Embed Size (px)
DESCRIPTION
inventory for measurent academic performance rating scale
Citation preview
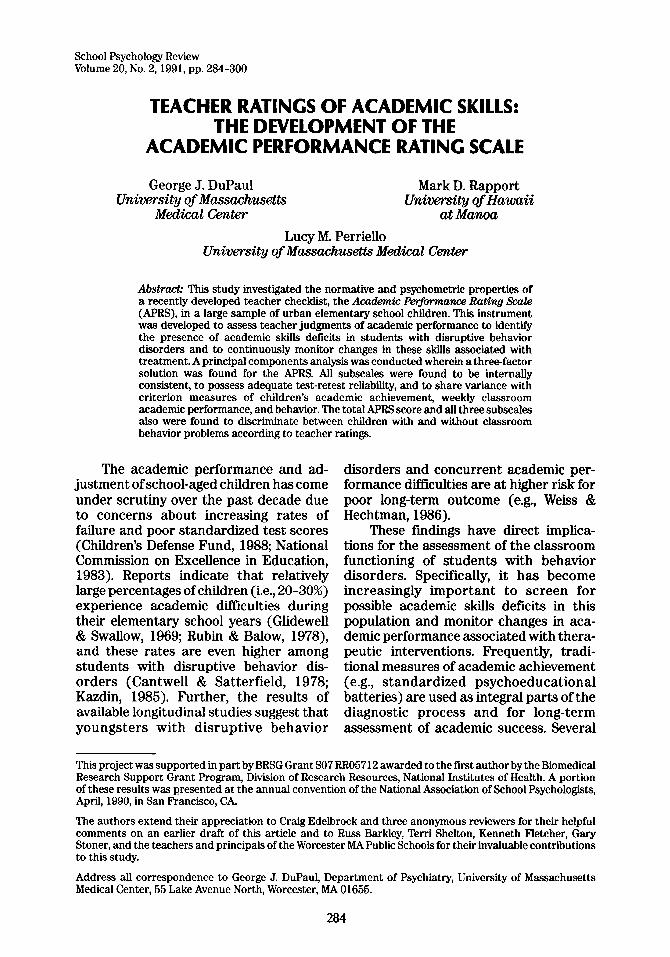
School Psychology Review Volume 20, No. 2,1991, pp. 284-300
TEACHER RATINGS OF ACADEMIC SKILLS: THE DEVELOPMENT OF THE
ACADEMIC PERFORMANCE RATING SCALE
George J. DuPaul Mark D. Rapport University of Massachusetts University of Hawaii
Medical Center at Mama Lucy M. Perriello
University of Massachusetts Medical Center
Abstract= This study investigated the normative and psychometric properties of a recently developed teacher checklist, the Academic Pet=fomnance Rating Scale (APRS), in a large sample of urban elementary school children. This instrument was developed to assess teacher judgments of academic performance to identify the presence of academic skills deficits in students with disruptive behavior disorders and to continuously monitor changes in these skills associated with treatment. A principal components analysis was conducted wherein a three-factor solution was found for the APRS. All subscales were found to be internally consistent, to possess adequate test-retest reliability, and to share variance with criterion measures of children’s academic achievement, weekly classroom academic performance, and behavior. The total APRS score and all three subscales also were found to discriminate between children with and without classroom behavior problems according to teacher ratings.
The academic performance and ad- justment of school-aged children has come under scrutiny over the past decade due to concerns about increasing rates of failure and poor standardized test scores (Children’s Defense Fund, 1988; National Commission on Excellence in Education, 1983). Reports indicate that relatively large percentages of children (i.e., 20-30%) experience academic difficulties during their elementary school years (Glidewell & Swallow, 1969; Rubin & Balow, 1978), and these rates are even higher among students with disruptive behavior dis- orders (Cantwell & Satterfield, 1978; Kazdin, 1986). Further, the results of available longitudinal studies suggest that youngsters with disruptive behavior
disorders and concurrent academic per- formance dficulties are at higher risk for poor long-term outcome (e.g., Weiss & Hechtman, 1986).
These fmdings have direct implica- tions for the assessment of the classroom functioning of students with behavior disorders. Specifically, it has become increasingly important to screen for possible academic skills deficits in this population and monitor changes in aca- demic performance associated with thera- peutic interventions. Frequently, tradi- tional measures of academic achievement (e.g., standardized psychoeducational batteries) are used as integral parts of the diagnostic process and for long-term assessment of academic success. Several
This project was supported in part by BRSG Grant SO7 RR05712 awarded to the first author by the Biomedical Research Support Grant Program, Division of Research Resources, National Institutes of Health. A portion of these results was presented at the annual convention of the National Association of School Psychologists, April, 1990, in San Francisco, CA
The authors extend their appreciation to Craig Edelbrock and three anonymous reviewers for their helpful comments on an earlier draft of this article and to Russ Barkley, Terri Shelton, Kenneth Fletcher, Gary Stoner, and the teachers and principals of the Worcester MA Public Schools for their invaluable contributions to this study.
Address all correspondence to George J. DuPaul, Department of Psychiatry, University of Massachusetts Medical Center, 55 Lake Avenue North, Worcester, MA 01655.
284
Academic Performance Rating Scale 285
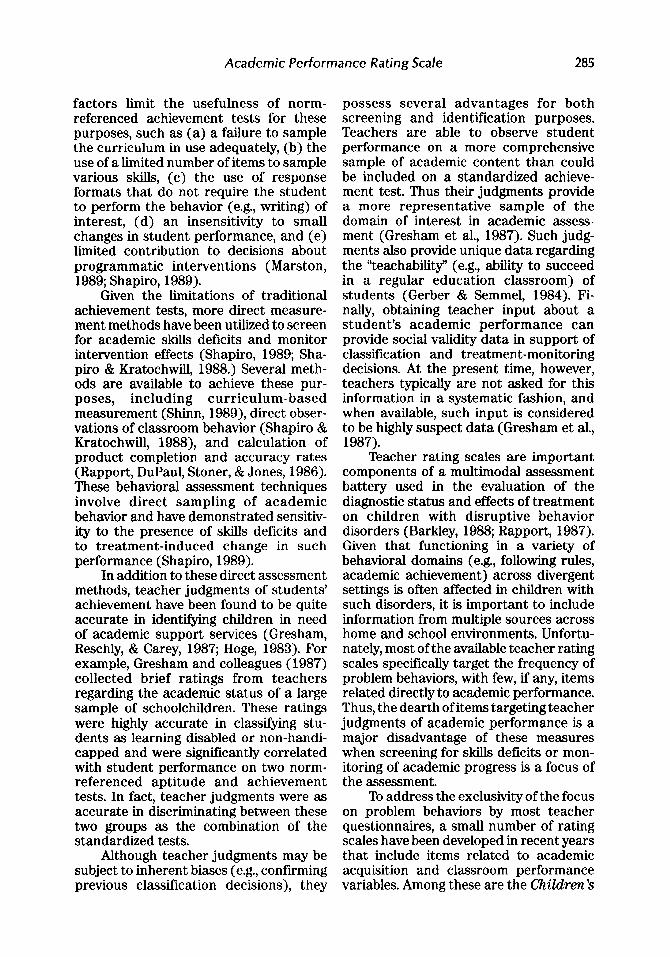
factors limit the usefulness of norm- referenced achievement tests for these purposes, such as (a) a failure to sample the curriculum in use adequately, (b) the use of a limited number of items to sample various skills, (c) the use of response formats that do not require the student to perform the behavior (e.g., writing) of interest, (d) an insensitivity to small changes in student performance, and (e) limited contribution to decisions about programmatic interventions (Marston, 1989; Shapiro, 1989).
Given the limitations of traditional achievement tests, more direct measure- ment methods have been utilized to screen for academic skills deficits and monitor intervention effects (Shapiro, 1989; Sha- piro & Kratochwill, 1988.) Several meth- ods are available to achieve these pur- poses, including curriculum-based measurement (Shinn, 1989), direct obser- vations of classroom behavior (Shapiro & Kratochwill, 1988), and calculation of product completion and accuracy rates (Rapport, DuPaul, Stoner, & Jones, 1986). These behavioral assessment techniques involve direct sampling of academic behavior and have demonstrated sensitiv- ity to the presence of skills deficits and to treatment-induced change in such performance (Shapiro, 1989).
In addition to these direct assessment methods, teacher judgments of students’ achievement have been found to be quite accurate in identifying children in need of academic support services (Gresham, Reschly, & Carey, 1987; Hoge, 1983). For example, Gresham and colleagues (1987) collected brief ratings from teachers regarding the academic status of a large sample of schoolchildren. These ratings were highly accurate in classifying stu- dents as learning disabled or non-handi- capped and were significantly correlated with student performance on two norm- referenced aptitude and achievement tests. In fact, teacher judgments were as accurate in discriminating between these two groups as the combination of the standardized tests.
Although teacher judgments may be subject to inherent biases (e.g., confirming previous classification decisions), they
possess several advantages for both screening and identification purposes. Teachers are able to observe student performance on a more comprehensive sample of academic content than could be included on a standardized achieve- ment test. Thus their judgments provide a more representative sample of the domain of interest in academic assess- ment (Gresham et al., 1987). Such judg- ments also provide unique data regarding the “teachability” (e.g., ability to succeed in a regular education classroom) of students (Gerber & Semmel, 1984). Fi- nally, obtaining teacher input about a student’s academic performance can provide social validity data in support of classification and treatment-monitoring decisions. At the present time, however, teachers typically are not asked for this information in a systematic fashion, and when available, such input is considered to be highly suspect data (Gresham et al., 1987).
Teacher rating scales are important components of a multimodal assessment battery used in the evaluation of the diagnostic status and effects of treatment on children with disruptive behavior disorders (Barkley, 1988; Rapport, 1987). Given that functioning in a variety of behavioral domains (e.g., following rules, academic achievement) across divergent settings is often affected in children with such disorders, it is important to include information from multiple sources across home and school environments. Unfortu- nately, most of the available teacher rating scales specifically target the frequency of problem behaviors, with few, if any, items related directly to academic performance. Thus, the dearth of items targeting teacher judgments of academic performance is a major disadvantage of these measures when screening for skills deficits or mon- itoring of academic progress is a focus of the assessment.
To address the exclusivity of the focus on problem behaviors by most teacher questionnaires, a small number of rating scales have been developed in recent years that include items related to academic acquisition and classroom performance variables. Among these are the Children’s
286 School Psychology Review, 7997, Vol. 20, No. 2
Behavior Rating &ale (Neeper & Lahey, 1986), Classroom Adjustment Ratings Scale (Lorion, Cowen, & Caldwell, 1975), Health Resources Inventory (Gesten, 1976), the Social Skills Rating System (Gresham & Elliott, 1990), the Teacher- mild Rating Scale (Hightower et al., 1986), and the WaZlCimneZZ Scale of social Chphnceand SchoolAdjustment (Walker & McConnell, 1988). These scales have been developed primarily as screen- ing and problem identification instru- ments and all have demonstrated relia- bility and validity for these purposes. Although all of these questionnaires are psychometrically sound, each scale pos- sesses one or more of the following characteristics that limit its utility for both screening and progress monitoring of academic skills deficits. These factors include (a) items worded at too general a level (e.g., “Produces work of acceptable quality given her/his skills level”) to allow targeting of academic completion and accuracy rates across subject areas, (b) a failure to establish validity with respect to criterion-based measures of academic success, and (c) requirements for comple- tion (e.g., large number of items) that detract from their appeal as instruments that may be used repeatedly or on a weekly basis for brief periods.
The need for a brief rating scale that could be used to identify the presence of academic skills deficits in students with disruptive behavior disorders and to monitor continuously changes in those skills associated with treatment was instrumental in the development of the Academic Performance Rating Scale (APRS). The APRS was designed to obtain teacher perceptions of specific aspects (e.g., completion and accuracy of work in various subject areas) of a student’s academic achievement in the context of a multimodal evaluation paradigm which would include more direct assessment techniques (e.g., curriculum-based mea- surement, behavioral observations). Be- fore investigating the usefulness of this measure for the above purposes, its psychometric properties and technical adequacy must be established. Thus, this study describes the initial development of
the APRS and reports on its basic psy- chometric properties with respect to factor structure, internal consistency, test-retest reliability, and criterion-related validity. In addition, normative data by gender across elementary school grade levels were collected.
METHOD
Subjects
Subjects were children enrolled in the first through sixth grades from 45 public schools in Worcester, Massachusetts. This system is an urban, lower middle-class school district with a 28.5% minority (African-American, Asian-American, and Hispanic) population. Complete teacher ratings were obtained for 493 children (251 boys and 242 girls), which were included in factor analytic and normative data analyses. Children ranged in age from 6 to 12 years of age (M = 8.9; SD = 1.8). A two-factor index of socioeconomic status (Hollingshead, 1975) was obtained with the relative percentages of subjects in each class as follows: I (upper), 12.3%; II (upper middle), 7.1%; III (middle), 45.5%; IV (lower middle), 26.3% and V (lower), 8.8%.
A subsample of 50 children, 22 girls and 28 boys, was randomly selected from the above sample to participate in a study of the validity of the APRS. Children at all grade levels participated, with the relative distribution of subjects across grades as follows: first, 19%; second, 16%; third, 17%; fourth, 17%; fifth, 13.5%; and sixth, 17.5%. The relative distribution of subjects across socioeconomic strata was equivalent to that obtained in the original sample.
Measures
The primary classroom teacher of each participant completed two brief measures: the APRS and Attention/‘h$i- tit-Hperact+vity Disorder {ADHD] Rat- ing Scale (DuPaul, in press). In addition, teachers of the children participating in the validity study completed the Abbre- viated Canners Teacher Rating Scale
Academic Performance Rating Scale 287
(ACTRS); (Goyette, Conners, & Ulrich, 1978).
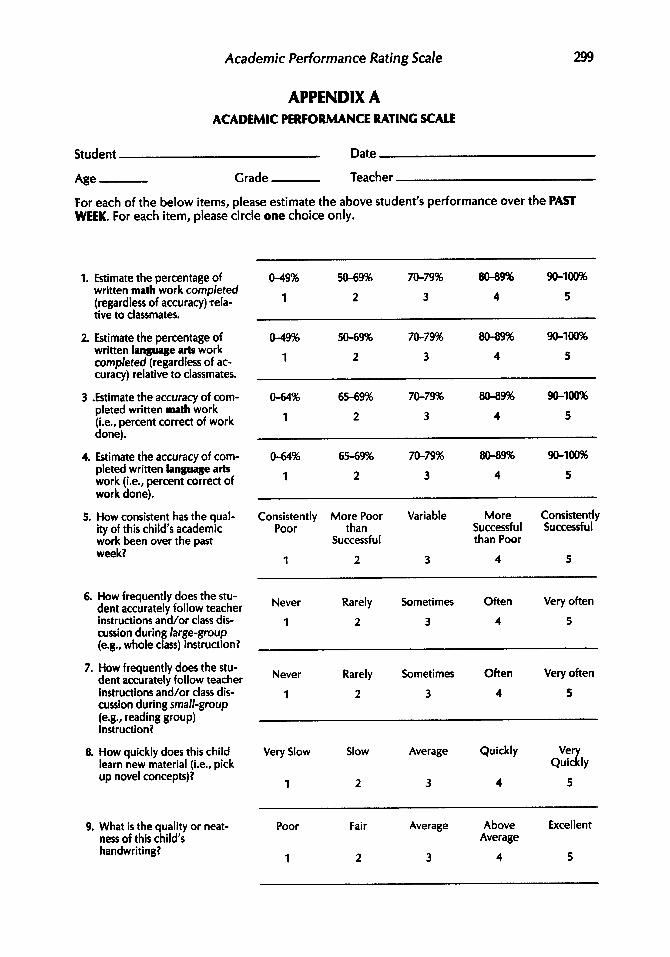
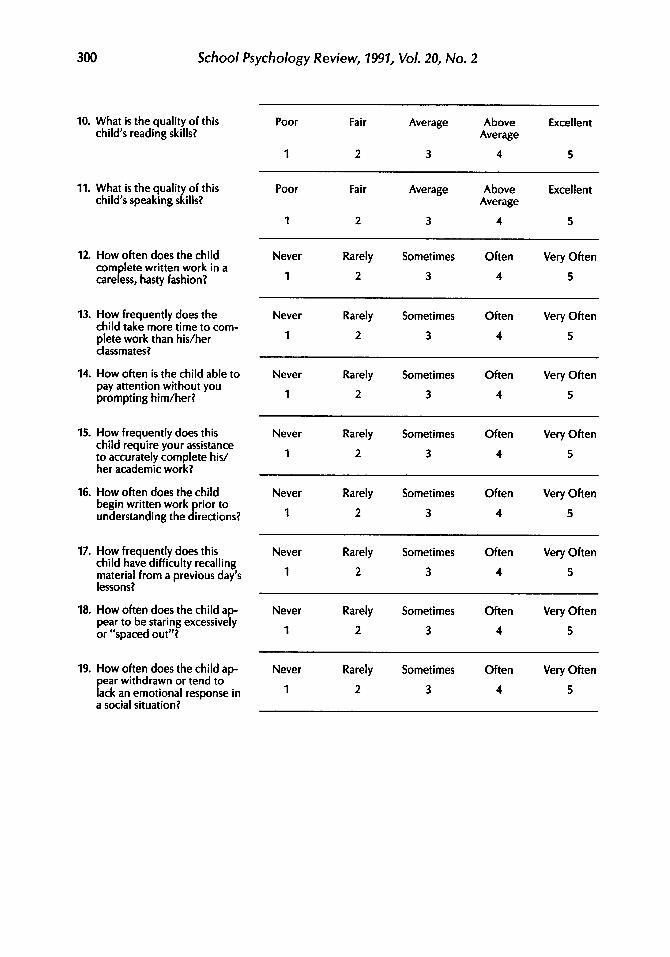
APRS. The APRS is a 19-item scale that was developed to reflect teachers’ percep- tions of children’s academic performance and abilities in classroom settings (see Appendix A). Thirty items were initially generated based on suggestions provided by several classroom teachers, school psychologists, and clinical child psychol- ogists. Of the original 30 items, 19 were retained based on feedback from a sep- arate group of classroom teachers, prin- cipals, and school and child psychologists, regarding item content validity, clarity, and importance. The final version in- cluded items directed towards work performance in various subject areas (e.g., “Estimate the percentage of written math work completed relative to classmates”), academic success (e.g., “What is the quality of this child’s reading skills?“), behavioral control in academic situations (e.g., “How often does the child begin written work prior to understanding the directions?“), and attention to assignments (e.g., “How often is the child able to pay attention without you prompting him/her?“). Two additional items were included to assess the frequency of staring episodes and social withdrawal. Although the latter are only tangentially related to the afore- mentioned constructs, they were included because “overfocused” attention (Kins- bourne & Swanson, 1979) and reduced social responding (Whalen, Henker, & Granger, 1989) are emergent symptoms associated with psychostimulant treat- ment. Teachers answered each item using a 1 (never or poor) to 5 (very often or excellent) Likert scale format. Seven APRS items (i.e., nos. 12,13,15- 19) were reverse- keyed in scoring so that a higher total score corresponded with a positive aca- demic status.
ADHD Rating Scale. The ADHD Rat- ing Scale consists of 14 items directly adapted from the ADHD symptom list in the most recent edition of the Diagnostic and Statistical Manual of Mental Disorders (DSM-III-R; American Psychiatric Associ- ation, 1987). Teachers indicated the frequency of each symptom on a 1 (not
at all) to 4 (very much) Likert scale with higher scores indicative of greater ADHD- related behavior. This scale has been found to have adequate internal consis- tency and test-retest reliability, and to correlate with criterion measures of classroom performance (DuPaul, in press).
ACTRS. The ACTRS (or Hyperactivity Index) is a lo-item rating scale designed to assess teacher perceptions of psycho- pathology (e.g., hyperactivity, poor con- duct, inattention) and is a widely used index for identifying children at-risk for ADHD and other disruptive behavior disorders. It has adequate psychometric properties and is highly sensitive to the effects of psychopharmacological inter- ventions (Barkley, 1988; Rapport, in press).
Observational measures. Children participating in the validity study were observed unobtrusively in their regular classrooms by a research assistant who was blind to obtained teacher rating scale scores. Observations were conducted during a time when each child was completing independent seatwork (e.g., math worksheet, phonics workbook). Observations were conducted for 20 min with on-task behavior recorded for 60 consecutive intervals. Each interval was divided into 15 s of observation followed by 5 s for recording. A child’s behavior was recorded as on or off-task in the same manner as employed by Rapport and colleagues (1982). A child was considered off-task if (s)he exhibited visual nonatten- tion to written work or the teacher for more than 2 consecutive seconds within each 15 s observation interval, unless the child was engaged in another task- appropriate behavior (e.g., sharpening a pencil). The observer was situated in a part of the classroom that avoided direct eye contact with the target child, but at a distance that allowed easy determina- tion of on-task behavior. This measure was included as a partial index of academic engaged time which has been shown to be significantly related to academic achievement (Rosenshine, 1981).
288 School Psychology Review, 7997, Vol. 20, No. 2
Academic efficiency score. Academic seatwork was assigned by each child’s classroom teacher at a level consistent with the teacher’s perceptions of the child’s ability level with the stipulation that the assignment be gradeable in terms of percentage completed and percentage accurate. Assignments were graded after the observation period by the research assistant and teacher, the latter of whom served as the reliability observer for academic measures. An academic effi- ciency score (AES) was calculated in a manner identical to that employed by Rapport and colleagues (1986) whereby the number of items’ completed correctly by the child was divided by the number of items assigned to the class multiplied by 100. This statistic represents the mean weekly percentage of academic assign- ments completed correctly relative to classmates and was used as the class- room-based criterion measure of aca- demic performance.
Published norm-referenced achieve- ment test scores. The results of school- based norm-referenced achievement tests (i.e., Comprehensive Test of Basic Skills; CTB/McGraw-Hill, 1982) were obtained from the school records of each student in the validity sample. These tests are administered routinely on a group basis in the fall or spring of each school year. National percentile scores from the most recent administration (i.e., within the past year) of this test were recorded for Mathematics, Reading, and Language Arts.
Procedure
Regular education teachers from 300 classrooms for grades 1 through 6 were asked to complete the APRS and ADHD rating scales with regard to the perfor- mance of two children in their class. Teachers from elementary schools in all parts of the city of Worcester participated (ie., a return rate of 93.5%) resulting in a sample that included children from all socio-economic strata. Teachers were instructed by one of the authors on which students to assess (i.e., one boy and girl
randomly selected from class roster), to complete APRS ratings according to each child’s academic performance during the previous week, and that responses on the ADHD scale were to reflect the child’s usual behavior over the year. Teacher ratings for the large sample (N= 487) were obtained within a l-month period in the early spring, to ensure familiarity with the student’s behavior.
A subsample of 50 children was selected randomly from the larger sample and parent consent for participation in the validity study was procured. Teacher ratings for this subsample were obtained within a 3-month period in the late winter and early spring. Teacher ratings on the APRS were randomly obtained for half of the sample participating in the validity study (n = 25) on a second occasion, 2 weeks after the original administration of this scale, to assess test-retest reliability. Ratings reflected children’s academic performance over the previous week The research assistant completed the behav- ioral observations and collected AES data on 3 separate days (i.e., a total of 60 min of observation) during the same week that APRS, ADHD, and ACIRS ratings were completed. Means (across the 3 observa- tion days) for percentage on-task and AES scores were used in the data analyses.
Interobserver reliability. The research assistant was trained by the first author to an interobserver reliability of 90% or greater prior to conducting live observa- tions using videotapes of children com- pleting independent work. Reliability coefficients for on-task percentage were calculated by dividing agreements by agreements plus disagreements and mul- tiplying by 100%. Interobserver reliability also was assessed weekly throughout the data collection phase of the study using videotapes of 10 individual children (who were participants in the validity study) completing academic work during one of the observation sessions. Interobserver reliability was consistently above 80% with a mean of 90% for all children. A mean Kappa coefficient (Cohen, 1960) of .74 was obtained for all observations to indicate reliability beyond chance levels. Following
Academic Performance Rating Scale 289
each observation period, the teacher and assistant independently calculated the amount of work completed by the student relative to classmates and the percentage of items completed correctly. Interrater reliability for these measures was consis- tently above 96% with a mean reliability of 99%.
Several analyses will be presented to explicate the psychometric properties of the APRS. First, the factor structure of this instrument was determined to aid in the construction of subscales. Second, the internal consistency and stability of APRS scores were examined. Next, gender and grade comparisons were conducted to identify the effects these variables may have on APRS ratings as well as to provide normative data. Finally, the concurrent validity of the APRS was evaluated by calculating correlation coefficients be- tween rating scale scores and the criterion measures.
Factor Structure of the APRS
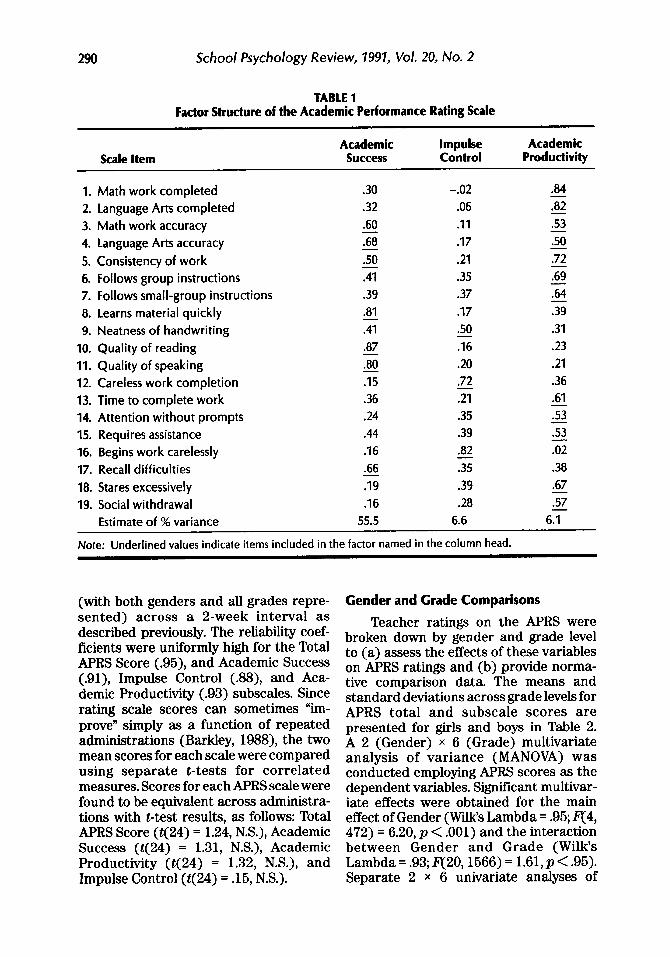
The APRS was factor analyzed using a principal components analysis followed by a normalized varimax rotation with iterations (Bernstein, 1988). As shown in Table 1, three components with eigen- values greater than unity were extracted, accounting for approximately 68% of the variance: Academic Success (7 items), Impulse Control (3 items), and Academic Productivity (12 items). The factor struc- ture replicated across halved random subsamples (i.e., n = 242 and 246, respec- tively). Congruence coefficients (Harman, 1976) between similar components ranged from 84 to .98 with a mean of .92, indicating a high degree of similarity in factor structure across subsamples. Items with loadings of 60 or greater on a specific component were retained to keep the number of complex items (i.e., those with significant loadings on more than one factor) to a minimum. In subsequent analyses, factor (subscale) scores were calculated in an unweighted fashion with complex items included on more than one
subscale (e.g., items 3-6 included on both the Academic Success and Academic Productivity subscales).
Given that the APRS was designed to evaluate the unitary construct of aca- demic performance, it was expected that the derived factors would be highly correlated. This hypothesis was confirmed as the intercorrelations among Academic Success and Impulse Control, Academic Success and Academic Productivity, and Impulse Control and Academic Produc- tivity were .69, .88, and .63, respectively. Despite the high degree of overlap between the Academic Success and Productivity components (Le., items reflecting accu- racy and consistency of work correlated with both), examination of the factor loadings revealed some important differ- ences (see Table 1). Specifically, the Academic Success factor appears related to classroom performance outcomes, such as the quality of a child’s academic achievement, ability to learn material quickly, and recall skills. Alternatively, the Academic Productivity factor is asso- ciated with behaviors that are important in the pocess of achieving classroom success, including completion of work, following instructions accurately, and ability to work independently in a timely fashion.
Internal Consistency and Reliability of the AIRS
Coefficient alphas were calculated to determine the internal consistency of the APRS and its subscales. The results of these analyses demonstrated adequate internal consistencies for the Total APRS (.96), as well as for the Academic Success (.94) and Academic Productivity (.94) subscales. The internal consistency of the Impulse Control subscale was weaker (.72). Subsequently, the total sample was randomly subdivided (i.e., n = 242 and 246, respectively) into two independent sub- samples. Coefficient alphas were calcu- lated for all APRS scores within each subsample with results nearly identical to the above obtained.
Test-retest reliability data were ob- tained for a subsample of 26 children
290 School Psychology Review, 7997, Vol. 20, No. 2
TABLE1 Factor Structure of the Academic Performance Rating Scale
Scale Item Academic Impulse
Success Control Academic
Productivity
I. Math work completed 2. language Arts completed
3. Math work accuracy
4. Language Arts accuracy 5. Consistency of work
6. Follows group instructions 7. Follows small-group instructions
8. Learns material quickly
9. Neatness of handwriting
10. Quality of reading 11. Quality of speaking
12. Careless work completion 13. Time to complete work
14. Attention without prompts 15. Requires assistance
16. Begins work carelessly
17. Recall difficulties 18. Stares excessively
19. Social withdrawal
Estimate of % variance
.30
.32
.60 G so rl .39
.81
z
.87 -80
Iii .36
.24
.44
.I6
.66 5 .I6
55.5
0.02
.06
.I1
.I7
.21
.35
.37
.I7
.50 ,Is .20 .72
Ti .35 .39
.82
z .39
.28 6.6
.84 ,82 F3 xi z 169 ,64 36 .31
.23
.21
.36
.61 s3 53 -02 .38
.67 ,57
67
Note: Underlined values indicate items included in the factor named in the column head.
(with both genders and all grades repre- sented) across a 2-week interval as described previously. The reliability coef- ficients were uniformly high for the Total APRS Score (.95), and Academic Success (.91), Impulse Control (.88), and Aca- demic Productivity (.93) subscales. Since rating scale scores can sometimes %n- prove” simply as a function of repeated administrations (Barkley, 1988), the two mean scores for each scale were compared using separate t-tests for correlated measures. Scores for each APRS scale were found to be equivalent across administra- tions with t-test results, as follows: Total APRS Score (t( 24) = 1.24, N.S.), Academic Success (t( 24) = 1.31, N.S.), Academic Productivity (t(24) = 1.32, N.S.), and Impulse Control (t(24) = .15, N.S.).
Gender and Grade Comparisons
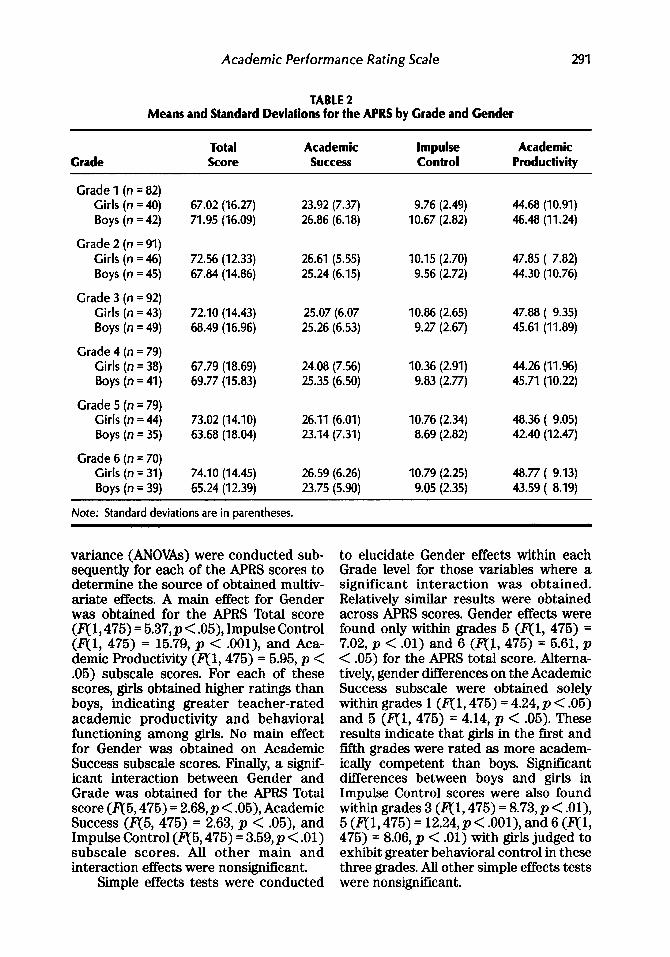
Teacher ratings on the APRS were broken down by gender and grade level to (a) assess the effects of these variables on APRS ratings and (b) provide norma- tive comparison data. The means and standard deviations across grade levels for APRS total and subscale scores are presented for girls and boys in Table 2. A 2 (Gender) x 6 (Grade) multivariate analysis of variance (MANOVA) was conducted employing APRS scores as the dependent variables. Significant multivar- iate effects were obtained for the main effect of Gender (Wilk’s Lambda = .95; fl4, 472) = 6.20, p < .OOl) and the interaction between Gender and Grade (Wilk’s Lambda = .93; F(20,1566) = 1.61,~ < .95). Separate 2 x 6 univariate analyses of
Academic Performance Rating Scale 291
TABLE 2 Means and Standard Deviations for the APRS by Grade and Gender
Grade Total Score
Academic Success
Impulse Control
Academic Productivity
Grade1 (n =82) Girls (n = 40) Boys(n=42)
67.02 (16.27) 23.92 (7.37) 9.76 (2.49) 44.68 (10.91) 71.95 (16.09) 26.86 (6.18) 10.67 (2.82) 46.48 (11.24)
Grade2(n=91) Girls (n = 46) Boys(n =45)
Grade 3 (n = 92) Girls (n = 43) Boys (n =49)
Grade4(n =79)
72.56 67.84
72.10 68.49
12.33) 26.61 (5.55) 10.15 (2.70) 47.85 14.86) 25.24 (6.15) 9.56 (2.72) 44.30
14.43) 25.07 (6.07 10.86 (2.65) 47.88 16.96) 25.26 (6.53) 9.27 (2.67) 45.61
Girls (n = 38) 67.79 (18.69) 24.08 (7.56) 10.36 (2.91) 44.26 Boys (n=41) 69.77 (15.83) 25.35 (6.50) 9.83 (2.77) 45.71
Grade5(n=79) Girls (n = 44) 73.02 (14.10) 26.11 (6.01) 10.76 (2.34) 48.36
7.82) 10.76)
9.35) 11.89)
Boys(n =35) 63.68 (18.04) 23.14 (7.31) 8.69 (2.82) 42.40 (12.47)
Grade6(n =70) Girls (n = 31) Boys (n =39)
74.10 (14.45) 26.59 (6.26) 10.79 (2.25) 48.77 ( 9.13) 65.24 (12.39) 23.75 (5.90) 9.05 (2.35) 43.59 ( 8.19)
Note: Standard deviations are in parentheses.
variance (ANOVAs) were conducted sub- sequently for each of the APRS scores to determine the source of obtained multiv- ariate effects. A main effect for Gender was obtained for the APRS Total score (fll, 476) = 6.37, p < .05), Impulse Control (F(1, 475) = 16.79, p < .OOl), and Aca- demic Productivity (fll, 475) = 6.95, p < .05) subscale scores. For each of these scores, girls obtained higher ratings than boys, indicating greater teacher-rated academic productivity and behavioral functioning among girls. No main effect for Gender was obtained on Academic Success subscale scores. Finally, a signif- icant interaction between Gender and Grade was obtained for the APRS Total score (F(5,476) = 2.68, p < .05), Academic Success (F(5, 475) = 2.63, p < .05), and Impulse Control (e&475) = 3.59, p < .Ol) subscale scores. All other main and interaction effects were nonsignificant.
Simple effects tests were conducted
to elucidate Gender effects within each Grade level for those variables where a significant interaction was obtained. Relatively similar results were obtained across APRS scores. Gender effects were found only within grades 6 (fll, 475) = 7.02, p < .Ol) and 6 (fly, 475) = 6.61, p < .05) for the APRS total score. Alterna- tively, gender differences on the Academic Success subscale were obtained solely within grades 1 (F(1,475) = 4.24, p < .05) and 5 (F(1, 475) = 4.14, p < .05). These results indicate that girls in the first and f&h grades were rated as more academ- ically competent than boys. Significant differences between boys and girls in Impulse Control scores were also found within grades 3 (fll, 475) = 8.73, p < .Ol), 5 (F(1,475) = 12.24,~ < .OOl), and 6 (F(I, 475) = 8.06, p < .Ol) with girls judged to exhibit greater behavioral control in these three grades. All other simple effects tests were nonsignificant.
School Psychology Review, 7997, Vol. 20, No. 2
TABLE 3 Correlations Between APRS Scores and Criterion Measures
Measures Total Academic Score Success
Impulse Control
Academic Productivity
ACTRS’
ADHD Ratings
On Task Percentage
AES”
CTBS Math
CTBS Reading
CTBS Language
-m6()***b 9.43’” 0.49”” ,.&4***
-.72*** 0.59”’ -.61*** 0.72”“”
.29* .22 .24 .31*
.53*** .26 .41** .57***
.48*** .62*** .28 .39**
.53*** .62*** .34* 44’”
.53*** .61*** .41** .45**
‘Abbreviated Conners Teacher Rating Scale.
bCorrelations are based on N = 50 with degrees of freedom = 48. ‘Academic Efficiency Score.
"pC.05 **p<.o1 -p < .ool
Note: National percentile scores were used for all Comprehensive Test of Basic Skills (CTBS) subscales.
Relationships Among APRS Scores and Criterion Measures
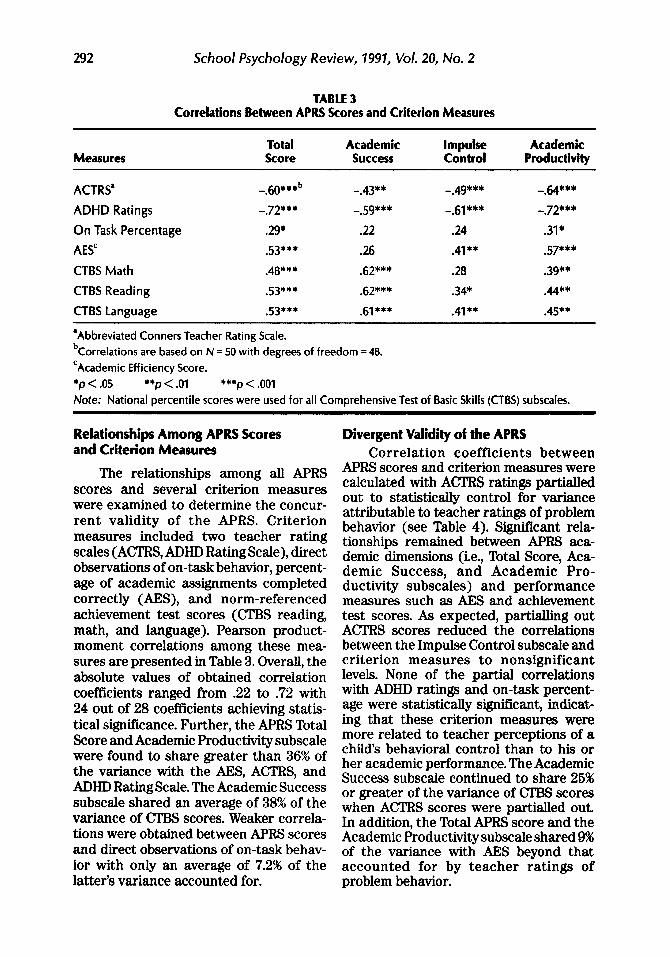
The relationships among all APRS scores and several criterion measures were examined to determine the concur- rent validity of the APRS. Criterion measures included two teacher rating scales (ACTRS, ADHD Rating Scale), direct observations of on-task behavior, percent- age of academic assignments completed correctly @ES), and norm-referenced achievement test scores (CTBS reading, math, and language). Pearson product- moment correlations among these mea- sures are presented in Table 3. Overall, the absolute values of obtained correlation coefficients ranged from .22 to .72 with 24 out of 28 coefficients achieving statis- tical significance. Further, the APRS Total Score and Academic Productivity subscale were found to share greater than 36% of the variance with the AES, ACTRS, and ADHD Rating Scale. The Academic Success subscale shared an average of 38% of the variance of CTBS scores. Weaker correla- tions were obtained between APRS scores and direct observations of on-task behav- ior with only an average of 7.2% of the latter’s variance accounted for.
Divergent Validity of the APRS Correlation coefficients between
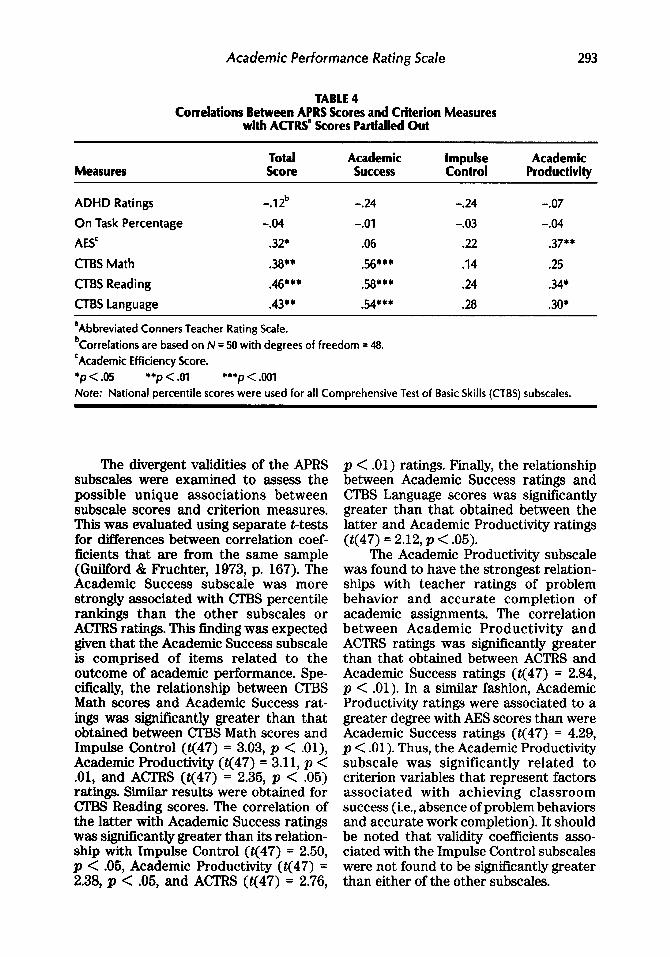
APRS scores and criterion measures were calculated with ACTRS ratings partialled out to statistically control for variance attributable to teacher ratings of problem behavior (see Table 4). Significant rela- tionships remained between APRS aca- demic dimensions (i.e., Total Score, Aca- demic Success, and Academic Pro- ductivity subscales) and performance measures such as AES and achievement test scores. As expected, partialling out ACTRS scores reduced the correlations between the Impulse Control subscale and criterion measures to nonsignificant levels. None of the partial correlations with ADHD ratings and on-task percent- age were statistically significant, indicat- ing that these criterion measures were more related to teacher perceptions of a child’s behavioral control than to his or her academic performance. The Academic Success subscale continued to share 26% or greater of the variance of CTBS scores when ACIDS scores were partialled out. In addition, the Total APRS score and the Academic Productivity subscale shared 9% of the variance with AES beyond that accounted for by teacher ratings of problem behavior.
Academic Performance Rating Scale 293
TABLE 4 Correlations Between APRS Scores and Criterion Measures
with ACTRSa Scores Partialled Out
Measures Total Score
Academic Success
Impulse Control
Academic Productivity
ADHD Ratings
On Task Percentage
AESC
CTBS Math
CTBS Reading
CTBS Language
-.12b 0.24 0.24 -. 07
0.04 0.01 0.03 9.04
.32* .06 .22 .37**
.38** .56*** .I4 .25
.46*** .58*** .24 .34*
.43** .54*** .28 .30*
*Abbreviated Conners Teacher Rating Scale.
bCorrelations are based on N = 50 with degrees of freedom = 48.
‘Academic Efficiency Score.
*p < .05 *+p < .Ol ““p < a01
Note: National percentile scores were used for all Comprehensive Test of Basic Skills (CTBS) subscales.
The divergent validities of the APRS subscales were examined to assess the possible unique associations between subscale scores and criterion measures. This was evaluated using separate t-tests for differences between correlation coef- ficients that are from the same sample (Guilford & Fruchter, 1973, p. 167). The Academic Success subscale was more strongly associated with CTBS percentile rankings than the other subscales or ACTRS ratings. This finding was expected given that the Academic Success subscale is comprised of items related to the outcome of academic performance. Spe- cifically, the relationship between CTBS Math scores and Academic Success rat- ings was significantly greater than that obtained between CTBS Math scores and Impulse Control (t(47) = 3.03, p < .Ol), Academic Productivity (t(47) = 3.11, p < .Ol, and ACTRS (t(47) = 2.35, p < .05) ratings. Similar results were obtained for CTBS Reading scores. The correlation of the latter with Academic Success ratings was significantly greater than its relation- ship with Impulse Control (t(47) = 2.50, p < .05, Academic Productivity (t(47) = 2.38, p < .05, and ACTRS (t(47) = 2.76,
p < .Ol) ratings. Finally, the relationship between Academic Success ratings and CTEB Language scores was significantly greater than that obtained between the latter and Academic Productivity ratings (t(47) = 2.12, p < .OS).
The Academic Productivity subscale was found to have the strongest relation- ships with teacher ratings of problem behavior and accurate completion of academic assignments. The correlation between Academic Productivity and ACTRS ratings was significantly greater than that obtained between ACTRS and Academic Success ratings (t(47) = 2.84, p < .Ol). In a similar fashion, Academic Productivity ratings were associated to a greater degree with AES scores than were Academic Success ratings (t(47) = 4.29, p < .Ol). Thus, the Academic Productivity subscale was significantly related to criterion variables that represent factors associated with achieving classroom success (i.e., absence of problem behaviors and accurate work completion). It should be noted that validity coefficients asso- ciated with the Impulse Control subscales were not found to be significantly greater than either of the other subscales.
294 School fsvcholonv Review, 7997, Vol. 20, A/o. 2 , “ /
APRS Ratings: Sensitivity to Group Differences
A final analysis was conducted to investigate the sensitivity of APRS ratings to differences between groups of children with and without attention and impulse control problems (i.e., the latter group representing students who are potentially exhibiting academic performance difficul- ties). Children from the total sample with scores 2 standard deviations above the mean on the ADHD rating scale (n = 35) were compared with students who re- ceived teacher ratings of ADHD sympto- matology within 1 standard deviation of the mean (n = 390). Separate t-tests were conducted employing each of the APRS scores as dependent measures. Statisti- cally significant differences were obtained between groups for the APRS Total score (t( 1,423) = 12.32,~ < .OOl), and Academic Success (t(1, 423) = 7.23, p < .OOl), Impulse Control (t( 1, 423) = 8.95, p < .OOl), and Academic Productivity (t(1, 423) = 10.20, p < .OOl) subscales, with the children exhibiting ADHD symptoms rated as significantly inferior on all APRS dimensions relative to control children.
DISCUSSION
The APRS is a brief teacher question- naire that provides reliable and valid information about the quality of a stu- dent’s academic performance and behav- ioral conduct in educational situations. Separate principal components analyses resulted in the extraction of three com- ponents or subscales (i.e., Academic Success, Impulse Control, and Academic Productivity) that were congruent across random subsamples. The Academic Suc- cess subscale accounted for over half of the variance which supports the construct validity of the APRS, as it was intended to assess teacher perceptions of the quality of students’ academic skills. An additional 13% of rating variance was accounted for by the Academic Produc- tivity and Impulse Control subscales. Although the latter are highly correlated with the Academic Success subscale, both appear to provide unique information
regarding factors associated with the process of achieving classroom success (e.g., work completion, following instruc- tions, behavioral conduct).
Psychometric Properties of the APRS
The APRS total and subscale scores were found to possess acceptable internal consistency, to be stable across a 2-week interval, and to evidence significant levels of criterion-related validity. Although the Impulse Control subscale was found to have adequate test-retest reliability, its internal consistency was lower than the other subscales. This latter finding is likely due to the fewer number of items in this subscale. The relationship among APRS scores and criterion measures, such as academic efficiency, behavior ratings, and standardized academic achievement test scores, were statistically significant. The APRS Total Score and two subscales were found to have moderate validity coeffi- cients and to share appreciable variance with several subtests of a norm-referenced achievement test and a measure of classwork accuracy. Further, when valid- ity coefficients were calculated with ACTRS readings partialled out, most continued to be statistically significant indicating that APRS scores provide unique information regarding a child’s classroom performance relative to brief ratings of problem behavior.
Two of the three APRS subscales were found to exhibit divergent validity. Al- though all APRS subscales were positively correlated with achievement test scores, the strongest relationships were found between the Academic Success subscale and CTBS percentile rankings, accounting for an average of 38% of the variance. Alternatively, although negative correla- tions were obtained between teacher report of problem behaviors (i.e., ACTRS and ADHD ratings) and all APRS scores, the strongest relationships were found between the former rating scales and Academic Productivity scores. Further, a classroom-based measure of work comple- tion accuracy (AES) had a significantly greater correlation with the Academic Productivity subscale with 32.5% variance
Academic Performance Rating Scale 295
accounted for. This latter finding may appear counterintuitive (i.e., that Aca- demic Success did not have the strongest relationship with AES), but is most likely due to the fact that AES represents a combination of the child’s academic ability, attention to task, behavioral control, and motivation to perform. Given the varied item content of the Academic Productivity subscale, it is not surprising that it shares more variance with a complex variable like AES. This pattern of results indicates that the Academic Success subscale is most representative of the teacher’s judgment of a student’s global achievement status, whereas the Academic Productivity subscale has a greater relationship with factors asso- ciated with the process of day-to-day academic performance. Finally, although the Impulse Control subscale was signif- icantly associated with most of the criterion measures, it was not found to demonstrate divergent validity. This result, combined with its brevity, lower internal consistency, and redundancy with teacher ratings of problem behavior, limits its practical utility as a separate subscale.
Although statistically significant positive correlations with on-task percent- age were obtained for the APRS Total and Academic Productivity scores, the Aca- demic Success and Impulse Control subscales were not related to this obser- vational measure. One explanation for this result is that the Academic Productivity subscale is more closely related to factors associated with independent work pro- ductivity (e.g., attention to task) than are the other subscales. A second possible explanation for the weaker correlations between this criterion variable and all APRS scores is that children’s classroom performance is a function of multiple variables and is unlikely to be represented by a single, specific construct. As such, teacher ratings of academic functioning should be more strongly related to global measures, such as AES or standardized achievement test scores, that represent a composite of ability, attention to task, task completion and accuracy, than with a
more specific index such as on-task frequency.
Teacher ratings on the APRS differ- entiated a group of children displaying behavior and attention problems from their normal classmates. Youngsters who had received scores 2 or more standard deviations above the mean on a teacher rating of ADHD symptomatology received significantly lower scores on all APRS scales relative to a group of classmates who were within 1 standard deviation of the mean on ADHD ratings. This result provides preliminary evidence of the APRS’s discriminant validity and value for screening/problem identification pur- poses. Further studies are necessary to establish its utility in differentiating youngsters with disruptive behavior disorders who are exhibiting concomitant academic problems versus those who are not.
APRS: Grade and Gender Differences
Girls were rated to be more compe- tent than boys on the Academic Produc- tivity subscale, regardless of grade level. This result was expected as gender differences favoring girls have been found for most similar teacher questionnaires (e.g., Weissberg et al., 1987). Alternatively, for the total and remaining subscale scores, girls were rated as outperforming boys only within specific grade levels. In general, these were obtained at the fifth and sixth grade levels, wherein gender differences with respect to achievement status and behavioral control are most evident at the upper grades. The latter result could indicate that gender differ- ences in daily academic performance do not impact on teachers’ overall assess- ment of educational status until the later grades when demands for independent work greatly increase. Interestingly, no significant grade differences were ob- tained for any of the APRS scores. As Hightower and colleagues (1986) have suggested, a lack of differences across grade levels implies that teachers com- plete ratings of academic performance in relative (i.e., in comparison with similar- aged peers) rather than absolute terms.
296 School Psychology Review, 7997, Vol. 20, No. 2
Limitations of the Present Study
Several factors limit definitive conclu- sions about the utility of the APRS based on the present results. First, the sample of children studied was limited to an urban location in one geographic region; it is unknown how representative these normative data would be for children from rural or suburban settings as well as other regions. Previous research with similar teacher questionnaires would suggest significant differences in scores across urban, suburban, and rural settings (e.g., Hightower et al., 1986). Secondly, for the norms to be generally applicable, APRS ratings would need to be collected for a sample representative of the general population with respect to ethnicity and socioeconomic status. A further limitation of the present study was the limited range of criterion measures employed. In par- ticular, the relationship of APRS scores with more direct measures of academic performance (e.g., criterion-based mea- surement) should be explored, as the weaknesses of norm-referenced achieve- ment tests for this purpose are well documented (Marston, 1989; Shapiro, 1989). Finally, additional psychometric properties of this scale, such as predictive validity and inter-rater reliability, need to be documented. Empirical investigations are necessary to determine the usefulness of the APRS as a treatment-sensitive instrument. Evidence for the latter is especially important as a primary purpose for creating the APRS was to allow assessment of intervention effects on academic performance.
Summary
The results of this preliminary inves- tigation indicate that the APRS is a highly reliable rating scale that has demon- strated initial validity for assessing teacher perceptions of the quality of student academic performance. Given its unique focus on academic competencies rather than behavioral deficits, it appears to have potential utilitywithin the context of a multimethod assessment battery. In particular, it should serve as a valuable
supplement to behavioral assessment techniques (e.g., direct observations of behavior, curriculum-based measure- ment) given its brevity, focus on both global and specific achievement parame- ters, and relationship with classroom- based criteria of academic success. The present results provide initial support for the utility of the APRS as a screening/ problem identification measure. Further, when used in the context of an assessment battery that includes more direct mea- sures of academic performance, the APRS may provide important data regarding the social validity (i.e., teacher perceptions of changes in academic status) of obtained intervention effects, although its incre- mental validity would need to be estab- lished. The APRS’s sensitivity to the effects of behavioral and psychopharmacological interventions awaits further empirical study.
American Psychiatric Association. (1987). Diugnos- tic and statistical manual of mental disorders (3rd ed. Revised). Washington, DC: Author.
Barkley, R. A. (1988). Child behavior rating scales and checklists. In M. Rutter, A. H. Tuma, & I. S. Lann (Eds.), Assessment and diagnosis in child psychopathology (pp. 113-155). New York: Guilford.
Bernstein, I. H. (1988). Applied multivariate analysis. New York: Springer-Verlag.
Cantwell, D. P., & Satterfield, J. H. (1978). The prevalence of academic under-achievement in hyperactive children. Journal @‘Pediatric pszlchol- w, 3, 168-171.
Children’s Defense Fund. (1988). A call for actiun to make our nation sqfie for children: A briefing book on the status of American children in 1988. Washington, DC: Author.
Cohen, J. (1960). A coefficient of agreement for nominal scales. Educational and pS@&gical Measurement, 20,37-46.
CTB/McGraw-Hill. (1982). l%e comprehensive Test of Basic Skills. Monterey, CA Author.
DuPaul, G. J. (in press). Parent and teacher ratings of ADHD symptoms: Psychometric properties in a community-based sample. Journal of Clinical Child Psychologg.
Academic Performance Rating Scale 297
Gerber, M. M., & Semmel, M. I. (1984). Teacher as imperfect test: Reconceptualizing the referral process. Educational Psychologist, 19, 137-148.
Gesten, E. L. (1976). A Health Resources Inventory: The development of a measure of the personal and social competence of primary-grade children. Journal of Consulting and Clinical Psychology, 4-4, 775-786.
Glidewell, .I. C., & Swallow, C. S. (1969). The prevalence of maladjustment in elementary schools. Report prepared for the Joint Commission on Mental Illness and Health of Children. Chicago: University of Chicago Press.
Goyette, C. H., Conners, C. K., & Ulrich, R. F. (1978). Normative data on Revised Conners Parent and Teacher Rating Scales. Journal of Abnormal Child Psychdogy, 6,221-236.
Gresham, F. M., & Elliott, S. N. (1990). Social skills rating system. Circle Pines, MN: American Guid- ance Service.
Gresham, F. M., Reschly, D. .I., & Carey, M. P. (1987). Teachers as “tests”: Classification accuracy and concurrent validation in the identification of learning disabled children. S&ool Psychology Rewiim, 16,543-553.
Guilford, .I. P., & Fruchter, B. (1973). Fundamental statistics in psychology and education (5th ed.). New York: McGraw-Hill.
Harman, H. H. (1976). Malern factor analysis (3rd ed.-revised). Chicago: The University of Chicago Press.
Hightower, A. D., Work, W. C., Cowen, E. L., Lotyczewski, B. S., Spine& A. T., Guare, J. C., & Rohrbeck, C. A. (1986). The Child Rating Scale: The development of a socioemotional self-rating scale for elementary school children. school Psychology Review, 16,239-255.
Hoge, R. D. (1983). Psychometric properties of teacher-judgment measures of pupil aptitudes, classroom behaviors, and achievement levels. Journal of &x&al Education, 17,401-429.
Hollingshead, A. B. (1975). Fourfactor index of social status. New Haven, CT Yale University, Department of Sociology.
Kazdin, A. E. (1985). Treatment of antisocial behavior in children and adolescents. Homewood, IL: Dorsey Press.
Kinsbourne, M., & Swanson, J. M. (1979). Models of hyperactivity: Implications for diagnosis and treatment. In R. L. Trites (Ed.), Hyperactivity in children: Etiology, measurement, and treatment implications (pp. l-20). Baltimore: University Park Press.
Lorion, R. P., Cowen, E. L., & Caldwell, R. A. ( 1975). Normative and parametric analyses of school maladjustment. American Journal of Community Psychology, 3,291-301.
Marston, D. B. (1989). A curriculum-based measure- ment approach to assessing academic perfor- mance: What it is and why do it. In M. R. Shinn (Ed.), Curriculum-based measurement: Assessing special children (pp. 18-78). New York: Guilford Press.
National Commission on Excellence in Education. (1983). A nation at risk: 17Le immative for educational reform. Washington, DC: Author.
Neeper, R., & Lahey, B. B. (1986). The Children’s Behavior Rating Scale: A factor analytic develop- mental study. school Psychology Reuiew, 15, 277- 288.
Rapport, M. D. (1987). Attention Deficit Disorder with Hyperactivity. In M. Hersen &V. B. Van Hasselt (Eds.), Behavior therapy with children and adolescents (pp. 325-361). New York: Wiley.
Rapport, M. D. (in press). Psychostimulant effects on learning and cognitive function in children with Attention Deficit Hyperactivity Disorder: Findings and implications. In J. L. Matson (Ed.), Hwac- tivity in children: A handbook. New York: Pergamon Press.
Rapport, M. D., DuPaul, G. J., Stoner, G., & Jones, J. T. (1986). Comparing classroom and clinic measures of attention deficit disorder: Differential idiosyncratic, and dose-response effects of methyl- phenidate. Journal of Consulting and Clinical PsycWQgy, 54,334-341.
Rapport, M. D., Murphy, A., & Bailey, J. S. (1982). Ritalin vs. response cost in the control of hyper- activity children: A within-subject comparison. Journal of Applied Behavior Analysis, 15, 205- 216.
Rosenshine, B. V. (1981). Academic engaged time, content covered, and direct instruction. Journal of Education, 3,38-66.
Rubin, R. A, & Balow, B. (1978). Prevalence of teacher-identified behavior problems. Exceptional Children, 45, 102-111.
Shapiro, E. S. (1989). Academic skills problems: Direct assessment and intervention. New York: GuiIford Press.
Shapiro, E. S., & Kratochwill, T. R. (Eds.). (1988). Behavioral assessment in schools: Conceptual foundations and practical applications. New York: Guilford Press.
Shinn, M. R. (Ed.). (1989). Curriculum-based measurement: Assessing special children. New York: Guilford Press.
290 School Psychology Review, 7997, Vol. 20, No. 2
Wallrer, H. M., & McConnell, S. R. (1988). ?ViuZti- & Gesten, E. L (1987). Teacher ratings of children’s M&ml1 &ale of social GmqMmce and &hool problem and competence behatiors: Normative A- Austin, TX: Pro-Ed, Inc. and parametric characteristics. AmericanJoumMtl
Weiss, G., & Hechtman, L. (1986). Hyperactive c#cOmmun~pszlcho~, 15,387-401.
clddm grown up. New York: GuMord. Whalen, C. K., Henker, B., & Granger, D. A. (1989).
Weissberg, R. P., Cowen, E. L., Lotyczewski, B. S., Boike, Ratings of medication effects in hyperactive children: Viable or vulnerable? Behavioral Assess-
M. F., Orara, N., Ahvay, Stalonas, P., Sterling, S., ment, 11,179.199.
-7 e J. DuPauI, PhD, received his doctorate from the University of Rhode lslan in 1985. He is currently Assistant Professor of Psychiatry at the University of Massachusetts Medical Center. His research interests include the assessment and treatment of Attention Deficit Hyperactivity Disorder and related behavior disorders.
Mak D. Rapport, PhD, is currently Associate Professor of Psychology at the University of Hawaii at Manoa. His research interests include assessment of the cognitive effects of psychotropic medications and the treatment of Attention Deficit Hyperactivity Disorder and related behavior disorders.
Lucy M. PerrieIIo, MA, received a Master’s degree in Counseling Psychology from Assumption College in 1988. She is currently a Research Associate in Behavioral Medicine at the University of Massachusetts Medical Center.
Academic Performance Rating Scale
APPENDIX A
Student Date
Grade Teacher
For each of the below items, please estimate the above student’s performance over the PAST WEEK. For each item, please circle one choice only.
Estimate the percentage of written math work completed (regardless of accuracy) rela- tive to classmates.
Estimate the percentage of written language arts work completed (regardless of ac- curacy) relative to classmates.
.Estimate the accuracy of com- 4 pleted written math work
(i.e., percent correct of work done).
4. Estimate the accuracy of com- pleted written language arts work (i.e., percent correct of work done).
5. How consistent has the qual- ity of this child’s academic work been over the past week?
6. How frequently does the stu- dent accurately follow teacher instructions and/or class dis- cussion during large-group (e.g., whole class) instruction?
7. How frequently does the stu- dent accurately follow teacher instructions and/or class dis- cussion during small-group (e.g., reading group) instruction?
8. How quickly does this child learn new material (i.e., pick up novel concepts)?
9. What is the quality or neat- ness of this child’s handwriting?
049% 5049% 70-79% 8049% 90-100%
1 2 3 4 5
049% 5049% 70-79% 804% 90400%
I 2 3 4 5
044% 65-69% 70-79% 8049% 90-100%
1 2 3 4 5
044% 6549% 70-79% 8&89% 90400%
1 2 3 4 5
Consistently More Poor Variable More Consistently Poor than Successful successful
Successful than Poor
1 2 3 4 5
Never Rarely Sometimes Often Very often
1 2 3 4 5
Never Rarely Sometimes Often Very often
1 2 3 4 5
Very Slow Slow Average Quickly very Quickly
1 2 3 4 5
Poor Fair Average Above Excellent Average
I 2 3 4 5
300 SchoolPsychologyReview,7997, Vo/.2OJVo.2
10.
11.
12.
13.
14.
15.
16.
17.
18.
19.
What is the quality of this child’s reading skills?
What is the quality of this child’s speaking skills?
How often does the child complete written work in a careless, hasty fashion?
How frequently does the child take more time to com- plete work than his/her classmates?
How often is the child able to pay attention without you prompting him/her?
How frequently does this child require your assistance to accurately complete his/ her academic work?
How often does the child begin written work prior to understanding the directions?
How frequently does this child have difficulty recalling material from a previous day’s lessons?
How often does the child ap- pear to be staring excessively or “spaced out”?
How often does the child ap- pear withdrawn or tend to lack an emotional response in a social situation?
Poor Fair Average Above Excellent Average
1 2 3 4 5
Poor Fair Average Above Average
Excellent
1 2 3 4 5
Never Rarely Sometimes Often Very Often
1 2 3 4 5
Never Rarely Sometimes Often Very Often
1 2 3 4 5
Never Rarely Sometimes Often Very Often
1 2 3 4 5
Never Rarely Sometimes Often Very Often
1 2 3 4 5
Never Rarely Sometimes Often Very Often
1 2 3 4 5
Never Rarely Sometimes Often Very Often
1 2 3 4 5
Never Rarely Sometimes Often Very Often
1 2 3 4 5
Never Rarely Sometimes Often Very Often
1 2 3 4 5