Embed Size (px)
Citation preview
1 Copyright 2003 © Professor Michael E. PorterPorter – Homebuilding – 11-18-03 – CT
The U.S. Homebuilding Industry and The Competitive Position of Large Builders
Professor Michael E. PorterHarvard Business School
Centex Investor ConferenceNew York, NY
November 18, 2003This presentation was prepared with the assistance of Catherine Turco, Harvard Business School. It draws on ideas from Professor Porter’s books and articles, in particular, Competitive Strategy (The Free Press, 1980); Competitive Advantage (The Free Press, 1985); “What is Strategy?” (Harvard Business Review, Nov/Dec 1996); “Strategy and the Internet” (Harvard Business Review, March 2001); and a forthcoming book. No part of this publication may be reproduced, stored in a retrieval system, or transmitted in any form or by any means —electronic, mechanical, photocopying, recording, or otherwise—without the permission of Michael E. Porter. Additional information may be found at the website of the Institute for Strategy and Competitiveness, www.isc.hbs.edu.

2 Copyright 2003 © Professor Michael E. PorterPorter – Homebuilding – 11-18-03 – CT
Overview
• Industry structure is a key driver of homebuilder profitability
– This tends to be lost amidst attention on fluctuations in interest rates and housing starts
• Overall industry structure is becoming more attractive
• Large multi-regional builders enjoy significant and growing competitive advantages over smaller builders
• Market assessments of homebuilding stocks appear to be out of line with other industries that have similar structural characteristics

3 Copyright 2003 © Professor Michael E. PorterPorter – Homebuilding – 11-18-03 – CT
• The Fundamentals of Industry Profitability and Competitive Advantage
• The Structure of the Homebuilding Industry
• The Competitive Advantages of the Large Homebuilders
• Market Assessments of Homebuilding versus Other Industries
• The Role of Investors in Strategy
Agenda
4 Copyright 2003 © Professor Michael E. PorterPorter – Homebuilding – 11-18-03 – CT
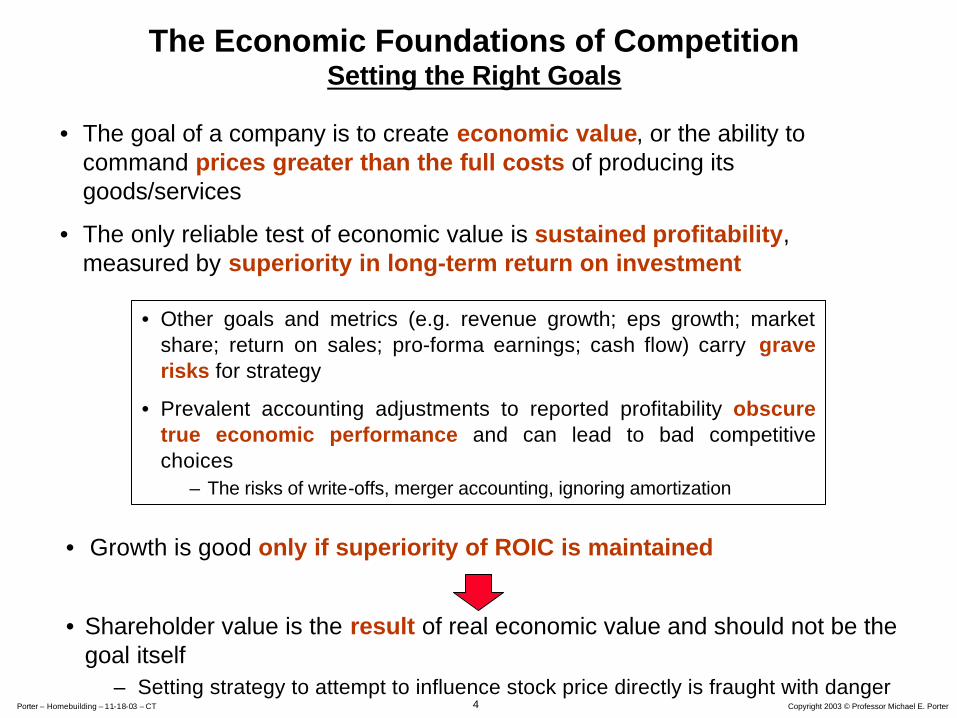
The Economic Foundations of Competition Setting the Right Goals
• The goal of a company is to create economic value, or the ability to command prices greater than the full costs of producing its goods/services
• The only reliable test of economic value is sustained profitability, measured by superiority in long-term return on investment
• Other goals and metrics (e.g. revenue growth; eps growth; marketshare; return on sales; pro-forma earnings; cash flow) carry grave risks for strategy
• Prevalent accounting adjustments to reported profitability obscure true economic performance and can lead to bad competitive choices
– The risks of write-offs, merger accounting, ignoring amortization
• Shareholder value is the result of real economic value and should not be the goal itself
– Setting strategy to attempt to influence stock price directly is fraught with danger
• Growth is good only if superiority of ROIC is maintained
5 Copyright 2003 © Professor Michael E. PorterPorter – Homebuilding – 11-18-03 – CT
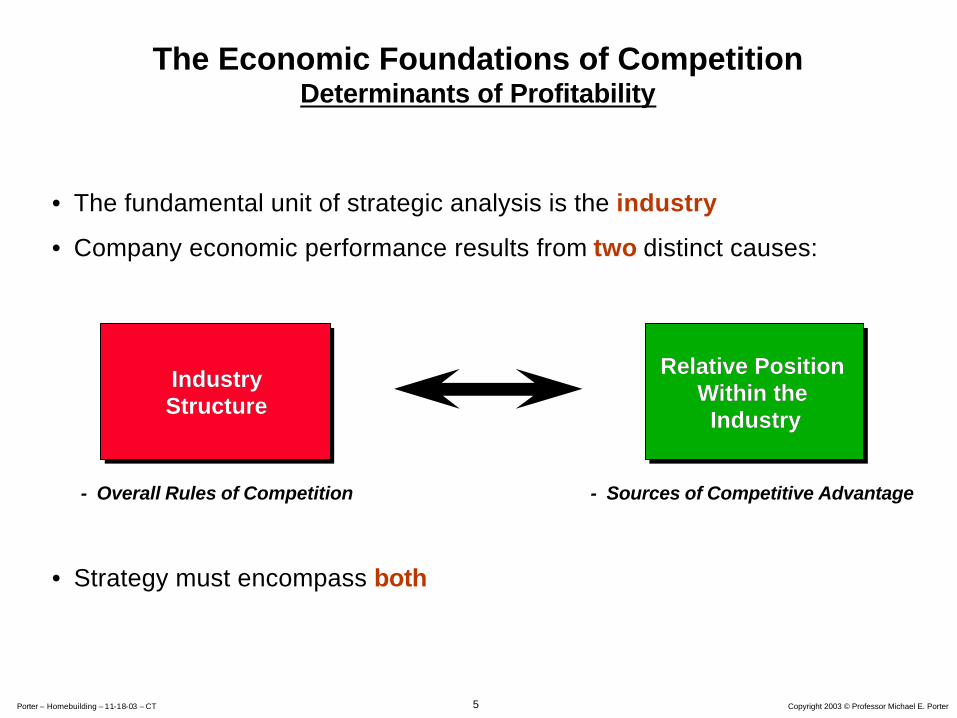
The Economic Foundations of Competition Determinants of Profitability
• The fundamental unit of strategic analysis is the industry
• Company economic performance results from two distinct causes:
• Strategy must encompass both
IndustryStructureIndustryIndustryStructureStructure
Relative Position Within the
Industry
Relative Position Relative Position Within the Within the
IndustryIndustry
- Overall Rules of Competition - Sources of Competitive Advantage
6 Copyright 2003 © Professor Michael E. PorterPorter – Homebuilding – 11-18-03 – CT
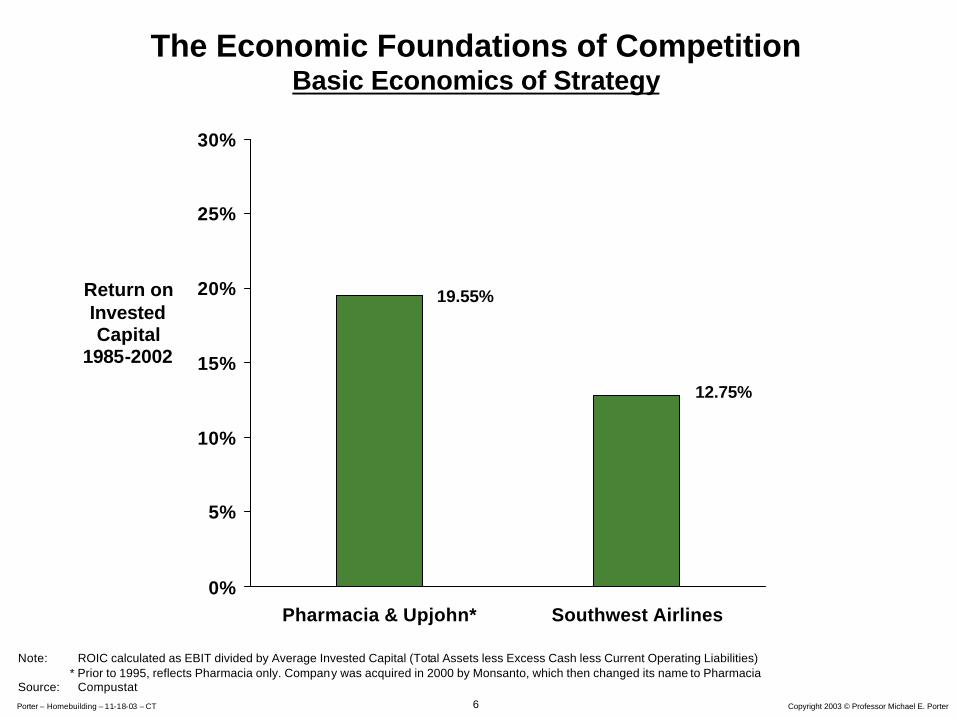
The Economic Foundations of Competition Basic Economics of Strategy
0%
5%
10%
15%
20%
25%
30%
Pharmacia & Upjohn* Southwest Airlines
Return on Invested Capital
1985-2002
19.55%
12.75%
Note: ROIC calculated as EBIT divided by Average Invested Capital (Total Assets less Excess Cash less Current Operating Liabilities)* Prior to 1995, reflects Pharmacia only. Company was acquired in 2000 by Monsanto, which then changed its name to Pharmacia
Source: Compustat
7 Copyright 2003 © Professor Michael E. PorterPorter – Homebuilding – 11-18-03 – CT
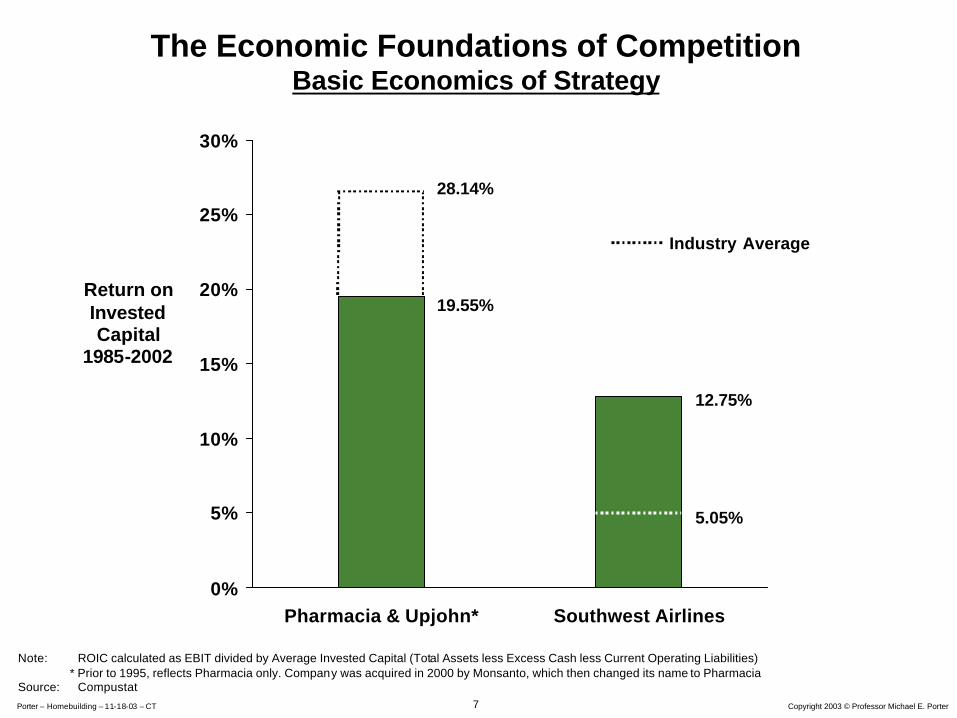
The Economic Foundations of Competition Basic Economics of Strategy
0%
5%
10%
15%
20%
25%
30%
Pharmacia & Upjohn* Southwest Airlines
Return on Invested Capital
1985-2002
19.55%
12.75%
Note: ROIC calculated as EBIT divided by Average Invested Capital (Total Assets less Excess Cash less Current Operating Liabilities)* Prior to 1995, reflects Pharmacia only. Company was acquired in 2000 by Monsanto, which then changed its name to Pharmacia
Source: Compustat
28.14%
Industry Average
5.05%

8 Copyright 2003 © Professor Michael E. PorterPorter – Homebuilding – 11-18-03 – CT
0% 5% 10% 15% 20% 25% 30% 35%
Prepackaged Software
Pharmaceuticals
Semiconductors
Electromedical Apparatus
Restaurants
Surgical/Medical Instruments
Computer Programming & Data Processing
Homebuilding
Telephone Communications
Petroleum Refining
Motor Vehicles
Trucking
Motor Vehicle Parts & Accessory
Radio, TV Broadcast, & Comm Equipment
Hotels & Motels
Natural Gas Distribution
Catalog & Mail-Order Houses
Cable & Other Pay TV Services
Steel Works & Blast Furnaces
Airlines
Note: ROIC calculated as EBIT divided by Average Invested Capital (Total Assets less Excess Cash less Current Operating Liabilities)Source: Compustat and author’s calculations
Profitability of Selected U.S. Industries
Average of the U.S. Economy: 11.6%
Return on Invested Capital, Average of 1985 – 2002
9 Copyright 2003 © Professor Michael E. PorterPorter – Homebuilding – 11-18-03 – CT
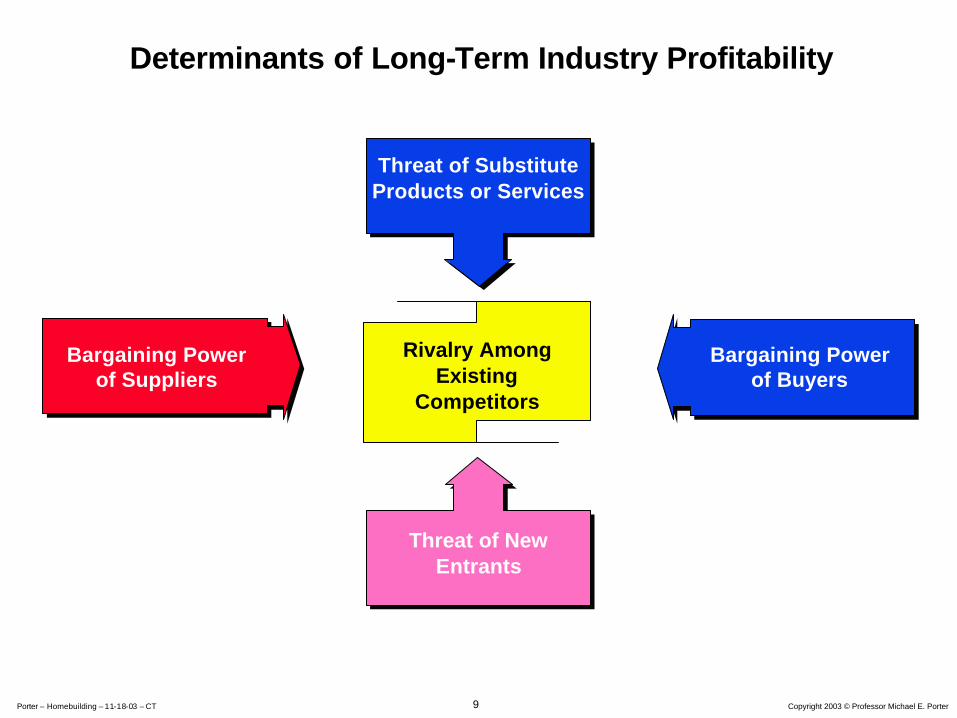
Threat of SubstituteProducts or Services
Threat of New Entrants
Rivalry AmongExisting
Competitors
Bargaining Powerof Suppliers
Bargaining Powerof Buyers
Determinants of Long-Term Industry Profitability
10 Copyright 2003 © Professor Michael E. PorterPorter – Homebuilding – 11-18-03 – CT
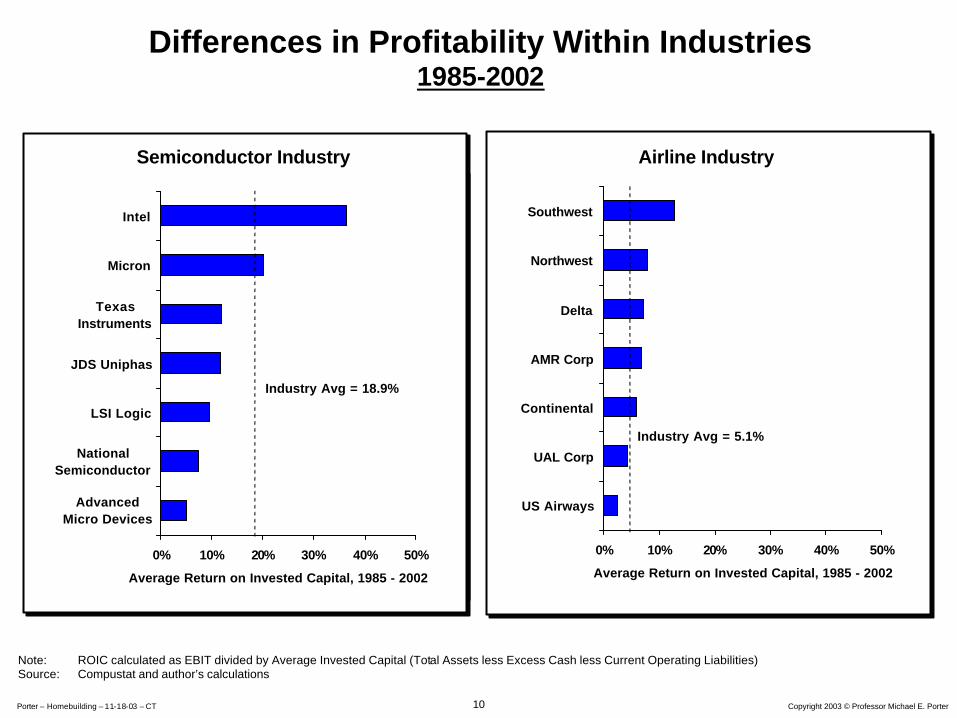
Differences in Profitability Within Industries1985-2002
0% 10% 20% 30% 40% 50%
Intel
Micron
TexasInstruments
JDS Uniphas
LSI Logic
NationalSemiconductor
AdvancedMicro Devices
Average Return on Invested Capital, 1985 - 2002
Semiconductor Industry Airline Industry
0% 10% 20% 30% 40% 50%
Southwest
Northwest
Delta
AMR Corp
Continental
UAL Corp
US Airways
Average Return on Invested Capital, 1985 - 2002
Note: ROIC calculated as EBIT divided by Average Invested Capital (Total Assets less Excess Cash less Current Operating Liabilities)Source: Compustat and author’s calculations
Industry Avg = 18.9%
Industry Avg = 5.1%
11 Copyright 2003 © Professor Michael E. PorterPorter – Homebuilding – 11-18-03 – CT
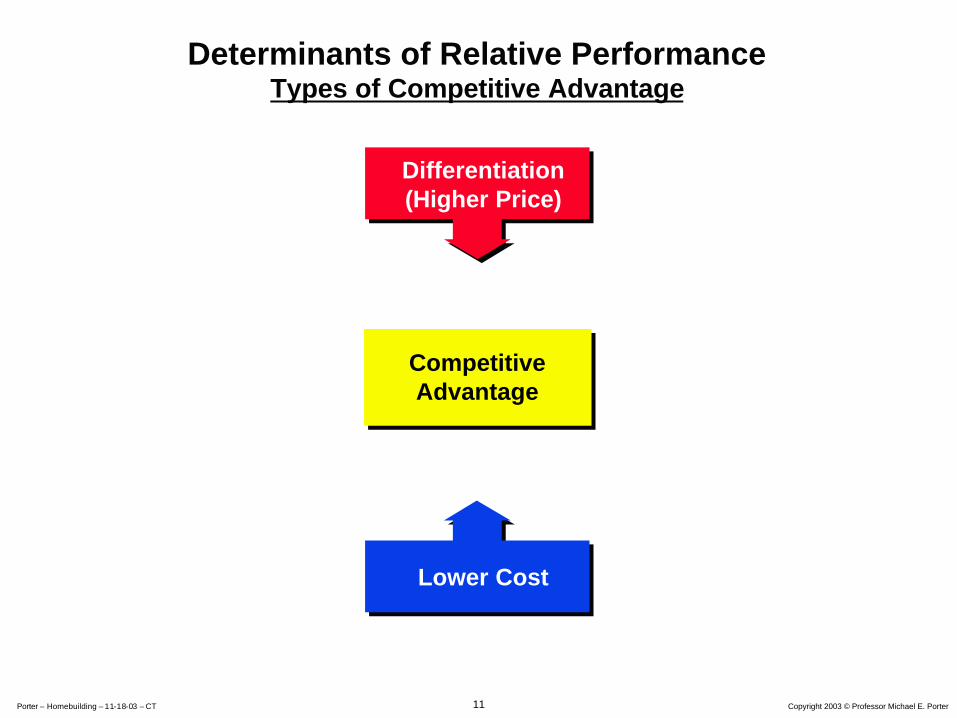
Determinants of Relative PerformanceTypes of Competitive Advantage
Differentiation(Higher Price)
Lower Cost
CompetitiveAdvantage
CompetitiveAdvantage
12 Copyright 2003 © Professor Michael E. PorterPorter – Homebuilding – 11-18-03 – CT
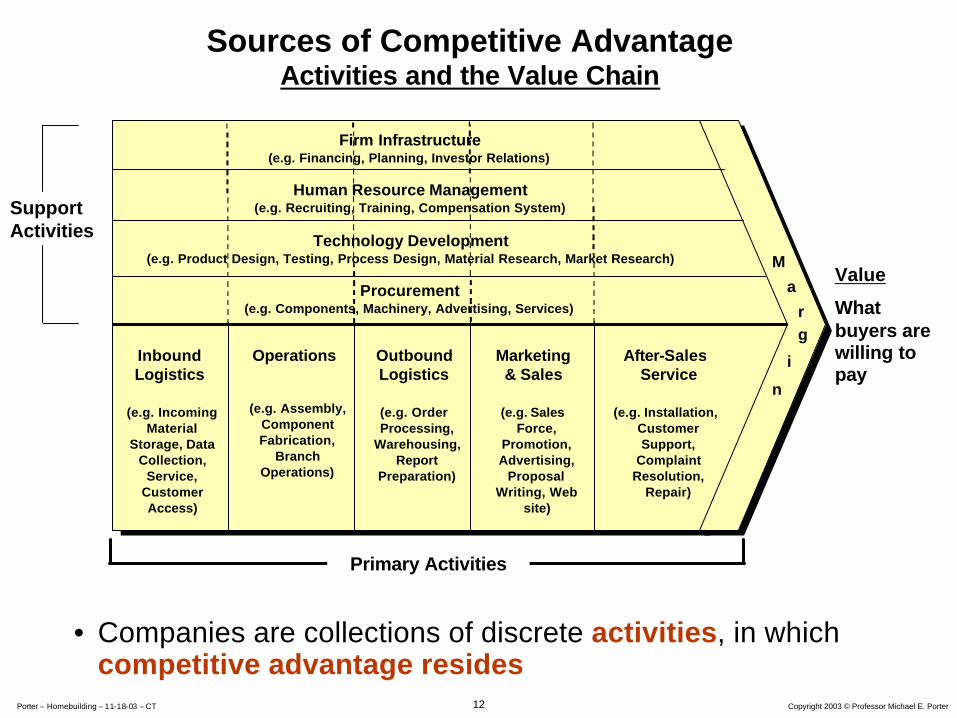
• Companies are collections of discrete activities, in which competitive advantage resides
Sources of Competitive AdvantageActivities and the Value Chain
SupportActivities
Marketing& Sales
(e.g. Sales Force,
Promotion, Advertising,
Proposal Writing, Web
site)
InboundLogistics
(e.g. Incoming Material
Storage, Data Collection,
Service, Customer Access)
Operations
(e.g. Assembly, Component Fabrication,
Branch Operations)
OutboundLogistics
(e.g. Order Processing,
Warehousing, Report
Preparation)
After-Sales Service
(e.g. Installation, Customer Support,
Complaint Resolution,
Repair)
M
a
rg
i
n
Primary Activities
Firm Infrastructure(e.g. Financing, Planning, Investor Relations)
Procurement(e.g. Components, Machinery, Advertising, Services)
Technology Development(e.g. Product Design, Testing, Process Design, Material Research, Market Research)
Human Resource Management(e.g. Recruiting, Training, Compensation System)
Value
What buyers are willing to pay
13 Copyright 2003 © Professor Michael E. PorterPorter – Homebuilding – 11-18-03 – CT
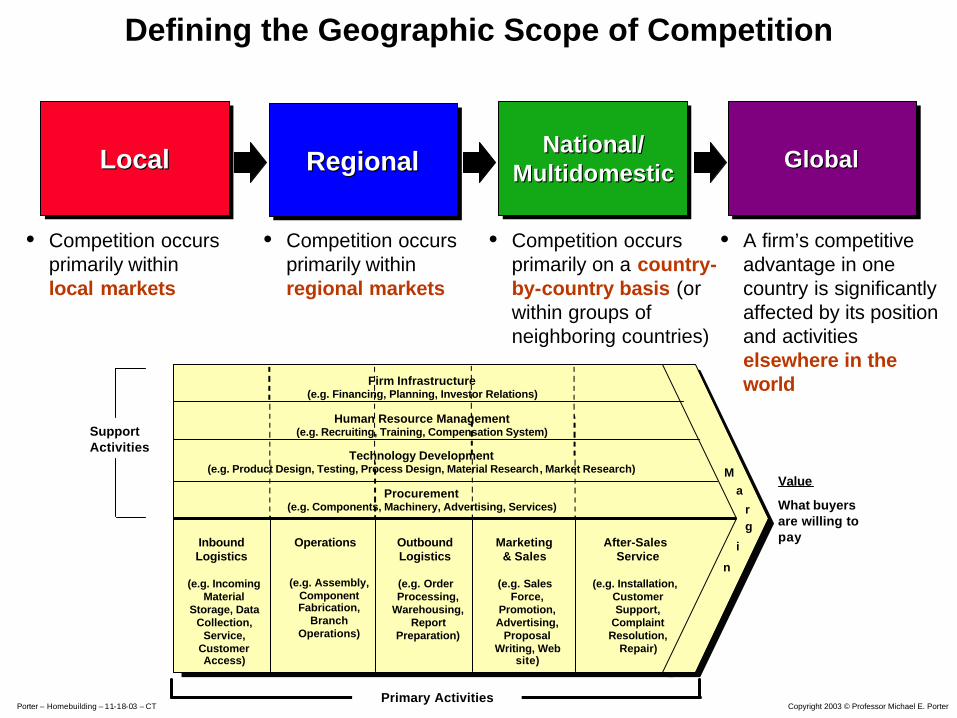
Defining the Geographic Scope of Competition
GlobalGlobalGlobalNational/Multidomestic
National/National/MultidomesticMultidomesticLocalLocalLocal
• Competition occurs primarily within local markets
• Competition occurs primarily on a country-by-country basis (or within groups of neighboring countries)
RegionalRegionalRegional
• A firm’s competitive advantage in one country is significantly affected by its position and activities elsewhere in the world
• Competition occurs primarily within regional markets
SupportActivities
Marketing& Sales
(e.g. Sales Force,
Promotion, Advertising,
Proposal Writing, Web
site)
InboundLogistics
(e.g. Incoming Material
Storage, Data Collection,
Service, Customer Access)
Operations
(e.g. Assembly, Component Fabrication,
Branch Operations)
OutboundLogistics
(e.g. Order Processing,
Warehousing, Report
Preparation)
After-Sales Service
(e.g. Installation, Customer Support,
Complaint Resolution,
Repair)
Ma
rg
i
n
Primary Activities
Firm Infrastructure(e.g. Financing, Planning, Investor Relations)
Procurement(e.g. Components, Machinery, Advertising, Services)
Technology Development(e.g. Product Design, Testing, Process Design, Material Research, Market Research)
Human Resource Management(e.g. Recruiting, Training, Compensation System)
Value
What buyers are willing to pay

14 Copyright 2003 © Professor Michael E. PorterPorter – Homebuilding – 11-18-03 – CT
Determinants of Relative Performance
• Creating a unique and sustainable competitive position
• Assimilating, attaining, and extending best practice
OperationalOperationalEffectivenessEffectiveness
StrategicStrategicPositioningPositioning
Run the same race faster Choose to run a different race
15 Copyright 2003 © Professor Michael E. PorterPorter – Homebuilding – 11-18-03 – CT
• The Fundamentals of Industry Profitability and Competitive Advantage
• The Structure of the Homebuilding Industry
• The Competitive Advantages of the Large Homebuilders
• Market Assessments of Homebuilding versus Other Industries
• The Role of Investors in Strategy
Agenda
16 Copyright 2003 © Professor Michael E. PorterPorter – Homebuilding – 11-18-03 – CT
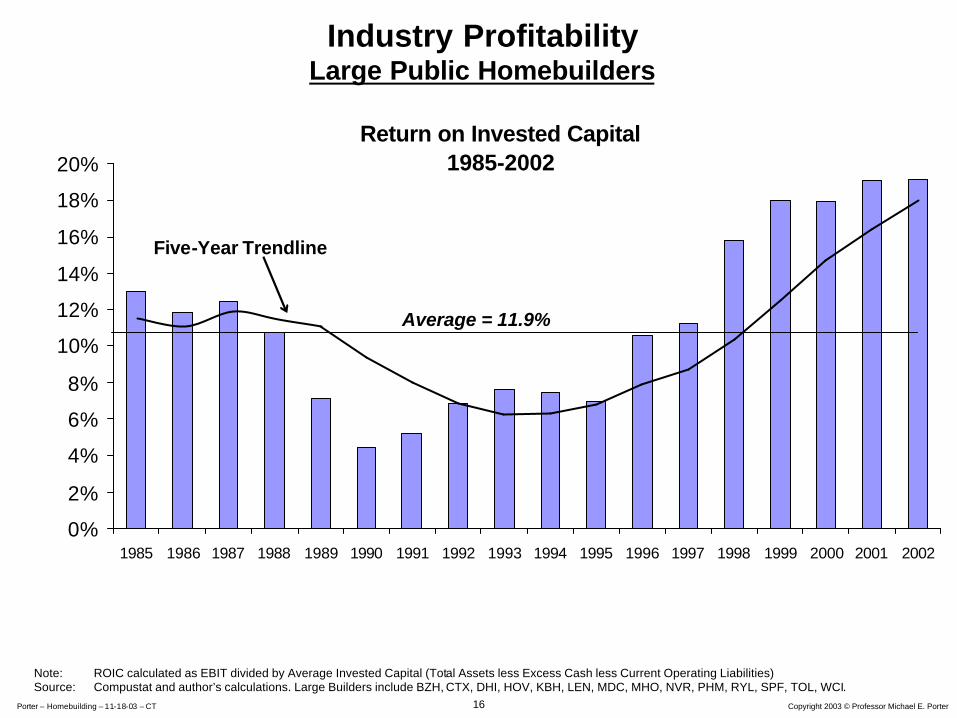
Note: ROIC calculated as EBIT divided by Average Invested Capital (Total Assets less Excess Cash less Current Operating Liabilities)Source: Compustat and author’s calculations. Large Builders include BZH, CTX, DHI, HOV, KBH, LEN, MDC, MHO, NVR, PHM, RYL, SPF, TOL, WCI.
Industry ProfitabilityLarge Public Homebuilders
Return on Invested Capital1985-2002
0%
2%
4%
6%
8%
10%
12%
14%
16%
18%
20%
1985 1986 1987 1988 1989 1990 1991 1992 1993 1994 1995 1996 1997 1998 1999 2000 2001 2002
Average = 11.9%
Five-Year Trendline
17 Copyright 2003 © Professor Michael E. PorterPorter – Homebuilding – 11-18-03 – CT
0% 5% 10% 15% 20% 25% 30% 35%
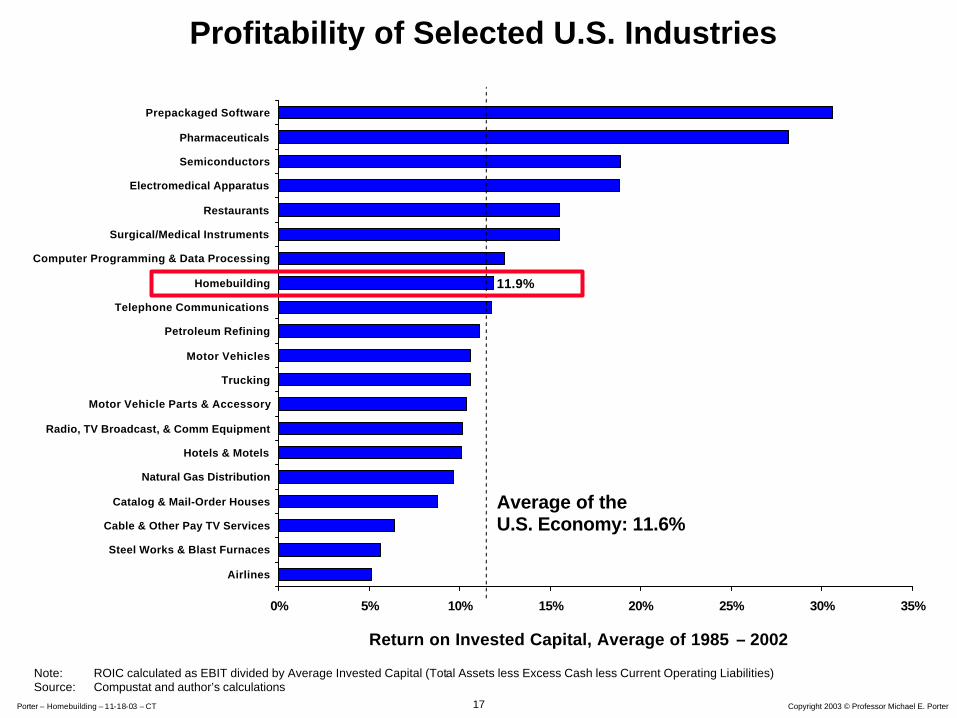
Prepackaged Software
Pharmaceuticals
Semiconductors
Electromedical Apparatus
Restaurants
Surgical/Medical Instruments
Computer Programming & Data Processing
Homebuilding
Telephone Communications
Petroleum Refining
Motor Vehicles
Trucking
Motor Vehicle Parts & Accessory
Radio, TV Broadcast, & Comm Equipment
Hotels & Motels
Natural Gas Distribution
Catalog & Mail-Order Houses
Cable & Other Pay TV Services
Steel Works & Blast Furnaces
Airlines
Return on Invested Capital, Average of 1985 – 2002
Note: ROIC calculated as EBIT divided by Average Invested Capital (Total Assets less Excess Cash less Current Operating Liabilities)Source: Compustat and author’s calculations
Profitability of Selected U.S. Industries
Average of the U.S. Economy: 11.6%
11.9%
18 Copyright 2003 © Professor Michael E. PorterPorter – Homebuilding – 11-18-03 – CT
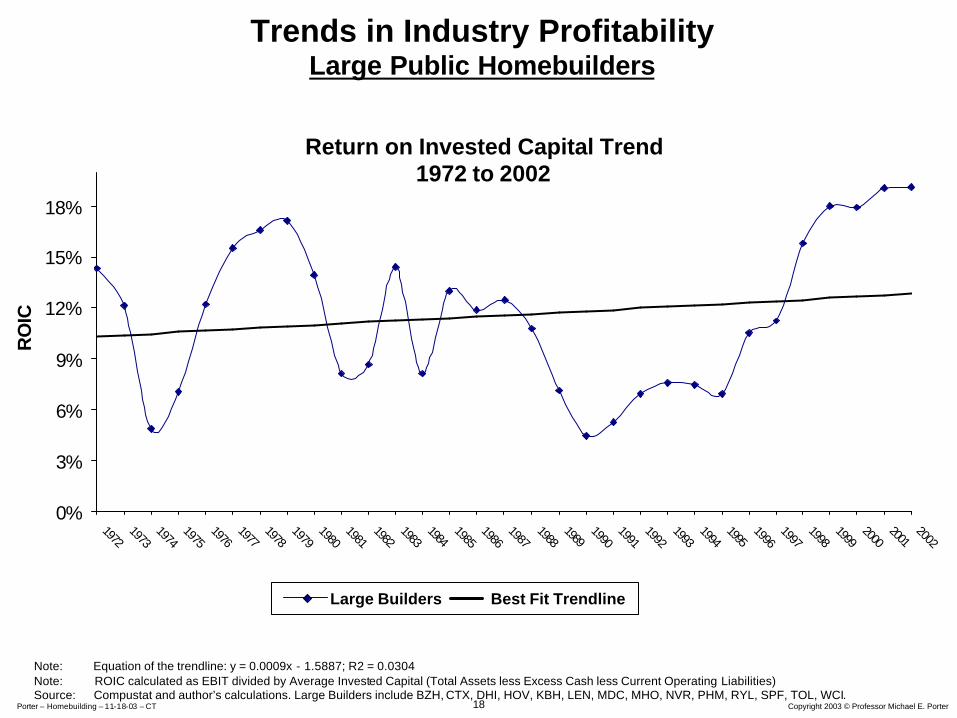
Note: Equation of the trendline: y = 0.0009x - 1.5887; R2 = 0.0304Note: ROIC calculated as EBIT divided by Average Invested Capital (Total Assets less Excess Cash less Current Operating Liabilities)Source: Compustat and author’s calculations. Large Builders include BZH, CTX, DHI, HOV, KBH, LEN, MDC, MHO, NVR, PHM, RYL, SPF, TOL, WCI.
Large Builders Best Fit Trendline
Trends in Industry ProfitabilityLarge Public Homebuilders
0%
3%
6%
9%
12%
15%
18%
19721973
19741975
19761977
19781979
19801981
19821983
19841985
19861987
19881989
19901991
19921993
19941995
19961997
19981999
20002001
2002
Return on Invested Capital Trend1972 to 2002
RO
IC
19 Copyright 2003 © Professor Michael E. PorterPorter – Homebuilding – 11-18-03 – CT
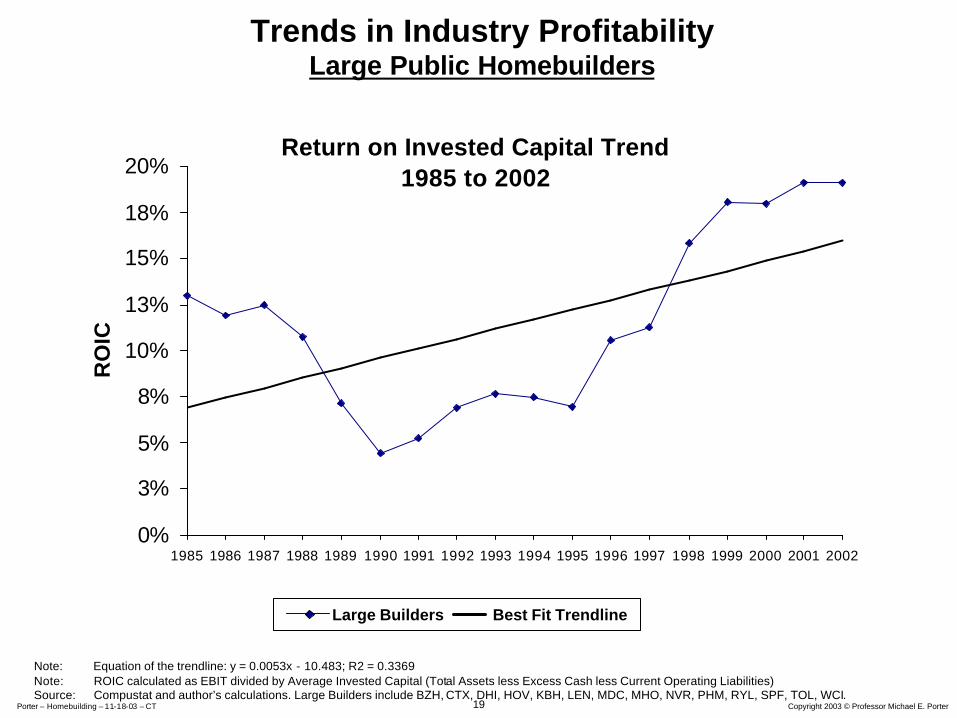
Return on Invested Capital Trend 1985 to 2002
0%
3%
5%
8%
10%
13%
15%
18%
20%
1985 1986 1987 1988 1989 1990 1991 1992 1993 1994 1995 1996 1997 1998 1999 2000 2001 2002
RO
IC
Note: Equation of the trendline: y = 0.0053x - 10.483; R2 = 0.3369Note: ROIC calculated as EBIT divided by Average Invested Capital (Total Assets less Excess Cash less Current Operating Liabilities)Source: Compustat and author’s calculations. Large Builders include BZH, CTX, DHI, HOV, KBH, LEN, MDC, MHO, NVR, PHM, RYL, SPF, TOL, WCI.
Large Builders Best Fit Trendline
Trends in Industry ProfitabilityLarge Public Homebuilders
20 Copyright 2003 © Professor Michael E. PorterPorter – Homebuilding – 11-18-03 – CT
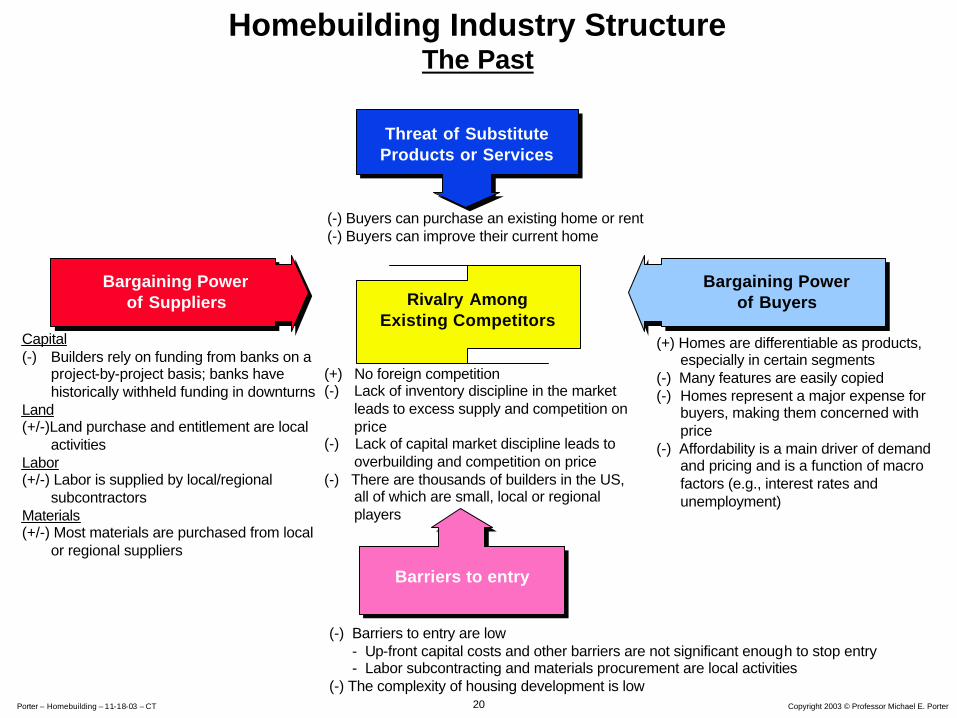
Homebuilding Industry StructureThe Past
Threat of SubstituteProducts or Services
Rivalry AmongExisting Competitors
Bargaining Powerof Suppliers
BargainingPower of Buyers
(-) Buyers can purchase an existing home or rent (-) Buyers can improve their current home
Capital(-) Builders rely on funding from banks on a
project-by-project basis; banks have historically withheld funding in downturns
Land(+/-)Land purchase and entitlement are local
activitiesLabor(+/-) Labor is supplied by local/regional
subcontractorsMaterials(+/-) Most materials are purchased from local
or regional suppliers
(+) No foreign competition(-) Lack of inventory discipline in the market
leads to excess supply and competition on price
(-) Lack of capital market discipline leads to overbuilding and competition on price
(-) There are thousands of builders in the US, all of which are small, local or regional players
(+) Homes are differentiable as products, especially in certain segments
(-) Many features are easily copied(-) Homes represent a major expense for
buyers, making them concerned with price
(-) Affordability is a main driver of demand and pricing and is a function of macro factors (e.g., interest rates and unemployment)
(-) Barriers to entry are low- Up-front capital costs and other barriers are not significant enough to stop entry- Labor subcontracting and materials procurement are local activities
(-) The complexity of housing development is low
Barriers to entry
Bargaining Power of Buyers
21 Copyright 2003 © Professor Michael E. PorterPorter – Homebuilding – 11-18-03 – CT
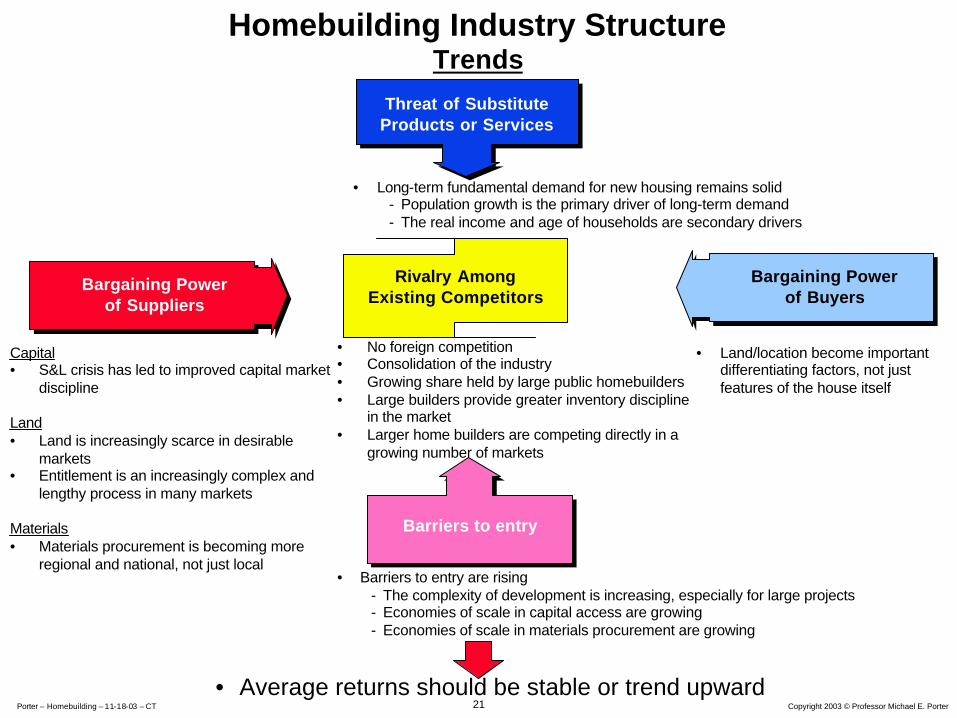
Homebuilding Industry StructureTrends
Threat of SubstituteProducts or Services
Rivalry AmongExisting Competitors
Bargaining Powerof Suppliers
Capital• S&L crisis has led to improved capital market
discipline
Land• Land is increasingly scarce in desirable
markets• Entitlement is an increasingly complex and
lengthy process in many markets
Materials• Materials procurement is becoming more
regional and national, not just local
• No foreign competition• Consolidation of the industry• Growing share held by large public homebuilders• Large builders provide greater inventory discipline
in the market• Larger home builders are competing directly in a
growing number of markets
• Land/location become important differentiating factors, not just features of the house itself
• Barriers to entry are rising- The complexity of development is increasing, especially for large projects- Economies of scale in capital access are growing- Economies of scale in materials procurement are growing
Barriers to entry
Bargaining Power of Buyers
• Average returns should be stable or trend upward
• Long-term fundamental demand for new housing remains solid- Population growth is the primary driver of long-term demand- The real income and age of households are secondary drivers
22 Copyright 2003 © Professor Michael E. PorterPorter – Homebuilding – 11-18-03 – CT
• The Fundamentals of Industry Profitability and Competitive Advantage
• The Structure of the Homebuilding Industry
• The Competitive Advantages of the Large Homebuilders
• Market Assessments of Homebuilding versus Other Industries
• The Role of Investors in Strategy
Agenda
23 Copyright 2003 © Professor Michael E. PorterPorter – Homebuilding – 11-18-03 – CT
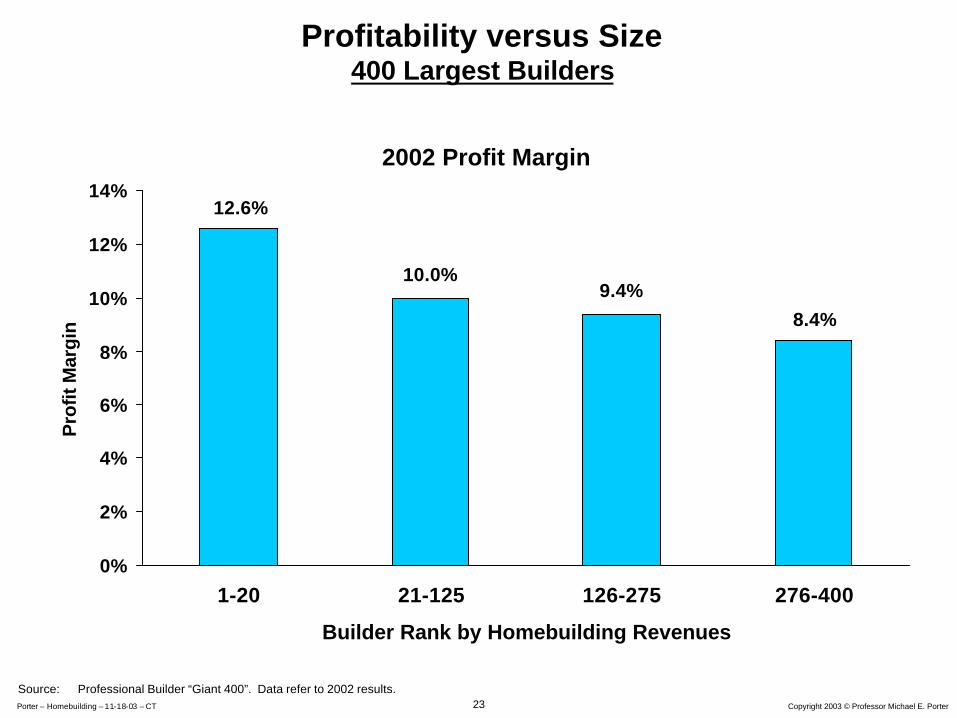
Profitability versus Size400 Largest Builders
12.6%
10.0%9.4%
8.4%
0%
2%
4%
6%
8%
10%
12%
14%
1-20 21-125 126-275 276-400
Builder Rank by Homebuilding Revenues
Pro
fit M
argi
n
2002 Profit Margin
Source: Professional Builder “Giant 400”. Data refer to 2002 results.
24 Copyright 2003 © Professor Michael E. PorterPorter – Homebuilding – 11-18-03 – CT
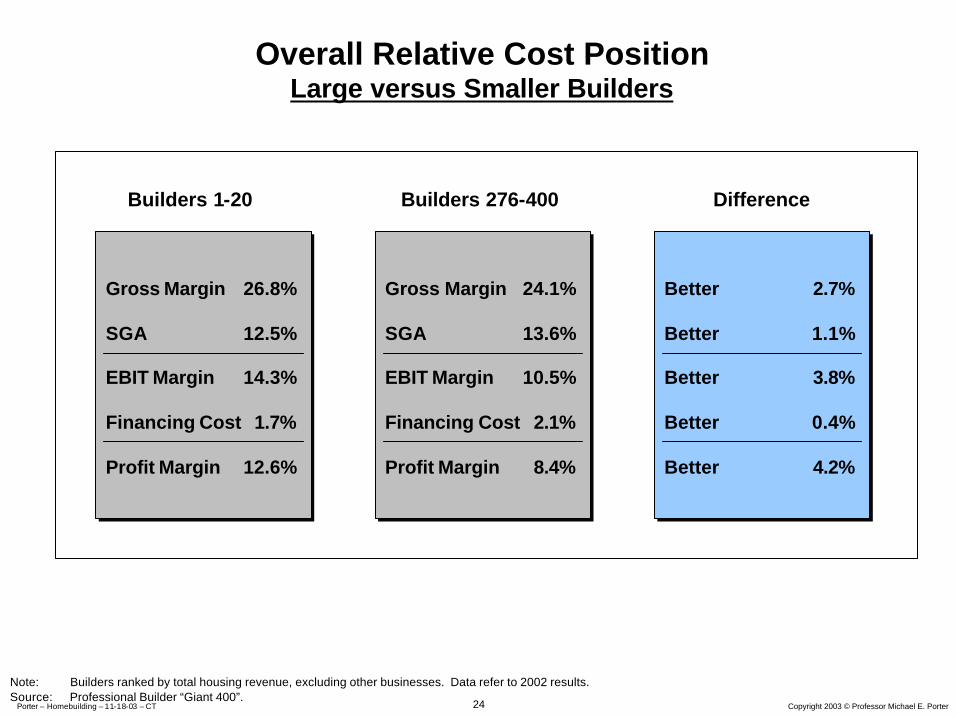
Overall Relative Cost PositionLarge versus Smaller Builders
Builders 276-400Builders 1-20
Note: Builders ranked by total housing revenue, excluding other businesses. Data refer to 2002 results.Source: Professional Builder “Giant 400”.
Gross Margin 26.8%
SGA 12.5%
EBIT Margin 14.3%
Financing Cost 1.7%
Profit Margin 12.6%
Gross Margin 26.8%
SGA 12.5%
EBIT Margin 14.3%
Financing Cost 1.7%
Profit Margin 12.6%
Difference
Gross Margin 24.1%
SGA 13.6%
EBIT Margin 10.5%
Financing Cost 2.1%
Profit Margin 8.4%
Gross Margin 24.1%
SGA 13.6%
EBIT Margin 10.5%
Financing Cost 2.1%
Profit Margin 8.4%
Better 2.7%
Better 1.1%
Better 3.8%
Better 0.4%
Better 4.2%
Better 2.7%
Better 1.1%
Better 3.8%
Better 0.4%
Better 4.2%
25 Copyright 2003 © Professor Michael E. PorterPorter – Homebuilding – 11-18-03 – CT
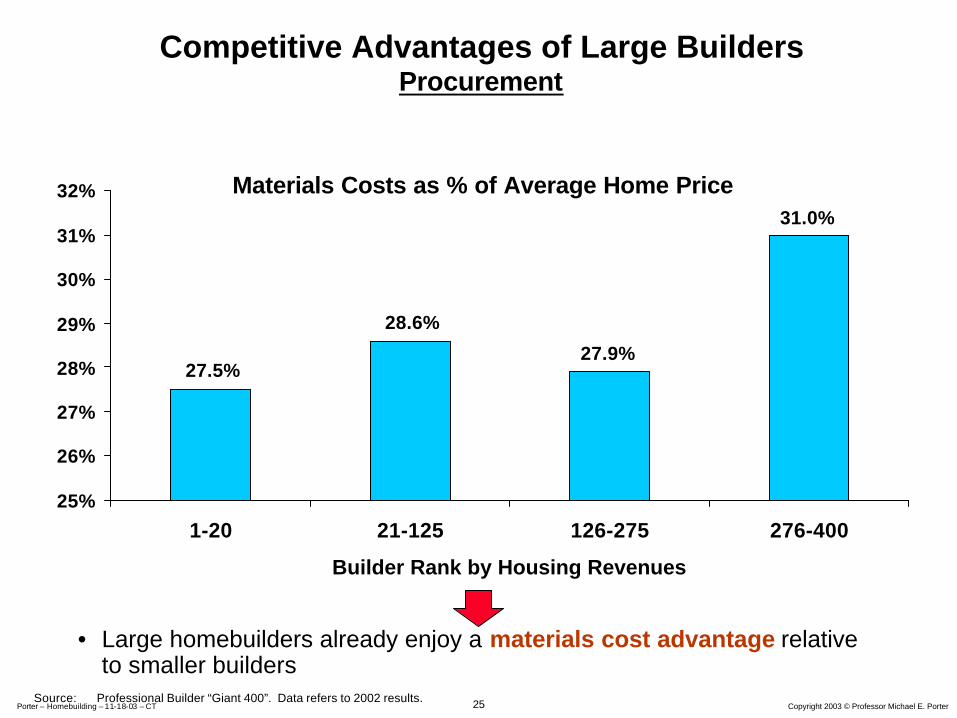
Competitive Advantages of Large BuildersProcurement
Materials Costs as % of Average Home Price31.0%
27.9%
28.6%
27.5%
25%
26%
27%
28%
29%
30%
31%
32%
1-20 21-125 126-275 276-400
Builder Rank by Housing Revenues
Source: Professional Builder “Giant 400”. Data refers to 2002 results.
• Large homebuilders already enjoy a materials cost advantage relative to smaller builders
26 Copyright 2003 © Professor Michael E. PorterPorter – Homebuilding – 11-18-03 – CT
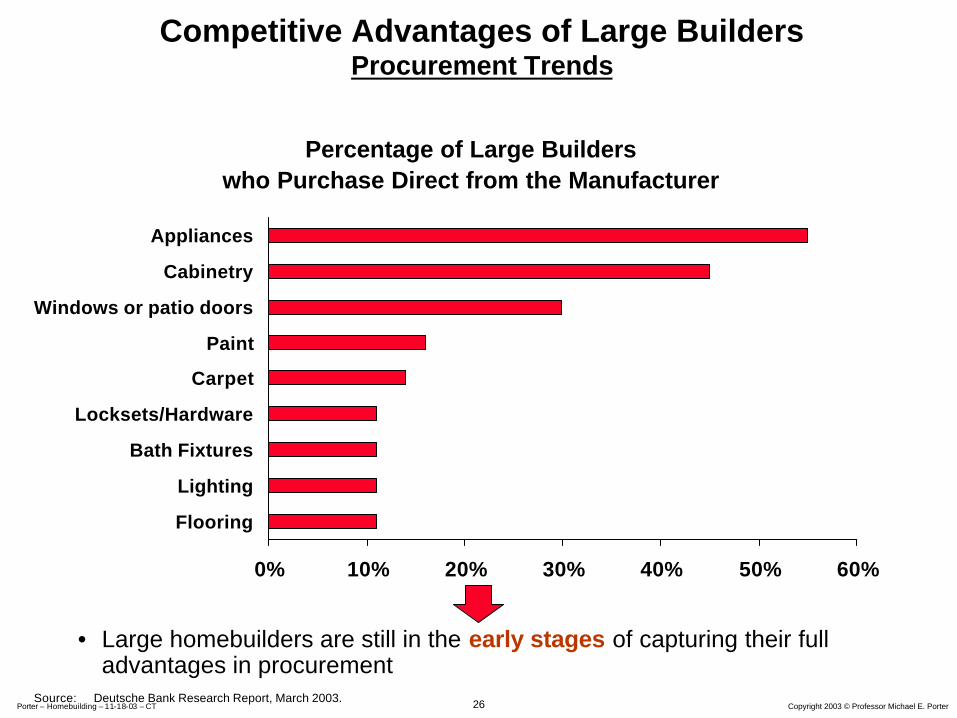
Percentage of Large Builderswho Purchase Direct from the Manufacturer
0% 10% 20% 30% 40% 50% 60%
Appliances
Cabinetry
Windows or patio doors
Paint
Carpet
Locksets/Hardware
Bath Fixtures
Lighting
Flooring
Source: Deutsche Bank Research Report, March 2003.
• Large homebuilders are still in the early stages of capturing their full advantages in procurement
Competitive Advantages of Large BuildersProcurement Trends

27 Copyright 2003 © Professor Michael E. PorterPorter – Homebuilding – 11-18-03 – CT
Construction Labor Costs as % of Average Home Price
23.5%
20.9%
22.2%
20.9%
20%
21%
22%
23%
24%
1-20 21-125 126-275 276-400
Builder Rank by Housing Revenues
Source: Professional Builder “Giant 400”. Data refers to 2002 results.
• Large homebuilders enjoy some labor cost advantages relative to most smaller builders
Competitive Advantages of Large BuildersLabor Cost
28 Copyright 2003 © Professor Michael E. PorterPorter – Homebuilding – 11-18-03 – CT
Competitive Advantages of Large BuildersAccess to Capital
• Small builders can access only bank credit
– Access to bank credit is limited or dries up in economic downturns
– At certain points in the economic cycle, however, the cost of short term bank debt may be less than that of corporate bonds with longer maturities
• Large builders can access both bank debt and corporate bonds
– Use of both bank credit and corporate bonds together provides a less volatile source of capital than bank credit alone
– Over the long-term, the cost of debt for large builders with public market access is likely to be lower than for smaller builders with access to bank credit only
• Large builders enjoy superior, more reliable capital access than smaller builders
29 Copyright 2003 © Professor Michael E. PorterPorter – Homebuilding – 11-18-03 – CT
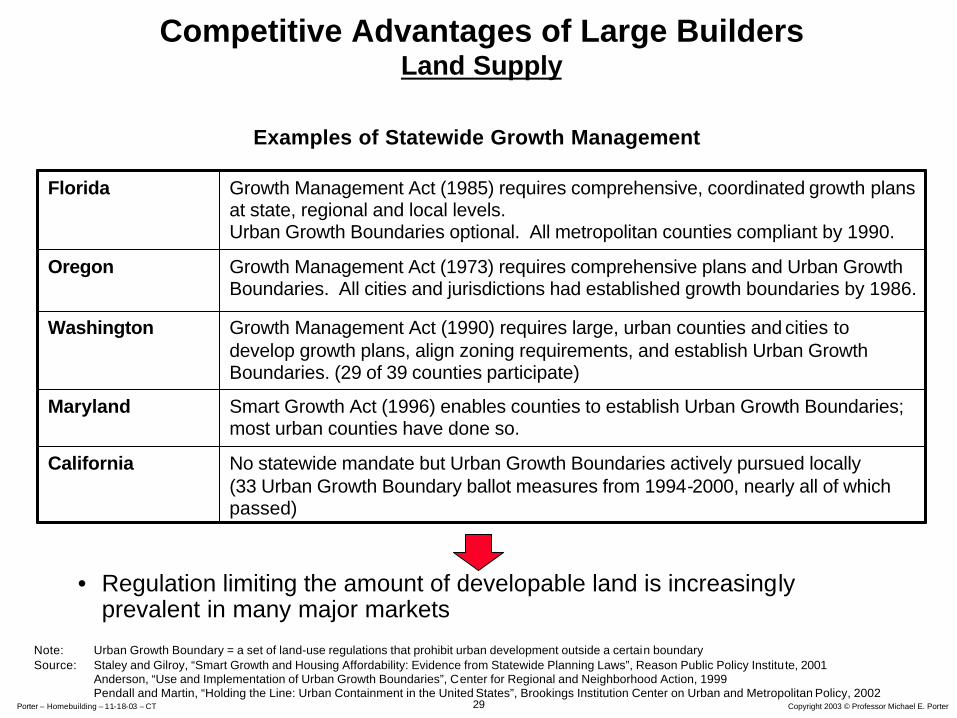
Competitive Advantages of Large BuildersLand Supply
No statewide mandate but Urban Growth Boundaries actively pursued locally(33 Urban Growth Boundary ballot measures from 1994-2000, nearly all of which passed)
California
Smart Growth Act (1996) enables counties to establish Urban Growth Boundaries; most urban counties have done so.
Maryland
Growth Management Act (1990) requires large, urban counties and cities to develop growth plans, align zoning requirements, and establish Urban Growth Boundaries. (29 of 39 counties participate)
Washington
Growth Management Act (1973) requires comprehensive plans and Urban Growth Boundaries. All cities and jurisdictions had established growth boundaries by 1986.
Oregon
Growth Management Act (1985) requires comprehensive, coordinated growth plans at state, regional and local levels.Urban Growth Boundaries optional. All metropolitan counties compliant by 1990.
Florida
Note: Urban Growth Boundary = a set of land-use regulations that prohibit urban development outside a certain boundarySource: Staley and Gilroy, “Smart Growth and Housing Affordability: Evidence from Statewide Planning Laws”, Reason Public Policy Institute, 2001
Anderson, “Use and Implementation of Urban Growth Boundaries”, Center for Regional and Neighborhood Action, 1999Pendall and Martin, “Holding the Line: Urban Containment in the United States”, Brookings Institution Center on Urban and Metropolitan Policy, 2002
Examples of Statewide Growth Management
• Regulation limiting the amount of developable land is increasingly prevalent in many major markets
30 Copyright 2003 © Professor Michael E. PorterPorter – Homebuilding – 11-18-03 – CT
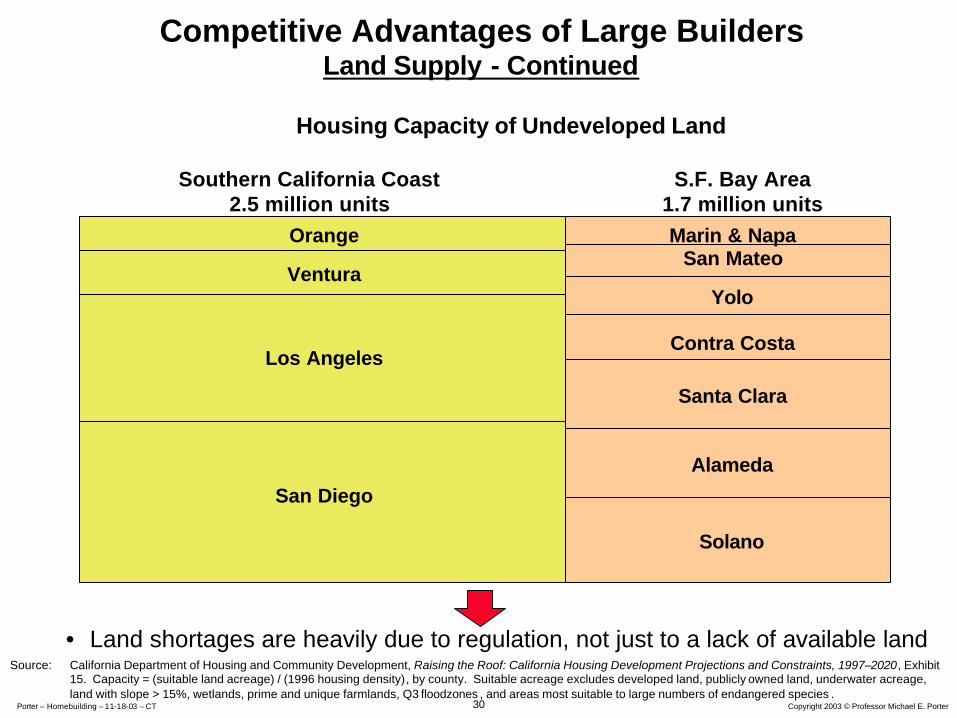
Competitive Advantages of Large BuildersLand Supply - Continued
Source: California Department of Housing and Community Development, Raising the Roof: California Housing Development Projections and Constraints, 1997–2020, Exhibit 15. Capacity = (suitable land acreage) / (1996 housing density), by county. Suitable acreage excludes developed land, publicly owned land, underwater acreage, land with slope > 15%, wetlands, prime and unique farmlands, Q3 floodzones , and areas most suitable to large numbers of endangered species .
Southern California Coast2.5 million units
S.F. Bay Area1.7 million units
• Land shortages are heavily due to regulation, not just to a lack of available land
San Diego
Los Angeles
Ventura
Orange
Solano
Alameda
Santa Clara
Contra Costa
Yolo
San MateoMarin & Napa
Housing Capacity of Undeveloped Land

31 Copyright 2003 © Professor Michael E. PorterPorter – Homebuilding – 11-18-03 – CT
Competitive Advantages of Large BuildersEffect of Land Use Regulation
More land-use regulation, e.g., “Smart Growth”
Slower process
More capital-intensive entitlement
Lessdevelopable land
Higher fees and exactions
More expensive land
• Regulation limits the amount of developable land and increases land costs.
• Large public builders with larger staffs, greater capital access, and more patient capital have an advantage in heavily regulated markets.
32 Copyright 2003 © Professor Michael E. PorterPorter – Homebuilding – 11-18-03 – CT
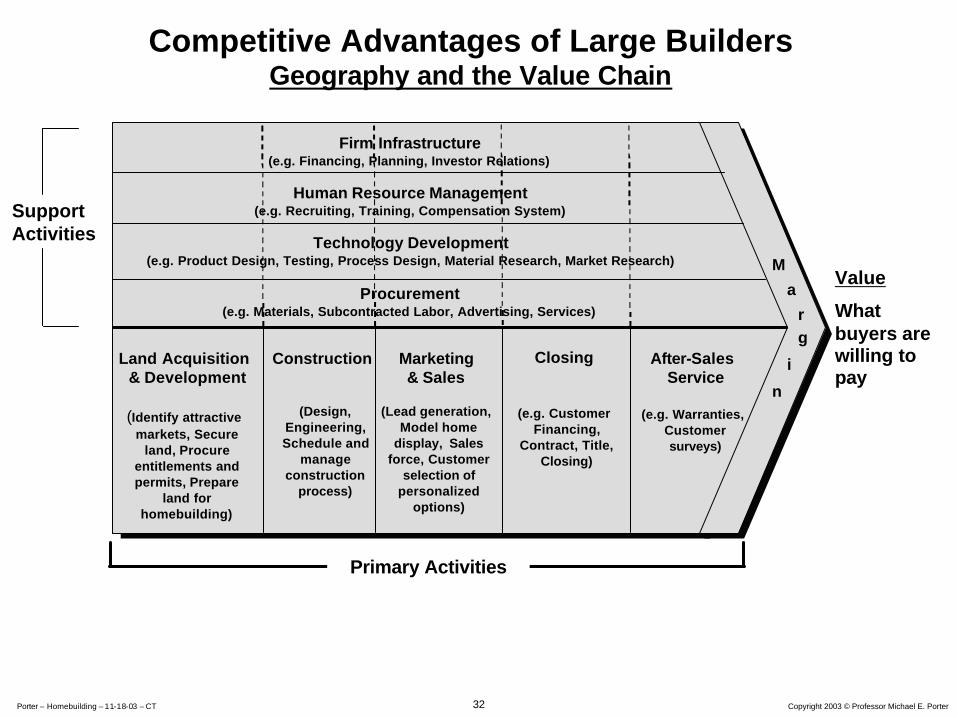
Marketing& Sales
(Lead generation, Model home
display, Sales force, Customer
selection of personalized
options)
Land Acquisition & Development
(Identify attractive markets, Secure
land, Procure entitlements and permits, Prepare
land for homebuilding)
Construction
(Design, Engineering, Schedule and
manage construction
process)
Closing
(e.g. Customer Financing,
Contract, Title, Closing)
After-Sales Service
(e.g. Warranties, Customer surveys)
M
a
rg
i
n
Primary Activities
SupportActivities
Firm Infrastructure(e.g. Financing, Planning, Investor Relations)
Procurement(e.g. Materials, Subcontracted Labor, Advertising, Services)
Technology Development(e.g. Product Design, Testing, Process Design, Material Research, Market Research)
Human Resource Management(e.g. Recruiting, Training, Compensation System)
Competitive Advantages of Large BuildersGeography and the Value Chain
Value
What buyers are willing to pay
33 Copyright 2003 © Professor Michael E. PorterPorter – Homebuilding – 11-18-03 – CT
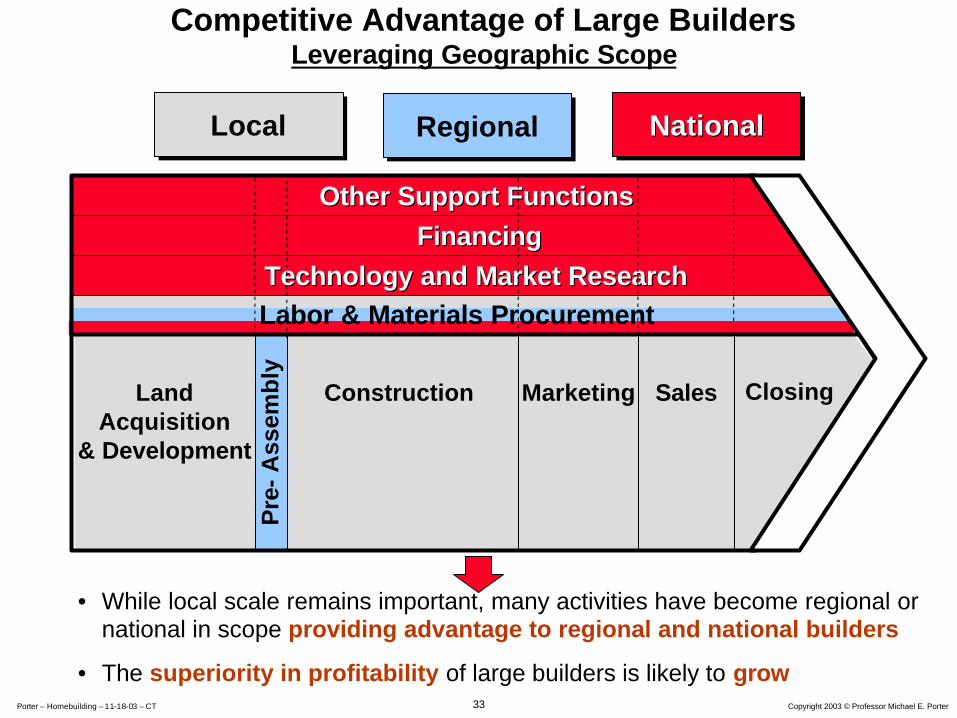
Competitive Advantage of Large BuildersLeveraging Geographic Scope
NationalNationalNationalLocalLocal RegionalRegional
Other Support FunctionsOther Support Functions
FinancingFinancing
Technology and Market ResearchTechnology and Market Research
Land Acquisition
& Development
Construction Marketing Sales
Pre
-A
ssem
bly
Closing
• While local scale remains important, many activities have become regional or national in scope providing advantage to regional and national builders
• The superiority in profitability of large builders is likely to grow
Labor & Materials Procurement

34 Copyright 2003 © Professor Michael E. PorterPorter – Homebuilding – 11-18-03 – CT
• The Fundamentals of Industry Profitability and Competitive Advantage
• The Structure of the Homebuilding Industry
• The Competitive Advantages of the Large Homebuilders
• Market Assessments of Homebuilding versus Other Industries
• The Role of Investors in Strategy
Agenda
35 Copyright 2003 © Professor Michael E. PorterPorter – Homebuilding – 11-18-03 – CT
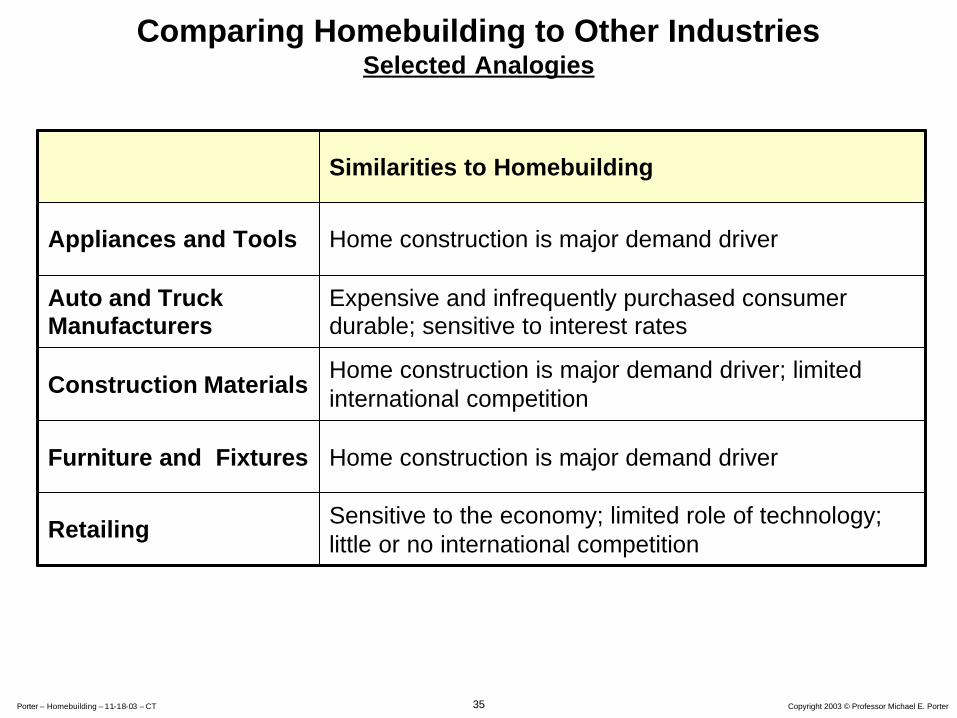
Comparing Homebuilding to Other IndustriesSelected Analogies
Sensitive to the economy; limited role of technology; little or no international competition
Retailing
Home construction is major demand driverFurniture and Fixtures
Home construction is major demand driver; limited international competitionConstruction Materials
Expensive and infrequently purchased consumer durable; sensitive to interest rates
Auto and Truck Manufacturers
Home construction is major demand driverAppliances and Tools
Similarities to Homebuilding
36 Copyright 2003 © Professor Michael E. PorterPorter – Homebuilding – 11-18-03 – CT
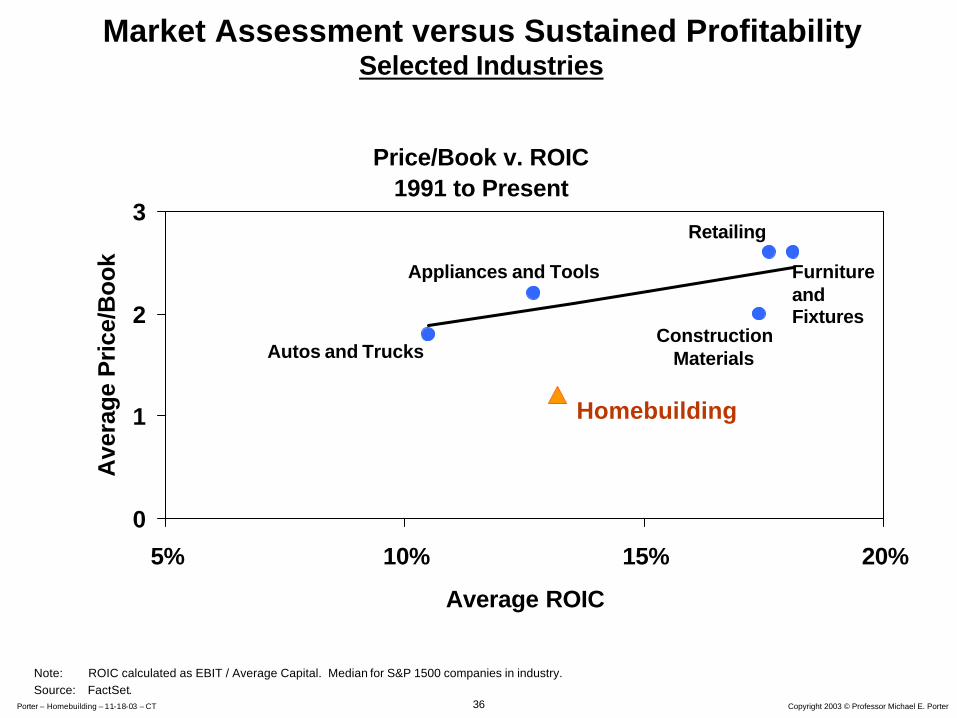
Market Assessment versus Sustained ProfitabilitySelected Industries
Price/Book v. ROIC 1991 to Present
0
1
2
3
5% 10% 15% 20%
Average ROIC
Ave
rage
Pri
ce/B
ook
Autos and Trucks
Appliances and Tools
Retailing
FurnitureandFixtures
ConstructionMaterials
Homebuilding
Note: ROIC calculated as EBIT / Average Capital. Median for S&P 1500 companies in industry. Source: FactSet.
37 Copyright 2003 © Professor Michael E. PorterPorter – Homebuilding – 11-18-03 – CT
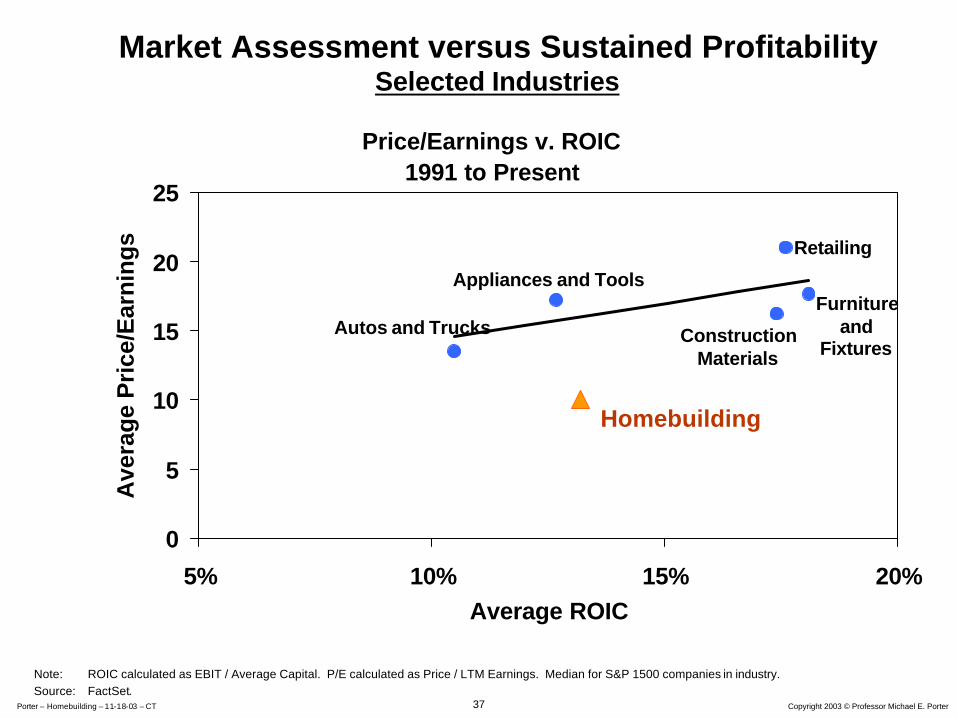
Price/Earnings v. ROIC 1991 to Present
0
5
10
15
20
25
5% 10% 15% 20%Average ROIC
Ave
rag
e P
rice
/Ear
nin
gs
Autos and Trucks
Appliances and Tools
Retailing
Furnitureand
FixturesConstruction
Materials
Homebuilding
Market Assessment versus Sustained ProfitabilitySelected Industries
Note: ROIC calculated as EBIT / Average Capital. P/E calculated as Price / LTM Earnings. Median for S&P 1500 companies in industry. Source: FactSet.
38 Copyright 2003 © Professor Michael E. PorterPorter – Homebuilding – 11-18-03 – CT
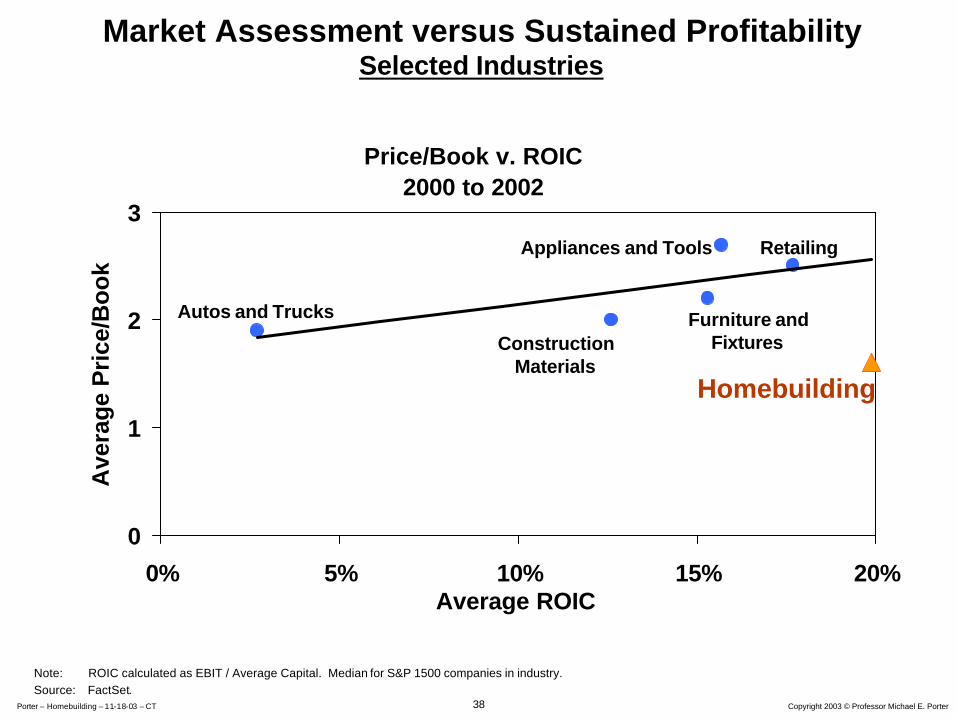
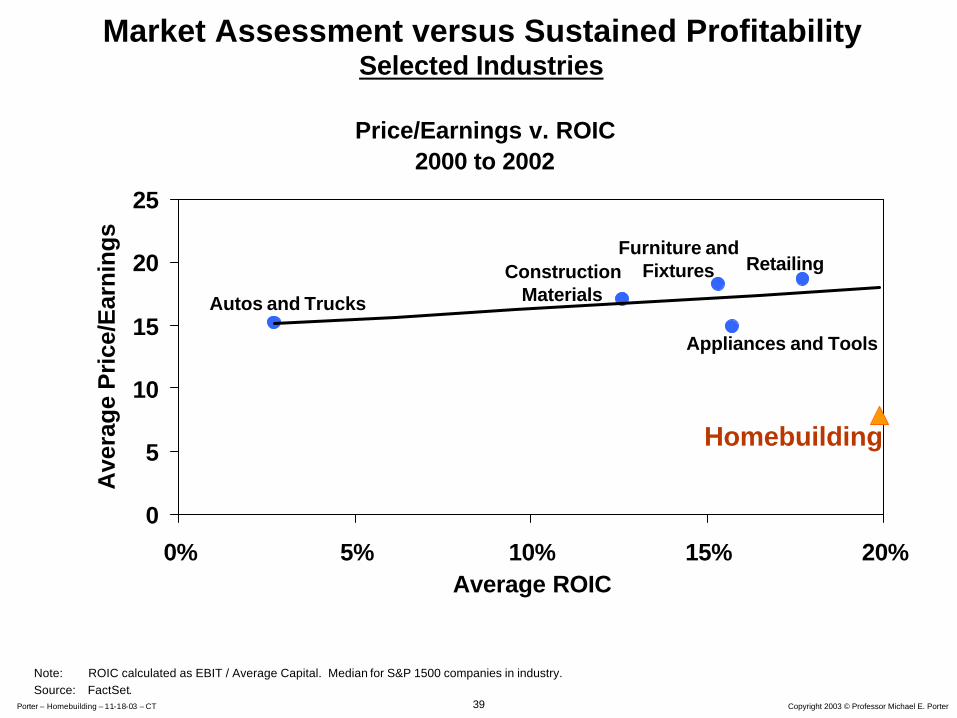
Market Assessment versus Sustained ProfitabilitySelected Industries
Price/Book v. ROIC2000 to 2002
0
1
2
3
0% 5% 10% 15% 20%Average ROIC
Ave
rag
e P
rice
/Bo
ok
Autos and Trucks
Appliances and Tools Retailing
Furniture andFixturesConstruction
MaterialsHomebuilding
Note: ROIC calculated as EBIT / Average Capital. Median for S&P 1500 companies in industry. Source: FactSet.
39 Copyright 2003 © Professor Michael E. PorterPorter – Homebuilding – 11-18-03 – CT
Price/Earnings v. ROIC2000 to 2002
0
5
10
15
20
25
0% 5% 10% 15% 20%Average ROIC
Ave
rag
e P
rice
/Ear
nin
gs
Autos and Trucks
Appliances and Tools
RetailingFurniture and
FixturesConstructionMaterials
Homebuilding
Market Assessment versus Sustained ProfitabilitySelected Industries
Note: ROIC calculated as EBIT / Average Capital. Median for S&P 1500 companies in industry. Source: FactSet.
40 Copyright 2003 © Professor Michael E. PorterPorter – Homebuilding – 11-18-03 – CT
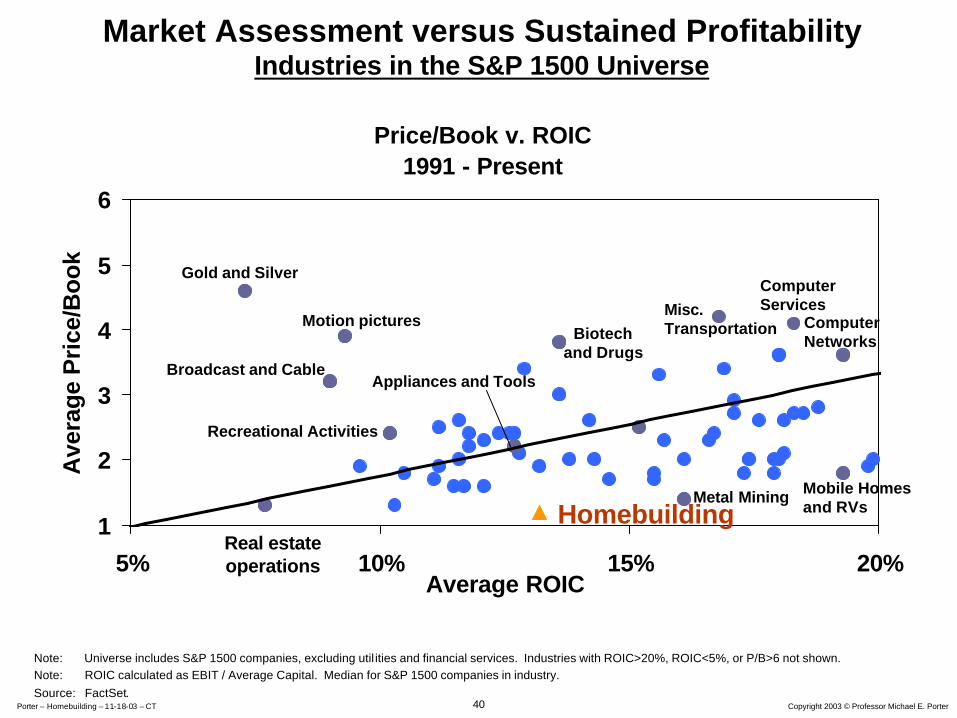
Market Assessment versus Sustained ProfitabilityIndustries in the S&P 1500 Universe
Price/Book v. ROIC1991 - Present
1
2
3
4
5
6
5% 10% 15% 20%Average ROIC
Ave
rage
Pri
ce/B
ook
HomebuildingReal estateoperations
Gold and Silver
Motion pictures
Broadcast and Cable
Recreational Activities
Biotechand Drugs
Appliances and Tools
Metal Mining
Misc. Transportation
ComputerServices
ComputerNetworks
Mobile Homes and RVs
Note: Universe includes S&P 1500 companies, excluding util ities and financial services. Industries with ROIC>20%, ROIC<5%, or P/B>6 not shown.Note: ROIC calculated as EBIT / Average Capital. Median for S&P 1500 companies in industry. Source: FactSet.
41 Copyright 2003 © Professor Michael E. PorterPorter – Homebuilding – 11-18-03 – CT
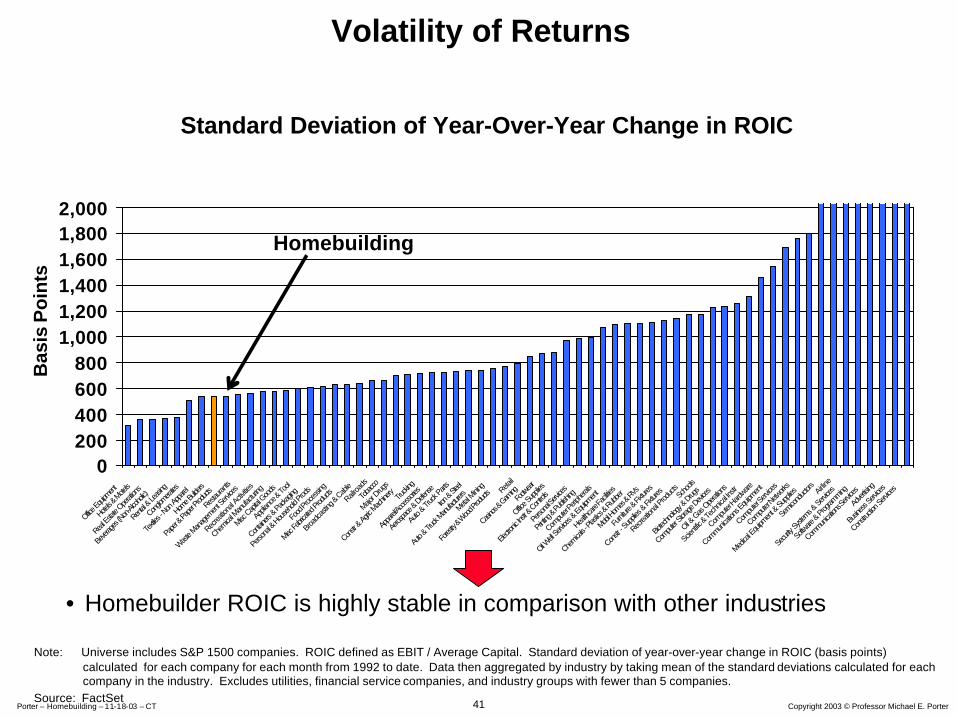
Volatility of Returns
Standard Deviation of Year-Over-Year Change in ROIC
0200400600800
1,0001,2001,4001,6001,8002,000
Office Eq
uipment
Hotels &
Mote
ls
Real E
state
Operati
ons
Bever
ages
(Non-Alc
oholic
)
Rental
& Lea
sing
Conglo
merates
Textile
s - Non
Appa
rel
Home B
uilders
Paper
& Pa
per Pr
oducts
Restau
rants
Waste M
anag
emen
t Serv
ices
Recrea
tional
Activitie
s
Chemica
l Man
ufactu
ring
Misc C
apital
Goods
Applia
nce &
Tool
Contain
ers &
Packa
ging
Perso
nal &
Househ
old Pr
ods
Food
Proc
essin
g
Misc Fa
bricate
d Prod
ucts
Broad
castin
g & Cab
le
Railroa
ds
Tobac
co
Major D
rugs
Constr
& Agric
Mach
inery
Trucki
ng
Appa
rel/Ac
cessor
ies
Aeros
pace &
Defen
se
Auto
& Truc
k Part
s
Iron &
Steel
Auto &
Truck
Manu
facture
rs
Metal M
ining
Fores
try & W
ood Pr
oducts Reta
il
Casino
s & Gam
ingFoo
twear
Office Su
pplies
Electro
nic Ins
tr & Con
trols
Perso
nal Se
rvices
Printing
& Pu
blishin
g
Compu
ter Pe
riphera
ls
Oil Well
Servic
es & E
quipm
ent
Healthc
are Fa
cilities
Chemica
ls - Pl
astics
& Rub
ber
Mobil H
omes
& RVs
Furnit
ure &
Fixtur
es
Constr
- Sup
plies &
Fixtu
res
Recrea
tional P
roduc
tsSc
hools
Biotec
hnolo
gy & D
rugs
Compu
ter Sto
rage D
evices
Oil & G
as Ope
ration
s
Scien
tific &
Tech
nical I
nstr
Compu
ter Hard
ware
Commun
ication
s Equ
ipmen
t
Compu
ter Se
rvices
Compu
ter Netw
orks
Medica
l Equ
ipmen
t & Su
pplies
Semico
nduct
ors Airline
Secur
ity Sy
stems &
Servic
es
Softw
are &
Progra
mming
Commun
ication
s Serv
ices
Adver
tising
Busin
ess Se
rvices
Constru
ction S
ervice
s
• Homebuilder ROIC is highly stable in comparison with other industries
Note: Universe includes S&P 1500 companies. ROIC defined as EBIT / Average Capital. Standard deviation of year-over-year change in ROIC (basis points) calculated for each company for each month from 1992 to date. Data then aggregated by industry by taking mean of the standard deviations calculated for each company in the industry. Excludes utilities, financial service companies, and industry groups with fewer than 5 companies.
Source: FactSet
Homebuilding
Bas
is P
oin
ts
42 Copyright 2003 © Professor Michael E. PorterPorter – Homebuilding – 11-18-03 – CT
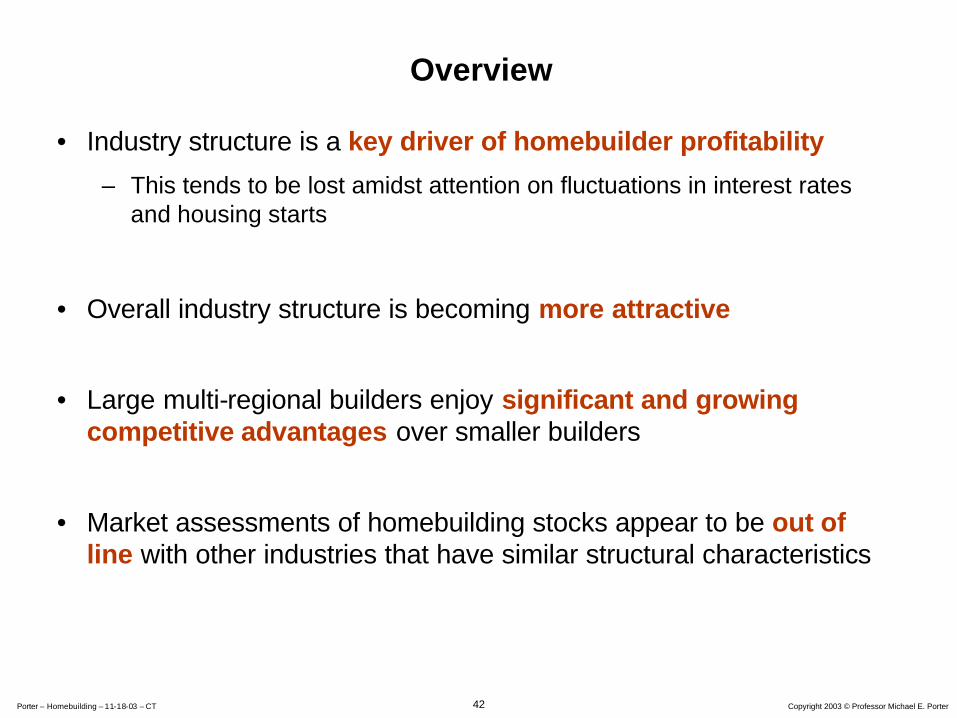
Overview
• Industry structure is a key driver of homebuilder profitability
– This tends to be lost amidst attention on fluctuations in interest rates and housing starts
• Overall industry structure is becoming more attractive
• Large multi-regional builders enjoy significant and growing competitive advantages over smaller builders
• Market assessments of homebuilding stocks appear to be out of line with other industries that have similar structural characteristics
43 Copyright 2003 © Professor Michael E. PorterPorter – Homebuilding – 11-18-03 – CT
• The Fundamentals of Industry Profitability and Competitive Advantage
• The Structure of the Homebuilding Industry
• The Competitive Advantages of the Large Homebuilders
• Market Assessments of Homebuilding versus Other Industries
• The Role of Investors in Strategy
Agenda
44 Copyright 2003 © Professor Michael E. PorterPorter – Homebuilding – 11-18-03 – CT
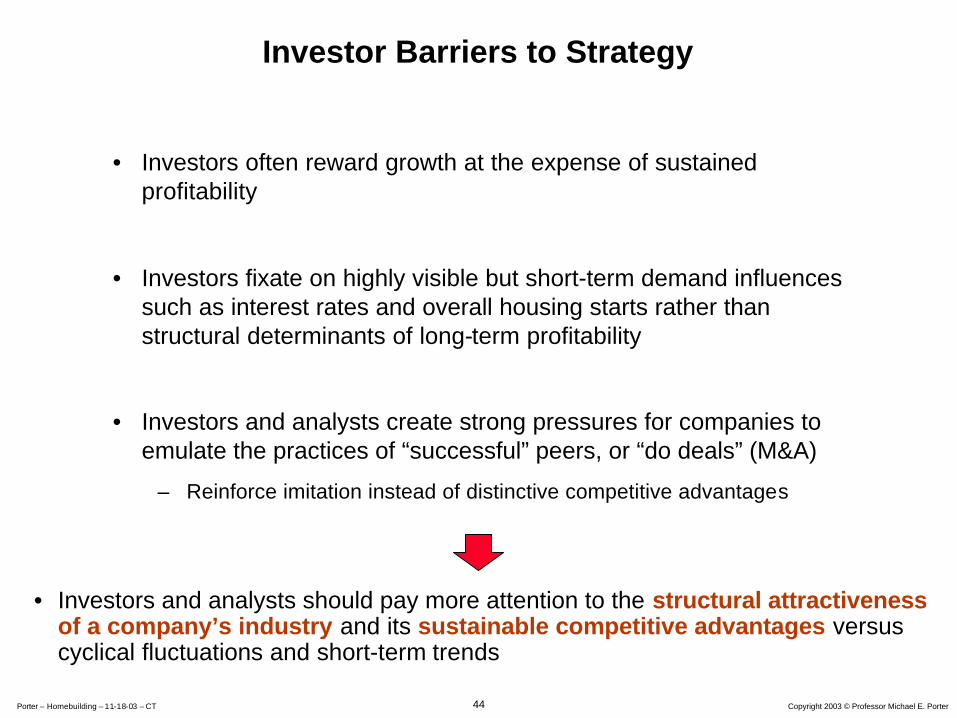
Investor Barriers to Strategy
• Investors often reward growth at the expense of sustained profitability
• Investors fixate on highly visible but short-term demand influences such as interest rates and overall housing starts rather than structural determinants of long-term profitability
• Investors and analysts create strong pressures for companies to emulate the practices of “successful” peers, or “do deals” (M&A)
– Reinforce imitation instead of distinctive competitive advantages
• Investors and analysts should pay more attention to the structural attractiveness of a company’s industry and its sustainable competitive advantages versus cyclical fluctuations and short-term trends
45 Copyright 2003 © Professor Michael E. PorterPorter – Homebuilding – 11-18-03 – CT
The U.S. Homebuilding Industry and The Competitive Position of Large Builders