Embed Size (px)
Citation preview
THE COMPETITIVE POSITION OF THEU.S. PUBLIC EQUITY MARKET
DECEMBER 2007
COMMITTEE ON CAPITAL MARKETS REGULATION
THE COMPETITIVE POSITION OF THE U.S. PUBLIC EQUITY MARKET
DECEMBER 4, 2007

Copyright © 2007. All rights reserved.
COMMITTEE ON CAPITAL MARKETS REGULATION
Peter Briger President, Fortress Investment Group
Peter C. Clapman President & CEO, Governance for Owners USA Inc.
Samuel DiPiazza Global CEO, PricewaterhouseCoopers
Scott C. Evans Executive Vice President of Asset Management, TIAA-CREF
Robert Glauber Visiting Professor, Kennedy School of Government; Former Chairman and CEO, NASD
Kenneth Griffin President & CEO, Citadel Investment Group LLC
Glenn Hubbard
Dean, Columbia Business School; Russell L. Carson Professor of Finance and Economics; Co-Chair, Committee
Cathy Kinney President & Co-COO, NYSE
Blythe Masters Head of Global Commodities, JP Morgan Investment Bank
Ira M. Millstein Partner, Weil, Gotshal & Manges
Steve Odland Chairman & CEO, Office Depot
William Parrett Former CEO, Deloitte
Jeffrey M. Peek Chairman & CEO, CIT Group Inc.
Robert Pozen Chairman, MFS Investment Management
Wilbur L. Ross Jr. Chairman & CEO, WL Ross & Co. LLC
James Rothenberg Chairman & PEO, Capital Research and Management Co.
Thomas A. Russo Vice Chairman, Chief Legal Officer, Lehman Brothers
Leonard Schaeffer Founding Chairman, WellPoint Health Network
Ted Schlein Managing Partner, Kleiner Perkins Caufield & Byers; Chairman, NVCA
Hal S. Scott
Nomura Professor and Director of the Program on International Financial Systems, Harvard Law School; Director, Committee
Paul Singer General Partner, Elliott Management Corporation
John L. Thornton Chairman, The Brookings Institution; Co-Chair, Committee
Peter Tufano
Sylvan C. Coleman Professor of Financial Management, Harvard Business School
Luigi Zingales
Robert C. McCormack Professor of Entrepreneurship and Finance, University of Chicago Graduate School of Business

COMMITTEE STAFF
Christopher Wheeler Deputy Director
Jennifer M. Grygiel Program Manager
Peter W. McClean Advisor
LEGAL ADVISORY GROUP
Leslie N. Silverman
Cleary Gottlieb Steen & Hamilton LLP
(Chairman)
John T. Bostelman Sullivan & Cromwell LLP
Adam D. Chinn Wachtell, Lipton, Rosen & Katz
Kris F. Heinzelman Cravath, Swaine & Moore LLP
Jeffrey Small Davis Polk & Wardwell
RESEARCH ASSISTANTS
Robert Allen
Oscar Hackett
Karen Piane
Charles Shioleno
Aymar Yoboué
iii

INTRODUCTION
The November 30, 2006 Interim Report of the Committee on Capital Markets Regulation found that the competitive position of the U.S. public equity market was seriously eroding. The Interim Report further found that continuation of this trend would have a significant negative impact on U.S. capital markets activity, including the formation and efficient allocation of capital. The Committee’s findings led to a wide-ranging discussion regarding the causes of the deteriorating competitiveness and how it should be measured. This Report addresses the second issue, refining and updating relevant measures of competitiveness. We also discuss measures that are not relevant and those that may be relevant if properly designed.
The Committee’s Interim Report offered a series of reforms that policymakers could implement in the near term—increasing shareholder rights and decreasing the burden of regulation and litigation—to help remedy the situation. Not nearly enough has been done. What is still lacking is commitment and political leadership.
This Report, therefore, is a second wake-up call. The Committee has published this Report on its website (www.capmktsreg.org),
and intends to update it on a quarterly basis.
v

EXECUTIVE SUMMARY
By any meaningful measure, the competitiveness of the U.S. public equity market has deteriorated significantly in recent years. We gathered data from a variety of sources—including exchanges, the World Federation of Exchanges, financial databases and market participants—for 13 separate measures of competitiveness. These measures fall into five categories: (1) equity raised in public markets; (2) the relative size of the private Rule 144A and public equity markets in the U.S.; (3) cross-listings and delistings by foreign companies; (4) trading on U.S. and non-U.S. stock exchanges; and (5) regional origin of U.S. investment banking revenue. For each measure, we went back to the mid-1990s, or, if later in time, as far back as a consistent time series would permit. Every single measure we looked at shows a significant deterioration in U.S. competitiveness, with one exception (which remained flat). Since we first called for urgent action to address the problem in 2006, most measures either have continued to decline or failed to substantially improve. We include a summary sheet tracking the measures on page 5, and briefly summarize our findings below. Equity Raised in Public Markets
• U.S. Share of Equity Raised in Global Public Markets
U.S. exchanges’ share of equity raised in global public markets, through IPOs and secondary offerings, reflects the relative attractiveness of the U.S. public market for both domestic and foreign issuers. The share of the principal U.S. exchanges has significantly dropped from 28.8% in 2002 to 19.2% in 2007 (through October). The U.S. share was 16.8% in 2006.
The trend is the same using a different data source with a longer time series. According to this second source, the U.S. share of equity raised in global public markets was 22.0% in 2007, down from its average of 33.2% in the period from 1996 to 2005. In 2006, the U.S. share was also 22.0%.
• U.S. Share of Global IPOs by Foreign Companies
The U.S. share of “Global IPOs”—IPOs done by non-U.S. companies on an exchange outside their respective countries of domicile, or privately offered in the U.S. via SEC Rule 144A—reflects the relative attractiveness of our public equity markets to foreign companies. The measure is especially telling because foreign companies—more so than U.S. companies—must choose to come to the U.S. Since 1996, the U.S. share of “Global IPOs” has dramatically dropped. In the first nine months of 2007, just 10.1% of Global IPOs were listed on a U.S. exchange, compared to 44.5% in 1996 and an average of 21.2% in the period from 1996 to 2005. Similarly, U.S. exchanges have captured just 7.7% of the total value of Global IPOs
1Committee on Capital Markets Regulation
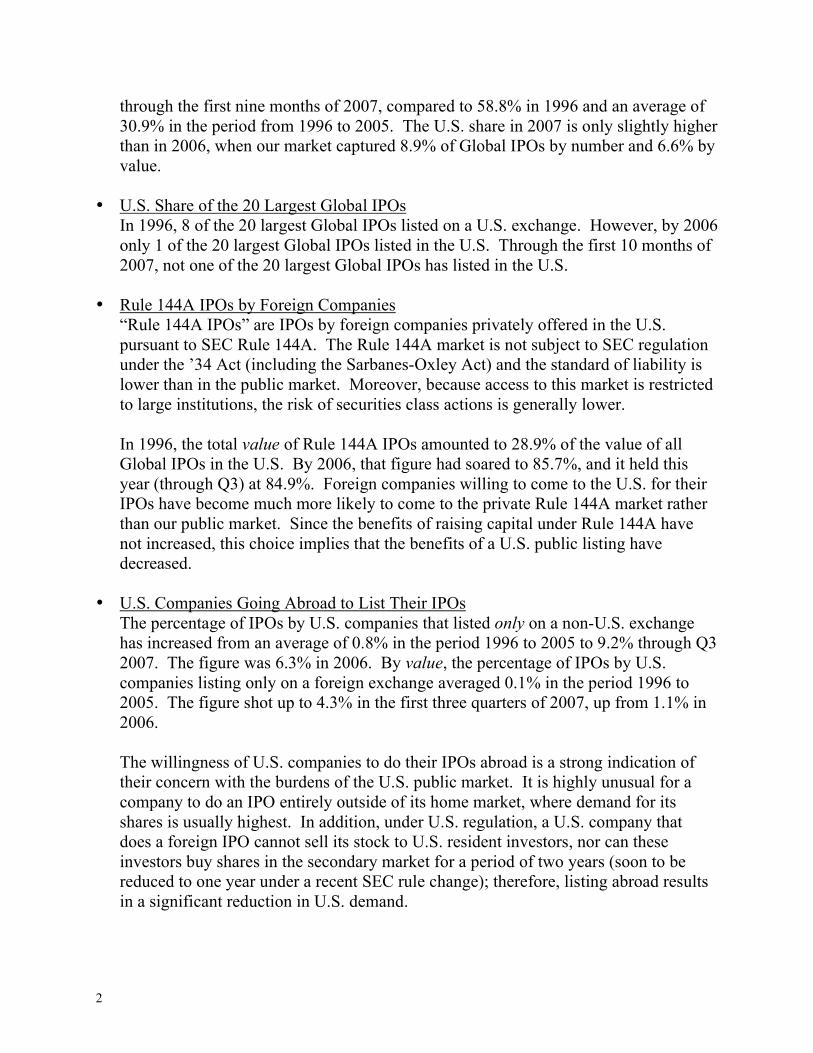
through the first nine months of 2007, compared to 58.8% in 1996 and an average of 30.9% in the period from 1996 to 2005. The U.S. share in 2007 is only slightly higher than in 2006, when our market captured 8.9% of Global IPOs by number and 6.6% by value.
• U.S. Share of the 20 Largest Global IPOs
In 1996, 8 of the 20 largest Global IPOs listed on a U.S. exchange. However, by 2006 only 1 of the 20 largest Global IPOs listed in the U.S. Through the first 10 months of 2007, not one of the 20 largest Global IPOs has listed in the U.S.
• Rule 144A IPOs by Foreign Companies “Rule 144A IPOs” are IPOs by foreign companies privately offered in the U.S. pursuant to SEC Rule 144A. The Rule 144A market is not subject to SEC regulation under the ’34 Act (including the Sarbanes-Oxley Act) and the standard of liability is lower than in the public market. Moreover, because access to this market is restricted to large institutions, the risk of securities class actions is generally lower. In 1996, the total value of Rule 144A IPOs amounted to 28.9% of the value of all Global IPOs in the U.S. By 2006, that figure had soared to 85.7%, and it held this year (through Q3) at 84.9%. Foreign companies willing to come to the U.S. for their IPOs have become much more likely to come to the private Rule 144A market rather than our public market. Since the benefits of raising capital under Rule 144A have not increased, this choice implies that the benefits of a U.S. public listing have decreased.
• U.S. Companies Going Abroad to List Their IPOs The percentage of IPOs by U.S. companies that listed only on a non-U.S. exchange has increased from an average of 0.8% in the period 1996 to 2005 to 9.2% through Q3 2007. The figure was 6.3% in 2006. By value, the percentage of IPOs by U.S. companies listing only on a foreign exchange averaged 0.1% in the period 1996 to 2005. The figure shot up to 4.3% in the first three quarters of 2007, up from 1.1% in 2006. The willingness of U.S. companies to do their IPOs abroad is a strong indication of their concern with the burdens of the U.S. public market. It is highly unusual for a company to do an IPO entirely outside of its home market, where demand for its shares is usually highest. In addition, under U.S. regulation, a U.S. company that does a foreign IPO cannot sell its stock to U.S. resident investors, nor can these investors buy shares in the secondary market for a period of two years (soon to be reduced to one year under a recent SEC rule change); therefore, listing abroad results in a significant reduction in U.S. demand.
2
Relative Size of the Private Rule 144A and Public Equity Markets in the U.S.
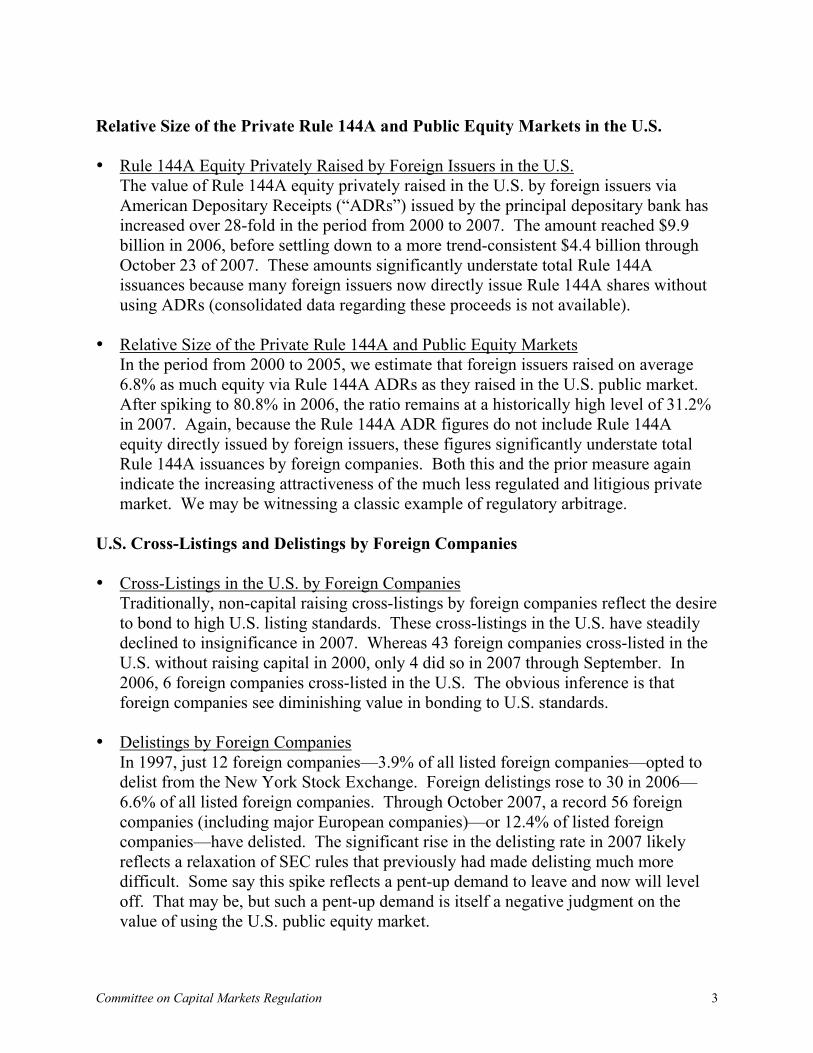
• Rule 144A Equity Privately Raised by Foreign Issuers in the U.S.
The value of Rule 144A equity privately raised in the U.S. by foreign issuers via American Depositary Receipts (“ADRs”) issued by the principal depositary bank has increased over 28-fold in the period from 2000 to 2007. The amount reached $9.9 billion in 2006, before settling down to a more trend-consistent $4.4 billion through October 23 of 2007. These amounts significantly understate total Rule 144A issuances because many foreign issuers now directly issue Rule 144A shares without using ADRs (consolidated data regarding these proceeds is not available).
• Relative Size of the Private Rule 144A and Public Equity Markets
In the period from 2000 to 2005, we estimate that foreign issuers raised on average 6.8% as much equity via Rule 144A ADRs as they raised in the U.S. public market. After spiking to 80.8% in 2006, the ratio remains at a historically high level of 31.2% in 2007. Again, because the Rule 144A ADR figures do not include Rule 144A equity directly issued by foreign issuers, these figures significantly understate total Rule 144A issuances by foreign companies. Both this and the prior measure again indicate the increasing attractiveness of the much less regulated and litigious private market. We may be witnessing a classic example of regulatory arbitrage.
U.S. Cross-Listings and Delistings by Foreign Companies
• Cross-Listings in the U.S. by Foreign Companies
Traditionally, non-capital raising cross-listings by foreign companies reflect the desire to bond to high U.S. listing standards. These cross-listings in the U.S. have steadily declined to insignificance in 2007. Whereas 43 foreign companies cross-listed in the U.S. without raising capital in 2000, only 4 did so in 2007 through September. In 2006, 6 foreign companies cross-listed in the U.S. The obvious inference is that foreign companies see diminishing value in bonding to U.S. standards.
• Delistings by Foreign Companies
In 1997, just 12 foreign companies—3.9% of all listed foreign companies—opted to delist from the New York Stock Exchange. Foreign delistings rose to 30 in 2006—6.6% of all listed foreign companies. Through October 2007, a record 56 foreign companies (including major European companies)—or 12.4% of listed foreign companies—have delisted. The significant rise in the delisting rate in 2007 likely reflects a relaxation of SEC rules that previously had made delisting much more difficult. Some say this spike reflects a pent-up demand to leave and now will level off. That may be, but such a pent-up demand is itself a negative judgment on the value of using the U.S. public equity market.
3Committee on Capital Markets Regulation
Trading on U.S. and Non-U.S. Exchanges
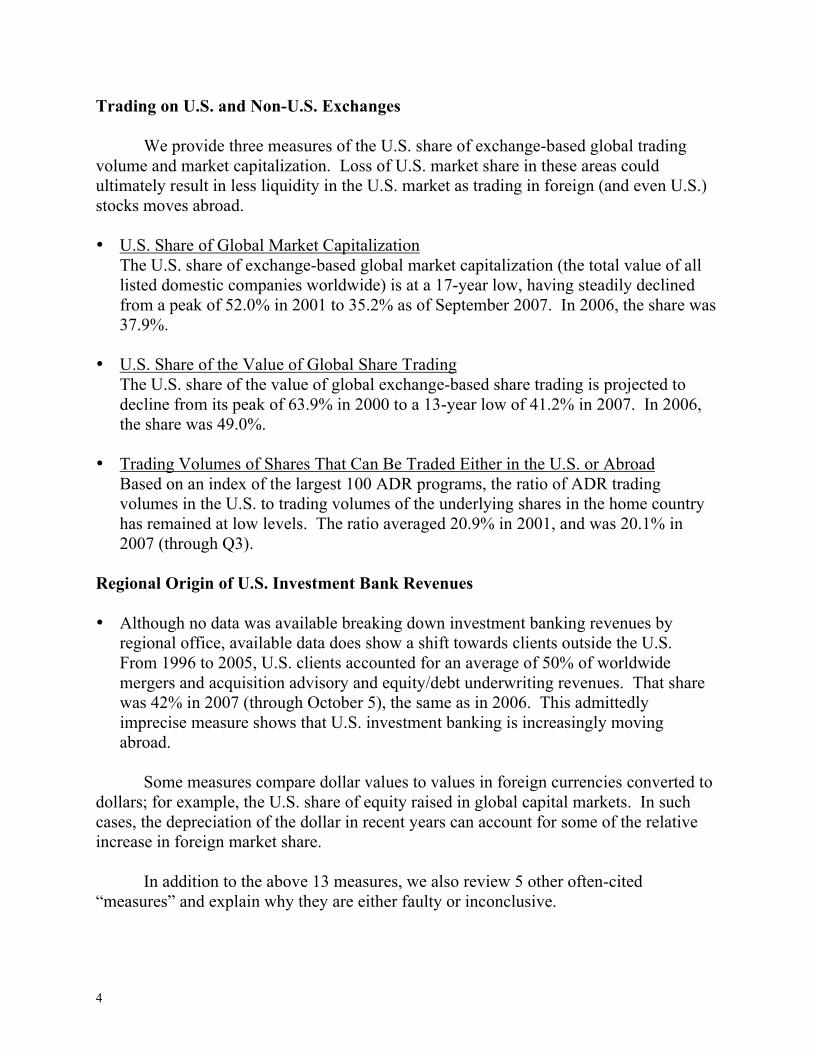
We provide three measures of the U.S. share of exchange-based global trading volume and market capitalization. Loss of U.S. market share in these areas could ultimately result in less liquidity in the U.S. market as trading in foreign (and even U.S.) stocks moves abroad. • U.S. Share of Global Market Capitalization
The U.S. share of exchange-based global market capitalization (the total value of all listed domestic companies worldwide) is at a 17-year low, having steadily declined from a peak of 52.0% in 2001 to 35.2% as of September 2007. In 2006, the share was 37.9%.
• U.S. Share of the Value of Global Share Trading The U.S. share of the value of global exchange-based share trading is projected to decline from its peak of 63.9% in 2000 to a 13-year low of 41.2% in 2007. In 2006, the share was 49.0%.
• Trading Volumes of Shares That Can Be Traded Either in the U.S. or Abroad
Based on an index of the largest 100 ADR programs, the ratio of ADR trading volumes in the U.S. to trading volumes of the underlying shares in the home country has remained at low levels. The ratio averaged 20.9% in 2001, and was 20.1% in 2007 (through Q3).
Regional Origin of U.S. Investment Bank Revenues
• Although no data was available breaking down investment banking revenues by
regional office, available data does show a shift towards clients outside the U.S. From 1996 to 2005, U.S. clients accounted for an average of 50% of worldwide mergers and acquisition advisory and equity/debt underwriting revenues. That share was 42% in 2007 (through October 5), the same as in 2006. This admittedly imprecise measure shows that U.S. investment banking is increasingly moving abroad.
Some measures compare dollar values to values in foreign currencies converted to dollars; for example, the U.S. share of equity raised in global capital markets. In such cases, the depreciation of the dollar in recent years can account for some of the relative increase in foreign market share.
In addition to the above 13 measures, we also review 5 other often-cited “measures” and explain why they are either faulty or inconclusive.
4
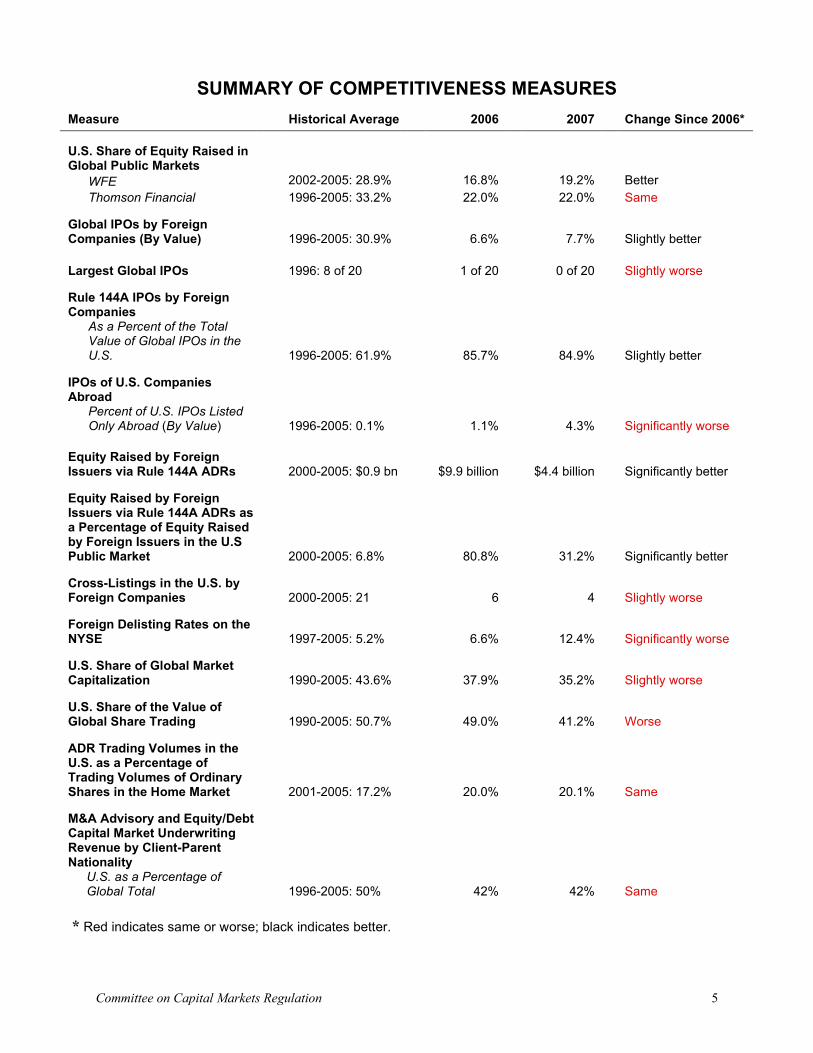
* Red indicates same or worse; black indicates better.
SUMMARY OF COMPETITIVENESS MEASURES
Measure Historical Average 2006 2007 Change Since 2006*
U.S. Share of Equity Raised in Global Public Markets
WFE 2002-2005: 28.9% 16.8% 19.2% Better
Thomson Financial 1996-2005: 33.2% 22.0% 22.0% Same
Global IPOs by Foreign Companies (By Value) 1996-2005: 30.9% 6.6% 7.7% Slightly better
Largest Global IPOs 1996: 8 of 20 1 of 20 0 of 20 Slightly worse
Rule 144A IPOs by Foreign Companies
As a Percent of the Total Value of Global IPOs in the U.S. 1996-2005: 61.9% 85.7% 84.9% Slightly better
IPOs of U.S. Companies Abroad
Percent of U.S. IPOs Listed Only Abroad (By Value) 1996-2005: 0.1% 1.1% 4.3% Significantly worse
Equity Raised by Foreign Issuers via Rule 144A ADRs 2000-2005: $0.9 bn $9.9 billion $4.4 billion Significantly better
Equity Raised by Foreign Issuers via Rule 144A ADRs as a Percentage of Equity Raised by Foreign Issuers in the U.S Public Market 2000-2005: 6.8% 80.8% 31.2% Significantly better
Cross-Listings in the U.S. by Foreign Companies 2000-2005: 21 6 4 Slightly worse
Foreign Delisting Rates on the NYSE 1997-2005: 5.2% 6.6% 12.4% Significantly worse
U.S. Share of Global Market Capitalization 1990-2005: 43.6% 37.9% 35.2% Slightly worse
U.S. Share of the Value of Global Share Trading 1990-2005: 50.7% 49.0% 41.2% Worse
ADR Trading Volumes in the U.S. as a Percentage of Trading Volumes of Ordinary Shares in the Home Market 2001-2005: 17.2% 20.0% 20.1% Same
M&A Advisory and Equity/Debt Capital Market Underwriting Revenue by Client-Parent Nationality
U.S. as a Percentage of Global Total 1996-2005: 50% 42% 42% Same
5Committee on Capital Markets Regulation
GOOD COMPETITIVE MEASURES
I. Equity Raised in Public Markets
A. The U.S. Share of Equity Raised in Public Markets
U.S. exchanges’ share of equity raised in global public markets, through IPOs and secondary offerings, is a useful measure of competitiveness. It reflects the relative attractiveness of the U.S. public market for both domestic and foreign issuers. The U.S. is losing market share.
1. World Federation of Exchanges
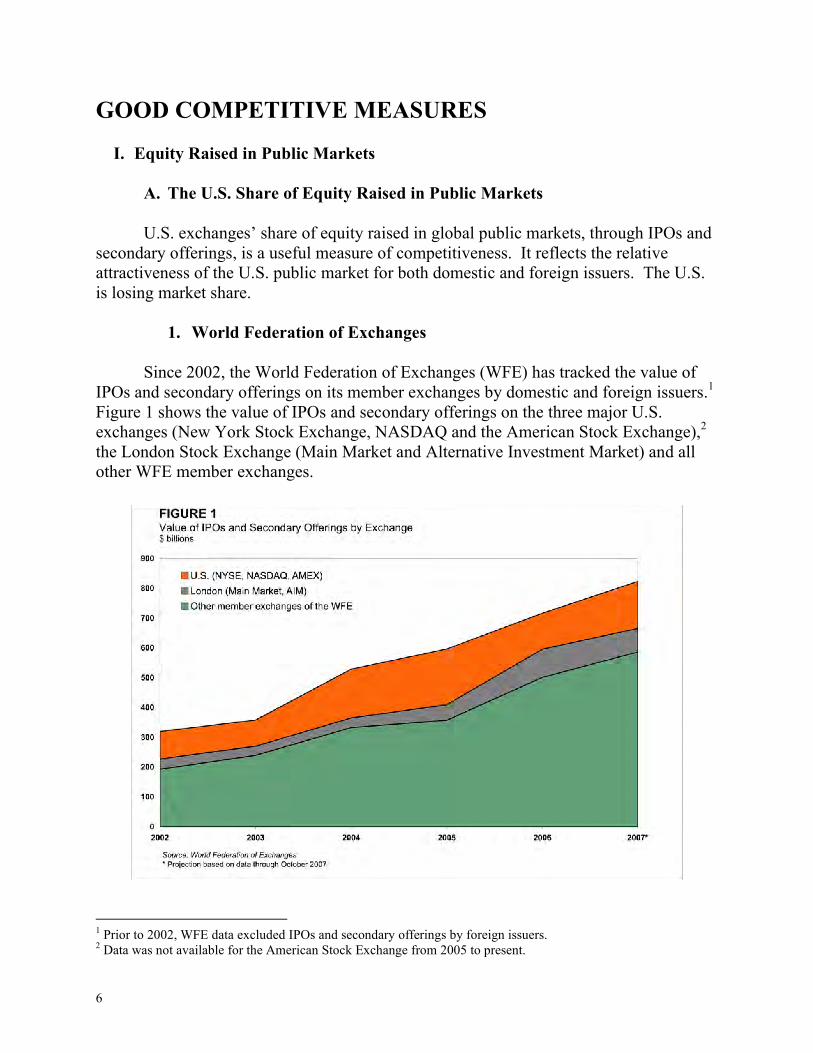
Since 2002, the World Federation of Exchanges (WFE) has tracked the value of
IPOs and secondary offerings on its member exchanges by domestic and foreign issuers.1 Figure 1 shows the value of IPOs and secondary offerings on the three major U.S. exchanges (New York Stock Exchange, NASDAQ and the American Stock Exchange),2 the London Stock Exchange (Main Market and Alternative Investment Market) and all other WFE member exchanges.
1 Prior to 2002, WFE data excluded IPOs and secondary offerings by foreign issuers. 2 Data was not available for the American Stock Exchange from 2005 to present.
6
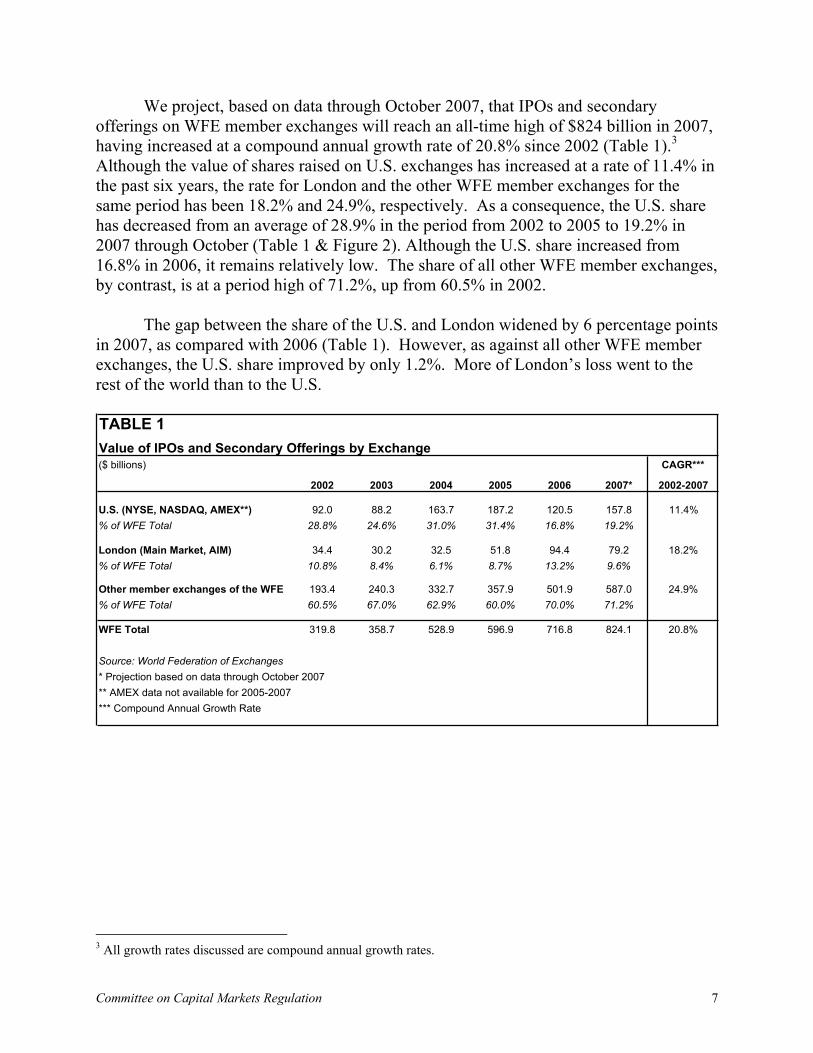
We project, based on data through October 2007, that IPOs and secondary offerings on WFE member exchanges will reach an all-time high of $824 billion in 2007, having increased at a compound annual growth rate of 20.8% since 2002 (Table 1).3 Although the value of shares raised on U.S. exchanges has increased at a rate of 11.4% in the past six years, the rate for London and the other WFE member exchanges for the same period has been 18.2% and 24.9%, respectively. As a consequence, the U.S. share has decreased from an average of 28.9% in the period from 2002 to 2005 to 19.2% in 2007 through October (Table 1 & Figure 2). Although the U.S. share increased from 16.8% in 2006, it remains relatively low. The share of all other WFE member exchanges, by contrast, is at a period high of 71.2%, up from 60.5% in 2002.
The gap between the share of the U.S. and London widened by 6 percentage points
in 2007, as compared with 2006 (Table 1). However, as against all other WFE member exchanges, the U.S. share improved by only 1.2%. More of London’s loss went to the rest of the world than to the U.S.
TABLE 1
Value of IPOs and Secondary Offerings by Exchange
($ billions) CAGR***
2002 2003 2004 2005 2006 2007* 2002-2007
U.S. (NYSE, NASDAQ, AMEX**) 92.0 88.2 163.7 187.2 120.5 157.8 11.4%
% of WFE Total 28.8% 24.6% 31.0% 31.4% 16.8% 19.2%
London (Main Market, AIM) 34.4 30.2 32.5 51.8 94.4 79.2 18.2%
% of WFE Total 10.8% 8.4% 6.1% 8.7% 13.2% 9.6%
Other member exchanges of the WFE 193.4 240.3 332.7 357.9 501.9 587.0 24.9%
% of WFE Total 60.5% 67.0% 62.9% 60.0% 70.0% 71.2%
WFE Total 319.8 358.7 528.9 596.9 716.8 824.1 20.8%
Source: World Federation of Exchanges
* Projection based on data through October 2007
** AMEX data not available for 2005-2007
*** Compound Annual Growth Rate
3 All growth rates discussed are compound annual growth rates.
7Committee on Capital Markets Regulation
2. Thomson Financial
The only financial data company that attempts to allocate equity issuances of domestic and foreign issuers on a regional basis over a period of time extending beyond 2002 is Thomson, which does so in its SDC Platinum database.4 Thomson relies largely on the offering prospectus for its allocations. Thomson allocates issuances by domestic and foreign issuers in the U.S. to its U.S. database; issuances by a foreign company in its home market to the company’s regional or country database; and issuances by a foreign company outside its home market to a catch-all “International” database. The “International” database also includes issuances where the prospectus is ambiguous as to the target region, as well as some equity privately raised in the U.S. pursuant to SEC Rule 144A and relatively rare (but increasingly common) issuances by U.S. companies abroad.
4 Dealogic, within a given transaction, is not designed to allocate capital raising by region. For example, if a company actually raised $1 billion through an IPO in London but cross-listed on the NYSE (without actually raising any money in New York), exclusively relying on Dealogic would require allocating the full $1 billion to both London and New York. Therefore, Dealogic cannot be used to compare the aggregate value of IPOs on different exchanges.
8
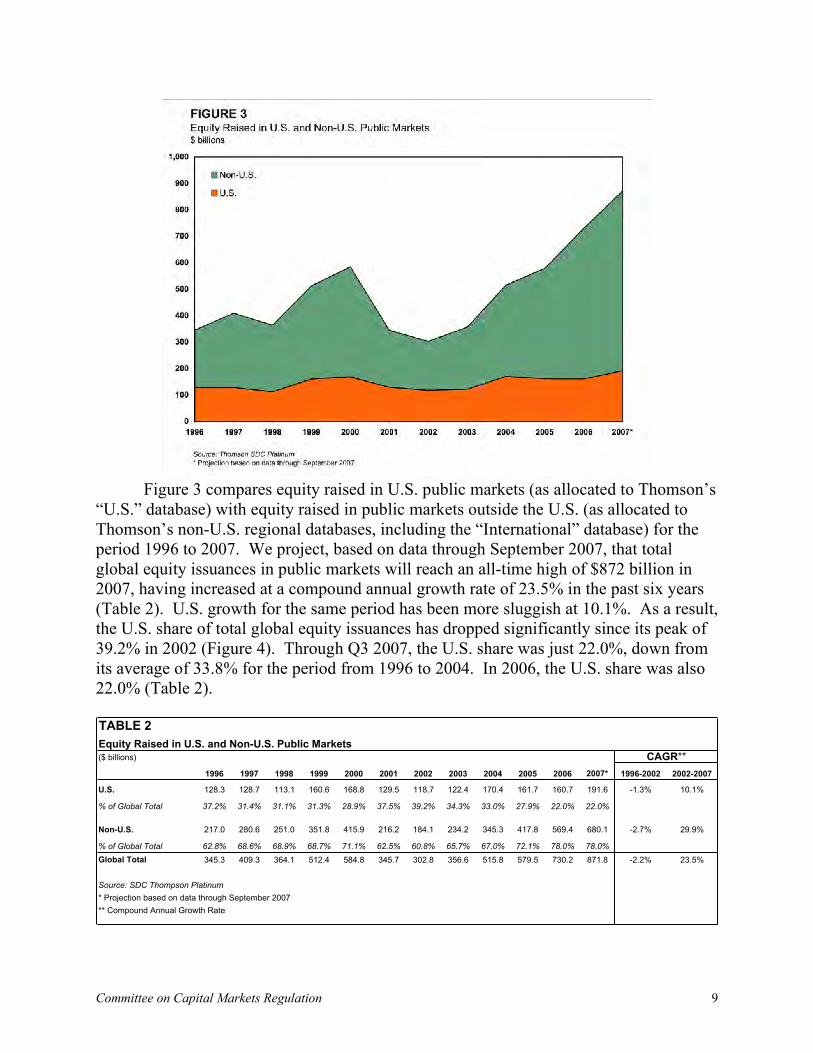
Figure 3 compares equity raised in U.S. public markets (as allocated to Thomson’s
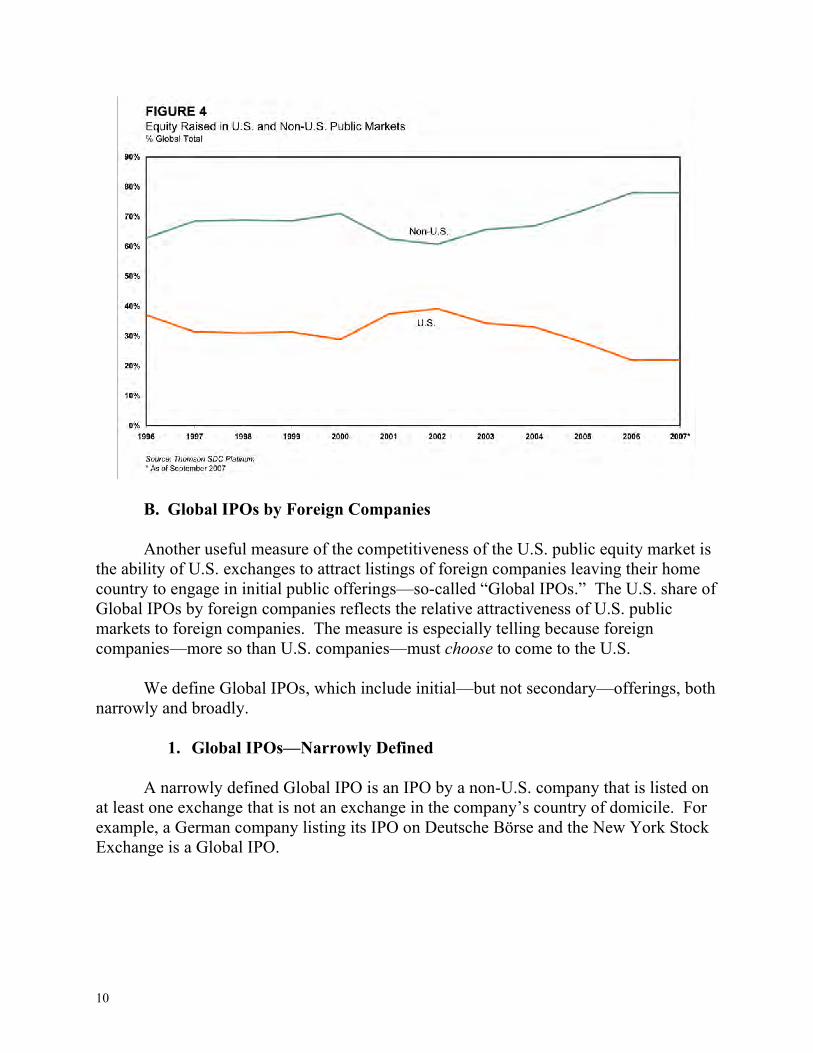
“U.S.” database) with equity raised in public markets outside the U.S. (as allocated to Thomson’s non-U.S. regional databases, including the “International” database) for the period 1996 to 2007. We project, based on data through September 2007, that total global equity issuances in public markets will reach an all-time high of $872 billion in 2007, having increased at a compound annual growth rate of 23.5% in the past six years (Table 2). U.S. growth for the same period has been more sluggish at 10.1%. As a result, the U.S. share of total global equity issuances has dropped significantly since its peak of 39.2% in 2002 (Figure 4). Through Q3 2007, the U.S. share was just 22.0%, down from its average of 33.8% for the period from 1996 to 2004. In 2006, the U.S. share was also 22.0% (Table 2).
TABLE 2
Equity Raised in U.S. and Non-U.S. Public Markets
($ billions) CAGR**
1996 1997 1998 1999 2000 2001 2002 2003 2004 2005 2006 2007* 1996-2002 2002-2007
128.3 128.7 113.1 160.6 168.8 129.5 118.7 122.4 170.4 161.7 160.7 191.6 -1.3% 10.1%
37.2% 31.4% 31.1% 31.3% 28.9% 37.5% 39.2% 34.3% 33.0% 27.9% 22.0% 22.0%
217.0 280.6 251.0 351.8 415.9 216.2 184.1 234.2 345.3 417.8 569.4 680.1 -2.7% 29.9%
62.8% 68.6% 68.9% 68.7% 71.1% 62.5% 60.8% 65.7% 67.0% 72.1% 78.0% 78.0%
345.3 409.3 364.1 512.4 584.8 345.7 302.8 356.6 515.8 579.5 730.2 871.8 -2.2% 23.5%
Source: SDC Thompson Platinum
* Projection based on data through September 2007
** Compound Annual Growth Rate
Global Total
U.S.
% of Global Total
Non-U.S.
% of Global Total
9Committee on Capital Markets Regulation
B. Global IPOs by Foreign Companies
Another useful measure of the competitiveness of the U.S. public equity market is
the ability of U.S. exchanges to attract listings of foreign companies leaving their home country to engage in initial public offerings—so-called “Global IPOs.” The U.S. share of Global IPOs by foreign companies reflects the relative attractiveness of U.S. public markets to foreign companies. The measure is especially telling because foreign companies—more so than U.S. companies—must choose to come to the U.S.
We define Global IPOs, which include initial—but not secondary—offerings, both
narrowly and broadly.
1. Global IPOs—Narrowly Defined
A narrowly defined Global IPO is an IPO by a non-U.S. company that is listed on
at least one exchange that is not an exchange in the company’s country of domicile. For example, a German company listing its IPO on Deutsche Börse and the New York Stock Exchange is a Global IPO.
10
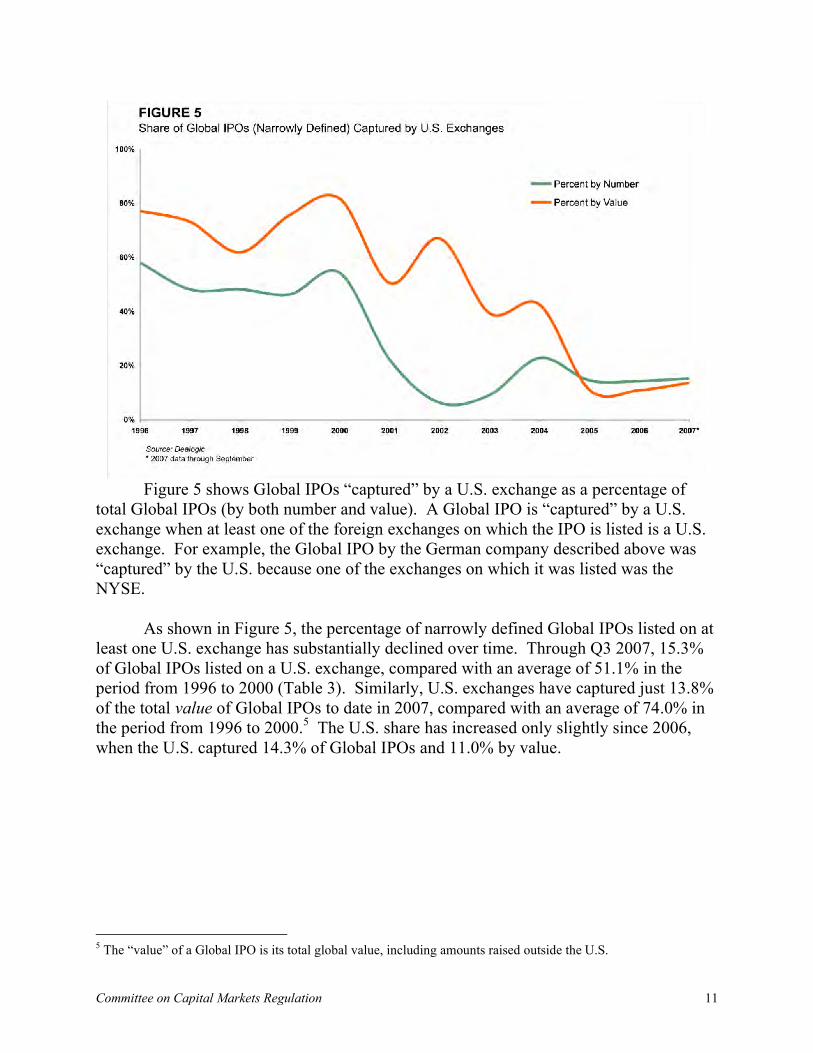
Figure 5 shows Global IPOs “captured” by a U.S. exchange as a percentage of
total Global IPOs (by both number and value). A Global IPO is “captured” by a U.S. exchange when at least one of the foreign exchanges on which the IPO is listed is a U.S. exchange. For example, the Global IPO by the German company described above was “captured” by the U.S. because one of the exchanges on which it was listed was the NYSE.
As shown in Figure 5, the percentage of narrowly defined Global IPOs listed on at least one U.S. exchange has substantially declined over time. Through Q3 2007, 15.3% of Global IPOs listed on a U.S. exchange, compared with an average of 51.1% in the period from 1996 to 2000 (Table 3). Similarly, U.S. exchanges have captured just 13.8% of the total value of Global IPOs to date in 2007, compared with an average of 74.0% in the period from 1996 to 2000.5 The U.S. share has increased only slightly since 2006, when the U.S. captured 14.3% of Global IPOs and 11.0% by value.
5 The “value” of a Global IPO is its total global value, including amounts raised outside the U.S.
11Committee on Capital Markets Regulation
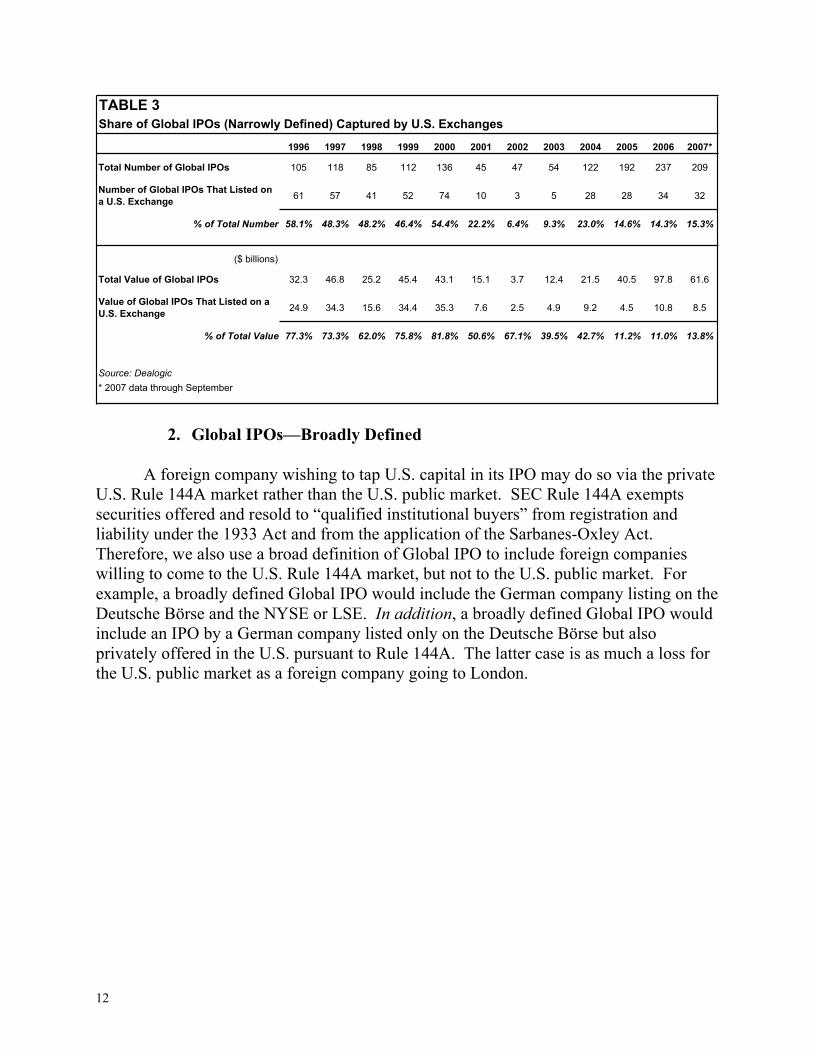
TABLE 3
Share of Global IPOs (Narrowly Defined) Captured by U.S. Exchanges
1996 1997 1998 1999 2000 2001 2002 2003 2004 2005 2006 2007*
Total Number of Global IPOs 105 118 85 112 136 45 47 54 122 192 237 209
Number of Global IPOs That Listed on
a U.S. Exchange61 57 41 52 74 10 3 5 28 28 34 32
% of Total Number 58.1% 48.3% 48.2% 46.4% 54.4% 22.2% 6.4% 9.3% 23.0% 14.6% 14.3% 15.3%
($ billions)
Total Value of Global IPOs 32.3 46.8 25.2 45.4 43.1 15.1 3.7 12.4 21.5 40.5 97.8 61.6
Value of Global IPOs That Listed on a
U.S. Exchange24.9 34.3 15.6 34.4 35.3 7.6 2.5 4.9 9.2 4.5 10.8 8.5
% of Total Value 77.3% 73.3% 62.0% 75.8% 81.8% 50.6% 67.1% 39.5% 42.7% 11.2% 11.0% 13.8%
Source: Dealogic
* 2007 data through September
2. Global IPOs—Broadly Defined
A foreign company wishing to tap U.S. capital in its IPO may do so via the private
U.S. Rule 144A market rather than the U.S. public market. SEC Rule 144A exempts securities offered and resold to “qualified institutional buyers” from registration and liability under the 1933 Act and from the application of the Sarbanes-Oxley Act. Therefore, we also use a broad definition of Global IPO to include foreign companies willing to come to the U.S. Rule 144A market, but not to the U.S. public market. For example, a broadly defined Global IPO would include the German company listing on the Deutsche Börse and the NYSE or LSE. In addition, a broadly defined Global IPO would include an IPO by a German company listed only on the Deutsche Börse but also privately offered in the U.S. pursuant to Rule 144A. The latter case is as much a loss for the U.S. public market as a foreign company going to London.
12

Figure 6 shows Global IPOs—broadly defined—“captured” by a U.S. exchange as a percentage of total Global IPOs. As with the narrow definition, a Global IPO is “captured” by a U.S. exchange when at least one of the exchanges on which the foreign company lists its IPO is a U.S. exchange. Because a Rule 144A offering is not listed on a U.S. exchange, it is not “captured” by a U.S. exchange. Therefore the number and value of Global IPOs captured by a U.S. exchange is the same for the broad definition as it is for the narrow definition. The total number and value of Global IPOs, however, is larger.
As shown in Figure 6, the percentage of broadly defined Global IPOs listed on at least one U.S. exchange has declined dramatically since 1996. Through Q3 2007, just 10.1% of Global IPOs listed on a U.S. exchange, compared to an average of 33.3% in the period from 1996 to 2000 (Table 4). Similarly, U.S. exchanges have captured just 7.7% of the total value of Global IPOs to date in 2007, compared with an average of 46.3% in the period from 1996 to 2000. The U.S. share has increased only slightly since 2006, when the U.S. captured 8.9% of Global IPOs by number and 6.6% by value.
13Committee on Capital Markets Regulation
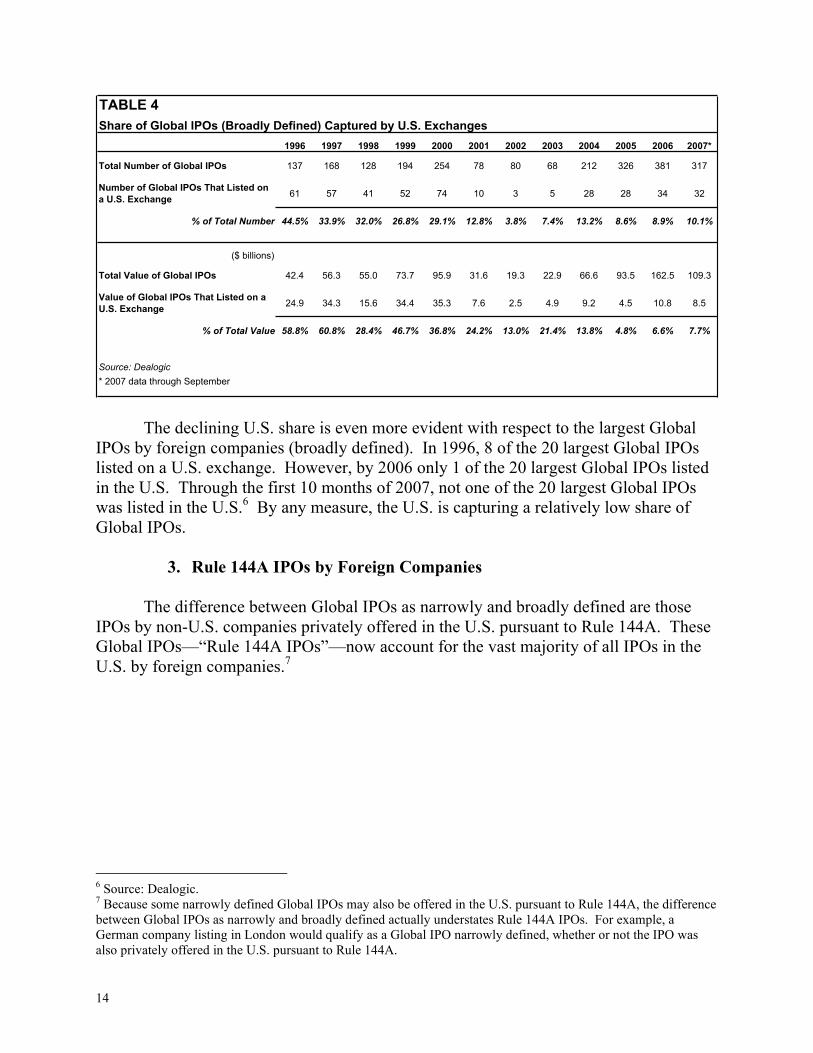
TABLE 4
Share of Global IPOs (Broadly Defined) Captured by U.S. Exchanges
1996 1997 1998 1999 2000 2001 2002 2003 2004 2005 2006 2007*
Total Number of Global IPOs 137 168 128 194 254 78 80 68 212 326 381 317
Number of Global IPOs That Listed on
a U.S. Exchange61 57 41 52 74 10 3 5 28 28 34 32
% of Total Number 44.5% 33.9% 32.0% 26.8% 29.1% 12.8% 3.8% 7.4% 13.2% 8.6% 8.9% 10.1%
($ billions)
Total Value of Global IPOs 42.4 56.3 55.0 73.7 95.9 31.6 19.3 22.9 66.6 93.5 162.5 109.3
Value of Global IPOs That Listed on a
U.S. Exchange24.9 34.3 15.6 34.4 35.3 7.6 2.5 4.9 9.2 4.5 10.8 8.5
% of Total Value 58.8% 60.8% 28.4% 46.7% 36.8% 24.2% 13.0% 21.4% 13.8% 4.8% 6.6% 7.7%
Source: Dealogic
* 2007 data through September
The declining U.S. share is even more evident with respect to the largest Global IPOs by foreign companies (broadly defined). In 1996, 8 of the 20 largest Global IPOs listed on a U.S. exchange. However, by 2006 only 1 of the 20 largest Global IPOs listed in the U.S. Through the first 10 months of 2007, not one of the 20 largest Global IPOs was listed in the U.S.6 By any measure, the U.S. is capturing a relatively low share of Global IPOs.
3. Rule 144A IPOs by Foreign Companies
The difference between Global IPOs as narrowly and broadly defined are those
IPOs by non-U.S. companies privately offered in the U.S. pursuant to Rule 144A. These Global IPOs—“Rule 144A IPOs”—now account for the vast majority of all IPOs in the U.S. by foreign companies.7
6 Source: Dealogic. 7 Because some narrowly defined Global IPOs may also be offered in the U.S. pursuant to Rule 144A, the difference between Global IPOs as narrowly and broadly defined actually understates Rule 144A IPOs. For example, a German company listing in London would qualify as a Global IPO narrowly defined, whether or not the IPO was also privately offered in the U.S. pursuant to Rule 144A.
14
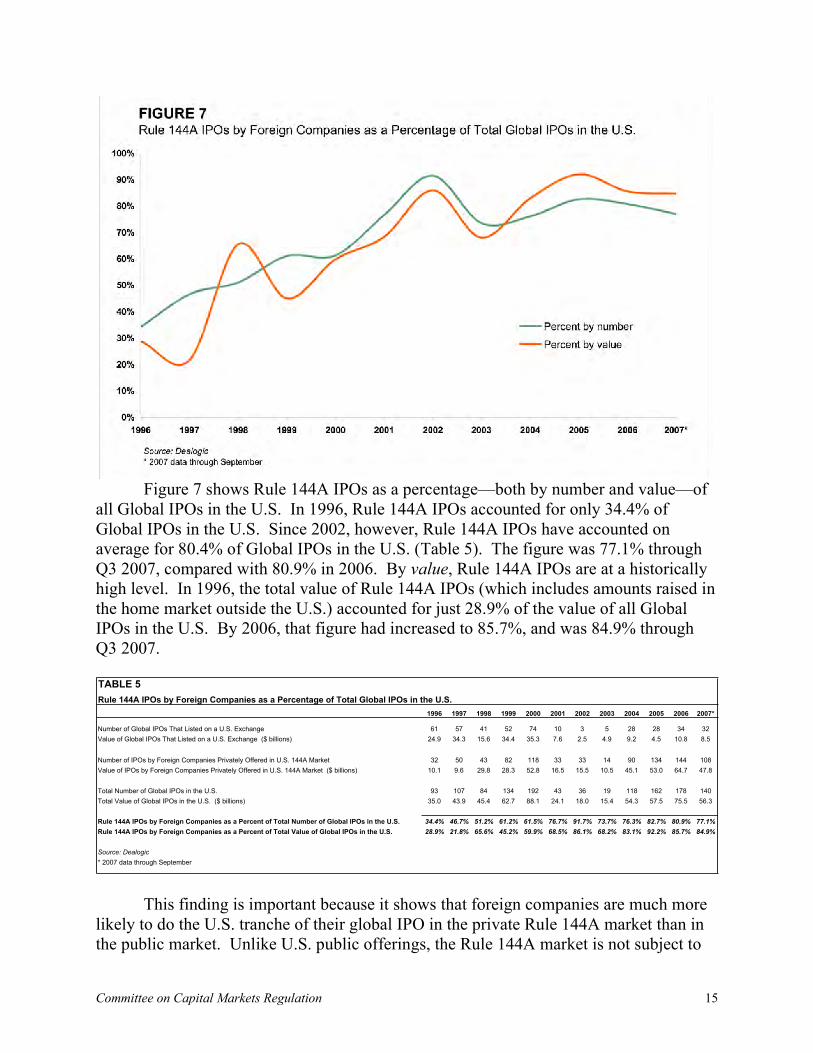
Figure 7 shows Rule 144A IPOs as a percentage—both by number and value—of
all Global IPOs in the U.S. In 1996, Rule 144A IPOs accounted for only 34.4% of Global IPOs in the U.S. Since 2002, however, Rule 144A IPOs have accounted on average for 80.4% of Global IPOs in the U.S. (Table 5). The figure was 77.1% through Q3 2007, compared with 80.9% in 2006. By value, Rule 144A IPOs are at a historically high level. In 1996, the total value of Rule 144A IPOs (which includes amounts raised in the home market outside the U.S.) accounted for just 28.9% of the value of all Global IPOs in the U.S. By 2006, that figure had increased to 85.7%, and was 84.9% through Q3 2007.
TABLE 5
Rule 144A IPOs by Foreign Companies as a Percentage of Total Global IPOs in the U.S.
1996 1997 1998 1999 2000 2001 2002 2003 2004 2005 2006 2007*
Number of Global IPOs That Listed on a U.S. Exchange 61 57 41 52 74 10 3 5 28 28 34 32
Value of Global IPOs That Listed on a U.S. Exchange ($ billions) 24.9 34.3 15.6 34.4 35.3 7.6 2.5 4.9 9.2 4.5 10.8 8.5
Number of IPOs by Foreign Companies Privately Offered in U.S. 144A Market 32 50 43 82 118 33 33 14 90 134 144 108
Value of IPOs by Foreign Companies Privately Offered in U.S. 144A Market ($ billions) 10.1 9.6 29.8 28.3 52.8 16.5 15.5 10.5 45.1 53.0 64.7 47.8
Total Number of Global IPOs in the U.S. 93 107 84 134 192 43 36 19 118 162 178 140
Total Value of Global IPOs in the U.S. ($ billions) 35.0 43.9 45.4 62.7 88.1 24.1 18.0 15.4 54.3 57.5 75.5 56.3
Rule 144A IPOs by Foreign Companies as a Percent of Total Number of Global IPOs in the U.S. 34.4% 46.7% 51.2% 61.2% 61.5% 76.7% 91.7% 73.7% 76.3% 82.7% 80.9% 77.1%
Rule 144A IPOs by Foreign Companies as a Percent of Total Value of Global IPOs in the U.S. 28.9% 21.8% 65.6% 45.2% 59.9% 68.5% 86.1% 68.2% 83.1% 92.2% 85.7% 84.9%
Source: Dealogic
* 2007 data through September
This finding is important because it shows that foreign companies are much more likely to do the U.S. tranche of their global IPO in the private Rule 144A market than in the public market. Unlike U.S. public offerings, the Rule 144A market is not subject to
15Committee on Capital Markets Regulation
SEC regulation under the ’34 Act (including Sarbanes-Oxley) and avoids exposure to securities class actions based on strict liability. Further, because access to this market is limited to large institutions, the risk of securities class actions is generally lower.
C. U.S. Companies Going Abroad to List Their IPOs
U.S. companies have recently begun to do their own IPOs abroad. This is
remarkable for two reasons. First, it is relatively rare for any company, particularly one from a developed market, to do its IPO only abroad. Second, the SEC’s Regulation S prevents U.S. resident investors (which mainly affects retail investors who have no presence abroad) from participating in the primary offering or from trading the shares for two years.8 Thus, the movement of U.S. IPOs abroad is an important indicator of the unattractiveness of the U.S. market. Some have argued that these IPOs have mainly been on the U.K. AIM market, which is true.9 However, the average AIM market IPO by a U.S. company in 2007 (through October) was $88.5 million, as compared with the $50 million minimum qualifying size for a U.S. listing. In fact, in 2007, 50% of the U.S. IPOs on AIM were large enough for an IPO in the U.S.10
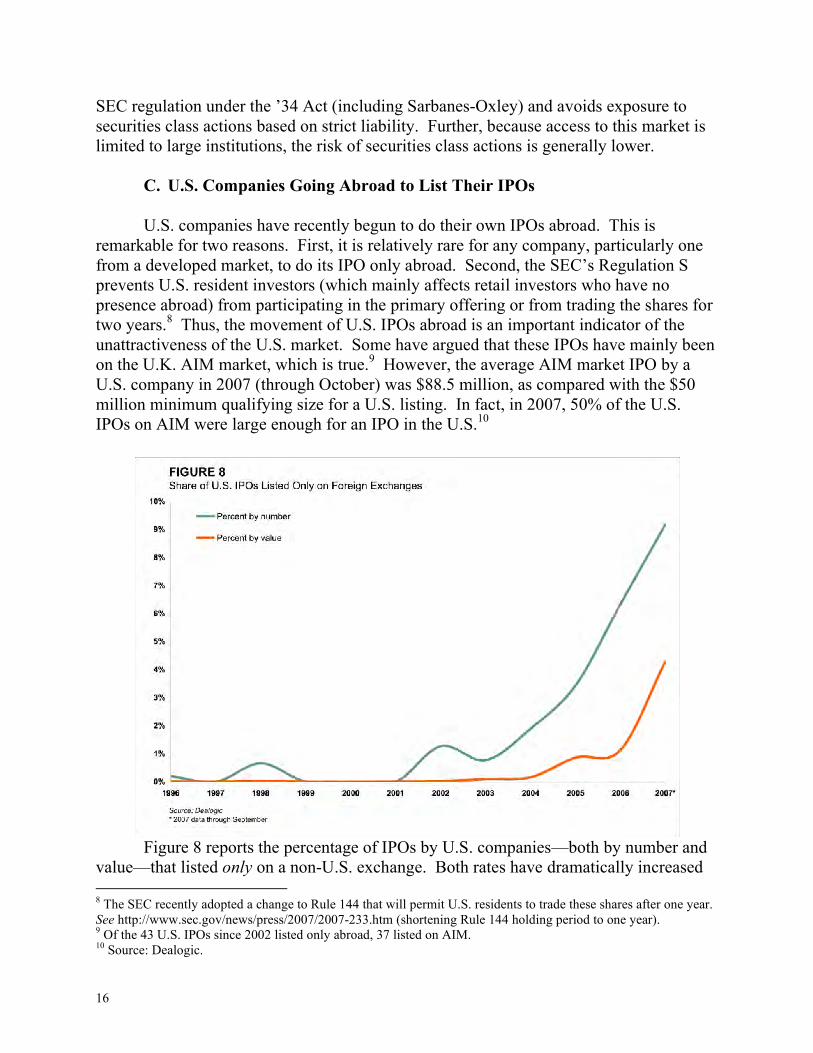
Figure 8 reports the percentage of IPOs by U.S. companies—both by number and
value—that listed only on a non-U.S. exchange. Both rates have dramatically increased 8 The SEC recently adopted a change to Rule 144 that will permit U.S. residents to trade these shares after one year. See http://www.sec.gov/news/press/2007/2007-233.htm (shortening Rule 144 holding period to one year). 9 Of the 43 U.S. IPOs since 2002 listed only abroad, 37 listed on AIM. 10 Source: Dealogic.
16
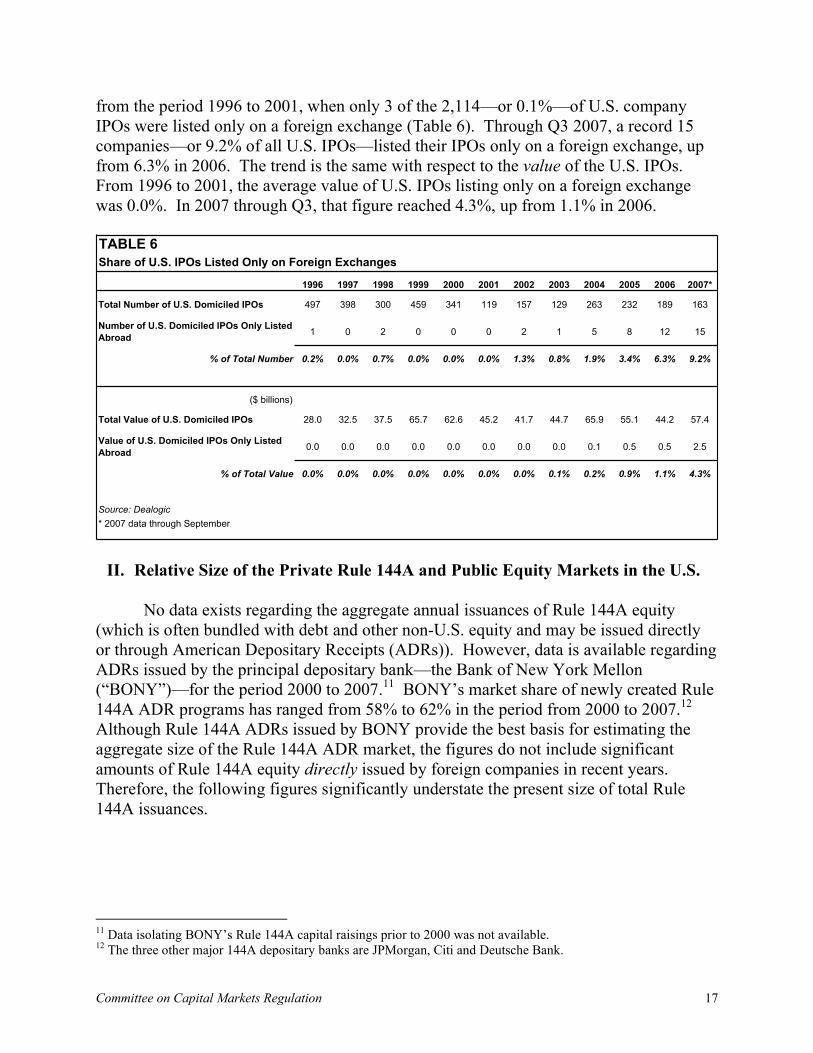
from the period 1996 to 2001, when only 3 of the 2,114—or 0.1%—of U.S. company IPOs were listed only on a foreign exchange (Table 6). Through Q3 2007, a record 15 companies—or 9.2% of all U.S. IPOs—listed their IPOs only on a foreign exchange, up from 6.3% in 2006. The trend is the same with respect to the value of the U.S. IPOs. From 1996 to 2001, the average value of U.S. IPOs listing only on a foreign exchange was 0.0%. In 2007 through Q3, that figure reached 4.3%, up from 1.1% in 2006.
II. Relative Size of the Private Rule 144A and Public Equity Markets in the U.S.
No data exists regarding the aggregate annual issuances of Rule 144A equity
(which is often bundled with debt and other non-U.S. equity and may be issued directly or through American Depositary Receipts (ADRs)). However, data is available regarding ADRs issued by the principal depositary bank—the Bank of New York Mellon (“BONY”)—for the period 2000 to 2007.11 BONY’s market share of newly created Rule 144A ADR programs has ranged from 58% to 62% in the period from 2000 to 2007.12 Although Rule 144A ADRs issued by BONY provide the best basis for estimating the aggregate size of the Rule 144A ADR market, the figures do not include significant amounts of Rule 144A equity directly issued by foreign companies in recent years. Therefore, the following figures significantly understate the present size of total Rule 144A issuances.
11 Data isolating BONY’s Rule 144A capital raisings prior to 2000 was not available. 12 The three other major 144A depositary banks are JPMorgan, Citi and Deutsche Bank.
TABLE 6
Share of U.S. IPOs Listed Only on Foreign Exchanges
1996 1997 1998 1999 2000 2001 2002 2003 2004 2005 2006 2007*
Total Number of U.S. Domiciled IPOs 497 398 300 459 341 119 157 129 263 232 189 163
Number of U.S. Domiciled IPOs Only Listed
Abroad1 0 2 0 0 0 2 1 5 8 12 15
% of Total Number 0.2% 0.0% 0.7% 0.0% 0.0% 0.0% 1.3% 0.8% 1.9% 3.4% 6.3% 9.2%
($ billions)
Total Value of U.S. Domiciled IPOs 28.0 32.5 37.5 65.7 62.6 45.2 41.7 44.7 65.9 55.1 44.2 57.4
Value of U.S. Domiciled IPOs Only Listed
Abroad0.0 0.0 0.0 0.0 0.0 0.0 0.0 0.0 0.1 0.5 0.5 2.5
% of Total Value 0.0% 0.0% 0.0% 0.0% 0.0% 0.0% 0.0% 0.1% 0.2% 0.9% 1.1% 4.3%
Source: Dealogic
* 2007 data through September
17Committee on Capital Markets Regulation
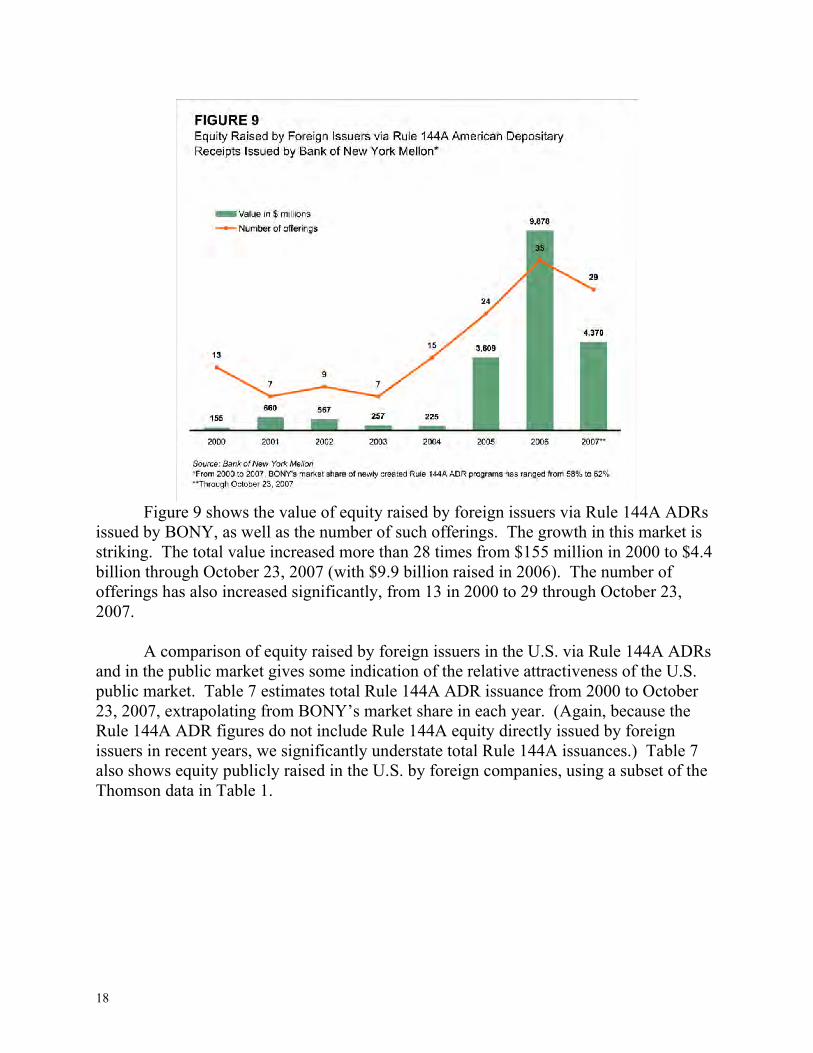
Figure 9 shows the value of equity raised by foreign issuers via Rule 144A ADRs
issued by BONY, as well as the number of such offerings. The growth in this market is striking. The total value increased more than 28 times from $155 million in 2000 to $4.4 billion through October 23, 2007 (with $9.9 billion raised in 2006). The number of offerings has also increased significantly, from 13 in 2000 to 29 through October 23, 2007.
A comparison of equity raised by foreign issuers in the U.S. via Rule 144A ADRs and in the public market gives some indication of the relative attractiveness of the U.S. public market. Table 7 estimates total Rule 144A ADR issuance from 2000 to October 23, 2007, extrapolating from BONY’s market share in each year. (Again, because the Rule 144A ADR figures do not include Rule 144A equity directly issued by foreign issuers in recent years, we significantly understate total Rule 144A issuances.) Table 7 also shows equity publicly raised in the U.S. by foreign companies, using a subset of the Thomson data in Table 1.
18
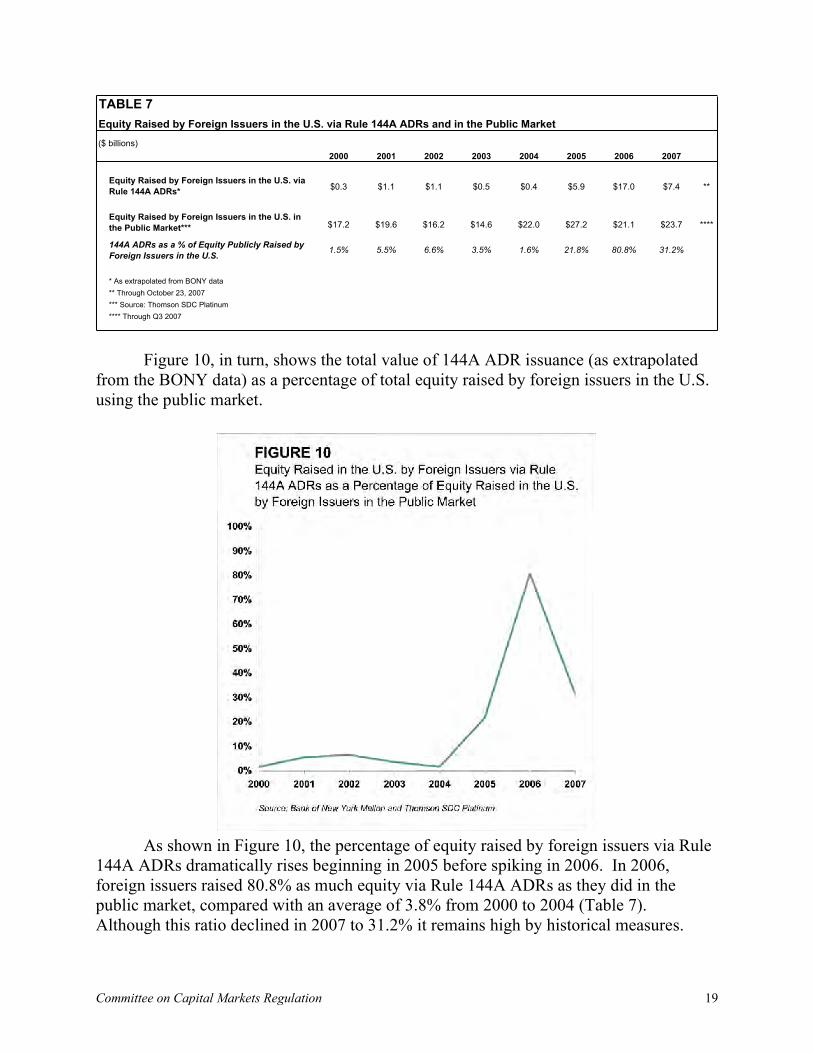
TABLE 7
Equity Raised by Foreign Issuers in the U.S. via Rule 144A ADRs and in the Public Market
($ billions)
2000 2001 2002 2003 2004 2005 2006 2007
Equity Raised by Foreign Issuers in the U.S. via
Rule 144A ADRs*$0.3 $1.1 $1.1 $0.5 $0.4 $5.9 $17.0 $7.4 **
Equity Raised by Foreign Issuers in the U.S. in
the Public Market*** $17.2 $19.6 $16.2 $14.6 $22.0 $27.2 $21.1 $23.7 ****
144A ADRs as a % of Equity Publicly Raised by
Foreign Issuers in the U.S. 1.5% 5.5% 6.6% 3.5% 1.6% 21.8% 80.8% 31.2%
* As extrapolated from BONY data
** Through October 23, 2007
*** Source: Thomson SDC Platinum
**** Through Q3 2007
Figure 10, in turn, shows the total value of 144A ADR issuance (as extrapolated from the BONY data) as a percentage of total equity raised by foreign issuers in the U.S. using the public market.
As shown in Figure 10, the percentage of equity raised by foreign issuers via Rule 144A ADRs dramatically rises beginning in 2005 before spiking in 2006. In 2006, foreign issuers raised 80.8% as much equity via Rule 144A ADRs as they did in the public market, compared with an average of 3.8% from 2000 to 2004 (Table 7). Although this ratio declined in 2007 to 31.2% it remains high by historical measures.
19Committee on Capital Markets Regulation
The extraordinary growth of the Rule 144A market compared to the U.S. public market again indicates the increasing attractiveness of the much less regulated and less litigious private market. We may be witnessing a classic example of regulatory arbitrage. III. U.S. Cross-Listings and Delistings by Foreign Companies
A. Cross-Listings in the U.S. by Foreign Companies
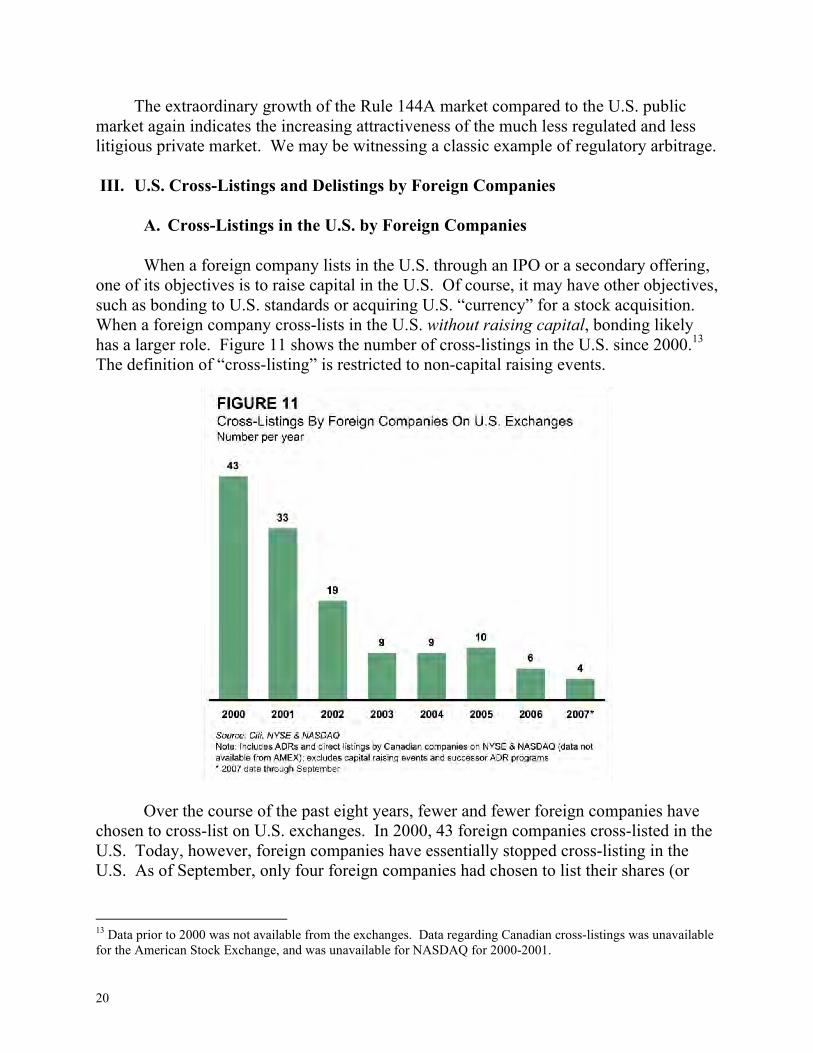
When a foreign company lists in the U.S. through an IPO or a secondary offering,
one of its objectives is to raise capital in the U.S. Of course, it may have other objectives, such as bonding to U.S. standards or acquiring U.S. “currency” for a stock acquisition. When a foreign company cross-lists in the U.S. without raising capital, bonding likely has a larger role. Figure 11 shows the number of cross-listings in the U.S. since 2000.13 The definition of “cross-listing” is restricted to non-capital raising events.
Over the course of the past eight years, fewer and fewer foreign companies have chosen to cross-list on U.S. exchanges. In 2000, 43 foreign companies cross-listed in the U.S. Today, however, foreign companies have essentially stopped cross-listing in the U.S. As of September, only four foreign companies had chosen to list their shares (or
13 Data prior to 2000 was not available from the exchanges. Data regarding Canadian cross-listings was unavailable for the American Stock Exchange, and was unavailable for NASDAQ for 2000-2001.
20
ADRs) on the NYSE or NASDAQ without raising capital. This indicates that the bonding value of a cross-listing has substantially decreased.
A recent study by Doidge, Karolyi and Stulz (DKS 2007)14 concludes that the
kinds of companies that used to cross-list in the U.S. continue to do so. Even if this is true, it is of little comfort to the U.S., which currently gets almost no cross-listings. Retaining market share in a shrinking market while losing market share in a growing market is hardly an indication of competitiveness.
B. Delistings by Foreign Companies from the New York Stock Exchange
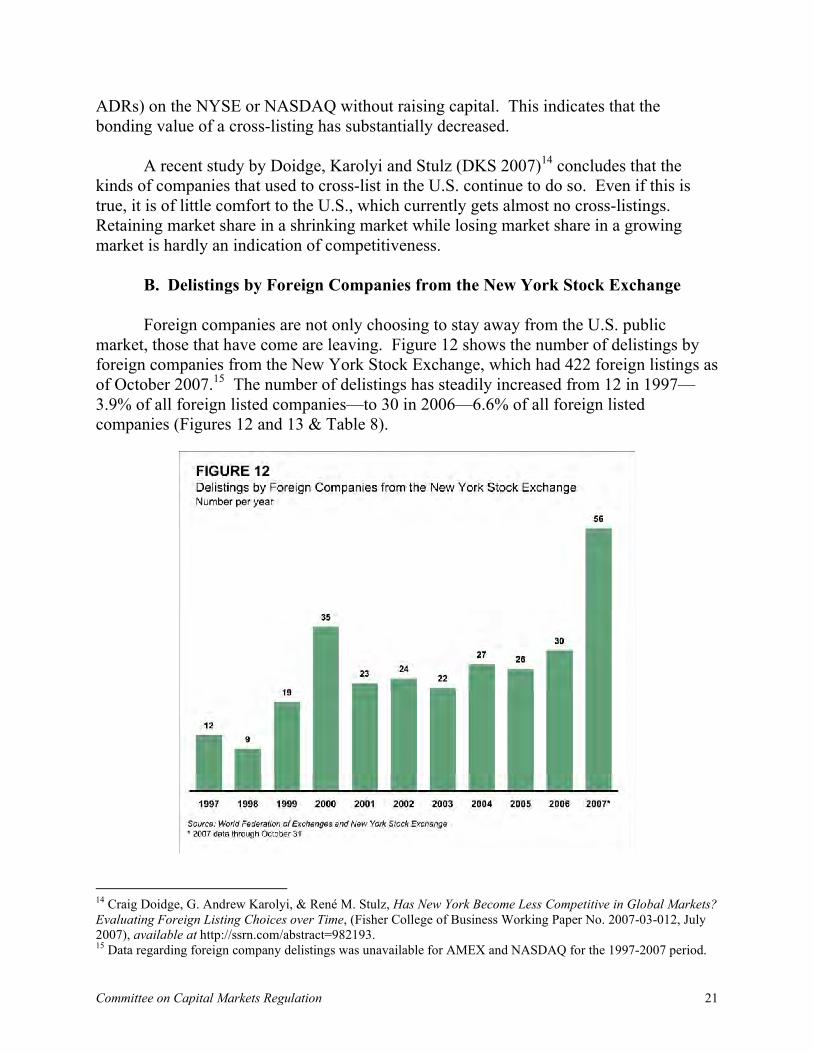
Foreign companies are not only choosing to stay away from the U.S. public
market, those that have come are leaving. Figure 12 shows the number of delistings by foreign companies from the New York Stock Exchange, which had 422 foreign listings as of October 2007.15 The number of delistings has steadily increased from 12 in 1997—3.9% of all foreign listed companies—to 30 in 2006—6.6% of all foreign listed companies (Figures 12 and 13 & Table 8).
14 Craig Doidge, G. Andrew Karolyi, & René M. Stulz, Has New York Become Less Competitive in Global Markets?
Evaluating Foreign Listing Choices over Time, (Fisher College of Business Working Paper No. 2007-03-012, July 2007), available at http://ssrn.com/abstract=982193. 15 Data regarding foreign company delistings was unavailable for AMEX and NASDAQ for the 1997-2007 period.
21Committee on Capital Markets Regulation
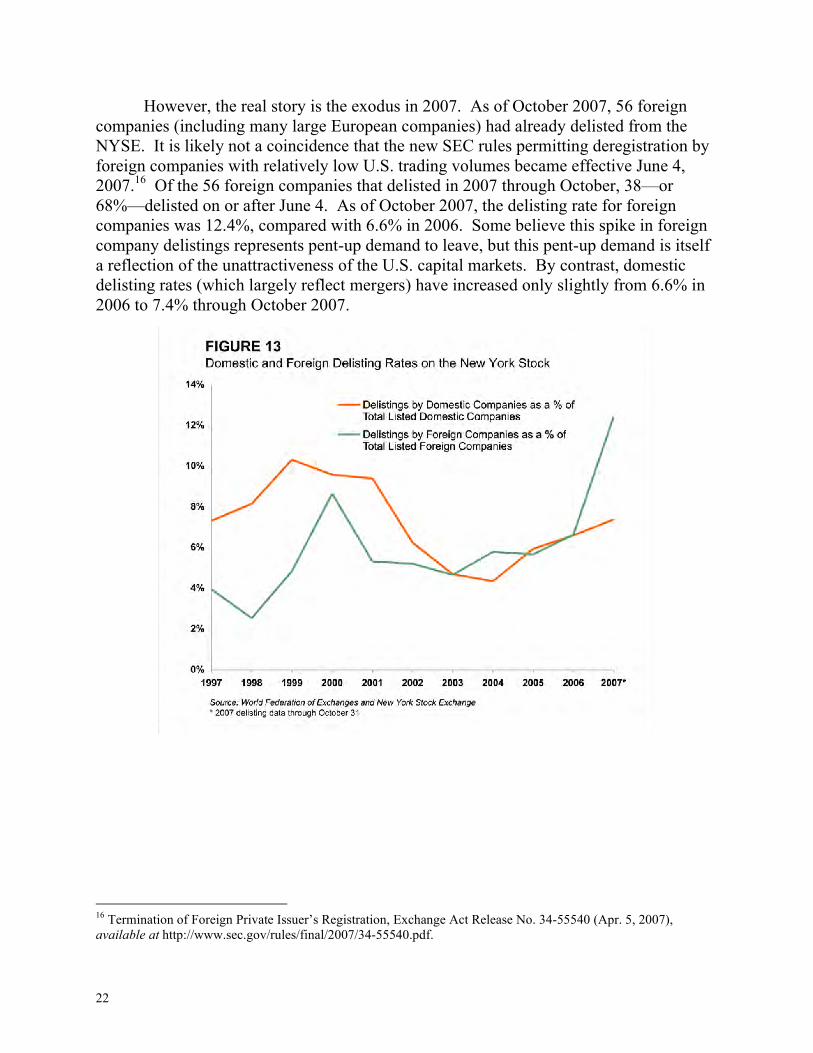
However, the real story is the exodus in 2007. As of October 2007, 56 foreign companies (including many large European companies) had already delisted from the NYSE. It is likely not a coincidence that the new SEC rules permitting deregistration by foreign companies with relatively low U.S. trading volumes became effective June 4, 2007.16 Of the 56 foreign companies that delisted in 2007 through October, 38—or 68%—delisted on or after June 4. As of October 2007, the delisting rate for foreign companies was 12.4%, compared with 6.6% in 2006. Some believe this spike in foreign company delistings represents pent-up demand to leave, but this pent-up demand is itself a reflection of the unattractiveness of the U.S. capital markets. By contrast, domestic delisting rates (which largely reflect mergers) have increased only slightly from 6.6% in 2006 to 7.4% through October 2007.
16 Termination of Foreign Private Issuer’s Registration, Exchange Act Release No. 34-55540 (Apr. 5, 2007), available at http://www.sec.gov/rules/final/2007/34-55540.pdf.
22
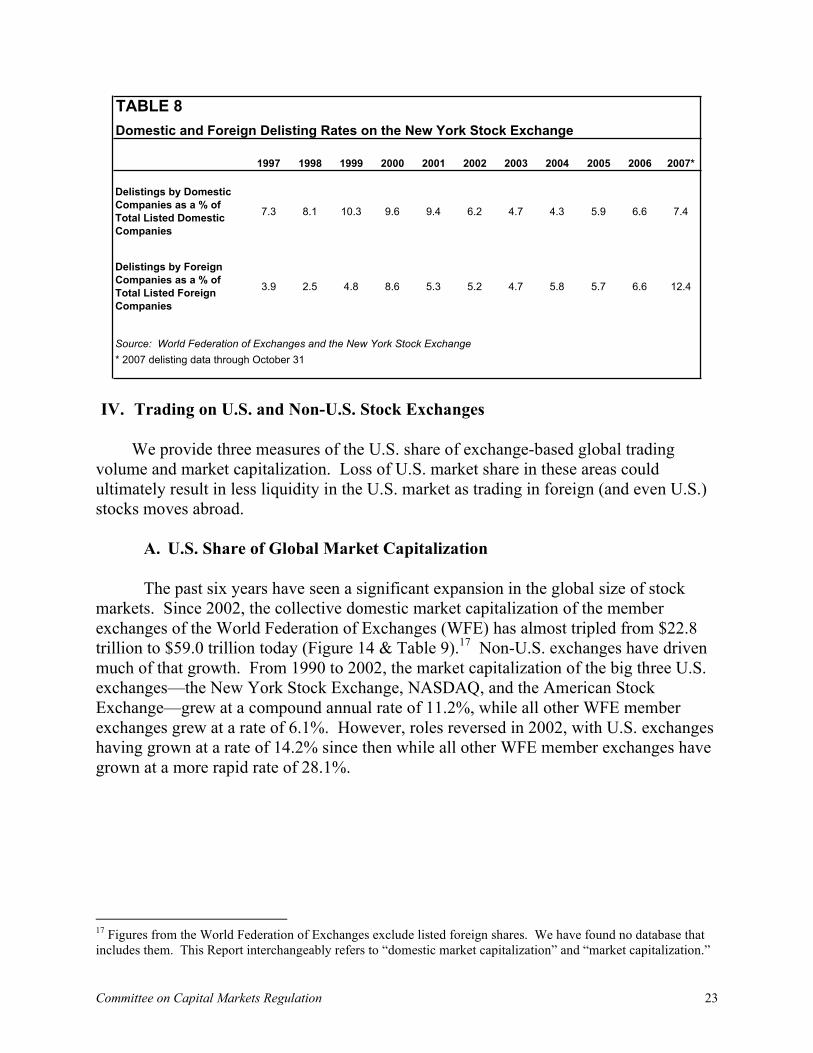
TABLE 8
Domestic and Foreign Delisting Rates on the New York Stock Exchange
1997 1998 1999 2000 2001 2002 2003 2004 2005 2006 2007*
Delistings by Domestic
Companies as a % of
Total Listed Domestic
Companies
7.3 8.1 10.3 9.6 9.4 6.2 4.7 4.3 5.9 6.6 7.4
Delistings by Foreign
Companies as a % of
Total Listed Foreign
Companies
3.9 2.5 4.8 8.6 5.3 5.2 4.7 5.8 5.7 6.6 12.4
Source: World Federation of Exchanges and the New York Stock Exchange
* 2007 delisting data through October 31
IV. Trading on U.S. and Non-U.S. Stock Exchanges
We provide three measures of the U.S. share of exchange-based global trading volume and market capitalization. Loss of U.S. market share in these areas could ultimately result in less liquidity in the U.S. market as trading in foreign (and even U.S.) stocks moves abroad.
A. U.S. Share of Global Market Capitalization
The past six years have seen a significant expansion in the global size of stock
markets. Since 2002, the collective domestic market capitalization of the member exchanges of the World Federation of Exchanges (WFE) has almost tripled from $22.8 trillion to $59.0 trillion today (Figure 14 & Table 9).17 Non-U.S. exchanges have driven much of that growth. From 1990 to 2002, the market capitalization of the big three U.S. exchanges—the New York Stock Exchange, NASDAQ, and the American Stock Exchange—grew at a compound annual rate of 11.2%, while all other WFE member exchanges grew at a rate of 6.1%. However, roles reversed in 2002, with U.S. exchanges having grown at a rate of 14.2% since then while all other WFE member exchanges have grown at a more rapid rate of 28.1%.
17 Figures from the World Federation of Exchanges exclude listed foreign shares. We have found no database that includes them. This Report interchangeably refers to “domestic market capitalization” and “market capitalization.”
23Committee on Capital Markets Regulation
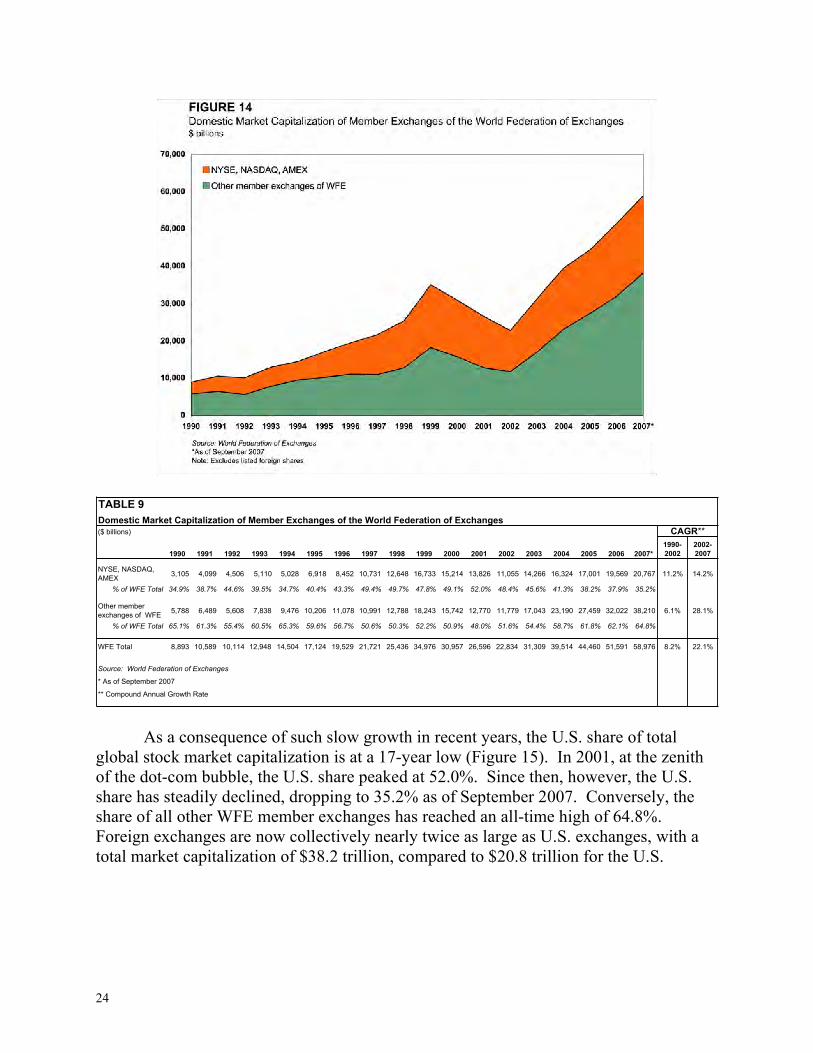
TABLE 9
Domestic Market Capitalization of Member Exchanges of the World Federation of Exchanges
($ billions) CAGR**
1990 1991 1992 1993 1994 1995 1996 1997 1998 1999 2000 2001 2002 2003 2004 2005 2006 2007*
1990-
2002
2002-
2007
NYSE, NASDAQ,
AMEX3,105 4,099 4,506 5,110 5,028 6,918 8,452 10,731 12,648 16,733 15,214 13,826 11,055 14,266 16,324 17,001 19,569 20,767 11.2% 14.2%
% of WFE Total 34.9% 38.7% 44.6% 39.5% 34.7% 40.4% 43.3% 49.4% 49.7% 47.8% 49.1% 52.0% 48.4% 45.6% 41.3% 38.2% 37.9% 35.2%
Other member
exchanges of WFE5,788 6,489 5,608 7,838 9,476 10,206 11,078 10,991 12,788 18,243 15,742 12,770 11,779 17,043 23,190 27,459 32,022 38,210 6.1% 28.1%
% of WFE Total 65.1% 61.3% 55.4% 60.5% 65.3% 59.6% 56.7% 50.6% 50.3% 52.2% 50.9% 48.0% 51.6% 54.4% 58.7% 61.8% 62.1% 64.8%
WFE Total 8,893 10,589 10,114 12,948 14,504 17,124 19,529 21,721 25,436 34,976 30,957 26,596 22,834 31,309 39,514 44,460 51,591 58,976 8.2% 22.1%
Source: World Federation of Exchanges
* As of September 2007
** Compound Annual Growth Rate
As a consequence of such slow growth in recent years, the U.S. share of total global stock market capitalization is at a 17-year low (Figure 15). In 2001, at the zenith of the dot-com bubble, the U.S. share peaked at 52.0%. Since then, however, the U.S. share has steadily declined, dropping to 35.2% as of September 2007. Conversely, the share of all other WFE member exchanges has reached an all-time high of 64.8%. Foreign exchanges are now collectively nearly twice as large as U.S. exchanges, with a total market capitalization of $38.2 trillion, compared to $20.8 trillion for the U.S.
24
B. U.S. Share of the Value of Global Share Trading
The U.S. share of global trading has decreased as well. From 1990 to 2002, the
value of share trading on U.S. exchanges grew at an annual rate of 21.2%, while the rate was 11.9% for all other WFE member exchanges (Figure 16 & Table 10). However, from 2002 to today, the value of share trading on non-U.S. exchanges grew at the annual rate of 30.1%, while the U.S. rate was 16.4%. In 2007, the value of share trading on non-U.S. exchanges is projected to reach $55.5 trillion, compared with just $14.9 trillion in 2002.
25Committee on Capital Markets Regulation
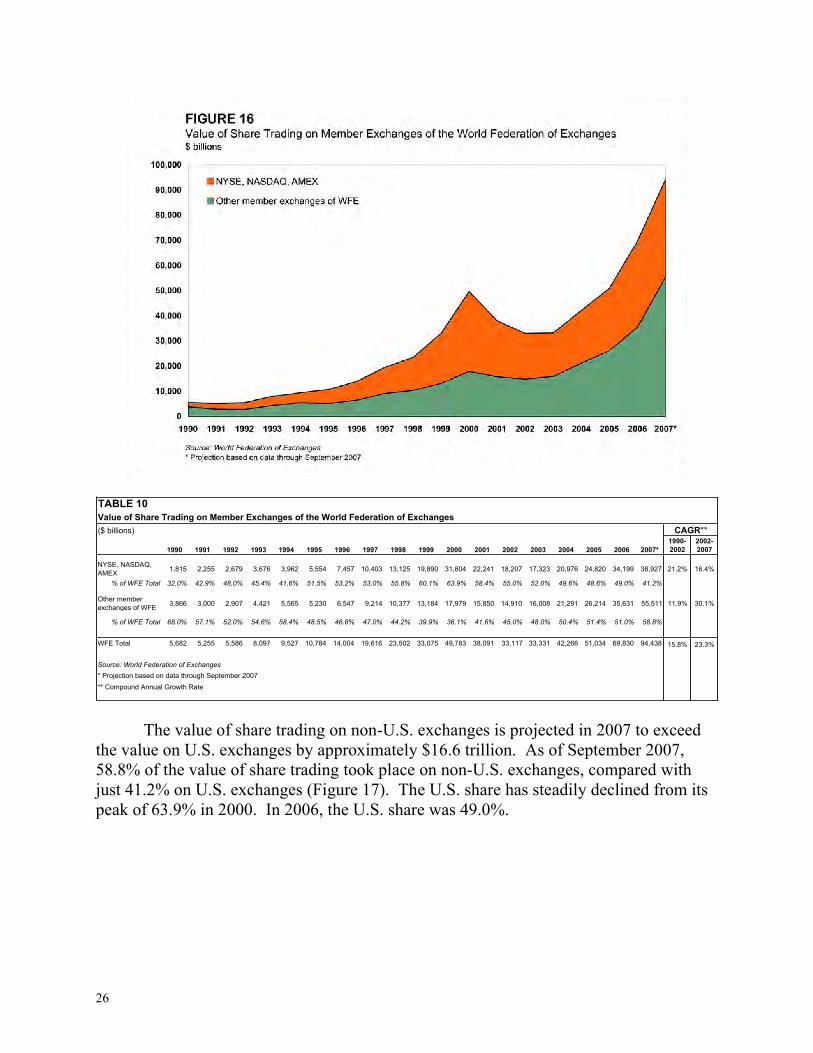
TABLE 10
Value of Share Trading on Member Exchanges of the World Federation of Exchanges
($ billions) CAGR**
1990 1991 1992 1993 1994 1995 1996 1997 1998 1999 2000 2001 2002 2003 2004 2005 2006 2007*
1990-
2002
2002-
2007
NYSE, NASDAQ,
AMEX1,815 2,255 2,679 3,676 3,962 5,554 7,457 10,403 13,125 19,890 31,804 22,241 18,207 17,323 20,976 24,820 34,199 38,927 21.2% 16.4%
% of WFE Total 32.0% 42.9% 48.0% 45.4% 41.6% 51.5% 53.2% 53.0% 55.8% 60.1% 63.9% 58.4% 55.0% 52.0% 49.6% 48.6% 49.0% 41.2%
Other member
exchanges of WFE3,866 3,000 2,907 4,421 5,565 5,230 6,547 9,214 10,377 13,184 17,979 15,850 14,910 16,008 21,291 26,214 35,631 55,511 11.9% 30.1%
% of WFE Total 68.0% 57.1% 52.0% 54.6% 58.4% 48.5% 46.8% 47.0% 44.2% 39.9% 36.1% 41.6% 45.0% 48.0% 50.4% 51.4% 51.0% 58.8%
WFE Total 5,682 5,255 5,586 8,097 9,527 10,784 14,004 19,616 23,502 33,075 49,783 38,091 33,117 33,331 42,266 51,034 69,830 94,438 15.8% 23.3%
Source: World Federation of Exchanges
* Projection based on data through September 2007
** Compound Annual Growth Rate
The value of share trading on non-U.S. exchanges is projected in 2007 to exceed the value on U.S. exchanges by approximately $16.6 trillion. As of September 2007, 58.8% of the value of share trading took place on non-U.S. exchanges, compared with just 41.2% on U.S. exchanges (Figure 17). The U.S. share has steadily declined from its peak of 63.9% in 2000. In 2006, the U.S. share was 49.0%.
26
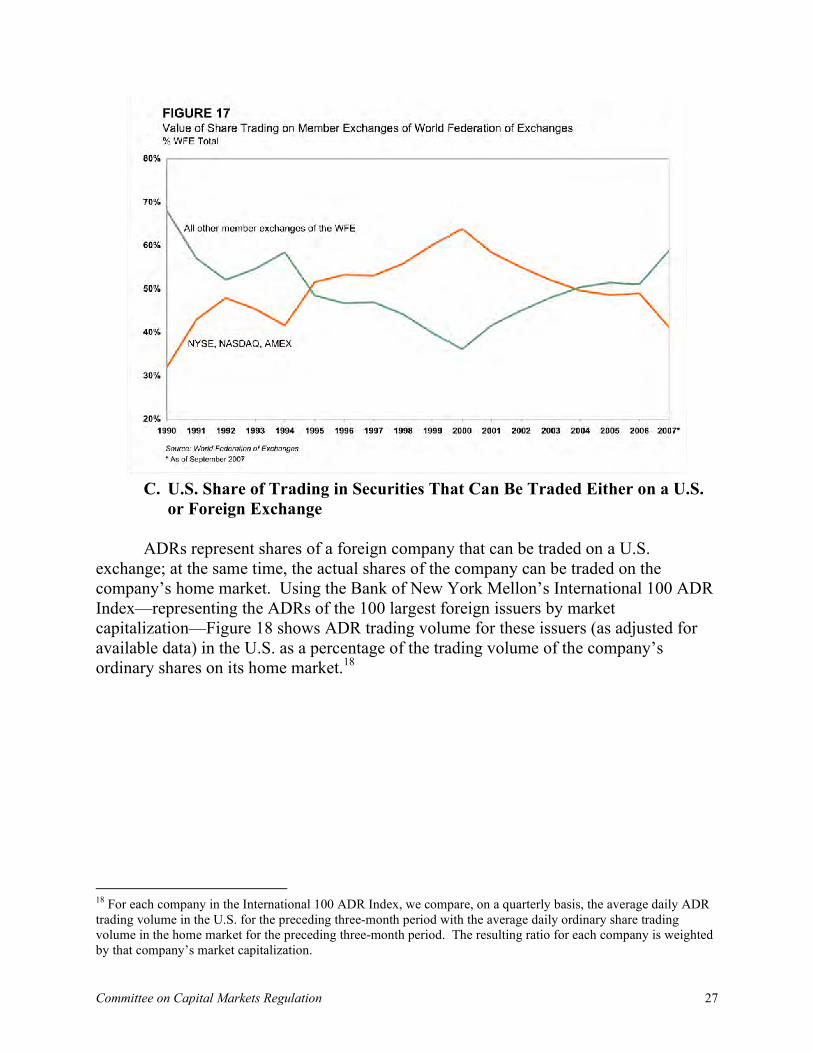
C. U.S. Share of Trading in Securities That Can Be Traded Either on a U.S.
or Foreign Exchange
ADRs represent shares of a foreign company that can be traded on a U.S. exchange; at the same time, the actual shares of the company can be traded on the company’s home market. Using the Bank of New York Mellon’s International 100 ADR Index—representing the ADRs of the 100 largest foreign issuers by market capitalization—Figure 18 shows ADR trading volume for these issuers (as adjusted for available data) in the U.S. as a percentage of the trading volume of the company’s ordinary shares on its home market.18
18 For each company in the International 100 ADR Index, we compare, on a quarterly basis, the average daily ADR trading volume in the U.S. for the preceding three-month period with the average daily ordinary share trading volume in the home market for the preceding three-month period. The resulting ratio for each company is weighted by that company’s market capitalization.
27Committee on Capital Markets Regulation
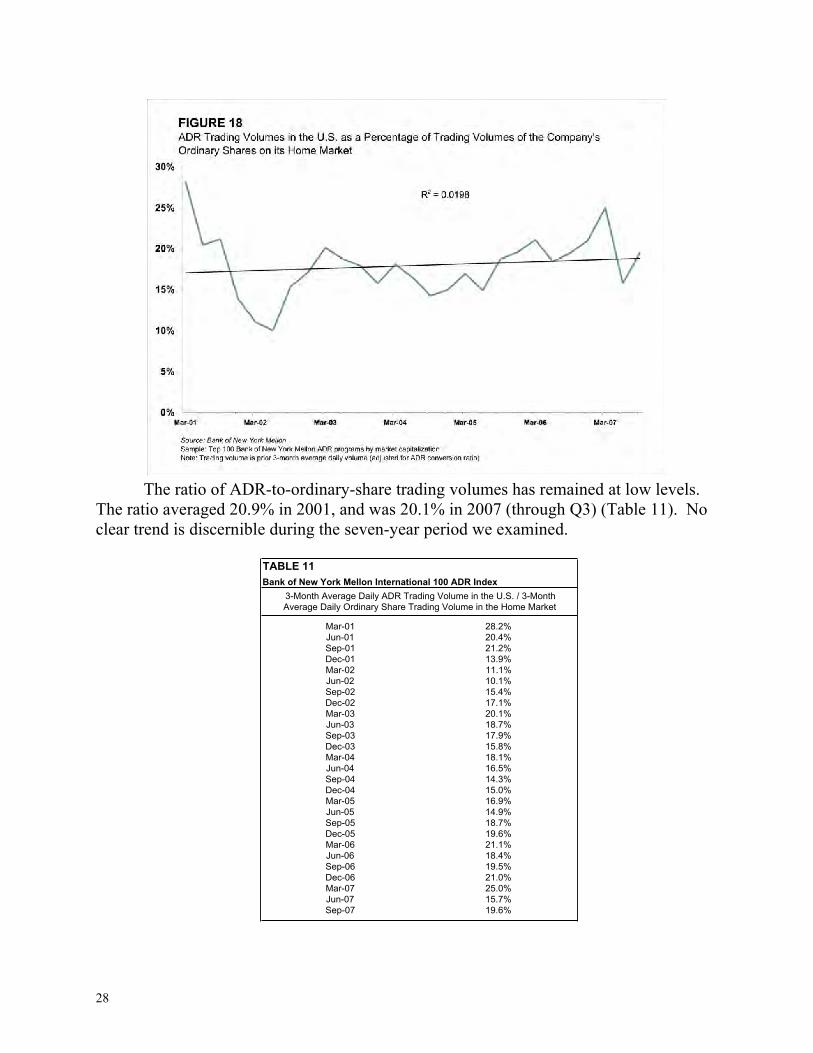
The ratio of ADR-to-ordinary-share trading volumes has remained at low levels.
The ratio averaged 20.9% in 2001, and was 20.1% in 2007 (through Q3) (Table 11). No clear trend is discernible during the seven-year period we examined.
TABLE 11
Mar-01 28.2%
Jun-01 20.4%
Sep-01 21.2%
Dec-01 13.9%
Mar-02 11.1%
Jun-02 10.1%
Sep-02 15.4%
Dec-02 17.1%
Mar-03 20.1%
Jun-03 18.7%
Sep-03 17.9%
Dec-03 15.8%
Mar-04 18.1%
Jun-04 16.5%
Sep-04 14.3%
Dec-04 15.0%
Mar-05 16.9%
Jun-05 14.9%
Sep-05 18.7%
Dec-05 19.6%
Mar-06 21.1%
Jun-06 18.4%
Sep-06 19.5%
Dec-06 21.0%
Mar-07 25.0%
Jun-07 15.7%
Sep-07 19.6%
Bank of New York Mellon International 100 ADR Index
3-Month Average Daily ADR Trading Volume in the U.S. / 3-Month
Average Daily Ordinary Share Trading Volume in the Home Market
28
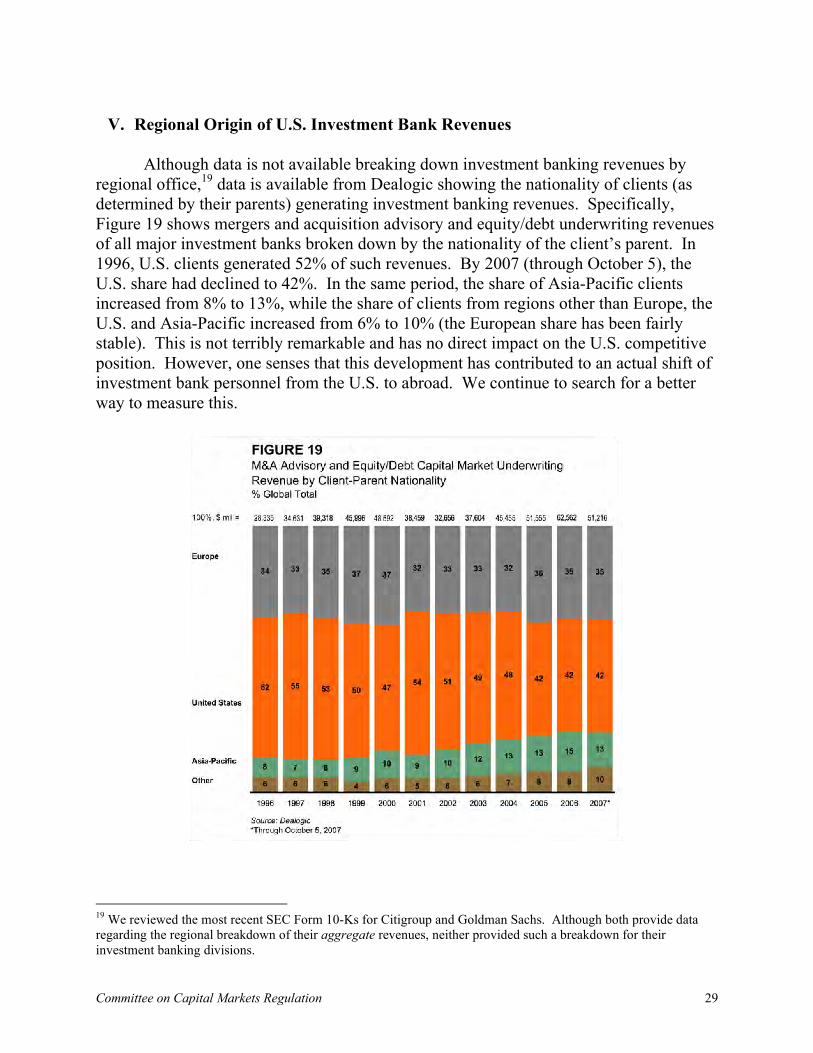
V. Regional Origin of U.S. Investment Bank Revenues
Although data is not available breaking down investment banking revenues by
regional office,19 data is available from Dealogic showing the nationality of clients (as determined by their parents) generating investment banking revenues. Specifically, Figure 19 shows mergers and acquisition advisory and equity/debt underwriting revenues of all major investment banks broken down by the nationality of the client’s parent. In 1996, U.S. clients generated 52% of such revenues. By 2007 (through October 5), the U.S. share had declined to 42%. In the same period, the share of Asia-Pacific clients increased from 8% to 13%, while the share of clients from regions other than Europe, the U.S. and Asia-Pacific increased from 6% to 10% (the European share has been fairly stable). This is not terribly remarkable and has no direct impact on the U.S. competitive position. However, one senses that this development has contributed to an actual shift of investment bank personnel from the U.S. to abroad. We continue to search for a better way to measure this.
19 We reviewed the most recent SEC Form 10-Ks for Citigroup and Goldman Sachs. Although both provide data regarding the regional breakdown of their aggregate revenues, neither provided such a breakdown for their investment banking divisions.
29Committee on Capital Markets Regulation
FAULTY COMPETITIVE MEASURES
Four purported “measures” of U.S. capital market competitiveness are often cited by commentators. Each is faulty.
I. U.S. Underwriting Fees
U.S. underwriting fees are generally higher than those of some competitors. For
example, the average IPO gross spread of 5.6% for NYSE offerings is higher than the 3.5% spread for London Stock Exchange (LSE) offerings. This 2.1% difference is not material to companies deciding whether to list in the U.S. or London. Foreign companies are much more concerned about pricing, and the U.S. underwriting process may lead to better pricing than foreign underwriting techniques.
II. Inaccurate “In Play” Analysis
Some analysts have contended that the U.S. is getting all of the IPOs it can—that
is, all of the IPOs that are actually “in play.” As an example, M. Pinelli and J. Muscat, in their report for Ernst & Young (E&Y) entitled “Global Capital Market Trends,”20 assumed that U.S. exchanges could not compete for London Alternative Investment Market (AIM) listings because, according to the authors, the average non-U.K. AIM IPO was $58 million compared with the U.S. average of $205 million in the first half of 2006. Any company with an offering of $50 million can qualify for a U.S. listing, so the average AIM listing was actually in play in the U.S. The E&Y study also assumed that New York could not attract Chinese listings, which it actually continues to do.21 E&Y also ignored losses of the U.S. public markets to the U.S. Rule 144A private market. Any “in play” analysis is only as good as the accuracy of the assumptions as to what is “in play.”
III. Getting the Same Companies as in the Past
As already noted, DKS (2007) contend the U.S. continues to garner listings of foreign companies that listed in the past. This is irrelevant to the current competitive position of the U.S.—its ability to attract companies listing today whether or not it attracted these companies in the past.
20 MARIA PINELLI & JOSEPH A. MUSCAT, ERNST & YOUNG, GLOBAL CAPITAL MARKET TRENDS (Jan. 2007). 21 For example, in October 2007, Chinese software maker Longtop Financial Technologies Ltd. listed on the NYSE and Chinese jeweler Fuqui International Inc. listed on NASDAQ.
30
IV. Absolute Numbers Versus Market Share
Thomson Financial issued a report in 2007 entitled “Making It In The USA: Foreign IPO Issuers Continue to Flock to US-Based Exchanges.” Thomson reports that the $10.5 billion in foreign IPO activity in the U.S. market in 2006 was the second highest dollar volume in its last 20-year examination, and concludes that the U.S. has an attractive market for foreign IPOs. Absolute numbers are not relevant to market share. As our Report shows, the U.S. share of the value of Global IPOs (broadly defined) in 2006 was just 6.6%.
A “MAYBE” COMPETITIVE MEASURE: LISTING
PREMIUMS
A number of academic studies have recently examined U.S. cross-listing premiums (the market value of a company compared to its book value).22 DKS (2007) compares the listing premiums for foreign companies cross-listing on the major U.S. exchanges with those cross-listing on the London Main Market (LMM) and finds the U.S. had an average premium of 17% from 1990-2005 compared with virtually no listing premium on LMM. The authors conclude that New York remains competitive.
We have four basic concerns with these findings. First, and most basic, if there
really is a listing premium, it is also the case that increasingly few foreign companies are coming to get it. Theory perhaps tells us the U.S. should not have a competitive problem, but behavior tells us it does. Second, the presence of a premium could indicate some real benefit from listing in the U.S., but it could also reflect market segmentation. For example, when Royal Dutch Shell traded as two separate classes of shares, the Royal Dutch class of shares trading in the U.S. was selling at a premium to the class of shares trading abroad, despite the lack of any difference in the two stocks. This example illustrates that listing premiums are not well understood. Third, there may be a significant self-selection problem because better companies cross-list in New York. When DKS properly control for such self-selection, the NYSE premium drops to 8%, versus 5% in the over-the-counter market. Fourth, the authors downplay the fact that even higher listing premiums are available on other markets—the authors’ own data shows a 27% premium on AIM in 2005. This cannot be dismissed by saying AIM does
22 For purposes of analyzing premiums, these studies characterize all cross-listings, whether or not they involve capital-raising events, as cross-listings.
31Committee on Capital Markets Regulation
not compete with New York—it does. The premiums on other exchanges may be even higher.23
Two listing premium studies, by Litvak and Zingales, find that the U.S. premium
has decreased significantly since the enactment of SOX in 2002,24 particularly for companies from countries with better corporate governance. It also appears that the premium has fallen significantly for smaller companies for whom the impact of SOX 404’s internal control requirements is disproportionately high.25
We believe that more work needs to be done on the measurement and relevance of
listing premiums before making a decision as to whether this is a reliable measurement of competitiveness.
CONCLUSION
By almost any meaningful measure, the competitiveness of the U.S. public equity market has significantly deteriorated in recent years. From 2006 to 2007, most measures either continued to decline or failed to substantially improve. As the November 2006 Interim Report found, continuation of this trend will have a significant negative impact on U.S. capital markets activity, including the formation and efficient allocation of capital.
The decline in competitiveness, with its negative effect on the U.S. economy, is continuing amid challenging market conditions worldwide and growing concern about U.S. economic fundamentals. The Committee’s November 2006 Interim Report offered a series of reforms that policymakers could implement in the near term—increasing shareholder rights and decreasing the burden of regulation and litigation—to help remedy the situation. Not nearly enough has been done. What is still lacking is commitment and political leadership.
This Report, therefore, is a second wake-up call.
23 For example, Qui Sun, Wilson H.S. Tong & Yujun Wu, Bonding Premium as a General Phenomenon, Working Paper (March 2006), available at http://ssrn.com/abstract=890962, find that from 1994-2002, the average premium for Chinese companies that cross-listed from Shanghai to Hong Kong was 80%. 24 Kate Litvak, Sarbanes-Oxley and the Cross-Listing Premium, 105 MICH. L. REV. 1857 (2007); Luigi Zingales, Is
the U.S. Capital Market Losing Its Competitive Edge?, J. ON ECON. PERSP. (forthcoming 2007). 25 Joseph D. Piotroski & Suraj Srinivasan, The Sarbanes-Oxley Act and the Flow of International Listings (Jan. 2007), available at http://ssrn.com/abstract=956987.
32

134 Mount Auburn Street, Cambridge, MA 02138www.capmktsreg.org