Embed Size (px)
Citation preview
THE
U.S. HEALTH WORKFORCE
CHARTBOOK
Part IV:
Behavioral and Allied Health
U.S. Department of Health and Human Services
Health Resources and Services Administration
National Center for Health Workforce Analysis
November 2013
The Health Resources and Services Administration (HRSA), U.S. Department of Health and
Human Services (HHS), provides national leadership in the development, distribution, and
retention of a diverse, culturally competent health workforce that can adapt to the population’s
changing health care needs and provide the highest-quality care for all. The agency administers
a wide range of training grants, scholarships, loans, and loan repayment programs that strengthen
the health care workforce and respond to the evolving needs of the health care system.
The National Center for Health Workforce Analysis (the National Center) informs public and
private-sector decision-making related to the health workforce by expanding and improving
health workforce data, disseminating workforce data to the public, improving and updating
projections of the supply and demand for health workers, and conducting analyses of issues
important to the health workforce.
For more information about the National Center, e-mail us at [email protected],
or visit our website at http://bhpr.hrsa.gov/healthworkforce/index.html.
Suggested citation:
U.S. Department of Health and Human Services, Health Resources and Services Administration,
National Center for Health Workforce Analysis. The U.S. Health Workforce Chartbook,
Rockville, Maryland; 2013.
Copyright information:
All material appearing in this report is in the public domain and may be reproduced or copied
without permission. Citation of the source, however, is appreciated.
The U.S. Health Workforce Chartbook- Part IV November 2013i
CONTENTS
Introduction ................................................................................................................................. 1
Data Sources ........................................................................................................................... 2
1.0 Behavioral Health ......................................................................................................... 4
1.1 Psychologists............................................................................................................. 4
1.2 Counselors..................................................................................................................... 7
1.3 Social Workers ............................................................................................................ 10
2.0 Dietitians and Nutritionists ............................................................................................. 13
3.0 Therapists – Allied Health .......................................................................................... 16
3.1 Physical Therapists ..................................................................................................... 16
3.1.1 Physical Therapist Assistants and Aides.............................................................. 19
3.2 Occupational Therapists.......................................................................................... 22
3.3 Respiratory Therapists ................................................................................................ 25
3.4 Speech-Language Pathologists ................................................................................... 28
3.5 Massage Therapists ..................................................................................................... 31
FIGURES
Figure 1: Psychologists per 100,000 Working-Age Population by State ...................................... 4 Figure 2: Number of Psychologists by State.................................................................................. 5 Figure 3: Distribution of Psychologists by Work Setting .............................................................. 5
Figure 4: Distribution of Psychologists by Sex and Age ............................................................... 6 Figure 5: Distribution of Psychologists by Race/Ethnicity, .......................................................... 6 Figure 6: Counselors per 100,000 Working-Age Population by State .......................................... 7 Figure 7: Number of Counselors by State...................................................................................... 8 Figure 8: Distribution of Counselors by Work Setting .................................................................. 8 Figure 9: Distribution of Counselors by Sex and Age ................................................................... 9 Figure 10: Distribution of Counselors by Race/Ethnicity,............................................................. 9
Figure 11: Social Workers per 100,000 Working-Age Population by State................................ 10 Figure 12: Number of Social Workers by State ........................................................................... 11 Figure 13: Distribution of Social Workers by Work Setting ....................................................... 11
Figure 14: Distribution of Social Workers by Sex and Age ........................................................ 12 Figure 15: Distribution of Social Workers by Race/Ethnicity, .................................................... 12 Figure 16: Dietitians and Nutritionists per 100,000 Working-Age Population by State ............. 13 Figure 17: Number of Dietitians and Nutritionists by State ........................................................ 14
Figure 18: Distribution of Dietitians and Nutritionists by Work Setting ..................................... 14 Figure 19: Distribution of Dietitians and Nutritionists by Sex and Age ...................................... 15 Figure 20: Distribution of Dietitians and Nutritionists by Race/Ethnicity, ................................. 15 Figure 21: Physical Therapists per 100,000 Working-Age Population by State ......................... 16 Figure 22: Number of Physical Therapists by State .................................................................... 17 Figure 23: Distribution of Physical Therapists by Work Setting ................................................. 17 Figure 24: Distribution of Physical Therapists by Sex and Age .................................................. 18 Figure 25: Distribution of Physical Therapists by Race/Ethnicity, ............................................. 18
November 2013 The U.S. Health Workforce Chartbook- Part IV ii
Figure 26: Physical Therapist Assistants and Aides per 100,000 ................................................ 19 Figure 27: Number of Physical Therapist Assistants and Aides by State.................................... 20
Figure 28: Distribution of Physical Therapist Assistants and Aides by Work Setting ................ 20 Figure 29: Distribution of Physical Therapist Assistants and Aides by Sex and Age ................. 21 Figure 30: Distribution of Physical Therapist Assistants and Aides by Race/Ethnicity, Relative
to the Working-Age Population .................................................................................................... 21 Figure 31: Occupational Therapists per 100,000 Working-Age Population by State ................. 22 Figure 32: Number of Occupational Therapists by State............................................................. 23 Figure 33: Distribution of Occupational Therapists by Work Setting ......................................... 23 Figure 34: Distribution of Occupational Therapists by Sex and Age .......................................... 24 Figure 35: Distribution of Occupational Therapists by Race/Ethnicity, ...................................... 24 Figure 36: Respiratory Therapists per 100,000 Working-Age Population by State .................... 25 Figure 37: Number of Respiratory Therapists by State ............................................................... 26 Figure 38: Distribution of Respiratory Therapists by Work Setting ............................................ 26 Figure 39: Distribution of Respiratory Therapists by Sex and Age ............................................. 27
Figure 40: Distribution of Respiratory Therapists by Race/Ethnicity, ........................................ 27 Figure 41: Speech-Language Pathologists per 100,000 Working-Age Population by State ....... 28 Figure 42: Number of Speech-Language Pathologists by State .................................................. 29 Figure 43: Distribution of Speech-Language Pathologists by Work Setting ............................... 29 Figure 44: Distribution of Speech-Language Pathologists by Sex and Age ................................ 30 Figure 45: Distribution of Speech-Language Pathologists by Race/Ethnicity, ............................ 30 Figure 46: Massage Therapists per 100,000 Working-Age Population by State ......................... 31 Figure 47: Number of Massage Therapists by State .................................................................... 32 Figure 48: Distribution of Massage Therapists by Work Setting ................................................ 32 Figure 49: Distribution of Massage Therapists by Sex and Age ................................................. 33 Figure 50: Distribution of Massage Therapists by Race/Ethnicity, ............................................. 33
The U.S. Health Workforce Chartbook- Part IV November 2013iii
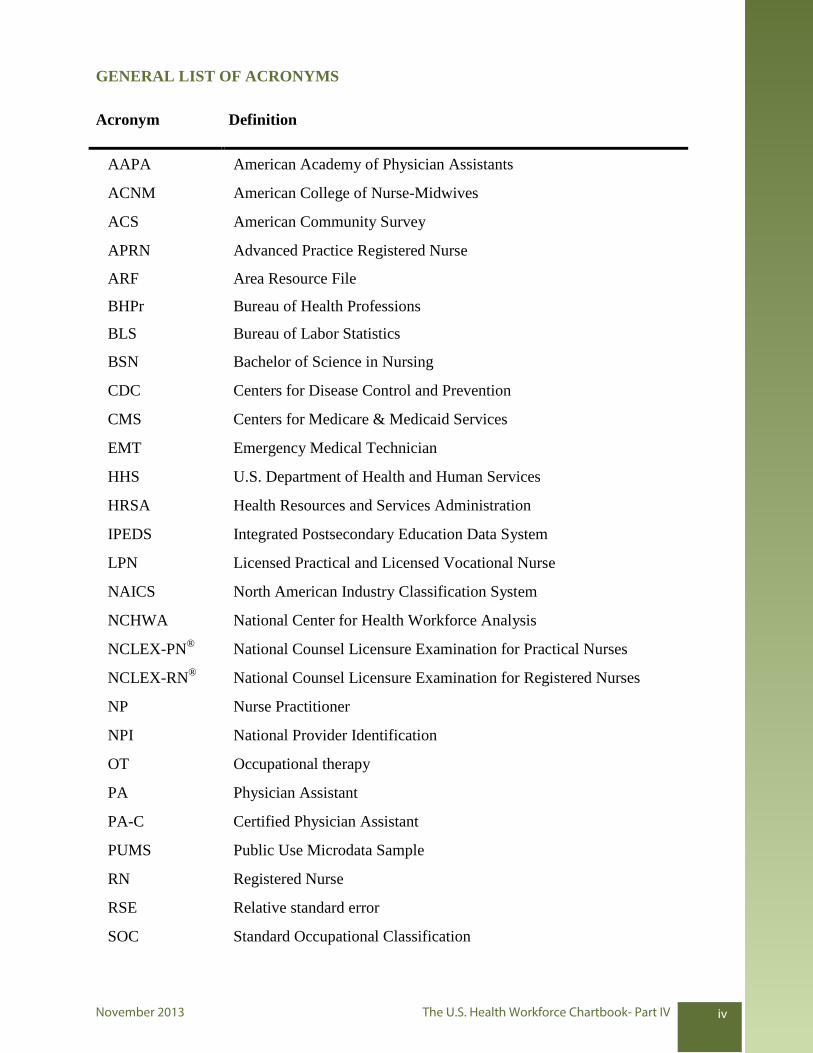
GENERAL LIST OF ACRONYMS
Acronym Definition
AAPA American Academy of Physician Assistants
ACNM American College of Nurse-Midwives
ACS American Community Survey
APRN Advanced Practice Registered Nurse
ARF Area Resource File
BHPr Bureau of Health Professions
BLS Bureau of Labor Statistics
BSN Bachelor of Science in Nursing
CDC Centers for Disease Control and Prevention
CMS Centers for Medicare & Medicaid Services
EMT Emergency Medical Technician
HHS U.S. Department of Health and Human Services
HRSA Health Resources and Services Administration
IPEDS Integrated Postsecondary Education Data System
LPN Licensed Practical and Licensed Vocational Nurse
NAICS North American Industry Classification System
NCHWA National Center for Health Workforce Analysis
NCLEX-PN®
National Counsel Licensure Examination for Practical Nurses
NCLEX-RN®
National Counsel Licensure Examination for Registered Nurses
NP Nurse Practitioner
NPI National Provider Identification
OT Occupational therapy
PA Physician Assistant
PA-C Certified Physician Assistant
PUMS Public Use Microdata Sample
RN Registered Nurse
RSE Relative standard error
SOC Standard Occupational Classification
November 2013 The U.S. Health Workforce Chartbook- Part IV iv
INTRODUCTION
The U.S. Health Workforce Chartbook provides extensive data on 35 health occupations and is
part of the Health Resources and Services Administration’s (HRSA’s) effort to assist states,
policymakers, local workforce planners, researchers, and the public in understanding the U.S.
health workforce. The Chartbook may also be used as a baseline to track changes in the health
workforce. While this Chartbook includes extensive data on supply, including comparative data
by state, it does not include data on demand and, as such, does not address the adequacy of the
supply.
The 35 occupations included in this Chartbook are classified based on the U.S. government’s
Standard Occupational Classification (SOC) system and included more than 14 million
individuals in 2010.1 These individuals represent approximately 10 percent of the nation’s
workforce.2 The occupations included in this Chartbook also represent those with the largest
current employment and those that are expected to grow substantially in the future.
The vast majority of workers are employed in what the U.S. Office of Management and Budget
defines as the “health sector,” which includes health settings such as hospitals, clinics, physician
offices, and nursing homes. The health sector also includes many workers in occupations that
are not considered health occupations. For example, workers such as accountants or food service
workers employed in hospitals are working in the health sector, even though they are not
working in a health occupation. Individuals in health occupations may also work outside the
health sector in settings such as local governments, schools, or insurance companies. The
information provided in this Chartbook includes individuals in health occupations that are both
within and outside the health sector.
For most occupations, the Chartbook relies on the U.S. Census Bureau’s ACS to estimate the
total number of individuals in each occupation, their geographic distribution, the settings in
which they work, and their demographic characteristics. The ACS, which uses self-reported
data, is the most comprehensive source available for the broad range of occupations included in
this report.3 This report also draws from the U.S. Department of Education’s Integrated
Postsecondary Education System (IPEDS) to include information on the number of graduates
from educational programs leading to entry into specific occupations. No graduate data are
presented for occupations in which formal educational requirements are completed in institutions
not reporting to IPEDS or vary substantially by state.
Some important components of the health workforce are not included or fully represented in the
Chartbook because of data limitations. These components include occupations for which data
are not collected or reported separately by the U.S. Census Bureau. For example, data from
public health nurses are not collected separately from other types of nurses. The report also does
1HRSA analysis of the U.S. Census Bureau, American Community Survey (ACS) Public Use Microdata Sample (PUMS), 2008-2010. 2HRSA analysis of the U.S. Bureau of Labor Statistics (BLS), Employment Projections, 2010-2020. Note: The “workforce” is defined as
individuals employed in the occupation and individuals whose last job was in the occupation and who are still seeking employment. 3Note: Self-reported data have limitations. Some individuals may report the occupation for which they are trained or licensed even when they
are not currently working the majority of their time in that occupation. For example, a physician who is spending a majority of his/her time as an
administrator may self-report as either a physician or an administrator. The ACS does not collect data on licensure or professional certification. See the Technical Documentation for additional details on ACS reporting and limitations.
The U.S. Health Workforce Chartbook- Part IV November 20131
not include important health occupations, because of the small size of the occupation, such as
epidemiologists and other public-health oriented disciplines like laboratorians and environmental
health professionals. In addition, some occupations in the Chartbook are limited by ACS
occupational groupings because of the methods by which the ACS collects and reports SOC data.
For example, although the SOC has two separate groupings for “medical and clinical laboratory
technologists” and “medical and clinical laboratory technicians,” the ACS only reports on
“medical and clinical laboratory technologists and technicians” as a single occupational grouping
and does not report the two occupations separately.
The Chartbook is divided into four main parts for ease of reporting. Part I comprises clinicians.
Part II presents additional clinician categories and occupations concerned with health care
administration duties. Part III discusses health-related technologists and technicians as well as
aides and assistants. Part IV describes behavioral and allied health occupations.
DATA SOURCES
Data for this Chartbook come primarily from two federal agencies: the U.S. Census Bureau and
the U.S. Department of Education.
The U.S. Census Bureau’s American Community Survey (ACS): The ACS, a household
survey, provides detailed self-reported data including demographic information (e.g., age, race,
and sex data) on individuals working in the health occupations and is the major source of data for
this report.
The U.S. Department of Education’s Integrated Postsecondary Education System (IPEDS):
IPEDS data are used to measure the educational pipeline into the health occupations. IPEDS
provides enrollment and graduation data on an annual basis for all institutions that receive or
apply for federal funds. The number of graduates, by degree type, is presented for occupations
for which there is a specific educational pathway into the occupation. No data are reported for
those occupations without a distinct educational pathway.
Descriptions of the educational and training requirements for the various occupations have been
obtained from the BLS, Occupational Outlook Handbook, 2012-13 Edition.
Also, data from HRSA’s Area Resource File (ARF) are included in this Chartbook. The ARF is
a comprehensive, county-level source of health workforce and other health resources data.
Included in the ARF are data from the American College of Nurse-Midwives (ACNM) and the
Centers for Medicare & Medicaid Services’ National Provider Identification (NPI) file. The NPI
file contains data on health professionals that require unique identification for federal billing
(e.g., Medicare and Medicaid), private insurance, and other purposes. In this report, NPI data in
the ARF have been used for cases in which ACS data were not available (i.e., nurse practitioners
and nurse anesthetists).
Details on the data sources, definitions and analysis, and other information provided in the
Chartbook are available in the The U.S. Health Workforce Chartbook: Technical
Documentation, which can be found at http://bhpr.hrsa.gov/healthworkforce/index.html. Also,
more detailed information on the work settings used in this report can be found on the U.S.
Census Bureau website at www.census.gov/eos/www/naics.
November 2013 The U.S. Health Workforce Chartbook- Part IV 2
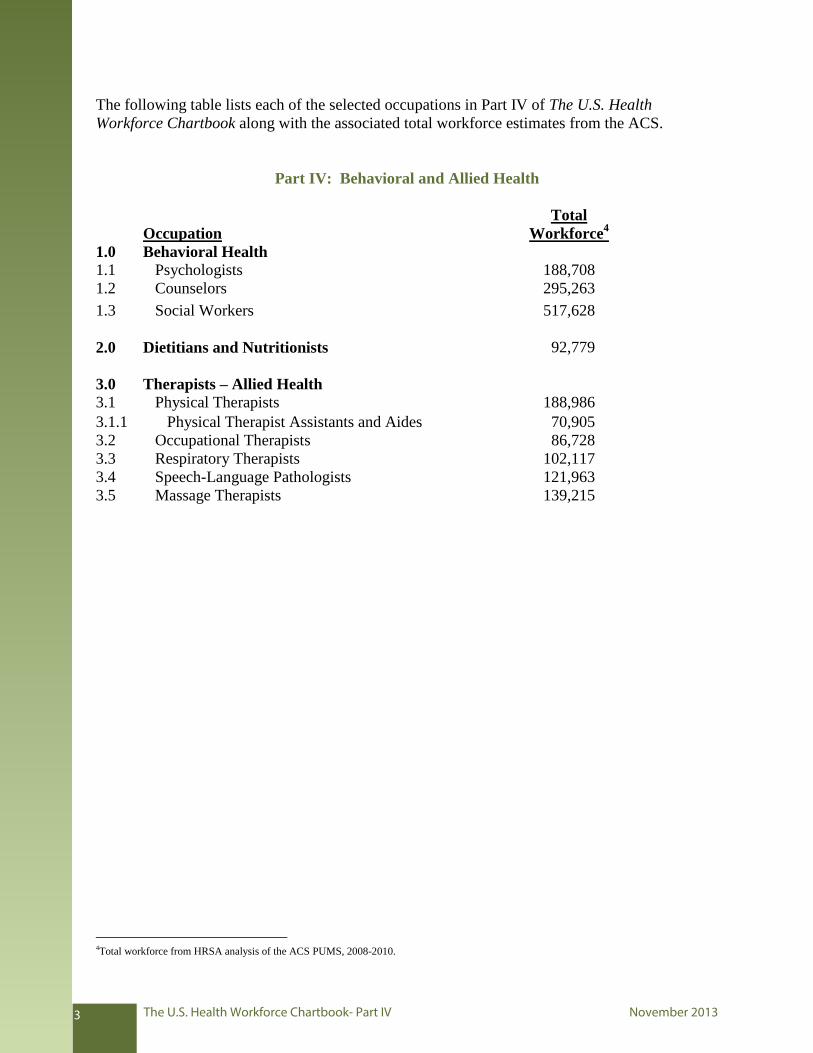
The following table lists each of the selected occupations in Part IV of The U.S. Health
Workforce Chartbook along with the associated total workforce estimates from the ACS.
Part IV: Behavioral and Allied Health
Occupation
Total
Workforce4
1.0 Behavioral Health
1.1 Psychologists 188,708
1.2 Counselors 295,263
1.3 Social Workers 517,628
2.0 Dietitians and Nutritionists 92,779
3.0 Therapists – Allied Health
3.1 Physical Therapists 188,986
3.1.1 Physical Therapist Assistants and Aides 70,905
3.2 Occupational Therapists 86,728
3.3 Respiratory Therapists 102,117
3.4 Speech-Language Pathologists 121,963
3.5 Massage Therapists 139,215
4Total workforce from HRSA analysis of the ACS PUMS, 2008-2010.
The U.S. Health Workforce Chartbook- Part IV November 20133
1.0 BEHAVIORAL HEALTH
A variety of occupations provide behavioral health services for which data are not readily
available. In the ACS, some of these occupations are included among larger occupational
groupings. For example, psychiatrists are reported under physicians, and psychiatric nurses are
reported among registered nurses.
The Behavioral Health occupations described in this section include:
1.1 Psychologists;
1.2 Counselors; and
1.3 Social Workers.
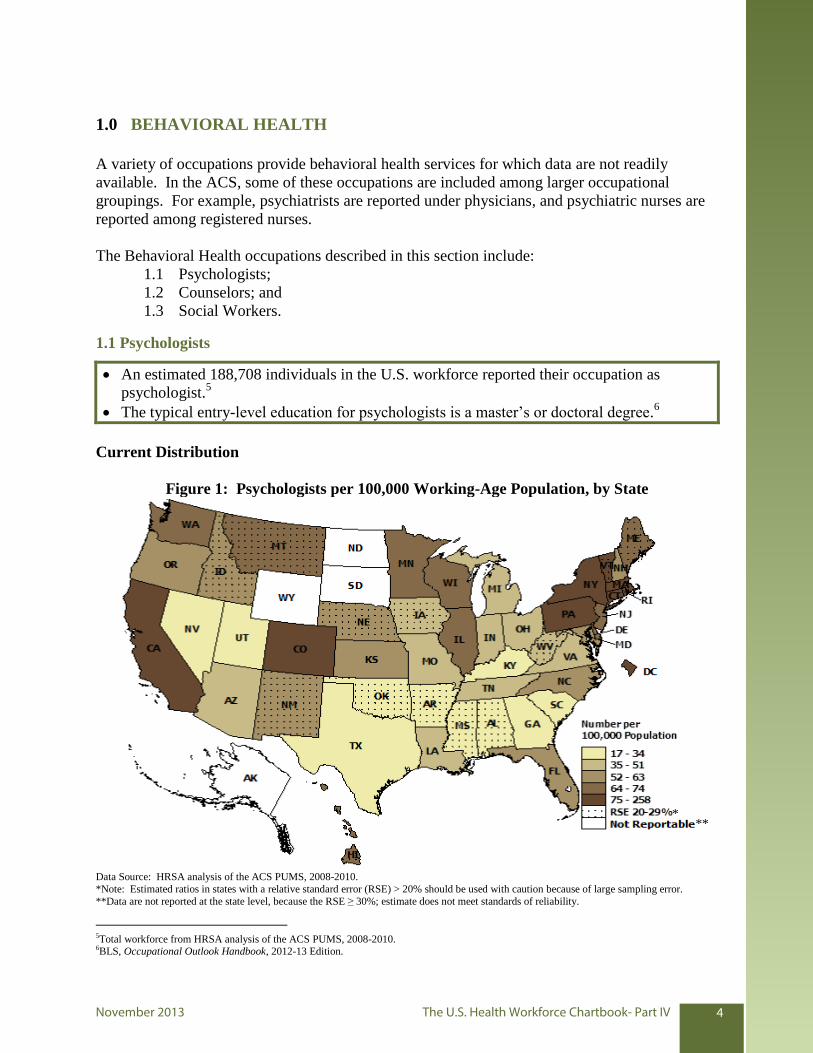
1.1 Psychologists
An estimated 188,708 individuals in the U.S. workforce reported their occupation as
psychologist.5
The typical entry-level education for psychologists is a master’s or doctoral degree.6
Current Distribution
Figure 1: Psychologists per 100,000 Working-Age Population, by State
Data Source: HRSA analysis of the ACS PUMS, 2008-2010.
*Note: Estimated ratios in states with a relative standard error (RSE) > 20% should be used with caution because of large sampling error.
**Data are not reported at the state level, because the RSE ≥ 30%; estimate does not meet standards of reliability.
5Total workforce from HRSA analysis of the ACS PUMS, 2008-2010. 6BLS, Occupational Outlook Handbook, 2012-13 Edition.
* **
November 2013 The U.S. Health Workforce Chartbook- Part IV 4
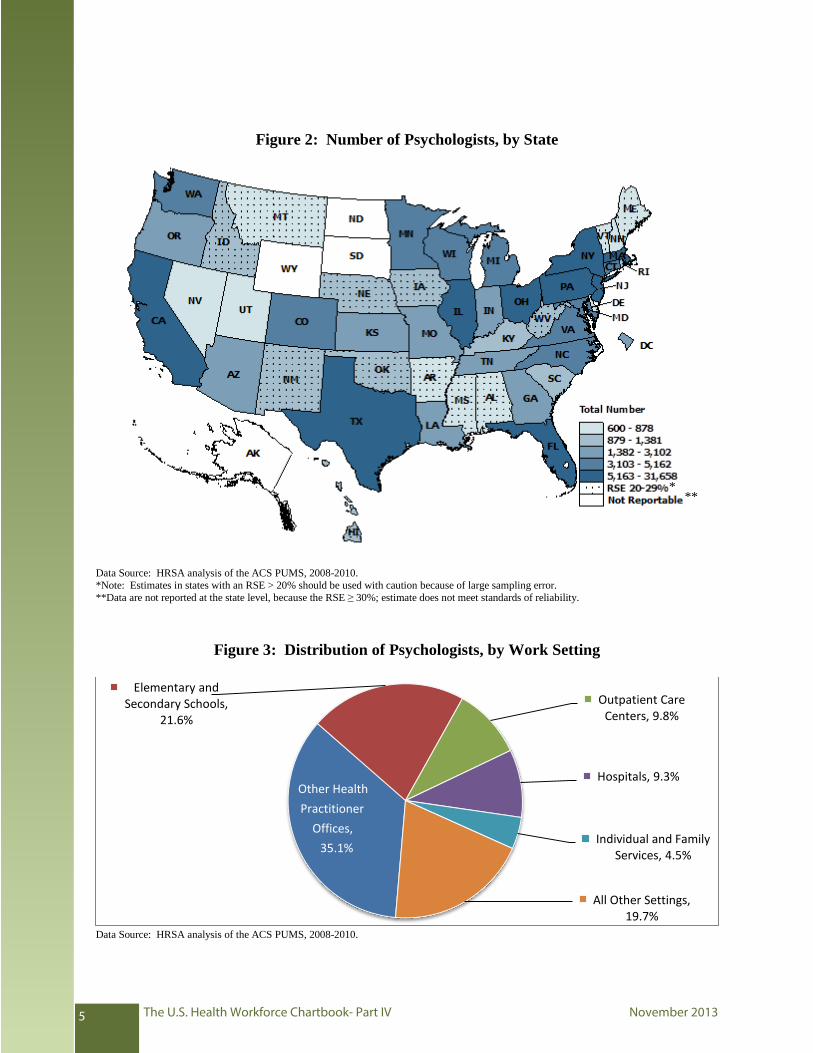
Figure 2: Number of Psychologists, by State
Data Source: HRSA analysis of the ACS PUMS, 2008-2010.
*Note: Estimates in states with an RSE > 20% should be used with caution because of large sampling error.
**Data are not reported at the state level, because the RSE ≥ 30%; estimate does not meet standards of reliability.
Figure 3: Distribution of Psychologists, by Work Setting
Other Health
Practitioner
Offices,
35.1%
Elementary and Secondary Schools,
21.6%
Outpatient Care Centers, 9.8%
Hospitals, 9.3%
Individual and Family Services, 4.5%
All Other Settings, 19.7%
Data Source: HRSA analysis of the ACS PUMS, 2008-2010.
* **
The U.S. Health Workforce Chartbook- Part IV November 20135
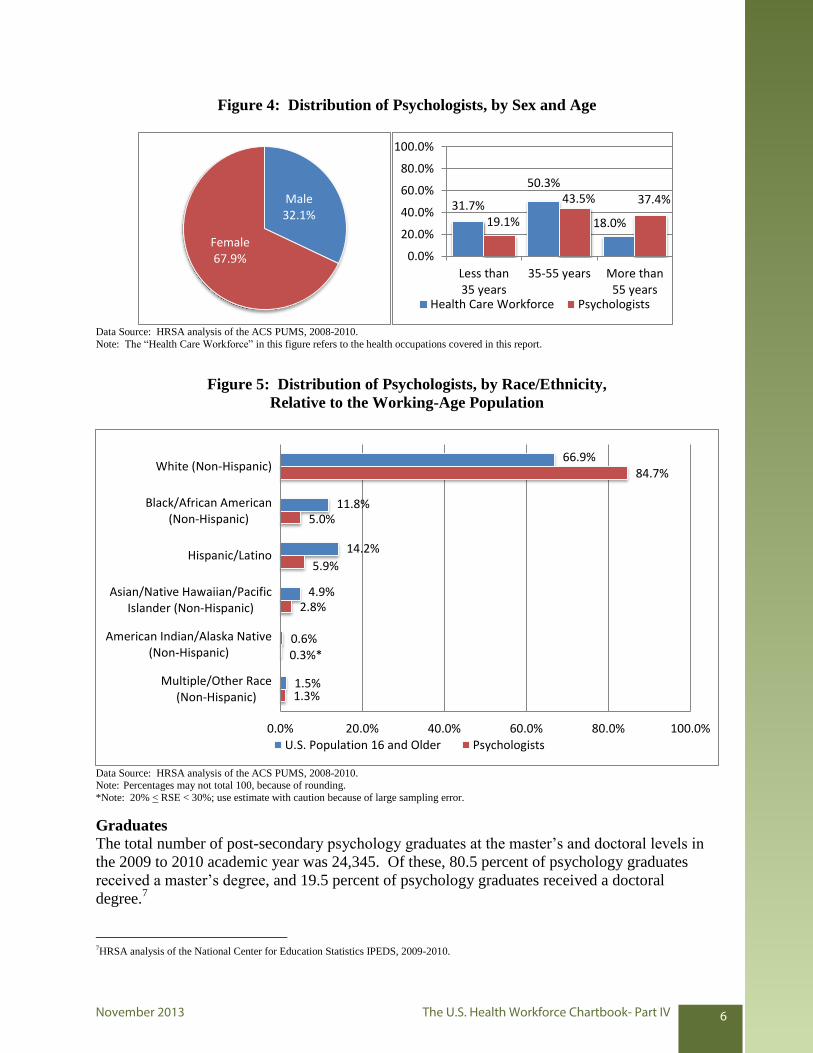
Figure 4: Distribution of Psychologists, by Sex and Age
Male 32.1%
Female 67.9%
31.7%
50.3%
18.0% 19.1%
43.5% 37.4%
0.0%
20.0%
40.0%
60.0%
80.0%
100.0%
Less than35 years
35-55 years More than55 years
Health Care Workforce Psychologists
Data Source: HRSA analysis of the ACS PUMS, 2008-2010.
Note: The “Health Care Workforce” in this figure refers to the health occupations covered in this report.
Figure 5: Distribution of Psychologists, by Race/Ethnicity,
Relative to the Working-Age Population
Data Source: HRSA analysis of the ACS PUMS, 2008-2010. Note: Percentages may not total 100, because of rounding.
*Note: 20% < RSE < 30%; use estimate with caution because of large sampling error.
Graduates
The total number of post-secondary psychology graduates at the master’s and doctoral levels in
the 2009 to 2010 academic year was 24,345. Of these, 80.5 percent of psychology graduates
received a master’s degree, and 19.5 percent of psychology graduates received a doctoral
degree.7
7HRSA analysis of the National Center for Education Statistics IPEDS, 2009-2010.
66.9%
11.8%
14.2%
4.9%
0.6%
1.5%
84.7%
5.0%
5.9%
2.8%
0.3%*
1.3%
0.0% 20.0% 40.0% 60.0% 80.0% 100.0%
White (Non-Hispanic)
Black/African American(Non-Hispanic)
Hispanic/Latino
Asian/Native Hawaiian/PacificIslander (Non-Hispanic)
American Indian/Alaska Native(Non-Hispanic)
Multiple/Other Race(Non-Hispanic)
U.S. Population 16 and Older Psychologists
November 2013 The U.S. Health Workforce Chartbook- Part IV 6
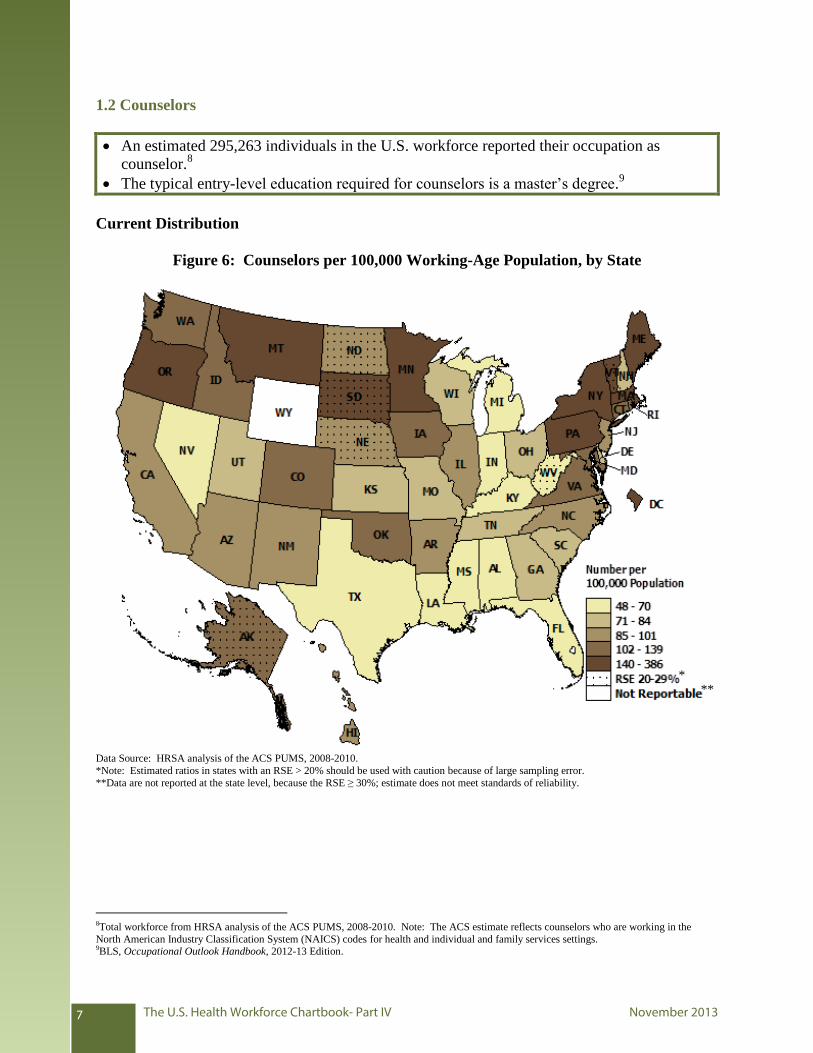
1.2 Counselors
An estimated 295,263 individuals in the U.S. workforce reported their occupation as
counselor.8
The typical entry-level education required for counselors is a master’s degree.9
Current Distribution
Figure 6: Counselors per 100,000 Working-Age Population, by State
Data Source: HRSA analysis of the ACS PUMS, 2008-2010.
*Note: Estimated ratios in states with an RSE > 20% should be used with caution because of large sampling error.
**Data are not reported at the state level, because the RSE ≥ 30%; estimate does not meet standards of reliability.
8Total workforce from HRSA analysis of the ACS PUMS, 2008-2010. Note: The ACS estimate reflects counselors who are working in the
North American Industry Classification System (NAICS) codes for health and individual and family services settings. 9BLS, Occupational Outlook Handbook, 2012-13 Edition.
* **
The U.S. Health Workforce Chartbook- Part IV November 20137
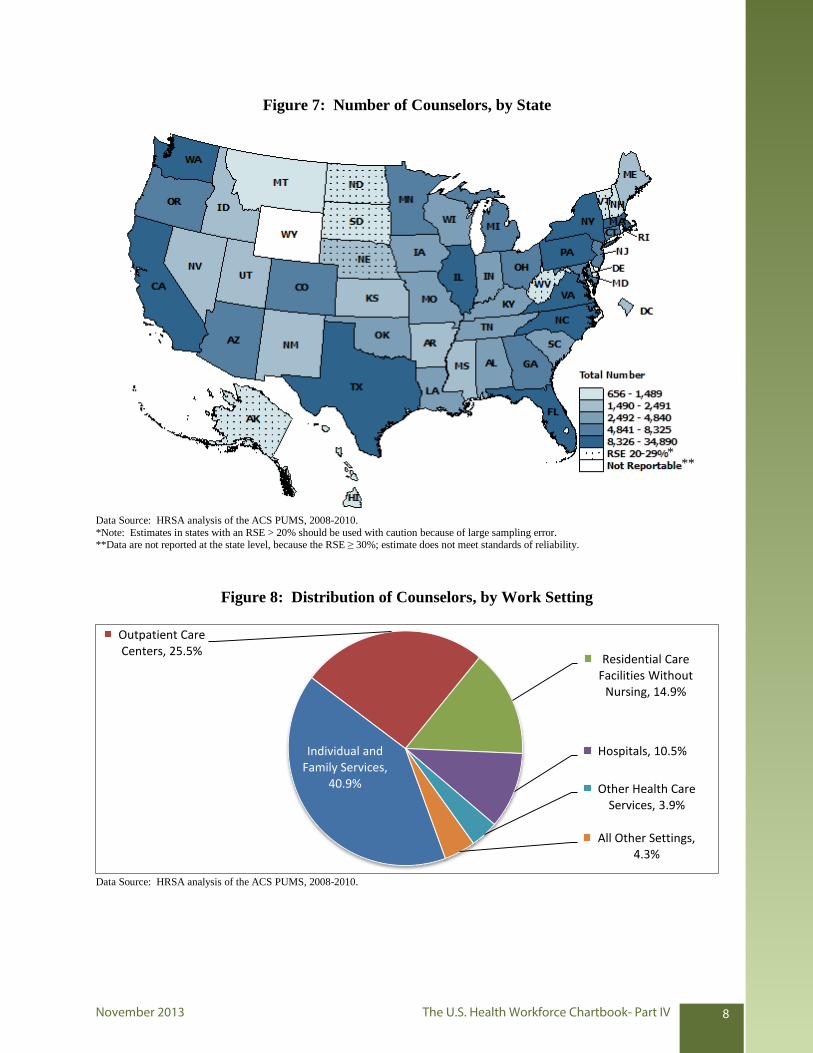
Figure 7: Number of Counselors, by State
Data Source: HRSA analysis of the ACS PUMS, 2008-2010.
*Note: Estimates in states with an RSE > 20% should be used with caution because of large sampling error.**Data are not reported at the state level, because the RSE ≥ 30%; estimate does not meet standards of reliability.
Figure 8: Distribution of Counselors, by Work Setting
Data Source: HRSA analysis of the ACS PUMS, 2008-2010.
Individual and Family Services,
40.9%
Outpatient Care Centers, 25.5%
Residential Care Facilities Without
Nursing, 14.9%
Hospitals, 10.5%
Other Health Care Services, 3.9%
All Other Settings, 4.3%
* **
November 2013 The U.S. Health Workforce Chartbook- Part IV 8
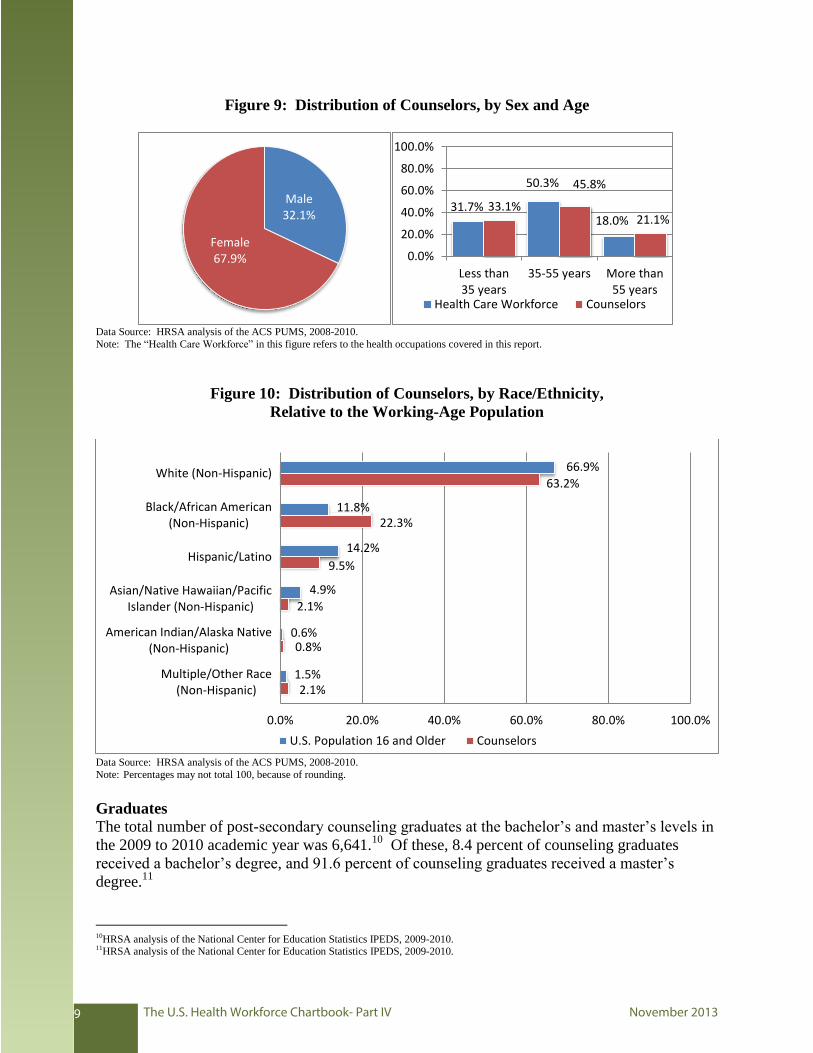
Figure 9: Distribution of Counselors, by Sex and Age
Male 32.1%
Female 67.9%
31.7%
50.3%
18.0% 33.1%
45.8%
21.1%
0.0%
20.0%
40.0%
60.0%
80.0%
100.0%
Less than35 years
35-55 years More than55 years
Health Care Workforce Counselors
Data Source: HRSA analysis of the ACS PUMS, 2008-2010.
Note: The “Health Care Workforce” in this figure refers to the health occupations covered in this report.
Figure 10: Distribution of Counselors, by Race/Ethnicity,
Relative to the Working-Age Population
Data Source: HRSA analysis of the ACS PUMS, 2008-2010.
Note: Percentages may not total 100, because of rounding.
Graduates
The total number of post-secondary counseling graduates at the bachelor’s and master’s levels in
the 2009 to 2010 academic year was 6,641.10
Of these, 8.4 percent of counseling graduates
received a bachelor’s degree, and 91.6 percent of counseling graduates received a master’s
degree.11
10HRSA analysis of the National Center for Education Statistics IPEDS, 2009-2010. 11HRSA analysis of the National Center for Education Statistics IPEDS, 2009-2010.
66.9%
11.8%
14.2%
4.9%
0.6%
1.5%
63.2%
22.3%
9.5%
2.1%
0.8%
2.1%
0.0% 20.0% 40.0% 60.0% 80.0% 100.0%
White (Non-Hispanic)
Black/African American(Non-Hispanic)
Hispanic/Latino
Asian/Native Hawaiian/PacificIslander (Non-Hispanic)
American Indian/Alaska Native(Non-Hispanic)
Multiple/Other Race(Non-Hispanic)
U.S. Population 16 and Older Counselors
The U.S. Health Workforce Chartbook- Part IV November 20139
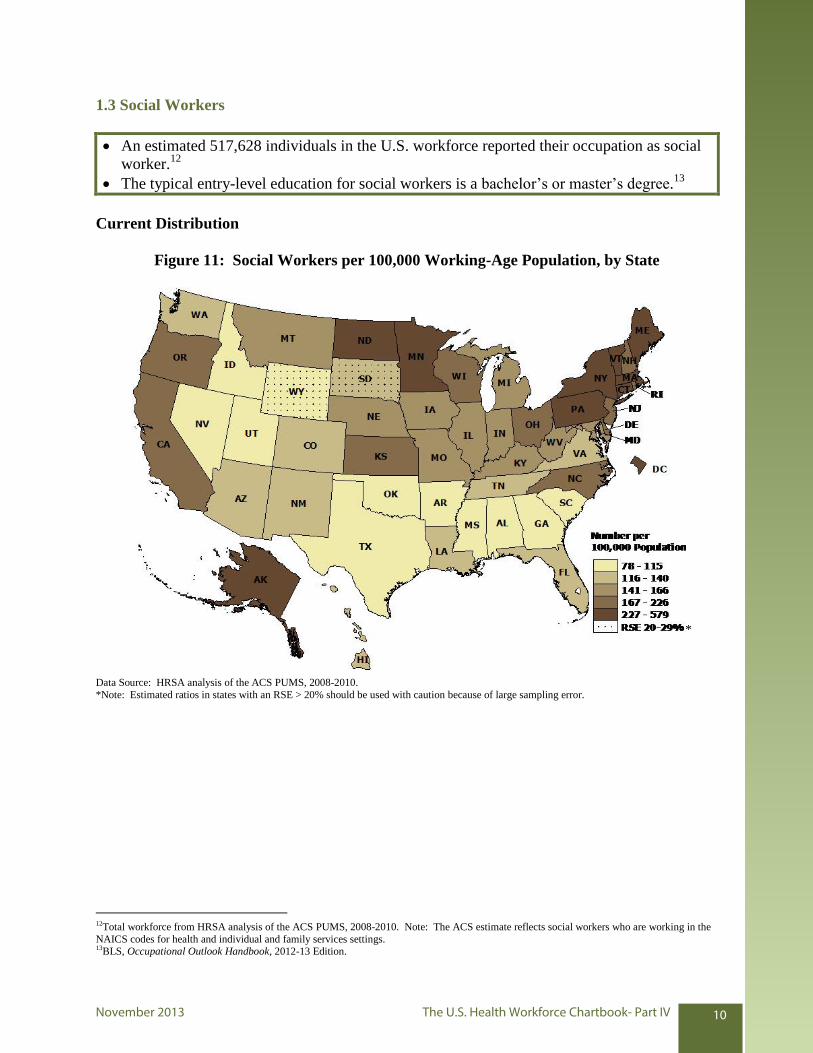
1.3 Social Workers
An estimated 517,628 individuals in the U.S. workforce reported their occupation as social
worker.12
The typical entry-level education for social workers is a bachelor’s or master’s degree.13
Current Distribution
Figure 11: Social Workers per 100,000 Working-Age Population, by State
Data Source: HRSA analysis of the ACS PUMS, 2008-2010.
*Note: Estimated ratios in states with an RSE > 20% should be used with caution because of large sampling error.
12Total workforce from HRSA analysis of the ACS PUMS, 2008-2010. Note: The ACS estimate reflects social workers who are working in the
NAICS codes for health and individual and family services settings. 13BLS, Occupational Outlook Handbook, 2012-13 Edition.
*
November 2013 The U.S. Health Workforce Chartbook- Part IV 10
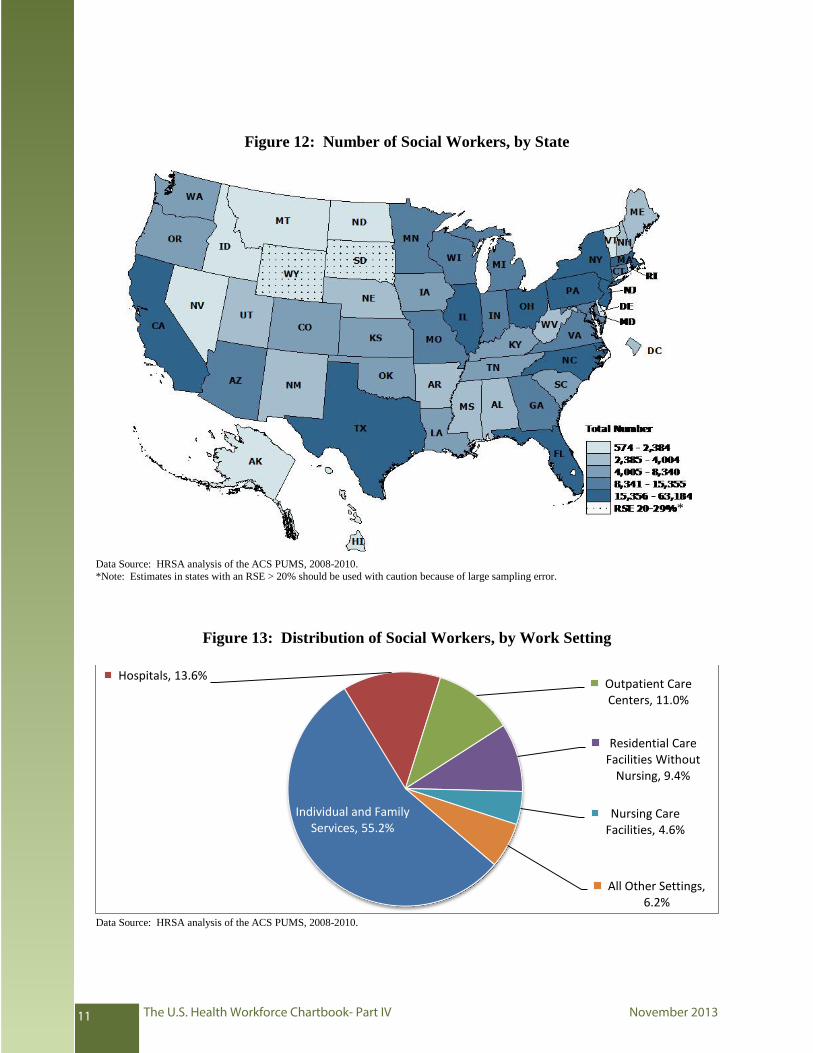
Figure 12: Number of Social Workers, by State
Data Source: HRSA analysis of the ACS PUMS, 2008-2010.
*Note: Estimates in states with an RSE > 20% should be used with caution because of large sampling error.
Figure 13: Distribution of Social Workers, by Work Setting
Data Source: HRSA analysis of the ACS PUMS, 2008-2010.
Individual and Family Services, 55.2%
Hospitals, 13.6% Outpatient Care Centers, 11.0%
Residential Care Facilities Without
Nursing, 9.4%
Nursing Care Facilities, 4.6%
All Other Settings, 6.2%
*
The U.S. Health Workforce Chartbook- Part IV November 201311
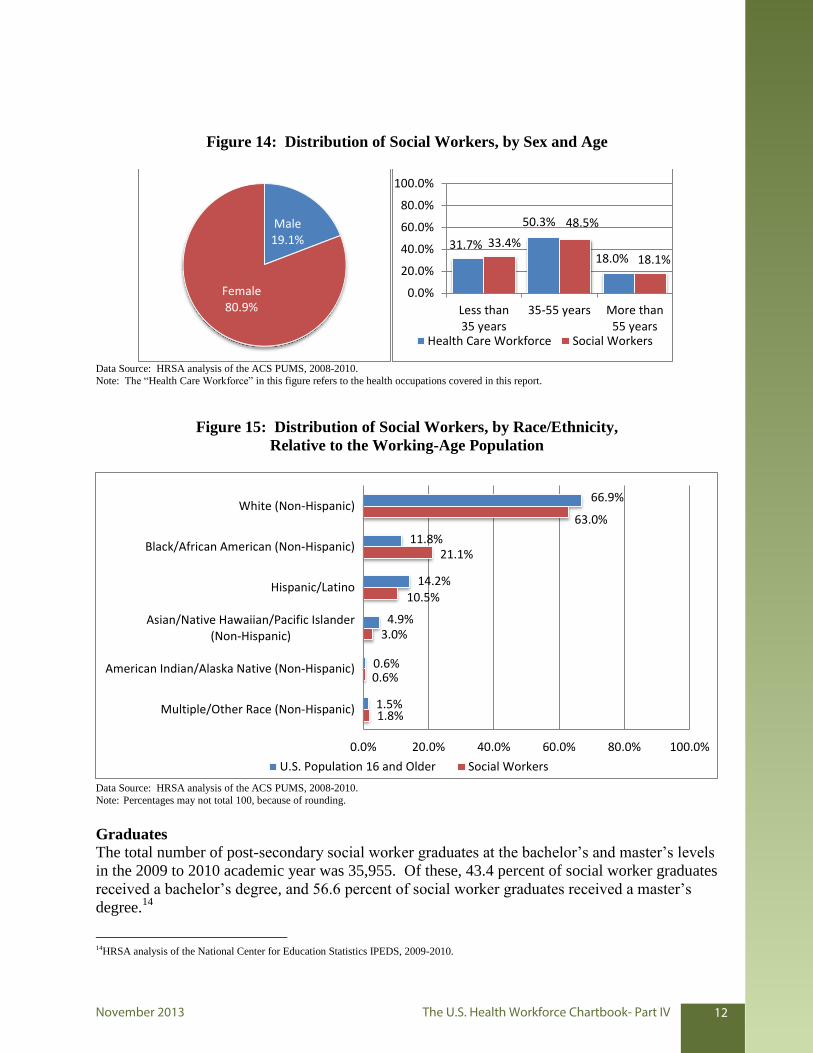
Figure 14: Distribution of Social Workers, by Sex and Age
Male 19.1%
Female 80.9%
31.7%
50.3%
18.0%
33.4%
48.5%
18.1%
0.0%
20.0%
40.0%
60.0%
80.0%
100.0%
Less than35 years
35-55 years More than55 years
Health Care Workforce Social Workers
Data Source: HRSA analysis of the ACS PUMS, 2008-2010.
Note: The “Health Care Workforce” in this figure refers to the health occupations covered in this report.
Figure 15: Distribution of Social Workers, by Race/Ethnicity,
Relative to the Working-Age Population
Data Source: HRSA analysis of the ACS PUMS, 2008-2010.
Note: Percentages may not total 100, because of rounding.
Graduates
The total number of post-secondary social worker graduates at the bachelor’s and master’s levels
in the 2009 to 2010 academic year was 35,955. Of these, 43.4 percent of social worker graduates
received a bachelor’s degree, and 56.6 percent of social worker graduates received a master’s
degree.14
14HRSA analysis of the National Center for Education Statistics IPEDS, 2009-2010.
66.9%
11.8%
14.2%
4.9%
0.6%
1.5%
63.0%
21.1%
10.5%
3.0%
0.6%
1.8%
0.0% 20.0% 40.0% 60.0% 80.0% 100.0%
White (Non-Hispanic)
Black/African American (Non-Hispanic)
Hispanic/Latino
Asian/Native Hawaiian/Pacific Islander(Non-Hispanic)
American Indian/Alaska Native (Non-Hispanic)
Multiple/Other Race (Non-Hispanic)
U.S. Population 16 and Older Social Workers
November 2013 The U.S. Health Workforce Chartbook- Part IV 12
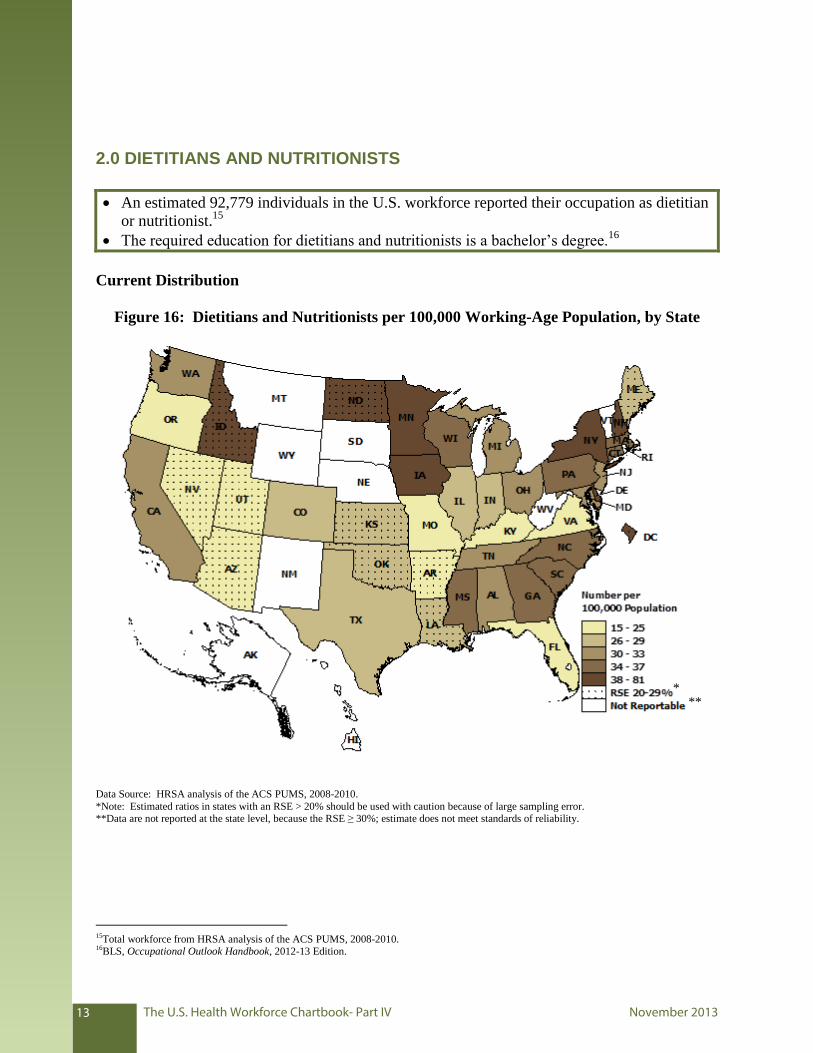
2.0 DIETITIANS AND NUTRITIONISTS
An estimated 92,779 individuals in the U.S. workforce reported their occupation as dietitian
or nutritionist.15
The required education for dietitians and nutritionists is a bachelor’s degree.16
Current Distribution
Figure 16: Dietitians and Nutritionists per 100,000 Working-Age Population, by State
Data Source: HRSA analysis of the ACS PUMS, 2008-2010.
*Note: Estimated ratios in states with an RSE > 20% should be used with caution because of large sampling error.**Data are not reported at the state level, because the RSE ≥ 30%; estimate does not meet standards of reliability.
15Total workforce from HRSA analysis of the ACS PUMS, 2008-2010. 16BLS, Occupational Outlook Handbook, 2012-13 Edition.
* **
The U.S. Health Workforce Chartbook- Part IV November 201313
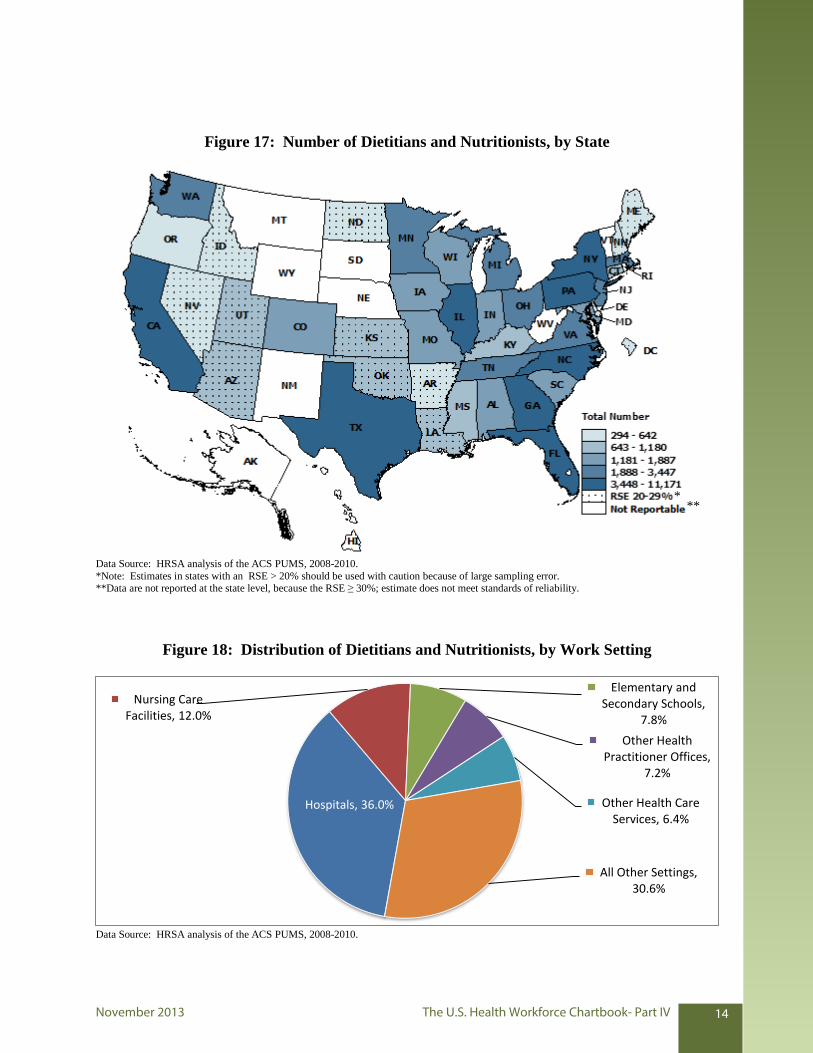
Figure 17: Number of Dietitians and Nutritionists, by State
Data Source: HRSA analysis of the ACS PUMS, 2008-2010.
*Note: Estimates in states with an RSE > 20% should be used with caution because of large sampling error.**Data are not reported at the state level, because the RSE ≥ 30%; estimate does not meet standards of reliability.
Figure 18: Distribution of Dietitians and Nutritionists, by Work Setting
Data Source: HRSA analysis of the ACS PUMS, 2008-2010.
Hospitals, 36.0%
Nursing Care Facilities, 12.0%
Elementary and Secondary Schools,
7.8%
Other Health Practitioner Offices,
7.2%
Other Health Care Services, 6.4%
All Other Settings, 30.6%
* **
November 2013 The U.S. Health Workforce Chartbook- Part IV 14
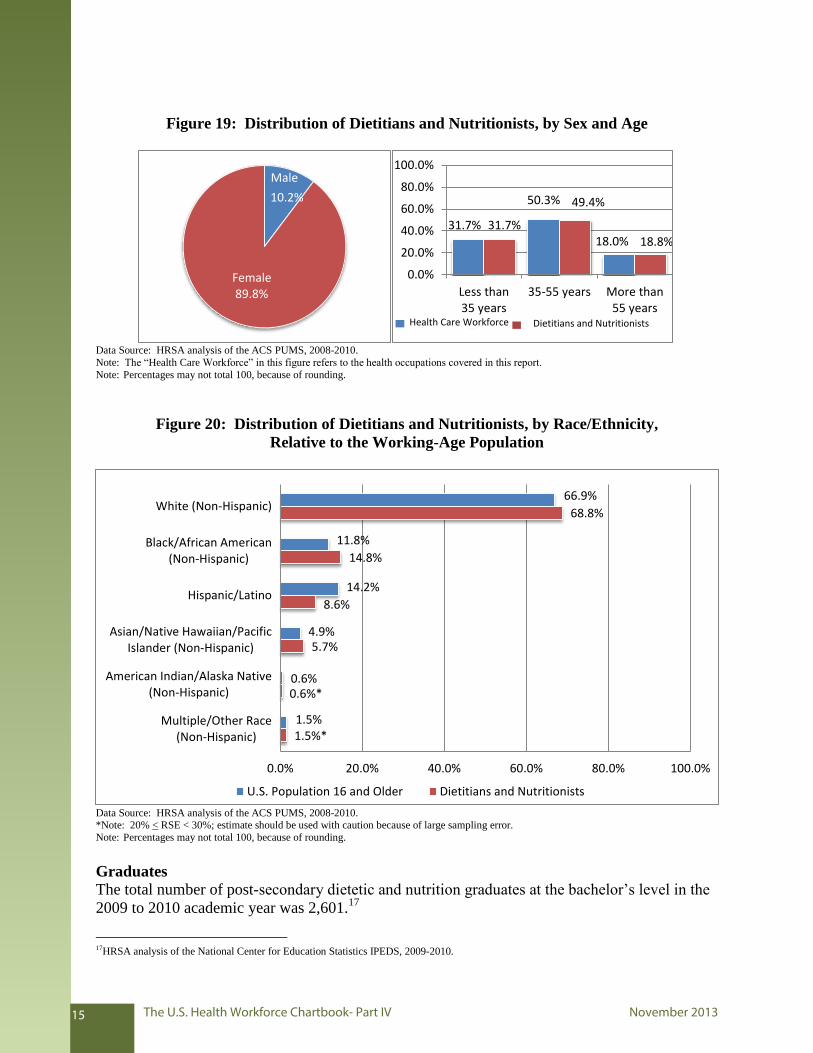
Figure 19: Distribution of Dietitians and Nutritionists, by Sex and Age
Data Source: HRSA analysis of the ACS PUMS, 2008-2010.
Note: The “Health Care Workforce” in this figure refers to the health occupations covered in this report.
Note: Percentages may not total 100, because of rounding.
Figure 20: Distribution of Dietitians and Nutritionists, by Race/Ethnicity,
Relative to the Working-Age Population
Data Source: HRSA analysis of the ACS PUMS, 2008-2010. *Note: 20% < RSE < 30%; estimate should be used with caution because of large sampling error.
Note: Percentages may not total 100, because of rounding.
Graduates
The total number of post-secondary dietetic and nutrition graduates at the bachelor’s level in the
2009 to 2010 academic year was 2,601.17
17HRSA analysis of the National Center for Education Statistics IPEDS, 2009-2010.
Male
10.2%
Female 89.8%
31.7%
50.3%
18.0%
31.7%
49.4%
18.8%
0.0%
20.0%
40.0%
60.0%
80.0%
100.0%
Less than35 years
35-55 years More than55 years
Health Care Workforce
66.9%
11.8%
14.2%
4.9%
0.6%
1.5%
68.8%
14.8%
8.6%
5.7%
0.6%*
1.5%*
0.0% 20.0% 40.0% 60.0% 80.0% 100.0%
White (Non-Hispanic)
Black/African American(Non-Hispanic)
Hispanic/Latino
Asian/Native Hawaiian/PacificIslander (Non-Hispanic)
American Indian/Alaska Native(Non-Hispanic)
Multiple/Other Race(Non-Hispanic)
U.S. Population 16 and Older Dietitians and Nutritionists
Dietitians and Nutritionists
The U.S. Health Workforce Chartbook- Part IV November 201315
3.0 THERAPISTS – ALLIED HEALTH
Allied health occupations and professional groups described in this section include:
3.1 Physical Therapists;
3.2 Occupational Therapists;
3.3 Respiratory Therapists;
3.4 Speech-Language Pathologists; and
3.5 Massage Therapists.
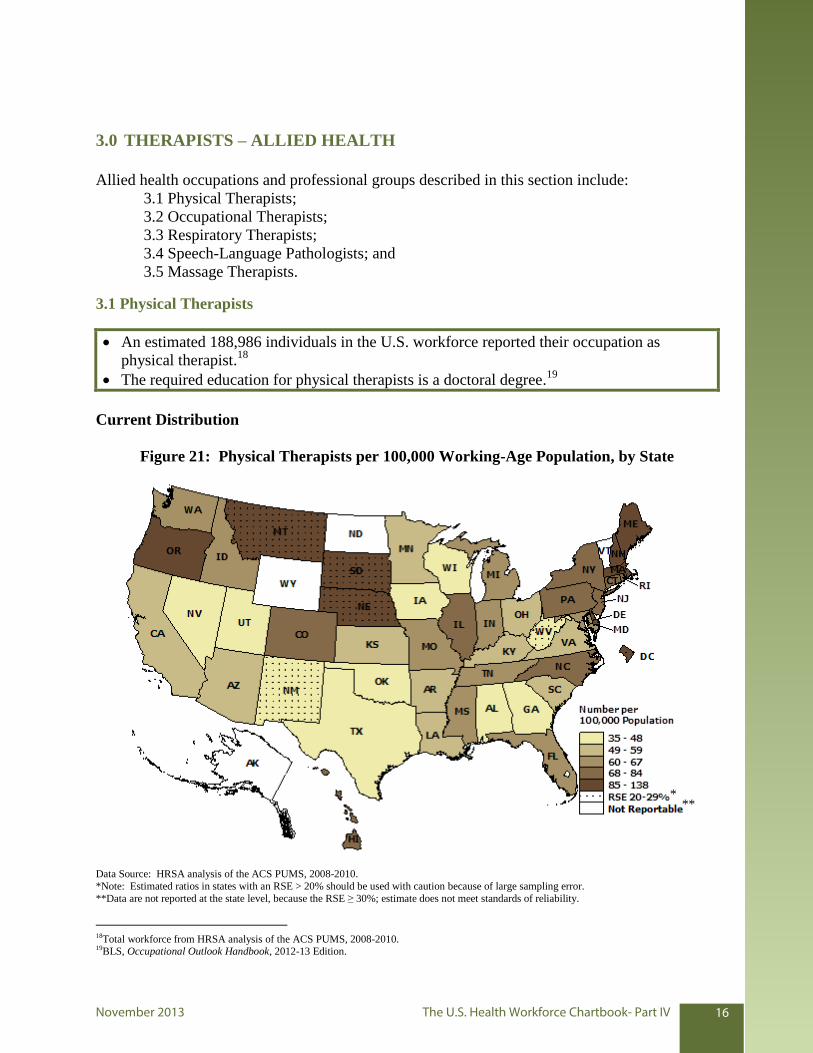
3.1 Physical Therapists
An estimated 188,986 individuals in the U.S. workforce reported their occupation as
physical therapist.18
The required education for physical therapists is a doctoral degree.19
Current Distribution
Figure 21: Physical Therapists per 100,000 Working-Age Population, by State
Data Source: HRSA analysis of the ACS PUMS, 2008-2010.
*Note: Estimated ratios in states with an RSE > 20% should be used with caution because of large sampling error.
**Data are not reported at the state level, because the RSE ≥ 30%; estimate does not meet standards of reliability.
18Total workforce from HRSA analysis of the ACS PUMS, 2008-2010. 19BLS, Occupational Outlook Handbook, 2012-13 Edition.
* **
November 2013 The U.S. Health Workforce Chartbook- Part IV 16
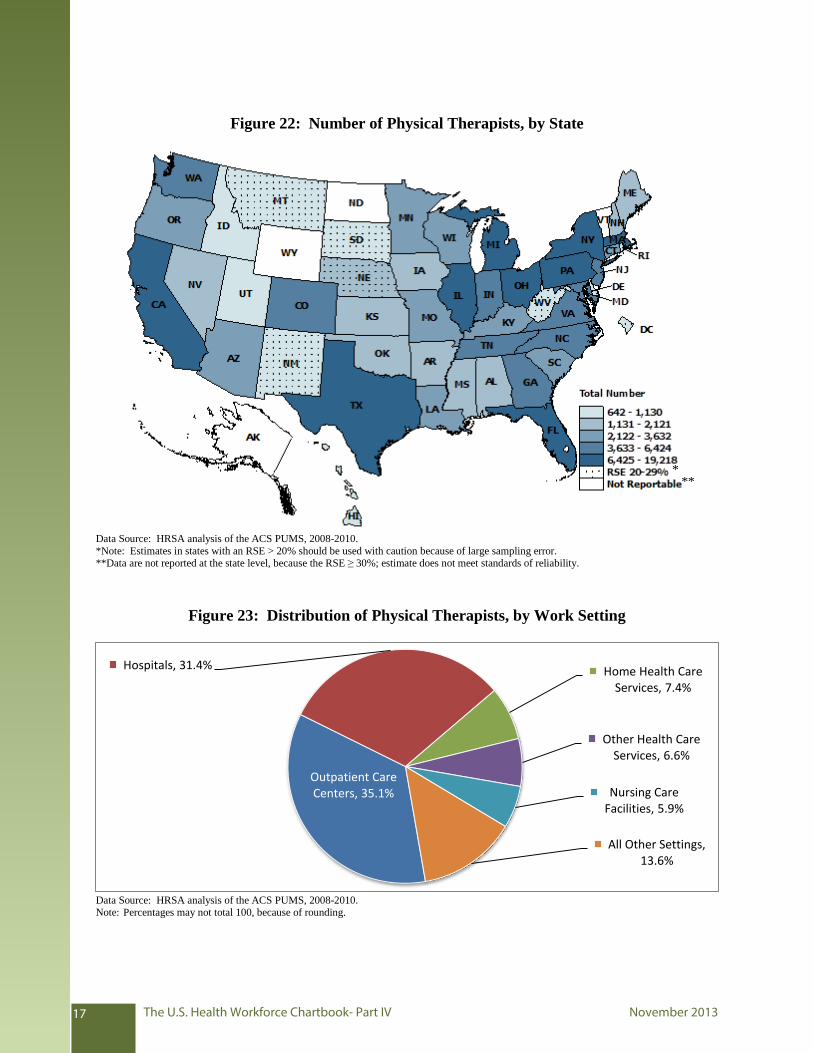
Figure 22: Number of Physical Therapists, by State
Data Source: HRSA analysis of the ACS PUMS, 2008-2010.
*Note: Estimates in states with an RSE > 20% should be used with caution because of large sampling error.**Data are not reported at the state level, because the RSE ≥ 30%; estimate does not meet standards of reliability.
Figure 23: Distribution of Physical Therapists, by Work Setting
Data Source: HRSA analysis of the ACS PUMS, 2008-2010. Note: Percentages may not total 100, because of rounding.
Outpatient Care Centers, 35.1%
Hospitals, 31.4% Home Health Care Services, 7.4%
Other Health Care Services, 6.6%
Nursing Care Facilities, 5.9%
All Other Settings, 13.6%
* **
The U.S. Health Workforce Chartbook- Part IV November 201317
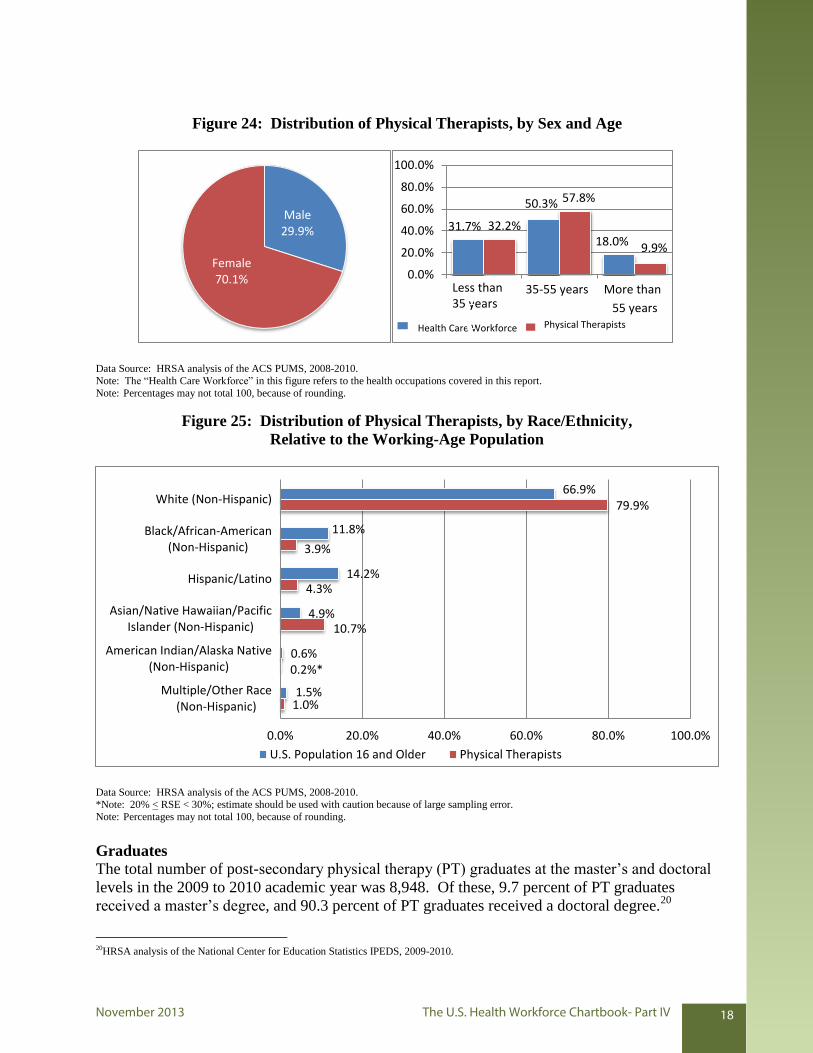
Figure 24: Distribution of Physical Therapists, by Sex and Age
Male 29.9%
Female 70.1%
31.7%
50.3%
18.0% 32.2%
57.8%
9.9%
0.0%
20.0%
40.0%
60.0%
80.0%
100.0%
Less than35 years
Health Care Workforce
35-55 years More than
55 yearsPhysical Therapists
Data Source: HRSA analysis of the ACS PUMS, 2008-2010.
Note: The “Health Care Workforce” in this figure refers to the health occupations covered in this report.
Note: Percentages may not total 100, because of rounding.
Figure 25: Distribution of Physical Therapists, by Race/Ethnicity,
Relative to the Working-Age Population
Data Source: HRSA analysis of the ACS PUMS, 2008-2010.
*Note: 20% < RSE < 30%; estimate should be used with caution because of large sampling error.
Note: Percentages may not total 100, because of rounding.
Graduates
The total number of post-secondary physical therapy (PT) graduates at the master’s and doctoral
levels in the 2009 to 2010 academic year was 8,948. Of these, 9.7 percent of PT graduates
received a master’s degree, and 90.3 percent of PT graduates received a doctoral degree.20
20HRSA analysis of the National Center for Education Statistics IPEDS, 2009-2010.
66.9%
11.8%
14.2%
4.9%
0.6%
1.5%
79.9%
3.9%
4.3%
10.7%
0.2%*
1.0%
0.0% 20.0% 40.0% 60.0% 80.0% 100.0%
White (Non-Hispanic)
Black/African-American(Non-Hispanic)
Hispanic/Latino
Asian/Native Hawaiian/PacificIslander (Non-Hispanic)
American Indian/Alaska Native(Non-Hispanic)
Multiple/Other Race(Non-Hispanic)
U.S. Population 16 and Older Physical Therapists
November 2013 The U.S. Health Workforce Chartbook- Part IV 18
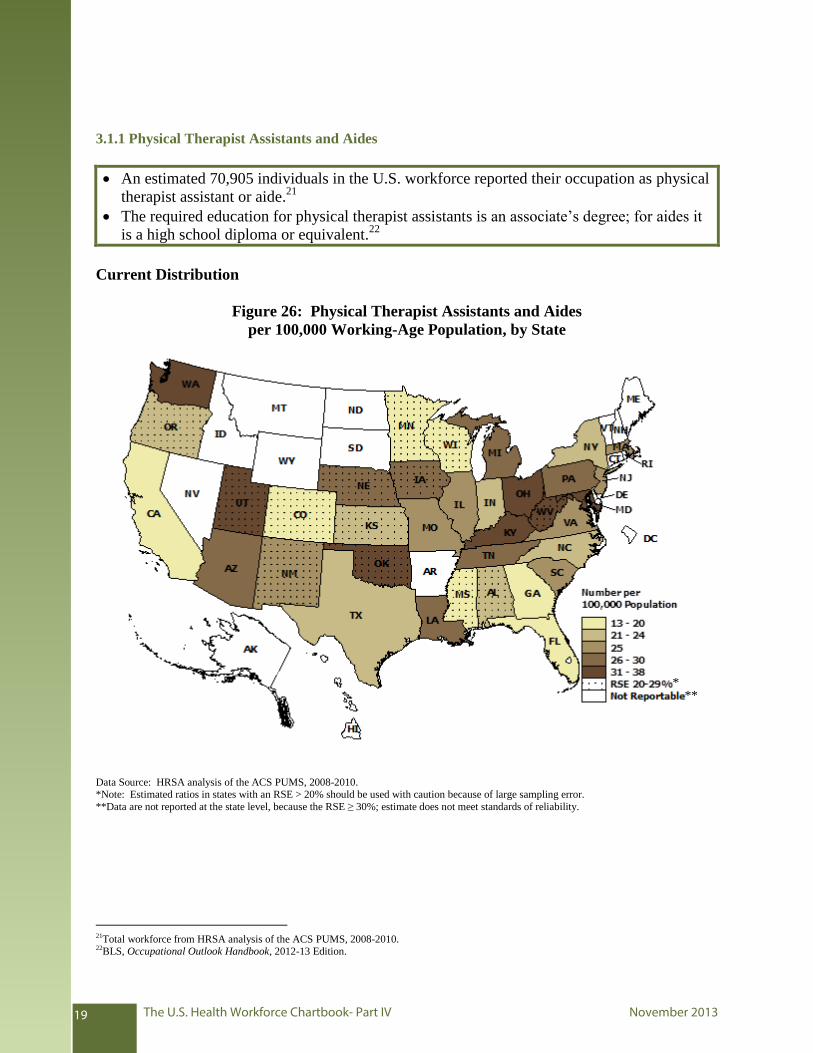
3.1.1 Physical Therapist Assistants and Aides
An estimated 70,905 individuals in the U.S. workforce reported their occupation as physical
therapist assistant or aide.21
The required education for physical therapist assistants is an associate’s degree; for aides it
is a high school diploma or equivalent.22
Current Distribution
Figure 26: Physical Therapist Assistants and Aides
per 100,000 Working-Age Population, by State
Data Source: HRSA analysis of the ACS PUMS, 2008-2010. *Note: Estimated ratios in states with an RSE > 20% should be used with caution because of large sampling error.
**Data are not reported at the state level, because the RSE ≥ 30%; estimate does not meet standards of reliability.
21Total workforce from HRSA analysis of the ACS PUMS, 2008-2010. 22BLS, Occupational Outlook Handbook, 2012-13 Edition.
* **
The U.S. Health Workforce Chartbook- Part IV November 201319
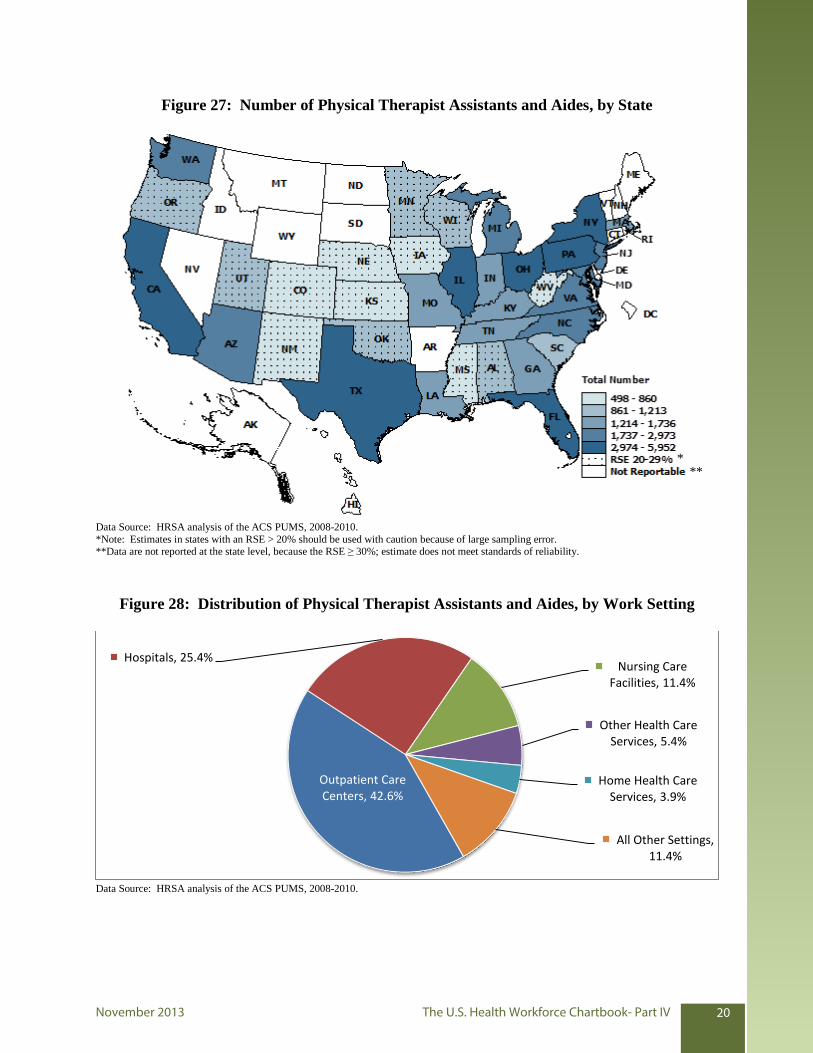
Figure 27: Number of Physical Therapist Assistants and Aides, by State
Data Source: HRSA analysis of the ACS PUMS, 2008-2010.
*Note: Estimates in states with an RSE > 20% should be used with caution because of large sampling error.**Data are not reported at the state level, because the RSE ≥ 30%; estimate does not meet standards of reliability.
Figure 28: Distribution of Physical Therapist Assistants and Aides, by Work Setting
Data Source: HRSA analysis of the ACS PUMS, 2008-2010.
Outpatient Care Centers, 42.6%
Hospitals, 25.4% Nursing Care
Facilities, 11.4%
Other Health Care Services, 5.4%
Home Health Care Services, 3.9%
All Other Settings, 11.4%
* **
November 2013 The U.S. Health Workforce Chartbook- Part IV 20
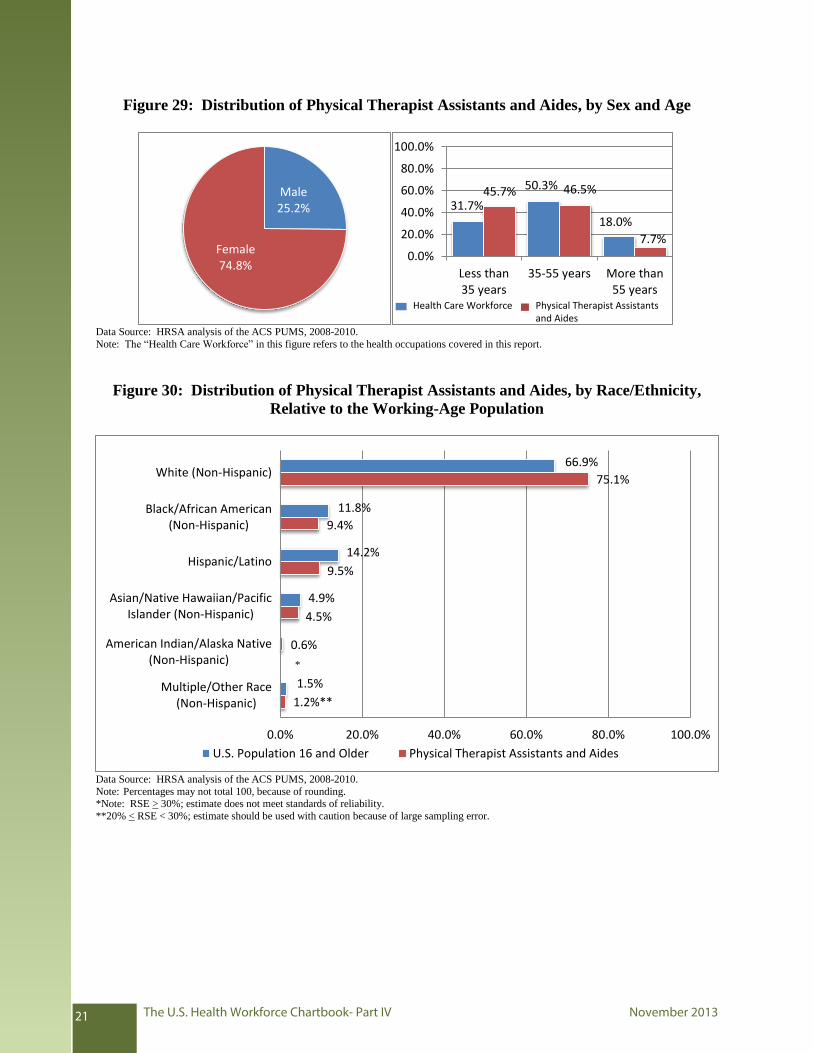
Figure 29: Distribution of Physical Therapist Assistants and Aides, by Sex and Age
Male 25.2%
Female 74.8%
31.7%
50.3%
18.0%
45.7% 46.5%
7.7%
0.0%
20.0%
40.0%
60.0%
80.0%
100.0%
Less than35 years
35-55 years More than55 years
Health Care Workforce
Data Source: HRSA analysis of the ACS PUMS, 2008-2010.
Note: The “Health Care Workforce” in this figure refers to the health occupations covered in this report.
Figure 30: Distribution of Physical Therapist Assistants and Aides, by Race/Ethnicity,
Relative to the Working-Age Population
Data Source: HRSA analysis of the ACS PUMS, 2008-2010.
Note: Percentages may not total 100, because of rounding.
*Note: RSE > 30%; estimate does not meet standards of reliability.
**20% < RSE < 30%; estimate should be used with caution because of large sampling error.
66.9%
11.8%
14.2%
4.9%
0.6%
1.5%
75.1%
9.4%
9.5%
4.5%
1.2%**
0.0% 20.0% 40.0% 60.0% 80.0% 100.0%
White (Non-Hispanic)
Black/African American(Non-Hispanic)
Hispanic/Latino
Asian/Native Hawaiian/PacificIslander (Non-Hispanic)
American Indian/Alaska Native(Non-Hispanic)
Multiple/Other Race(Non-Hispanic)
U.S. Population 16 and Older Physical Therapist Assistants and Aides
*
Physical Therapist Assistants and Aides
The U.S. Health Workforce Chartbook- Part IV November 201321
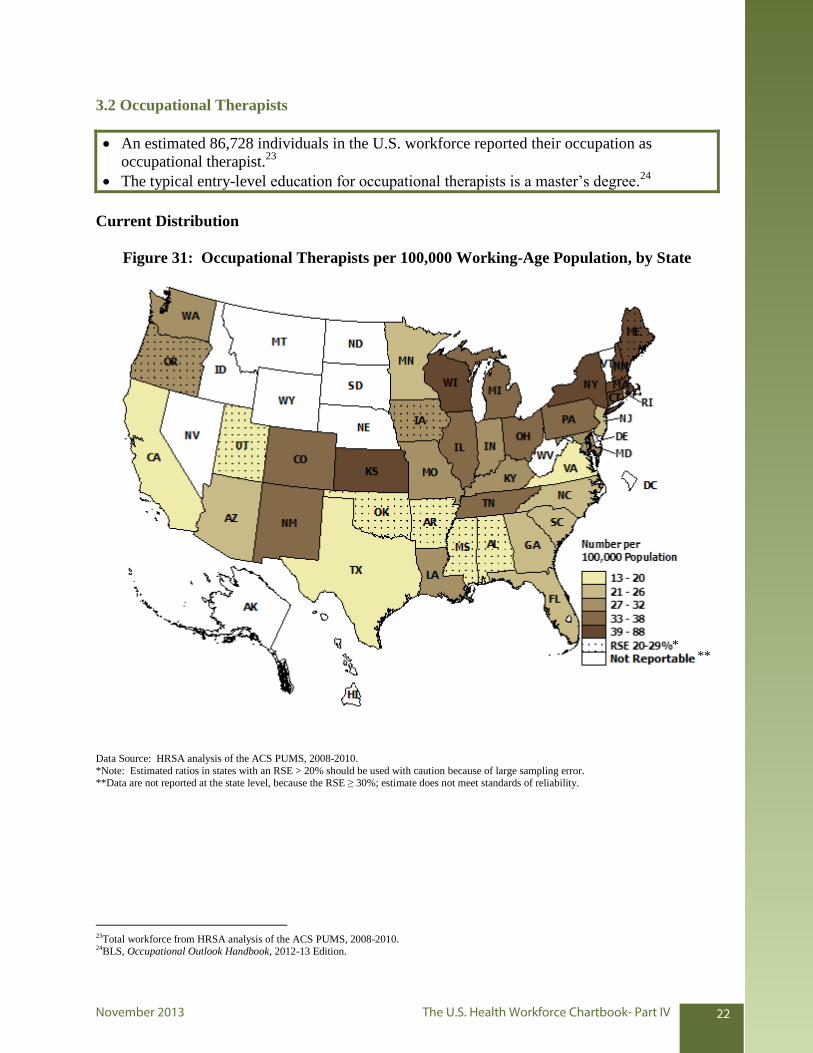
3.2 Occupational Therapists
An estimated 86,728 individuals in the U.S. workforce reported their occupation as
occupational therapist.23
The typical entry-level education for occupational therapists is a master’s degree.24
Current Distribution
Figure 31: Occupational Therapists per 100,000 Working-Age Population, by State
Data Source: HRSA analysis of the ACS PUMS, 2008-2010.
*Note: Estimated ratios in states with an RSE > 20% should be used with caution because of large sampling error.**Data are not reported at the state level, because the RSE ≥ 30%; estimate does not meet standards of reliability.
23Total workforce from HRSA analysis of the ACS PUMS, 2008-2010. 24BLS, Occupational Outlook Handbook, 2012-13 Edition.
* **
November 2013 The U.S. Health Workforce Chartbook- Part IV 22
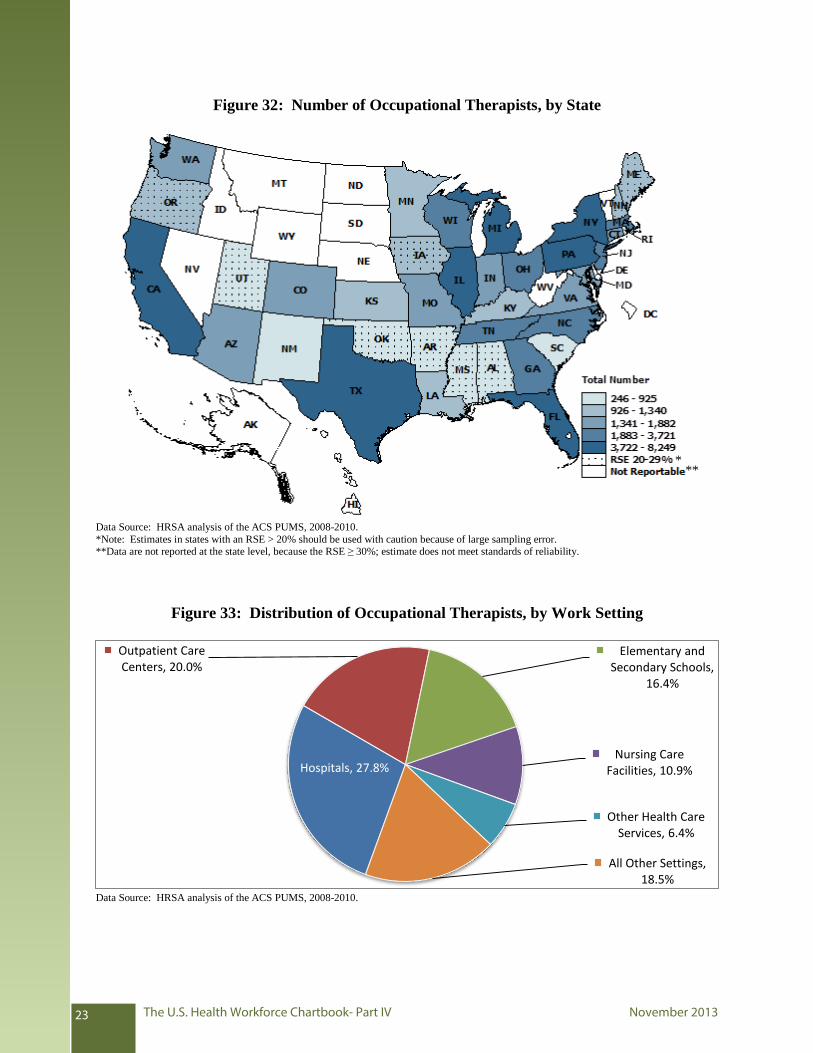
Figure 32: Number of Occupational Therapists, by State
Data Source: HRSA analysis of the ACS PUMS, 2008-2010.
*Note: Estimates in states with an RSE > 20% should be used with caution because of large sampling error.**Data are not reported at the state level, because the RSE ≥ 30%; estimate does not meet standards of reliability.
Figure 33: Distribution of Occupational Therapists, by Work Setting
Data Source: HRSA analysis of the ACS PUMS, 2008-2010.
Hospitals, 27.8%
Outpatient Care Centers, 20.0%
Elementary and Secondary Schools,
16.4%
Nursing Care Facilities, 10.9%
Other Health Care Services, 6.4%
All Other Settings, 18.5%
* **
The U.S. Health Workforce Chartbook- Part IV November 201323
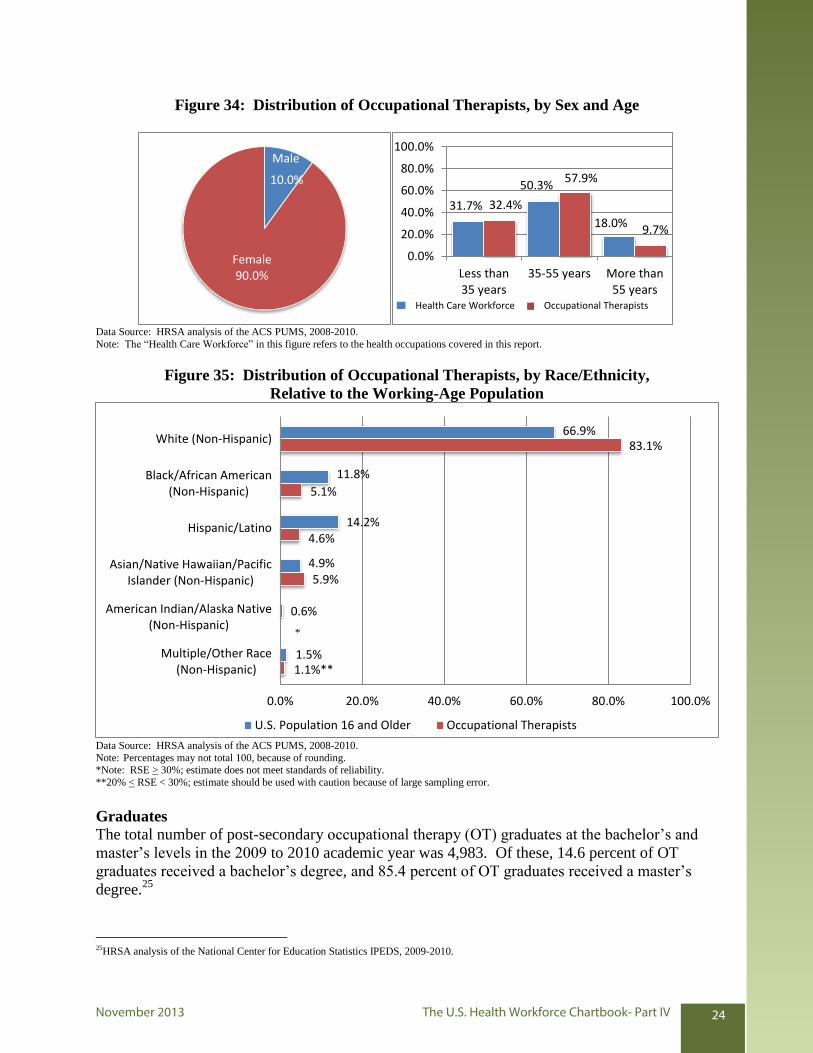
Figure 34: Distribution of Occupational Therapists, by Sex and Age
Male
10.0%
Female 90.0%
31.7%
50.3%
18.0%
32.4%
57.9%
9.7%
0.0%
20.0%
40.0%
60.0%
80.0%
100.0%
Less than35 years
35-55 years More than55 years
Health Care Workforce
Data Source: HRSA analysis of the ACS PUMS, 2008-2010.
Note: The “Health Care Workforce” in this figure refers to the health occupations covered in this report.
Figure 35: Distribution of Occupational Therapists, by Race/Ethnicity,
Relative to the Working-Age Population
Data Source: HRSA analysis of the ACS PUMS, 2008-2010.
Note: Percentages may not total 100, because of rounding. *Note: RSE > 30%; estimate does not meet standards of reliability.
**20% < RSE < 30%; estimate should be used with caution because of large sampling error.
Graduates
The total number of post-secondary occupational therapy (OT) graduates at the bachelor’s and
master’s levels in the 2009 to 2010 academic year was 4,983. Of these, 14.6 percent of OT
graduates received a bachelor’s degree, and 85.4 percent of OT graduates received a master’s
degree.25
25HRSA analysis of the National Center for Education Statistics IPEDS, 2009-2010.
66.9%
11.8%
14.2%
4.9%
0.6%
1.5%
83.1%
5.1%
4.6%
5.9%
1.1%**
0.0% 20.0% 40.0% 60.0% 80.0% 100.0%
White (Non-Hispanic)
Black/African American(Non-Hispanic)
Hispanic/Latino
Asian/Native Hawaiian/PacificIslander (Non-Hispanic)
American Indian/Alaska Native(Non-Hispanic)
Multiple/Other Race(Non-Hispanic)
U.S. Population 16 and Older Occupational Therapists
*
Occupational Therapists
November 2013 The U.S. Health Workforce Chartbook- Part IV 24
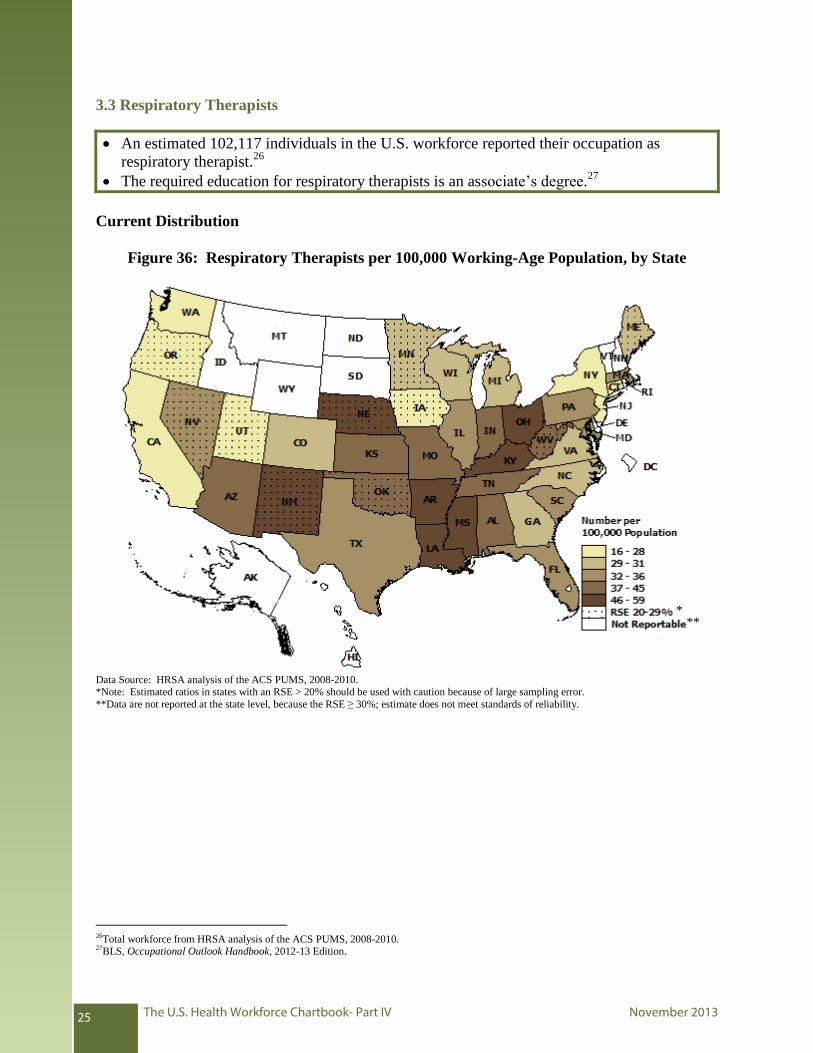
3.3 Respiratory Therapists
An estimated 102,117 individuals in the U.S. workforce reported their occupation as
respiratory therapist.26
The required education for respiratory therapists is an associate’s degree.27
Current Distribution
Figure 36: Respiratory Therapists per 100,000 Working-Age Population, by State
Data Source: HRSA analysis of the ACS PUMS, 2008-2010. *Note: Estimated ratios in states with an RSE > 20% should be used with caution because of large sampling error.
**Data are not reported at the state level, because the RSE ≥ 30%; estimate does not meet standards of reliability.
26Total workforce from HRSA analysis of the ACS PUMS, 2008-2010. 27BLS, Occupational Outlook Handbook, 2012-13 Edition.
* **
The U.S. Health Workforce Chartbook- Part IV November 201325
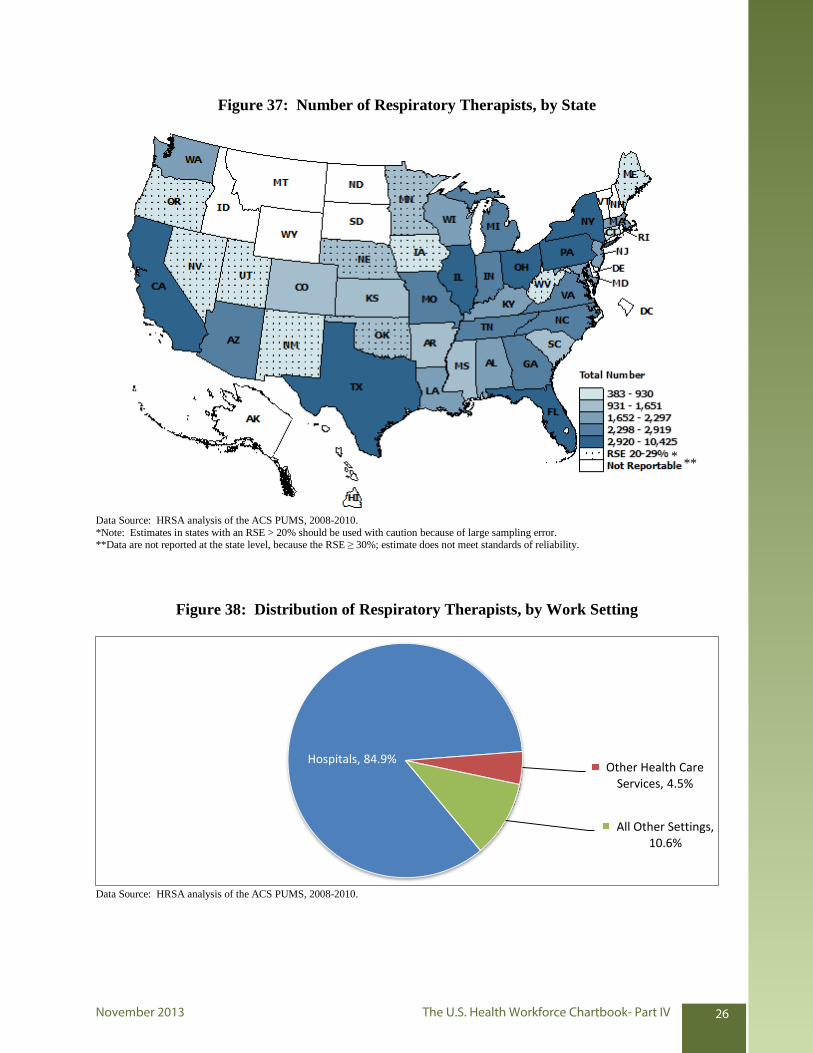
Figure 37: Number of Respiratory Therapists, by State
Data Source: HRSA analysis of the ACS PUMS, 2008-2010.
*Note: Estimates in states with an RSE > 20% should be used with caution because of large sampling error.**Data are not reported at the state level, because the RSE ≥ 30%; estimate does not meet standards of reliability.
Figure 38: Distribution of Respiratory Therapists, by Work Setting
Data Source: HRSA analysis of the ACS PUMS, 2008-2010.
Hospitals, 84.9% Other Health Care
Services, 4.5%
All Other Settings, 10.6%
* **
November 2013 The U.S. Health Workforce Chartbook- Part IV 26
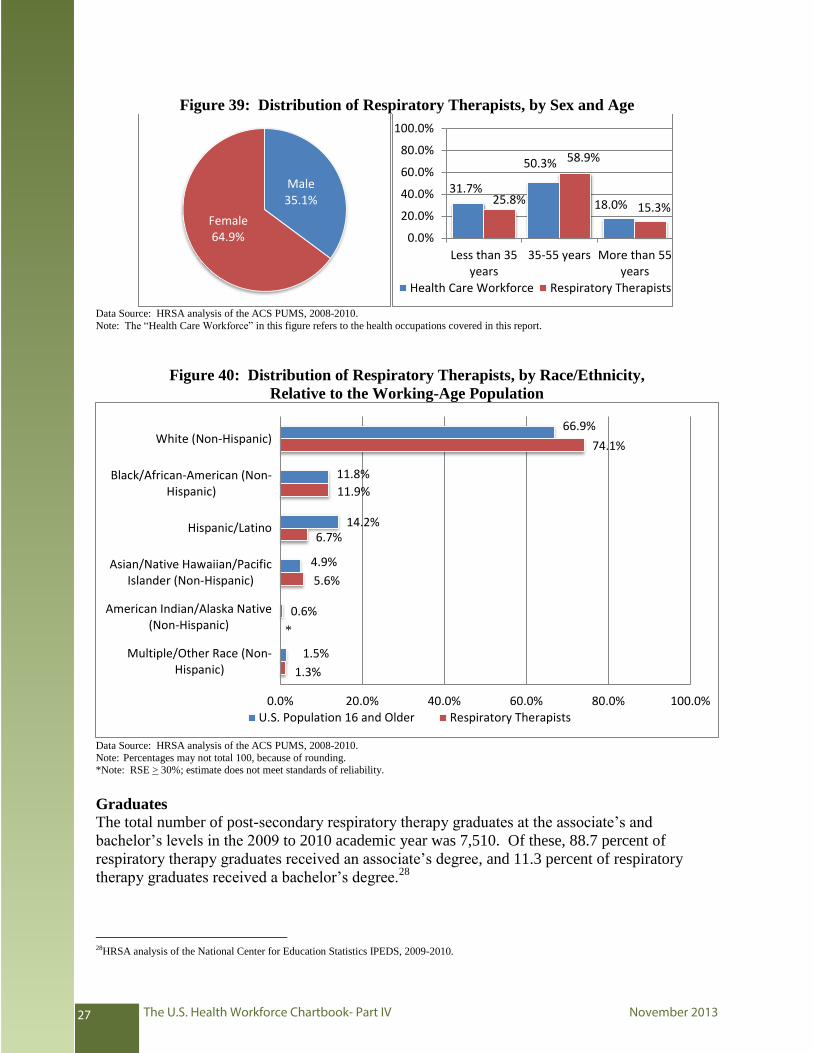
Figure 39: Distribution of Respiratory Therapists, by Sex and Age
Data Source: HRSA analysis of the ACS PUMS, 2008-2010.
Note: The “Health Care Workforce” in this figure refers to the health occupations covered in this report.
Figure 40: Distribution of Respiratory Therapists, by Race/Ethnicity,
Relative to the Working-Age Population
Data Source: HRSA analysis of the ACS PUMS, 2008-2010.
Note: Percentages may not total 100, because of rounding. *Note: RSE > 30%; estimate does not meet standards of reliability.
Graduates
The total number of post-secondary respiratory therapy graduates at the associate’s and
bachelor’s levels in the 2009 to 2010 academic year was 7,510. Of these, 88.7 percent of
respiratory therapy graduates received an associate’s degree, and 11.3 percent of respiratory
therapy graduates received a bachelor’s degree.28
28HRSA analysis of the National Center for Education Statistics IPEDS, 2009-2010.
Male 35.1%
Female 64.9%
31.7%
50.3%
18.0% 25.8%
58.9%
15.3%
0.0%
20.0%
40.0%
60.0%
80.0%
100.0%
Less than 35years
35-55 years More than 55years
Health Care Workforce Respiratory Therapists
66.9%
11.8%
14.2%
4.9%
0.6%
1.5%
74.1%
11.9%
6.7%
5.6%
1.3%
0.0% 20.0% 40.0% 60.0% 80.0% 100.0%
White (Non-Hispanic)
Black/African-American (Non-Hispanic)
Hispanic/Latino
Asian/Native Hawaiian/PacificIslander (Non-Hispanic)
American Indian/Alaska Native(Non-Hispanic)
Multiple/Other Race (Non-Hispanic)
U.S. Population 16 and Older Respiratory Therapists
*
The U.S. Health Workforce Chartbook- Part IV November 201327
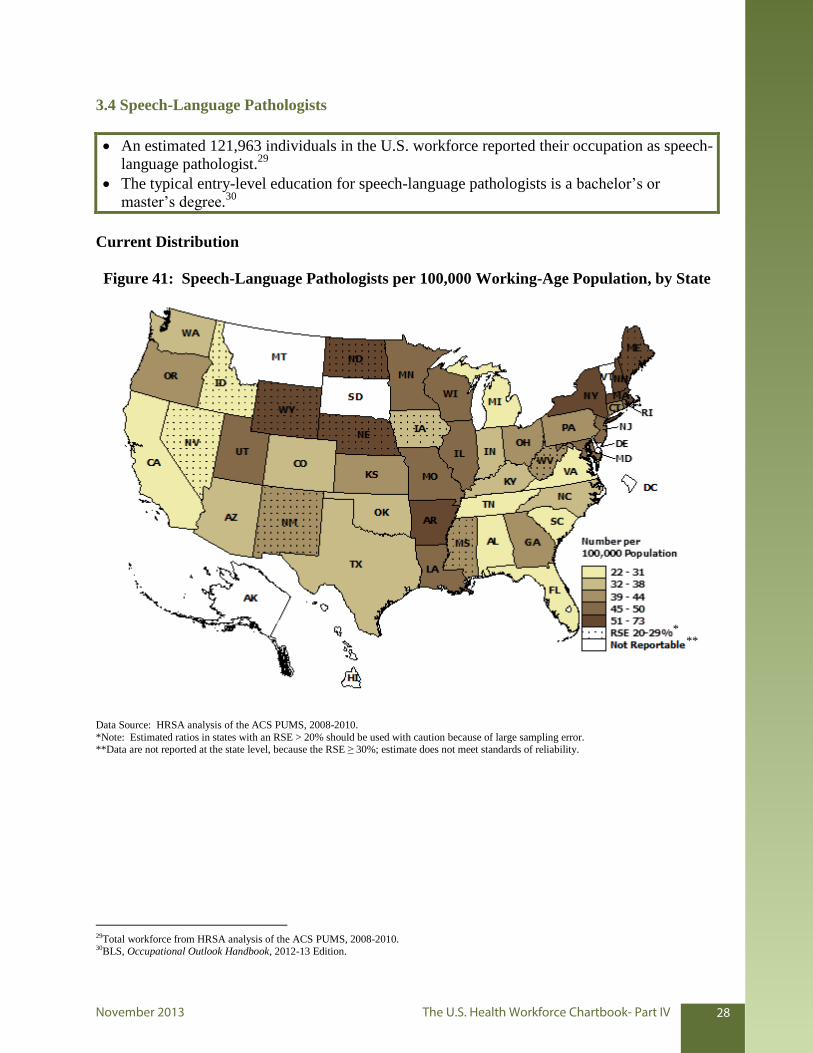
3.4 Speech-Language Pathologists
An estimated 121,963 individuals in the U.S. workforce reported their occupation as speech-
language pathologist.29
The typical entry-level education for speech-language pathologists is a bachelor’s or
master’s degree.30
Current Distribution
Figure 41: Speech-Language Pathologists per 100,000 Working-Age Population, by State
Data Source: HRSA analysis of the ACS PUMS, 2008-2010.
*Note: Estimated ratios in states with an RSE > 20% should be used with caution because of large sampling error.**Data are not reported at the state level, because the RSE ≥ 30%; estimate does not meet standards of reliability.
29Total workforce from HRSA analysis of the ACS PUMS, 2008-2010. 30BLS, Occupational Outlook Handbook, 2012-13 Edition.
* **
November 2013 The U.S. Health Workforce Chartbook- Part IV 28
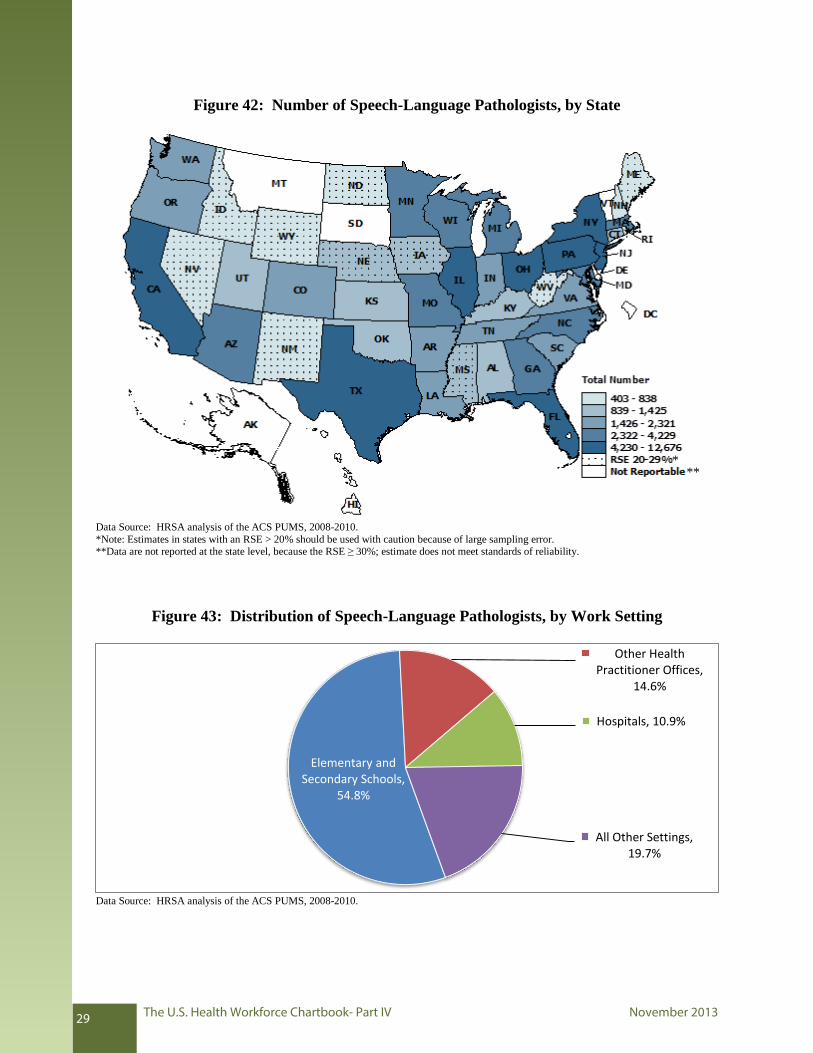
Figure 42: Number of Speech-Language Pathologists, by State
Data Source: HRSA analysis of the ACS PUMS, 2008-2010.
*Note: Estimates in states with an RSE > 20% should be used with caution because of large sampling error.**Data are not reported at the state level, because the RSE ≥ 30%; estimate does not meet standards of reliability.
Figure 43: Distribution of Speech-Language Pathologists, by Work Setting
Data Source: HRSA analysis of the ACS PUMS, 2008-2010.
Elementary and Secondary Schools,
54.8%
Other Health Practitioner Offices,
14.6%
Hospitals, 10.9%
All Other Settings, 19.7%
* **
The U.S. Health Workforce Chartbook- Part IV November 201329
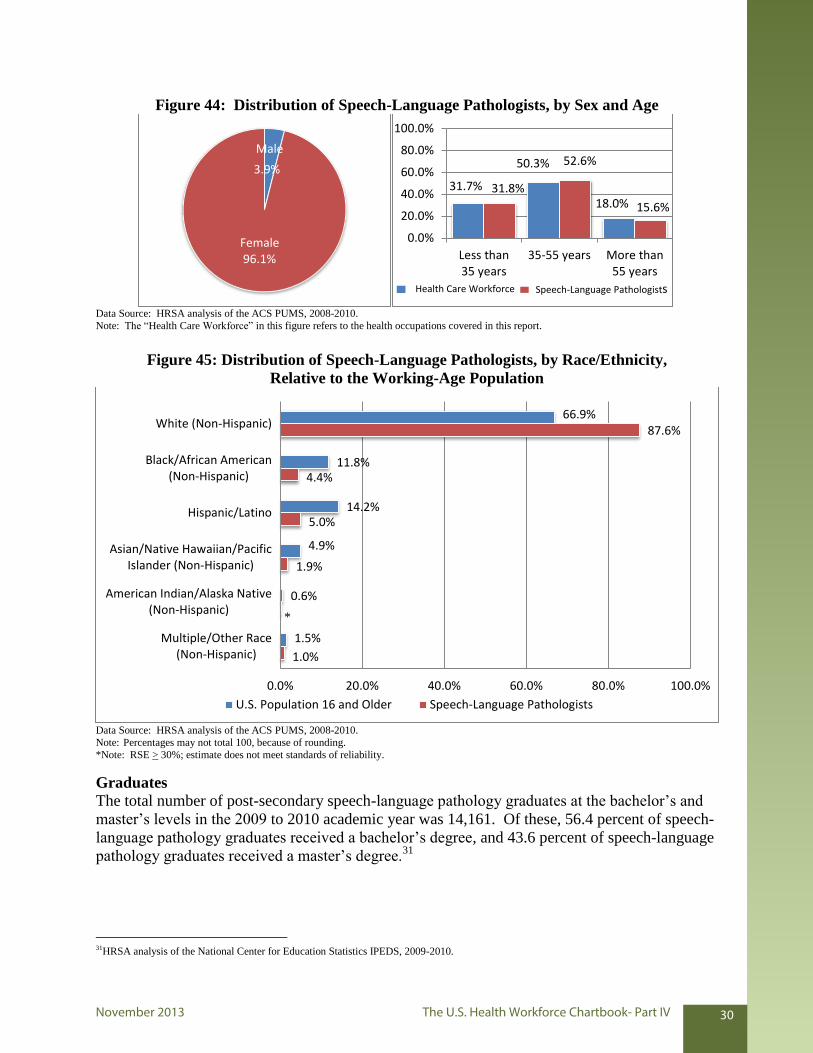
Figure 44: Distribution of Speech-Language Pathologists, by Sex and Age
Male
3.9%
Female 96.1%
31.7%
50.3%
18.0% 31.8%
52.6%
15.6%
0.0%
20.0%
40.0%
60.0%
80.0%
100.0%
Less than35 years
35-55 years More than55 years
Health Care Workforce
Data Source: HRSA analysis of the ACS PUMS, 2008-2010.
Note: The “Health Care Workforce” in this figure refers to the health occupations covered in this report.
Figure 45: Distribution of Speech-Language Pathologists, by Race/Ethnicity,
Relative to the Working-Age Population
Data Source: HRSA analysis of the ACS PUMS, 2008-2010.
Note: Percentages may not total 100, because of rounding.
*Note: RSE > 30%; estimate does not meet standards of reliability.
Graduates
The total number of post-secondary speech-language pathology graduates at the bachelor’s and
master’s levels in the 2009 to 2010 academic year was 14,161. Of these, 56.4 percent of speech-
language pathology graduates received a bachelor’s degree, and 43.6 percent of speech-language
pathology graduates received a master’s degree.31
31HRSA analysis of the National Center for Education Statistics IPEDS, 2009-2010.
66.9%
11.8%
14.2%
4.9%
0.6%
1.5%
87.6%
4.4%
5.0%
1.9%
1.0%
0.0% 20.0% 40.0% 60.0% 80.0% 100.0%
White (Non-Hispanic)
Black/African American(Non-Hispanic)
Hispanic/Latino
Asian/Native Hawaiian/PacificIslander (Non-Hispanic)
American Indian/Alaska Native(Non-Hispanic)
Multiple/Other Race(Non-Hispanic)
U.S. Population 16 and Older Speech-Language Pathologists
*
Speech-Language Pathologists
November 2013 The U.S. Health Workforce Chartbook- Part IV 30
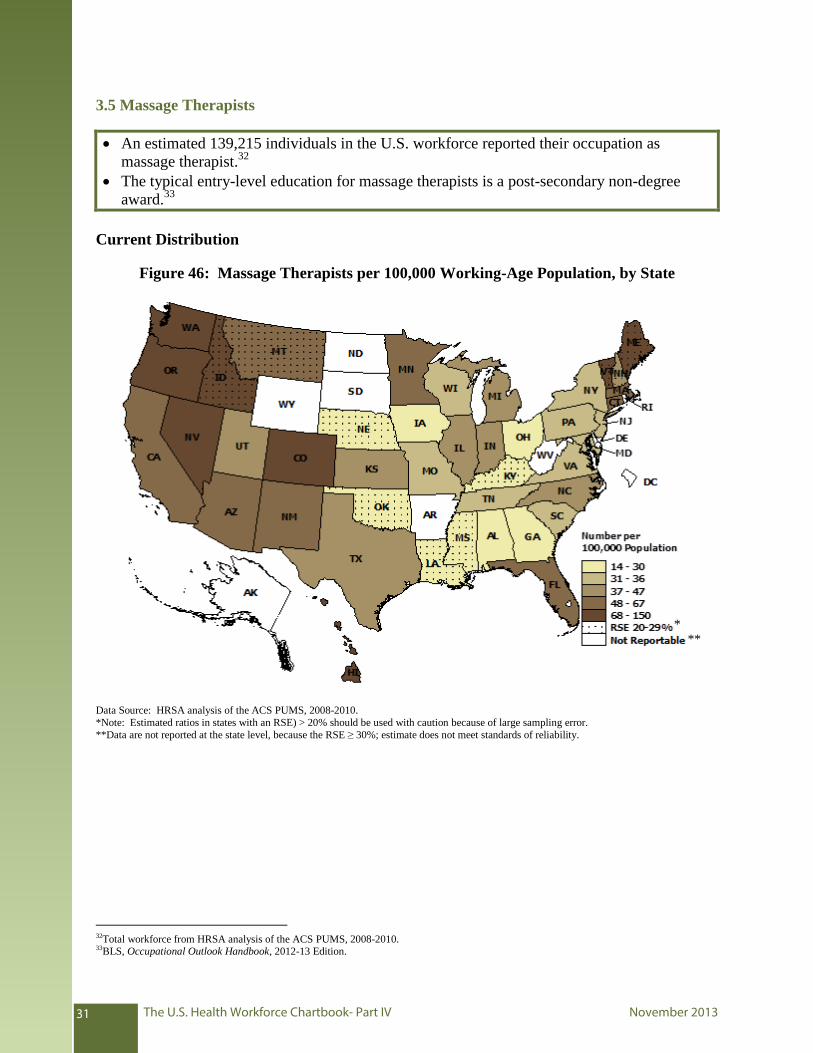
3.5 Massage Therapists
An estimated 139,215 individuals in the U.S. workforce reported their occupation as
massage therapist.32
The typical entry-level education for massage therapists is a post-secondary non-degree
award.33
Current Distribution
Figure 46: Massage Therapists per 100,000 Working-Age Population, by State
Data Source: HRSA analysis of the ACS PUMS, 2008-2010.
*Note: Estimated ratios in states with an RSE) > 20% should be used with caution because of large sampling error.
**Data are not reported at the state level, because the RSE ≥ 30%; estimate does not meet standards of reliability.
32Total workforce from HRSA analysis of the ACS PUMS, 2008-2010. 33BLS, Occupational Outlook Handbook, 2012-13 Edition.
* **
The U.S. Health Workforce Chartbook- Part IV November 201331
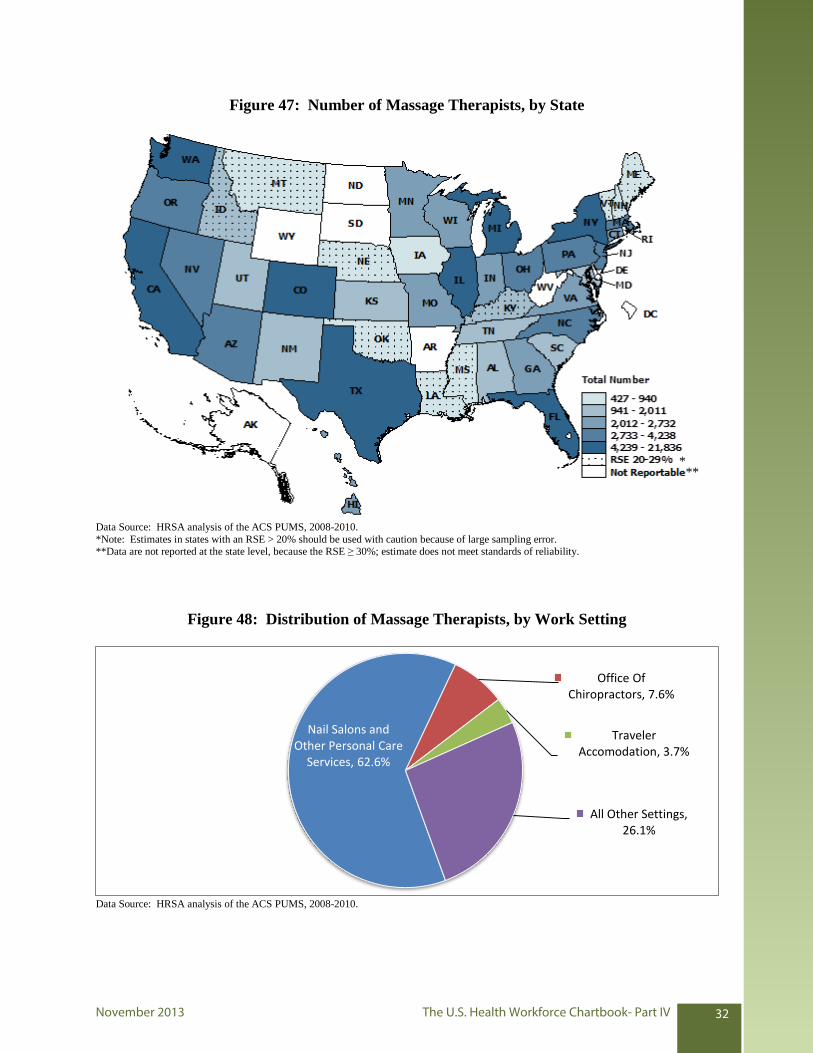
Figure 47: Number of Massage Therapists, by State
Data Source: HRSA analysis of the ACS PUMS, 2008-2010.
*Note: Estimates in states with an RSE > 20% should be used with caution because of large sampling error.**Data are not reported at the state level, because the RSE ≥ 30%; estimate does not meet standards of reliability.
Figure 48: Distribution of Massage Therapists, by Work Setting
Data Source: HRSA analysis of the ACS PUMS, 2008-2010.
Nail Salons and Other Personal Care
Services, 62.6%
Office Of Chiropractors, 7.6%
Traveler Accomodation, 3.7%
All Other Settings, 26.1%
* **
November 2013 The U.S. Health Workforce Chartbook- Part IV 32
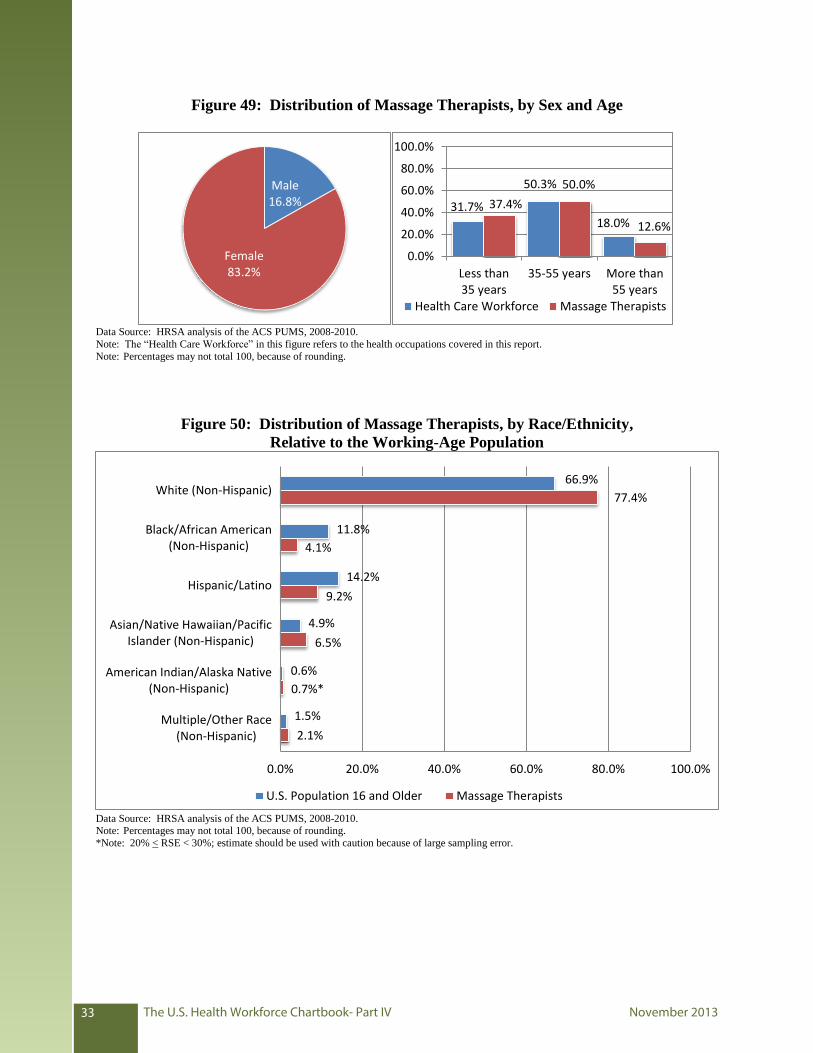
Figure 49: Distribution of Massage Therapists, by Sex and Age
Male 16.8%
Female 83.2%
31.7%
50.3%
18.0% 37.4%
50.0%
12.6%
0.0%
20.0%
40.0%
60.0%
80.0%
100.0%
Less than35 years
35-55 years More than55 years
Health Care Workforce Massage Therapists
Data Source: HRSA analysis of the ACS PUMS, 2008-2010.
Note: The “Health Care Workforce” in this figure refers to the health occupations covered in this report.
Note: Percentages may not total 100, because of rounding.
Figure 50: Distribution of Massage Therapists, by Race/Ethnicity,
Relative to the Working-Age Population
Data Source: HRSA analysis of the ACS PUMS, 2008-2010. Note: Percentages may not total 100, because of rounding.
*Note: 20% < RSE < 30%; estimate should be used with caution because of large sampling error.
66.9%
11.8%
14.2%
4.9%
0.6%
1.5%
77.4%
4.1%
9.2%
6.5%
0.7%*
2.1%
0.0% 20.0% 40.0% 60.0% 80.0% 100.0%
White (Non-Hispanic)
Black/African American(Non-Hispanic)
Hispanic/Latino
Asian/Native Hawaiian/PacificIslander (Non-Hispanic)
American Indian/Alaska Native(Non-Hispanic)
Multiple/Other Race(Non-Hispanic)
U.S. Population 16 and Older Massage Therapists
The U.S. Health Workforce Chartbook- Part IV November 201333