Embed Size (px)
Citation preview
The UPC Holding Group
Combined Financial Statements
December 31, 2018
The UPC Holding Group
TABLE OF CONTENTS
Page
Number
I. COMBINED FINANCIAL STATEMENTS
Independent Auditors’ Report ......................................................................................................................
Combined Balance Sheets as of December 31, 2018 and 2017 ...................................................................
Combined Statements of Operations for the Years Ended December 31, 2018, 2017 and 2016 .................
Combined Statements of Comprehensive Earnings (Loss) for the Years Ended December 31, 2018, 2017 and 2016...........................................................................................................................................
Combined Statements of Equity (Deficit) for the Years Ended December 31, 2018, 2017 and 2016 .........
Combined Statements of Cash Flows for the Years Ended December 31, 2018, 2017 and 2016................
Notes to Combined Financial Statements ....................................................................................................
II. MANAGEMENT’S DISCUSSION AND ANALYSIS OF FINANCIAL CONDITION AND RESULTS OF OPERATIONS .................................................................................................................
I-1
I-3
I-5
I-6
I-7
I-10
I-12
II-1
I-1
Independent Auditor’s Report
The Board of Directors
UPC Holding Group
Report on the Audit of the Combined Financial Statements 2018
Our Opinion
In our opinion the accompanying combined financial statements present fairly, in all material respects, the financial position of
the UPC Holding Group (comprising of UPC Holding B.V. based in Schiphol-Rijk, The Netherlands and its subsidiaries and of
UPC Broadband Slovakia s.r.o., based in Bratislava, Slovakia and its subsidiaries) as of December 31, 2018 and the results of
their operations and their cash flows for the years ended December 31, 2018 in accordance with U.S. generally accepted accounting
principles.
What We Have Audited
We have audited the combined financial statements 2018 of the UPC Holding Group.
The financial statements comprise:
1 the combined balance sheet as of December 31, 2018;
2 the related combined statement of operations, comprehensive earnings (loss), equity (deficit) and cash flows for the year
ended December 31, 2018; and
3 the related notes to the combined financial statements.
Emphasis of the Basis of Accounting and Restriction on Use
We draw attention to note 1 to the combined financial statements 2018 of the UPC Holding Group, which describes the special
purpose of the combined financial statements 2018 of the UPC Holding Group, including the basis of accounting. These financial
statements are prepared to comply with the facilities agreement and bond indentures governing the debt of UPC Holding B.V..
As a result, the combined financial statements of the UPC Holding Group may not be suitable for any other purpose.
Basis for Our Opinion
We conducted our audit in accordance with Dutch law, including the Dutch Standards on Auditing. Our responsibilities under
those standards are further described in the ‘Our responsibilities for the audit of the financial statements’ section of our report.
We are independent of the UPC Holding Group in accordance with the ‘Verordening inzake de onafhankelijkheid van accountants
bij assurance-opdrachten’ (ViO, Code of Ethics for Professional Accountants, a regulation with respect to independence) and
other relevant independence regulations in the Netherlands. Furthermore, we have complied with the ‘Verordening gedrags- en
beroepsregels accountants’ (VGBA, Dutch Code of Ethics).
We believe the audit evidence we have obtained is sufficient and appropriate to provide a basis for our opinion.
Report on the Other Information Added to the Combined Financial Statements
The combined financial statements and our auditor’s report thereon, contain other information that consists of Management’s
Discussion and Analysis of Financial Condition and Results of Operations.
Based on the following procedures performed, we conclude that other information is consistent with the combined financial
statements and does not contain material misstatements.
We have read the other information. Based on our knowledge and understanding obtained through our audit of the combined
financial statements or otherwise, we have considered whether the other information contains material misstatements.
By performing these procedures, we comply with the requirements of the Dutch Standard 720. The scope of the procedures
performed is substantially less than the scope of those performed in our audit of the combined financial statements.
The Board of Directors is responsible for the preparation of the other information.
I-2
Description of Responsibilities Regarding the Combined Financial Statements
Responsibilities of the Board of Directors of the UPC Holding Group for the Combined Financial Statements
The Board of Directors is responsible for the preparation and fair presentation of the combined financial statements in accordance
with U.S. generally accepted accounting principles. Furthermore, the Board of Directors is responsible for such internal control
as the Board of Directors determines is necessary to enable the preparation of the combined financial statements that are free
from material misstatement, whether due to errors or fraud.
As part of the preparation of the combined financial statements, the Board of Directors is responsible for assessing the company’s
ability to continue as a going concern. Based on the financial reporting frameworks mentioned, the Board of Directors should
prepare the combined financial statements using the going concern basis of accounting unless when liquidation is imminent.
The Board of Directors should disclose events and circumstances that may cast significant doubt on the company’s ability to
continue as a going concern in the combined financial statements.
Our Responsibilities for the Audit of the Combined Financial Statements
Our objective is to plan and perform the audit engagement in a manner that allows us to obtain sufficient and appropriate audit
evidence for our opinion.
Our audit has been performed with a high, but not absolute, level of assurance, which means we may not have detected all
material errors and fraud during our audit.
Misstatements can arise from fraud or errors and are considered material if, individually or in the aggregate, they could reasonably
be expected to influence the economic decisions of users taken on the basis of these combined financial statements. The materiality
affects the nature, timing and extent of our audit procedures and the evaluation of the effect of identified misstatements on our
opinion.
A further description of our responsibilities for the audit of the combined financial statements is located at the website of de
‘Koninklijke Nederlandse Beroepsorganisatie van Accountants’ (NBA, Royal Netherlands Institute of Chartered Accountants)
at: http://www.nba.nl/ENG_beursgenoteerd_01
This description forms part of our independent auditor’s report.
Amstelveen, March 14, 2019
KPMG Accountants N.V.
C.A. Bakker RA
I-3
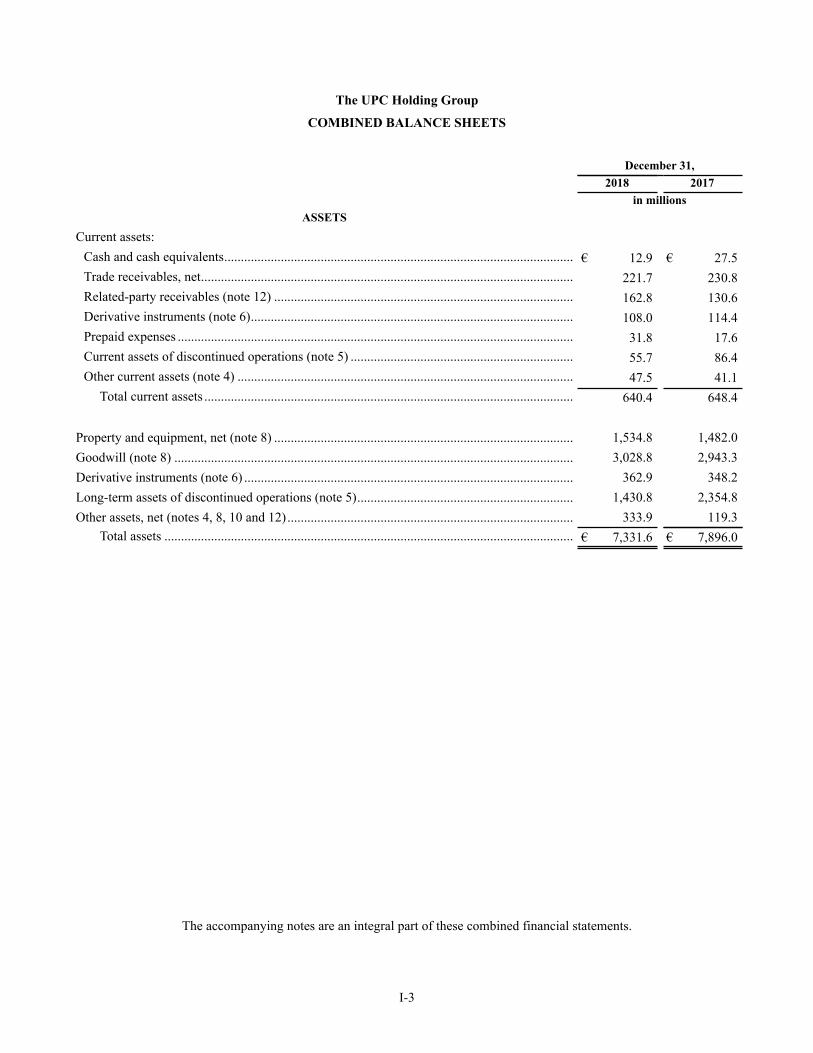
The UPC Holding Group
COMBINED BALANCE SHEETS
December 31,
2018 2017
in millions
ASSETS
Current assets:
Cash and cash equivalents......................................................................................................... € 12.9 € 27.5
Trade receivables, net................................................................................................................ 221.7 230.8
Related-party receivables (note 12) .......................................................................................... 162.8 130.6
Derivative instruments (note 6)................................................................................................. 108.0 114.4
Prepaid expenses ....................................................................................................................... 31.8 17.6
Current assets of discontinued operations (note 5) ................................................................... 55.7 86.4
Other current assets (note 4) ..................................................................................................... 47.5 41.1
Total current assets ............................................................................................................... 640.4 648.4
Property and equipment, net (note 8) .......................................................................................... 1,534.8 1,482.0
Goodwill (note 8) ........................................................................................................................ 3,028.8 2,943.3
Derivative instruments (note 6) ................................................................................................... 362.9 348.2
Long-term assets of discontinued operations (note 5)................................................................. 1,430.8 2,354.8
Other assets, net (notes 4, 8, 10 and 12)...................................................................................... 333.9 119.3
Total assets ........................................................................................................................... € 7,331.6 € 7,896.0
The accompanying notes are an integral part of these combined financial statements.
I-4
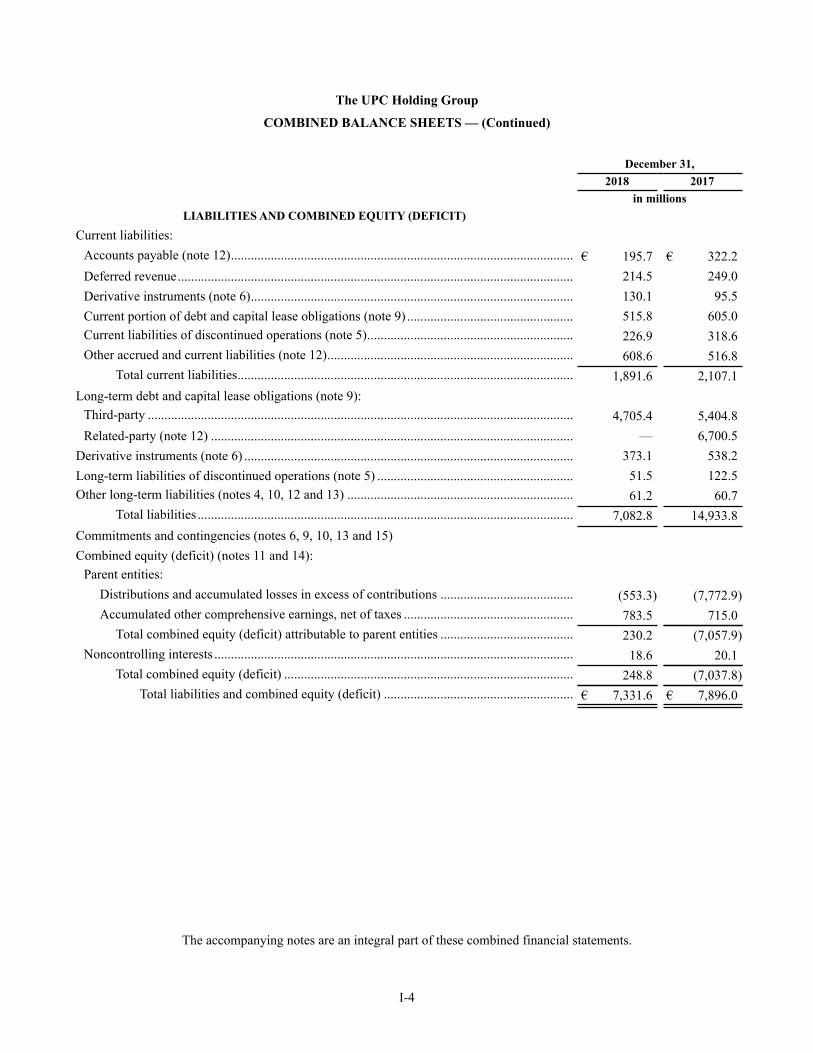
The UPC Holding Group
COMBINED BALANCE SHEETS — (Continued)
December 31,
2018 2017
in millions
LIABILITIES AND COMBINED EQUITY (DEFICIT)
Current liabilities:
Accounts payable (note 12)....................................................................................................... € 195.7 € 322.2
Deferred revenue....................................................................................................................... 214.5 249.0
Derivative instruments (note 6)................................................................................................. 130.1 95.5
Current portion of debt and capital lease obligations (note 9) .................................................. 515.8 605.0
Current liabilities of discontinued operations (note 5).............................................................. 226.9 318.6
Other accrued and current liabilities (note 12).......................................................................... 608.6 516.8
Total current liabilities..................................................................................................... 1,891.6 2,107.1
Long-term debt and capital lease obligations (note 9):
Third-party ................................................................................................................................ 4,705.4 5,404.8
Related-party (note 12) ............................................................................................................. — 6,700.5
Derivative instruments (note 6) ................................................................................................... 373.1 538.2
Long-term liabilities of discontinued operations (note 5) ........................................................... 51.5 122.5
Other long-term liabilities (notes 4, 10, 12 and 13) .................................................................... 61.2 60.7
Total liabilities ................................................................................................................. 7,082.8 14,933.8
Commitments and contingencies (notes 6, 9, 10, 13 and 15)
Combined equity (deficit) (notes 11 and 14):
Parent entities:
Distributions and accumulated losses in excess of contributions ........................................ (553.3) (7,772.9)
Accumulated other comprehensive earnings, net of taxes ................................................... 783.5 715.0
Total combined equity (deficit) attributable to parent entities ........................................ 230.2 (7,057.9)
Noncontrolling interests ............................................................................................................ 18.6 20.1
Total combined equity (deficit) ....................................................................................... 248.8 (7,037.8)
Total liabilities and combined equity (deficit) ......................................................... € 7,331.6 € 7,896.0
The accompanying notes are an integral part of these combined financial statements.
I-5
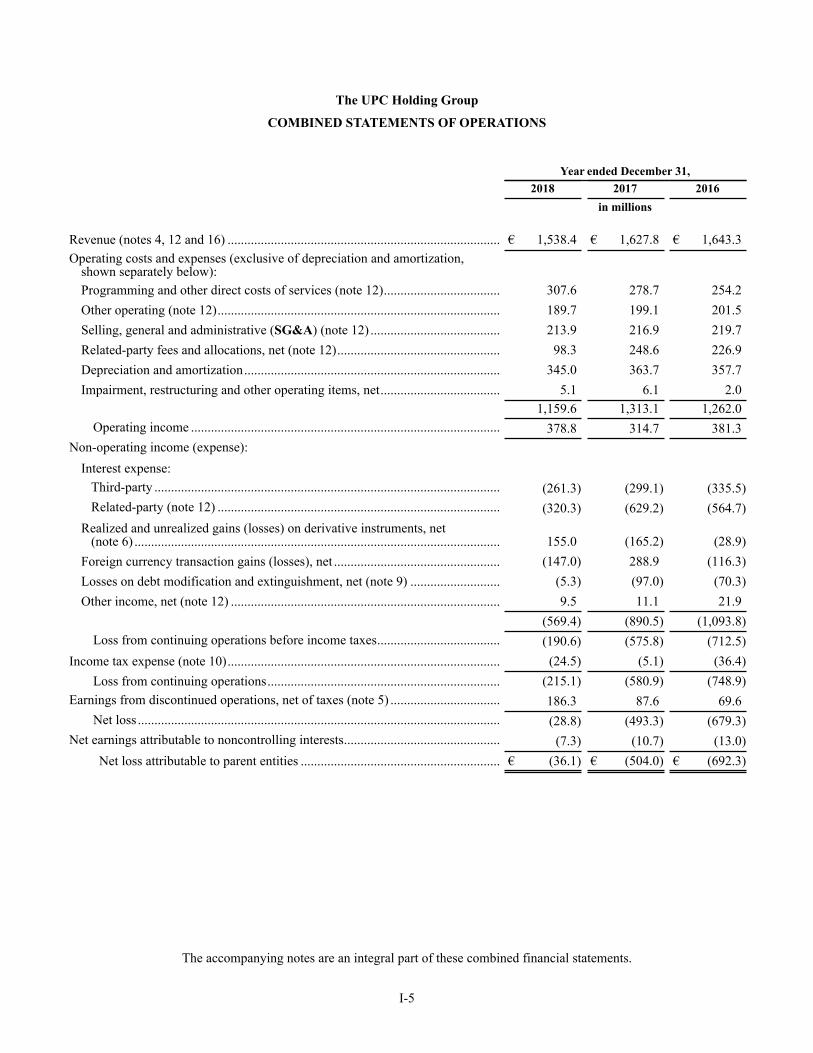
The UPC Holding Group
COMBINED STATEMENTS OF OPERATIONS
Year ended December 31,
2018 2017 2016
in millions
Revenue (notes 4, 12 and 16) .................................................................................. € 1,538.4 € 1,627.8 € 1,643.3
Operating costs and expenses (exclusive of depreciation and amortization,shown separately below):
Programming and other direct costs of services (note 12)................................... 307.6 278.7 254.2
Other operating (note 12)..................................................................................... 189.7 199.1 201.5
Selling, general and administrative (SG&A) (note 12) ....................................... 213.9 216.9 219.7
Related-party fees and allocations, net (note 12)................................................. 98.3 248.6 226.9
Depreciation and amortization............................................................................. 345.0 363.7 357.7
Impairment, restructuring and other operating items, net.................................... 5.1 6.1 2.0
1,159.6 1,313.1 1,262.0
Operating income ............................................................................................. 378.8 314.7 381.3
Non-operating income (expense):
Interest expense:
Third-party ........................................................................................................ (261.3) (299.1) (335.5)
Related-party (note 12) ..................................................................................... (320.3) (629.2) (564.7)
Realized and unrealized gains (losses) on derivative instruments, net (note 6) .............................................................................................................. 155.0 (165.2) (28.9)
Foreign currency transaction gains (losses), net .................................................. (147.0) 288.9 (116.3)
Losses on debt modification and extinguishment, net (note 9) ........................... (5.3) (97.0) (70.3)
Other income, net (note 12) ................................................................................. 9.5 11.1 21.9
(569.4) (890.5) (1,093.8)
Loss from continuing operations before income taxes..................................... (190.6) (575.8) (712.5)
Income tax expense (note 10).................................................................................. (24.5) (5.1) (36.4)
Loss from continuing operations...................................................................... (215.1) (580.9) (748.9)
Earnings from discontinued operations, net of taxes (note 5) ................................. 186.3 87.6 69.6
Net loss ............................................................................................................. (28.8) (493.3) (679.3)
Net earnings attributable to noncontrolling interests............................................... (7.3) (10.7) (13.0)
Net loss attributable to parent entities ............................................................ € (36.1) € (504.0) € (692.3)
The accompanying notes are an integral part of these combined financial statements.
I-6
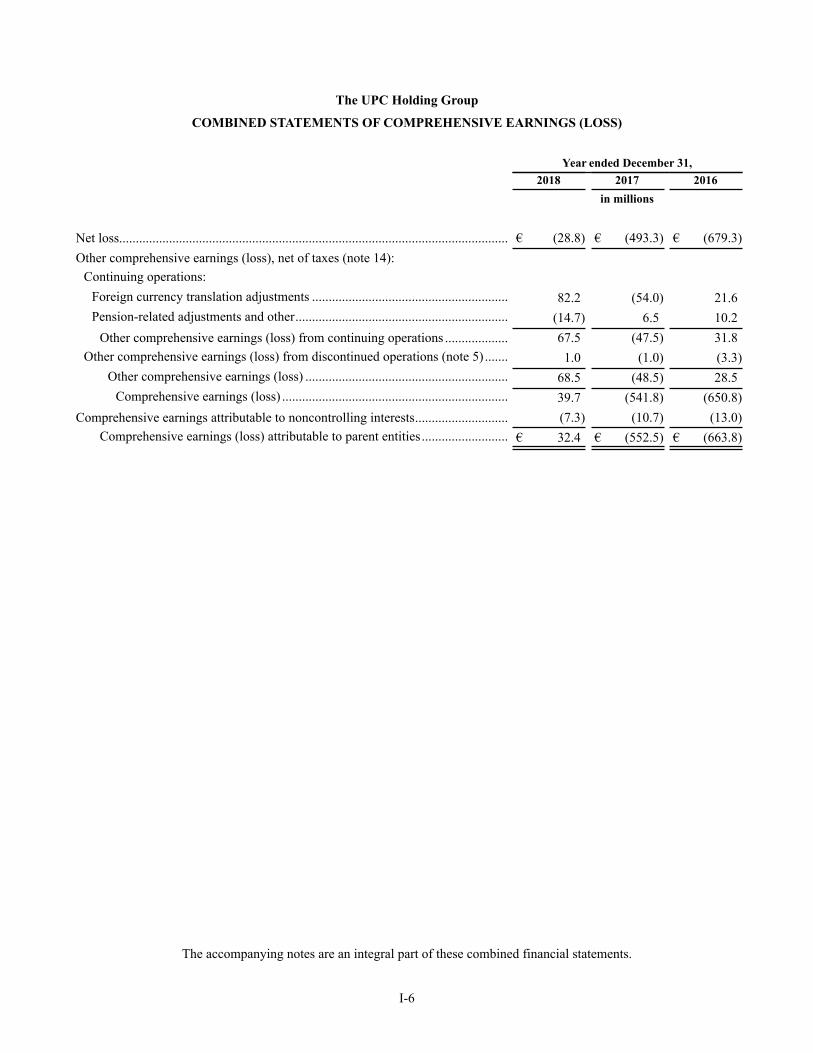
The UPC Holding Group
COMBINED STATEMENTS OF COMPREHENSIVE EARNINGS (LOSS)
Year ended December 31,
2018 2017 2016
in millions
Net loss..................................................................................................................... € (28.8) € (493.3) € (679.3)
Other comprehensive earnings (loss), net of taxes (note 14):
Continuing operations:
Foreign currency translation adjustments ........................................................... 82.2 (54.0) 21.6
Pension-related adjustments and other................................................................ (14.7) 6.5 10.2
Other comprehensive earnings (loss) from continuing operations ................... 67.5 (47.5) 31.8
Other comprehensive earnings (loss) from discontinued operations (note 5) ....... 1.0 (1.0) (3.3)
Other comprehensive earnings (loss) ............................................................. 68.5 (48.5) 28.5
Comprehensive earnings (loss) .................................................................... 39.7 (541.8) (650.8)
Comprehensive earnings attributable to noncontrolling interests............................ (7.3) (10.7) (13.0)
Comprehensive earnings (loss) attributable to parent entities.......................... € 32.4 € (552.5) € (663.8)
The accompanying notes are an integral part of these combined financial statements.
I-7
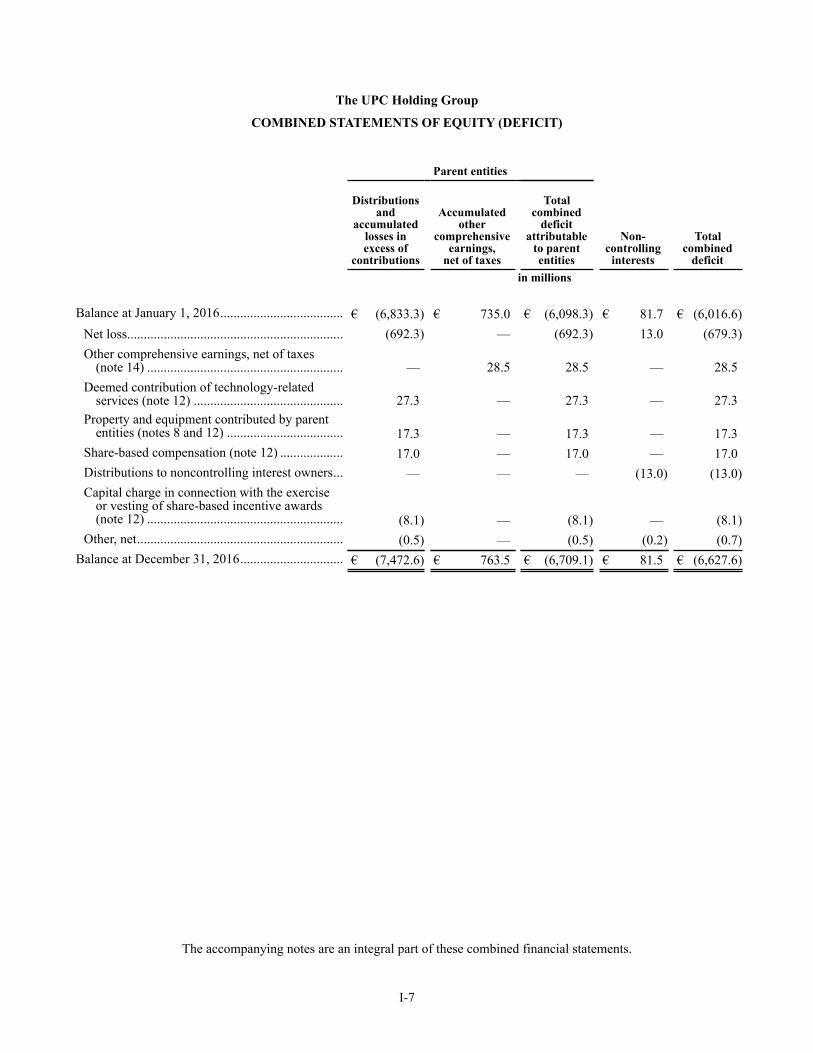
The UPC Holding Group
COMBINED STATEMENTS OF EQUITY (DEFICIT)
Parent entities
Non-controlling
interests
Totalcombined
deficit
Distributionsand
accumulatedlosses inexcess of
contributions
Accumulatedother
comprehensiveearnings,
net of taxes
Totalcombined
deficitattributable
to parententities
in millions
Balance at January 1, 2016..................................... € (6,833.3) € 735.0 € (6,098.3) € 81.7 € (6,016.6)
Net loss................................................................. (692.3) — (692.3) 13.0 (679.3)
Other comprehensive earnings, net of taxes(note 14) ........................................................... — 28.5 28.5 — 28.5
Deemed contribution of technology-relatedservices (note 12) ............................................. 27.3 — 27.3 — 27.3
Property and equipment contributed by parententities (notes 8 and 12) ................................... 17.3 — 17.3 — 17.3
Share-based compensation (note 12) ................... 17.0 — 17.0 — 17.0
Distributions to noncontrolling interest owners... — — — (13.0) (13.0)
Capital charge in connection with the exerciseor vesting of share-based incentive awards(note 12) ........................................................... (8.1) — (8.1) — (8.1)
Other, net.............................................................. (0.5) — (0.5) (0.2) (0.7)
Balance at December 31, 2016............................... € (7,472.6) € 763.5 € (6,709.1) € 81.5 € (6,627.6)
The accompanying notes are an integral part of these combined financial statements.
I-8
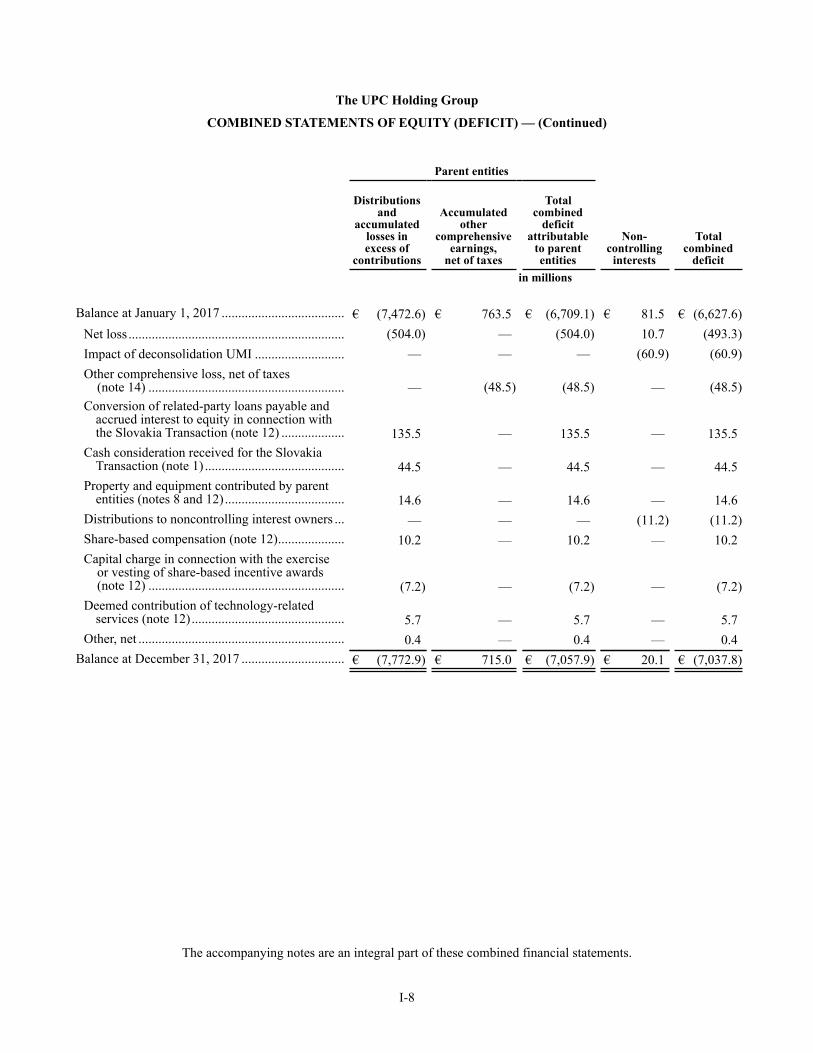
The UPC Holding Group
COMBINED STATEMENTS OF EQUITY (DEFICIT) — (Continued)
Parent entities
Non-controlling
interests
Totalcombined
deficit
Distributionsand
accumulatedlosses inexcess of
contributions
Accumulatedother
comprehensiveearnings,
net of taxes
Totalcombined
deficitattributable
to parententities
in millions
Balance at January 1, 2017 ..................................... € (7,472.6) € 763.5 € (6,709.1) € 81.5 € (6,627.6)
Net loss ................................................................. (504.0) — (504.0) 10.7 (493.3)
Impact of deconsolidation UMI ........................... — — — (60.9) (60.9)
Other comprehensive loss, net of taxes (note 14) ........................................................... — (48.5) (48.5) — (48.5)
Conversion of related-party loans payable andaccrued interest to equity in connection withthe Slovakia Transaction (note 12) ................... 135.5 — 135.5 — 135.5
Cash consideration received for the SlovakiaTransaction (note 1) .......................................... 44.5 — 44.5 — 44.5
Property and equipment contributed by parententities (notes 8 and 12).................................... 14.6 — 14.6 — 14.6
Distributions to noncontrolling interest owners ... — — — (11.2) (11.2)
Share-based compensation (note 12).................... 10.2 — 10.2 — 10.2
Capital charge in connection with the exercise or vesting of share-based incentive awards (note 12) ........................................................... (7.2) — (7.2) — (7.2)
Deemed contribution of technology-relatedservices (note 12).............................................. 5.7 — 5.7 — 5.7
Other, net .............................................................. 0.4 — 0.4 — 0.4
Balance at December 31, 2017 ............................... € (7,772.9) € 715.0 € (7,057.9) € 20.1 € (7,037.8)
The accompanying notes are an integral part of these combined financial statements.
I-9
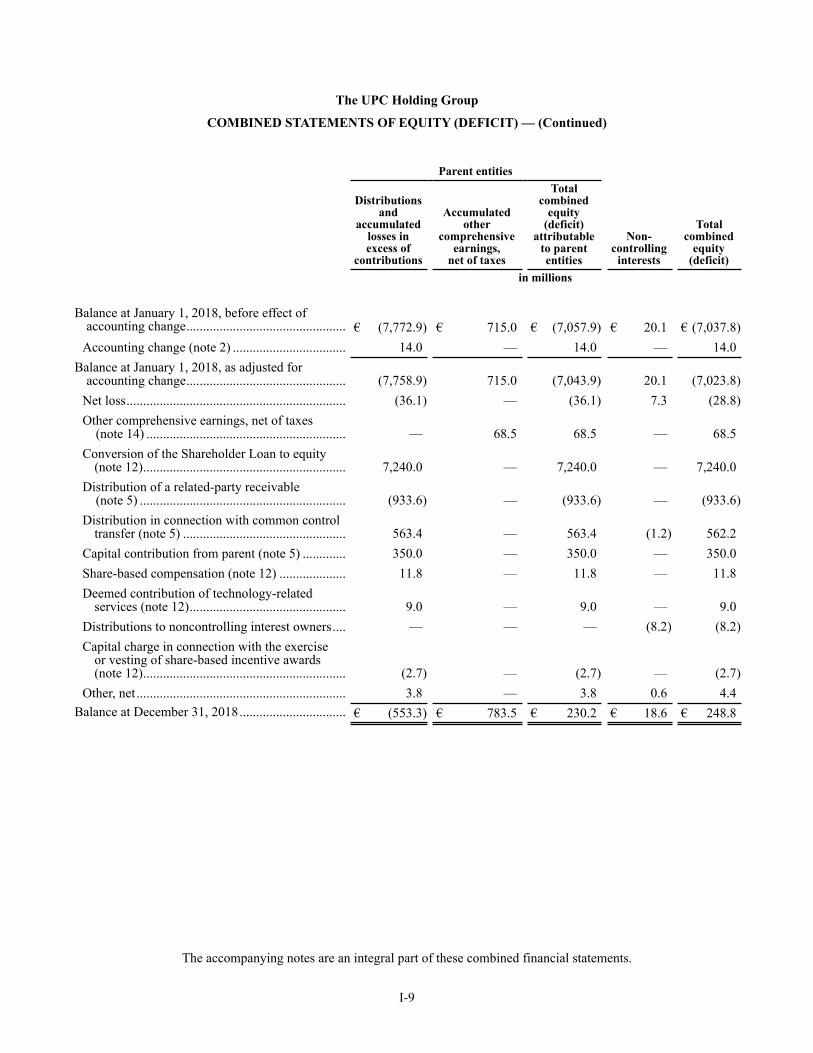
The UPC Holding Group
COMBINED STATEMENTS OF EQUITY (DEFICIT) — (Continued)
Parent entities
Non-controlling
interests
Totalcombined
equity(deficit)
Distributions
andaccumulated
losses inexcess of
contributions
Accumulatedother
comprehensiveearnings,
net of taxes
Totalcombined
equity(deficit)
attributableto parententities
in millions
Balance at January 1, 2018, before effect ofaccounting change................................................ € (7,772.9) € 715.0 € (7,057.9) € 20.1 € (7,037.8)
Accounting change (note 2) .................................. 14.0 — 14.0 — 14.0
Balance at January 1, 2018, as adjusted foraccounting change................................................ (7,758.9) 715.0 (7,043.9) 20.1 (7,023.8)
Net loss.................................................................. (36.1) — (36.1) 7.3 (28.8)
Other comprehensive earnings, net of taxes (note 14) ............................................................ — 68.5 68.5 — 68.5
Conversion of the Shareholder Loan to equity(note 12)............................................................. 7,240.0 — 7,240.0 — 7,240.0
Distribution of a related-party receivable (note 5) .............................................................. (933.6) — (933.6) — (933.6)
Distribution in connection with common controltransfer (note 5) ................................................. 563.4 — 563.4 (1.2) 562.2
Capital contribution from parent (note 5) ............. 350.0 — 350.0 — 350.0
Share-based compensation (note 12) .................... 11.8 — 11.8 — 11.8
Deemed contribution of technology-relatedservices (note 12)............................................... 9.0 — 9.0 — 9.0
Distributions to noncontrolling interest owners.... — — — (8.2) (8.2)
Capital charge in connection with the exerciseor vesting of share-based incentive awards(note 12)............................................................. (2.7) — (2.7) — (2.7)
Other, net ............................................................... 3.8 — 3.8 0.6 4.4
Balance at December 31, 2018................................ € (553.3) € 783.5 € 230.2 € 18.6 € 248.8
The accompanying notes are an integral part of these combined financial statements.
I-10
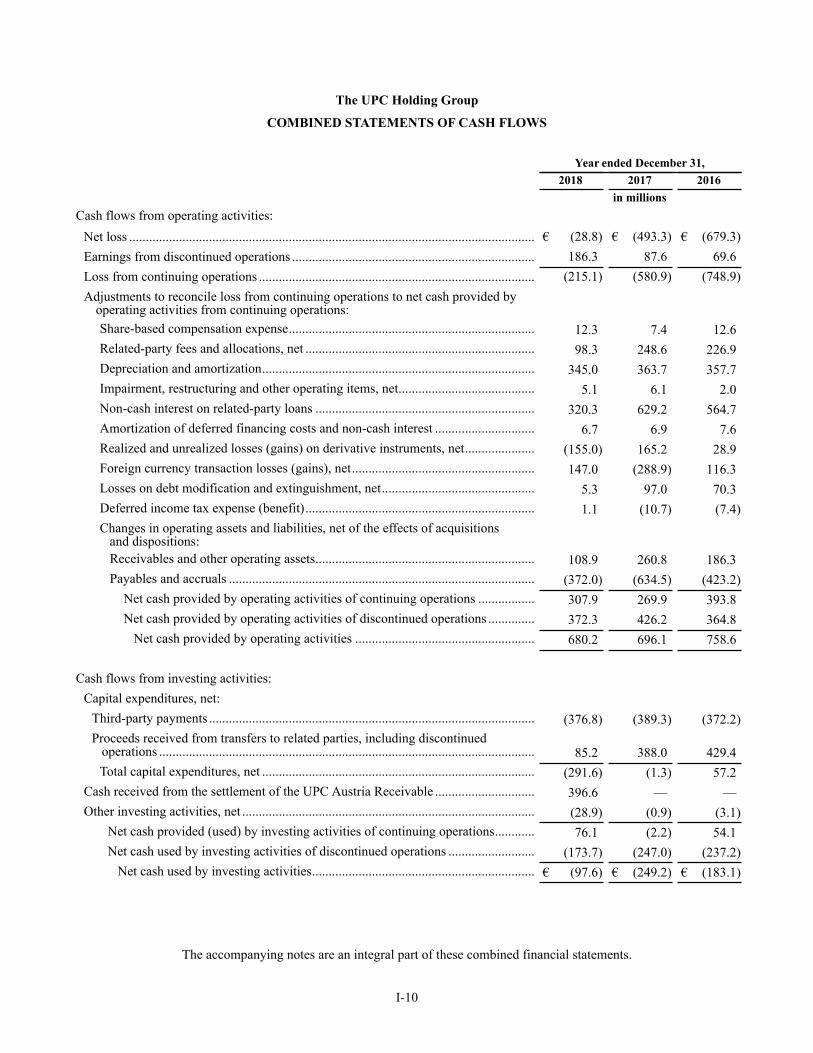
The UPC Holding Group
COMBINED STATEMENTS OF CASH FLOWS
Year ended December 31,
2018 2017 2016
in millions
Cash flows from operating activities:
Net loss .......................................................................................................................... € (28.8) € (493.3) € (679.3)
Earnings from discontinued operations ......................................................................... 186.3 87.6 69.6
Loss from continuing operations ................................................................................... (215.1) (580.9) (748.9)
Adjustments to reconcile loss from continuing operations to net cash provided byoperating activities from continuing operations:
Share-based compensation expense.......................................................................... 12.3 7.4 12.6
Related-party fees and allocations, net ..................................................................... 98.3 248.6 226.9
Depreciation and amortization.................................................................................. 345.0 363.7 357.7
Impairment, restructuring and other operating items, net......................................... 5.1 6.1 2.0
Non-cash interest on related-party loans .................................................................. 320.3 629.2 564.7
Amortization of deferred financing costs and non-cash interest .............................. 6.7 6.9 7.6
Realized and unrealized losses (gains) on derivative instruments, net..................... (155.0) 165.2 28.9
Foreign currency transaction losses (gains), net....................................................... 147.0 (288.9) 116.3
Losses on debt modification and extinguishment, net.............................................. 5.3 97.0 70.3
Deferred income tax expense (benefit)..................................................................... 1.1 (10.7) (7.4)
Changes in operating assets and liabilities, net of the effects of acquisitions and dispositions:
Receivables and other operating assets.................................................................. 108.9 260.8 186.3
Payables and accruals ............................................................................................ (372.0) (634.5) (423.2)
Net cash provided by operating activities of continuing operations ................. 307.9 269.9 393.8
Net cash provided by operating activities of discontinued operations .............. 372.3 426.2 364.8
Net cash provided by operating activities ...................................................... 680.2 696.1 758.6
Cash flows from investing activities:
Capital expenditures, net:
Third-party payments .................................................................................................. (376.8) (389.3) (372.2)
Proceeds received from transfers to related parties, including discontinued operations ................................................................................................................. 85.2 388.0 429.4
Total capital expenditures, net .................................................................................. (291.6) (1.3) 57.2
Cash received from the settlement of the UPC Austria Receivable .............................. 396.6 — —
Other investing activities, net ........................................................................................ (28.9) (0.9) (3.1)
Net cash provided (used) by investing activities of continuing operations............ 76.1 (2.2) 54.1
Net cash used by investing activities of discontinued operations .......................... (173.7) (247.0) (237.2)
Net cash used by investing activities................................................................... € (97.6) € (249.2) € (183.1)
The accompanying notes are an integral part of these combined financial statements.
I-11
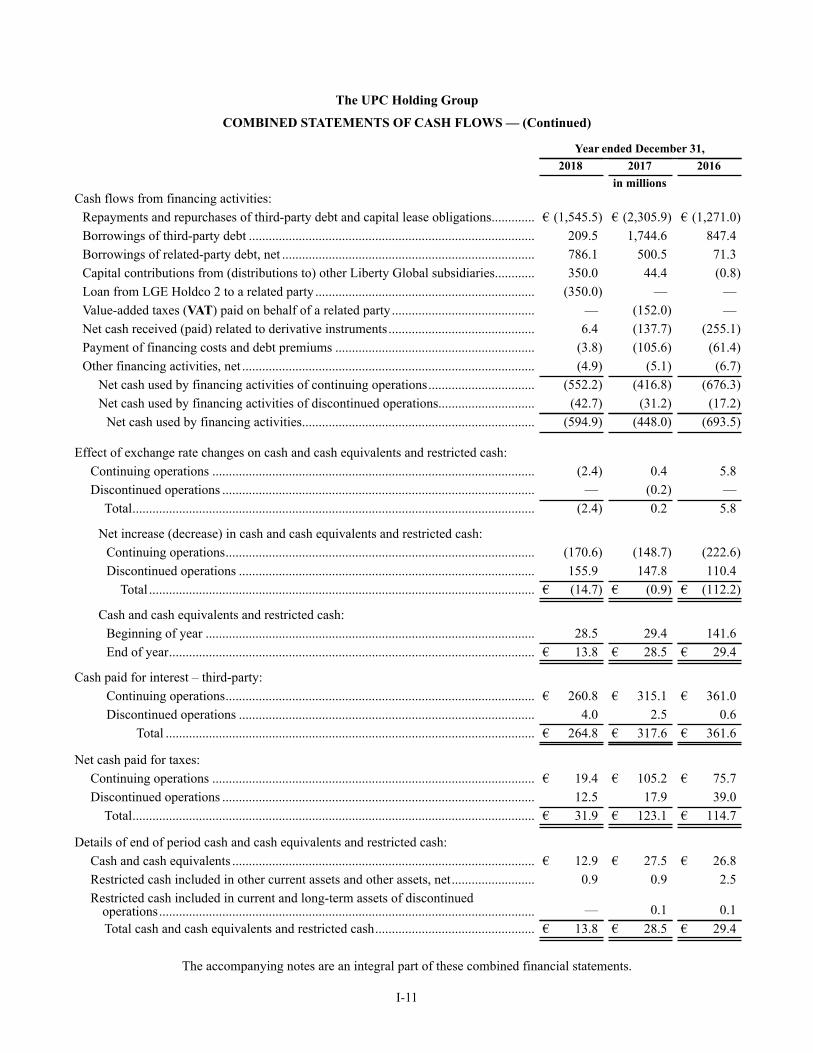
The UPC Holding Group
COMBINED STATEMENTS OF CASH FLOWS — (Continued)
Year ended December 31,
2018 2017 2016
in millions
Cash flows from financing activities:
Repayments and repurchases of third-party debt and capital lease obligations............. € (1,545.5) € (2,305.9) € (1,271.0)
Borrowings of third-party debt ...................................................................................... 209.5 1,744.6 847.4
Borrowings of related-party debt, net ............................................................................ 786.1 500.5 71.3
Capital contributions from (distributions to) other Liberty Global subsidiaries............ 350.0 44.4 (0.8)
Loan from LGE Holdco 2 to a related party .................................................................. (350.0) — —
Value-added taxes (VAT) paid on behalf of a related party ........................................... — (152.0) —
Net cash received (paid) related to derivative instruments............................................ 6.4 (137.7) (255.1)
Payment of financing costs and debt premiums ............................................................ (3.8) (105.6) (61.4)
Other financing activities, net ........................................................................................ (4.9) (5.1) (6.7)
Net cash used by financing activities of continuing operations................................ (552.2) (416.8) (676.3)
Net cash used by financing activities of discontinued operations ............................. (42.7) (31.2) (17.2)
Net cash used by financing activities...................................................................... (594.9) (448.0) (693.5)
Effect of exchange rate changes on cash and cash equivalents and restricted cash:
Continuing operations ................................................................................................. (2.4) 0.4 5.8
Discontinued operations .............................................................................................. — (0.2) —
Total......................................................................................................................... (2.4) 0.2 5.8
Net increase (decrease) in cash and cash equivalents and restricted cash:
Continuing operations............................................................................................. (170.6) (148.7) (222.6)
Discontinued operations ......................................................................................... 155.9 147.8 110.4
Total .................................................................................................................... € (14.7) € (0.9) € (112.2)
Cash and cash equivalents and restricted cash:
Beginning of year ................................................................................................... 28.5 29.4 141.6
End of year.............................................................................................................. € 13.8 € 28.5 € 29.4
Cash paid for interest – third-party:
Continuing operations............................................................................................. € 260.8 € 315.1 € 361.0
Discontinued operations ......................................................................................... 4.0 2.5 0.6
Total ............................................................................................................... € 264.8 € 317.6 € 361.6
Net cash paid for taxes:
Continuing operations ................................................................................................. € 19.4 € 105.2 € 75.7
Discontinued operations .............................................................................................. 12.5 17.9 39.0
Total......................................................................................................................... € 31.9 € 123.1 € 114.7
Details of end of period cash and cash equivalents and restricted cash:
Cash and cash equivalents ........................................................................................... € 12.9 € 27.5 € 26.8
Restricted cash included in other current assets and other assets, net......................... 0.9 0.9 2.5
Restricted cash included in current and long-term assets of discontinued operations................................................................................................................. — 0.1 0.1
Total cash and cash equivalents and restricted cash................................................ € 13.8 € 28.5 € 29.4
The accompanying notes are an integral part of these combined financial statements.
The UPC Holding Group
Notes to Combined Financial Statements
December 31, 2018, 2017 and 2016
I-12
(1) Basis of Presentation
UPC Holding B.V. (UPC Holding) and UPC Broadband Slovakia s.r.o. (UPC Slovakia) are wholly-owned subsidiaries of
Liberty Global plc (Liberty Global). The accompanying combined financial statements include the historical financial information
of UPC Holding and its subsidiaries and UPC Slovakia and its subsidiaries (Slovakia) (collectively, the UPC Holding Group).
Prior to the fourth quarter of 2017, Slovakia was a wholly-owned subsidiary of UPC Holding. In connection with certain internal
reorganization transactions completed by Liberty Global during the fourth quarter of 2017, Slovakia was acquired by another
subsidiary of Liberty Global outside of the UPC Holding Group (the Slovakia Transaction). We accounted for the Slovakia
Transaction as a common control transfer at historical cost. Following the Slovakia Transaction, Slovakia remains a restricted
subsidiary for the purpose of the facilities agreement and bond indentures governing the debt of the UPC Holding Group.
Accordingly, the accompanying financial statements are prepared in order to comply with the facilities agreement and bond
indentures governing the debt of UPC Holding B.V. on a combined basis as a result of this change in reporting entity. In these
notes, the terms, “we,” “our,” “our company” and “us” may refer, as the context requires, to the UPC Holding Group.
As of December 31, 2018, our continuing operations comprise businesses that provide (i) residential and business-to-business
(B2B) communications services in Switzerland, Poland and Slovakia and (ii) mobile services in Switzerland and Poland.
In addition, we currently provide (i) residential and B2B communication services in Romania, Hungary, and the Czech Republic
and (ii) direct-to-home satellite (DTH) services to residential customers in Hungary, the Czech Republic, Romania and Slovakia
through a Luxembourg-based organization that we refer to as “UPC DTH”. We also provided residential and B2B communication
services in Austria through July 31, 2018, the date we completed the sale of such operations. On May 9, 2018, we reached an
agreement to sell our operations in Romania, Hungary, and the Czech Republic (exclusive of our UPC DTH operations) and on
December 21, 2018, we reached an agreement to sell the operations of UPC DTH. In these combined financial statements, our
operations in each of these countries are presented as discontinued operations for all periods. For additional information regarding
these pending and completed dispositions, see note 5.
Unless otherwise indicated, the amounts presented in these notes relate only to our continuing operations, and ownership
percentages and convenience translations into euros are calculated as of December 31, 2018.
These combined financial statements reflect our consideration of the accounting and disclosure implications of subsequent
events through March 14, 2019, the date of issuance.
UPC Holding guarantees the commitments entered into by UPC DTH Sarl and UPC DTH Leasing Sarl, each of which is a
subsidiary of UPC Holding, in order to make use of the exemptions pursuant to Article 70 of the Luxembourg Law of December
19, 2002.
The UPC Holding Group
Notes to Combined Financial Statements - (Continued)
December 31, 2018, 2017 and 2016
I-13
(2) Accounting Changes and Recent Accounting Pronouncements
Accounting Changes
ASU 2014-09
In May 2014, the Financial Accounting Standards Board (FASB) issued Accounting Standards Update (ASU) No. 2014-09,
Revenue from Contracts with Customers (ASU 2014-09), which requires an entity to recognize the amount of revenue to which
it expects to be entitled for the transfer of goods or services to customers. We adopted ASU 2014-09 effective January 1, 2018 by
recording the cumulative effect of the adoption to our distributions and accumulated losses in excess of contributions. We applied
the new standard to contracts that were not complete at January 1, 2018. The comparative information for the years ended December
31, 2017 and 2016 contained within these combined financial statements and notes has not been restated and continues to be
reported under the accounting standards in effect for such periods. The implementation of ASU 2014-09 did not have a material
impact on our combined financial statements.
The principal impacts of ASU 2014-09 on our revenue recognition policies relate to our accounting for (i) time-limited
discounts and free service periods provided to our customers and (ii) certain upfront fees charged to our customers, as follows:
• When we enter into contracts to provide services to our customers, we often provide time-limited discounts or free service
periods. Under previous accounting rules, we recognized revenue net of discounts during the promotional periods and
did not recognize any revenue during free service periods. Under ASU 2014-09, revenue recognition for those contracts
that contain substantive termination penalties is recognized uniformly over the contractual period. For contracts that do
not have substantive termination penalties, we continue to record the impacts of partial or full discounts during the
applicable promotional periods.
• When we enter into contracts to provide services to our customers, we often charge installation or other upfront fees. Under
previous accounting rules, installation fees related to services provided over our cable networks were recognized as
revenue during the period in which the installation occurred to the extent these fees were equal to or less than direct selling
costs. Under ASU 2014-09, these fees are generally deferred and recognized as revenue over the contractual period, or
longer if the upfront fee results in a material renewal right.
ASU 2014-09 also impacted our accounting for certain upfront costs directly associated with obtaining customer
contracts. Under our previous policy, these costs were expensed as incurred unless the costs were in the scope of another accounting
topic that allowed for capitalization. Under ASU 2014-09, certain upfront costs associated with contracts that have substantive
termination penalties and a term of one year or more are recognized as assets and amortized to operating costs and expenses over
the applicable period benefited.
For additional information regarding the impact of our adoption of ASU 2014-09, see note 4.
The UPC Holding Group
Notes to Combined Financial Statements - (Continued)
December 31, 2018, 2017 and 2016
I-14
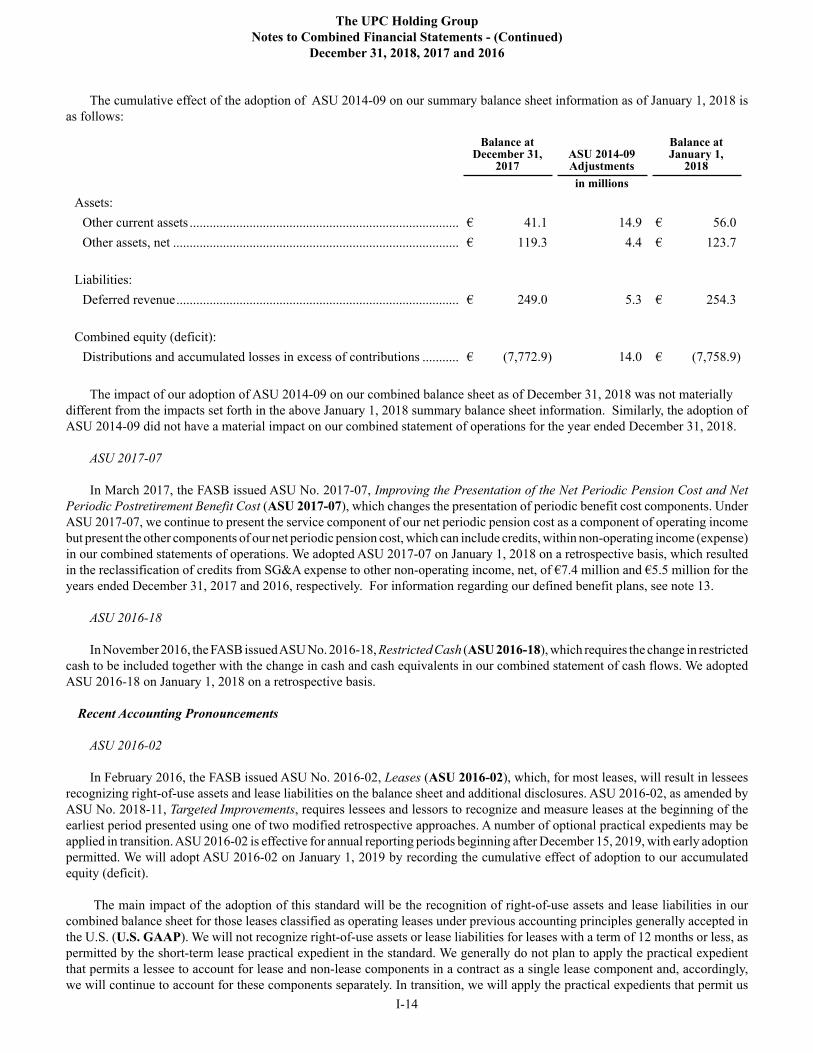
The cumulative effect of the adoption of ASU 2014-09 on our summary balance sheet information as of January 1, 2018 is
as follows:
Balance atDecember 31,
2017ASU 2014-09Adjustments
Balance atJanuary 1,
2018
in millions
Assets:
Other current assets ................................................................................. € 41.1 14.9 € 56.0
Other assets, net ...................................................................................... € 119.3 4.4 € 123.7
Liabilities:
Deferred revenue..................................................................................... € 249.0 5.3 € 254.3
Combined equity (deficit):
Distributions and accumulated losses in excess of contributions ........... € (7,772.9) 14.0 € (7,758.9)
The impact of our adoption of ASU 2014-09 on our combined balance sheet as of December 31, 2018 was not materially
different from the impacts set forth in the above January 1, 2018 summary balance sheet information. Similarly, the adoption of
ASU 2014-09 did not have a material impact on our combined statement of operations for the year ended December 31, 2018.
ASU 2017-07
In March 2017, the FASB issued ASU No. 2017-07, Improving the Presentation of the Net Periodic Pension Cost and Net
Periodic Postretirement Benefit Cost (ASU 2017-07), which changes the presentation of periodic benefit cost components. Under
ASU 2017-07, we continue to present the service component of our net periodic pension cost as a component of operating income
but present the other components of our net periodic pension cost, which can include credits, within non-operating income (expense)
in our combined statements of operations. We adopted ASU 2017-07 on January 1, 2018 on a retrospective basis, which resulted
in the reclassification of credits from SG&A expense to other non-operating income, net, of €7.4 million and €5.5 million for the
years ended December 31, 2017 and 2016, respectively. For information regarding our defined benefit plans, see note 13.
ASU 2016-18
In November 2016, the FASB issued ASU No. 2016-18, Restricted Cash (ASU 2016-18), which requires the change in restricted
cash to be included together with the change in cash and cash equivalents in our combined statement of cash flows. We adopted
ASU 2016-18 on January 1, 2018 on a retrospective basis.
Recent Accounting Pronouncements
ASU 2016-02
In February 2016, the FASB issued ASU No. 2016-02, Leases (ASU 2016-02), which, for most leases, will result in lessees
recognizing right-of-use assets and lease liabilities on the balance sheet and additional disclosures. ASU 2016-02, as amended by
ASU No. 2018-11, Targeted Improvements, requires lessees and lessors to recognize and measure leases at the beginning of the
earliest period presented using one of two modified retrospective approaches. A number of optional practical expedients may be
applied in transition. ASU 2016-02 is effective for annual reporting periods beginning after December 15, 2019, with early adoption
permitted. We will adopt ASU 2016-02 on January 1, 2019 by recording the cumulative effect of adoption to our accumulated
equity (deficit).
The main impact of the adoption of this standard will be the recognition of right-of-use assets and lease liabilities in our
combined balance sheet for those leases classified as operating leases under previous accounting principles generally accepted in
the U.S. (U.S. GAAP). We will not recognize right-of-use assets or lease liabilities for leases with a term of 12 months or less, as
permitted by the short-term lease practical expedient in the standard. We generally do not plan to apply the practical expedient
that permits a lessee to account for lease and non-lease components in a contract as a single lease component and, accordingly,
we will continue to account for these components separately. In transition, we will apply the practical expedients that permit us
The UPC Holding Group
Notes to Combined Financial Statements - (Continued)
December 31, 2018, 2017 and 2016
I-15
not to reassess (i) whether expired or existing contracts contain a lease under the new standard, (ii) the lease classification for
expired or existing leases or (iii) whether previously-capitalized initial direct costs would qualify for capitalization under the new
standard. In addition, we will not use hindsight during transition.
We are in the process of implementing a new lease accounting system and related internal controls to meet the requirements
of ASU 2016-02. While we are still evaluating the effect that ASU 2016-02 will have on our combined balance sheet, we expect
to record significant right-of-use assets and corresponding lease liabilities upon adoption. We do not expect our adoption of ASU
2016-02 will have a material impact on our combined statement of operations or cash flows.
Our current operating lease portfolio primarily includes leases related to network equipment and real estate. For a summary
of our undiscounted future minimum lease payments under non-cancellable operating leases as of December 31, 2018, see note
15.
ASU 2018-15
In August 2018, the FASB issued ASU No. 2018-15, Customer’s Accounting for Implementation Costs Incurred in a Cloud
Computing Arrangement that is a Service Contract (ASU 2018-15), which requires entities to defer implementation costs incurred
that are related to the application development stage in a cloud computing arrangement that is a service contract. Deferred
implementation costs will be amortized over the term of the cloud computing arrangement and presented in the same expense line
item as the cloud computing arrangement. All other implementation costs will be expensed as incurred. ASU 2018-15 is effective
for annual reporting periods beginning after December 15, 2020, including interim periods within those fiscal years, with early
adoption permitted. We are currently evaluating the effect that ASU 2018-15 will have on our combined financial statements.
(3) Summary of Significant Accounting Policies
Estimates
The preparation of financial statements in conformity with U.S. GAAP requires management to make estimates and
assumptions that affect the reported amounts of assets and liabilities at the date of the financial statements and the reported amounts
of revenue and expenses during the reporting period. Estimates and assumptions are used in accounting for, among other things,
the valuation of acquisition-related assets and liabilities, allowances for uncollectible accounts, certain components of revenue,
programming and copyright costs, deferred income taxes and related valuation allowances, loss contingencies, fair value
measurements, impairment assessments, capitalization of internal costs associated with construction and installation activities,
useful lives of long-lived assets, share-based compensation and actuarial liabilities associated with certain benefit plans. Actual
results could differ from those estimates.
Reclassifications
Certain prior year amounts have been reclassified to conform to the current year presentation.
Principles of Combination
The accompanying combined financial statements include the accounts of the entities described in note 1, all of which are
voting interest entities where we or Liberty Global exercise a controlling financial interest through the ownership of a direct or
indirect controlling voting interest and variable interest entities for which our company is the primary beneficiary. All significant
intercompany accounts and transactions have been eliminated in combination.
Cash and Cash Equivalents and Restricted Cash
Cash equivalents consist of money market funds and other investments that are readily convertible into cash and have maturities
of three months or less at the time of acquisition. We record money market funds at the net asset value as there are no restrictions
on our ability, contractual or otherwise, to redeem our investments at the stated net asset value.
Restricted cash consists of cash held in restricted accounts, including cash held as collateral for debt and other compensating
balances. Restricted cash amounts that are required to be used to purchase long-term assets or repay long-term debt are classified
The UPC Holding Group
Notes to Combined Financial Statements - (Continued)
December 31, 2018, 2017 and 2016
I-16
as long-term assets. All other cash that is restricted to a specific use is classified as current or long-term based on the expected
timing of the disbursement.
Our significant non-cash investing and financing activities are disclosed in our combined statements of equity (deficit) and
in notes 5, 8, 9, 11 and 12.
Cash Flow Statement
For the purpose of determining the classification of cash flows in our combined statements of cash flows, payments on related-
party loans are first applied to principal (included as cash flows from financing activities) and then to capitalized interest (included
as cash flows from operating activities). Interest-bearing cash advances to related parties and repayments thereof are classified as
investing activities. Receipts on related-party receivables are first applied to principal (included as cash flows from investing
activities) and then to capitalized interest (included as cash flows from operating activities). All other related-party borrowings,
advances and repayments are reflected as financing activities.
For the purpose of our combined statements of cash flows, expenses financed by an intermediary are treated as hypothetical
operating cash outflows and hypothetical financing cash inflows when the expenses are incurred. When we pay the financing
intermediary, we record financing cash outflows in our combined statements of cash flows.
The capital expenditures that we report in our combined statements of cash flows do not include (i) amounts that are financed
under capital-related vendor financing or capital lease arrangements or (ii) purchased assets transferred to our company by another
entity under the common control of Liberty Global in exchange for non-cash increases to the Shareholder Loan or non-cash
contributions from our parent entities (non-cash related-party capital additions). Instead, these amounts are reflected as non-cash
additions to our property and equipment when the underlying assets are delivered, and in the case of capital-related vendor financing
and capital lease arrangements and non-cash related-party capital additions that are settled through increases to the Shareholder
Loan, as repayments of debt when the principal is repaid.
Trade Receivables
Our trade receivables are reported net of an allowance for doubtful accounts. Such allowance aggregated €4.6 million and
€5.7 million at December 31, 2018 and 2017, respectively. The allowance for doubtful accounts is based upon our assessment of
probable loss related to uncollectible accounts receivable. We use a number of factors in determining the allowance, including,
among other things, collection trends, prevailing and anticipated economic conditions and specific customer credit risk. The
allowance is maintained until either payment is received or the likelihood of collection is considered to be remote.
Concentration of credit risk with respect to trade receivables is limited due to the large number of residential and business
customers. We also manage this risk by disconnecting services to customers whose accounts are delinquent.
Financial Instruments
Due to the short maturities of cash and cash equivalents, restricted cash, short-term liquid investments, trade and other
receivables, other current assets, accounts payable, accrued liabilities and other accrued and current liabilities, their respective
carrying values approximate their respective fair values. For information concerning the fair values of certain of our derivatives
and debt, see notes 6 and 9, respectively. For information regarding how we arrive at certain of our fair value measurements, see
note 7.
Derivative Instruments
All derivative instruments are recorded on the balance sheet at fair value. As we do not apply hedge accounting to any of our
derivative instruments, changes in the fair values of our derivative instruments are recorded in realized and unrealized gains or
losses on derivative instruments, net, in our combined statements of operations.
The net cash received or paid related to our derivative instruments is classified as an operating, investing or financing activity
in our combined statements of cash flows based on the objective of the derivative instrument and the classification of the applicable
underlying cash flows. For derivative contracts that are terminated prior to maturity, the cash paid or received upon termination
that relates to future periods is classified as a financing activity in our combined statements of cash flows.
The UPC Holding Group
Notes to Combined Financial Statements - (Continued)
December 31, 2018, 2017 and 2016
I-17
For information regarding our derivative instruments, see note 6.
Property and Equipment
Property and equipment are stated at cost less accumulated depreciation. We capitalize costs associated with the construction
of new cable and mobile transmission and distribution facilities and the installation of new cable services. Capitalized construction
and installation costs include materials, labor and other directly attributable costs. Installation activities that are capitalized include
(i) the initial connection (or drop) from our cable system to a customer location, (ii) the replacement of a drop and (iii) the installation
of equipment for additional services, such as digital cable, telephone or broadband internet service. The costs of other customer-
facing activities, such as reconnecting and disconnecting customer locations and repairing or maintaining drops, are expensed as
incurred. Interest capitalized with respect to construction activities was not material during any of the periods presented.
Capitalized internal-use software is included as a component of property and equipment. We capitalize internal and external
costs directly associated with the development of internal-use software. We also capitalize costs associated with the purchase of
software licenses. Maintenance and training costs, as well as costs incurred during the preliminary stage of an internal-use software
development project, are expensed as incurred.
Depreciation is computed using the straight-line method over the estimated useful life of the underlying asset. Equipment
under capital leases is amortized on a straight-line basis over the shorter of the lease term or estimated useful life of the asset.
Useful lives used to depreciate our property and equipment are assessed periodically and are adjusted when warranted. The useful
lives of cable and mobile distribution systems that are undergoing a rebuild are adjusted such that property and equipment to be
retired will be fully depreciated by the time the rebuild is completed. For additional information regarding the useful lives of our
property and equipment, see note 8.
Additions, replacements and improvements that extend the asset life are capitalized. Repairs and maintenance are charged to
operations.
We recognize a liability for asset retirement obligations in the period in which it is incurred if sufficient information is available
to make a reasonable estimate of fair values. Asset retirement obligations may arise from the loss of rights of way that we obtain
from local municipalities or other relevant authorities, as well as our obligations under certain lease arrangements to restore the
property to its original condition at the end of the lease term. Given the nature of our operations, most of our rights of way and
certain leased premises are considered integral to our business. Accordingly, for most of our rights of way and certain lease
agreements, the possibility is remote that we will incur significant removal costs in the foreseeable future and, as such, we do not
have sufficient information to make a reasonable estimate of fair value for these asset retirement obligations.
As of December 31, 2018 and 2017, the recorded value of our asset retirement obligations was €1.9 million.
Intangible Assets
Our primary intangible assets relate to goodwill and customer relationships. Goodwill represents the excess purchase price
over the fair value of the identifiable net assets acquired in a business combination. Customer relationships are initially recorded
at their fair value in connection with business combinations.
Goodwill is not amortized, but instead is tested for impairment at least annually. Intangible assets with finite lives are amortized
on a straight-line basis over their respective estimated useful lives to their estimated residual values and reviewed for impairment.
For additional information regarding the useful lives of our intangible assets, see note 8.
Impairment of Property and Equipment and Intangible Assets
When circumstances warrant, we review the carrying amounts of our property and equipment and our intangible assets (other
than goodwill ) to determine whether such carrying amounts continue to be recoverable. Such changes in circumstance may include
(i) an expectation of a sale or disposal of a long-lived asset or asset group, (ii) adverse changes in market or competitive conditions,
(iii) an adverse change in legal factors or business climate in the markets in which we operate and (iv) operating or cash flow
losses. For purposes of impairment testing, long-lived assets are grouped at the lowest level for which cash flows are largely
The UPC Holding Group
Notes to Combined Financial Statements - (Continued)
December 31, 2018, 2017 and 2016
I-18
independent of other assets and liabilities, generally at or below the reporting unit level (see below). If the carrying amount of the
asset or asset group is greater than the expected undiscounted cash flows to be generated by such asset or asset group, an impairment
adjustment is recognized. Such adjustment is measured by the amount that the carrying value of such asset or asset group exceeds
its fair value. We generally measure fair value by considering (a) sale prices for similar assets, (b) discounted estimated future
cash flows using an appropriate discount rate and/or (c) estimated replacement cost. Assets to be disposed of are recorded at the
lower of their carrying amount or fair value less costs to sell.
We evaluate goodwill for impairment at least annually on October 1 and whenever facts and circumstances indicate that the
carrying amount may not be recoverable. For impairment evaluations, we first make a qualitative assessment to determine if the
goodwill may be impaired. If it is more-likely-than-not that a reporting unit’s fair value is less than its carrying value, we then
compare the fair value of the reporting unit to its respective carrying amount. Any excess of the carrying amount over the fair
value would be charged to operations as an impairment loss. A reporting unit is an operating segment or one level below an operating
segment (referred to as a “component”).
Income Taxes
Income taxes are accounted for under the asset and liability method. We recognize deferred tax assets and liabilities for the
future tax consequences attributable to differences between the financial statement carrying amounts and income tax basis of assets
and liabilities and the expected benefits of utilizing net operating loss and tax credit carryforwards, using enacted tax rates in effect
for each taxing jurisdiction in which we operate for the year in which those temporary differences are expected to be recovered
or settled. We recognize the financial statement effects of a tax position when it is more-likely-than-not, based on technical merits,
that the position will be sustained upon examination. Net deferred tax assets are then reduced by a valuation allowance if we
believe it is more-likely-than-not such net deferred tax assets will not be realized. The effect on deferred tax assets and liabilities
of a change in tax rates is recognized in earnings in the period that includes the enactment date. Deferred tax liabilities related to
investments in foreign subsidiaries and foreign corporate joint ventures that are essentially permanent in duration are not recognized
until it becomes apparent that such amounts will reverse in the foreseeable future. In order to be considered essentially permanent
in duration, sufficient evidence must indicate that the foreign subsidiary has invested or will invest its undistributed earnings
indefinitely, or that earnings will be remitted in a tax-free manner. Interest and penalties related to income tax liabilities are included
in income tax benefit or expense in our combined statements of operations.
The Dutch entities of the UPC Holding Group are part of two fiscal unities. UPC Holding is the parent of the largest of these
fiscal unities (the UPCH Fiscal Unity). The UPCH Fiscal Unity is part of the larger fiscal unity of Liberty Global Holding B.V.
(Liberty Global Holding), which consolidates individual entities and their ultimate Dutch parent company, as one taxpayer for
Dutch tax purposes (the LGH Fiscal Unity). The LGH Fiscal Unity includes Dutch entities from the UPCH Fiscal Unity, as well
as Dutch entities not included in these combined financial statements. The income taxes of the Dutch entities of the UPC Holding
Group are presented in our combined statements of operations on a separate return basis for each tax paying entity or group. The
individual entities of the Dutch fiscal unities are jointly and severally liable for all corporate income tax liabilities and the income
taxes of their respective fiscal unity. For additional information on our income taxes, see note 10.
Foreign Currency Translation and Transactions
The reporting currency of our company is the euro. The functional currency of our foreign operations generally is the applicable
local currency for each foreign entity and equity method investee. Assets and liabilities of foreign entities (including intercompany
balances for which settlement is not anticipated in the foreseeable future) are translated at the spot rate in effect at the applicable
reporting date. With the exception of certain material transactions, the amounts reported in our combined statements of operations
are translated at the average exchange rates in effect during the applicable period. The resulting unrealized cumulative translation
adjustment, net of applicable income taxes, is recorded as a component of accumulated other comprehensive earnings or loss in
our combined statements of equity (deficit). With the exception of certain material transactions, the cash flows from our operations
in foreign countries are translated at the average rate for the applicable period in our combined statements of cash flows. The
impacts of material transactions generally are recorded at the applicable spot rates in our combined statements of operations and
cash flows. The effect of exchange rates on cash balances held in foreign currencies are separately reported in our combined
statements of cash flows.
Transactions denominated in currencies other than our or our combined entities’ functional currencies are recorded based on
exchange rates at the time such transactions arise. Changes in exchange rates with respect to amounts recorded in our combined
balance sheets related to these non-functional currency transactions result in transaction gains and losses that are reflected in our
The UPC Holding Group
Notes to Combined Financial Statements - (Continued)
December 31, 2018, 2017 and 2016
I-19
combined statements of operations as unrealized (based on the applicable period end exchange rates) or realized upon settlement
of the transactions.
Revenue Recognition
Service Revenue – Cable Networks. We recognize revenue from the provision of video, broadband internet and fixed-line
telephony services over our cable network to customers in the period the related services are provided, with the exception of
revenue recognized pursuant to certain contracts that contain promotional discounts, as described below. Installation fees related
to services provided over our cable network are generally deferred and recognized as revenue over the contractual period, or longer
if the upfront fee results in a material renewal right.
Sale of Multiple Products and Services. We sell video, broadband internet, fixed-line telephony and, in some of our markets,
mobile services to our customers in bundled packages at a rate lower than if the customer purchased each product on a standalone
basis. Revenue from bundled packages generally is allocated proportionally to the individual products or services based on the
relative standalone selling price for each respective product or service.
Mobile Revenue – General. Consideration from mobile contracts is allocated to the airtime service component and the handset
component based on the relative standalone selling prices of each component. In markets where we offer handsets and airtime
services in separate contracts entered into at the same time, we account for these contracts as a single contract.
Mobile Revenue – Airtime Services. We recognize revenue from mobile services in the period in which the related services
are provided. Revenue from pre-pay customers is deferred prior to the commencement of services and recognized as the services
are rendered or usage rights expire.
Mobile Revenue – Handset Revenue. Revenue from the sale of handsets is recognized at the point in which the goods have
been transferred to the customer. Some of our mobile handset contracts that permit the customer to take control of the handset
upfront and pay for the handset in installments over a contractual period may contain a significant financing component. For
contracts with terms of one year or more, we recognize any significant financing component as revenue over the contractual period
using the effective interest method. We do not record the effect of a significant financing component if the contractual period is
less than one year.
Business-to-Business (B2B) Revenue. We defer upfront installation and certain nonrecurring fees received on B2B contracts
where we maintain ownership of the installed equipment. The deferred fees are amortized into revenue on a straight-line basis,
generally over the longer of the term of the arrangement or the expected period of performance.
Contract Costs. Incremental costs to obtain a contract with a customer, such as incremental sales commissions, are generally
recognized as assets and amortized to SG&A expenses over the applicable period benefited, which generally is the contract life.
If, however, the amortization period is less than one year, we expense such costs in the period incurred.
Promotional Discounts. For subscriber promotions, such as discounted or free services during an introductory period, revenue
is recognized uniformly over the contractual period if the contract has substantive termination penalties. If a contract does not
have substantive termination penalties, revenue is recognized only to the extent of the discounted monthly fees charged to the
subscriber, if any.
Subscriber Advance Payments. Payments received in advance for the services we provide are deferred and recognized as
revenue when the associated services are provided.
Sales, Use and Other Value-Added Taxes. Revenue is recorded net of applicable sales, use and other value-added taxes.
For additional information regarding our revenue recognition and related costs, see note 4. For a disaggregation of our revenue
by major category and by reportable and geographic segment, see note 16.
The UPC Holding Group
Notes to Combined Financial Statements - (Continued)
December 31, 2018, 2017 and 2016
I-20
Share-based Compensation
We recognize all share-based payments from Liberty Global to employees of our combined entities, including grants of
employee share-based incentive awards, based on their grant date fair values and Liberty Global’s estimates of forfeitures. We
recognize the grant date fair value of outstanding awards as a charge to operations over the vesting period.
We use the straight-line method to recognize share-based compensation expense for Liberty Global’s outstanding share awards
to employees of our combined entities that do not contain a performance condition and the accelerated expense attribution method
for our outstanding share awards that contain a performance condition and vest on a graded basis.
The grant date fair values for options, share appreciation rights (SARs) and performance-based share appreciation rights
(PSARs) are estimated using the Black-Scholes option pricing model, and the grant date fair values for restricted share units
(RSUs) and performance-based restricted share units (PSUs) are based upon the closing share price of Liberty Global ordinary
shares on the date of grant. Liberty Global considers historical exercise trends in its calculation of the expected life of options and
SARs granted by Liberty Global to employees. The expected volatility for options and SARs related to Liberty Global ordinary
shares is generally based on a combination of (i) historical volatilities for a period equal to the expected average life of the awards
and (ii) volatilities implied from publicly-traded options for Liberty Global ordinary shares.
Litigation Costs
Legal fees and related litigation costs are expensed as incurred.
(4) Revenue Recognition and Related Costs
Contract Balances
If we transfer goods or services to a customer but do not have an unconditional right to payment, we record a contract asset.
Contract assets typically arise from the uniform recognition of introductory promotional discounts over the contract period and
accrued revenue for handset sales. Our contract assets were €3.7 million and €2.6 million as of December 31, 2018 and January
1, 2018, respectively. The current and long-term portions of our contract asset balance at December 31, 2018 are included within
other current assets and other assets, net, respectively, in our combined balance sheet.
We record deferred revenue when we receive payment prior to transferring goods or services to a customer. We primarily
defer revenue for (i) installation and other upfront services and (ii) other services that are invoiced prior to when services are
provided. Our deferred revenue balances were €216.2 million and €256.4 million as of December 31, 2018 and January 1, 2018,
respectively. The decrease in deferred revenue during 2018 is primarily due to €250.7 million of revenue recognized that was
included in our deferred revenue balance at January 1, 2018, partially offset by advanced billings recorded in the period. The
current and long-term portions of our deferred revenue balance at December 31, 2018 are included within deferred revenue and
other long-term liabilities, respectively, in our combined balance sheet.
Contract Costs
Our aggregate assets associated with incremental costs to obtain our contracts were €14.4 million and €15.8 million at
December 31, 2018 and January 1, 2018, respectively. The current and long-term portions of our assets related to contract costs
at December 31, 2018 are included within other current assets and other assets, net, respectively, in our combined balance sheet.
We amortized €19.0 million to operating costs and expenses during 2018 related to these assets.
Unsatisfied Performance Obligations
A large portion of our revenue is derived from customers who are not subject to contracts. Revenue from customers who are
subject to contracts is generally recognized over the term of such contracts, which is typically 12 months for our residential service
contracts, one to three years for our mobile service contracts and one to five years for our B2B service contracts.
The UPC Holding Group
Notes to Combined Financial Statements - (Continued)
December 31, 2018, 2017 and 2016
I-21
(5) Dispositions
Pending and Completed Dispositions
Vodafone Disposal Group
On May 9, 2018, Liberty Global and certain of its subsidiaries entered into a sale and purchase agreement (the Vodafone
Agreement) with Vodafone Group plc (Vodafone) and certain of its subsidiaries, pursuant to which Liberty Global will sell its
ownership interest in certain of its operations, including its interest in our operations in Romania, Hungary and the Czech Republic
(excluding UPC DTH) to Vodafone. The operations of Romania, Hungary and the Czech Republic are collectively referred to
herein as the “Vodafone Disposal Group.”
Closing of the transaction is subject to various conditions, including regulatory approval, which is expected to be obtained in
mid-2019. The Vodafone Agreement contains certain termination rights for both Liberty Global and Vodafone, including if closing
has not occurred by November 9, 2019, or May 9, 2020 in certain limited circumstances. Pursuant to the Vodafone Agreement,
we will retain all cash generated from the Vodafone Disposal Group through the closing of the transaction.
UPC Austria
On July 31, 2018, Liberty Global Europe Holdco 2 BV (LGE Holdco 2) completed the sale of its Austrian operations, “UPC
Austria,” to Deutsche Telekom AG (Deutsche Telekom). Just prior to completion of the sale of UPC Austria, UPC Austria and
LGE Holdco 2 were distributed out of the UPC Holding Group to another subsidiary of Liberty Global (the UPC Austria
Distribution) and therefore are no longer included within the UPC borrowing group. As a result of the UPC Austria Distribution,
the results of the sale of UPC Austria are not reflected in our combined financial statements. The distribution was accounted for
at carryover basis as a transaction under common control. As UPC Austria was already presented as a discontinued operation and
LGE Holdco 2 did not have any material activity, other than certain intercompany transactions with other entities of the UPC
Holding Group, we did not give retrospective effect to the UPC Austria Distribution in our combined financial statements. As
such, the results and cash flows of UPC Austria (presented as a discontinued operation) and LGE Holdco 2 (presented as a continuing
operation) are included in our combined financial statements through July 31, 2018. In connection with the UPC Austria Distribution
we (i) received a capital contribution from one of our immediate parents, LGE Financing B.V. (LGE Financing) of €350.0 million,
which was used to fund certain intercompany transactions, including a €350.0 million loan to another subsidiary of Liberty Global
by LGE Holdco 2 prior to the UPC Austria Distribution, and (ii) equity-settled a loan receivable of €933.6 million due from LGE
Financing, which was established and settled in connection with the UPC Austria Distribution.
Upon completion of the sale of UPC Austria, we (i) were loaned a portion of the net cash proceeds received by LGE Holdco
2 through a related-party loan and (ii) received €396.6 million of cash upon the post-completion settlement of a related-party
receivable due from UPC Austria (the UPC Austria Receivable). We used this cash to repay or redeem an aggregate €842.8 million
(equivalent at the applicable dates) principal amount of our outstanding debt, including (i) the repayment of €782.8 million
(equivalent at the repayment date) principal amount under the UPC Holding Bank Facility and (ii) the redemption of €60.0 million
principal amount of the UPCB SPE Notes. For additional information regarding our debt obligations, see note 9.
UPC DTH
On December 21, 2018, Liberty Global and certain of its subsidiaries entered into a sale and purchase agreement (the UPC
DTH Agreement) with M7 Group (M7), pursuant to which Liberty Global will sell its ownership interest in UPC DTH for an
enterprise value of approximately €180 million. Closing of the transaction is subject to regulatory approval, which is expected in
the first half of 2019.
Presentation of Discontinued Operations
The operations of UPC Austria, the Vodafone Disposal Group and UPC DTH are presented as discontinued operations in our
combined financial statements for all periods. In connection with the signing of each respective sales agreement, we ceased to
depreciate or amortize the long-lived assets of (i) UPC Austria on December 22, 2017, (ii) the Vodafone Disposal Group on May
9, 2018 and (iii) UPC DTH on December 21, 2018. No debt, interest expense or derivative instruments of the UPC Holding Group,
other than with respect to certain borrowings that are direct obligations of the entities to be disposed, has been allocated to
discontinued operations. As discussed above, a portion of the proceeds LGE Holdco 2 received from the disposition of UPC Austria
The UPC Holding Group
Notes to Combined Financial Statements - (Continued)
December 31, 2018, 2017 and 2016
I-22
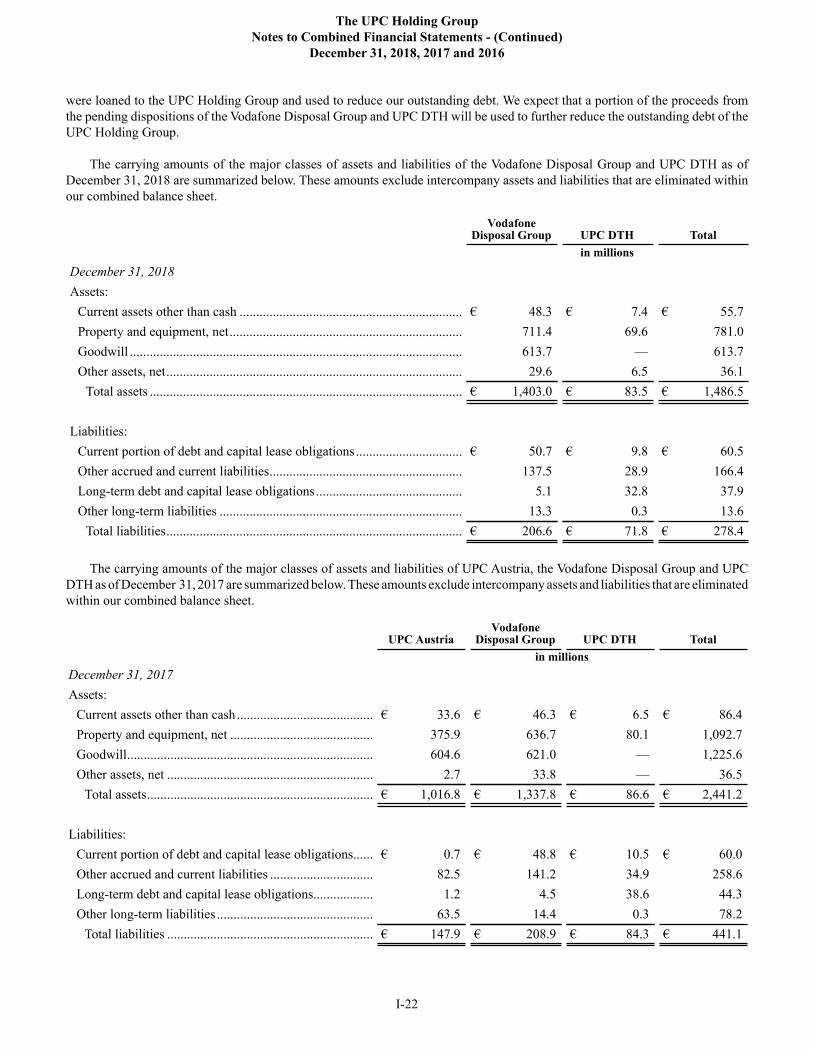
were loaned to the UPC Holding Group and used to reduce our outstanding debt. We expect that a portion of the proceeds from
the pending dispositions of the Vodafone Disposal Group and UPC DTH will be used to further reduce the outstanding debt of the
UPC Holding Group.
The carrying amounts of the major classes of assets and liabilities of the Vodafone Disposal Group and UPC DTH as of
December 31, 2018 are summarized below. These amounts exclude intercompany assets and liabilities that are eliminated within
our combined balance sheet.
VodafoneDisposal Group UPC DTH Total
in millions
December 31, 2018
Assets:
Current assets other than cash ................................................................... € 48.3 € 7.4 € 55.7
Property and equipment, net...................................................................... 711.4 69.6 781.0
Goodwill .................................................................................................... 613.7 — 613.7
Other assets, net......................................................................................... 29.6 6.5 36.1
Total assets .............................................................................................. € 1,403.0 € 83.5 € 1,486.5
Liabilities:
Current portion of debt and capital lease obligations................................ € 50.7 € 9.8 € 60.5
Other accrued and current liabilities.......................................................... 137.5 28.9 166.4
Long-term debt and capital lease obligations............................................ 5.1 32.8 37.9
Other long-term liabilities ......................................................................... 13.3 0.3 13.6
Total liabilities......................................................................................... € 206.6 € 71.8 € 278.4
The carrying amounts of the major classes of assets and liabilities of UPC Austria, the Vodafone Disposal Group and UPC
DTH as of December 31, 2017 are summarized below. These amounts exclude intercompany assets and liabilities that are eliminated
within our combined balance sheet.
UPC AustriaVodafone
Disposal Group UPC DTH Total
in millions
December 31, 2017
Assets:
Current assets other than cash ......................................... € 33.6 € 46.3 € 6.5 € 86.4
Property and equipment, net ........................................... 375.9 636.7 80.1 1,092.7
Goodwill.......................................................................... 604.6 621.0 — 1,225.6
Other assets, net .............................................................. 2.7 33.8 — 36.5
Total assets.................................................................... € 1,016.8 € 1,337.8 € 86.6 € 2,441.2
Liabilities:
Current portion of debt and capital lease obligations...... € 0.7 € 48.8 € 10.5 € 60.0
Other accrued and current liabilities ............................... 82.5 141.2 34.9 258.6
Long-term debt and capital lease obligations.................. 1.2 4.5 38.6 44.3
Other long-term liabilities ............................................... 63.5 14.4 0.3 78.2
Total liabilities .............................................................. € 147.9 € 208.9 € 84.3 € 441.1
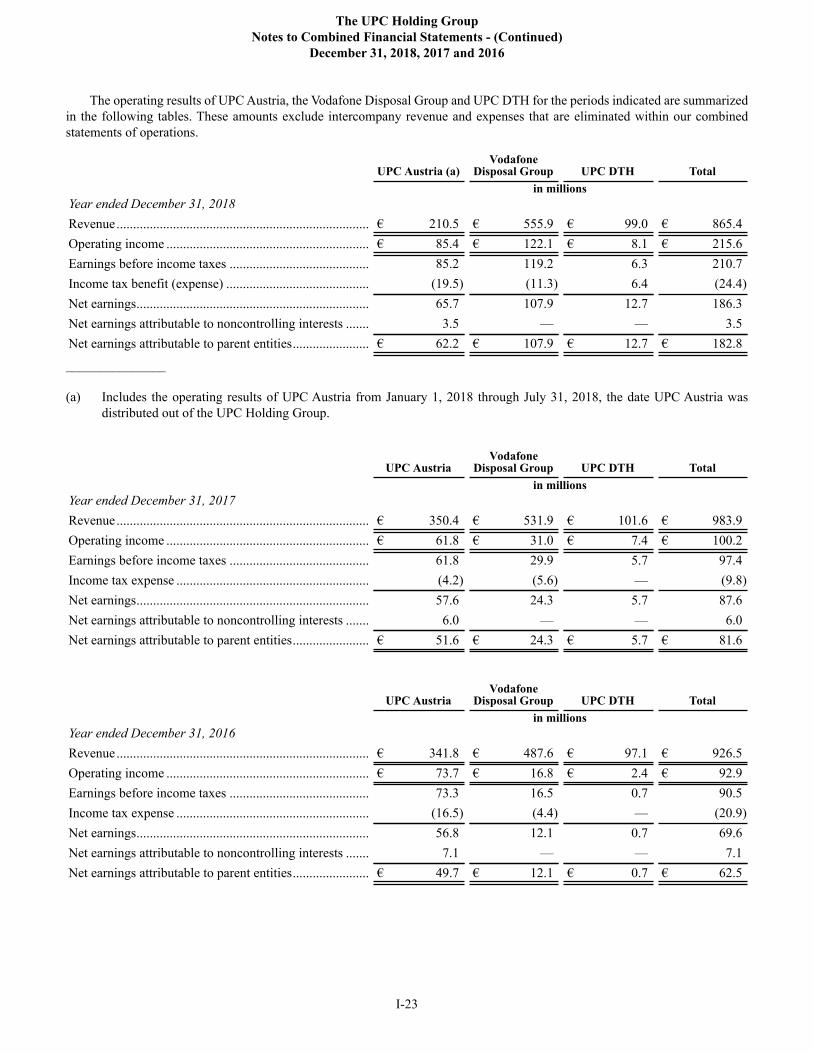
The UPC Holding Group
Notes to Combined Financial Statements - (Continued)
December 31, 2018, 2017 and 2016
I-23
The operating results of UPC Austria, the Vodafone Disposal Group and UPC DTH for the periods indicated are summarized
in the following tables. These amounts exclude intercompany revenue and expenses that are eliminated within our combined
statements of operations.
UPC Austria (a)Vodafone
Disposal Group UPC DTH Total
in millions
Year ended December 31, 2018
Revenue............................................................................ € 210.5 € 555.9 € 99.0 € 865.4
Operating income ............................................................. € 85.4 € 122.1 € 8.1 € 215.6
Earnings before income taxes .......................................... 85.2 119.2 6.3 210.7
Income tax benefit (expense) ........................................... (19.5) (11.3) 6.4 (24.4)
Net earnings...................................................................... 65.7 107.9 12.7 186.3
Net earnings attributable to noncontrolling interests ....... 3.5 — — 3.5
Net earnings attributable to parent entities....................... € 62.2 € 107.9 € 12.7 € 182.8
_______________
(a) Includes the operating results of UPC Austria from January 1, 2018 through July 31, 2018, the date UPC Austria was
distributed out of the UPC Holding Group.
UPC AustriaVodafone
Disposal Group UPC DTH Total
in millions
Year ended December 31, 2017
Revenue............................................................................ € 350.4 € 531.9 € 101.6 € 983.9
Operating income ............................................................. € 61.8 € 31.0 € 7.4 € 100.2
Earnings before income taxes .......................................... 61.8 29.9 5.7 97.4
Income tax expense .......................................................... (4.2) (5.6) — (9.8)
Net earnings...................................................................... 57.6 24.3 5.7 87.6
Net earnings attributable to noncontrolling interests ....... 6.0 — — 6.0
Net earnings attributable to parent entities....................... € 51.6 € 24.3 € 5.7 € 81.6
UPC AustriaVodafone
Disposal Group UPC DTH Total
in millions
Year ended December 31, 2016
Revenue............................................................................ € 341.8 € 487.6 € 97.1 € 926.5
Operating income ............................................................. € 73.7 € 16.8 € 2.4 € 92.9
Earnings before income taxes .......................................... 73.3 16.5 0.7 90.5
Income tax expense .......................................................... (16.5) (4.4) — (20.9)
Net earnings...................................................................... 56.8 12.1 0.7 69.6
Net earnings attributable to noncontrolling interests ....... 7.1 — — 7.1
Net earnings attributable to parent entities....................... € 49.7 € 12.1 € 0.7 € 62.5
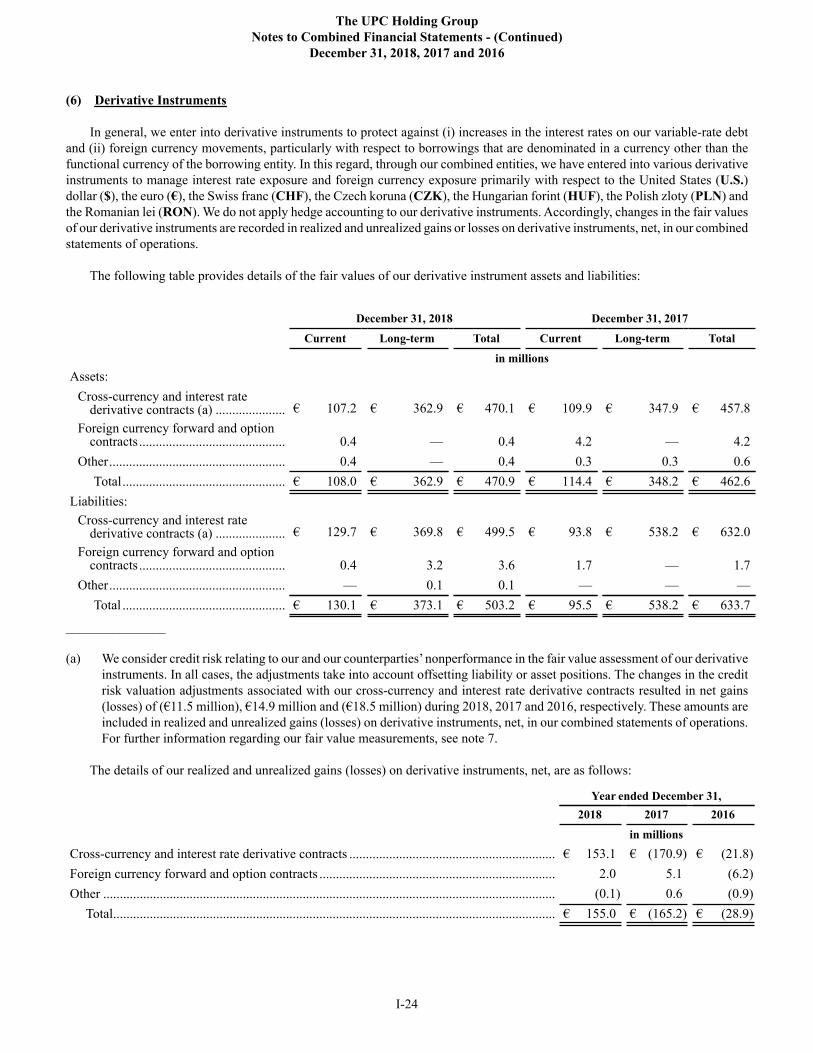
The UPC Holding Group
Notes to Combined Financial Statements - (Continued)
December 31, 2018, 2017 and 2016
I-24
(6) Derivative Instruments
In general, we enter into derivative instruments to protect against (i) increases in the interest rates on our variable-rate debt
and (ii) foreign currency movements, particularly with respect to borrowings that are denominated in a currency other than the
functional currency of the borrowing entity. In this regard, through our combined entities, we have entered into various derivative
instruments to manage interest rate exposure and foreign currency exposure primarily with respect to the United States (U.S.)
dollar ($), the euro (€), the Swiss franc (CHF), the Czech koruna (CZK), the Hungarian forint (HUF), the Polish zloty (PLN) and
the Romanian lei (RON). We do not apply hedge accounting to our derivative instruments. Accordingly, changes in the fair values
of our derivative instruments are recorded in realized and unrealized gains or losses on derivative instruments, net, in our combined
statements of operations.
The following table provides details of the fair values of our derivative instrument assets and liabilities:
December 31, 2018 December 31, 2017
Current Long-term Total Current Long-term Total
in millions
Assets:
Cross-currency and interest ratederivative contracts (a) ..................... € 107.2 € 362.9 € 470.1 € 109.9 € 347.9 € 457.8
Foreign currency forward and optioncontracts............................................ 0.4 — 0.4 4.2 — 4.2
Other..................................................... 0.4 — 0.4 0.3 0.3 0.6
Total................................................. € 108.0 € 362.9 € 470.9 € 114.4 € 348.2 € 462.6
Liabilities:
Cross-currency and interest ratederivative contracts (a) ..................... € 129.7 € 369.8 € 499.5 € 93.8 € 538.2 € 632.0
Foreign currency forward and optioncontracts............................................ 0.4 3.2 3.6 1.7 — 1.7
Other..................................................... — 0.1 0.1 — — —
Total ................................................. € 130.1 € 373.1 € 503.2 € 95.5 € 538.2 € 633.7
_______________
(a) We consider credit risk relating to our and our counterparties’ nonperformance in the fair value assessment of our derivative
instruments. In all cases, the adjustments take into account offsetting liability or asset positions. The changes in the credit
risk valuation adjustments associated with our cross-currency and interest rate derivative contracts resulted in net gains
(losses) of (€11.5 million), €14.9 million and (€18.5 million) during 2018, 2017 and 2016, respectively. These amounts are
included in realized and unrealized gains (losses) on derivative instruments, net, in our combined statements of operations.
For further information regarding our fair value measurements, see note 7.
The details of our realized and unrealized gains (losses) on derivative instruments, net, are as follows:
Year ended December 31,
2018 2017 2016
in millions
Cross-currency and interest rate derivative contracts .............................................................. € 153.1 € (170.9) € (21.8)
Foreign currency forward and option contracts ....................................................................... 2.0 5.1 (6.2)
Other ........................................................................................................................................ (0.1) 0.6 (0.9)
Total..................................................................................................................................... € 155.0 € (165.2) € (28.9)
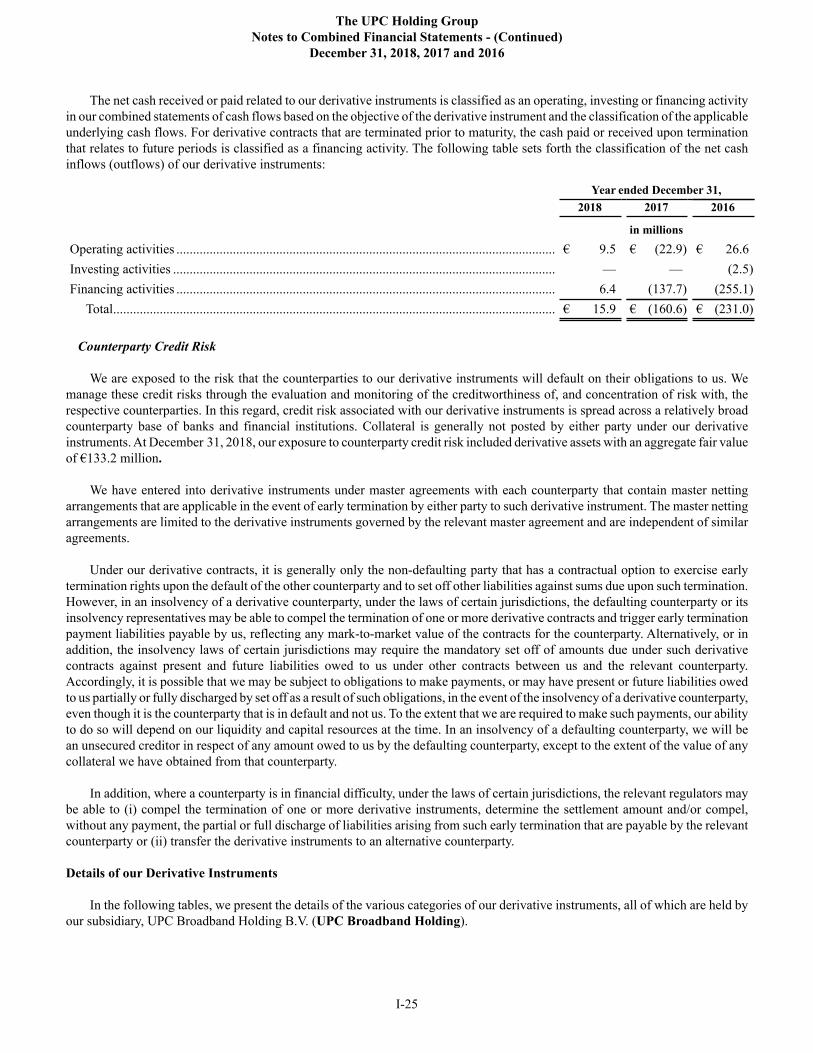
The UPC Holding Group
Notes to Combined Financial Statements - (Continued)
December 31, 2018, 2017 and 2016
I-25
The net cash received or paid related to our derivative instruments is classified as an operating, investing or financing activity
in our combined statements of cash flows based on the objective of the derivative instrument and the classification of the applicable
underlying cash flows. For derivative contracts that are terminated prior to maturity, the cash paid or received upon termination
that relates to future periods is classified as a financing activity. The following table sets forth the classification of the net cash
inflows (outflows) of our derivative instruments:
Year ended December 31,
2018 2017 2016
in millions
Operating activities .................................................................................................................. € 9.5 € (22.9) € 26.6
Investing activities ................................................................................................................... — — (2.5)
Financing activities .................................................................................................................. 6.4 (137.7) (255.1)
Total..................................................................................................................................... € 15.9 € (160.6) € (231.0)
Counterparty Credit Risk
We are exposed to the risk that the counterparties to our derivative instruments will default on their obligations to us. We
manage these credit risks through the evaluation and monitoring of the creditworthiness of, and concentration of risk with, the
respective counterparties. In this regard, credit risk associated with our derivative instruments is spread across a relatively broad
counterparty base of banks and financial institutions. Collateral is generally not posted by either party under our derivative
instruments. At December 31, 2018, our exposure to counterparty credit risk included derivative assets with an aggregate fair value
of €133.2 million.
We have entered into derivative instruments under master agreements with each counterparty that contain master netting
arrangements that are applicable in the event of early termination by either party to such derivative instrument. The master netting
arrangements are limited to the derivative instruments governed by the relevant master agreement and are independent of similar
agreements.
Under our derivative contracts, it is generally only the non-defaulting party that has a contractual option to exercise early
termination rights upon the default of the other counterparty and to set off other liabilities against sums due upon such termination.
However, in an insolvency of a derivative counterparty, under the laws of certain jurisdictions, the defaulting counterparty or its
insolvency representatives may be able to compel the termination of one or more derivative contracts and trigger early termination
payment liabilities payable by us, reflecting any mark-to-market value of the contracts for the counterparty. Alternatively, or in
addition, the insolvency laws of certain jurisdictions may require the mandatory set off of amounts due under such derivative
contracts against present and future liabilities owed to us under other contracts between us and the relevant counterparty.
Accordingly, it is possible that we may be subject to obligations to make payments, or may have present or future liabilities owed
to us partially or fully discharged by set off as a result of such obligations, in the event of the insolvency of a derivative counterparty,
even though it is the counterparty that is in default and not us. To the extent that we are required to make such payments, our ability
to do so will depend on our liquidity and capital resources at the time. In an insolvency of a defaulting counterparty, we will be
an unsecured creditor in respect of any amount owed to us by the defaulting counterparty, except to the extent of the value of any
collateral we have obtained from that counterparty.
In addition, where a counterparty is in financial difficulty, under the laws of certain jurisdictions, the relevant regulators may
be able to (i) compel the termination of one or more derivative instruments, determine the settlement amount and/or compel,
without any payment, the partial or full discharge of liabilities arising from such early termination that are payable by the relevant
counterparty or (ii) transfer the derivative instruments to an alternative counterparty.
Details of our Derivative Instruments
In the following tables, we present the details of the various categories of our derivative instruments, all of which are held by
our subsidiary, UPC Broadband Holding B.V. (UPC Broadband Holding).
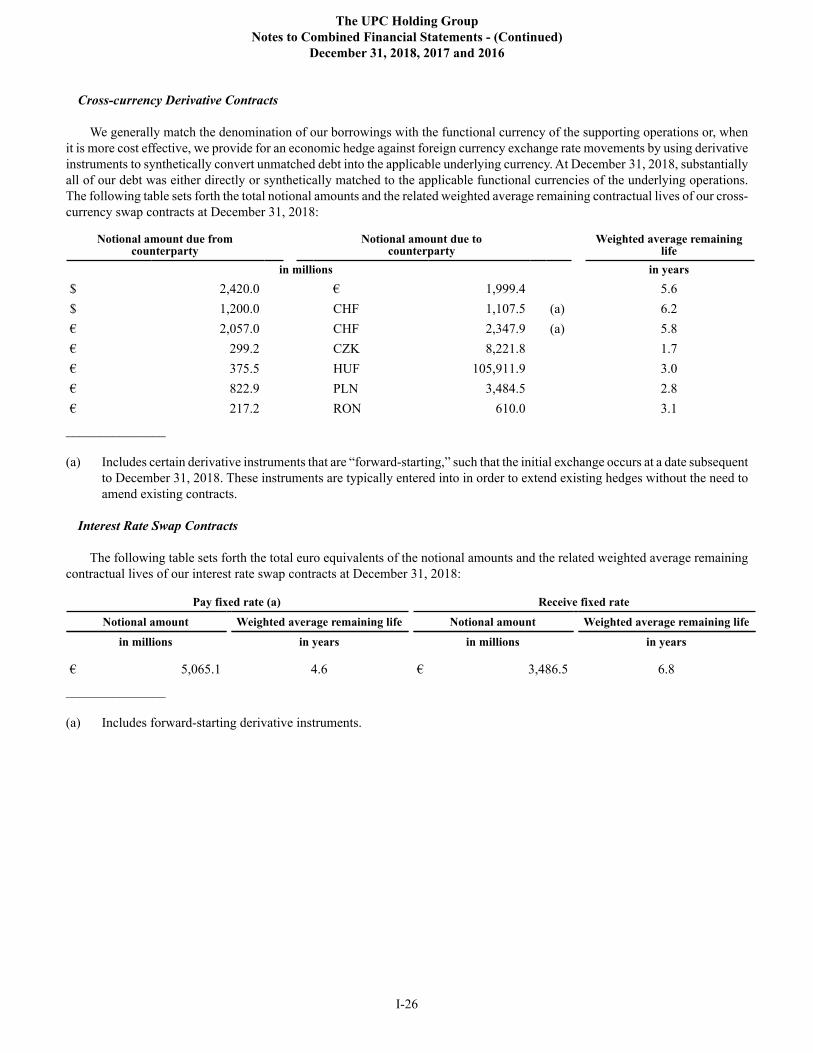
The UPC Holding Group
Notes to Combined Financial Statements - (Continued)
December 31, 2018, 2017 and 2016
I-26
Cross-currency Derivative Contracts
We generally match the denomination of our borrowings with the functional currency of the supporting operations or, when
it is more cost effective, we provide for an economic hedge against foreign currency exchange rate movements by using derivative
instruments to synthetically convert unmatched debt into the applicable underlying currency. At December 31, 2018, substantially
all of our debt was either directly or synthetically matched to the applicable functional currencies of the underlying operations.
The following table sets forth the total notional amounts and the related weighted average remaining contractual lives of our cross-
currency swap contracts at December 31, 2018:
Notional amount due fromcounterparty
Notional amount due tocounterparty
Weighted average remaininglife
in millions in years
$ 2,420.0 € 1,999.4 5.6
$ 1,200.0 CHF 1,107.5 (a) 6.2
€ 2,057.0 CHF 2,347.9 (a) 5.8
€ 299.2 CZK 8,221.8 1.7
€ 375.5 HUF 105,911.9 3.0
€ 822.9 PLN 3,484.5 2.8
€ 217.2 RON 610.0 3.1
_______________
(a) Includes certain derivative instruments that are “forward-starting,” such that the initial exchange occurs at a date subsequent
to December 31, 2018. These instruments are typically entered into in order to extend existing hedges without the need to
amend existing contracts.
Interest Rate Swap Contracts
The following table sets forth the total euro equivalents of the notional amounts and the related weighted average remaining
contractual lives of our interest rate swap contracts at December 31, 2018:
Pay fixed rate (a) Receive fixed rate
Notional amount Weighted average remaining life Notional amount Weighted average remaining life
in millions in years in millions in years
€ 5,065.1 4.6 € 3,486.5 6.8
_______________
(a) Includes forward-starting derivative instruments.
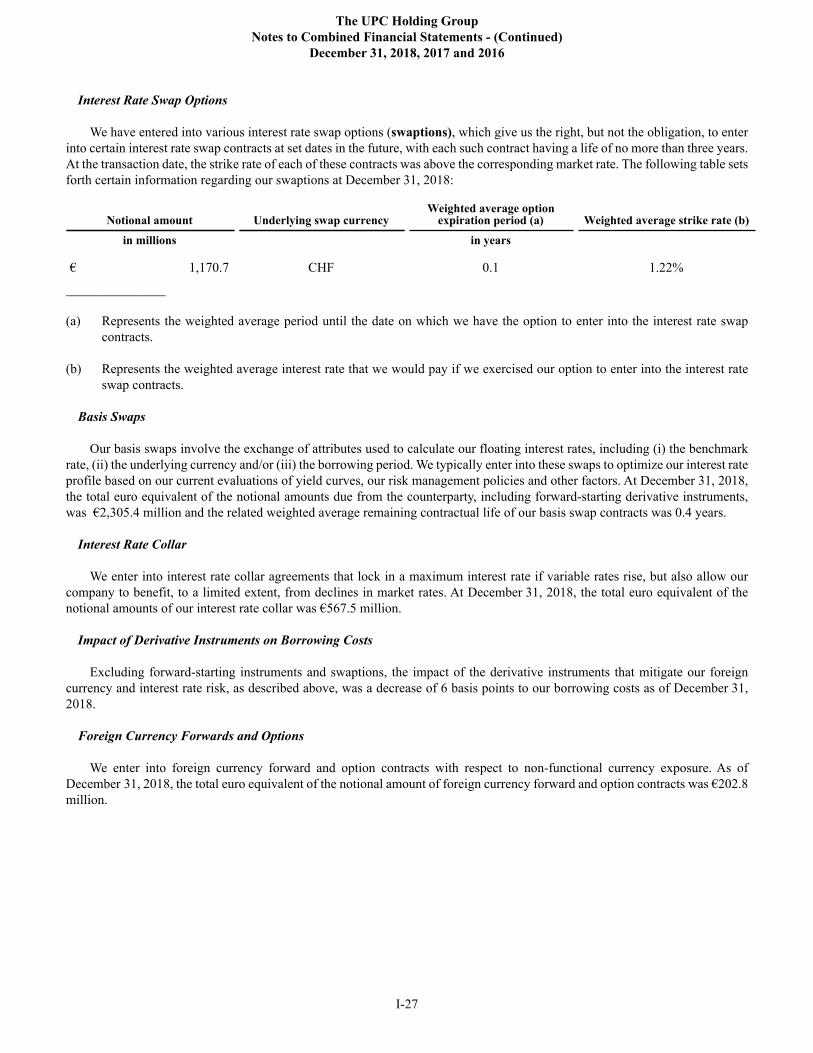
The UPC Holding Group
Notes to Combined Financial Statements - (Continued)
December 31, 2018, 2017 and 2016
I-27
Interest Rate Swap Options
We have entered into various interest rate swap options (swaptions), which give us the right, but not the obligation, to enter
into certain interest rate swap contracts at set dates in the future, with each such contract having a life of no more than three years.
At the transaction date, the strike rate of each of these contracts was above the corresponding market rate. The following table sets
forth certain information regarding our swaptions at December 31, 2018:
Notional amount Underlying swap currencyWeighted average option
expiration period (a) Weighted average strike rate (b)
in millions in years
€ 1,170.7 CHF 0.1 1.22%
_______________
(a) Represents the weighted average period until the date on which we have the option to enter into the interest rate swap
contracts.
(b) Represents the weighted average interest rate that we would pay if we exercised our option to enter into the interest rate
swap contracts.
Basis Swaps
Our basis swaps involve the exchange of attributes used to calculate our floating interest rates, including (i) the benchmark
rate, (ii) the underlying currency and/or (iii) the borrowing period. We typically enter into these swaps to optimize our interest rate
profile based on our current evaluations of yield curves, our risk management policies and other factors. At December 31, 2018,
the total euro equivalent of the notional amounts due from the counterparty, including forward-starting derivative instruments,
was €2,305.4 million and the related weighted average remaining contractual life of our basis swap contracts was 0.4 years.
Interest Rate Collar
We enter into interest rate collar agreements that lock in a maximum interest rate if variable rates rise, but also allow our
company to benefit, to a limited extent, from declines in market rates. At December 31, 2018, the total euro equivalent of the
notional amounts of our interest rate collar was €567.5 million.
Impact of Derivative Instruments on Borrowing Costs
Excluding forward-starting instruments and swaptions, the impact of the derivative instruments that mitigate our foreign
currency and interest rate risk, as described above, was a decrease of 6 basis points to our borrowing costs as of December 31,
2018.
Foreign Currency Forwards and Options
We enter into foreign currency forward and option contracts with respect to non-functional currency exposure. As of
December 31, 2018, the total euro equivalent of the notional amount of foreign currency forward and option contracts was €202.8
million.
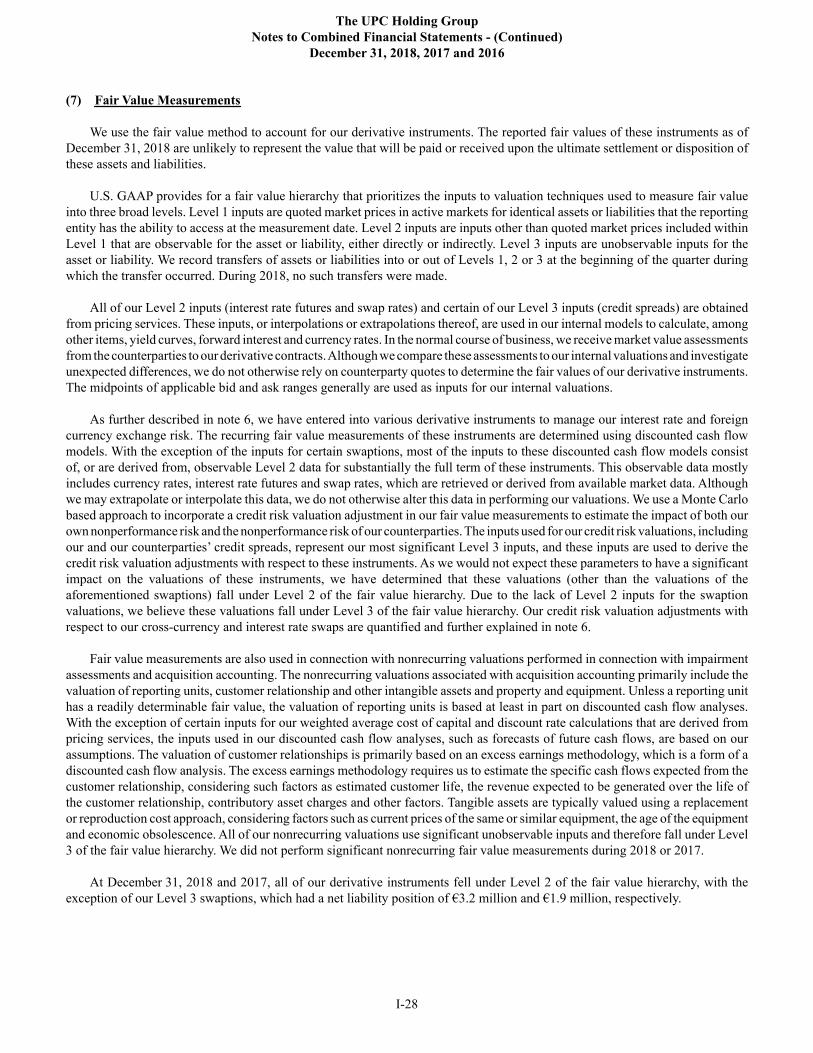
The UPC Holding Group
Notes to Combined Financial Statements - (Continued)
December 31, 2018, 2017 and 2016
I-28
(7) Fair Value Measurements
We use the fair value method to account for our derivative instruments. The reported fair values of these instruments as of
December 31, 2018 are unlikely to represent the value that will be paid or received upon the ultimate settlement or disposition of
these assets and liabilities.
U.S. GAAP provides for a fair value hierarchy that prioritizes the inputs to valuation techniques used to measure fair value
into three broad levels. Level 1 inputs are quoted market prices in active markets for identical assets or liabilities that the reporting
entity has the ability to access at the measurement date. Level 2 inputs are inputs other than quoted market prices included within
Level 1 that are observable for the asset or liability, either directly or indirectly. Level 3 inputs are unobservable inputs for the
asset or liability. We record transfers of assets or liabilities into or out of Levels 1, 2 or 3 at the beginning of the quarter during
which the transfer occurred. During 2018, no such transfers were made.
All of our Level 2 inputs (interest rate futures and swap rates) and certain of our Level 3 inputs (credit spreads) are obtained
from pricing services. These inputs, or interpolations or extrapolations thereof, are used in our internal models to calculate, among
other items, yield curves, forward interest and currency rates. In the normal course of business, we receive market value assessments
from the counterparties to our derivative contracts. Although we compare these assessments to our internal valuations and investigate
unexpected differences, we do not otherwise rely on counterparty quotes to determine the fair values of our derivative instruments.
The midpoints of applicable bid and ask ranges generally are used as inputs for our internal valuations.
As further described in note 6, we have entered into various derivative instruments to manage our interest rate and foreign
currency exchange risk. The recurring fair value measurements of these instruments are determined using discounted cash flow
models. With the exception of the inputs for certain swaptions, most of the inputs to these discounted cash flow models consist
of, or are derived from, observable Level 2 data for substantially the full term of these instruments. This observable data mostly
includes currency rates, interest rate futures and swap rates, which are retrieved or derived from available market data. Although
we may extrapolate or interpolate this data, we do not otherwise alter this data in performing our valuations. We use a Monte Carlo
based approach to incorporate a credit risk valuation adjustment in our fair value measurements to estimate the impact of both our
own nonperformance risk and the nonperformance risk of our counterparties. The inputs used for our credit risk valuations, including
our and our counterparties’ credit spreads, represent our most significant Level 3 inputs, and these inputs are used to derive the
credit risk valuation adjustments with respect to these instruments. As we would not expect these parameters to have a significant
impact on the valuations of these instruments, we have determined that these valuations (other than the valuations of the
aforementioned swaptions) fall under Level 2 of the fair value hierarchy. Due to the lack of Level 2 inputs for the swaption
valuations, we believe these valuations fall under Level 3 of the fair value hierarchy. Our credit risk valuation adjustments with
respect to our cross-currency and interest rate swaps are quantified and further explained in note 6.
Fair value measurements are also used in connection with nonrecurring valuations performed in connection with impairment
assessments and acquisition accounting. The nonrecurring valuations associated with acquisition accounting primarily include the
valuation of reporting units, customer relationship and other intangible assets and property and equipment. Unless a reporting unit
has a readily determinable fair value, the valuation of reporting units is based at least in part on discounted cash flow analyses.
With the exception of certain inputs for our weighted average cost of capital and discount rate calculations that are derived from
pricing services, the inputs used in our discounted cash flow analyses, such as forecasts of future cash flows, are based on our
assumptions. The valuation of customer relationships is primarily based on an excess earnings methodology, which is a form of a
discounted cash flow analysis. The excess earnings methodology requires us to estimate the specific cash flows expected from the
customer relationship, considering such factors as estimated customer life, the revenue expected to be generated over the life of
the customer relationship, contributory asset charges and other factors. Tangible assets are typically valued using a replacement
or reproduction cost approach, considering factors such as current prices of the same or similar equipment, the age of the equipment
and economic obsolescence. All of our nonrecurring valuations use significant unobservable inputs and therefore fall under Level
3 of the fair value hierarchy. We did not perform significant nonrecurring fair value measurements during 2018 or 2017.
At December 31, 2018 and 2017, all of our derivative instruments fell under Level 2 of the fair value hierarchy, with the
exception of our Level 3 swaptions, which had a net liability position of €3.2 million and €1.9 million, respectively.
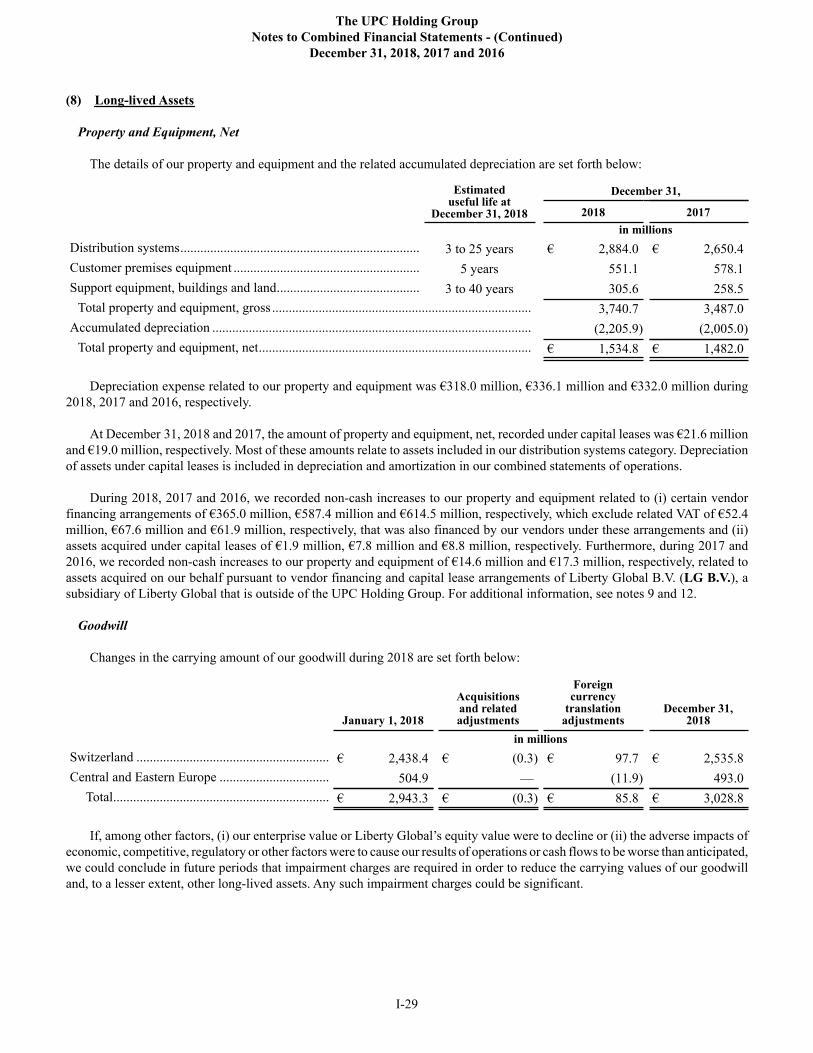
The UPC Holding Group
Notes to Combined Financial Statements - (Continued)
December 31, 2018, 2017 and 2016
I-29
(8) Long-lived Assets
Property and Equipment, Net
The details of our property and equipment and the related accumulated depreciation are set forth below:
Estimated useful life at
December 31, 2018
December 31,
2018 2017
in millions
Distribution systems........................................................................ 3 to 25 years € 2,884.0 € 2,650.4
Customer premises equipment ........................................................ 5 years 551.1 578.1
Support equipment, buildings and land........................................... 3 to 40 years 305.6 258.5
Total property and equipment, gross .............................................................................. 3,740.7 3,487.0
Accumulated depreciation ................................................................................................ (2,205.9) (2,005.0)
Total property and equipment, net.................................................................................. € 1,534.8 € 1,482.0
Depreciation expense related to our property and equipment was €318.0 million, €336.1 million and €332.0 million during
2018, 2017 and 2016, respectively.
At December 31, 2018 and 2017, the amount of property and equipment, net, recorded under capital leases was €21.6 million
and €19.0 million, respectively. Most of these amounts relate to assets included in our distribution systems category. Depreciation
of assets under capital leases is included in depreciation and amortization in our combined statements of operations.
During 2018, 2017 and 2016, we recorded non-cash increases to our property and equipment related to (i) certain vendor
financing arrangements of €365.0 million, €587.4 million and €614.5 million, respectively, which exclude related VAT of €52.4
million, €67.6 million and €61.9 million, respectively, that was also financed by our vendors under these arrangements and (ii)
assets acquired under capital leases of €1.9 million, €7.8 million and €8.8 million, respectively. Furthermore, during 2017 and
2016, we recorded non-cash increases to our property and equipment of €14.6 million and €17.3 million, respectively, related to
assets acquired on our behalf pursuant to vendor financing and capital lease arrangements of Liberty Global B.V. (LG B.V.), a
subsidiary of Liberty Global that is outside of the UPC Holding Group. For additional information, see notes 9 and 12.
Goodwill
Changes in the carrying amount of our goodwill during 2018 are set forth below:
January 1, 2018
Acquisitionsand relatedadjustments
Foreigncurrency
translationadjustments
December 31,2018
in millions
Switzerland .......................................................... € 2,438.4 € (0.3) € 97.7 € 2,535.8
Central and Eastern Europe ................................. 504.9 — (11.9) 493.0
Total................................................................. € 2,943.3 € (0.3) € 85.8 € 3,028.8
If, among other factors, (i) our enterprise value or Liberty Global’s equity value were to decline or (ii) the adverse impacts of
economic, competitive, regulatory or other factors were to cause our results of operations or cash flows to be worse than anticipated,
we could conclude in future periods that impairment charges are required in order to reduce the carrying values of our goodwill
and, to a lesser extent, other long-lived assets. Any such impairment charges could be significant.
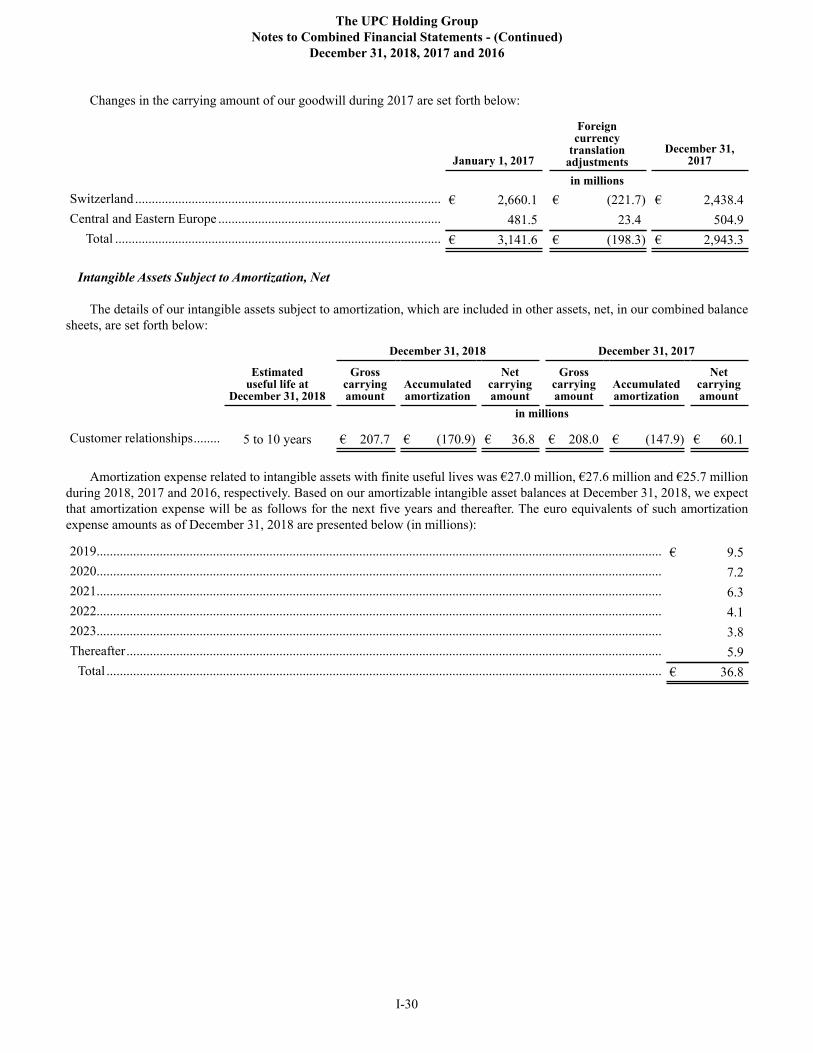
The UPC Holding Group
Notes to Combined Financial Statements - (Continued)
December 31, 2018, 2017 and 2016
I-30
Changes in the carrying amount of our goodwill during 2017 are set forth below:
January 1, 2017
Foreigncurrency
translationadjustments
December 31,2017
in millions
Switzerland ............................................................................................ € 2,660.1 € (221.7) € 2,438.4
Central and Eastern Europe ................................................................... 481.5 23.4 504.9
Total .................................................................................................. € 3,141.6 € (198.3) € 2,943.3
Intangible Assets Subject to Amortization, Net
The details of our intangible assets subject to amortization, which are included in other assets, net, in our combined balance
sheets, are set forth below:
Estimated useful life at
December 31, 2018
December 31, 2018 December 31, 2017
Grosscarryingamount
Accumulatedamortization
Netcarryingamount
Grosscarryingamount
Accumulatedamortization
Netcarryingamount
in millions
Customer relationships........ 5 to 10 years € 207.7 € (170.9) € 36.8 € 208.0 € (147.9) € 60.1
Amortization expense related to intangible assets with finite useful lives was €27.0 million, €27.6 million and €25.7 million
during 2018, 2017 and 2016, respectively. Based on our amortizable intangible asset balances at December 31, 2018, we expect
that amortization expense will be as follows for the next five years and thereafter. The euro equivalents of such amortization
expense amounts as of December 31, 2018 are presented below (in millions):
2019.......................................................................................................................................................................... € 9.5
2020.......................................................................................................................................................................... 7.2
2021.......................................................................................................................................................................... 6.3
2022.......................................................................................................................................................................... 4.1
2023.......................................................................................................................................................................... 3.8
Thereafter................................................................................................................................................................. 5.9
Total ....................................................................................................................................................................... € 36.8
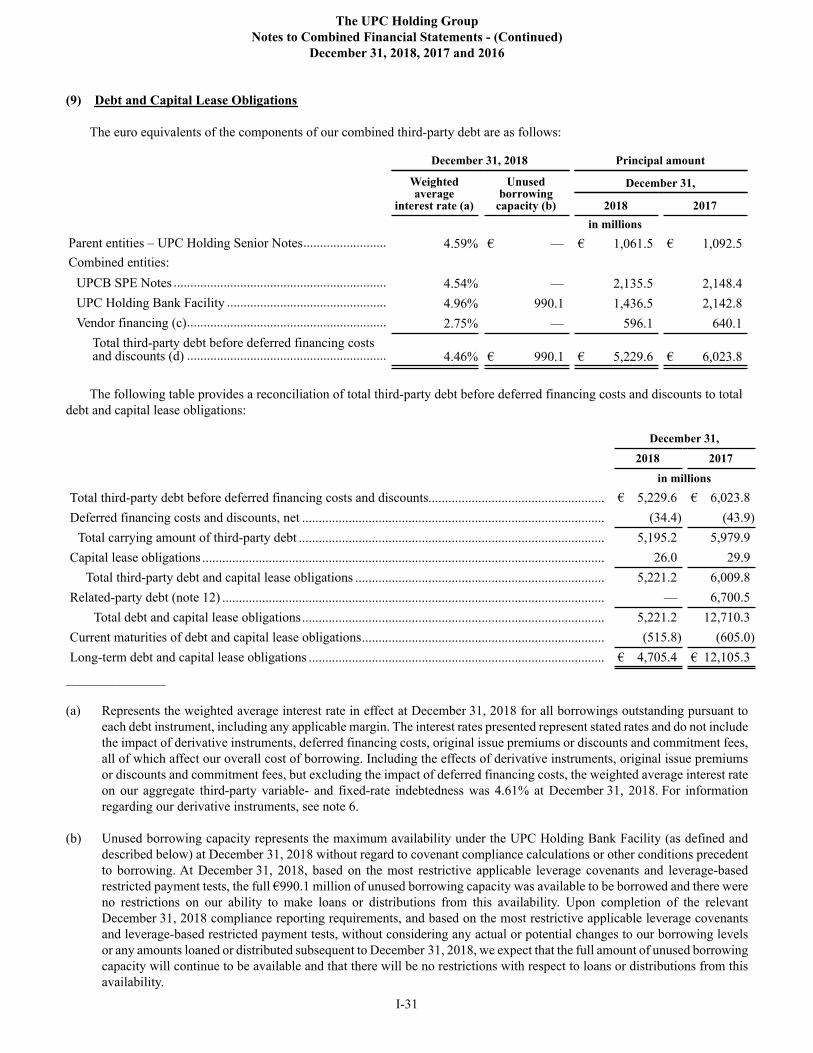
The UPC Holding Group
Notes to Combined Financial Statements - (Continued)
December 31, 2018, 2017 and 2016
I-31
(9) Debt and Capital Lease Obligations
The euro equivalents of the components of our combined third-party debt are as follows:
December 31, 2018 Principal amount
Weightedaverage
interest rate (a)
Unusedborrowing
capacity (b)
December 31,
2018 2017
in millions
Parent entities – UPC Holding Senior Notes......................... 4.59% € — € 1,061.5 € 1,092.5
Combined entities:
UPCB SPE Notes ................................................................ 4.54% — 2,135.5 2,148.4
UPC Holding Bank Facility ................................................ 4.96% 990.1 1,436.5 2,142.8
Vendor financing (c)............................................................ 2.75% — 596.1 640.1
Total third-party debt before deferred financing costsand discounts (d) ............................................................ 4.46% € 990.1 € 5,229.6 € 6,023.8
The following table provides a reconciliation of total third-party debt before deferred financing costs and discounts to total
debt and capital lease obligations:
December 31,
2018 2017
in millions
Total third-party debt before deferred financing costs and discounts..................................................... € 5,229.6 € 6,023.8
Deferred financing costs and discounts, net ........................................................................................... (34.4) (43.9)
Total carrying amount of third-party debt ............................................................................................ 5,195.2 5,979.9
Capital lease obligations ......................................................................................................................... 26.0 29.9
Total third-party debt and capital lease obligations ........................................................................... 5,221.2 6,009.8
Related-party debt (note 12) ................................................................................................................... — 6,700.5
Total debt and capital lease obligations........................................................................................... 5,221.2 12,710.3
Current maturities of debt and capital lease obligations......................................................................... (515.8) (605.0)
Long-term debt and capital lease obligations ......................................................................................... € 4,705.4 € 12,105.3
_______________
(a) Represents the weighted average interest rate in effect at December 31, 2018 for all borrowings outstanding pursuant to
each debt instrument, including any applicable margin. The interest rates presented represent stated rates and do not include
the impact of derivative instruments, deferred financing costs, original issue premiums or discounts and commitment fees,
all of which affect our overall cost of borrowing. Including the effects of derivative instruments, original issue premiums
or discounts and commitment fees, but excluding the impact of deferred financing costs, the weighted average interest rate
on our aggregate third-party variable- and fixed-rate indebtedness was 4.61% at December 31, 2018. For information
regarding our derivative instruments, see note 6.
(b) Unused borrowing capacity represents the maximum availability under the UPC Holding Bank Facility (as defined and
described below) at December 31, 2018 without regard to covenant compliance calculations or other conditions precedent
to borrowing. At December 31, 2018, based on the most restrictive applicable leverage covenants and leverage-based
restricted payment tests, the full €990.1 million of unused borrowing capacity was available to be borrowed and there were
no restrictions on our ability to make loans or distributions from this availability. Upon completion of the relevant
December 31, 2018 compliance reporting requirements, and based on the most restrictive applicable leverage covenants
and leverage-based restricted payment tests, without considering any actual or potential changes to our borrowing levels
or any amounts loaned or distributed subsequent to December 31, 2018, we expect that the full amount of unused borrowing
capacity will continue to be available and that there will be no restrictions with respect to loans or distributions from this
availability.
The UPC Holding Group
Notes to Combined Financial Statements - (Continued)
December 31, 2018, 2017 and 2016
I-32
(c) Represents amounts owed pursuant to interest-bearing vendor financing arrangements that are used to finance certain of
our property and equipment additions and operating expenses. These obligations are generally due within one year and
include VAT that was paid on our behalf by the vendor. At December 31, 2018 and 2017, the amounts owed pursuant to
these arrangements include nil and €3.7 million, respectively, related to third-party capital-related vendor financing
obligations for which we and LG B.V. are co-obligors. We expect to cash settle the co-obligor obligations with LG B.V. in
advance of when we and LG B.V. are required to settle the obligations with the applicable third parties. Our cash payments
to LG B.V. will be reflected as capital expenditures in our combined statements of cash flows and any cash payments made
prior to the settlement of the related co-obligor obligation will be reflected as related-party accounts receivable from LG
B.V. in our combined balance sheets. Repayments of vendor financing obligations, other than the co-obligor obligations,
are included in repayments and repurchases of third-party debt and capital lease obligations in our combined statements of
cash flows.
(d) As of December 31, 2018 and 2017, our debt had an estimated fair value of €5.0 billion and €6.0 billion, respectively. The
estimated fair values of our debt instruments are generally determined using the average of applicable bid and ask prices
(mostly Level 1 of the fair value hierarchy). For additional information regarding fair value hierarchies, see note 7.
General Information
Credit Facility. We have entered into a credit facility agreement with certain financial institutions (the “credit facility”). Our
credit facility contains certain covenants, the more notable of which are as follows:
• Our credit facility contains certain net leverage ratios which are required to be complied with (i) on an incurrence basis
and/or (ii) when the associated revolving credit facility has been drawn beyond a specified percentage of the total available
revolving credit commitments, on a maintenance basis;
• Subject to certain customary and agreed exceptions, our credit facility contains certain restrictions which, among other
things, restrict our ability to (i) incur or guarantee certain financial indebtedness, (ii) make certain disposals and
acquisitions, (iii) create certain security interests over our assets and (iv) make certain restricted payments to our direct
and/or indirect parent companies through dividends, loans or other distributions;
• Our credit facility requires that we (i) guarantee the payment of all sums payable under the credit facility and (ii) grant
first-ranking security over substantially all of our assets to secure the payment of all sums payable thereunder;
• In addition to certain mandatory prepayment events, our credit facility provides that the instructing group of lenders,
under certain circumstances, may cancel the group’s commitments thereunder and declare the loan(s) thereunder due and
payable after the applicable notice period following the occurrence of a change of control (as specified in our credit
facility);
• Our credit facility contains certain customary events of default, the occurrence of which, subject to certain exceptions,
materiality qualifications and cure rights, would allow the instructing group of lenders to (i) cancel the total commitments,
(ii) declare that all or part of the loans be payable on demand and/or (iii) accelerate all outstanding loans and terminate
their commitments thereunder;
• Our credit facility requires that we observe certain affirmative and negative undertakings and covenants, which are subject
to certain materiality qualifications and other customary and agreed exceptions; and
• In addition to customary default provisions, our credit facility includes certain cross-default and cross-acceleration
provisions with respect to our other indebtedness, subject to agreed minimum thresholds and other customary and agreed
exceptions.
Senior Notes. We have issued certain senior notes. In general, our senior notes (i) are senior obligations of the issuer of such
notes that rank equally with all of the existing and future senior debt of such issuer and are senior to all existing and future
subordinated debt of such issuer and (ii) are secured by a pledge over the shares of UPC Holding. In addition, the indentures
governing our senior notes contain certain covenants, the more notable of which are as follows:
The UPC Holding Group
Notes to Combined Financial Statements - (Continued)
December 31, 2018, 2017 and 2016
I-33
• Subject to certain materiality qualifications and other customary and agreed exceptions, our notes contain (i) certain
customary incurrence-based restrictions and (ii) certain restrictions that, among other things, restrict our ability to (a)
incur or guarantee certain financial indebtedness, (b) make certain disposals and acquisitions, (c) create certain security
interests over our assets and (d) make certain restricted payments to our direct and/or indirect parent companies through
dividends, loans or other distributions;
• Our notes provide that any failure to pay principal after the expiration of any applicable grace period, or any acceleration
with respect to other indebtedness of the issuer or certain subsidiaries over agreed minimum thresholds (as specified
under the applicable indenture), is an event of default under the respective notes; and
• If we or certain of our combined entities (as specified in the applicable indenture) sell certain assets, we must, subject to
certain materiality qualifications and other customary and agreed exceptions, offer to repurchase the applicable notes at
par, or if a change of control (as specified in the applicable indenture) occurs, we must offer to repurchase all of the
relevant notes at a redemption price of 101%.
SPE Notes. From time to time, we create special purpose financing entities, which are 100% owned by third parties, for the
primary purpose of facilitating the offering of senior secured notes, which we collectively refer to as the “UPCB SPE Notes.” In
this regard, UPCB SPE Notes have been issued, and are outstanding at December 31, 2018, by UPCB Finance IV Limited (UPCB
Finance IV) and UPCB Finance VII Limited (UPCB Finance VII), collectively the “UPCB SPEs”.
As further described below, the UPCB SPEs used the proceeds from the issuance of UPCB SPE Notes to fund term loan
facilities to UPC Financing Partnership (UPC Financing) under the UPC Holding Bank Facility, each a “UPC Funded Facility”
and collectively the “UPC Funded Facilities.” Each UPCB SPE is dependent on payments from UPC Financing under the
applicable UPC Funded Facility in order to service its payment obligations under each respective UPCB SPE Note. The term loan
under each of the UPC Funded Facilities creates a variable interest in the UPCB SPEs for which UPC Financing is the primary
beneficiary and is required to consolidate the UPCB SPEs. As a result, the amounts outstanding under the UPC Funded Facilities
are eliminated in the UPC Holding Group’s combined financial statements.
Pursuant to the respective indentures for the UPCB SPE Notes (the UPCB SPE Indentures) and the respective accession
agreements for the UPC Funded Facilities, the call provisions, maturity and applicable interest rate for each UPC Funded Facility
are the same as those of the related UPCB SPE Notes. Each UPCB SPE, as the lender under the UPC Funded Facility, is treated
the same as the other lenders under the UPC Holding Bank Facility, with benefits, rights and protections similar to those afforded
to the other lenders. Through the covenants in the applicable UPCB SPE Indentures and the applicable security interests over (i) all
of the issued shares of the applicable UPCB SPE and (ii) the applicable UPCB SPE’s rights under the relevant UPC Funded Facility
granted to secure the UPCB SPE’s obligations under the relevant UPCB SPE Notes, the holders of the UPCB SPE Notes are
provided indirectly with the benefits, rights, protections and covenants granted to the applicable UPCB SPE as lender under the
relevant UPC Funded Facility. The UPCB SPEs are prohibited from incurring any additional indebtedness, subject to certain
exceptions under the UPCB SPE Indentures.
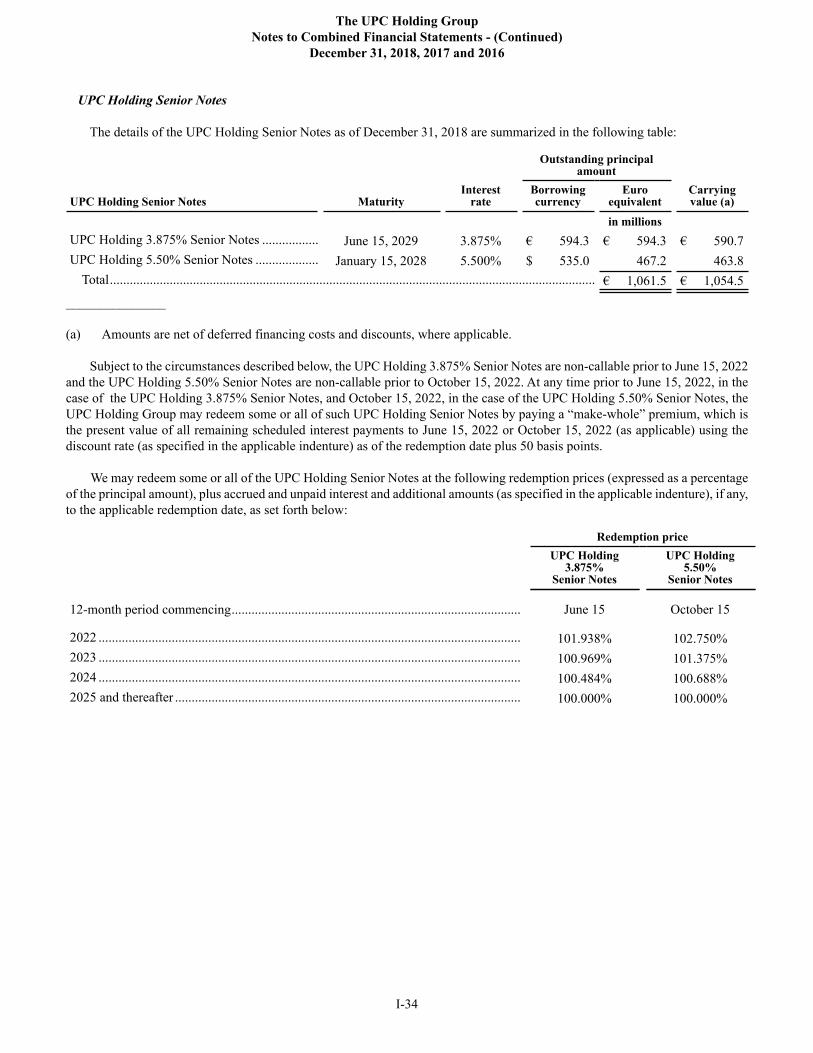
The UPC Holding Group
Notes to Combined Financial Statements - (Continued)
December 31, 2018, 2017 and 2016
I-34
UPC Holding Senior Notes
The details of the UPC Holding Senior Notes as of December 31, 2018 are summarized in the following table:
Outstanding principal
amount
UPC Holding Senior Notes MaturityInterest
rateBorrowingcurrency
Euroequivalent
Carryingvalue (a)
in millions
UPC Holding 3.875% Senior Notes ................. June 15, 2029 3.875% € 594.3 € 594.3 € 590.7
UPC Holding 5.50% Senior Notes ................... January 15, 2028 5.500% $ 535.0 467.2 463.8
Total.................................................................................................................................................. € 1,061.5 € 1,054.5
_______________
(a) Amounts are net of deferred financing costs and discounts, where applicable.
Subject to the circumstances described below, the UPC Holding 3.875% Senior Notes are non-callable prior to June 15, 2022
and the UPC Holding 5.50% Senior Notes are non-callable prior to October 15, 2022. At any time prior to June 15, 2022, in the
case of the UPC Holding 3.875% Senior Notes, and October 15, 2022, in the case of the UPC Holding 5.50% Senior Notes, the
UPC Holding Group may redeem some or all of such UPC Holding Senior Notes by paying a “make-whole” premium, which is
the present value of all remaining scheduled interest payments to June 15, 2022 or October 15, 2022 (as applicable) using the
discount rate (as specified in the applicable indenture) as of the redemption date plus 50 basis points.
We may redeem some or all of the UPC Holding Senior Notes at the following redemption prices (expressed as a percentage
of the principal amount), plus accrued and unpaid interest and additional amounts (as specified in the applicable indenture), if any,
to the applicable redemption date, as set forth below:
Redemption price
UPC Holding 3.875%
Senior Notes
UPC Holding 5.50%
Senior Notes
12-month period commencing....................................................................................... June 15 October 15
2022 ............................................................................................................................... 101.938% 102.750%
2023 ............................................................................................................................... 100.969% 101.375%
2024 ............................................................................................................................... 100.484% 100.688%
2025 and thereafter ........................................................................................................ 100.000% 100.000%
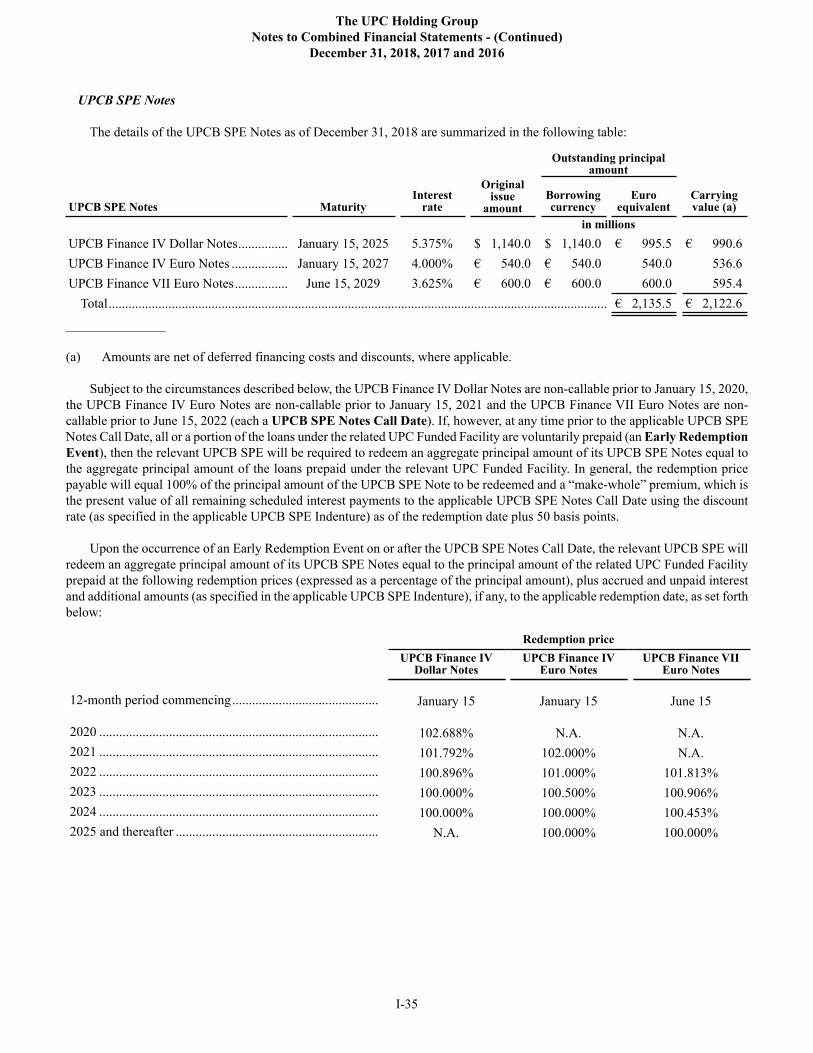
The UPC Holding Group
Notes to Combined Financial Statements - (Continued)
December 31, 2018, 2017 and 2016
I-35
UPCB SPE Notes
The details of the UPCB SPE Notes as of December 31, 2018 are summarized in the following table:
Outstanding principal
amount
UPCB SPE Notes MaturityInterest
rate
Originalissue
amountBorrowingcurrency
Euroequivalent
Carryingvalue (a)
in millions
UPCB Finance IV Dollar Notes............... January 15, 2025 5.375% $ 1,140.0 $ 1,140.0 € 995.5 € 990.6
UPCB Finance IV Euro Notes ................. January 15, 2027 4.000% € 540.0 € 540.0 540.0 536.6
UPCB Finance VII Euro Notes................ June 15, 2029 3.625% € 600.0 € 600.0 600.0 595.4
Total...................................................................................................................................................... € 2,135.5 € 2,122.6
_______________
(a) Amounts are net of deferred financing costs and discounts, where applicable.
Subject to the circumstances described below, the UPCB Finance IV Dollar Notes are non-callable prior to January 15, 2020,
the UPCB Finance IV Euro Notes are non-callable prior to January 15, 2021 and the UPCB Finance VII Euro Notes are non-
callable prior to June 15, 2022 (each a UPCB SPE Notes Call Date). If, however, at any time prior to the applicable UPCB SPE
Notes Call Date, all or a portion of the loans under the related UPC Funded Facility are voluntarily prepaid (an Early Redemption
Event), then the relevant UPCB SPE will be required to redeem an aggregate principal amount of its UPCB SPE Notes equal to
the aggregate principal amount of the loans prepaid under the relevant UPC Funded Facility. In general, the redemption price
payable will equal 100% of the principal amount of the UPCB SPE Note to be redeemed and a “make-whole” premium, which is
the present value of all remaining scheduled interest payments to the applicable UPCB SPE Notes Call Date using the discount
rate (as specified in the applicable UPCB SPE Indenture) as of the redemption date plus 50 basis points.
Upon the occurrence of an Early Redemption Event on or after the UPCB SPE Notes Call Date, the relevant UPCB SPE will
redeem an aggregate principal amount of its UPCB SPE Notes equal to the principal amount of the related UPC Funded Facility
prepaid at the following redemption prices (expressed as a percentage of the principal amount), plus accrued and unpaid interest
and additional amounts (as specified in the applicable UPCB SPE Indenture), if any, to the applicable redemption date, as set forth
below:
Redemption price
UPCB Finance IVDollar Notes
UPCB Finance IVEuro Notes
UPCB Finance VIIEuro Notes
12-month period commencing............................................ January 15 January 15 June 15
2020 .................................................................................... 102.688% N.A. N.A.
2021 .................................................................................... 101.792% 102.000% N.A.
2022 .................................................................................... 100.896% 101.000% 101.813%
2023 .................................................................................... 100.000% 100.500% 100.906%
2024 .................................................................................... 100.000% 100.000% 100.453%
2025 and thereafter ............................................................. N.A. 100.000% 100.000%
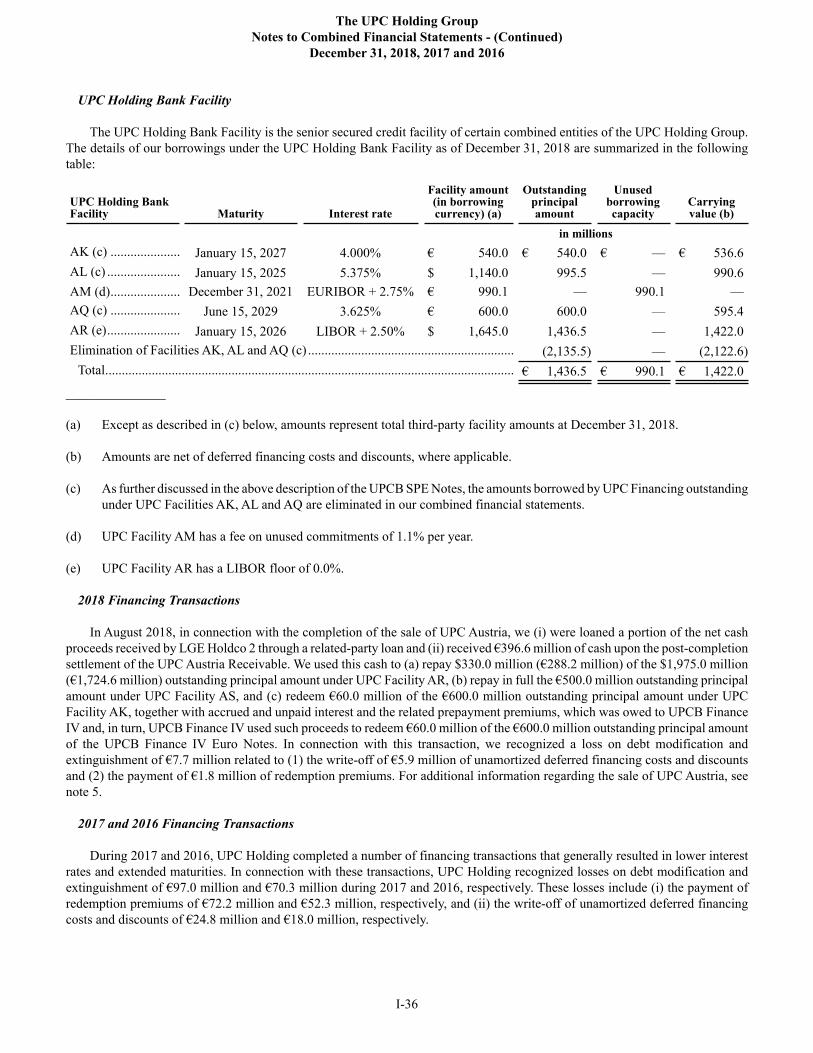
The UPC Holding Group
Notes to Combined Financial Statements - (Continued)
December 31, 2018, 2017 and 2016
I-36
UPC Holding Bank Facility
The UPC Holding Bank Facility is the senior secured credit facility of certain combined entities of the UPC Holding Group.
The details of our borrowings under the UPC Holding Bank Facility as of December 31, 2018 are summarized in the following
table:
UPC Holding BankFacility Maturity Interest rate
Facility amount(in borrowingcurrency) (a)
Outstandingprincipalamount
Unusedborrowingcapacity
Carryingvalue (b)
in millions
AK (c) ..................... January 15, 2027 4.000% € 540.0 € 540.0 € — € 536.6
AL (c) ...................... January 15, 2025 5.375% $ 1,140.0 995.5 — 990.6
AM (d)..................... December 31, 2021 EURIBOR + 2.75% € 990.1 — 990.1 —
AQ (c) ..................... June 15, 2029 3.625% € 600.0 600.0 — 595.4
AR (e)...................... January 15, 2026 LIBOR + 2.50% $ 1,645.0 1,436.5 — 1,422.0
Elimination of Facilities AK, AL and AQ (c) .............................................................. (2,135.5) — (2,122.6)
Total........................................................................................................................... € 1,436.5 € 990.1 € 1,422.0
_______________
(a) Except as described in (c) below, amounts represent total third-party facility amounts at December 31, 2018.
(b) Amounts are net of deferred financing costs and discounts, where applicable.
(c) As further discussed in the above description of the UPCB SPE Notes, the amounts borrowed by UPC Financing outstanding
under UPC Facilities AK, AL and AQ are eliminated in our combined financial statements.
(d) UPC Facility AM has a fee on unused commitments of 1.1% per year.
(e) UPC Facility AR has a LIBOR floor of 0.0%.
2018 Financing Transactions
In August 2018, in connection with the completion of the sale of UPC Austria, we (i) were loaned a portion of the net cash
proceeds received by LGE Holdco 2 through a related-party loan and (ii) received €396.6 million of cash upon the post-completion
settlement of the UPC Austria Receivable. We used this cash to (a) repay $330.0 million (€288.2 million) of the $1,975.0 million
(€1,724.6 million) outstanding principal amount under UPC Facility AR, (b) repay in full the €500.0 million outstanding principal
amount under UPC Facility AS, and (c) redeem €60.0 million of the €600.0 million outstanding principal amount under UPC
Facility AK, together with accrued and unpaid interest and the related prepayment premiums, which was owed to UPCB Finance
IV and, in turn, UPCB Finance IV used such proceeds to redeem €60.0 million of the €600.0 million outstanding principal amount
of the UPCB Finance IV Euro Notes. In connection with this transaction, we recognized a loss on debt modification and
extinguishment of €7.7 million related to (1) the write-off of €5.9 million of unamortized deferred financing costs and discounts
and (2) the payment of €1.8 million of redemption premiums. For additional information regarding the sale of UPC Austria, see
note 5.
2017 and 2016 Financing Transactions
During 2017 and 2016, UPC Holding completed a number of financing transactions that generally resulted in lower interest
rates and extended maturities. In connection with these transactions, UPC Holding recognized losses on debt modification and
extinguishment of €97.0 million and €70.3 million during 2017 and 2016, respectively. These losses include (i) the payment of
redemption premiums of €72.2 million and €52.3 million, respectively, and (ii) the write-off of unamortized deferred financing
costs and discounts of €24.8 million and €18.0 million, respectively.
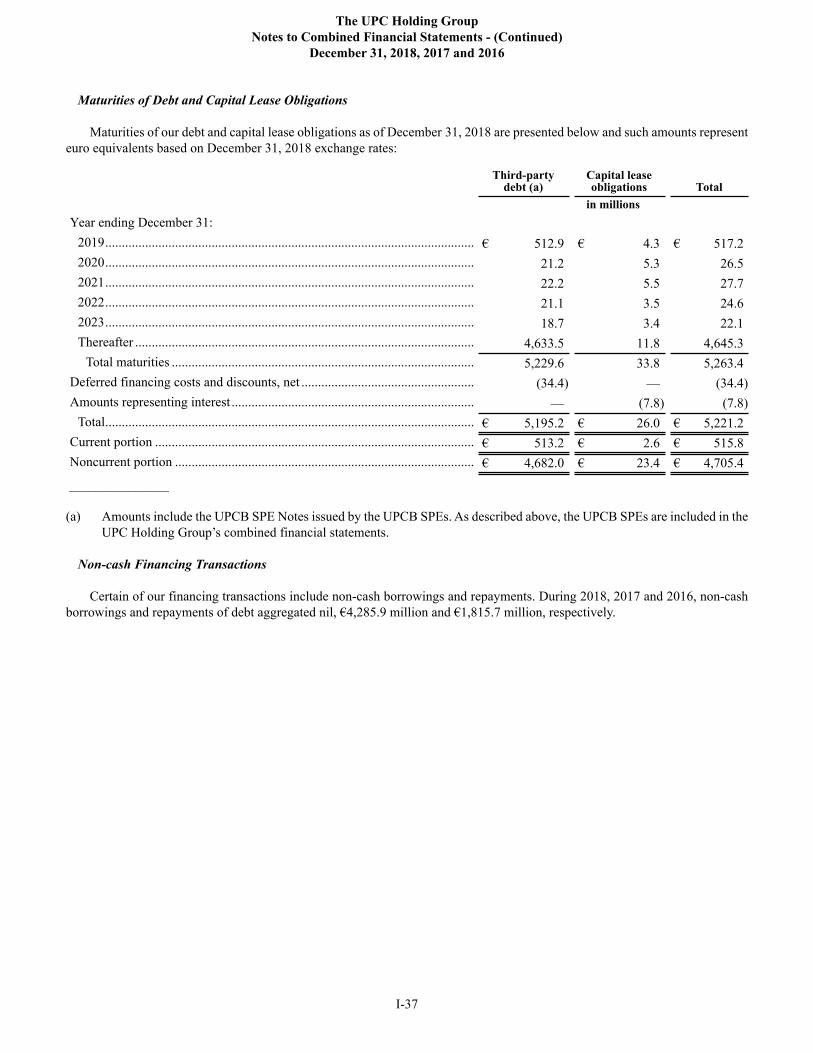
The UPC Holding Group
Notes to Combined Financial Statements - (Continued)
December 31, 2018, 2017 and 2016
I-37
Maturities of Debt and Capital Lease Obligations
Maturities of our debt and capital lease obligations as of December 31, 2018 are presented below and such amounts represent
euro equivalents based on December 31, 2018 exchange rates:
Third-partydebt (a)
Capital leaseobligations Total
in millions
Year ending December 31:
2019............................................................................................................... € 512.9 € 4.3 € 517.2
2020............................................................................................................... 21.2 5.3 26.5
2021............................................................................................................... 22.2 5.5 27.7
2022............................................................................................................... 21.1 3.5 24.6
2023............................................................................................................... 18.7 3.4 22.1
Thereafter ...................................................................................................... 4,633.5 11.8 4,645.3
Total maturities ........................................................................................... 5,229.6 33.8 5,263.4
Deferred financing costs and discounts, net .................................................... (34.4) — (34.4)
Amounts representing interest ......................................................................... — (7.8) (7.8)
Total............................................................................................................... € 5,195.2 € 26.0 € 5,221.2
Current portion ................................................................................................ € 513.2 € 2.6 € 515.8
Noncurrent portion .......................................................................................... € 4,682.0 € 23.4 € 4,705.4
_______________
(a) Amounts include the UPCB SPE Notes issued by the UPCB SPEs. As described above, the UPCB SPEs are included in the
UPC Holding Group’s combined financial statements.
Non-cash Financing Transactions
Certain of our financing transactions include non-cash borrowings and repayments. During 2018, 2017 and 2016, non-cash
borrowings and repayments of debt aggregated nil, €4,285.9 million and €1,815.7 million, respectively.
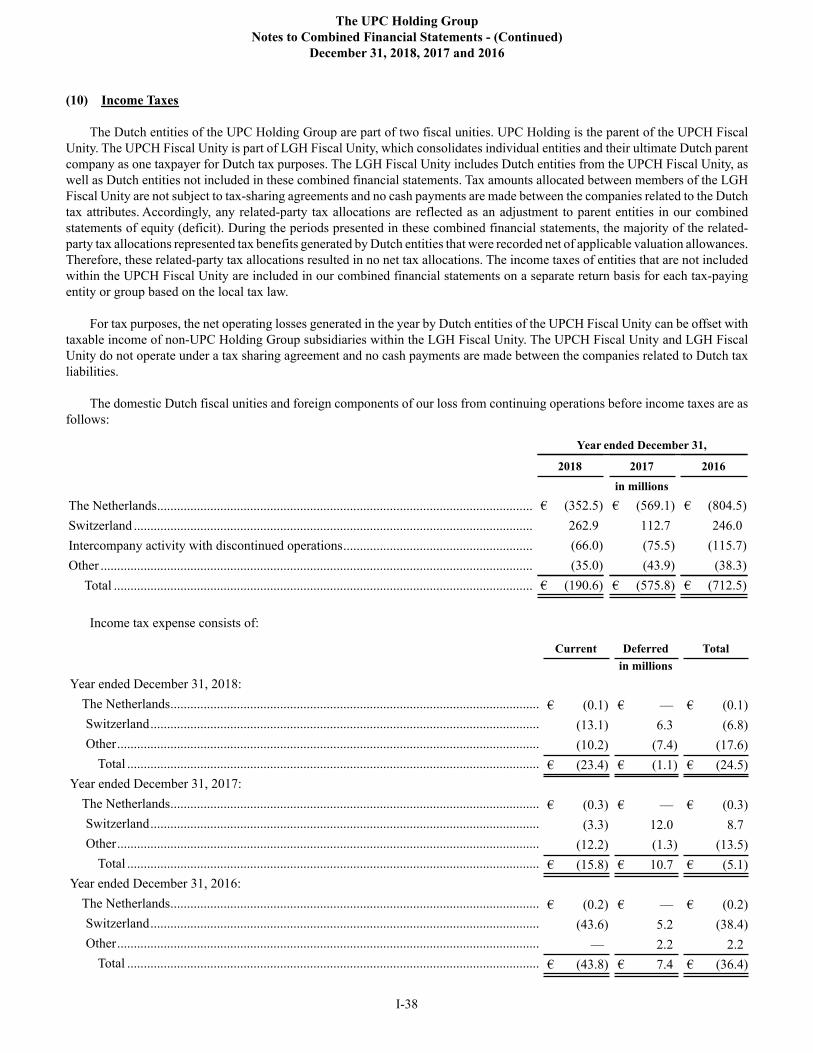
The UPC Holding Group
Notes to Combined Financial Statements - (Continued)
December 31, 2018, 2017 and 2016
I-38
(10) Income Taxes
The Dutch entities of the UPC Holding Group are part of two fiscal unities. UPC Holding is the parent of the UPCH Fiscal
Unity. The UPCH Fiscal Unity is part of LGH Fiscal Unity, which consolidates individual entities and their ultimate Dutch parent
company as one taxpayer for Dutch tax purposes. The LGH Fiscal Unity includes Dutch entities from the UPCH Fiscal Unity, as
well as Dutch entities not included in these combined financial statements. Tax amounts allocated between members of the LGH
Fiscal Unity are not subject to tax-sharing agreements and no cash payments are made between the companies related to the Dutch
tax attributes. Accordingly, any related-party tax allocations are reflected as an adjustment to parent entities in our combined
statements of equity (deficit). During the periods presented in these combined financial statements, the majority of the related-
party tax allocations represented tax benefits generated by Dutch entities that were recorded net of applicable valuation allowances.
Therefore, these related-party tax allocations resulted in no net tax allocations. The income taxes of entities that are not included
within the UPCH Fiscal Unity are included in our combined financial statements on a separate return basis for each tax-paying
entity or group based on the local tax law.
For tax purposes, the net operating losses generated in the year by Dutch entities of the UPCH Fiscal Unity can be offset with
taxable income of non-UPC Holding Group subsidiaries within the LGH Fiscal Unity. The UPCH Fiscal Unity and LGH Fiscal
Unity do not operate under a tax sharing agreement and no cash payments are made between the companies related to Dutch tax
liabilities.
The domestic Dutch fiscal unities and foreign components of our loss from continuing operations before income taxes are as
follows:
Year ended December 31,
2018 2017 2016
in millions
The Netherlands................................................................................................................. € (352.5) € (569.1) € (804.5)
Switzerland ........................................................................................................................ 262.9 112.7 246.0
Intercompany activity with discontinued operations......................................................... (66.0) (75.5) (115.7)
Other .................................................................................................................................. (35.0) (43.9) (38.3)
Total .............................................................................................................................. € (190.6) € (575.8) € (712.5)
Income tax expense consists of:
Current Deferred Total
in millions
Year ended December 31, 2018:
The Netherlands............................................................................................................... € (0.1) € — € (0.1)
Switzerland..................................................................................................................... (13.1) 6.3 (6.8)
Other............................................................................................................................... (10.2) (7.4) (17.6)
Total ............................................................................................................................ € (23.4) € (1.1) € (24.5)
Year ended December 31, 2017:
The Netherlands............................................................................................................... € (0.3) € — € (0.3)
Switzerland..................................................................................................................... (3.3) 12.0 8.7
Other............................................................................................................................... (12.2) (1.3) (13.5)
Total ............................................................................................................................ € (15.8) € 10.7 € (5.1)
Year ended December 31, 2016:
The Netherlands............................................................................................................... € (0.2) € — € (0.2)
Switzerland..................................................................................................................... (43.6) 5.2 (38.4)
Other............................................................................................................................... — 2.2 2.2
Total ............................................................................................................................ € (43.8) € 7.4 € (36.4)
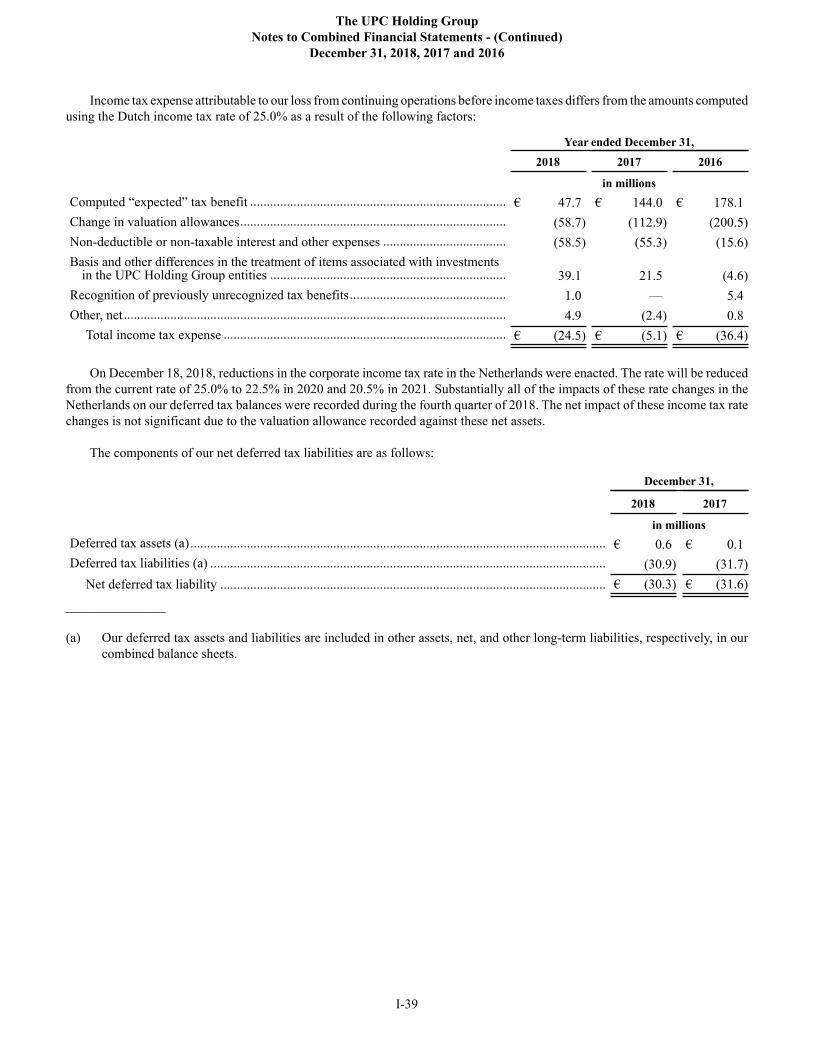
The UPC Holding Group
Notes to Combined Financial Statements - (Continued)
December 31, 2018, 2017 and 2016
I-39
Income tax expense attributable to our loss from continuing operations before income taxes differs from the amounts computed
using the Dutch income tax rate of 25.0% as a result of the following factors:
Year ended December 31,
2018 2017 2016
in millions
Computed “expected” tax benefit ............................................................................. € 47.7 € 144.0 € 178.1
Change in valuation allowances................................................................................ (58.7) (112.9) (200.5)
Non-deductible or non-taxable interest and other expenses ..................................... (58.5) (55.3) (15.6)
Basis and other differences in the treatment of items associated with investmentsin the UPC Holding Group entities ....................................................................... 39.1 21.5 (4.6)
Recognition of previously unrecognized tax benefits............................................... 1.0 — 5.4
Other, net ................................................................................................................... 4.9 (2.4) 0.8
Total income tax expense ..................................................................................... € (24.5) € (5.1) € (36.4)
On December 18, 2018, reductions in the corporate income tax rate in the Netherlands were enacted. The rate will be reduced
from the current rate of 25.0% to 22.5% in 2020 and 20.5% in 2021. Substantially all of the impacts of these rate changes in the
Netherlands on our deferred tax balances were recorded during the fourth quarter of 2018. The net impact of these income tax rate
changes is not significant due to the valuation allowance recorded against these net assets.
The components of our net deferred tax liabilities are as follows:
December 31,
2018 2017
in millions
Deferred tax assets (a)............................................................................................................................. € 0.6 € 0.1
Deferred tax liabilities (a) ....................................................................................................................... (30.9) (31.7)
Net deferred tax liability .................................................................................................................... € (30.3) € (31.6)
_______________
(a) Our deferred tax assets and liabilities are included in other assets, net, and other long-term liabilities, respectively, in our
combined balance sheets.
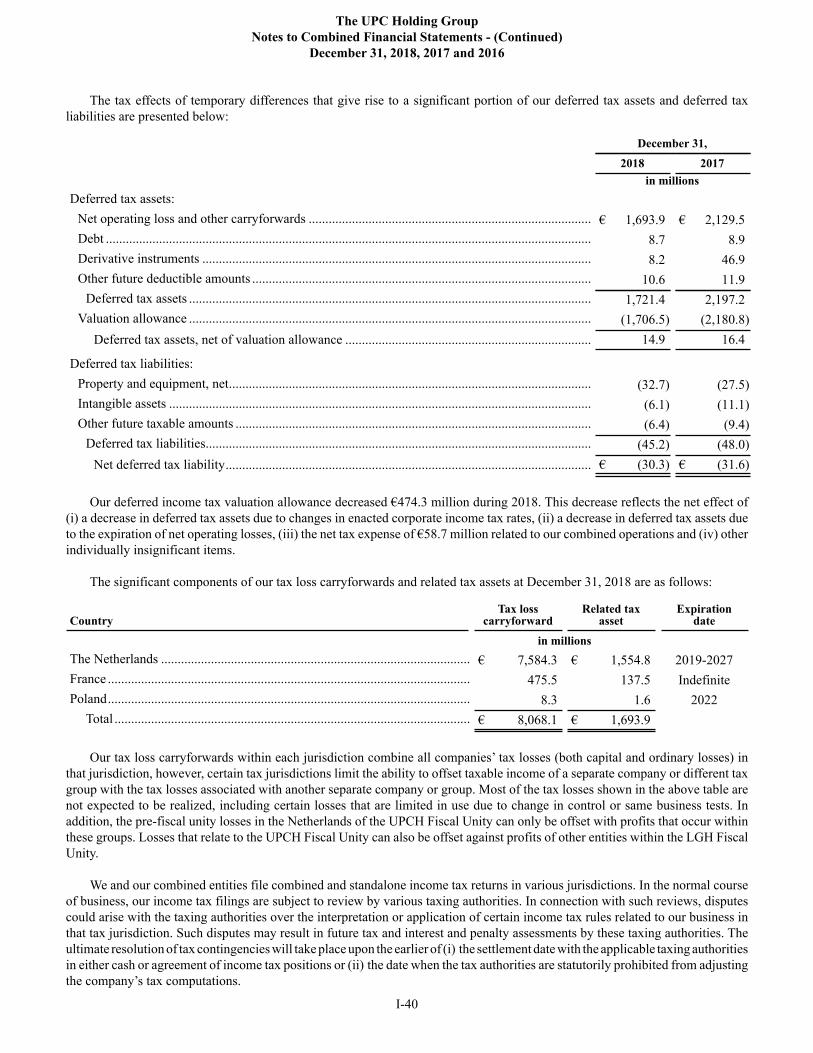
The UPC Holding Group
Notes to Combined Financial Statements - (Continued)
December 31, 2018, 2017 and 2016
I-40
The tax effects of temporary differences that give rise to a significant portion of our deferred tax assets and deferred tax
liabilities are presented below:
December 31,
2018 2017
in millions
Deferred tax assets:
Net operating loss and other carryforwards ..................................................................................... € 1,693.9 € 2,129.5
Debt .................................................................................................................................................. 8.7 8.9
Derivative instruments ..................................................................................................................... 8.2 46.9
Other future deductible amounts ...................................................................................................... 10.6 11.9
Deferred tax assets ......................................................................................................................... 1,721.4 2,197.2
Valuation allowance ......................................................................................................................... (1,706.5) (2,180.8)
Deferred tax assets, net of valuation allowance .......................................................................... 14.9 16.4
Deferred tax liabilities:
Property and equipment, net............................................................................................................. (32.7) (27.5)
Intangible assets ............................................................................................................................... (6.1) (11.1)
Other future taxable amounts ........................................................................................................... (6.4) (9.4)
Deferred tax liabilities.................................................................................................................... (45.2) (48.0)
Net deferred tax liability.............................................................................................................. € (30.3) € (31.6)
Our deferred income tax valuation allowance decreased €474.3 million during 2018. This decrease reflects the net effect of
(i) a decrease in deferred tax assets due to changes in enacted corporate income tax rates, (ii) a decrease in deferred tax assets due
to the expiration of net operating losses, (iii) the net tax expense of €58.7 million related to our combined operations and (iv) other
individually insignificant items.
The significant components of our tax loss carryforwards and related tax assets at December 31, 2018 are as follows:
CountryTax loss
carryforwardRelated tax
assetExpiration
date
in millions
The Netherlands ............................................................................................. € 7,584.3 € 1,554.8 2019-2027
France ............................................................................................................. 475.5 137.5 Indefinite
Poland............................................................................................................. 8.3 1.6 2022
Total ........................................................................................................... € 8,068.1 € 1,693.9
Our tax loss carryforwards within each jurisdiction combine all companies’ tax losses (both capital and ordinary losses) in
that jurisdiction, however, certain tax jurisdictions limit the ability to offset taxable income of a separate company or different tax
group with the tax losses associated with another separate company or group. Most of the tax losses shown in the above table are
not expected to be realized, including certain losses that are limited in use due to change in control or same business tests. In
addition, the pre-fiscal unity losses in the Netherlands of the UPCH Fiscal Unity can only be offset with profits that occur within
these groups. Losses that relate to the UPCH Fiscal Unity can also be offset against profits of other entities within the LGH Fiscal
Unity.
We and our combined entities file combined and standalone income tax returns in various jurisdictions. In the normal course
of business, our income tax filings are subject to review by various taxing authorities. In connection with such reviews, disputes
could arise with the taxing authorities over the interpretation or application of certain income tax rules related to our business in
that tax jurisdiction. Such disputes may result in future tax and interest and penalty assessments by these taxing authorities. The
ultimate resolution of tax contingencies will take place upon the earlier of (i) the settlement date with the applicable taxing authorities
in either cash or agreement of income tax positions or (ii) the date when the tax authorities are statutorily prohibited from adjusting
the company’s tax computations.
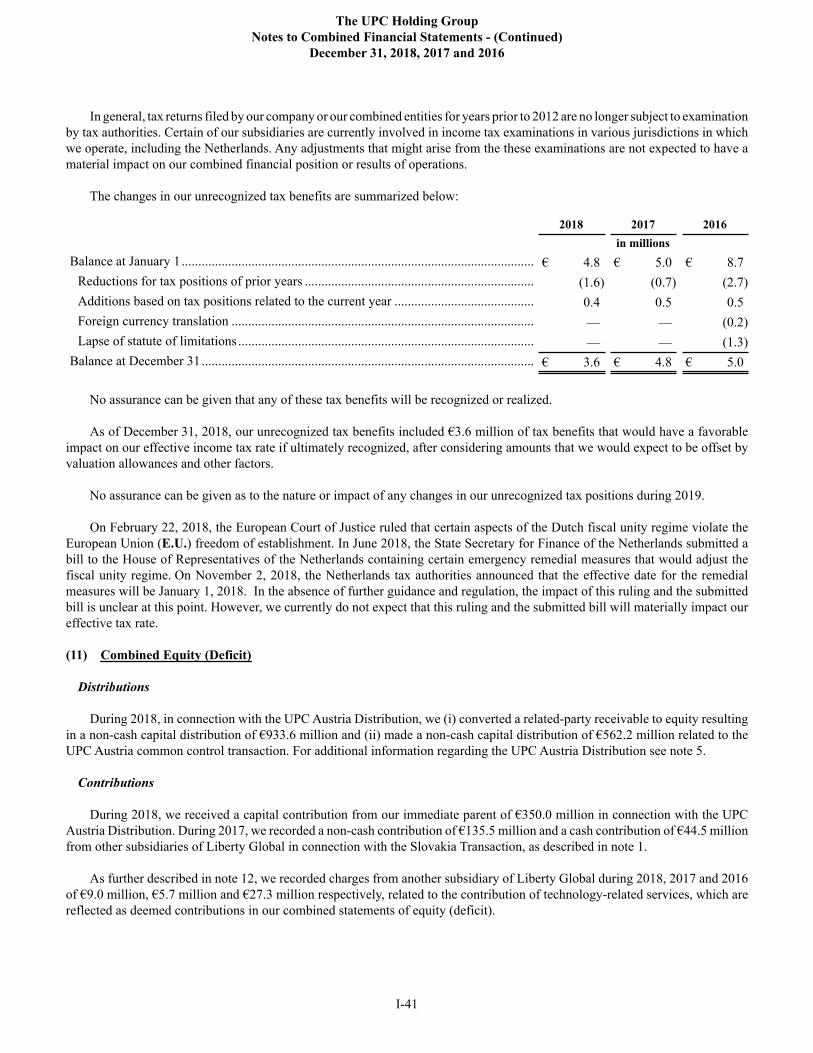
The UPC Holding Group
Notes to Combined Financial Statements - (Continued)
December 31, 2018, 2017 and 2016
I-41
In general, tax returns filed by our company or our combined entities for years prior to 2012 are no longer subject to examination
by tax authorities. Certain of our subsidiaries are currently involved in income tax examinations in various jurisdictions in which
we operate, including the Netherlands. Any adjustments that might arise from the these examinations are not expected to have a
material impact on our combined financial position or results of operations.
The changes in our unrecognized tax benefits are summarized below:
2018 2017 2016
in millions
Balance at January 1.......................................................................................................... € 4.8 € 5.0 € 8.7
Reductions for tax positions of prior years ..................................................................... (1.6) (0.7) (2.7)
Additions based on tax positions related to the current year .......................................... 0.4 0.5 0.5
Foreign currency translation ........................................................................................... — — (0.2)
Lapse of statute of limitations ......................................................................................... — — (1.3)
Balance at December 31.................................................................................................... € 3.6 € 4.8 € 5.0
No assurance can be given that any of these tax benefits will be recognized or realized.
As of December 31, 2018, our unrecognized tax benefits included €3.6 million of tax benefits that would have a favorable
impact on our effective income tax rate if ultimately recognized, after considering amounts that we would expect to be offset by
valuation allowances and other factors.
No assurance can be given as to the nature or impact of any changes in our unrecognized tax positions during 2019.
On February 22, 2018, the European Court of Justice ruled that certain aspects of the Dutch fiscal unity regime violate the
European Union (E.U.) freedom of establishment. In June 2018, the State Secretary for Finance of the Netherlands submitted a
bill to the House of Representatives of the Netherlands containing certain emergency remedial measures that would adjust the
fiscal unity regime. On November 2, 2018, the Netherlands tax authorities announced that the effective date for the remedial
measures will be January 1, 2018. In the absence of further guidance and regulation, the impact of this ruling and the submitted
bill is unclear at this point. However, we currently do not expect that this ruling and the submitted bill will materially impact our
effective tax rate.
(11) Combined Equity (Deficit)
Distributions
During 2018, in connection with the UPC Austria Distribution, we (i) converted a related-party receivable to equity resulting
in a non-cash capital distribution of €933.6 million and (ii) made a non-cash capital distribution of €562.2 million related to the
UPC Austria common control transaction. For additional information regarding the UPC Austria Distribution see note 5.
Contributions
During 2018, we received a capital contribution from our immediate parent of €350.0 million in connection with the UPC
Austria Distribution. During 2017, we recorded a non-cash contribution of €135.5 million and a cash contribution of €44.5 million
from other subsidiaries of Liberty Global in connection with the Slovakia Transaction, as described in note 1.
As further described in note 12, we recorded charges from another subsidiary of Liberty Global during 2018, 2017 and 2016
of €9.0 million, €5.7 million and €27.3 million respectively, related to the contribution of technology-related services, which are
reflected as deemed contributions in our combined statements of equity (deficit).
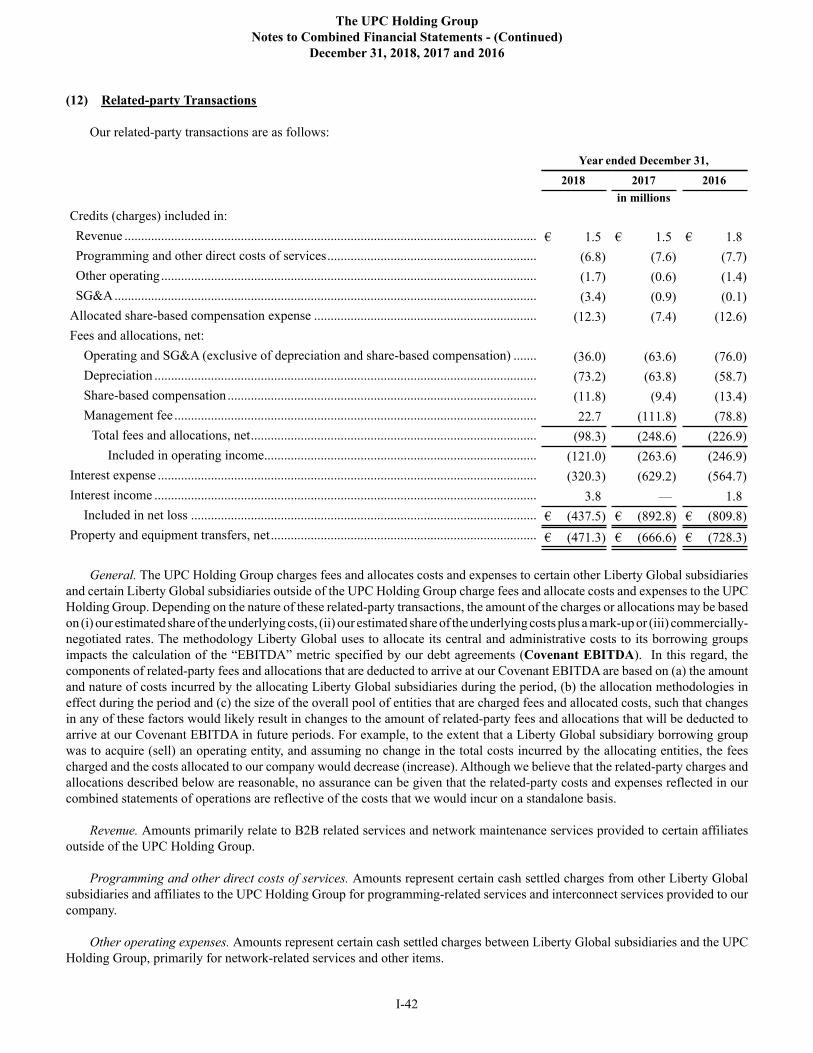
The UPC Holding Group
Notes to Combined Financial Statements - (Continued)
December 31, 2018, 2017 and 2016
I-42
(12) Related-party Transactions
Our related-party transactions are as follows:
Year ended December 31,
2018 2017 2016
in millions
Credits (charges) included in:
Revenue ............................................................................................................................ € 1.5 € 1.5 € 1.8
Programming and other direct costs of services............................................................... (6.8) (7.6) (7.7)
Other operating................................................................................................................. (1.7) (0.6) (1.4)
SG&A............................................................................................................................... (3.4) (0.9) (0.1)
Allocated share-based compensation expense ................................................................... (12.3) (7.4) (12.6)
Fees and allocations, net:
Operating and SG&A (exclusive of depreciation and share-based compensation) ....... (36.0) (63.6) (76.0)
Depreciation ................................................................................................................... (73.2) (63.8) (58.7)
Share-based compensation ............................................................................................. (11.8) (9.4) (13.4)
Management fee ............................................................................................................. 22.7 (111.8) (78.8)
Total fees and allocations, net...................................................................................... (98.3) (248.6) (226.9)
Included in operating income.................................................................................. (121.0) (263.6) (246.9)
Interest expense .................................................................................................................. (320.3) (629.2) (564.7)
Interest income ................................................................................................................... 3.8 — 1.8
Included in net loss ........................................................................................................ € (437.5) € (892.8) € (809.8)
Property and equipment transfers, net................................................................................ € (471.3) € (666.6) € (728.3)
General. The UPC Holding Group charges fees and allocates costs and expenses to certain other Liberty Global subsidiaries
and certain Liberty Global subsidiaries outside of the UPC Holding Group charge fees and allocate costs and expenses to the UPC
Holding Group. Depending on the nature of these related-party transactions, the amount of the charges or allocations may be based
on (i) our estimated share of the underlying costs, (ii) our estimated share of the underlying costs plus a mark-up or (iii) commercially-
negotiated rates. The methodology Liberty Global uses to allocate its central and administrative costs to its borrowing groups
impacts the calculation of the “EBITDA” metric specified by our debt agreements (Covenant EBITDA). In this regard, the
components of related-party fees and allocations that are deducted to arrive at our Covenant EBITDA are based on (a) the amount
and nature of costs incurred by the allocating Liberty Global subsidiaries during the period, (b) the allocation methodologies in
effect during the period and (c) the size of the overall pool of entities that are charged fees and allocated costs, such that changes
in any of these factors would likely result in changes to the amount of related-party fees and allocations that will be deducted to
arrive at our Covenant EBITDA in future periods. For example, to the extent that a Liberty Global subsidiary borrowing group
was to acquire (sell) an operating entity, and assuming no change in the total costs incurred by the allocating entities, the fees
charged and the costs allocated to our company would decrease (increase). Although we believe that the related-party charges and
allocations described below are reasonable, no assurance can be given that the related-party costs and expenses reflected in our
combined statements of operations are reflective of the costs that we would incur on a standalone basis.
Revenue. Amounts primarily relate to B2B related services and network maintenance services provided to certain affiliates
outside of the UPC Holding Group.
Programming and other direct costs of services. Amounts represent certain cash settled charges from other Liberty Global
subsidiaries and affiliates to the UPC Holding Group for programming-related services and interconnect services provided to our
company.
Other operating expenses. Amounts represent certain cash settled charges between Liberty Global subsidiaries and the UPC
Holding Group, primarily for network-related services and other items.
The UPC Holding Group
Notes to Combined Financial Statements - (Continued)
December 31, 2018, 2017 and 2016
I-43
SG&A expenses. Amounts represent certain cash settled charges between Liberty Global subsidiaries and the UPC Holding
Group, primarily for information technology-related services and software maintenance services.
Allocated share-based compensation expense. Amounts are allocated to our company by Liberty Global subsidiaries and
represent share-based compensation expense associated with the Liberty Global share-based incentive awards held by certain
employees of our combined entities. Share-based compensation expense is included in SG&A expenses in our combined statements
of operations.
Fees and allocations, net. These amounts, which are based on our company’s estimated share of the applicable costs (including
personnel-related and other costs associated with the services provided) incurred by Liberty Global subsidiaries, represent the
aggregate net effect of charges between our company and various Liberty Global subsidiaries that are outside of our company.
These charges generally relate to management, finance, legal, technology and other services that support our company’s operations.
The categories of our fees and allocations, net, are as follows:
• Operating and SG&A (exclusive of depreciation and share-based compensation). The amounts included in this category,
which are generally loan settled, represent our estimated share of certain centralized technology, management, marketing,
finance and other operating and SG&A expenses of Liberty Global subsidiaries, whose activities benefit multiple
operations, including operations within and outside of our company. The amounts allocated represent our estimated share
of the actual costs incurred by Liberty Global subsidiaries, without a mark-up. Amounts in this category are generally
deducted to arrive at our Covenant EBITDA.
• Depreciation. The amounts included in this category, which are generally loan settled, represent our estimated share of
depreciation of assets not owned by our company. The amounts allocated represent our estimated share of the actual costs
incurred by Liberty Global subsidiaries, without a mark-up.
• Share-based compensation. The amounts included in this category, which are generally loan settled, represent our estimated
share of share-based compensation associated with Liberty Global employees who are not employees of our company.
The amounts allocated represent our estimated share of the actual costs incurred by Liberty Global subsidiaries, without
a mark-up.
• Management fee. The amounts included in this category, which are generally loan settled, represent our estimated allocable
share of (i) operating and SG&A expenses related to stewardship services provided by certain Liberty Global subsidiaries
and (ii) the mark-up, if any, applicable to each category of the related-party fees and allocations charged to our company.
Liberty Global charges technology-based fees to our company using a royalty-based method. For 2018, 2017 and 2016, our
proportional share of the technology-based costs of €125.2 million, €133.4 million and €134.3 million, respectively, was €2.9
million, €0.4 million and €10.1 million, respectively, more than the actual amount charged under the royalty-based
method. Accordingly, these excess amounts have been reflected as deemed contributions of technology-related services in our
combined statements of equity (deficit). Any excess of these charges over our estimated proportionate share of the underlying
technology-based costs will be classified as management fees and added back to arrive at Covenant EBITDA.
In addition, we recorded an adjustment during the second quarter of 2016 to reduce the amount charged during 2015 under
the royalty-based method. This adjustment resulted in (i) a €17.6 million reduction to the management fee category of fees and
allocations and (ii) a €13.3 million decrease that is reflected as a deemed contribution of technology-related services in our combined
statement of deficit. The technology fee charged to our company during the third quarter of 2018 includes an €83.8 million credit
that arose from the acceptance of a Bilateral Advance Pricing Arrangement (BAPA) with the Swiss authorities by a subsidiary of
Liberty Global, which is reflected as a reduction to management fees. The BAPA reduced prior year technology fees charged to
our Switzerland operations, primarily during the years ended December 31, 2017 and 2016, and accordingly resulted in the issuance
of a credit note from a subsidiary of Liberty Global to our Switzerland operations in the amount of such reductions.
Interest expense. Amounts primarily include interest accrued on the Shareholder Loan (as defined and described below).
Interest expense is accrued and included in other long-term liabilities during the year, and then added to the Shareholder Loan
balance at the end of the year.
Property and equipment transfers, net. These amounts, which are generally cash settled, represent the net carrying values
related to (i) customer premises equipment that is centrally procured by an entity that is part of the UPC Holding Group and
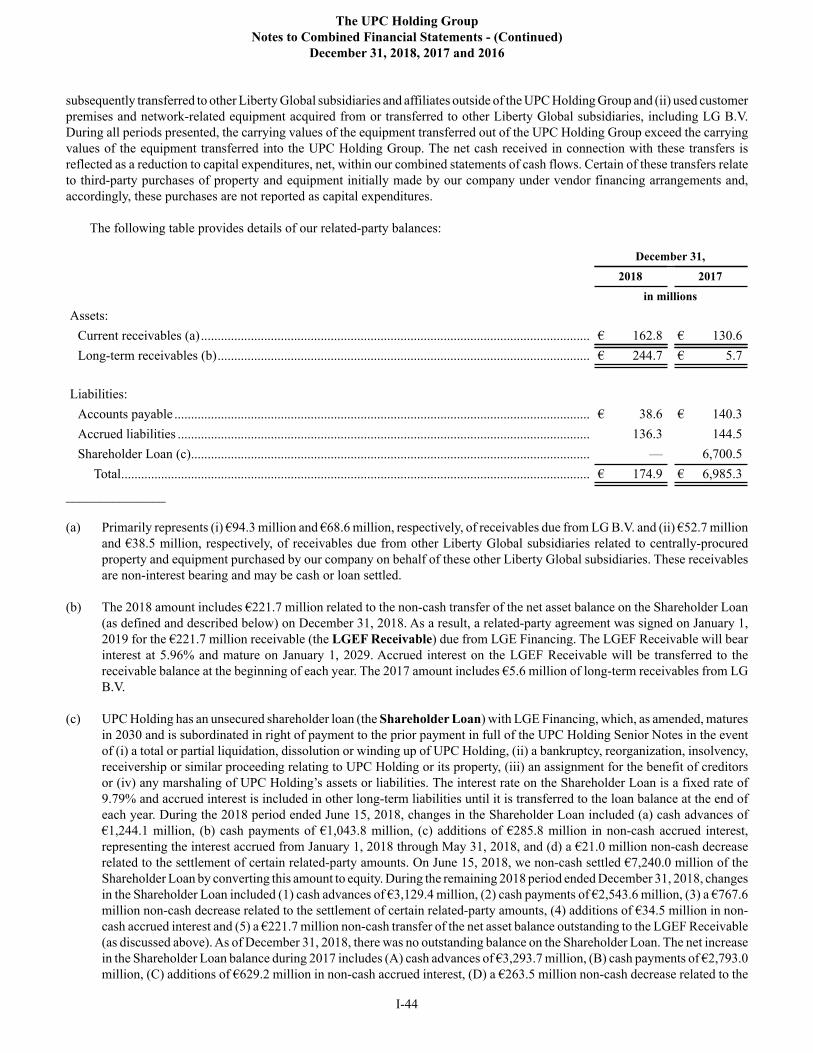
The UPC Holding Group
Notes to Combined Financial Statements - (Continued)
December 31, 2018, 2017 and 2016
I-44
subsequently transferred to other Liberty Global subsidiaries and affiliates outside of the UPC Holding Group and (ii) used customer
premises and network-related equipment acquired from or transferred to other Liberty Global subsidiaries, including LG B.V.
During all periods presented, the carrying values of the equipment transferred out of the UPC Holding Group exceed the carrying
values of the equipment transferred into the UPC Holding Group. The net cash received in connection with these transfers is
reflected as a reduction to capital expenditures, net, within our combined statements of cash flows. Certain of these transfers relate
to third-party purchases of property and equipment initially made by our company under vendor financing arrangements and,
accordingly, these purchases are not reported as capital expenditures.
The following table provides details of our related-party balances:
December 31,
2018 2017
in millions
Assets:
Current receivables (a)..................................................................................................................... € 162.8 € 130.6
Long-term receivables (b)................................................................................................................ € 244.7 € 5.7
Liabilities:
Accounts payable ............................................................................................................................. € 38.6 € 140.3
Accrued liabilities ............................................................................................................................ 136.3 144.5
Shareholder Loan (c)........................................................................................................................ — 6,700.5
Total............................................................................................................................................. € 174.9 € 6,985.3
_______________
(a) Primarily represents (i) €94.3 million and €68.6 million, respectively, of receivables due from LG B.V. and (ii) €52.7 million
and €38.5 million, respectively, of receivables due from other Liberty Global subsidiaries related to centrally-procured
property and equipment purchased by our company on behalf of these other Liberty Global subsidiaries. These receivables
are non-interest bearing and may be cash or loan settled.
(b) The 2018 amount includes €221.7 million related to the non-cash transfer of the net asset balance on the Shareholder Loan
(as defined and described below) on December 31, 2018. As a result, a related-party agreement was signed on January 1,
2019 for the €221.7 million receivable (the LGEF Receivable) due from LGE Financing. The LGEF Receivable will bear
interest at 5.96% and mature on January 1, 2029. Accrued interest on the LGEF Receivable will be transferred to the
receivable balance at the beginning of each year. The 2017 amount includes €5.6 million of long-term receivables from LG
B.V.
(c) UPC Holding has an unsecured shareholder loan (the Shareholder Loan) with LGE Financing, which, as amended, matures
in 2030 and is subordinated in right of payment to the prior payment in full of the UPC Holding Senior Notes in the event
of (i) a total or partial liquidation, dissolution or winding up of UPC Holding, (ii) a bankruptcy, reorganization, insolvency,
receivership or similar proceeding relating to UPC Holding or its property, (iii) an assignment for the benefit of creditors
or (iv) any marshaling of UPC Holding’s assets or liabilities. The interest rate on the Shareholder Loan is a fixed rate of
9.79% and accrued interest is included in other long-term liabilities until it is transferred to the loan balance at the end of
each year. During the 2018 period ended June 15, 2018, changes in the Shareholder Loan included (a) cash advances of
€1,244.1 million, (b) cash payments of €1,043.8 million, (c) additions of €285.8 million in non-cash accrued interest,
representing the interest accrued from January 1, 2018 through May 31, 2018, and (d) a €21.0 million non-cash decrease
related to the settlement of certain related-party amounts. On June 15, 2018, we non-cash settled €7,240.0 million of the
Shareholder Loan by converting this amount to equity. During the remaining 2018 period ended December 31, 2018, changes
in the Shareholder Loan included (1) cash advances of €3,129.4 million, (2) cash payments of €2,543.6 million, (3) a €767.6
million non-cash decrease related to the settlement of certain related-party amounts, (4) additions of €34.5 million in non-
cash accrued interest and (5) a €221.7 million non-cash transfer of the net asset balance outstanding to the LGEF Receivable
(as discussed above). As of December 31, 2018, there was no outstanding balance on the Shareholder Loan. The net increase
in the Shareholder Loan balance during 2017 includes (A) cash advances of €3,293.7 million, (B) cash payments of €2,793.0
million, (C) additions of €629.2 million in non-cash accrued interest, (D) a €263.5 million non-cash decrease related to the
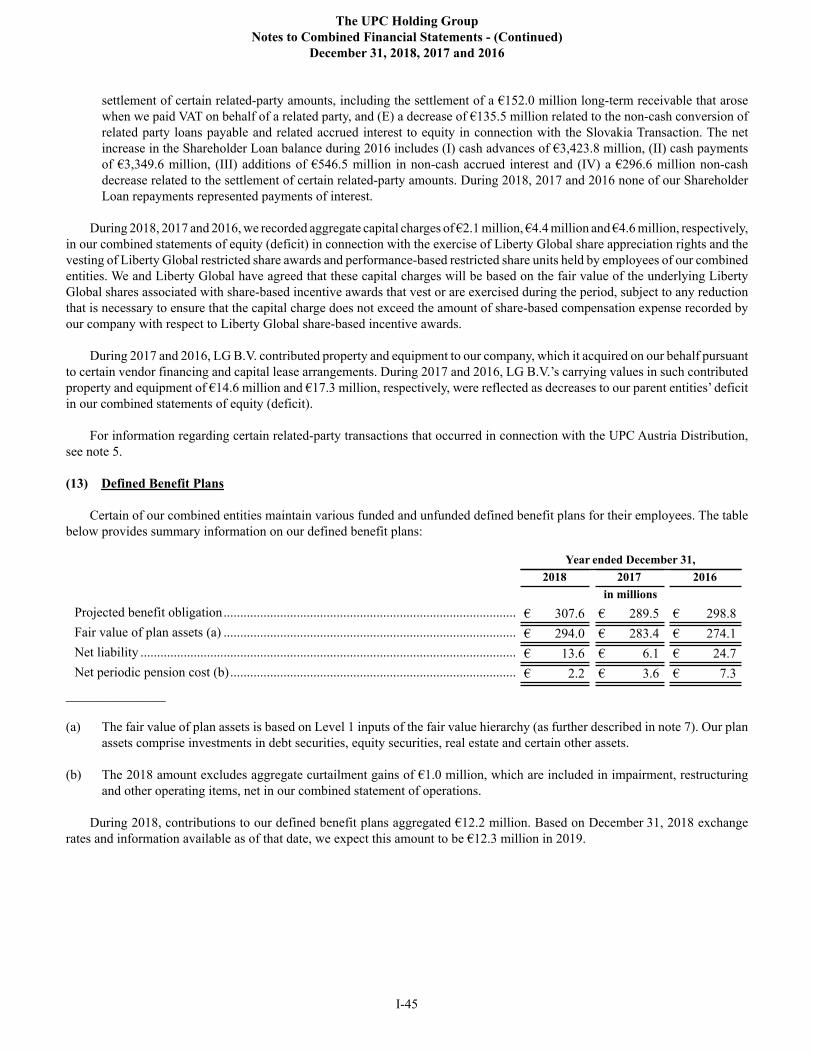
The UPC Holding Group
Notes to Combined Financial Statements - (Continued)
December 31, 2018, 2017 and 2016
I-45
settlement of certain related-party amounts, including the settlement of a €152.0 million long-term receivable that arose
when we paid VAT on behalf of a related party, and (E) a decrease of €135.5 million related to the non-cash conversion of
related party loans payable and related accrued interest to equity in connection with the Slovakia Transaction. The net
increase in the Shareholder Loan balance during 2016 includes (I) cash advances of €3,423.8 million, (II) cash payments
of €3,349.6 million, (III) additions of €546.5 million in non-cash accrued interest and (IV) a €296.6 million non-cash
decrease related to the settlement of certain related-party amounts. During 2018, 2017 and 2016 none of our Shareholder
Loan repayments represented payments of interest.
During 2018, 2017 and 2016, we recorded aggregate capital charges of €2.1 million, €4.4 million and €4.6 million, respectively,
in our combined statements of equity (deficit) in connection with the exercise of Liberty Global share appreciation rights and the
vesting of Liberty Global restricted share awards and performance-based restricted share units held by employees of our combined
entities. We and Liberty Global have agreed that these capital charges will be based on the fair value of the underlying Liberty
Global shares associated with share-based incentive awards that vest or are exercised during the period, subject to any reduction
that is necessary to ensure that the capital charge does not exceed the amount of share-based compensation expense recorded by
our company with respect to Liberty Global share-based incentive awards.
During 2017 and 2016, LG B.V. contributed property and equipment to our company, which it acquired on our behalf pursuant
to certain vendor financing and capital lease arrangements. During 2017 and 2016, LG B.V.’s carrying values in such contributed
property and equipment of €14.6 million and €17.3 million, respectively, were reflected as decreases to our parent entities’ deficit
in our combined statements of equity (deficit).
For information regarding certain related-party transactions that occurred in connection with the UPC Austria Distribution,
see note 5.
(13) Defined Benefit Plans
Certain of our combined entities maintain various funded and unfunded defined benefit plans for their employees. The table
below provides summary information on our defined benefit plans:
Year ended December 31,
2018 2017 2016
in millions
Projected benefit obligation........................................................................................ € 307.6 € 289.5 € 298.8
Fair value of plan assets (a) ........................................................................................ € 294.0 € 283.4 € 274.1
Net liability ................................................................................................................. € 13.6 € 6.1 € 24.7
Net periodic pension cost (b)...................................................................................... € 2.2 € 3.6 € 7.3
_______________
(a) The fair value of plan assets is based on Level 1 inputs of the fair value hierarchy (as further described in note 7). Our plan
assets comprise investments in debt securities, equity securities, real estate and certain other assets.
(b) The 2018 amount excludes aggregate curtailment gains of €1.0 million, which are included in impairment, restructuring
and other operating items, net in our combined statement of operations.
During 2018, contributions to our defined benefit plans aggregated €12.2 million. Based on December 31, 2018 exchange
rates and information available as of that date, we expect this amount to be €12.3 million in 2019.
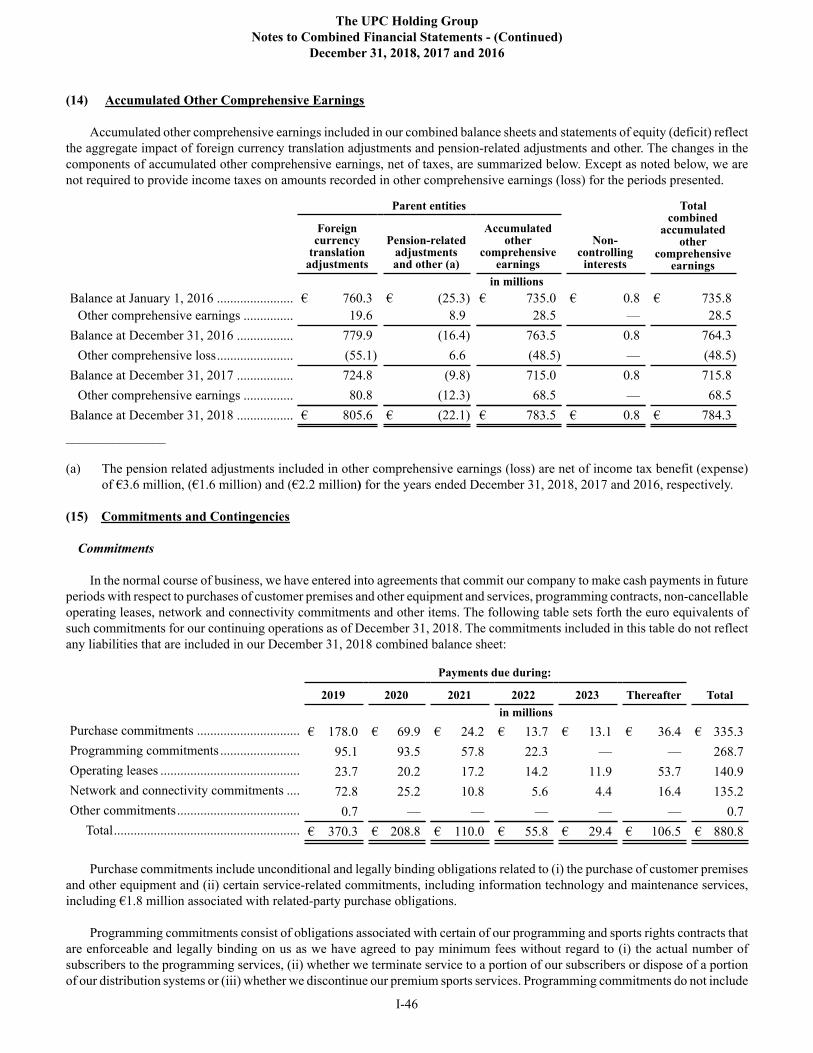
The UPC Holding Group
Notes to Combined Financial Statements - (Continued)
December 31, 2018, 2017 and 2016
I-46
(14) Accumulated Other Comprehensive Earnings
Accumulated other comprehensive earnings included in our combined balance sheets and statements of equity (deficit) reflect
the aggregate impact of foreign currency translation adjustments and pension-related adjustments and other. The changes in the
components of accumulated other comprehensive earnings, net of taxes, are summarized below. Except as noted below, we are
not required to provide income taxes on amounts recorded in other comprehensive earnings (loss) for the periods presented.
Parent entities Totalcombined
accumulatedother
comprehensiveearnings
Foreigncurrency
translationadjustments
Pension-relatedadjustmentsand other (a)
Accumulatedother
comprehensiveearnings
Non-controlling
interests
in millions
Balance at January 1, 2016 ....................... € 760.3 € (25.3) € 735.0 € 0.8 € 735.8
Other comprehensive earnings ............... 19.6 8.9 28.5 — 28.5
Balance at December 31, 2016 ................. 779.9 (16.4) 763.5 0.8 764.3
Other comprehensive loss....................... (55.1) 6.6 (48.5) — (48.5)
Balance at December 31, 2017 ................. 724.8 (9.8) 715.0 0.8 715.8
Other comprehensive earnings ............... 80.8 (12.3) 68.5 — 68.5
Balance at December 31, 2018 ................. € 805.6 € (22.1) € 783.5 € 0.8 € 784.3
_______________
(a) The pension related adjustments included in other comprehensive earnings (loss) are net of income tax benefit (expense)
of €3.6 million, (€1.6 million) and (€2.2 million) for the years ended December 31, 2018, 2017 and 2016, respectively.
(15) Commitments and Contingencies
Commitments
In the normal course of business, we have entered into agreements that commit our company to make cash payments in future
periods with respect to purchases of customer premises and other equipment and services, programming contracts, non-cancellable
operating leases, network and connectivity commitments and other items. The following table sets forth the euro equivalents of
such commitments for our continuing operations as of December 31, 2018. The commitments included in this table do not reflect
any liabilities that are included in our December 31, 2018 combined balance sheet:
Payments due during:
2019 2020 2021 2022 2023 Thereafter Total
in millions
Purchase commitments ............................... € 178.0 € 69.9 € 24.2 € 13.7 € 13.1 € 36.4 € 335.3
Programming commitments ........................ 95.1 93.5 57.8 22.3 — — 268.7
Operating leases .......................................... 23.7 20.2 17.2 14.2 11.9 53.7 140.9
Network and connectivity commitments .... 72.8 25.2 10.8 5.6 4.4 16.4 135.2
Other commitments..................................... 0.7 — — — — — 0.7
Total........................................................ € 370.3 € 208.8 € 110.0 € 55.8 € 29.4 € 106.5 € 880.8
Purchase commitments include unconditional and legally binding obligations related to (i) the purchase of customer premises
and other equipment and (ii) certain service-related commitments, including information technology and maintenance services,
including €1.8 million associated with related-party purchase obligations.
Programming commitments consist of obligations associated with certain of our programming and sports rights contracts that
are enforceable and legally binding on us as we have agreed to pay minimum fees without regard to (i) the actual number of
subscribers to the programming services, (ii) whether we terminate service to a portion of our subscribers or dispose of a portion
of our distribution systems or (iii) whether we discontinue our premium sports services. Programming commitments do not include
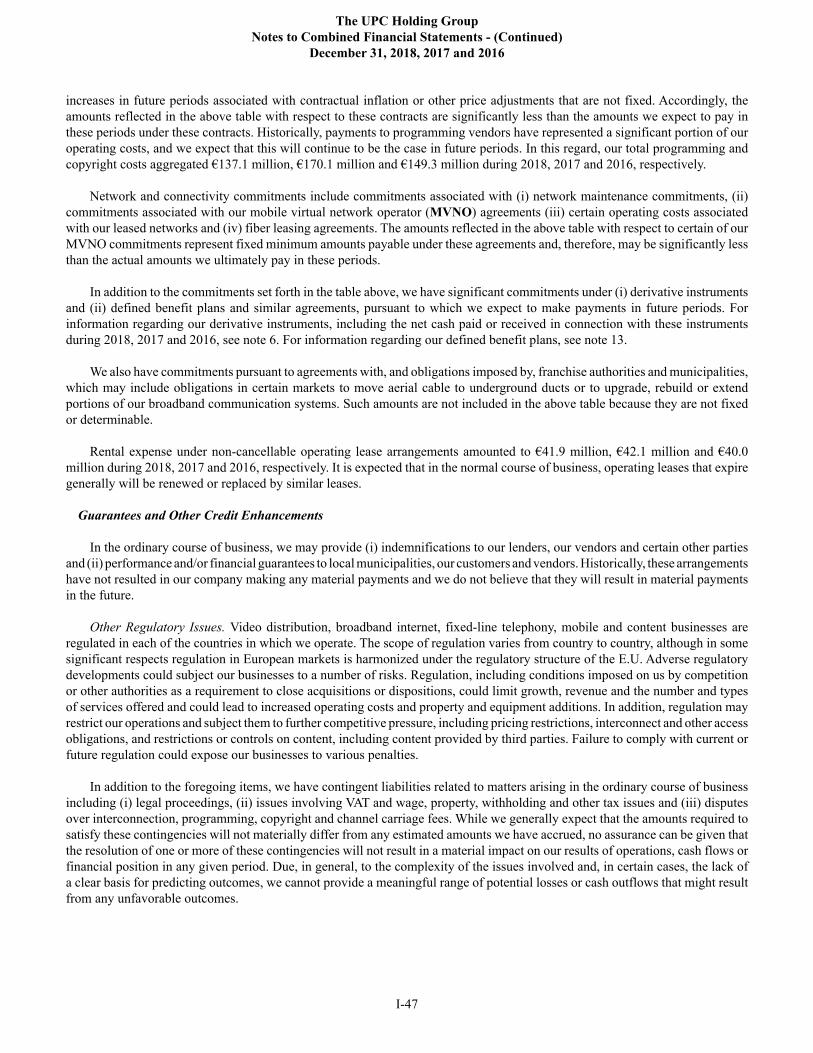
The UPC Holding Group
Notes to Combined Financial Statements - (Continued)
December 31, 2018, 2017 and 2016
I-47
increases in future periods associated with contractual inflation or other price adjustments that are not fixed. Accordingly, the
amounts reflected in the above table with respect to these contracts are significantly less than the amounts we expect to pay in
these periods under these contracts. Historically, payments to programming vendors have represented a significant portion of our
operating costs, and we expect that this will continue to be the case in future periods. In this regard, our total programming and
copyright costs aggregated €137.1 million, €170.1 million and €149.3 million during 2018, 2017 and 2016, respectively.
Network and connectivity commitments include commitments associated with (i) network maintenance commitments, (ii)
commitments associated with our mobile virtual network operator (MVNO) agreements (iii) certain operating costs associated
with our leased networks and (iv) fiber leasing agreements. The amounts reflected in the above table with respect to certain of our
MVNO commitments represent fixed minimum amounts payable under these agreements and, therefore, may be significantly less
than the actual amounts we ultimately pay in these periods.
In addition to the commitments set forth in the table above, we have significant commitments under (i) derivative instruments
and (ii) defined benefit plans and similar agreements, pursuant to which we expect to make payments in future periods. For
information regarding our derivative instruments, including the net cash paid or received in connection with these instruments
during 2018, 2017 and 2016, see note 6. For information regarding our defined benefit plans, see note 13.
We also have commitments pursuant to agreements with, and obligations imposed by, franchise authorities and municipalities,
which may include obligations in certain markets to move aerial cable to underground ducts or to upgrade, rebuild or extend
portions of our broadband communication systems. Such amounts are not included in the above table because they are not fixed
or determinable.
Rental expense under non-cancellable operating lease arrangements amounted to €41.9 million, €42.1 million and €40.0
million during 2018, 2017 and 2016, respectively. It is expected that in the normal course of business, operating leases that expire
generally will be renewed or replaced by similar leases.
Guarantees and Other Credit Enhancements
In the ordinary course of business, we may provide (i) indemnifications to our lenders, our vendors and certain other parties
and (ii) performance and/or financial guarantees to local municipalities, our customers and vendors. Historically, these arrangements
have not resulted in our company making any material payments and we do not believe that they will result in material payments
in the future.
Other Regulatory Issues. Video distribution, broadband internet, fixed-line telephony, mobile and content businesses are
regulated in each of the countries in which we operate. The scope of regulation varies from country to country, although in some
significant respects regulation in European markets is harmonized under the regulatory structure of the E.U. Adverse regulatory
developments could subject our businesses to a number of risks. Regulation, including conditions imposed on us by competition
or other authorities as a requirement to close acquisitions or dispositions, could limit growth, revenue and the number and types
of services offered and could lead to increased operating costs and property and equipment additions. In addition, regulation may
restrict our operations and subject them to further competitive pressure, including pricing restrictions, interconnect and other access
obligations, and restrictions or controls on content, including content provided by third parties. Failure to comply with current or
future regulation could expose our businesses to various penalties.
In addition to the foregoing items, we have contingent liabilities related to matters arising in the ordinary course of business
including (i) legal proceedings, (ii) issues involving VAT and wage, property, withholding and other tax issues and (iii) disputes
over interconnection, programming, copyright and channel carriage fees. While we generally expect that the amounts required to
satisfy these contingencies will not materially differ from any estimated amounts we have accrued, no assurance can be given that
the resolution of one or more of these contingencies will not result in a material impact on our results of operations, cash flows or
financial position in any given period. Due, in general, to the complexity of the issues involved and, in certain cases, the lack of
a clear basis for predicting outcomes, we cannot provide a meaningful range of potential losses or cash outflows that might result
from any unfavorable outcomes.
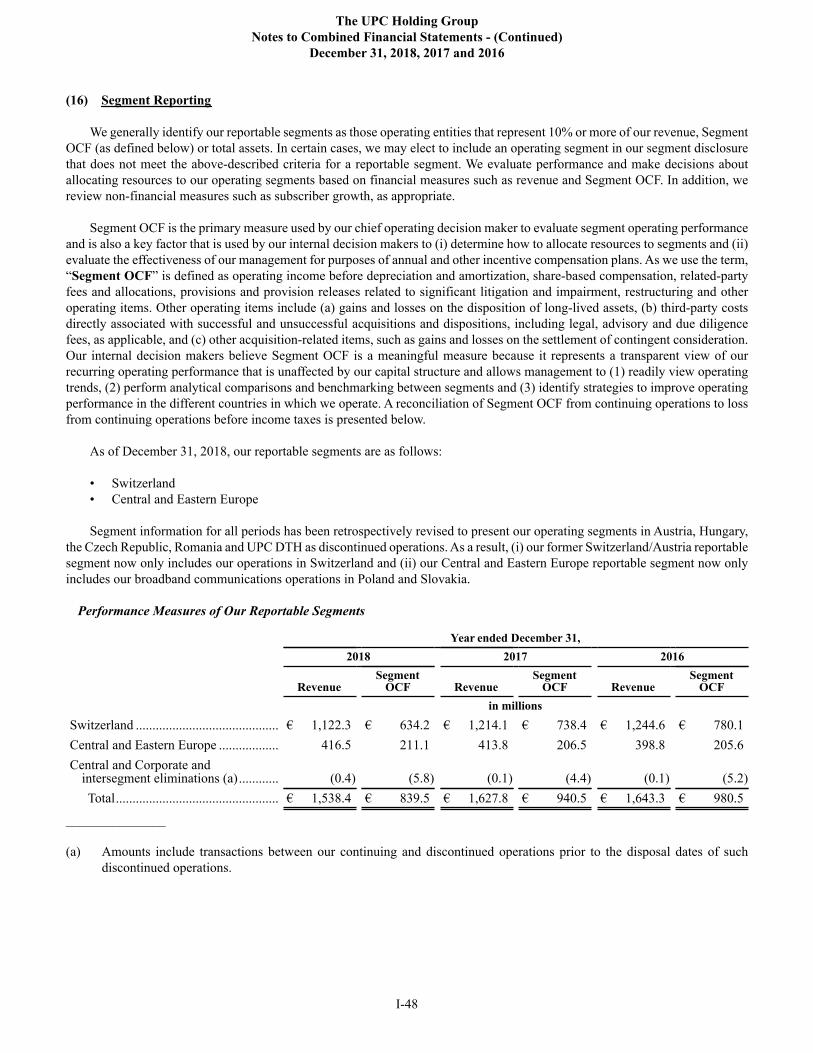
The UPC Holding Group
Notes to Combined Financial Statements - (Continued)
December 31, 2018, 2017 and 2016
I-48
(16) Segment Reporting
We generally identify our reportable segments as those operating entities that represent 10% or more of our revenue, Segment
OCF (as defined below) or total assets. In certain cases, we may elect to include an operating segment in our segment disclosure
that does not meet the above-described criteria for a reportable segment. We evaluate performance and make decisions about
allocating resources to our operating segments based on financial measures such as revenue and Segment OCF. In addition, we
review non-financial measures such as subscriber growth, as appropriate.
Segment OCF is the primary measure used by our chief operating decision maker to evaluate segment operating performance
and is also a key factor that is used by our internal decision makers to (i) determine how to allocate resources to segments and (ii)
evaluate the effectiveness of our management for purposes of annual and other incentive compensation plans. As we use the term,
“Segment OCF” is defined as operating income before depreciation and amortization, share-based compensation, related-party
fees and allocations, provisions and provision releases related to significant litigation and impairment, restructuring and other
operating items. Other operating items include (a) gains and losses on the disposition of long-lived assets, (b) third-party costs
directly associated with successful and unsuccessful acquisitions and dispositions, including legal, advisory and due diligence
fees, as applicable, and (c) other acquisition-related items, such as gains and losses on the settlement of contingent consideration.
Our internal decision makers believe Segment OCF is a meaningful measure because it represents a transparent view of our
recurring operating performance that is unaffected by our capital structure and allows management to (1) readily view operating
trends, (2) perform analytical comparisons and benchmarking between segments and (3) identify strategies to improve operating
performance in the different countries in which we operate. A reconciliation of Segment OCF from continuing operations to loss
from continuing operations before income taxes is presented below.
As of December 31, 2018, our reportable segments are as follows:
• Switzerland
• Central and Eastern Europe
Segment information for all periods has been retrospectively revised to present our operating segments in Austria, Hungary,
the Czech Republic, Romania and UPC DTH as discontinued operations. As a result, (i) our former Switzerland/Austria reportable
segment now only includes our operations in Switzerland and (ii) our Central and Eastern Europe reportable segment now only
includes our broadband communications operations in Poland and Slovakia.
Performance Measures of Our Reportable Segments
Year ended December 31,
2018 2017 2016
RevenueSegment
OCF RevenueSegment
OCF RevenueSegment
OCF
in millions
Switzerland ........................................... € 1,122.3 € 634.2 € 1,214.1 € 738.4 € 1,244.6 € 780.1
Central and Eastern Europe .................. 416.5 211.1 413.8 206.5 398.8 205.6
Central and Corporate andintersegment eliminations (a)............ (0.4) (5.8) (0.1) (4.4) (0.1) (5.2)
Total................................................. € 1,538.4 € 839.5 € 1,627.8 € 940.5 € 1,643.3 € 980.5
_______________
(a) Amounts include transactions between our continuing and discontinued operations prior to the disposal dates of such
discontinued operations.
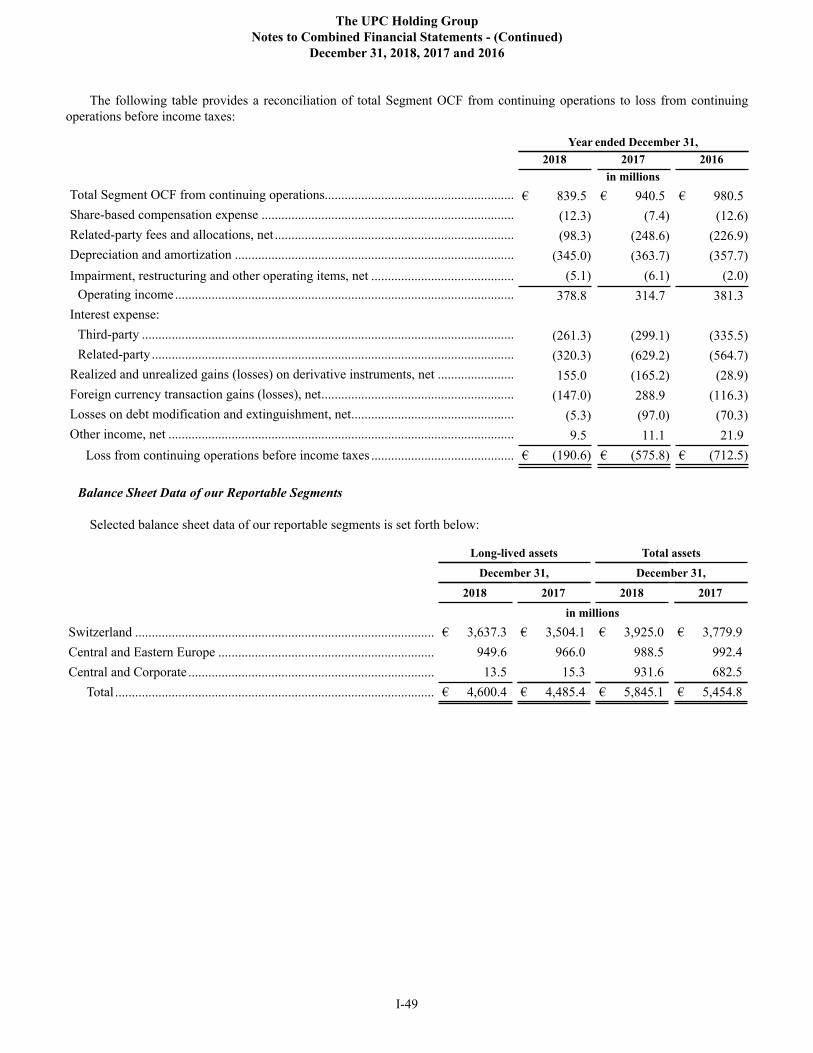
The UPC Holding Group
Notes to Combined Financial Statements - (Continued)
December 31, 2018, 2017 and 2016
I-49
The following table provides a reconciliation of total Segment OCF from continuing operations to loss from continuing
operations before income taxes:
Year ended December 31,
2018 2017 2016
in millions
Total Segment OCF from continuing operations......................................................... € 839.5 € 940.5 € 980.5
Share-based compensation expense ............................................................................ (12.3) (7.4) (12.6)
Related-party fees and allocations, net ........................................................................ (98.3) (248.6) (226.9)
Depreciation and amortization .................................................................................... (345.0) (363.7) (357.7)
Impairment, restructuring and other operating items, net ........................................... (5.1) (6.1) (2.0)
Operating income...................................................................................................... 378.8 314.7 381.3
Interest expense:
Third-party ................................................................................................................ (261.3) (299.1) (335.5)
Related-party ............................................................................................................. (320.3) (629.2) (564.7)
Realized and unrealized gains (losses) on derivative instruments, net ....................... 155.0 (165.2) (28.9)
Foreign currency transaction gains (losses), net.......................................................... (147.0) 288.9 (116.3)
Losses on debt modification and extinguishment, net................................................. (5.3) (97.0) (70.3)
Other income, net ........................................................................................................ 9.5 11.1 21.9
Loss from continuing operations before income taxes ........................................... € (190.6) € (575.8) € (712.5)
Balance Sheet Data of our Reportable Segments
Selected balance sheet data of our reportable segments is set forth below:
Long-lived assets Total assets
December 31, December 31,
2018 2017 2018 2017
in millions
Switzerland .......................................................................................... € 3,637.3 € 3,504.1 € 3,925.0 € 3,779.9
Central and Eastern Europe ................................................................. 949.6 966.0 988.5 992.4
Central and Corporate .......................................................................... 13.5 15.3 931.6 682.5
Total ................................................................................................ € 4,600.4 € 4,485.4 € 5,845.1 € 5,454.8
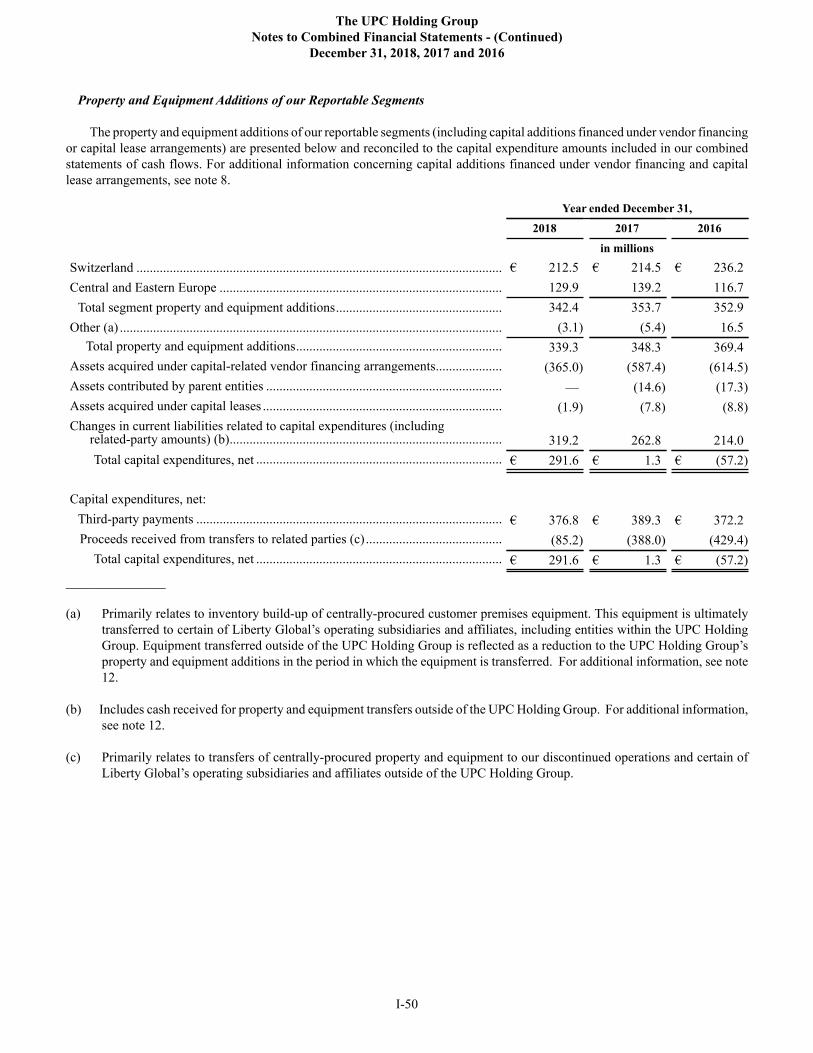
The UPC Holding Group
Notes to Combined Financial Statements - (Continued)
December 31, 2018, 2017 and 2016
I-50
Property and Equipment Additions of our Reportable Segments
The property and equipment additions of our reportable segments (including capital additions financed under vendor financing
or capital lease arrangements) are presented below and reconciled to the capital expenditure amounts included in our combined
statements of cash flows. For additional information concerning capital additions financed under vendor financing and capital
lease arrangements, see note 8.
Year ended December 31,
2018 2017 2016
in millions
Switzerland .............................................................................................................. € 212.5 € 214.5 € 236.2
Central and Eastern Europe ..................................................................................... 129.9 139.2 116.7
Total segment property and equipment additions.................................................. 342.4 353.7 352.9
Other (a) ................................................................................................................... (3.1) (5.4) 16.5
Total property and equipment additions.............................................................. 339.3 348.3 369.4
Assets acquired under capital-related vendor financing arrangements.................... (365.0) (587.4) (614.5)
Assets contributed by parent entities ....................................................................... — (14.6) (17.3)
Assets acquired under capital leases ........................................................................ (1.9) (7.8) (8.8)
Changes in current liabilities related to capital expenditures (including related-party amounts) (b).................................................................................. 319.2 262.8 214.0
Total capital expenditures, net .......................................................................... € 291.6 € 1.3 € (57.2)
Capital expenditures, net:
Third-party payments ............................................................................................ € 376.8 € 389.3 € 372.2
Proceeds received from transfers to related parties (c)......................................... (85.2) (388.0) (429.4)
Total capital expenditures, net .......................................................................... € 291.6 € 1.3 € (57.2)
_______________
(a) Primarily relates to inventory build-up of centrally-procured customer premises equipment. This equipment is ultimately
transferred to certain of Liberty Global’s operating subsidiaries and affiliates, including entities within the UPC Holding
Group. Equipment transferred outside of the UPC Holding Group is reflected as a reduction to the UPC Holding Group’s
property and equipment additions in the period in which the equipment is transferred. For additional information, see note
12.
(b) Includes cash received for property and equipment transfers outside of the UPC Holding Group. For additional information,
see note 12.
(c) Primarily relates to transfers of centrally-procured property and equipment to our discontinued operations and certain of
Liberty Global’s operating subsidiaries and affiliates outside of the UPC Holding Group.
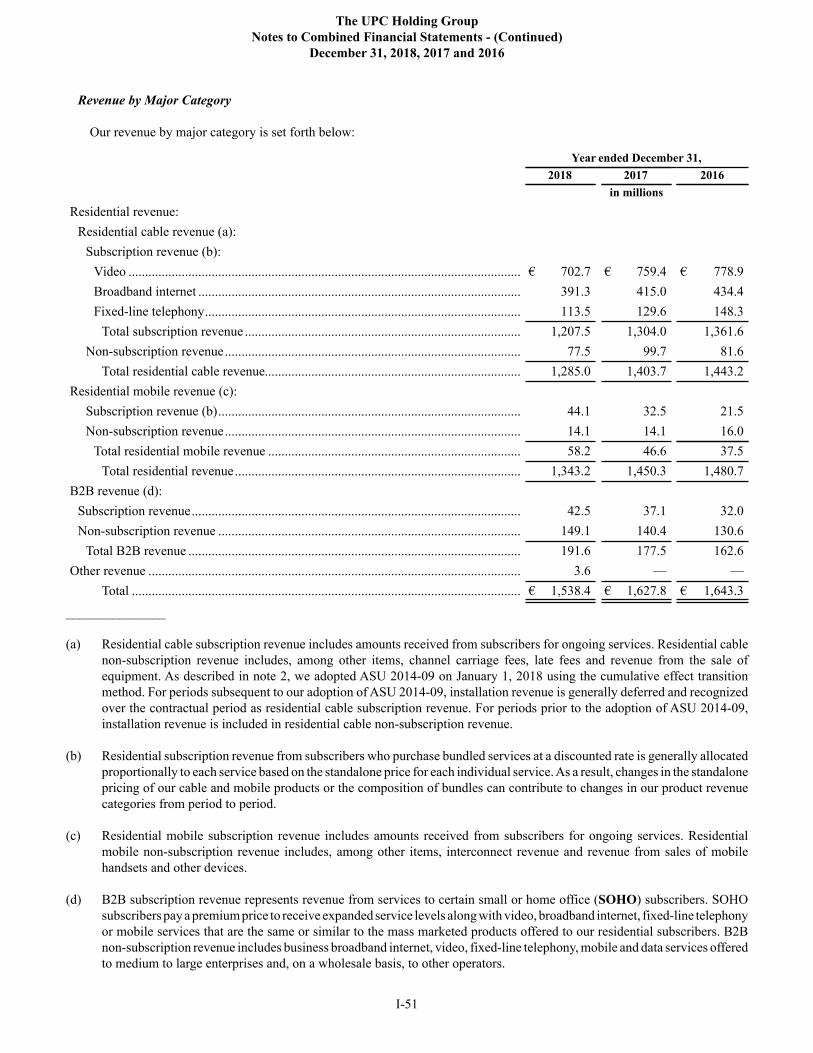
The UPC Holding Group
Notes to Combined Financial Statements - (Continued)
December 31, 2018, 2017 and 2016
I-51
Revenue by Major Category
Our revenue by major category is set forth below:
Year ended December 31,
2018 2017 2016
in millions
Residential revenue:
Residential cable revenue (a):
Subscription revenue (b):
Video ...................................................................................................................... € 702.7 € 759.4 € 778.9
Broadband internet ................................................................................................. 391.3 415.0 434.4
Fixed-line telephony............................................................................................... 113.5 129.6 148.3
Total subscription revenue ................................................................................... 1,207.5 1,304.0 1,361.6
Non-subscription revenue......................................................................................... 77.5 99.7 81.6
Total residential cable revenue............................................................................. 1,285.0 1,403.7 1,443.2
Residential mobile revenue (c):
Subscription revenue (b)........................................................................................... 44.1 32.5 21.5
Non-subscription revenue......................................................................................... 14.1 14.1 16.0
Total residential mobile revenue ............................................................................ 58.2 46.6 37.5
Total residential revenue...................................................................................... 1,343.2 1,450.3 1,480.7
B2B revenue (d):
Subscription revenue................................................................................................... 42.5 37.1 32.0
Non-subscription revenue ........................................................................................... 149.1 140.4 130.6
Total B2B revenue .................................................................................................... 191.6 177.5 162.6
Other revenue ................................................................................................................ 3.6 — —
Total ..................................................................................................................... € 1,538.4 € 1,627.8 € 1,643.3
_______________
(a) Residential cable subscription revenue includes amounts received from subscribers for ongoing services. Residential cable
non-subscription revenue includes, among other items, channel carriage fees, late fees and revenue from the sale of
equipment. As described in note 2, we adopted ASU 2014-09 on January 1, 2018 using the cumulative effect transition
method. For periods subsequent to our adoption of ASU 2014-09, installation revenue is generally deferred and recognized
over the contractual period as residential cable subscription revenue. For periods prior to the adoption of ASU 2014-09,
installation revenue is included in residential cable non-subscription revenue.
(b) Residential subscription revenue from subscribers who purchase bundled services at a discounted rate is generally allocated
proportionally to each service based on the standalone price for each individual service. As a result, changes in the standalone
pricing of our cable and mobile products or the composition of bundles can contribute to changes in our product revenue
categories from period to period.
(c) Residential mobile subscription revenue includes amounts received from subscribers for ongoing services. Residential
mobile non-subscription revenue includes, among other items, interconnect revenue and revenue from sales of mobile
handsets and other devices.
(d) B2B subscription revenue represents revenue from services to certain small or home office (SOHO) subscribers. SOHO
subscribers pay a premium price to receive expanded service levels along with video, broadband internet, fixed-line telephony
or mobile services that are the same or similar to the mass marketed products offered to our residential subscribers. B2B
non-subscription revenue includes business broadband internet, video, fixed-line telephony, mobile and data services offered
to medium to large enterprises and, on a wholesale basis, to other operators.
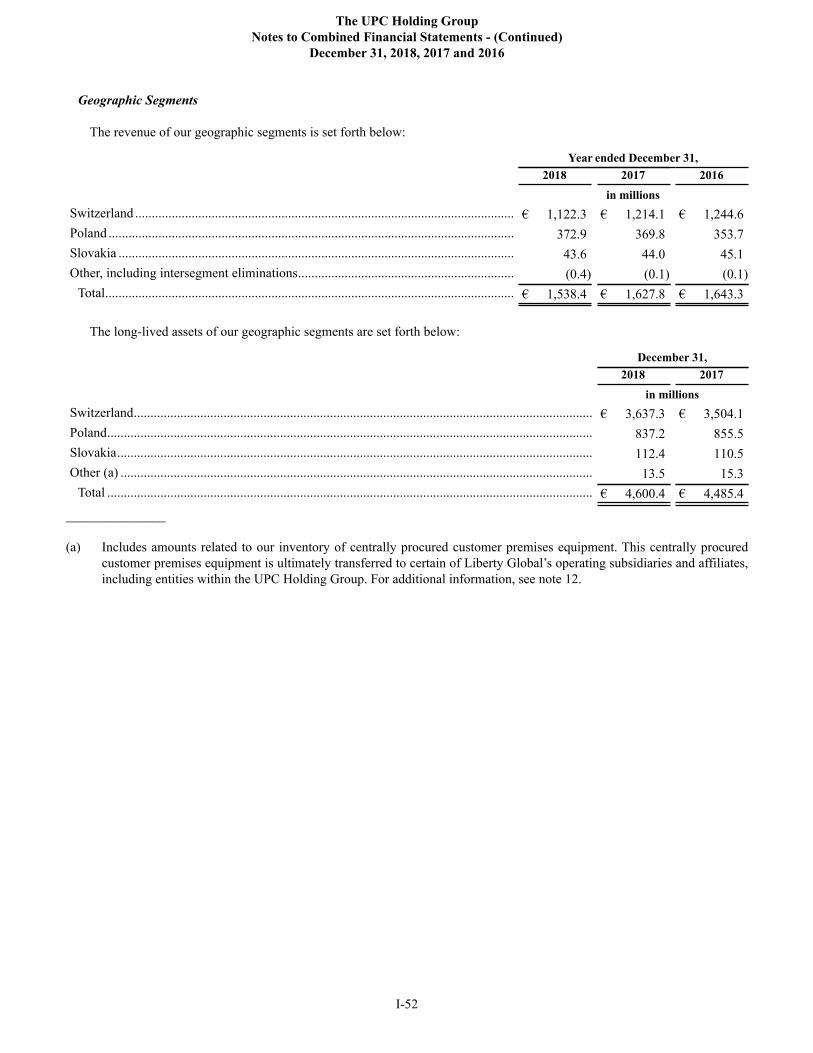
The UPC Holding Group
Notes to Combined Financial Statements - (Continued)
December 31, 2018, 2017 and 2016
I-52
Geographic Segments
The revenue of our geographic segments is set forth below:
Year ended December 31,
2018 2017 2016
in millions
Switzerland .................................................................................................................. € 1,122.3 € 1,214.1 € 1,244.6
Poland .......................................................................................................................... 372.9 369.8 353.7
Slovakia ....................................................................................................................... 43.6 44.0 45.1
Other, including intersegment eliminations................................................................. (0.4) (0.1) (0.1)
Total........................................................................................................................... € 1,538.4 € 1,627.8 € 1,643.3
The long-lived assets of our geographic segments are set forth below:
December 31,
2018 2017
in millions
Switzerland.......................................................................................................................................... € 3,637.3 € 3,504.1
Poland.................................................................................................................................................. 837.2 855.5
Slovakia............................................................................................................................................... 112.4 110.5
Other (a) .............................................................................................................................................. 13.5 15.3
Total .................................................................................................................................................. € 4,600.4 € 4,485.4
_______________
(a) Includes amounts related to our inventory of centrally procured customer premises equipment. This centrally procured
customer premises equipment is ultimately transferred to certain of Liberty Global’s operating subsidiaries and affiliates,
including entities within the UPC Holding Group. For additional information, see note 12.
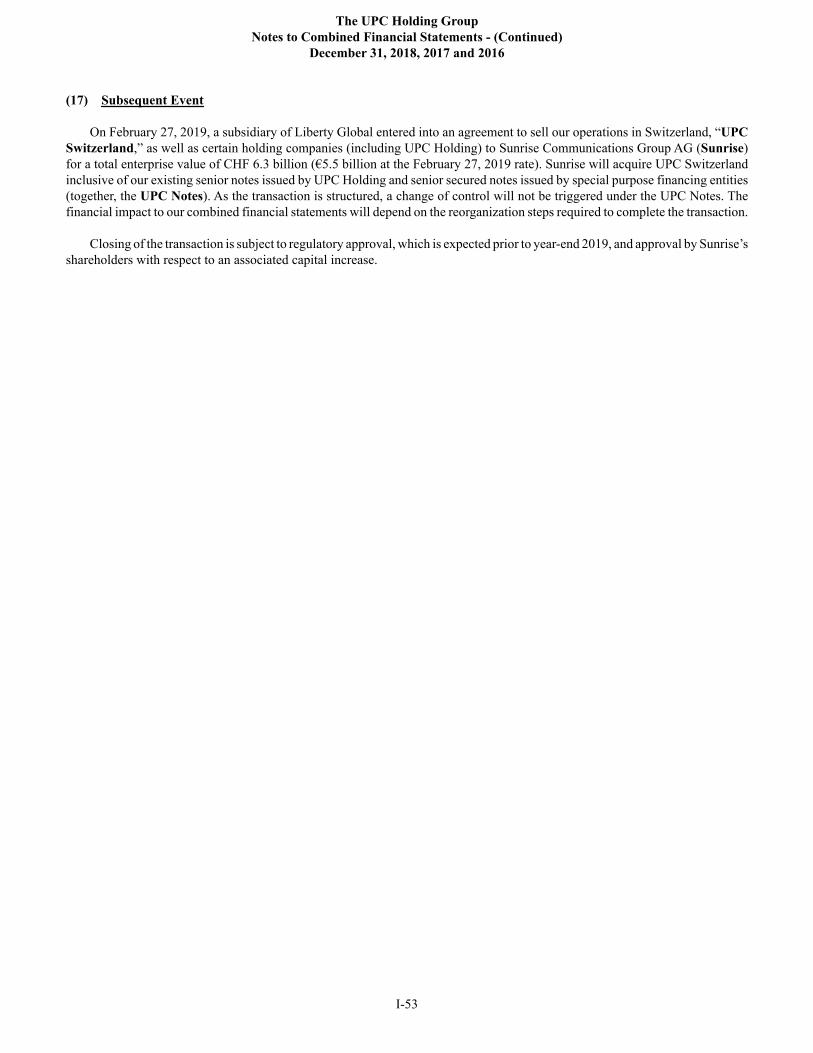
The UPC Holding Group
Notes to Combined Financial Statements - (Continued)
December 31, 2018, 2017 and 2016
I-53
(17) Subsequent Event
On February 27, 2019, a subsidiary of Liberty Global entered into an agreement to sell our operations in Switzerland, “UPC
Switzerland,” as well as certain holding companies (including UPC Holding) to Sunrise Communications Group AG (Sunrise)
for a total enterprise value of CHF 6.3 billion (€5.5 billion at the February 27, 2019 rate). Sunrise will acquire UPC Switzerland
inclusive of our existing senior notes issued by UPC Holding and senior secured notes issued by special purpose financing entities
(together, the UPC Notes). As the transaction is structured, a change of control will not be triggered under the UPC Notes. The
financial impact to our combined financial statements will depend on the reorganization steps required to complete the transaction.
Closing of the transaction is subject to regulatory approval, which is expected prior to year-end 2019, and approval by Sunrise’s
shareholders with respect to an associated capital increase.
II-1
MANAGEMENT’S DISCUSSION AND ANALYSIS OF FINANCIAL CONDITION AND RESULTS OF OPERATIONS
The following discussion and analysis, which should be read in conjunction with our combined financial statements, is intended
to assist in providing an understanding of our results of operations and financial condition and is organized as follows:
• Forward-looking Statements. This section provides a description of certain factors that could cause actual results or events
to differ materially from anticipated results or events.
• Overview. This section provides a general description of our business and recent events.
• Results of Operations. This section provides an analysis of our results of operations for the years ended December 31,
2018, 2017 and 2016.
• Liquidity and Capital Resources. This section provides an analysis of our liquidity, combined statements of cash flows
and contractual commitments.
• Critical Accounting Policies, Judgments and Estimates. This section discusses those material accounting policies that
involve uncertainties and require significant judgment in their application.
The capitalized terms used below have been defined in the notes to our combined financial statements. In the following text,
the terms, “we,” “our,” “our company” and “us” may refer, as the context requires, to UPC Holding or the UPC Holding Group.
Unless otherwise indicated, convenience translations into euros are calculated, and operational data (including subscriber
statistics) are presented, as of December 31, 2018.
Forward-looking Statements
Certain statements in this annual report constitute forward-looking statements. To the extent that statements in this annual
report are not recitations of historical fact, such statements constitute forward-looking statements, which, by definition, involve
risks and uncertainties that could cause actual results to differ materially from those expressed or implied by such statements. In
particular, statements under Management’s Discussion and Analysis of Financial Condition and Results of Operations may contain
forward-looking statements, including statements regarding our business, product, foreign currency and finance strategies in 2019,
subscriber growth and retention rates, competitive, regulatory and economic factors, the timing and impacts of proposed
transactions, the maturity of our markets, the anticipated impacts of new legislation (or changes to existing rules and regulations),
anticipated changes in our revenue, costs or growth rates, our liquidity, credit risks, foreign currency risks, target leverage levels,
our future projected contractual commitments and cash flows and other information and statements that are not historical fact.
Where, in any forward-looking statement, we express an expectation or belief as to future results or events, such expectation or
belief is expressed in good faith and believed to have a reasonable basis, but there can be no assurance that the expectation or
belief will result or be achieved or accomplished. In evaluating these statements, you should consider the risks and uncertainties
in the following list, and those described herein, as some but not all of the factors that could cause actual results or events to differ
materially from anticipated results or events:
• economic and business conditions and industry trends in the countries in which we operate;
• the competitive environment in the industries in the countries in which we operate, including competitor responses to our
products and services;
• fluctuations in currency exchange rates and interest rates;
• instability in global financial markets, including sovereign debt issues and related fiscal reforms;
• consumer disposable income and spending levels, including the availability and amount of individual consumer debt;
• changes in consumer television viewing preferences and habits;
• consumer acceptance of our existing service offerings, including our cable television, broadband internet, fixed-line
telephony, mobile and business service offerings, and of new technology, programming alternatives and other products
and services that we may offer in the future;
• our ability to manage rapid technological changes;
II-2
• our ability to maintain or increase the number of subscriptions to our cable television, broadband internet, fixed-line
telephony and mobile service offerings and our average revenue per household;
• our ability to provide satisfactory customer service, including support for new and evolving products and services;
• our ability to maintain or increase rates to our subscribers or to pass through increased costs to our subscribers;
• the impact of our future financial performance, or market conditions generally, on the availability, terms and deployment
of capital;
• changes in, or failure or inability to comply with, government regulations in the countries in which we operate and adverse
outcomes from regulatory proceedings;
• government intervention that requires opening our broadband distribution networks to competitors;
• our ability to obtain regulatory approval and satisfy other conditions necessary to close acquisitions and dispositions
(including the dispositions of the Vodafone Disposal Group, UPC Switzerland and UPC DTH) and the impact of conditions
imposed by competition and other regulatory authorities in connection with acquisitions;
• our ability to successfully acquire new businesses and, if acquired, to integrate, realize anticipated efficiencies from and
implement our business plan with respect to the businesses we have acquired or that we expect to acquire;
• changes in laws or treaties relating to taxation, or the interpretation thereof, in countries in which we operate;
• changes in laws and government regulations that may impact the availability and cost of capital and the derivative
instruments that hedge certain of our financial risks;
• the ability of suppliers and vendors (including our third-party wireless network providers under our MVNO arrangements)
to timely deliver quality products, equipment, software, services and access;
• the availability of attractive programming for our video services and the costs associated with such programming, including
retransmission and copyright fees payable to public and private broadcasters;
• uncertainties inherent in the development and integration of new business lines and business strategies;
• our ability to adequately forecast and plan future network requirements, including the costs and benefits associated with
any planned network extensions;
• the availability of capital for the acquisition and/or development of telecommunications networks and services;
• problems we may discover post-closing with the operations, including the internal controls and financial reporting process,
of businesses we acquire;
• the leakage of sensitive customer data;
• the outcome of any pending or threatened litigation;
• the loss of key employees and the availability of qualified personnel;
• changes in the nature of key strategic relationships with partners and joint venturers; and
• events that are outside of our control, such as political unrest in international markets, terrorist attacks, malicious human
acts, natural disasters, pandemics and other similar events.
The broadband distribution and mobile service industries are changing rapidly and, therefore, the forward-looking statements
of expectations, plans and intent in this annual report are subject to a significant degree of risk. These forward-looking statements
and the above-described risks, uncertainties and other factors speak only as of the date of this annual report, and we expressly
disclaim any obligation or undertaking to disseminate any updates or revisions to any forward-looking statement contained herein,
to reflect any change in our expectations with regard thereto, or any other change in events, conditions or circumstances on which
any such statement is based. Readers are cautioned not to place undue reliance on any forward-looking statement.
II-3
Overview
General
We are an international provider of video, broadband internet, fixed-line telephony and mobile communications services to
residential customers and businesses in Europe. Our continuing operations currently provide residential and B2B communications
services in Switzerland, Poland and Slovakia.
As further described in note 5 to our combined financial statements, we (i) completed the sale of our operations in Austria on
July 31, 2018, (ii) reached an agreement on May 9, 2018 to sell our operations in Romania, Hungary and the Czech Republic, and
(iii) reached an agreement on December 21, 2018 to sell the operations of UPC DTH. Accordingly, our operations in Austria,
Romania, Hungary, the Czech Republic and the operations of UPC DTH are presented as discontinued operations for all periods.
In the following discussion and analysis, the operating statistics, results of operations, cash flows and financial condition that we
present and discuss are those of our continuing operations unless otherwise indicated.
Operations
At December 31, 2018, our continuing operations owned and operated networks that passed 6,415,900 homes and served
5,746,800 revenue generating units (RGUs), consisting of 2,476,200 video subscribers, 2,012,300 broadband internet subscribers
and 1,258,300 fixed-line telephony subscribers. In addition, at December 31, 2018, our continuing operations served 149,500
mobile subscribers.
Video services. We provide video services, including various enhanced products that enable our customers to control when
they watch their programming. These products range from digital video recorders to multimedia home gateway systems capable
of distributing video, voice and data content throughout the home and to multiple devices.
Broadband internet services. We offer multiple tiers of broadband internet service with available maximum download speeds
as high as 600 Mbps or more depending on location. We continue to invest in new technologies that allow us to increase the internet
speeds we offer to our customers.
Fixed-line telephony services. We offer fixed-line telephony services via either voice-over-internet-protocol or “VoIP”
technology or circuit-switched telephony, depending on location.
Mobile services. We offer voice and data mobile services through third-party MVNO networks in Switzerland and Poland.
B2B services. Our B2B services include voice, broadband internet, data, video, wireless and cloud services.
Strategy and Management Focus
We strive to achieve organic revenue and customer growth in our operations by developing and marketing bundled
entertainment and information and communications services, and extending and upgrading the quality of our networks where
appropriate. As we use the term, organic growth excludes foreign currency translation effects (FX) and the estimated impact of
acquisitions and dispositions. While we seek to increase our customer base, we also seek to maximize the average revenue we
receive from each household by increasing the penetration of our digital video, broadband internet, fixed-line telephony and mobile
services with existing customers through product bundling and upselling.
Competition and Other External Factors
We are experiencing significant competition from incumbent telecommunications operators, DTH operators and/or other
providers in all of our markets. The significant competition we are experiencing, together with macroeconomic and regulatory
factors, has adversely impacted our revenue, RGUs and/or average monthly subscription revenue per average cable RGU or mobile
subscriber, as applicable (ARPU), particularly in Switzerland. For additional information regarding the revenue impact of changes
in the RGUs and ARPU of our reportable segments, see Discussion and Analysis of our Reportable Segments below.
In addition to competition, our operations are subject to macroeconomic, political and other risks that are outside of our
control. For example, on June 23, 2016, the U.K. held a referendum in which U.K. citizens voted in favor of, on an advisory basis,
an exit from the E.U. commonly referred to as “Brexit.” Failing the implementation of an agreed extension, the U.K. will leave
the E.U. on March 29, 2019 under a so-called “hard Brexit” or “no-deal Brexit” without agreements on trade, finance and other
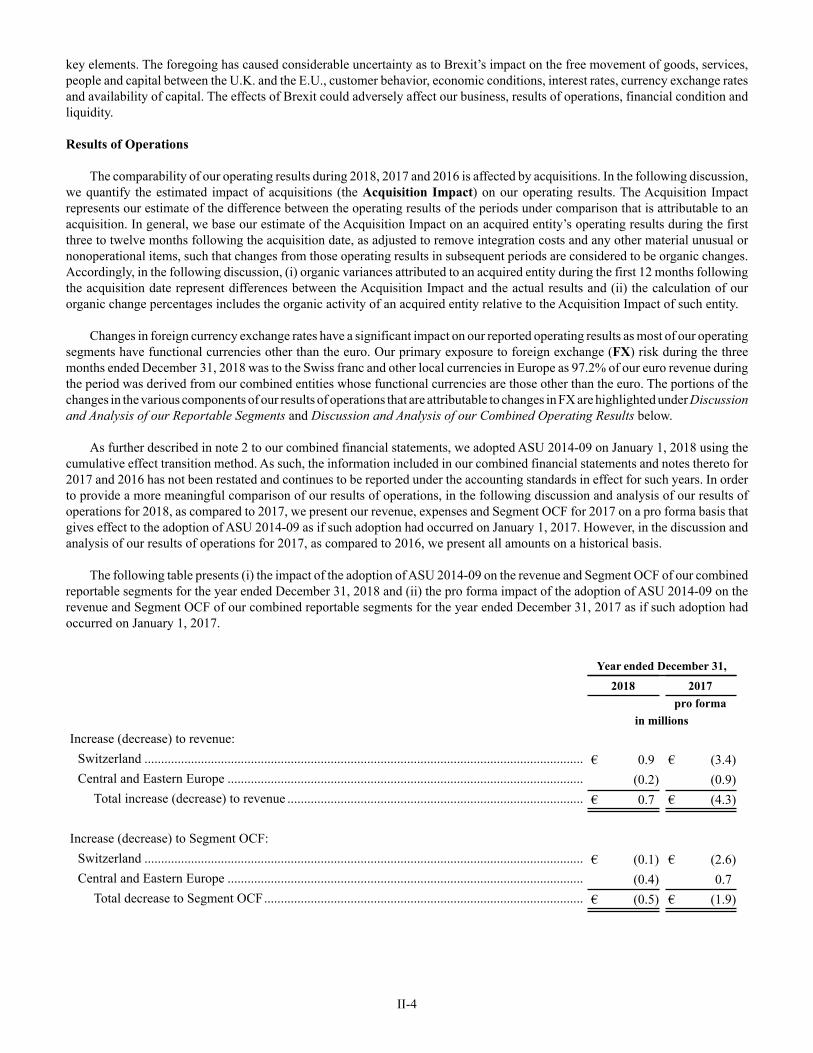
II-4
key elements. The foregoing has caused considerable uncertainty as to Brexit’s impact on the free movement of goods, services,
people and capital between the U.K. and the E.U., customer behavior, economic conditions, interest rates, currency exchange rates
and availability of capital. The effects of Brexit could adversely affect our business, results of operations, financial condition and
liquidity.
Results of Operations
The comparability of our operating results during 2018, 2017 and 2016 is affected by acquisitions. In the following discussion,
we quantify the estimated impact of acquisitions (the Acquisition Impact) on our operating results. The Acquisition Impact
represents our estimate of the difference between the operating results of the periods under comparison that is attributable to an
acquisition. In general, we base our estimate of the Acquisition Impact on an acquired entity’s operating results during the first
three to twelve months following the acquisition date, as adjusted to remove integration costs and any other material unusual or
nonoperational items, such that changes from those operating results in subsequent periods are considered to be organic changes.
Accordingly, in the following discussion, (i) organic variances attributed to an acquired entity during the first 12 months following
the acquisition date represent differences between the Acquisition Impact and the actual results and (ii) the calculation of our
organic change percentages includes the organic activity of an acquired entity relative to the Acquisition Impact of such entity.
Changes in foreign currency exchange rates have a significant impact on our reported operating results as most of our operating
segments have functional currencies other than the euro. Our primary exposure to foreign exchange (FX) risk during the three
months ended December 31, 2018 was to the Swiss franc and other local currencies in Europe as 97.2% of our euro revenue during
the period was derived from our combined entities whose functional currencies are those other than the euro. The portions of the
changes in the various components of our results of operations that are attributable to changes in FX are highlighted under Discussion
and Analysis of our Reportable Segments and Discussion and Analysis of our Combined Operating Results below.
As further described in note 2 to our combined financial statements, we adopted ASU 2014-09 on January 1, 2018 using the
cumulative effect transition method. As such, the information included in our combined financial statements and notes thereto for
2017 and 2016 has not been restated and continues to be reported under the accounting standards in effect for such years. In order
to provide a more meaningful comparison of our results of operations, in the following discussion and analysis of our results of
operations for 2018, as compared to 2017, we present our revenue, expenses and Segment OCF for 2017 on a pro forma basis that
gives effect to the adoption of ASU 2014-09 as if such adoption had occurred on January 1, 2017. However, in the discussion and
analysis of our results of operations for 2017, as compared to 2016, we present all amounts on a historical basis.
The following table presents (i) the impact of the adoption of ASU 2014-09 on the revenue and Segment OCF of our combined
reportable segments for the year ended December 31, 2018 and (ii) the pro forma impact of the adoption of ASU 2014-09 on the
revenue and Segment OCF of our combined reportable segments for the year ended December 31, 2017 as if such adoption had
occurred on January 1, 2017.
Year ended December 31,
2018 2017
pro forma
in millions
Increase (decrease) to revenue:
Switzerland .................................................................................................................................... € 0.9 € (3.4)
Central and Eastern Europe ........................................................................................................... (0.2) (0.9)
Total increase (decrease) to revenue ......................................................................................... € 0.7 € (4.3)
Increase (decrease) to Segment OCF:
Switzerland .................................................................................................................................... € (0.1) € (2.6)
Central and Eastern Europe ........................................................................................................... (0.4) 0.7
Total decrease to Segment OCF................................................................................................ € (0.5) € (1.9)
II-5
Discussion and Analysis of our Reportable Segments
General
Our reportable segments derive their revenue primarily from residential and B2B communications services, including video,
broadband internet, fixed-line telephony and mobile services. For detailed information regarding the composition of our reportable
segments and how we define and categorize our revenue components, see note 16 to our combined financial statements.
The tables presented below in this section provide the details of the revenue and Segment OCF of our combined reportable
segments for (i) 2018, as compared to 2017, and (ii) 2017, as compared to 2016. As discussed above, in our comparison of 2018
to 2017, amounts for 2017 are presented on a pro forma basis that gives effect to the adoption of ASU 2014-09 as if such adoption
had occurred on January 1, 2017. In our comparison of 2017 to 2016, all amounts are presented on a historical basis. These tables
present (a) the amounts reported for the current and comparative periods, (b) the reported euro and percentage change from period
to period and (c) the organic percentage change from period to period. The comparisons that exclude FX assume that exchange
rates remained constant at the prior-year rate during the comparative periods that are included in each table. We also provide a
table showing the Segment OCF margins of our combined reportable segments for 2018, 2017 and 2016 at the end of this section.
All of our revenue is derived from jurisdictions that administer VAT or similar revenue-based taxes. Any increases in these
taxes could have an adverse impact on our ability to maintain or increase our revenue to the extent that we are unable to pass such
tax increases on to our customers. In the case of revenue-based taxes for which we are the ultimate taxpayer, we will also experience
increases in our operating costs and expenses and corresponding declines in our Segment OCF and Segment OCF margins to the
extent of any such tax increases.
We pay interconnection fees to other telephony providers when calls or text messages from our subscribers terminate on
another network, and we receive similar fees from such providers when calls or text messages from their customers terminate on
our networks or networks that we access through MVNO or other arrangements. The amounts we charge and incur with respect
to fixed-line telephony and mobile interconnection fees are subject to regulatory oversight. To the extent that regulatory authorities
introduce fixed-line or mobile termination rate changes, we would experience prospective changes and, in very limited cases, we
could experience retroactive changes in our interconnect revenue and/or costs. The ultimate impact of any such changes in
termination rates on our Segment OCF would be dependent on the call or text messaging patterns that are subject to the changed
termination rates.
We are subject to inflationary pressures with respect to certain costs and foreign currency exchange risk with respect to costs
and expenses that are denominated in currencies other than the respective functional currencies of our combined reportable segments
(non-functional currency expenses). Any cost increases that we are not able to pass on to our subscribers through rate increases
would result in increased pressure on our operating margins.
Revenue of our Reportable Segments
General. While not specifically discussed in the below explanations of the changes in the revenue of our reportable segments,
we are experiencing significant competition in all of our markets. This competition has an adverse impact on our ability to increase
or maintain our RGUs and/or ARPU.
Variances in the subscription revenue that we receive from our customers are a function of (i) changes in the number of RGUs
or mobile subscribers outstanding during the period and (ii) changes in ARPU. Changes in ARPU can be attributable to (a) changes
in prices, (b) changes in bundling or promotional discounts, (c) changes in the tier of services selected, (d) variances in subscriber
usage patterns and (e) the overall mix of cable and mobile products during the period. In the following discussion, we discuss
ARPU changes in terms of the net impact of the above factors on the ARPU that is derived from our video, broadband internet,
fixed-line telephony and mobile products.
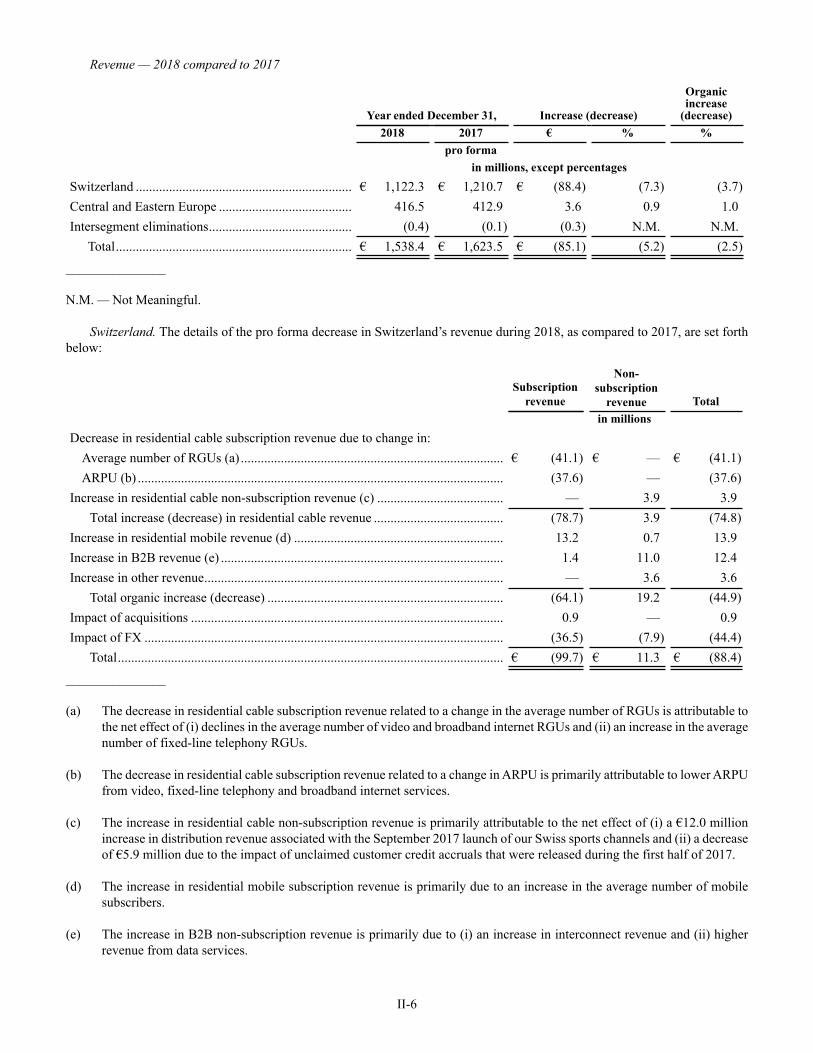
II-6
Revenue — 2018 compared to 2017
Year ended December 31, Increase (decrease)
Organicincrease
(decrease)
2018 2017 € % %
pro forma
in millions, except percentages
Switzerland ................................................................. € 1,122.3 € 1,210.7 € (88.4) (7.3) (3.7)
Central and Eastern Europe ........................................ 416.5 412.9 3.6 0.9 1.0
Intersegment eliminations........................................... (0.4) (0.1) (0.3) N.M. N.M.
Total....................................................................... € 1,538.4 € 1,623.5 € (85.1) (5.2) (2.5)
_______________
N.M. — Not Meaningful.
Switzerland. The details of the pro forma decrease in Switzerland’s revenue during 2018, as compared to 2017, are set forth
below:
Subscription
revenue
Non-
subscription
revenue Total
in millions
Decrease in residential cable subscription revenue due to change in:
Average number of RGUs (a) ............................................................................... € (41.1) € — € (41.1)
ARPU (b) .............................................................................................................. (37.6) — (37.6)
Increase in residential cable non-subscription revenue (c) ...................................... — 3.9 3.9
Total increase (decrease) in residential cable revenue ....................................... (78.7) 3.9 (74.8)
Increase in residential mobile revenue (d) ............................................................... 13.2 0.7 13.9
Increase in B2B revenue (e) ..................................................................................... 1.4 11.0 12.4
Increase in other revenue.......................................................................................... — 3.6 3.6
Total organic increase (decrease) ....................................................................... (64.1) 19.2 (44.9)
Impact of acquisitions .............................................................................................. 0.9 — 0.9
Impact of FX ............................................................................................................ (36.5) (7.9) (44.4)
Total.................................................................................................................... € (99.7) € 11.3 € (88.4)
_______________
(a) The decrease in residential cable subscription revenue related to a change in the average number of RGUs is attributable to
the net effect of (i) declines in the average number of video and broadband internet RGUs and (ii) an increase in the average
number of fixed-line telephony RGUs.
(b) The decrease in residential cable subscription revenue related to a change in ARPU is primarily attributable to lower ARPU
from video, fixed-line telephony and broadband internet services.
(c) The increase in residential cable non-subscription revenue is primarily attributable to the net effect of (i) a €12.0 million
increase in distribution revenue associated with the September 2017 launch of our Swiss sports channels and (ii) a decrease
of €5.9 million due to the impact of unclaimed customer credit accruals that were released during the first half of 2017.
(d) The increase in residential mobile subscription revenue is primarily due to an increase in the average number of mobile
subscribers.
(e) The increase in B2B non-subscription revenue is primarily due to (i) an increase in interconnect revenue and (ii) higher
revenue from data services.
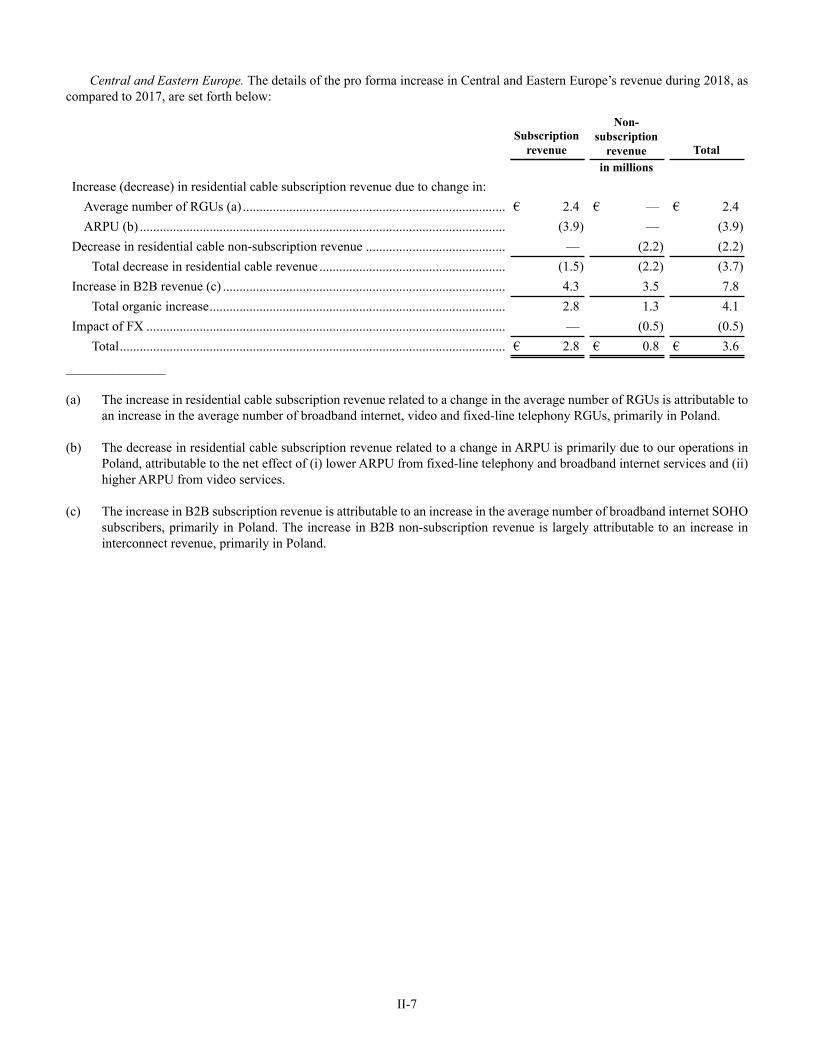
II-7
Central and Eastern Europe. The details of the pro forma increase in Central and Eastern Europe’s revenue during 2018, as
compared to 2017, are set forth below:
Subscription
revenue
Non-
subscription
revenue Total
in millions
Increase (decrease) in residential cable subscription revenue due to change in:
Average number of RGUs (a) ............................................................................... € 2.4 € — € 2.4
ARPU (b) .............................................................................................................. (3.9) — (3.9)
Decrease in residential cable non-subscription revenue .......................................... — (2.2) (2.2)
Total decrease in residential cable revenue ........................................................ (1.5) (2.2) (3.7)
Increase in B2B revenue (c) ..................................................................................... 4.3 3.5 7.8
Total organic increase......................................................................................... 2.8 1.3 4.1
Impact of FX ............................................................................................................ — (0.5) (0.5)
Total.................................................................................................................... € 2.8 € 0.8 € 3.6
_______________
(a) The increase in residential cable subscription revenue related to a change in the average number of RGUs is attributable to
an increase in the average number of broadband internet, video and fixed-line telephony RGUs, primarily in Poland.
(b) The decrease in residential cable subscription revenue related to a change in ARPU is primarily due to our operations in
Poland, attributable to the net effect of (i) lower ARPU from fixed-line telephony and broadband internet services and (ii)
higher ARPU from video services.
(c) The increase in B2B subscription revenue is attributable to an increase in the average number of broadband internet SOHO
subscribers, primarily in Poland. The increase in B2B non-subscription revenue is largely attributable to an increase in
interconnect revenue, primarily in Poland.
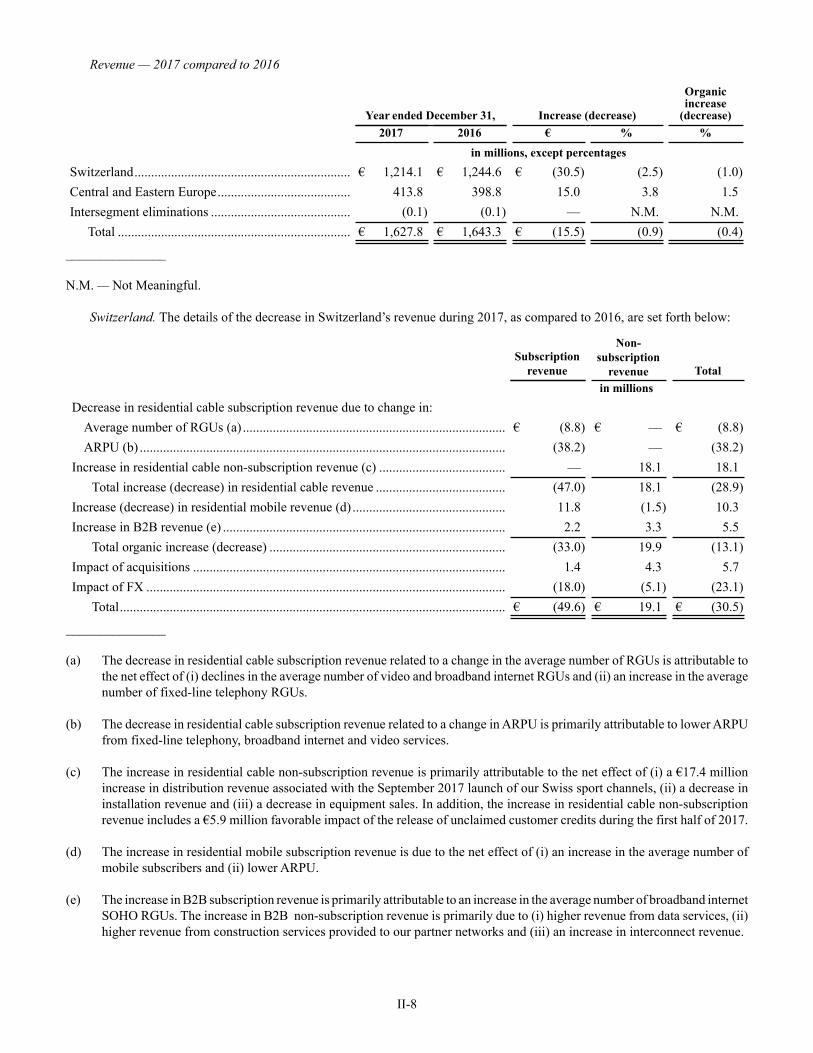
II-8
Revenue — 2017 compared to 2016
Year ended December 31, Increase (decrease)
Organicincrease
(decrease)
2017 2016 € % %
in millions, except percentages
Switzerland................................................................. € 1,214.1 € 1,244.6 € (30.5) (2.5) (1.0)
Central and Eastern Europe........................................ 413.8 398.8 15.0 3.8 1.5
Intersegment eliminations .......................................... (0.1) (0.1) — N.M. N.M.
Total ...................................................................... € 1,627.8 € 1,643.3 € (15.5) (0.9) (0.4)
_______________
N.M. — Not Meaningful.
Switzerland. The details of the decrease in Switzerland’s revenue during 2017, as compared to 2016, are set forth below:
Subscription
revenue
Non-
subscription
revenue Total
in millions
Decrease in residential cable subscription revenue due to change in:
Average number of RGUs (a) ............................................................................... € (8.8) € — € (8.8)
ARPU (b) .............................................................................................................. (38.2) — (38.2)
Increase in residential cable non-subscription revenue (c) ...................................... — 18.1 18.1
Total increase (decrease) in residential cable revenue ....................................... (47.0) 18.1 (28.9)
Increase (decrease) in residential mobile revenue (d) .............................................. 11.8 (1.5) 10.3
Increase in B2B revenue (e) ..................................................................................... 2.2 3.3 5.5
Total organic increase (decrease) ....................................................................... (33.0) 19.9 (13.1)
Impact of acquisitions .............................................................................................. 1.4 4.3 5.7
Impact of FX ............................................................................................................ (18.0) (5.1) (23.1)
Total.................................................................................................................... € (49.6) € 19.1 € (30.5)
_______________
(a) The decrease in residential cable subscription revenue related to a change in the average number of RGUs is attributable to
the net effect of (i) declines in the average number of video and broadband internet RGUs and (ii) an increase in the average
number of fixed-line telephony RGUs.
(b) The decrease in residential cable subscription revenue related to a change in ARPU is primarily attributable to lower ARPU
from fixed-line telephony, broadband internet and video services.
(c) The increase in residential cable non-subscription revenue is primarily attributable to the net effect of (i) a €17.4 million
increase in distribution revenue associated with the September 2017 launch of our Swiss sport channels, (ii) a decrease in
installation revenue and (iii) a decrease in equipment sales. In addition, the increase in residential cable non-subscription
revenue includes a €5.9 million favorable impact of the release of unclaimed customer credits during the first half of 2017.
(d) The increase in residential mobile subscription revenue is due to the net effect of (i) an increase in the average number of
mobile subscribers and (ii) lower ARPU.
(e) The increase in B2B subscription revenue is primarily attributable to an increase in the average number of broadband internet
SOHO RGUs. The increase in B2B non-subscription revenue is primarily due to (i) higher revenue from data services, (ii)
higher revenue from construction services provided to our partner networks and (iii) an increase in interconnect revenue.
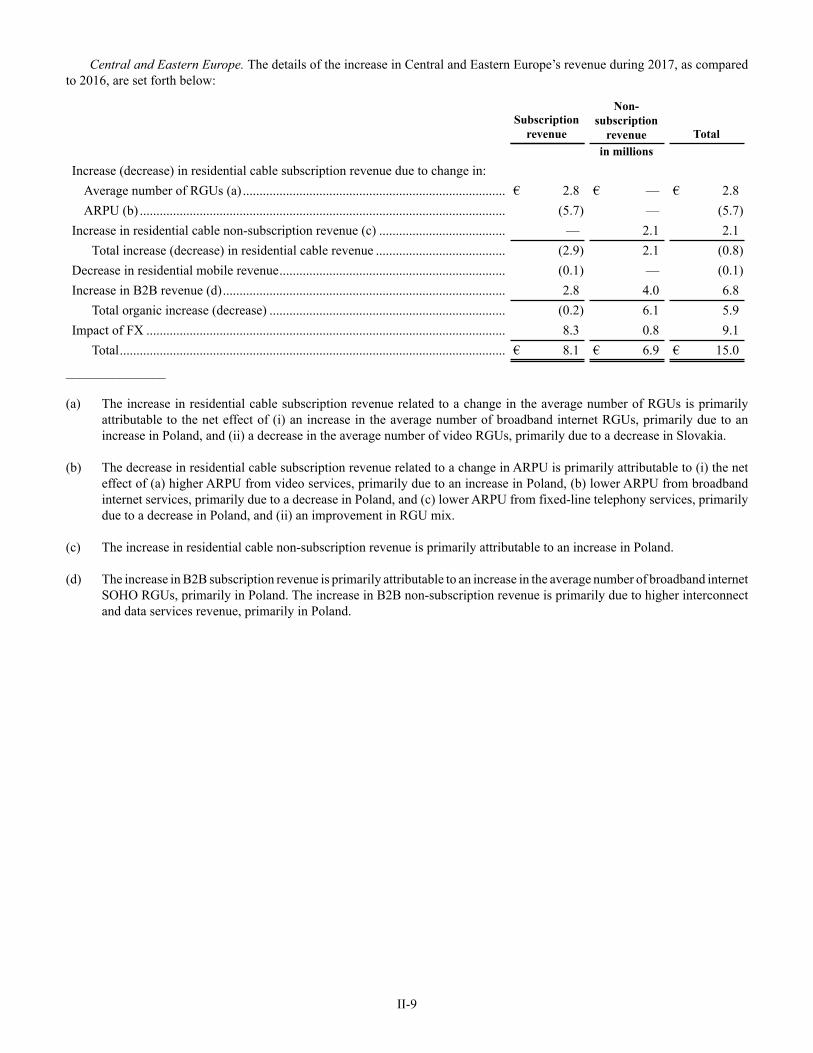
II-9
Central and Eastern Europe. The details of the increase in Central and Eastern Europe’s revenue during 2017, as compared
to 2016, are set forth below:
Subscription
revenue
Non-
subscription
revenue Total
in millions
Increase (decrease) in residential cable subscription revenue due to change in:
Average number of RGUs (a) ............................................................................... € 2.8 € — € 2.8
ARPU (b) .............................................................................................................. (5.7) — (5.7)
Increase in residential cable non-subscription revenue (c) ...................................... — 2.1 2.1
Total increase (decrease) in residential cable revenue ....................................... (2.9) 2.1 (0.8)
Decrease in residential mobile revenue.................................................................... (0.1) — (0.1)
Increase in B2B revenue (d)..................................................................................... 2.8 4.0 6.8
Total organic increase (decrease) ....................................................................... (0.2) 6.1 5.9
Impact of FX ............................................................................................................ 8.3 0.8 9.1
Total.................................................................................................................... € 8.1 € 6.9 € 15.0
_______________
(a) The increase in residential cable subscription revenue related to a change in the average number of RGUs is primarily
attributable to the net effect of (i) an increase in the average number of broadband internet RGUs, primarily due to an
increase in Poland, and (ii) a decrease in the average number of video RGUs, primarily due to a decrease in Slovakia.
(b) The decrease in residential cable subscription revenue related to a change in ARPU is primarily attributable to (i) the net
effect of (a) higher ARPU from video services, primarily due to an increase in Poland, (b) lower ARPU from broadband
internet services, primarily due to a decrease in Poland, and (c) lower ARPU from fixed-line telephony services, primarily
due to a decrease in Poland, and (ii) an improvement in RGU mix.
(c) The increase in residential cable non-subscription revenue is primarily attributable to an increase in Poland.
(d) The increase in B2B subscription revenue is primarily attributable to an increase in the average number of broadband internet
SOHO RGUs, primarily in Poland. The increase in B2B non-subscription revenue is primarily due to higher interconnect
and data services revenue, primarily in Poland.
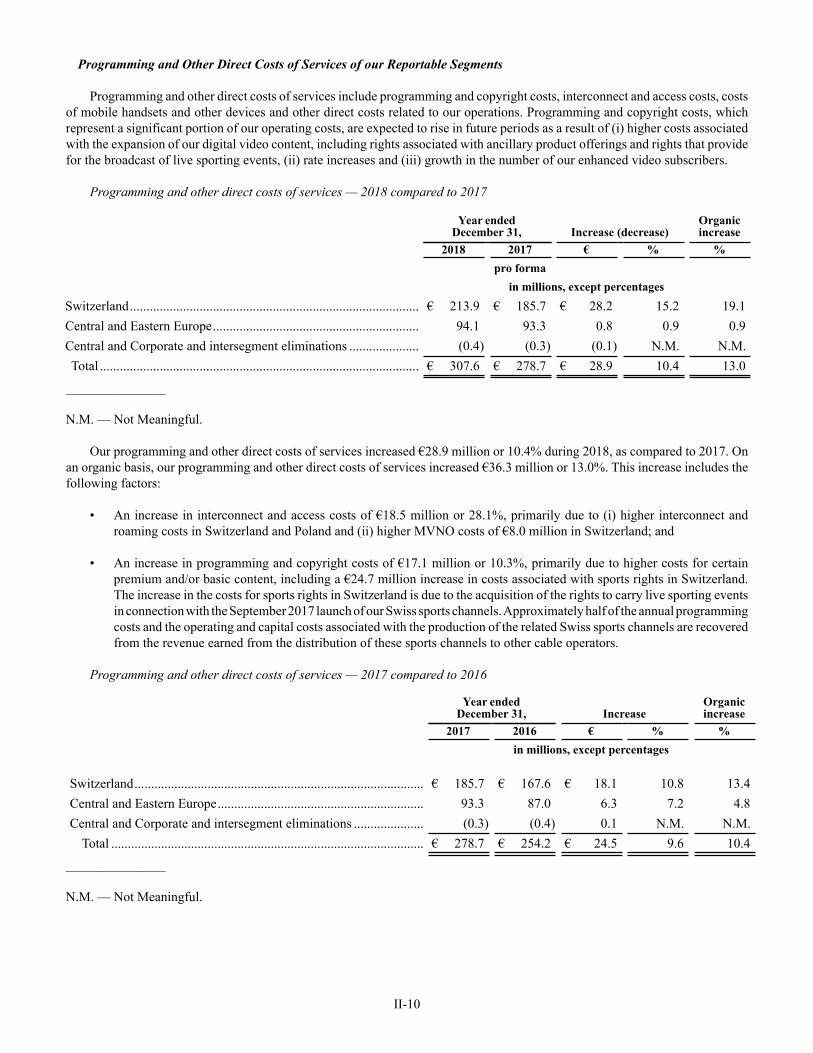
II-10
Programming and Other Direct Costs of Services of our Reportable Segments
Programming and other direct costs of services include programming and copyright costs, interconnect and access costs, costs
of mobile handsets and other devices and other direct costs related to our operations. Programming and copyright costs, which
represent a significant portion of our operating costs, are expected to rise in future periods as a result of (i) higher costs associated
with the expansion of our digital video content, including rights associated with ancillary product offerings and rights that provide
for the broadcast of live sporting events, (ii) rate increases and (iii) growth in the number of our enhanced video subscribers.
Programming and other direct costs of services — 2018 compared to 2017
Year endedDecember 31, Increase (decrease)
Organicincrease
2018 2017 € % %
pro forma
in millions, except percentages
Switzerland....................................................................................... € 213.9 € 185.7 € 28.2 15.2 19.1
Central and Eastern Europe.............................................................. 94.1 93.3 0.8 0.9 0.9
Central and Corporate and intersegment eliminations ..................... (0.4) (0.3) (0.1) N.M. N.M.
Total ................................................................................................ € 307.6 € 278.7 € 28.9 10.4 13.0
_______________
N.M. — Not Meaningful.
Our programming and other direct costs of services increased €28.9 million or 10.4% during 2018, as compared to 2017. On
an organic basis, our programming and other direct costs of services increased €36.3 million or 13.0%. This increase includes the
following factors:
• An increase in interconnect and access costs of €18.5 million or 28.1%, primarily due to (i) higher interconnect and
roaming costs in Switzerland and Poland and (ii) higher MVNO costs of €8.0 million in Switzerland; and
• An increase in programming and copyright costs of €17.1 million or 10.3%, primarily due to higher costs for certain
premium and/or basic content, including a €24.7 million increase in costs associated with sports rights in Switzerland.
The increase in the costs for sports rights in Switzerland is due to the acquisition of the rights to carry live sporting events
in connection with the September 2017 launch of our Swiss sports channels. Approximately half of the annual programming
costs and the operating and capital costs associated with the production of the related Swiss sports channels are recovered
from the revenue earned from the distribution of these sports channels to other cable operators.
Programming and other direct costs of services — 2017 compared to 2016
Year endedDecember 31, Increase
Organicincrease
2017 2016 € % %
in millions, except percentages
Switzerland....................................................................................... € 185.7 € 167.6 € 18.1 10.8 13.4
Central and Eastern Europe.............................................................. 93.3 87.0 6.3 7.2 4.8
Central and Corporate and intersegment eliminations ..................... (0.3) (0.4) 0.1 N.M. N.M.
Total .............................................................................................. € 278.7 € 254.2 € 24.5 9.6 10.4
_______________
N.M. — Not Meaningful.
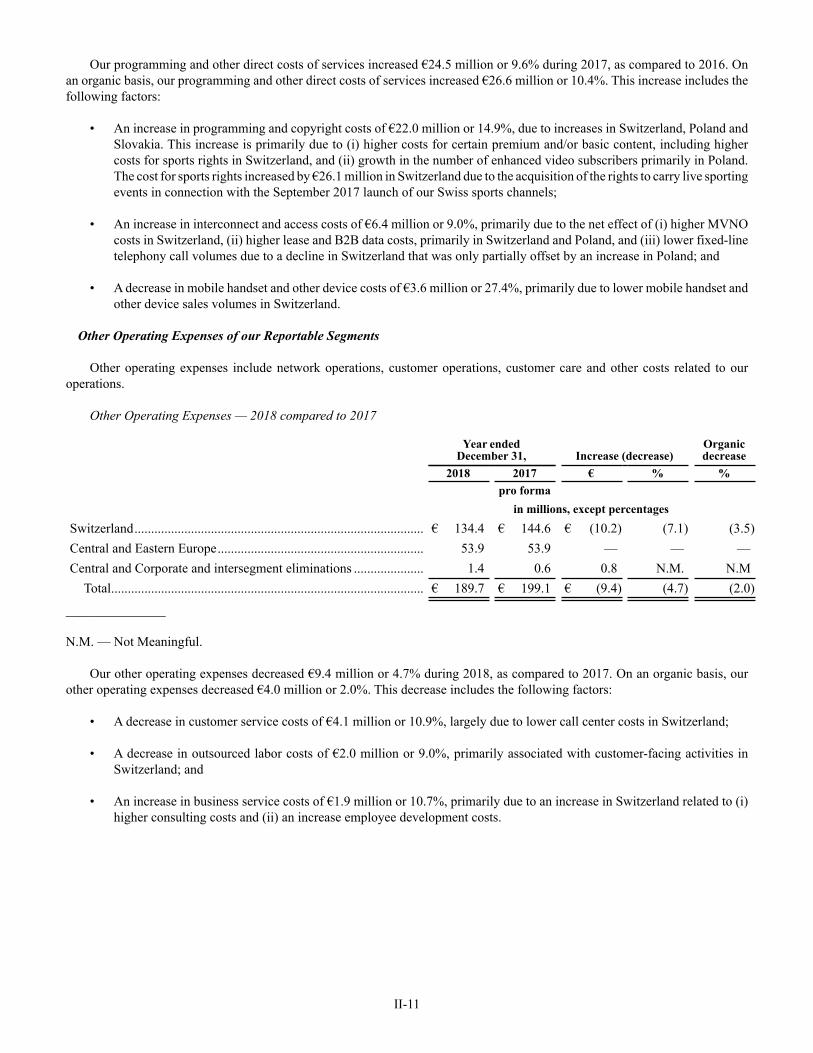
II-11
Our programming and other direct costs of services increased €24.5 million or 9.6% during 2017, as compared to 2016. On
an organic basis, our programming and other direct costs of services increased €26.6 million or 10.4%. This increase includes the
following factors:
• An increase in programming and copyright costs of €22.0 million or 14.9%, due to increases in Switzerland, Poland and
Slovakia. This increase is primarily due to (i) higher costs for certain premium and/or basic content, including higher
costs for sports rights in Switzerland, and (ii) growth in the number of enhanced video subscribers primarily in Poland.
The cost for sports rights increased by €26.1 million in Switzerland due to the acquisition of the rights to carry live sporting
events in connection with the September 2017 launch of our Swiss sports channels;
• An increase in interconnect and access costs of €6.4 million or 9.0%, primarily due to the net effect of (i) higher MVNO
costs in Switzerland, (ii) higher lease and B2B data costs, primarily in Switzerland and Poland, and (iii) lower fixed-line
telephony call volumes due to a decline in Switzerland that was only partially offset by an increase in Poland; and
• A decrease in mobile handset and other device costs of €3.6 million or 27.4%, primarily due to lower mobile handset and
other device sales volumes in Switzerland.
Other Operating Expenses of our Reportable Segments
Other operating expenses include network operations, customer operations, customer care and other costs related to our
operations.
Other Operating Expenses — 2018 compared to 2017
Year ended
December 31, Increase (decrease)Organicdecrease
2018 2017 € % %
pro forma
in millions, except percentages
Switzerland....................................................................................... € 134.4 € 144.6 € (10.2) (7.1) (3.5)
Central and Eastern Europe.............................................................. 53.9 53.9 — — —
Central and Corporate and intersegment eliminations ..................... 1.4 0.6 0.8 N.M. N.M
Total.............................................................................................. € 189.7 € 199.1 € (9.4) (4.7) (2.0)
_______________
N.M. — Not Meaningful.
Our other operating expenses decreased €9.4 million or 4.7% during 2018, as compared to 2017. On an organic basis, our
other operating expenses decreased €4.0 million or 2.0%. This decrease includes the following factors:
• A decrease in customer service costs of €4.1 million or 10.9%, largely due to lower call center costs in Switzerland;
• A decrease in outsourced labor costs of €2.0 million or 9.0%, primarily associated with customer-facing activities in
Switzerland; and
• An increase in business service costs of €1.9 million or 10.7%, primarily due to an increase in Switzerland related to (i)
higher consulting costs and (ii) an increase employee development costs.
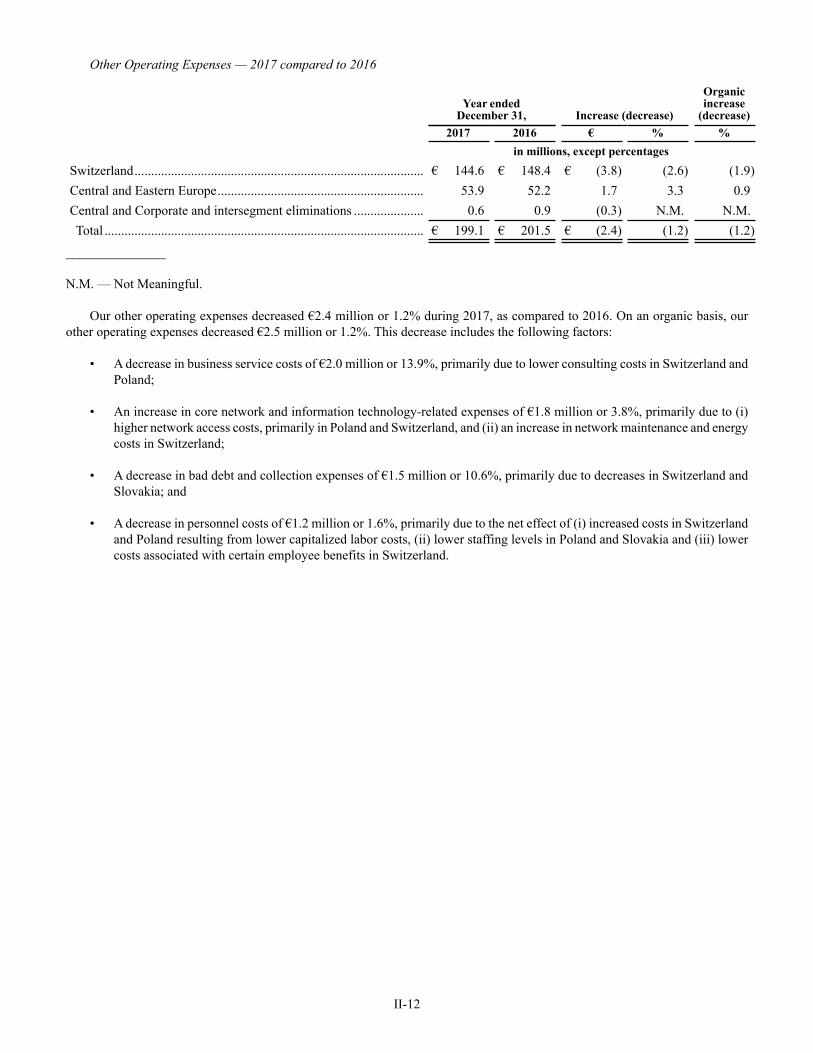
II-12
Other Operating Expenses — 2017 compared to 2016
Year ended
December 31, Increase (decrease)
Organicincrease
(decrease)
2017 2016 € % %
in millions, except percentages
Switzerland....................................................................................... € 144.6 € 148.4 € (3.8) (2.6) (1.9)
Central and Eastern Europe.............................................................. 53.9 52.2 1.7 3.3 0.9
Central and Corporate and intersegment eliminations ..................... 0.6 0.9 (0.3) N.M. N.M.
Total ................................................................................................ € 199.1 € 201.5 € (2.4) (1.2) (1.2)
_______________
N.M. — Not Meaningful.
Our other operating expenses decreased €2.4 million or 1.2% during 2017, as compared to 2016. On an organic basis, our
other operating expenses decreased €2.5 million or 1.2%. This decrease includes the following factors:
• A decrease in business service costs of €2.0 million or 13.9%, primarily due to lower consulting costs in Switzerland and
Poland;
• An increase in core network and information technology-related expenses of €1.8 million or 3.8%, primarily due to (i)
higher network access costs, primarily in Poland and Switzerland, and (ii) an increase in network maintenance and energy
costs in Switzerland;
• A decrease in bad debt and collection expenses of €1.5 million or 10.6%, primarily due to decreases in Switzerland and
Slovakia; and
• A decrease in personnel costs of €1.2 million or 1.6%, primarily due to the net effect of (i) increased costs in Switzerland
and Poland resulting from lower capitalized labor costs, (ii) lower staffing levels in Poland and Slovakia and (iii) lower
costs associated with certain employee benefits in Switzerland.
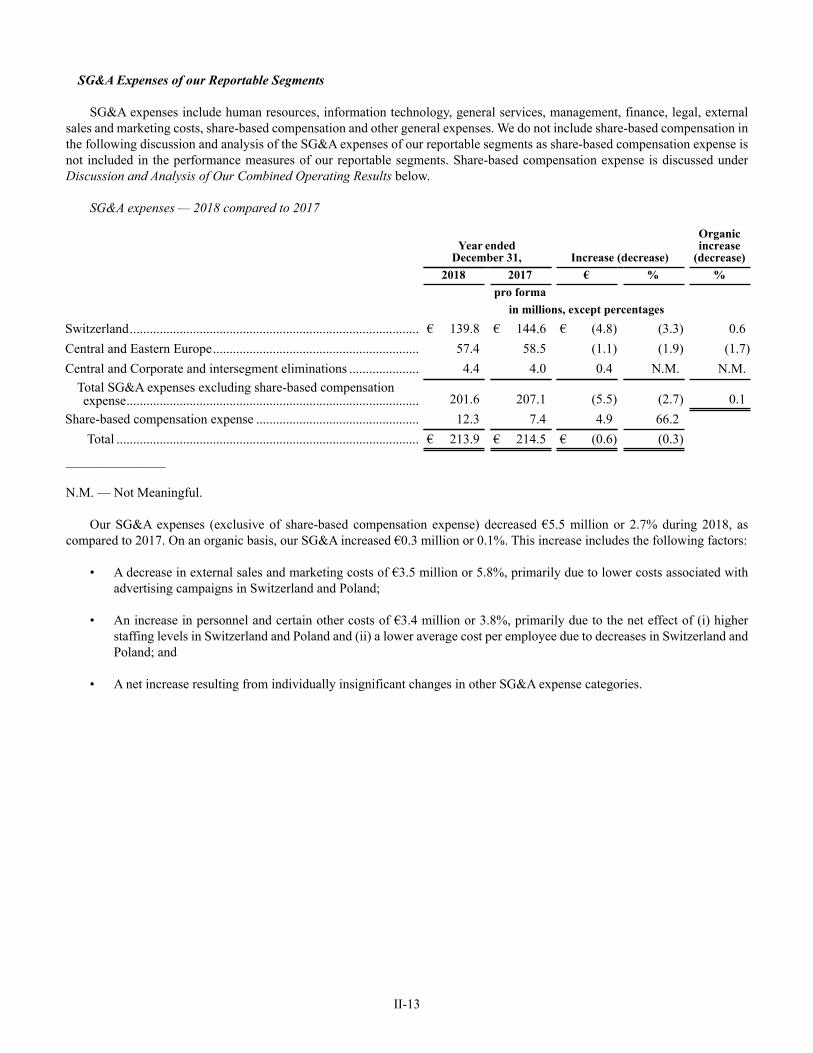
II-13
SG&A Expenses of our Reportable Segments
SG&A expenses include human resources, information technology, general services, management, finance, legal, external
sales and marketing costs, share-based compensation and other general expenses. We do not include share-based compensation in
the following discussion and analysis of the SG&A expenses of our reportable segments as share-based compensation expense is
not included in the performance measures of our reportable segments. Share-based compensation expense is discussed under
Discussion and Analysis of Our Combined Operating Results below.
SG&A expenses — 2018 compared to 2017
Year endedDecember 31, Increase (decrease)
Organicincrease
(decrease)
2018 2017 € % %
pro forma
in millions, except percentages
Switzerland....................................................................................... € 139.8 € 144.6 € (4.8) (3.3) 0.6
Central and Eastern Europe.............................................................. 57.4 58.5 (1.1) (1.9) (1.7)
Central and Corporate and intersegment eliminations ..................... 4.4 4.0 0.4 N.M. N.M.
Total SG&A expenses excluding share-based compensationexpense........................................................................................ 201.6 207.1 (5.5) (2.7) 0.1
Share-based compensation expense ................................................. 12.3 7.4 4.9 66.2
Total ........................................................................................... € 213.9 € 214.5 € (0.6) (0.3)
_______________
N.M. — Not Meaningful.
Our SG&A expenses (exclusive of share-based compensation expense) decreased €5.5 million or 2.7% during 2018, as
compared to 2017. On an organic basis, our SG&A increased €0.3 million or 0.1%. This increase includes the following factors:
• A decrease in external sales and marketing costs of €3.5 million or 5.8%, primarily due to lower costs associated with
advertising campaigns in Switzerland and Poland;
• An increase in personnel and certain other costs of €3.4 million or 3.8%, primarily due to the net effect of (i) higher
staffing levels in Switzerland and Poland and (ii) a lower average cost per employee due to decreases in Switzerland and
Poland; and
• A net increase resulting from individually insignificant changes in other SG&A expense categories.
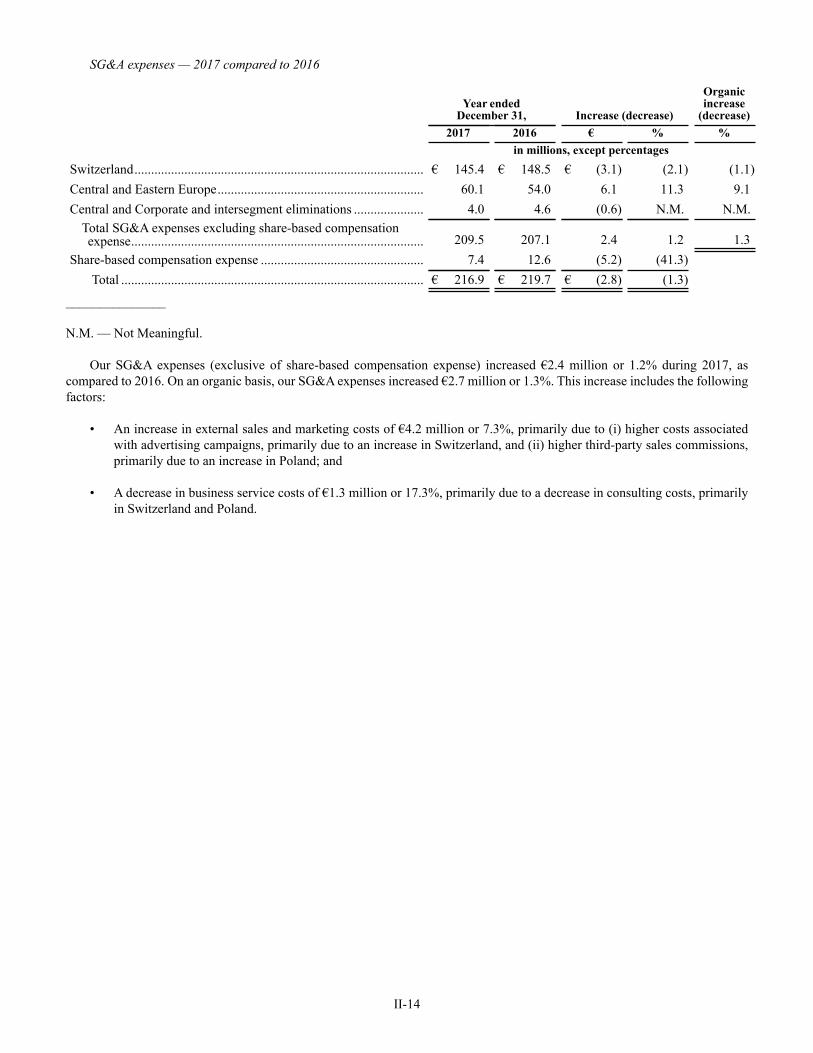
II-14
SG&A expenses — 2017 compared to 2016
Year endedDecember 31, Increase (decrease)
Organicincrease
(decrease)
2017 2016 € % %
in millions, except percentages
Switzerland....................................................................................... € 145.4 € 148.5 € (3.1) (2.1) (1.1)
Central and Eastern Europe.............................................................. 60.1 54.0 6.1 11.3 9.1
Central and Corporate and intersegment eliminations ..................... 4.0 4.6 (0.6) N.M. N.M.
Total SG&A expenses excluding share-based compensationexpense........................................................................................ 209.5 207.1 2.4 1.2 1.3
Share-based compensation expense ................................................. 7.4 12.6 (5.2) (41.3)
Total ........................................................................................... € 216.9 € 219.7 € (2.8) (1.3)
_______________
N.M. — Not Meaningful.
Our SG&A expenses (exclusive of share-based compensation expense) increased €2.4 million or 1.2% during 2017, as
compared to 2016. On an organic basis, our SG&A expenses increased €2.7 million or 1.3%. This increase includes the following
factors:
• An increase in external sales and marketing costs of €4.2 million or 7.3%, primarily due to (i) higher costs associated
with advertising campaigns, primarily due to an increase in Switzerland, and (ii) higher third-party sales commissions,
primarily due to an increase in Poland; and
• A decrease in business service costs of €1.3 million or 17.3%, primarily due to a decrease in consulting costs, primarily
in Switzerland and Poland.
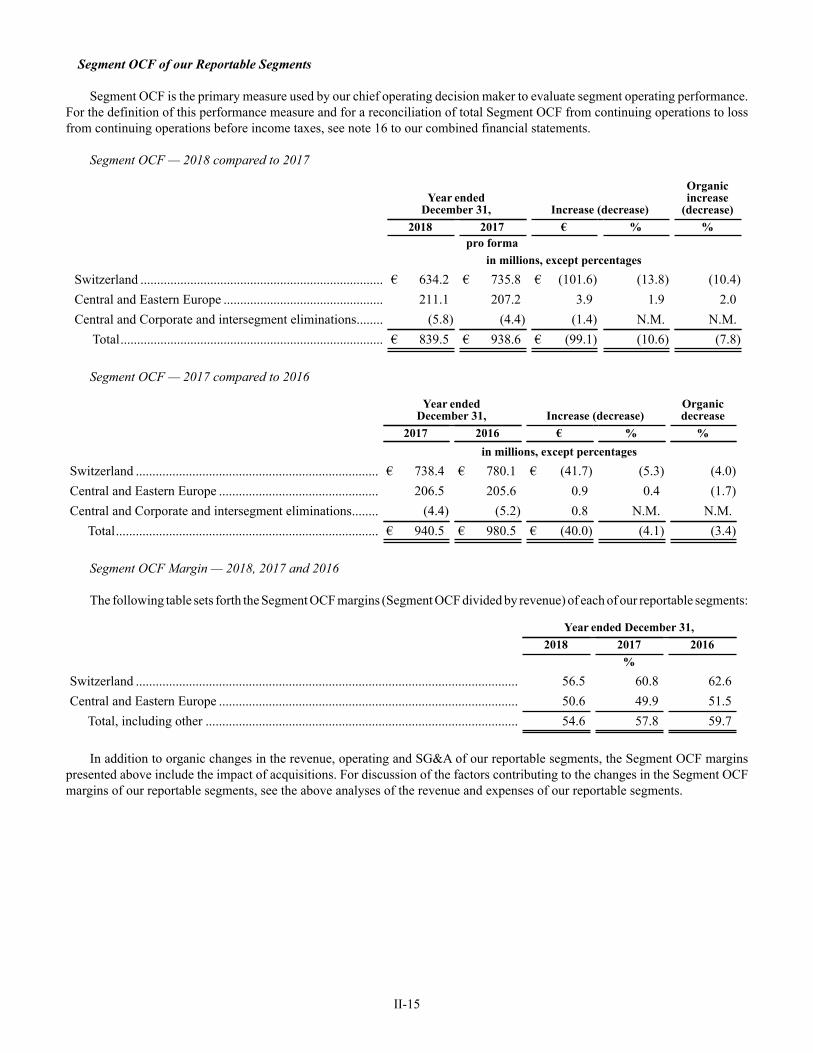
II-15
Segment OCF of our Reportable Segments
Segment OCF is the primary measure used by our chief operating decision maker to evaluate segment operating performance.
For the definition of this performance measure and for a reconciliation of total Segment OCF from continuing operations to loss
from continuing operations before income taxes, see note 16 to our combined financial statements.
Segment OCF — 2018 compared to 2017
Year ended
December 31, Increase (decrease)
Organicincrease
(decrease)
2018 2017 € % %
pro forma
in millions, except percentages
Switzerland ......................................................................... € 634.2 € 735.8 € (101.6) (13.8) (10.4)
Central and Eastern Europe ................................................ 211.1 207.2 3.9 1.9 2.0
Central and Corporate and intersegment eliminations........ (5.8) (4.4) (1.4) N.M. N.M.
Total............................................................................... € 839.5 € 938.6 € (99.1) (10.6) (7.8)
Segment OCF — 2017 compared to 2016
Year ended
December 31, Increase (decrease)Organicdecrease
2017 2016 € % %
in millions, except percentages
Switzerland ......................................................................... € 738.4 € 780.1 € (41.7) (5.3) (4.0)
Central and Eastern Europe ................................................ 206.5 205.6 0.9 0.4 (1.7)
Central and Corporate and intersegment eliminations........ (4.4) (5.2) 0.8 N.M. N.M.
Total............................................................................... € 940.5 € 980.5 € (40.0) (4.1) (3.4)
Segment OCF Margin — 2018, 2017 and 2016
The following table sets forth the Segment OCF margins (Segment OCF divided by revenue) of each of our reportable segments:
Year ended December 31,
2018 2017 2016
%
Switzerland ................................................................................................................... 56.5 60.8 62.6
Central and Eastern Europe .......................................................................................... 50.6 49.9 51.5
Total, including other .............................................................................................. 54.6 57.8 59.7
In addition to organic changes in the revenue, operating and SG&A of our reportable segments, the Segment OCF margins
presented above include the impact of acquisitions. For discussion of the factors contributing to the changes in the Segment OCF
margins of our reportable segments, see the above analyses of the revenue and expenses of our reportable segments.
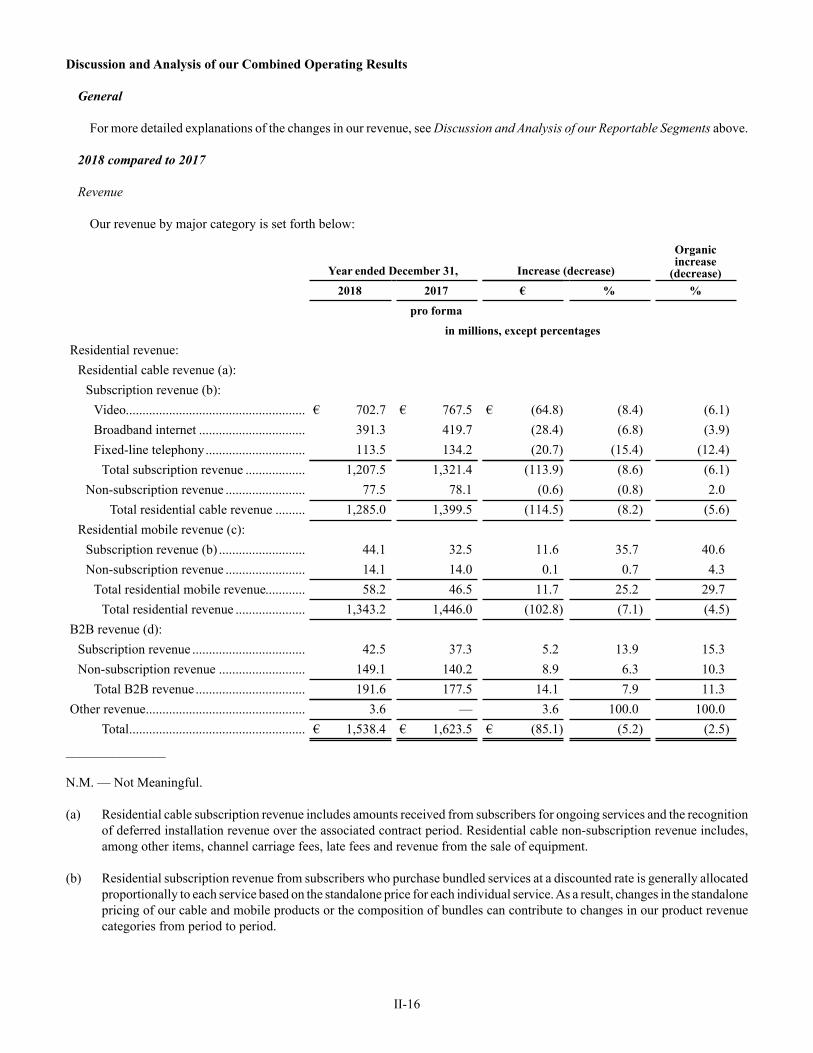
II-16
Discussion and Analysis of our Combined Operating Results
General
For more detailed explanations of the changes in our revenue, see Discussion and Analysis of our Reportable Segments above.
2018 compared to 2017
Revenue
Our revenue by major category is set forth below:
Year ended December 31, Increase (decrease)
Organicincrease
(decrease)
2018 2017 € % %
pro forma
in millions, except percentages
Residential revenue:
Residential cable revenue (a):
Subscription revenue (b):
Video...................................................... € 702.7 € 767.5 € (64.8) (8.4) (6.1)
Broadband internet ................................ 391.3 419.7 (28.4) (6.8) (3.9)
Fixed-line telephony.............................. 113.5 134.2 (20.7) (15.4) (12.4)
Total subscription revenue .................. 1,207.5 1,321.4 (113.9) (8.6) (6.1)
Non-subscription revenue ........................ 77.5 78.1 (0.6) (0.8) 2.0
Total residential cable revenue ......... 1,285.0 1,399.5 (114.5) (8.2) (5.6)
Residential mobile revenue (c):
Subscription revenue (b) .......................... 44.1 32.5 11.6 35.7 40.6
Non-subscription revenue ........................ 14.1 14.0 0.1 0.7 4.3
Total residential mobile revenue............ 58.2 46.5 11.7 25.2 29.7
Total residential revenue ..................... 1,343.2 1,446.0 (102.8) (7.1) (4.5)
B2B revenue (d):
Subscription revenue .................................. 42.5 37.3 5.2 13.9 15.3
Non-subscription revenue .......................... 149.1 140.2 8.9 6.3 10.3
Total B2B revenue ................................. 191.6 177.5 14.1 7.9 11.3
Other revenue................................................ 3.6 — 3.6 100.0 100.0
Total..................................................... € 1,538.4 € 1,623.5 € (85.1) (5.2) (2.5)
_______________
N.M. — Not Meaningful.
(a) Residential cable subscription revenue includes amounts received from subscribers for ongoing services and the recognition
of deferred installation revenue over the associated contract period. Residential cable non-subscription revenue includes,
among other items, channel carriage fees, late fees and revenue from the sale of equipment.
(b) Residential subscription revenue from subscribers who purchase bundled services at a discounted rate is generally allocated
proportionally to each service based on the standalone price for each individual service. As a result, changes in the standalone
pricing of our cable and mobile products or the composition of bundles can contribute to changes in our product revenue
categories from period to period.
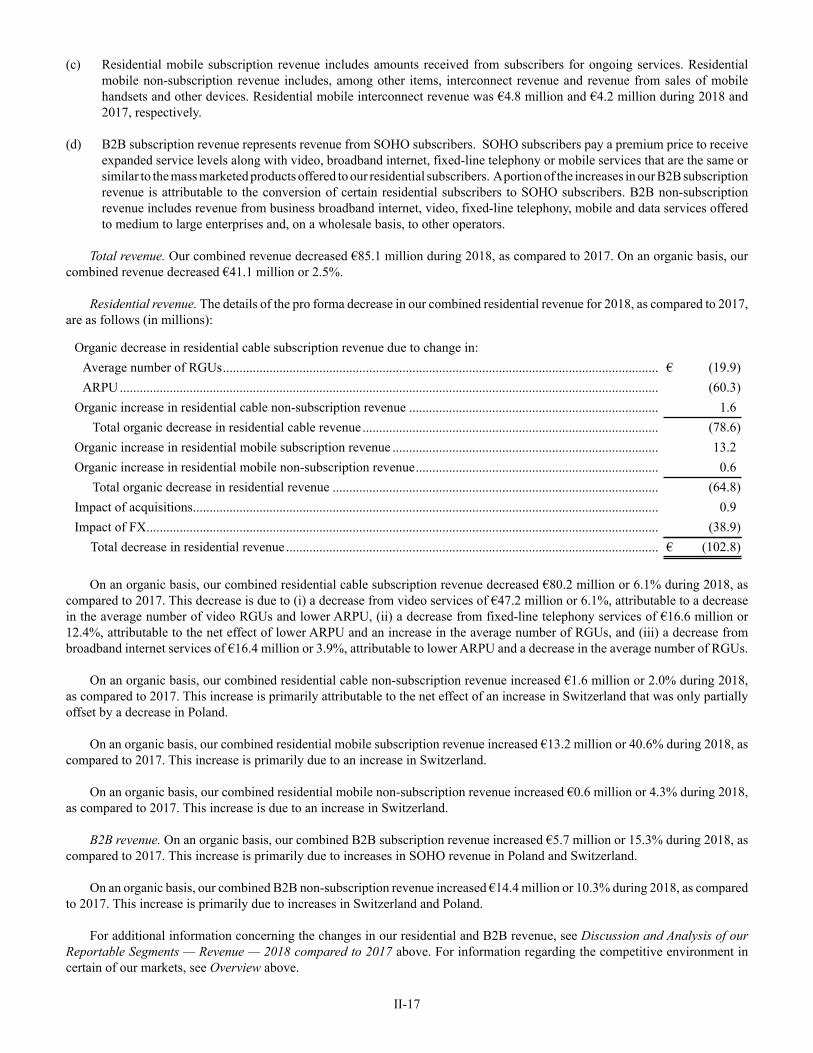
II-17
(c) Residential mobile subscription revenue includes amounts received from subscribers for ongoing services. Residential
mobile non-subscription revenue includes, among other items, interconnect revenue and revenue from sales of mobile
handsets and other devices. Residential mobile interconnect revenue was €4.8 million and €4.2 million during 2018 and
2017, respectively.
(d) B2B subscription revenue represents revenue from SOHO subscribers. SOHO subscribers pay a premium price to receive
expanded service levels along with video, broadband internet, fixed-line telephony or mobile services that are the same or
similar to the mass marketed products offered to our residential subscribers. A portion of the increases in our B2B subscription
revenue is attributable to the conversion of certain residential subscribers to SOHO subscribers. B2B non-subscription
revenue includes revenue from business broadband internet, video, fixed-line telephony, mobile and data services offered
to medium to large enterprises and, on a wholesale basis, to other operators.
Total revenue. Our combined revenue decreased €85.1 million during 2018, as compared to 2017. On an organic basis, our
combined revenue decreased €41.1 million or 2.5%.
Residential revenue. The details of the pro forma decrease in our combined residential revenue for 2018, as compared to 2017,
are as follows (in millions):
Organic decrease in residential cable subscription revenue due to change in:
Average number of RGUs................................................................................................................................... € (19.9)
ARPU .................................................................................................................................................................. (60.3)
Organic increase in residential cable non-subscription revenue ........................................................................... 1.6
Total organic decrease in residential cable revenue ......................................................................................... (78.6)
Organic increase in residential mobile subscription revenue ................................................................................ 13.2
Organic increase in residential mobile non-subscription revenue......................................................................... 0.6
Total organic decrease in residential revenue .................................................................................................. (64.8)
Impact of acquisitions............................................................................................................................................ 0.9
Impact of FX.......................................................................................................................................................... (38.9)
Total decrease in residential revenue ................................................................................................................ € (102.8)
On an organic basis, our combined residential cable subscription revenue decreased €80.2 million or 6.1% during 2018, as
compared to 2017. This decrease is due to (i) a decrease from video services of €47.2 million or 6.1%, attributable to a decrease
in the average number of video RGUs and lower ARPU, (ii) a decrease from fixed-line telephony services of €16.6 million or
12.4%, attributable to the net effect of lower ARPU and an increase in the average number of RGUs, and (iii) a decrease from
broadband internet services of €16.4 million or 3.9%, attributable to lower ARPU and a decrease in the average number of RGUs.
On an organic basis, our combined residential cable non-subscription revenue increased €1.6 million or 2.0% during 2018,
as compared to 2017. This increase is primarily attributable to the net effect of an increase in Switzerland that was only partially
offset by a decrease in Poland.
On an organic basis, our combined residential mobile subscription revenue increased €13.2 million or 40.6% during 2018, as
compared to 2017. This increase is primarily due to an increase in Switzerland.
On an organic basis, our combined residential mobile non-subscription revenue increased €0.6 million or 4.3% during 2018,
as compared to 2017. This increase is due to an increase in Switzerland.
B2B revenue. On an organic basis, our combined B2B subscription revenue increased €5.7 million or 15.3% during 2018, as
compared to 2017. This increase is primarily due to increases in SOHO revenue in Poland and Switzerland.
On an organic basis, our combined B2B non-subscription revenue increased €14.4 million or 10.3% during 2018, as compared
to 2017. This increase is primarily due to increases in Switzerland and Poland.
For additional information concerning the changes in our residential and B2B revenue, see Discussion and Analysis of our
Reportable Segments — Revenue — 2018 compared to 2017 above. For information regarding the competitive environment in
certain of our markets, see Overview above.
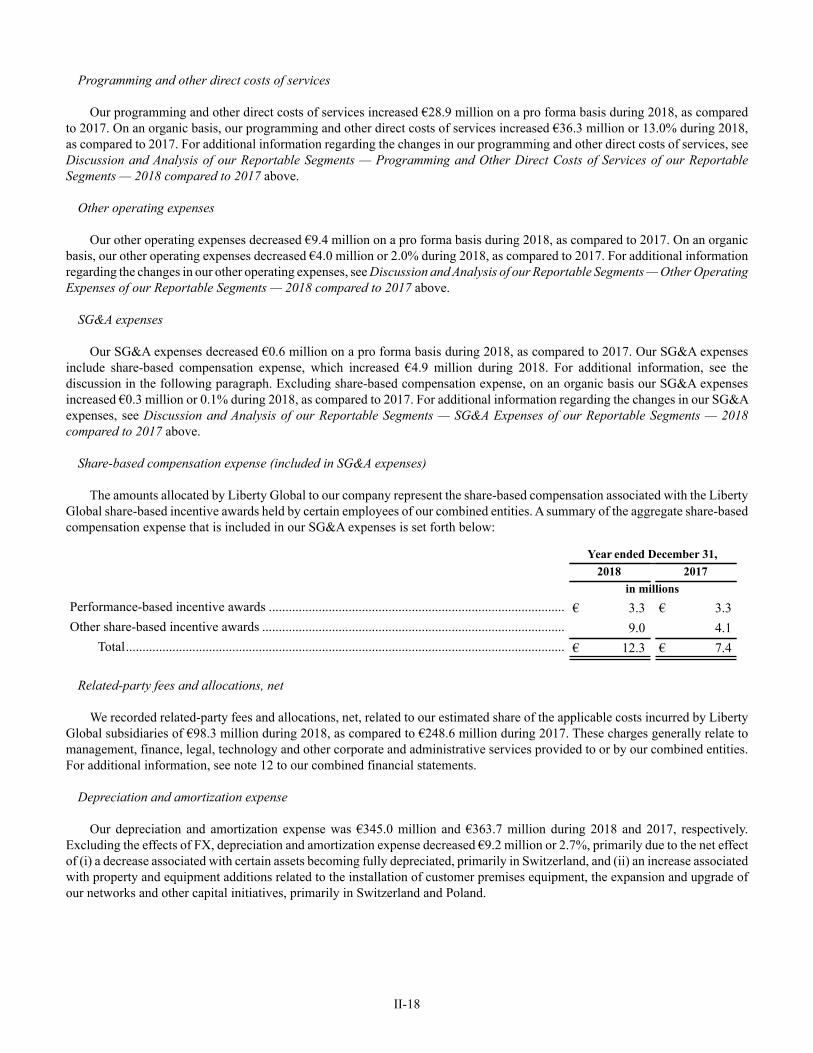
II-18
Programming and other direct costs of services
Our programming and other direct costs of services increased €28.9 million on a pro forma basis during 2018, as compared
to 2017. On an organic basis, our programming and other direct costs of services increased €36.3 million or 13.0% during 2018,
as compared to 2017. For additional information regarding the changes in our programming and other direct costs of services, see
Discussion and Analysis of our Reportable Segments — Programming and Other Direct Costs of Services of our Reportable
Segments — 2018 compared to 2017 above.
Other operating expenses
Our other operating expenses decreased €9.4 million on a pro forma basis during 2018, as compared to 2017. On an organic
basis, our other operating expenses decreased €4.0 million or 2.0% during 2018, as compared to 2017. For additional information
regarding the changes in our other operating expenses, see Discussion and Analysis of our Reportable Segments — Other Operating
Expenses of our Reportable Segments — 2018 compared to 2017 above.
SG&A expenses
Our SG&A expenses decreased €0.6 million on a pro forma basis during 2018, as compared to 2017. Our SG&A expenses
include share-based compensation expense, which increased €4.9 million during 2018. For additional information, see the
discussion in the following paragraph. Excluding share-based compensation expense, on an organic basis our SG&A expenses
increased €0.3 million or 0.1% during 2018, as compared to 2017. For additional information regarding the changes in our SG&A
expenses, see Discussion and Analysis of our Reportable Segments — SG&A Expenses of our Reportable Segments — 2018
compared to 2017 above.
Share-based compensation expense (included in SG&A expenses)
The amounts allocated by Liberty Global to our company represent the share-based compensation associated with the Liberty
Global share-based incentive awards held by certain employees of our combined entities. A summary of the aggregate share-based
compensation expense that is included in our SG&A expenses is set forth below:
Year ended December 31,
2018 2017
in millions
Performance-based incentive awards ......................................................................................... € 3.3 € 3.3
Other share-based incentive awards ........................................................................................... 9.0 4.1
Total.................................................................................................................................... € 12.3 € 7.4
Related-party fees and allocations, net
We recorded related-party fees and allocations, net, related to our estimated share of the applicable costs incurred by Liberty
Global subsidiaries of €98.3 million during 2018, as compared to €248.6 million during 2017. These charges generally relate to
management, finance, legal, technology and other corporate and administrative services provided to or by our combined entities.
For additional information, see note 12 to our combined financial statements.
Depreciation and amortization expense
Our depreciation and amortization expense was €345.0 million and €363.7 million during 2018 and 2017, respectively.
Excluding the effects of FX, depreciation and amortization expense decreased €9.2 million or 2.7%, primarily due to the net effect
of (i) a decrease associated with certain assets becoming fully depreciated, primarily in Switzerland, and (ii) an increase associated
with property and equipment additions related to the installation of customer premises equipment, the expansion and upgrade of
our networks and other capital initiatives, primarily in Switzerland and Poland.
II-19
Impairment, restructuring and other operating items, net
We recognized impairment, restructuring and other operating items, net, of €5.1 million during 2018, as compared to €6.1
million during 2017. The 2018 amount is primarily related to (i) employee severance and termination costs related to certain
reorganization activities in Poland, Switzerland and Slovakia and (ii) office closures in Switzerland. The 2017 amount is primarily
related to employee severance and termination costs related to certain reorganization activities, primarily in Switzerland.
If, among other factors, (i) our enterprise value or Liberty Global’s equity value were to decline or (ii) the adverse impacts of
economic, competitive, regulatory or other factors were to cause our results of operations or cash flows to be worse than anticipated,
we could conclude in future periods that impairment charges are required in order to reduce the carrying values of our goodwill
and, to a lesser extent, other long-lived assets. Any such impairment charges could be significant. For additional information, see
Critical Accounting Policies, Judgments and Estimates — Impairment of Property and Equipment and Intangible Assets below.
Interest expense – third-party
Our third-party interest expense decreased €37.8 million during 2018, as compared to 2017. This decrease is primarily
attributable (i) lower average outstanding third-party debt balances and (ii) lower weighter average interest rates. For additional
information regarding our outstanding indebtedness, see note 9 to our combined financial statements.
It is possible that the interest rates on (i) any new borrowings could be higher than the current interest rates on our existing
indebtedness and (ii) our variable-rate indebtedness could increase in future periods. As further discussed in note 6 to our combined
financial statements, we use derivative instruments to manage our interest rate risks.
In July 2017, the U.K. Financial Conduct Authority (the authority that regulates LIBOR) announced that it intends to stop
compelling banks to submit rates for the calculation of LIBOR after 2021. Currently, it is not possible to predict the exact transitional
arrangements for calculating applicable reference rates that may be made in the U.K., the U.S., the Eurozone or elsewhere given
that a number of outcomes are possible, including the cessation of the publication of one or more reference rates. Our loan documents
contain provisions that contemplate alternative calculations of the base rate applicable to our LIBOR-indexed debt to the extent
LIBOR is not available, which alternative calculations we do not anticipate will be materially different from what would have
been calculated under LIBOR. Additionally, no mandatory prepayment or redemption provisions would be triggered under our
loan documents in the event that the LIBOR rate is not available. It is possible, however, that any new reference rate that applies
to our LIBOR-indexed debt could be different than any new reference rate that applies to our LIBOR-indexed derivative instruments.
We anticipate managing this difference and any resulting increased variable-rate exposure through modifications to our debt and/
or derivative instruments, however future market conditions may not allow immediate implementation of desired modifications
and/or the company may incur significant associated costs.
Interest expense – related-party
Our related-party interest expense primarily relates to interest expense on the Shareholder Loan. Our related-party interest
expense decreased €308.9 million during 2018, as compared to 2017. This decrease is primarily due to the non-cash settlement of
the Shareholder Loan on June 15, 2018. For additional information regarding the Shareholder Loan, see note 12 to our combined
financial statements.
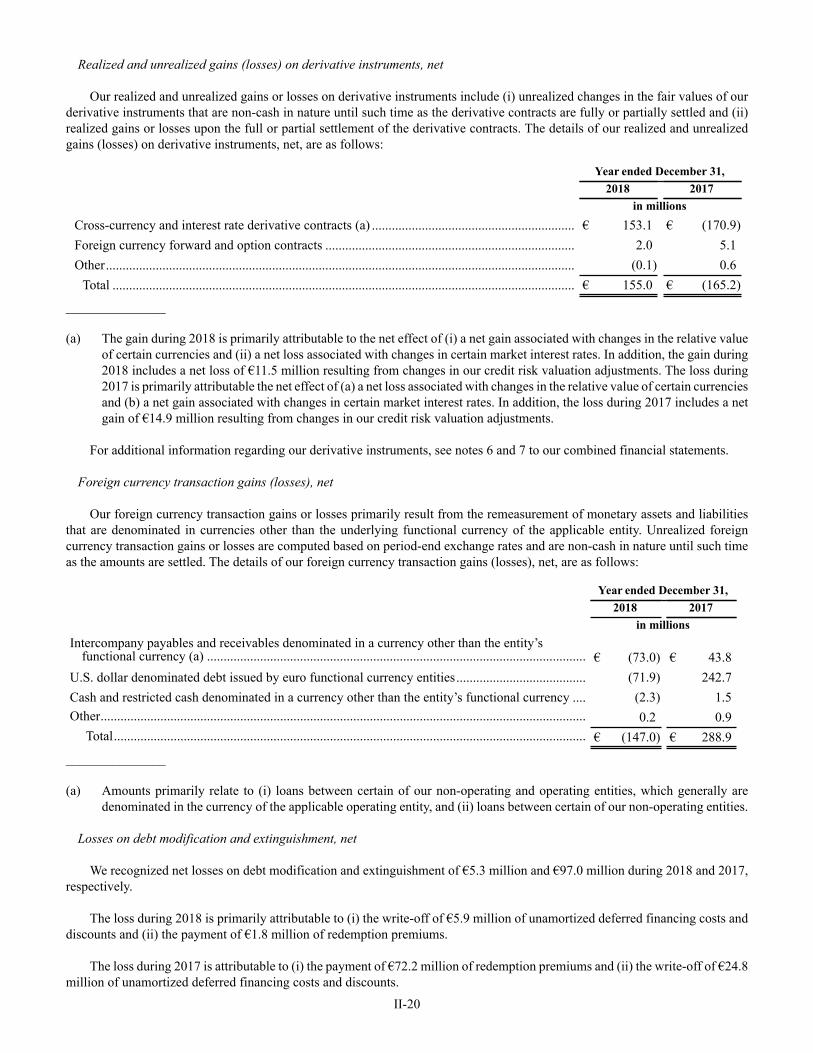
II-20
Realized and unrealized gains (losses) on derivative instruments, net
Our realized and unrealized gains or losses on derivative instruments include (i) unrealized changes in the fair values of our
derivative instruments that are non-cash in nature until such time as the derivative contracts are fully or partially settled and (ii)
realized gains or losses upon the full or partial settlement of the derivative contracts. The details of our realized and unrealized
gains (losses) on derivative instruments, net, are as follows:
Year ended December 31,
2018 2017
in millions
Cross-currency and interest rate derivative contracts (a) ............................................................. € 153.1 € (170.9)
Foreign currency forward and option contracts ........................................................................... 2.0 5.1
Other............................................................................................................................................. (0.1) 0.6
Total ........................................................................................................................................... € 155.0 € (165.2)
_______________
(a) The gain during 2018 is primarily attributable to the net effect of (i) a net gain associated with changes in the relative value
of certain currencies and (ii) a net loss associated with changes in certain market interest rates. In addition, the gain during
2018 includes a net loss of €11.5 million resulting from changes in our credit risk valuation adjustments. The loss during
2017 is primarily attributable the net effect of (a) a net loss associated with changes in the relative value of certain currencies
and (b) a net gain associated with changes in certain market interest rates. In addition, the loss during 2017 includes a net
gain of €14.9 million resulting from changes in our credit risk valuation adjustments.
For additional information regarding our derivative instruments, see notes 6 and 7 to our combined financial statements.
Foreign currency transaction gains (losses), net
Our foreign currency transaction gains or losses primarily result from the remeasurement of monetary assets and liabilities
that are denominated in currencies other than the underlying functional currency of the applicable entity. Unrealized foreign
currency transaction gains or losses are computed based on period-end exchange rates and are non-cash in nature until such time
as the amounts are settled. The details of our foreign currency transaction gains (losses), net, are as follows:
Year ended December 31,
2018 2017
in millions
Intercompany payables and receivables denominated in a currency other than the entity’sfunctional currency (a) .................................................................................................................. € (73.0) € 43.8
U.S. dollar denominated debt issued by euro functional currency entities....................................... (71.9) 242.7
Cash and restricted cash denominated in a currency other than the entity’s functional currency .... (2.3) 1.5
Other.................................................................................................................................................. 0.2 0.9
Total.............................................................................................................................................. € (147.0) € 288.9
_______________
(a) Amounts primarily relate to (i) loans between certain of our non-operating and operating entities, which generally are
denominated in the currency of the applicable operating entity, and (ii) loans between certain of our non-operating entities.
Losses on debt modification and extinguishment, net
We recognized net losses on debt modification and extinguishment of €5.3 million and €97.0 million during 2018 and 2017,
respectively.
The loss during 2018 is primarily attributable to (i) the write-off of €5.9 million of unamortized deferred financing costs and
discounts and (ii) the payment of €1.8 million of redemption premiums.
The loss during 2017 is attributable to (i) the payment of €72.2 million of redemption premiums and (ii) the write-off of €24.8
million of unamortized deferred financing costs and discounts.
II-21
For additional information concerning our losses on debt modification and extinguishment, net, see note 9 to our combined
financial statements.
Income tax expense
We recognized income tax expense of €24.5 million and €5.1 million during 2018 and 2017, respectively.
The income tax expense during 2018 and 2017 differs from the expected income tax benefit of €47.7 million and €144.0
million, respectively, (based on the Dutch 25.0% income tax rate) primarily due to the net negative impact of (i) an increase in
valuation allowances and (ii) certain permanent differences between the financial and tax accounting treatment of interest and
other items.
For additional information concerning our income taxes, see note 10 to our combined financial statements.
Loss from continuing operations
During 2018 and 2017, we reported losses from continuing operations of €215.1 million and €580.9 million, respectively,
consisting of (i) operating income of €378.8 million and €314.7 million, respectively, (ii) net non-operating expense of €569.4
million and €890.5 million, respectively, and (iii) income tax expense of €24.5 million and €5.1 million, respectively.
Gains or losses associated with (i) changes in the fair values of derivative instruments and (ii) movements in foreign currency
exchange rates are subject to a high degree of volatility and, as such, any gains from these sources do not represent a reliable source
of income. In the absence of significant gains in the future from these sources or from other non-operating items, our ability to
achieve earnings from operations is largely dependent on our ability to increase our aggregate Segment OCF to a level that more
than offsets the aggregate amount of our (a) share-based compensation expense, (b) related-party fees and allocations, net, (c)
depreciation and amortization, (d) impairment, restructuring and other operating items, (e) interest expense, (f) other non-operating
expenses and (g) income tax expense.
Subject to the limitations included in our various debt instruments, we expect that Liberty Global will cause our company to
maintain our debt at current levels relative to our Covenant EBITDA. As a result, we expect that we will continue to report
significant levels of interest expense for the foreseeable future. For information concerning our expectations with respect to trends
that may affect certain aspects of our operating results in future periods, see the discussion under Overview above. For information
concerning the reasons for changes in specific line items in our combined statements of operations, see the discussion under
Discussion and Analysis of our Reportable Segments and Discussion and Analysis of our Combined Operating Results above.
Earnings from discontinued operations
We reported earnings from discontinued operations, net of taxes, of €186.3 million and €87.6 million during 2018 and 2017,
respectively, related to the operations of UPC Austria, the Vodafone Disposal Group and UPC DTH. For additional information,
see note 5 to our combined financial statements.
Net earnings attributable to noncontrolling interests
Net earnings attributable to noncontrolling interests includes the noncontrolling interest’ share of the results of our continuing
and discontinued operations. Net earnings attributable to noncontrolling interests decreased €3.4 million during 2018, as compared
to 2017. This decrease is largely attributable to the results of operations of UPC Austria.
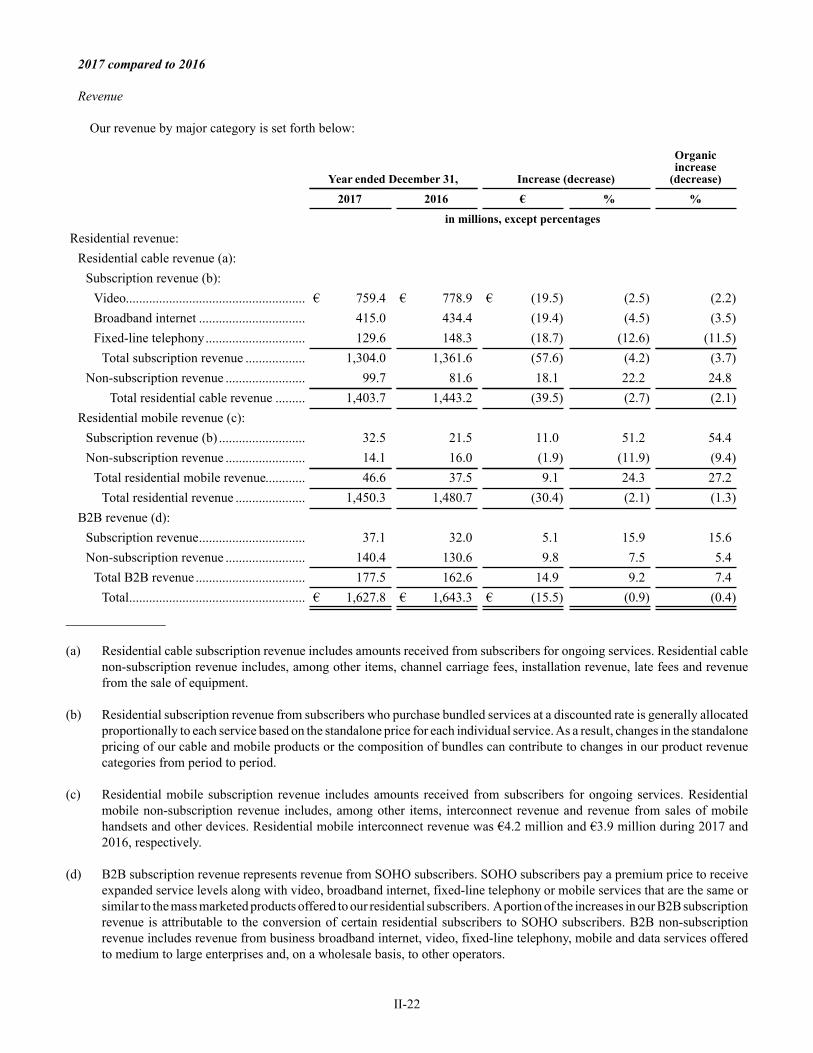
II-22
2017 compared to 2016
Revenue
Our revenue by major category is set forth below:
Year ended December 31, Increase (decrease)
Organicincrease
(decrease)
2017 2016 € % %
in millions, except percentages
Residential revenue:
Residential cable revenue (a):
Subscription revenue (b):
Video...................................................... € 759.4 € 778.9 € (19.5) (2.5) (2.2)
Broadband internet ................................ 415.0 434.4 (19.4) (4.5) (3.5)
Fixed-line telephony.............................. 129.6 148.3 (18.7) (12.6) (11.5)
Total subscription revenue .................. 1,304.0 1,361.6 (57.6) (4.2) (3.7)
Non-subscription revenue ........................ 99.7 81.6 18.1 22.2 24.8
Total residential cable revenue ......... 1,403.7 1,443.2 (39.5) (2.7) (2.1)
Residential mobile revenue (c):
Subscription revenue (b) .......................... 32.5 21.5 11.0 51.2 54.4
Non-subscription revenue ........................ 14.1 16.0 (1.9) (11.9) (9.4)
Total residential mobile revenue............ 46.6 37.5 9.1 24.3 27.2
Total residential revenue ..................... 1,450.3 1,480.7 (30.4) (2.1) (1.3)
B2B revenue (d):
Subscription revenue................................ 37.1 32.0 5.1 15.9 15.6
Non-subscription revenue ........................ 140.4 130.6 9.8 7.5 5.4
Total B2B revenue ................................. 177.5 162.6 14.9 9.2 7.4
Total..................................................... € 1,627.8 € 1,643.3 € (15.5) (0.9) (0.4)
_______________
(a) Residential cable subscription revenue includes amounts received from subscribers for ongoing services. Residential cable
non-subscription revenue includes, among other items, channel carriage fees, installation revenue, late fees and revenue
from the sale of equipment.
(b) Residential subscription revenue from subscribers who purchase bundled services at a discounted rate is generally allocated
proportionally to each service based on the standalone price for each individual service. As a result, changes in the standalone
pricing of our cable and mobile products or the composition of bundles can contribute to changes in our product revenue
categories from period to period.
(c) Residential mobile subscription revenue includes amounts received from subscribers for ongoing services. Residential
mobile non-subscription revenue includes, among other items, interconnect revenue and revenue from sales of mobile
handsets and other devices. Residential mobile interconnect revenue was €4.2 million and €3.9 million during 2017 and
2016, respectively.
(d) B2B subscription revenue represents revenue from SOHO subscribers. SOHO subscribers pay a premium price to receive
expanded service levels along with video, broadband internet, fixed-line telephony or mobile services that are the same or
similar to the mass marketed products offered to our residential subscribers. A portion of the increases in our B2B subscription
revenue is attributable to the conversion of certain residential subscribers to SOHO subscribers. B2B non-subscription
revenue includes revenue from business broadband internet, video, fixed-line telephony, mobile and data services offered
to medium to large enterprises and, on a wholesale basis, to other operators.
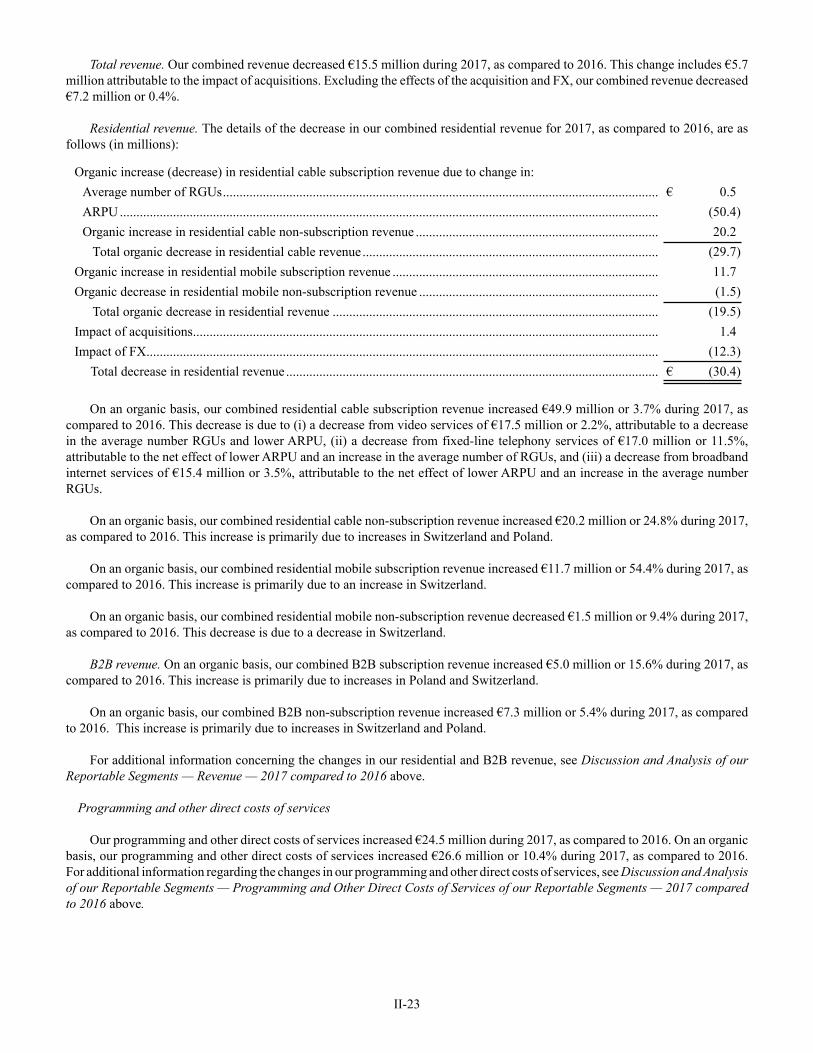
II-23
Total revenue. Our combined revenue decreased €15.5 million during 2017, as compared to 2016. This change includes €5.7
million attributable to the impact of acquisitions. Excluding the effects of the acquisition and FX, our combined revenue decreased
€7.2 million or 0.4%.
Residential revenue. The details of the decrease in our combined residential revenue for 2017, as compared to 2016, are as
follows (in millions):
Organic increase (decrease) in residential cable subscription revenue due to change in:
Average number of RGUs................................................................................................................................... € 0.5
ARPU .................................................................................................................................................................. (50.4)
Organic increase in residential cable non-subscription revenue ......................................................................... 20.2
Total organic decrease in residential cable revenue ......................................................................................... (29.7)
Organic increase in residential mobile subscription revenue ................................................................................ 11.7
Organic decrease in residential mobile non-subscription revenue ........................................................................ (1.5)
Total organic decrease in residential revenue .................................................................................................. (19.5)
Impact of acquisitions............................................................................................................................................ 1.4
Impact of FX.......................................................................................................................................................... (12.3)
Total decrease in residential revenue ................................................................................................................ € (30.4)
On an organic basis, our combined residential cable subscription revenue increased €49.9 million or 3.7% during 2017, as
compared to 2016. This decrease is due to (i) a decrease from video services of €17.5 million or 2.2%, attributable to a decrease
in the average number RGUs and lower ARPU, (ii) a decrease from fixed-line telephony services of €17.0 million or 11.5%,
attributable to the net effect of lower ARPU and an increase in the average number of RGUs, and (iii) a decrease from broadband
internet services of €15.4 million or 3.5%, attributable to the net effect of lower ARPU and an increase in the average number
RGUs.
On an organic basis, our combined residential cable non-subscription revenue increased €20.2 million or 24.8% during 2017,
as compared to 2016. This increase is primarily due to increases in Switzerland and Poland.
On an organic basis, our combined residential mobile subscription revenue increased €11.7 million or 54.4% during 2017, as
compared to 2016. This increase is primarily due to an increase in Switzerland.
On an organic basis, our combined residential mobile non-subscription revenue decreased €1.5 million or 9.4% during 2017,
as compared to 2016. This decrease is due to a decrease in Switzerland.
B2B revenue. On an organic basis, our combined B2B subscription revenue increased €5.0 million or 15.6% during 2017, as
compared to 2016. This increase is primarily due to increases in Poland and Switzerland.
On an organic basis, our combined B2B non-subscription revenue increased €7.3 million or 5.4% during 2017, as compared
to 2016. This increase is primarily due to increases in Switzerland and Poland.
For additional information concerning the changes in our residential and B2B revenue, see Discussion and Analysis of our
Reportable Segments — Revenue — 2017 compared to 2016 above.
Programming and other direct costs of services
Our programming and other direct costs of services increased €24.5 million during 2017, as compared to 2016. On an organic
basis, our programming and other direct costs of services increased €26.6 million or 10.4% during 2017, as compared to 2016.
For additional information regarding the changes in our programming and other direct costs of services, see Discussion and Analysis
of our Reportable Segments — Programming and Other Direct Costs of Services of our Reportable Segments — 2017 compared
to 2016 above.
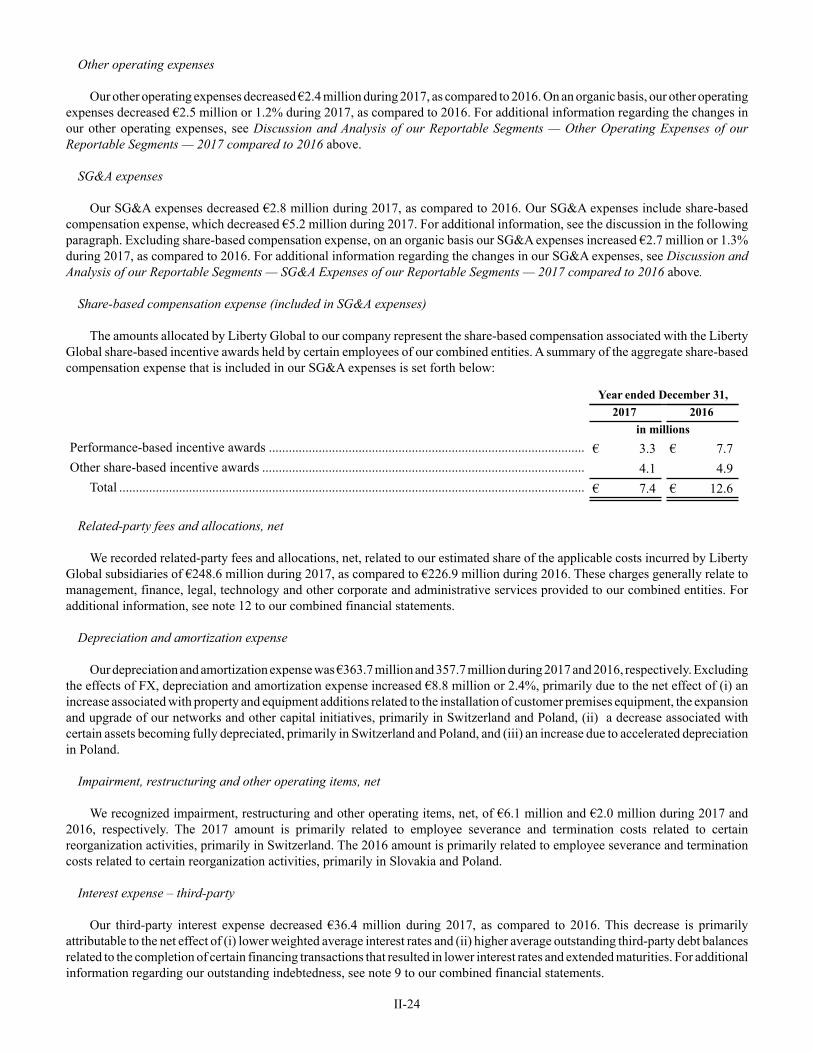
II-24
Other operating expenses
Our other operating expenses decreased €2.4 million during 2017, as compared to 2016. On an organic basis, our other operating
expenses decreased €2.5 million or 1.2% during 2017, as compared to 2016. For additional information regarding the changes in
our other operating expenses, see Discussion and Analysis of our Reportable Segments — Other Operating Expenses of our
Reportable Segments — 2017 compared to 2016 above.
SG&A expenses
Our SG&A expenses decreased €2.8 million during 2017, as compared to 2016. Our SG&A expenses include share-based
compensation expense, which decreased €5.2 million during 2017. For additional information, see the discussion in the following
paragraph. Excluding share-based compensation expense, on an organic basis our SG&A expenses increased €2.7 million or 1.3%
during 2017, as compared to 2016. For additional information regarding the changes in our SG&A expenses, see Discussion and
Analysis of our Reportable Segments — SG&A Expenses of our Reportable Segments — 2017 compared to 2016 above.
Share-based compensation expense (included in SG&A expenses)
The amounts allocated by Liberty Global to our company represent the share-based compensation associated with the Liberty
Global share-based incentive awards held by certain employees of our combined entities. A summary of the aggregate share-based
compensation expense that is included in our SG&A expenses is set forth below:
Year ended December 31,
2017 2016
in millions
Performance-based incentive awards ............................................................................................... € 3.3 € 7.7
Other share-based incentive awards ................................................................................................. 4.1 4.9
Total ............................................................................................................................................ € 7.4 € 12.6
Related-party fees and allocations, net
We recorded related-party fees and allocations, net, related to our estimated share of the applicable costs incurred by Liberty
Global subsidiaries of €248.6 million during 2017, as compared to €226.9 million during 2016. These charges generally relate to
management, finance, legal, technology and other corporate and administrative services provided to our combined entities. For
additional information, see note 12 to our combined financial statements.
Depreciation and amortization expense
Our depreciation and amortization expense was €363.7 million and 357.7 million during 2017 and 2016, respectively. Excluding
the effects of FX, depreciation and amortization expense increased €8.8 million or 2.4%, primarily due to the net effect of (i) an
increase associated with property and equipment additions related to the installation of customer premises equipment, the expansion
and upgrade of our networks and other capital initiatives, primarily in Switzerland and Poland, (ii) a decrease associated with
certain assets becoming fully depreciated, primarily in Switzerland and Poland, and (iii) an increase due to accelerated depreciation
in Poland.
Impairment, restructuring and other operating items, net
We recognized impairment, restructuring and other operating items, net, of €6.1 million and €2.0 million during 2017 and
2016, respectively. The 2017 amount is primarily related to employee severance and termination costs related to certain
reorganization activities, primarily in Switzerland. The 2016 amount is primarily related to employee severance and termination
costs related to certain reorganization activities, primarily in Slovakia and Poland.
Interest expense – third-party
Our third-party interest expense decreased €36.4 million during 2017, as compared to 2016. This decrease is primarily
attributable to the net effect of (i) lower weighted average interest rates and (ii) higher average outstanding third-party debt balances
related to the completion of certain financing transactions that resulted in lower interest rates and extended maturities. For additional
information regarding our outstanding indebtedness, see note 9 to our combined financial statements.
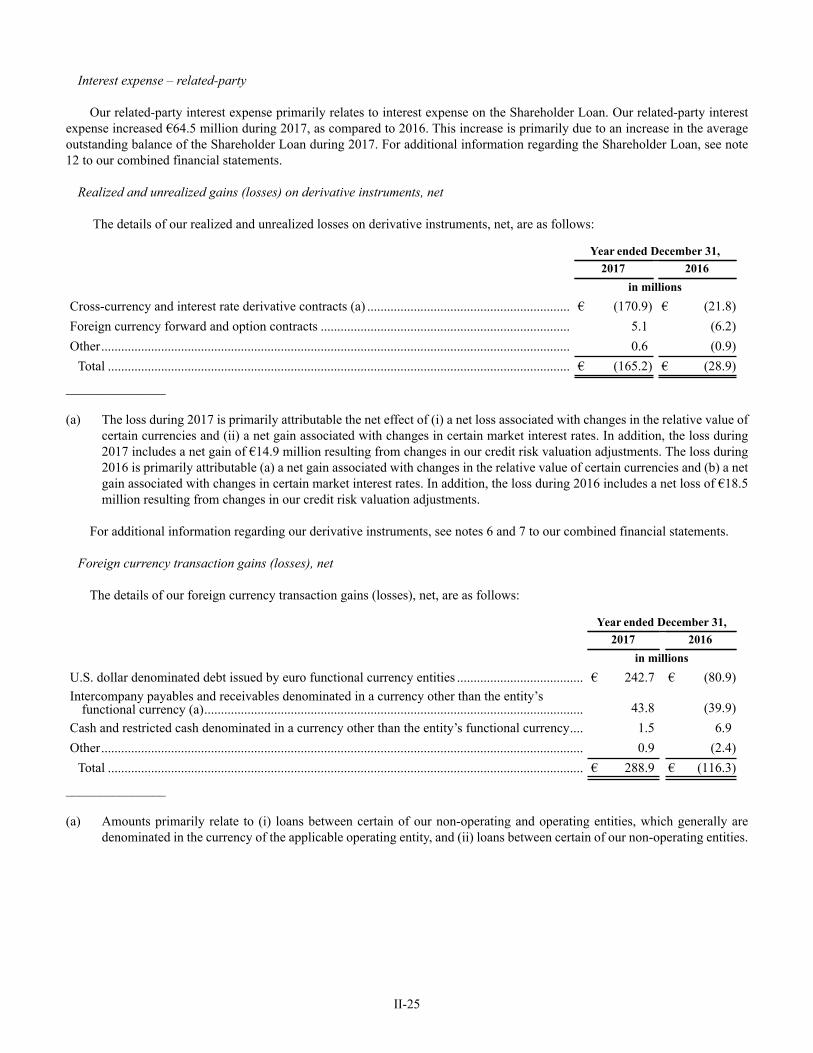
II-25
Interest expense – related-party
Our related-party interest expense primarily relates to interest expense on the Shareholder Loan. Our related-party interest
expense increased €64.5 million during 2017, as compared to 2016. This increase is primarily due to an increase in the average
outstanding balance of the Shareholder Loan during 2017. For additional information regarding the Shareholder Loan, see note
12 to our combined financial statements.
Realized and unrealized gains (losses) on derivative instruments, net
The details of our realized and unrealized losses on derivative instruments, net, are as follows:
Year ended December 31,
2017 2016
in millions
Cross-currency and interest rate derivative contracts (a) ............................................................. € (170.9) € (21.8)
Foreign currency forward and option contracts ........................................................................... 5.1 (6.2)
Other............................................................................................................................................. 0.6 (0.9)
Total ........................................................................................................................................... € (165.2) € (28.9)
_______________
(a) The loss during 2017 is primarily attributable the net effect of (i) a net loss associated with changes in the relative value of
certain currencies and (ii) a net gain associated with changes in certain market interest rates. In addition, the loss during
2017 includes a net gain of €14.9 million resulting from changes in our credit risk valuation adjustments. The loss during
2016 is primarily attributable (a) a net gain associated with changes in the relative value of certain currencies and (b) a net
gain associated with changes in certain market interest rates. In addition, the loss during 2016 includes a net loss of €18.5
million resulting from changes in our credit risk valuation adjustments.
For additional information regarding our derivative instruments, see notes 6 and 7 to our combined financial statements.
Foreign currency transaction gains (losses), net
The details of our foreign currency transaction gains (losses), net, are as follows:
Year ended December 31,
2017 2016
in millions
U.S. dollar denominated debt issued by euro functional currency entities ...................................... € 242.7 € (80.9)
Intercompany payables and receivables denominated in a currency other than the entity’sfunctional currency (a).................................................................................................................. 43.8 (39.9)
Cash and restricted cash denominated in a currency other than the entity’s functional currency.... 1.5 6.9
Other................................................................................................................................................. 0.9 (2.4)
Total ............................................................................................................................................... € 288.9 € (116.3)
_______________
(a) Amounts primarily relate to (i) loans between certain of our non-operating and operating entities, which generally are
denominated in the currency of the applicable operating entity, and (ii) loans between certain of our non-operating entities.
II-26
Losses on debt modification and extinguishment, net
We recognized net losses on debt modification and extinguishment of €97.0 million and €70.3 million during 2017 and 2016,
respectively.
The loss during 2017 is attributable to (i) the payment of €72.2 million of redemption premiums and (ii) the write-off of €24.8
million of unamortized deferred financing costs and discounts.
The loss during 2016 is attributable to (i) the payment of €52.3 million of redemption premiums and (ii) the write-off of €18.0
million of unamortized deferred financing costs and discounts.
For additional information concerning our losses on debt modification and extinguishment, net, see note 9 to our combined
financial statements.
Income tax expense
We recognized income tax expense of €5.1 million and €36.4 million during 2017 and 2016, respectively.
The income tax expense during 2017 and 2016 differs from the expected income tax benefit of €144.0 million and €178.1
million, respectively, (based on the Dutch 25.0% income tax rate) primarily due to the net negative impact of (i) an increase in
valuation allowances and (ii) certain permanent differences between the financial and tax accounting treatment of interest and
other items.
For additional information concerning our income taxes, see note 10 to our combined financial statements.
Loss from continuing operations
During 2017 and 2016, we reported losses from continuing operations of €580.9 million and €748.9 million, respectively,
consisting of (i) operating income of €314.7 million and €381.3 million, respectively, (ii) net non-operating expense of €890.5
million and €1,093.8 million, respectively, and (iii) income tax expense of €5.1 million and €36.4 million, respectively.
Earnings from discontinued operations
We reported earnings from discontinued operations, net of taxes, of €87.6 million and €69.6 million during 2017 and 2016,
respectively, related to the operations of UPC Austria, the Vodafone Disposal Group and UPC DTH. For additional information,
see note 5 to our combined financial statements.
Net earnings attributable to noncontrolling interests
Net earnings attributable to noncontrolling interests includes the noncontrolling interest’ share of the results of our continuing
and discontinued operations. Net earnings attributable to noncontrolling interests decreased €2.3 million during 2017, as compared
to 2016. This decrease is largely attributable to the results of operations of UPC Austria.
II-27
Liquidity and Capital Resources
Sources and Uses of Cash
The UPC Holding Group’s primary assets are its investments in its combined entities, and the majority of our operating entities
are owned by UPC Broadband Holding. Although our combined operating entities generate cash from operating activities, the
terms of the instruments governing the indebtedness of UPC Broadband Holding may restrict our ability to access the liquidity of
these entities. These entities accounted for substantially all of our €12.9 million of combined cash and cash equivalents at
December 31, 2018. In addition, our ability to access the liquidity of these and other combined entities may be limited by tax and
legal considerations, the presence of noncontrolling interests and other factors.
Corporate Liquidity of the UPC Holding Group
As the UPC Holding Group typically does not hold significant amounts of cash and cash equivalents at the corporate level,
the UPC Holding Group’s primary source of corporate liquidity is proceeds received from UPC Broadband Holding (and indirectly
from UPC Broadband Holding’s combined entities) in the form of loans or distributions. As noted above, various factors may limit
the ability of the UPC Holding Group’s combined entities to loan or distribute cash. From time to time, the UPC Holding Group
may also supplement its sources of corporate liquidity with net proceeds received in connection with the issuance of debt instruments
and/or loans or contributions from LGE Financing (and ultimately Liberty Global and other Liberty Global subsidiaries). No
assurance can be given that any external funding would be available on favorable terms, or at all.
The UPC Holding Group’s corporate liquidity requirements include (i) corporate general and administrative expenses and (ii)
interest payments on the UPC Holding Senior Notes. From time to time, UPC Holding may also require cash in connection with
(a) the repayment of third-party and related-party debt (including the repurchase or exchange of outstanding debt securities in the
open market or privately-negotiated transactions and net repayments to LGE Financing pursuant to the Shareholder Loan, as
described in note 12 to our combined financial statements), (b) the funding of loans or distributions to LGE Financing (and
ultimately Liberty Global and other Liberty Global subsidiaries), (c) the satisfaction of contingent liabilities, (d) acquisitions, (e)
other investment opportunities or (f) income tax payments.
Liquidity of Combined Operating Entities
In addition to cash and cash equivalents, the primary source of liquidity of our combined operating entities is cash provided
by operations and, in the case of UPC Broadband Holding, borrowing availability under the UPC Holding Bank Facility. For the
details of the borrowing availability under the UPC Holding Bank Facility at December 31, 2018, see note 9 to our combined
financial statements. Our combined operating entities’ liquidity generally is used to fund property and equipment additions, debt
service requirements and payments required by the UPC Holding Group’s derivative instruments. From time to time, our combined
operating entities may also require liquidity in connection with (i) acquisitions and other investment opportunities, (ii) loans to
UPC Holding or other Liberty Global subsidiaries, (iii) capital distributions to UPC Holding or (iv) the satisfaction of contingent
liabilities. No assurance can be given that any external funding would be available to our combined operating entities on favorable
terms, or at all. For information regarding our commitments and contingencies, see note 15 to our combined financial statements.
For additional information regarding our combined cash flows, see the discussion under Combined Statements of Cash Flows
below.
Capitalization
At December 31, 2018, the outstanding principal amount of our combined third-party debt, together with our capital lease
obligations, aggregated €5,255.6 million, including €515.8 million that is classified as current in our combined balance sheet and
€4,643.3 million that is not due until 2024 or thereafter. For additional information regarding our current debt maturities, see note
9 to our combined financial statements.
Our ability to service or refinance our debt and to maintain compliance with the leverage covenants in the credit agreements
and indentures of the UPC Holding Group is dependent primarily on our ability to maintain or increase the Covenant EBITDA of
our operating entities and to achieve adequate returns on our property and equipment additions and acquisitions. In addition, our
ability to obtain additional debt financing is limited by the incurrence-based leverage covenants contained in the UPC Holding
Group’s debt instruments. For example, if our Covenant EBITDA were to decline, our ability to obtain additional debt could be
limited. No assurance can be given that we would have sufficient sources of liquidity, or that any external funding would be
available on favorable terms, or at all, to fund any such required repayment.
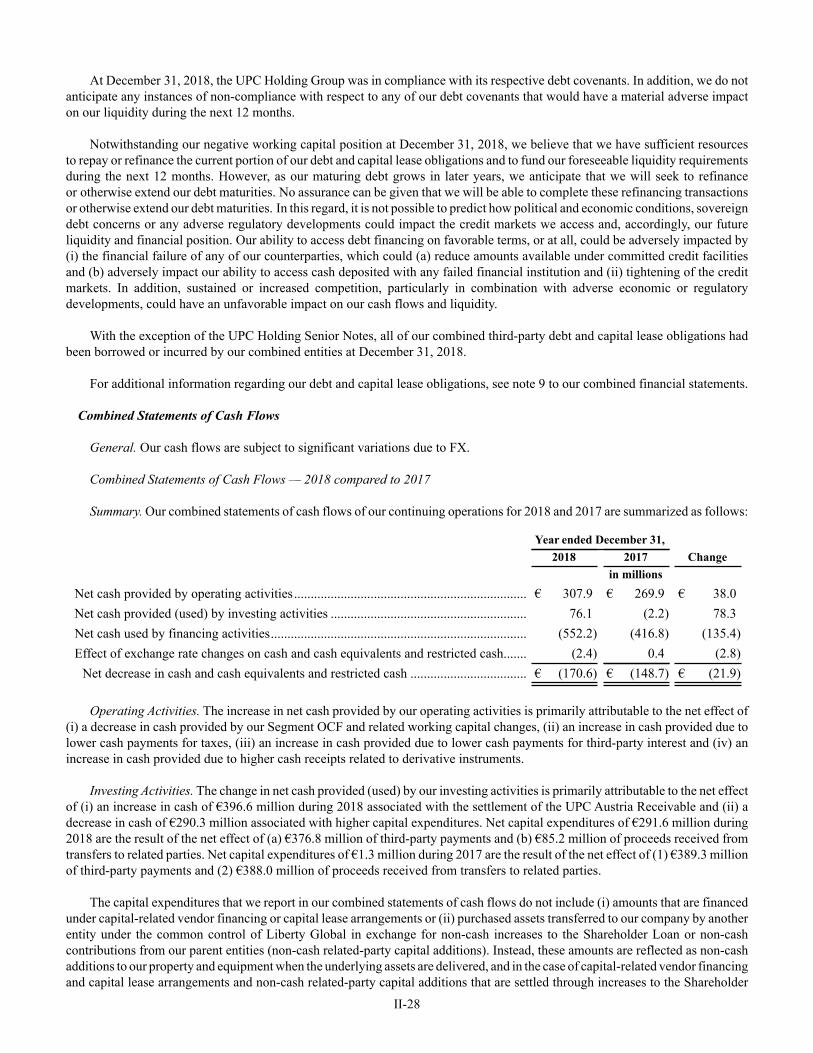
II-28
At December 31, 2018, the UPC Holding Group was in compliance with its respective debt covenants. In addition, we do not
anticipate any instances of non-compliance with respect to any of our debt covenants that would have a material adverse impact
on our liquidity during the next 12 months.
Notwithstanding our negative working capital position at December 31, 2018, we believe that we have sufficient resources
to repay or refinance the current portion of our debt and capital lease obligations and to fund our foreseeable liquidity requirements
during the next 12 months. However, as our maturing debt grows in later years, we anticipate that we will seek to refinance
or otherwise extend our debt maturities. No assurance can be given that we will be able to complete these refinancing transactions
or otherwise extend our debt maturities. In this regard, it is not possible to predict how political and economic conditions, sovereign
debt concerns or any adverse regulatory developments could impact the credit markets we access and, accordingly, our future
liquidity and financial position. Our ability to access debt financing on favorable terms, or at all, could be adversely impacted by
(i) the financial failure of any of our counterparties, which could (a) reduce amounts available under committed credit facilities
and (b) adversely impact our ability to access cash deposited with any failed financial institution and (ii) tightening of the credit
markets. In addition, sustained or increased competition, particularly in combination with adverse economic or regulatory
developments, could have an unfavorable impact on our cash flows and liquidity.
With the exception of the UPC Holding Senior Notes, all of our combined third-party debt and capital lease obligations had
been borrowed or incurred by our combined entities at December 31, 2018.
For additional information regarding our debt and capital lease obligations, see note 9 to our combined financial statements.
Combined Statements of Cash Flows
General. Our cash flows are subject to significant variations due to FX.
Combined Statements of Cash Flows — 2018 compared to 2017
Summary. Our combined statements of cash flows of our continuing operations for 2018 and 2017 are summarized as follows:
Year ended December 31,
2018 2017 Change
in millions
Net cash provided by operating activities...................................................................... € 307.9 € 269.9 € 38.0
Net cash provided (used) by investing activities ........................................................... 76.1 (2.2) 78.3
Net cash used by financing activities............................................................................. (552.2) (416.8) (135.4)
Effect of exchange rate changes on cash and cash equivalents and restricted cash....... (2.4) 0.4 (2.8)
Net decrease in cash and cash equivalents and restricted cash ................................... € (170.6) € (148.7) € (21.9)
Operating Activities. The increase in net cash provided by our operating activities is primarily attributable to the net effect of
(i) a decrease in cash provided by our Segment OCF and related working capital changes, (ii) an increase in cash provided due to
lower cash payments for taxes, (iii) an increase in cash provided due to lower cash payments for third-party interest and (iv) an
increase in cash provided due to higher cash receipts related to derivative instruments.
Investing Activities. The change in net cash provided (used) by our investing activities is primarily attributable to the net effect
of (i) an increase in cash of €396.6 million during 2018 associated with the settlement of the UPC Austria Receivable and (ii) a
decrease in cash of €290.3 million associated with higher capital expenditures. Net capital expenditures of €291.6 million during
2018 are the result of the net effect of (a) €376.8 million of third-party payments and (b) €85.2 million of proceeds received from
transfers to related parties. Net capital expenditures of €1.3 million during 2017 are the result of the net effect of (1) €389.3 million
of third-party payments and (2) €388.0 million of proceeds received from transfers to related parties.
The capital expenditures that we report in our combined statements of cash flows do not include (i) amounts that are financed
under capital-related vendor financing or capital lease arrangements or (ii) purchased assets transferred to our company by another
entity under the common control of Liberty Global in exchange for non-cash increases to the Shareholder Loan or non-cash
contributions from our parent entities (non-cash related-party capital additions). Instead, these amounts are reflected as non-cash
additions to our property and equipment when the underlying assets are delivered, and in the case of capital-related vendor financing
and capital lease arrangements and non-cash related-party capital additions that are settled through increases to the Shareholder
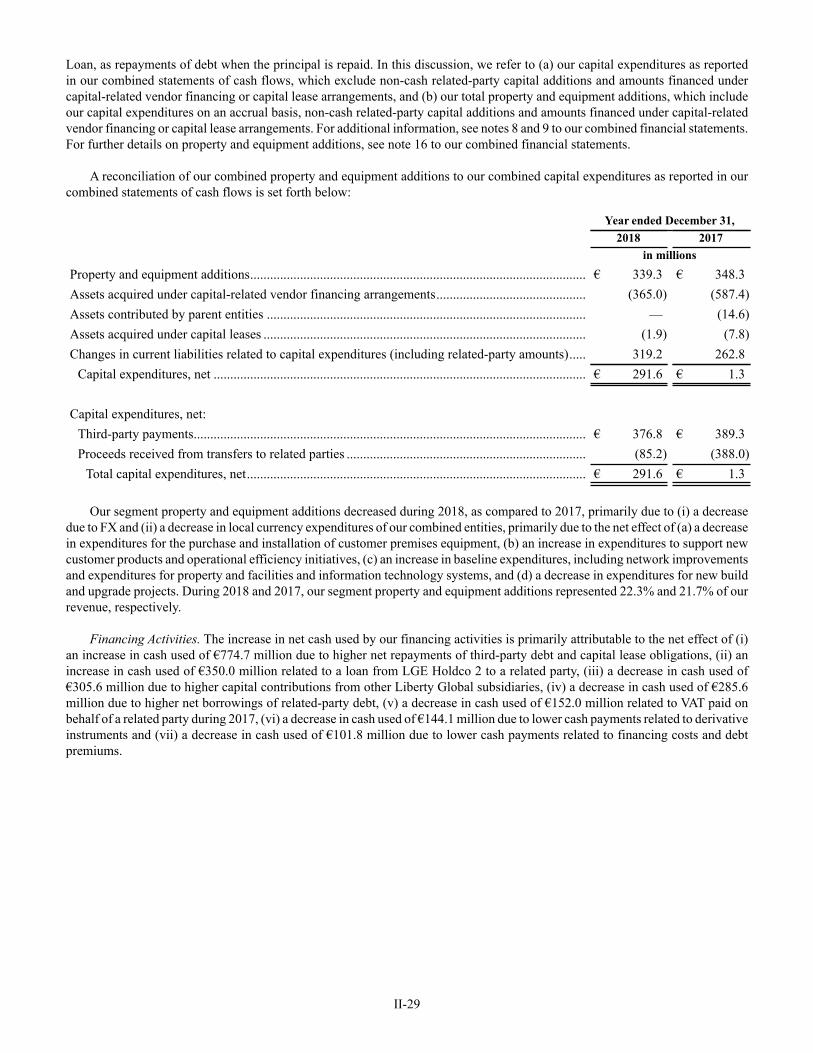
II-29
Loan, as repayments of debt when the principal is repaid. In this discussion, we refer to (a) our capital expenditures as reported
in our combined statements of cash flows, which exclude non-cash related-party capital additions and amounts financed under
capital-related vendor financing or capital lease arrangements, and (b) our total property and equipment additions, which include
our capital expenditures on an accrual basis, non-cash related-party capital additions and amounts financed under capital-related
vendor financing or capital lease arrangements. For additional information, see notes 8 and 9 to our combined financial statements.
For further details on property and equipment additions, see note 16 to our combined financial statements.
A reconciliation of our combined property and equipment additions to our combined capital expenditures as reported in our
combined statements of cash flows is set forth below:
Year ended December 31,
2018 2017
in millions
Property and equipment additions..................................................................................................... € 339.3 € 348.3
Assets acquired under capital-related vendor financing arrangements............................................. (365.0) (587.4)
Assets contributed by parent entities ................................................................................................ — (14.6)
Assets acquired under capital leases ................................................................................................. (1.9) (7.8)
Changes in current liabilities related to capital expenditures (including related-party amounts)..... 319.2 262.8
Capital expenditures, net ................................................................................................................ € 291.6 € 1.3
Capital expenditures, net:
Third-party payments...................................................................................................................... € 376.8 € 389.3
Proceeds received from transfers to related parties ........................................................................ (85.2) (388.0)
Total capital expenditures, net...................................................................................................... € 291.6 € 1.3
Our segment property and equipment additions decreased during 2018, as compared to 2017, primarily due to (i) a decrease
due to FX and (ii) a decrease in local currency expenditures of our combined entities, primarily due to the net effect of (a) a decrease
in expenditures for the purchase and installation of customer premises equipment, (b) an increase in expenditures to support new
customer products and operational efficiency initiatives, (c) an increase in baseline expenditures, including network improvements
and expenditures for property and facilities and information technology systems, and (d) a decrease in expenditures for new build
and upgrade projects. During 2018 and 2017, our segment property and equipment additions represented 22.3% and 21.7% of our
revenue, respectively.
Financing Activities. The increase in net cash used by our financing activities is primarily attributable to the net effect of (i)
an increase in cash used of €774.7 million due to higher net repayments of third-party debt and capital lease obligations, (ii) an
increase in cash used of €350.0 million related to a loan from LGE Holdco 2 to a related party, (iii) a decrease in cash used of
€305.6 million due to higher capital contributions from other Liberty Global subsidiaries, (iv) a decrease in cash used of €285.6
million due to higher net borrowings of related-party debt, (v) a decrease in cash used of €152.0 million related to VAT paid on
behalf of a related party during 2017, (vi) a decrease in cash used of €144.1 million due to lower cash payments related to derivative
instruments and (vii) a decrease in cash used of €101.8 million due to lower cash payments related to financing costs and debt
premiums.
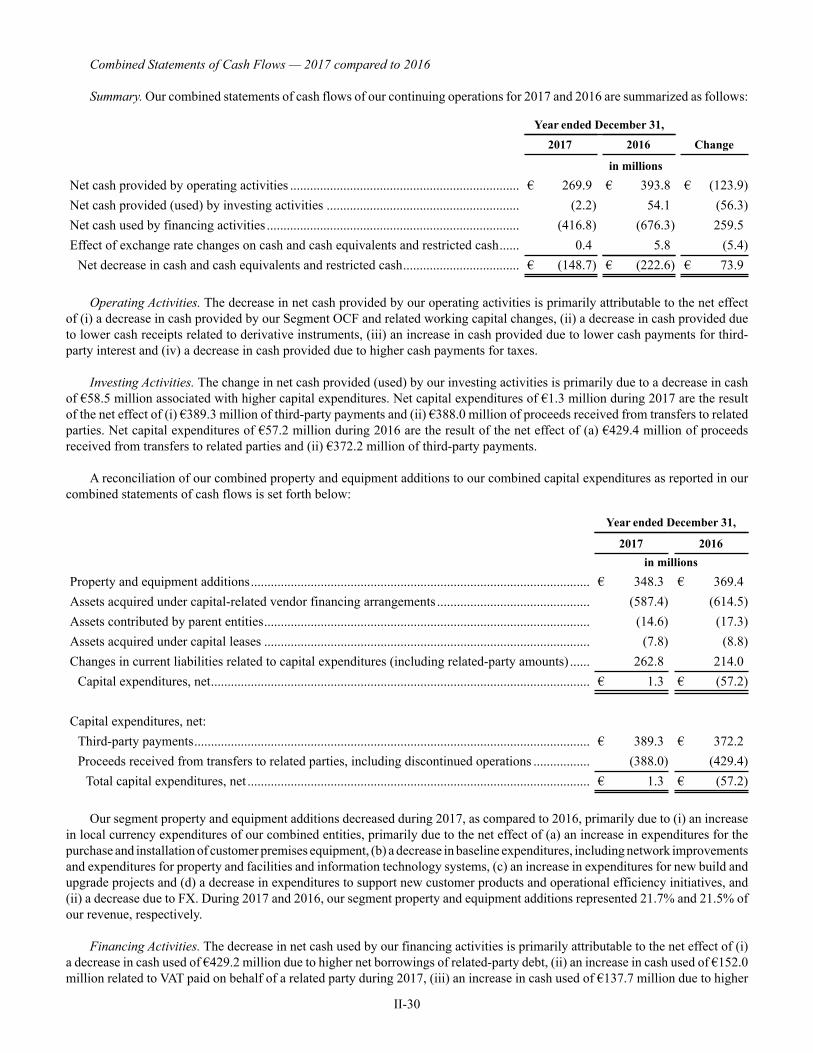
II-30
Combined Statements of Cash Flows — 2017 compared to 2016
Summary. Our combined statements of cash flows of our continuing operations for 2017 and 2016 are summarized as follows:
Year ended December 31,
2017 2016 Change
in millions
Net cash provided by operating activities ..................................................................... € 269.9 € 393.8 € (123.9)
Net cash provided (used) by investing activities .......................................................... (2.2) 54.1 (56.3)
Net cash used by financing activities ............................................................................ (416.8) (676.3) 259.5
Effect of exchange rate changes on cash and cash equivalents and restricted cash...... 0.4 5.8 (5.4)
Net decrease in cash and cash equivalents and restricted cash................................... € (148.7) € (222.6) € 73.9
Operating Activities. The decrease in net cash provided by our operating activities is primarily attributable to the net effect
of (i) a decrease in cash provided by our Segment OCF and related working capital changes, (ii) a decrease in cash provided due
to lower cash receipts related to derivative instruments, (iii) an increase in cash provided due to lower cash payments for third-
party interest and (iv) a decrease in cash provided due to higher cash payments for taxes.
Investing Activities. The change in net cash provided (used) by our investing activities is primarily due to a decrease in cash
of €58.5 million associated with higher capital expenditures. Net capital expenditures of €1.3 million during 2017 are the result
of the net effect of (i) €389.3 million of third-party payments and (ii) €388.0 million of proceeds received from transfers to related
parties. Net capital expenditures of €57.2 million during 2016 are the result of the net effect of (a) €429.4 million of proceeds
received from transfers to related parties and (ii) €372.2 million of third-party payments.
A reconciliation of our combined property and equipment additions to our combined capital expenditures as reported in our
combined statements of cash flows is set forth below:
Year ended December 31,
2017 2016
in millions
Property and equipment additions...................................................................................................... € 348.3 € 369.4
Assets acquired under capital-related vendor financing arrangements .............................................. (587.4) (614.5)
Assets contributed by parent entities.................................................................................................. (14.6) (17.3)
Assets acquired under capital leases .................................................................................................. (7.8) (8.8)
Changes in current liabilities related to capital expenditures (including related-party amounts) ...... 262.8 214.0
Capital expenditures, net.................................................................................................................. € 1.3 € (57.2)
Capital expenditures, net:
Third-party payments....................................................................................................................... € 389.3 € 372.2
Proceeds received from transfers to related parties, including discontinued operations ................. (388.0) (429.4)
Total capital expenditures, net ....................................................................................................... € 1.3 € (57.2)
Our segment property and equipment additions decreased during 2017, as compared to 2016, primarily due to (i) an increase
in local currency expenditures of our combined entities, primarily due to the net effect of (a) an increase in expenditures for the
purchase and installation of customer premises equipment, (b) a decrease in baseline expenditures, including network improvements
and expenditures for property and facilities and information technology systems, (c) an increase in expenditures for new build and
upgrade projects and (d) a decrease in expenditures to support new customer products and operational efficiency initiatives, and
(ii) a decrease due to FX. During 2017 and 2016, our segment property and equipment additions represented 21.7% and 21.5% of
our revenue, respectively.
Financing Activities. The decrease in net cash used by our financing activities is primarily attributable to the net effect of (i)
a decrease in cash used of €429.2 million due to higher net borrowings of related-party debt, (ii) an increase in cash used of €152.0
million related to VAT paid on behalf of a related party during 2017, (iii) an increase in cash used of €137.7 million due to higher
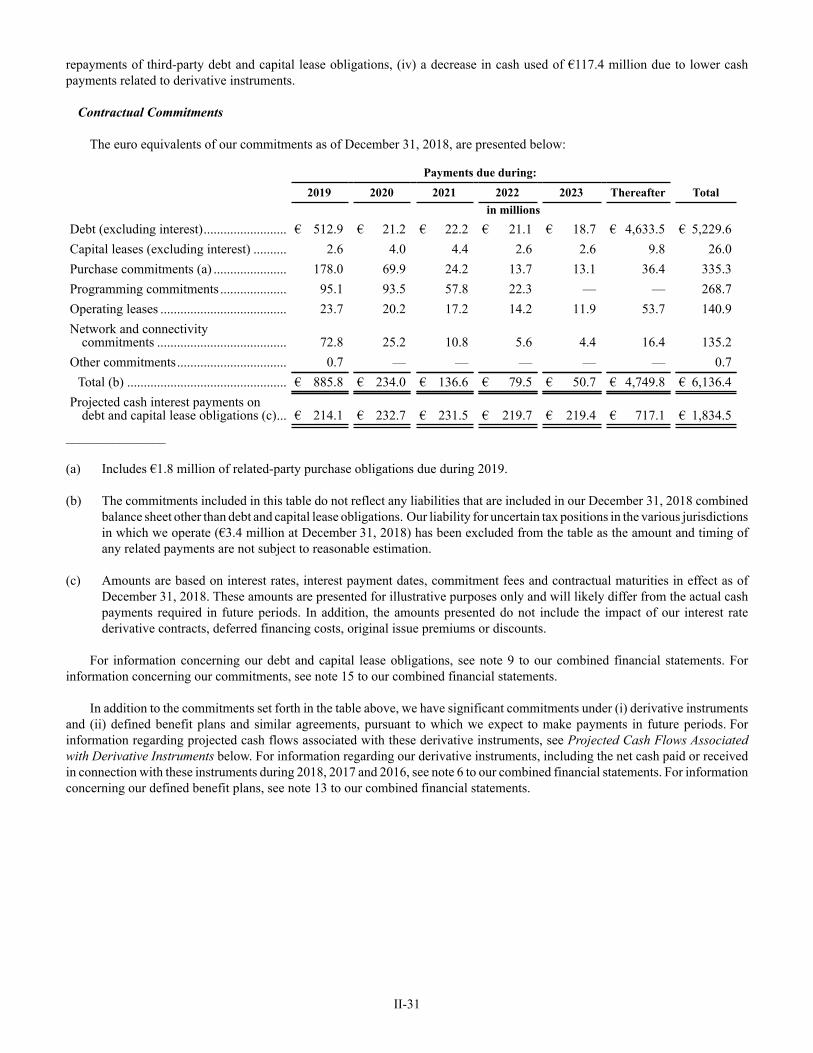
II-31
repayments of third-party debt and capital lease obligations, (iv) a decrease in cash used of €117.4 million due to lower cash
payments related to derivative instruments.
Contractual Commitments
The euro equivalents of our commitments as of December 31, 2018, are presented below:
Payments due during:
Total2019 2020 2021 2022 2023 Thereafter
in millions
Debt (excluding interest)......................... € 512.9 € 21.2 € 22.2 € 21.1 € 18.7 € 4,633.5 € 5,229.6
Capital leases (excluding interest) .......... 2.6 4.0 4.4 2.6 2.6 9.8 26.0
Purchase commitments (a) ...................... 178.0 69.9 24.2 13.7 13.1 36.4 335.3
Programming commitments .................... 95.1 93.5 57.8 22.3 — — 268.7
Operating leases ...................................... 23.7 20.2 17.2 14.2 11.9 53.7 140.9
Network and connectivitycommitments ....................................... 72.8 25.2 10.8 5.6 4.4 16.4 135.2
Other commitments................................. 0.7 — — — — — 0.7
Total (b) ................................................ € 885.8 € 234.0 € 136.6 € 79.5 € 50.7 € 4,749.8 € 6,136.4
Projected cash interest payments ondebt and capital lease obligations (c)... € 214.1 € 232.7 € 231.5 € 219.7 € 219.4 € 717.1 € 1,834.5
_______________
(a) Includes €1.8 million of related-party purchase obligations due during 2019.
(b) The commitments included in this table do not reflect any liabilities that are included in our December 31, 2018 combined
balance sheet other than debt and capital lease obligations. Our liability for uncertain tax positions in the various jurisdictions
in which we operate (€3.4 million at December 31, 2018) has been excluded from the table as the amount and timing of
any related payments are not subject to reasonable estimation.
(c) Amounts are based on interest rates, interest payment dates, commitment fees and contractual maturities in effect as of
December 31, 2018. These amounts are presented for illustrative purposes only and will likely differ from the actual cash
payments required in future periods. In addition, the amounts presented do not include the impact of our interest rate
derivative contracts, deferred financing costs, original issue premiums or discounts.
For information concerning our debt and capital lease obligations, see note 9 to our combined financial statements. For
information concerning our commitments, see note 15 to our combined financial statements.
In addition to the commitments set forth in the table above, we have significant commitments under (i) derivative instruments
and (ii) defined benefit plans and similar agreements, pursuant to which we expect to make payments in future periods. For
information regarding projected cash flows associated with these derivative instruments, see Projected Cash Flows Associated
with Derivative Instruments below. For information regarding our derivative instruments, including the net cash paid or received
in connection with these instruments during 2018, 2017 and 2016, see note 6 to our combined financial statements. For information
concerning our defined benefit plans, see note 13 to our combined financial statements.
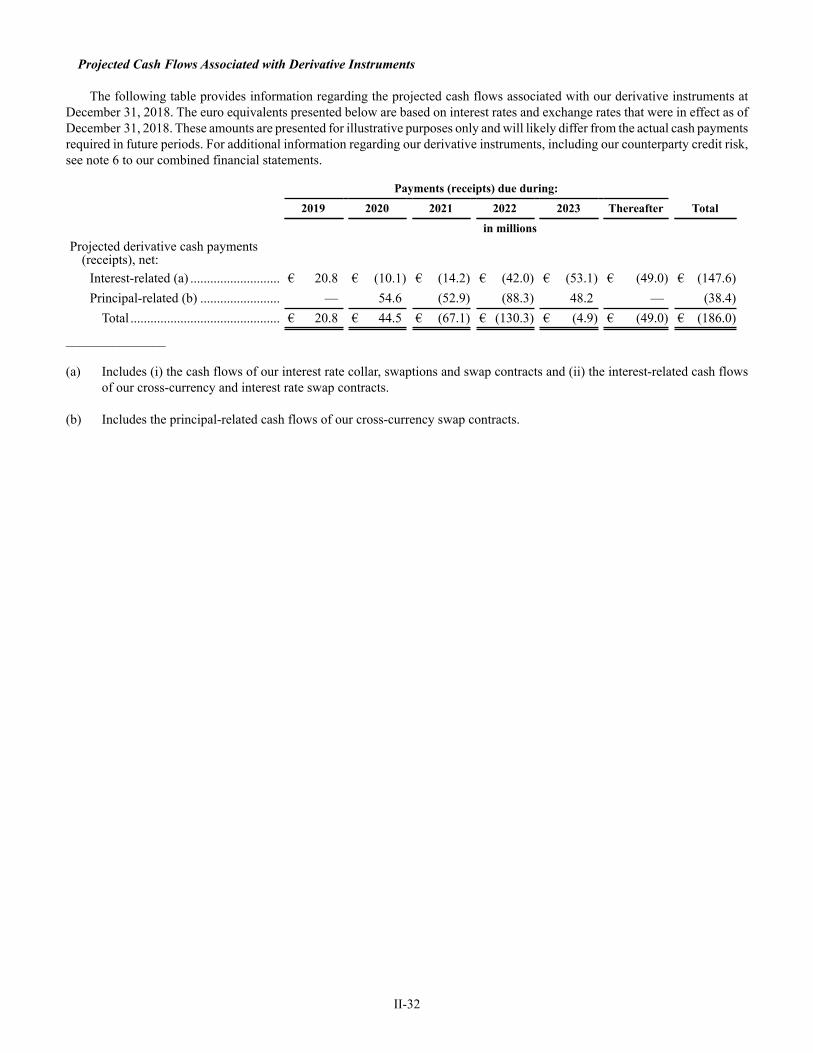
II-32
Projected Cash Flows Associated with Derivative Instruments
The following table provides information regarding the projected cash flows associated with our derivative instruments at
December 31, 2018. The euro equivalents presented below are based on interest rates and exchange rates that were in effect as of
December 31, 2018. These amounts are presented for illustrative purposes only and will likely differ from the actual cash payments
required in future periods. For additional information regarding our derivative instruments, including our counterparty credit risk,
see note 6 to our combined financial statements.
Payments (receipts) due during:
Total 2019 2020 2021 2022 2023 Thereafter
in millions
Projected derivative cash payments(receipts), net:
Interest-related (a) ........................... € 20.8 € (10.1) € (14.2) € (42.0) € (53.1) € (49.0) € (147.6)
Principal-related (b) ........................ — 54.6 (52.9) (88.3) 48.2 — (38.4)
Total ............................................. € 20.8 € 44.5 € (67.1) € (130.3) € (4.9) € (49.0) € (186.0)
_______________
(a) Includes (i) the cash flows of our interest rate collar, swaptions and swap contracts and (ii) the interest-related cash flows
of our cross-currency and interest rate swap contracts.
(b) Includes the principal-related cash flows of our cross-currency swap contracts.
II-33
Critical Accounting Policies, Judgments and Estimates
In connection with the preparation of our combined financial statements, we make estimates and assumptions that affect the
reported amounts of assets and liabilities, revenue and expenses and related disclosure of contingent assets and liabilities. Critical
accounting policies are defined as those policies that are reflective of significant judgments, estimates and uncertainties, which
would potentially result in materially different results under different assumptions and conditions. We believe the following
accounting policies are critical in the preparation of our combined financial statements because of the judgment necessary to
account for these matters and the significant estimates involved, which are susceptible to change:
• Impairment of property and equipment and intangible assets (including goodwill);
• Costs associated with construction and installation activities;
• Fair value measurements; and
• Income tax accounting.
For additional information concerning our significant accounting policies, see note 3 to our combined financial statements.
Impairment of Property and Equipment and Intangible Assets
Carrying Value. The aggregate carrying value of our property and equipment and intangible assets (including goodwill) that
was held for use comprised 79% of the total assets of our continuing operations at December 31, 2018.
When circumstances warrant, we review the carrying amounts of our property and equipment and our intangible assets (other
than goodwill) to determine whether such carrying amounts continue to be recoverable. Such changes in circumstance may include
(i) an expectation of a sale or disposal of a long-lived asset or asset group, (ii) adverse changes in market or competitive conditions,
(iii) an adverse change in legal factors or business climate in the markets in which we operate and (iv) operating or cash flow
losses. For purposes of impairment testing, long-lived assets are grouped at the lowest level for which cash flows are largely
independent of other assets and liabilities, generally at or below the reporting unit level (see below). If the carrying amount of the
asset or asset group is greater than the expected undiscounted cash flows to be generated by such asset or asset group, an impairment
adjustment is recognized. Such adjustment is measured by the amount that the carrying value of such asset or asset group exceeds
its fair value. We generally measure fair value by considering (a) sale prices for similar assets, (b) discounted estimated future
cash flows using an appropriate discount rate and/or (c) estimated replacement cost. Assets to be disposed of are recorded at the
lower of their carrying amount or fair value less costs to sell.
We evaluate goodwill for impairment at least annually on October 1 and whenever facts and circumstances indicate that the
carrying amount of goodwill may not be recoverable. For impairment evaluations, we first make a qualitative assessment to
determine if the goodwill may be impaired. If it is more-likely-than-not that a reporting unit’s fair value is less than its carrying
value, we then compare the fair value of the reporting unit to its respective carrying amount. Any excess of the carrying amount
over the fair value would be charged to operations as an impairment loss. A reporting unit is an operating segment or one level
below an operating segment (referred to as a “component”). If the carrying value of a reporting unit were to exceed its fair value,
we would then compare the implied fair value of the reporting unit’s goodwill to its carrying amount, and any excess of the carrying
amount over the fair value would be charged to operations as an impairment loss.
When required, considerable management judgment is necessary to estimate the fair value of reporting units and underlying
long-lived assets. We typically determine fair value using an income-based approach (discounted cash flows) based on assumptions
in our long-range business plans and, in some cases, a combination of an income-based approach and a market-based approach.
With respect to our discounted cash flow analysis used in the income-based approach, the timing and amount of future cash flows
under these business plans require estimates of, among other items, subscriber growth and retention rates, rates charged per product,
expected gross margins and Segment OCF margins and expected property and equipment additions. The development of these
cash flows, and the discount rate applied to the cash flows, is subject to inherent uncertainties, and actual results could vary
significantly from such estimates. Our determination of the discount rate is based on a weighted average cost of capital approach,
which uses a market participant’s cost of equity and after-tax cost of debt and reflects the risks inherent in the cash flows. Based
on the results of our 2018 qualitative assessment of our reporting unit carrying values, we determined that it was more-likely-than-
not that fair value exceeded carrying value for all of our reporting units.
During the three years ended December 31, 2018, we did not record any significant impairment charges with respect to our
property and equipment and intangible assets. For additional information regarding our long-lived assets, see note 8 to our combined
financial statements.
II-34
If, among other factors, (i) our enterprise value or Liberty Global’s equity values were to decline or (ii) the adverse impacts
of economic, competitive, regulatory or other factors were to cause our results of operations or cash flows to be worse than
anticipated, we could conclude in future periods that impairment charges are required in order to reduce the carrying values of our
goodwill and, to a lesser extent, other long-lived assets. Any such impairment charges could be significant.
Costs Associated with Construction and Installation Activities
We capitalize costs associated with the construction of new cable and mobile transmission and distribution facilities and the
installation of new cable services. Installation activities that are capitalized include (i) the initial connection (or drop) from our
cable system to a customer location, (ii) the replacement of a drop and (iii) the installation of equipment for additional services,
such as digital cable, telephone or broadband internet service. The costs of other customer-facing activities, such as reconnecting
customer locations where a drop already exists, disconnecting customer locations and repairing or maintaining drops, are expensed
as incurred.
The nature and amount of labor and other costs to be capitalized with respect to construction and installation activities involves
significant judgment. In addition to direct external and internal labor and materials, we also capitalize other costs directly attributable
to our construction and installation activities, including dispatch costs, quality-control costs, vehicle-related costs and certain
warehouse-related costs. The capitalization of these costs is based on time sheets, time studies, standard costs, call tracking systems
and other verifiable means that directly link the costs incurred with the applicable capitalizable activity. We continuously monitor
the appropriateness of our capitalization policies and update the policies when necessary to respond to changes in facts and
circumstances, such as the development of new products and services and changes in the manner that installations or construction
activities are performed.
Fair Value Measurements
U.S. GAAP provides guidance with respect to the recurring and nonrecurring fair value measurements and for a fair value
hierarchy that prioritizes the inputs to valuation techniques used to measure fair value into three broad levels. Level 1 inputs are
quoted market prices in active markets for identical assets or liabilities that the reporting entity has the ability to access at the
measurement date. Level 2 inputs are inputs other than quoted market prices included within Level 1 that are observable for the
asset or liability, either directly or indirectly. Level 3 inputs are unobservable inputs for the asset or liability.
Recurring Valuations. We perform recurring fair value measurements with respect to our derivative instruments. We use cash
flow valuation models to determine the fair values of our interest rate and foreign currency derivative instruments. For a detailed
discussion of the inputs we use to determine the fair value of our derivative instruments, see note 7 to our combined financial
statements. See also note 6 to our combined financial statements for information concerning our derivative instruments.
Changes in the fair values of our derivative instruments have had, and we believe will continue to have, a significant and
volatile impact on our results of operations. During 2018, 2017 and 2016, we recognized net gains (losses) of €155.0 million,
(€165.2 million) and (€28.9 million), respectively, attributable to changes in the fair values of our derivative instruments.
As further described in note 7 to our combined financial statements, actual amounts received or paid upon the settlement or
disposition of our derivative instruments may differ materially from the recorded fair values at December 31, 2018.
Nonrecurring Valuations. Our nonrecurring valuations are primarily associated with (i) the application of acquisition
accounting and (ii) impairment assessments, both of which require that we make fair value determinations as of the applicable
valuation date. In making these determinations, we are required to make estimates and assumptions that affect the recorded amounts,
including, but not limited to, expected future cash flows, market comparables and discount rates, remaining useful lives of long-
lived assets, replacement or reproduction costs of property and equipment and the amounts to be recovered in future periods from
acquired net operating losses and other deferred tax assets. To assist us in making these fair value determinations, we may engage
third-party valuation specialists. Our estimates in this area impact, among other items, the amount of depreciation and amortization,
impairment charges and income tax expense or benefit that we report. Our estimates of fair value are based upon assumptions we
believe to be reasonable, but which are inherently uncertain. A significant portion of our long-lived assets were initially recorded
through the application of acquisition accounting and all of our long-lived assets are subject to impairment assessments. For
additional information, see notes 5, 7 and 8 to our combined financial statements.

II-35
Income Tax Accounting
We are required to estimate the amount of tax payable or refundable for the current year and the deferred tax assets and
liabilities for the future tax consequences attributable to differences between the financial statement carrying amounts and income
tax basis of assets and liabilities and the expected benefits of utilizing net operating loss and tax credit carryforwards, using enacted
tax rates in effect for each taxing jurisdiction in which we operate for the year in which those temporary differences are expected
to be recovered or settled. This process requires our management to make assessments regarding the timing and probability of the
ultimate tax impact of such items.
Net deferred tax assets are reduced by a valuation allowance if we believe it more-likely-than-not such net deferred tax assets
will not be realized. Establishing or reducing a tax valuation allowance requires us to make assessments about the timing of future
events, including the probability of expected future taxable income and available tax planning strategies. At December 31, 2018,
the aggregate valuation allowance provided against deferred tax assets was €1,706.5 million. The actual amount of deferred income
tax benefits realized in future periods will likely differ from the net deferred tax assets reflected in our December 31, 2018 combined
balance sheet due to, among other factors, possible future changes in income tax law or interpretations thereof in the jurisdictions
in which we operate and differences between estimated and actual future taxable income. Any such factors could have a material
effect on our current and deferred tax positions as reported in our combined financial statements. A high degree of judgment is
required to assess the impact of possible future outcomes on our current and deferred tax positions.
Tax laws in jurisdictions in which we have a presence are subject to varied interpretation, and many tax positions we take are
subject to significant uncertainty regarding whether the position will be ultimately sustained after review by the relevant tax
authority. We recognize the financial statement effects of a tax position when it is more-likely-than-not, based on technical merits,
that the position will be sustained upon examination. The determination of whether the tax position meets the more-likely-than-
not threshold requires a facts-based judgment using all information available. In a number of cases, we have concluded that the
more-likely-than-not threshold is not met, and accordingly, the amount of tax benefit recognized in our combined financial
statements is different than the amount taken or expected to be taken in our tax returns. As of December 31, 2018, the amount of
unrecognized tax benefits for financial reporting purposes, but taken or expected to be taken in our tax returns, was €3.6 million
all of which would have a favorable impact on our effective income tax rate if ultimately recognized, after considering amounts
that we would expect to be offset by valuation allowances.
We are required to continually assess our tax positions, and the results of tax examinations or changes in judgment can result
in substantial changes to our unrecognized tax benefits.
For additional information concerning our income taxes, see note 10 to our combined financial statements.
Management and Principal Shareholder
The managing director of UPC Holding is Liberty Global Management B.V., which is also an indirect subsidiary of Liberty
Global. The managing director of UPC Slovakia Holding I B.V. is Liberty Global Europe Management B.V., which is also an
indirect subsidiary of Liberty Global. The managing directors are authorized to conduct the day to day business of the relevant
entities within the governance of Liberty Global and its subsidiaries.