Embed Size (px)
Citation preview

Energy gained during melting . . . . . . . . . . . . . . . . 80 calories/gram
Energy released during freezing . . . . . . . . . . . . 80 calories/gram
Energy gained during vaporization . . . . . . . . 540 calories/gram
Energy released during condensation . . . . . 540 calories/gram
Density at 3.98°C . . . . . . . . . . . . . . . . . . . . . . . . . . . . 1.00 gram/milliliter
1617
1819
2021
2223
2425
151
23
45
67
89
1011
1213
14cm
RADIOACTIVEISOTOPE DISINTEGRATION HALF-LIFE
(years)
Carbon-14
Potassium-40
Uranium-238
Rubidium-87
C14
K40
U238
Rb87
N14
Pb206
Sr87
5.7 ! 103
1.3 ! 109
4.5 ! 109
4.9 ! 1010
Ar40
Ca40
MATERIAL SPECIFIC HEAT(calories/gram • C°)
Water
Dry airBasaltGraniteIronCopperLead
solidliquidgas{ 0.5
1.00.50.240.200.190.110.090.03
2001 EDITIONThis edition of the Earth Science Reference Tables should be used in theclassroom beginning in the 2000–2001 school year. The first examinationfor which these tables will be used is the January 2001 RegentsExamination in Earth Science.
Specific Heats of Common MaterialsRadioactive Decay Data
Percent deviationfrom accepted value
Eccentricity of an ellipse
Gradient
Density of a substance
deviation (%) = ! 100
eccentricity = distance between focilength of major axis
difference from accepted valueaccepted value
gradient =change in field value
distance
density = massvolume
Rate of change rate of change = change in field valuetime
EQUATIONS
PHYSICAL CONSTANTS
The University of the State of New York • THE STATE EDUCATION DEPARTMENT • Albany, New York 12234 • www.nysed.gov
Earth Science Reference Tables
EURYPTERUS
Properties of Water
New York State Fossil
(Revised November 2006)

2 Earth Science Reference Tables — 2001 Edition (Revised November 2006)
TUG
HIL
LP
LATE
AU
THE
CAT
SK
ILLS
ALL
EG
HE
NY
PLA
TEAU
LAK
EE
RIE
LAK
E O
NTA
RIO
AD
IRO
ND
AC
K
MO
UN
TAIN
S
ST.L
AWRE
NCE
LOW
LAND
S
ER
IE–O
NTA
RIO
LO
WLA
ND
S(P
LAIN
S)
GR
EN
VIL
LE P
RO
VIN
CE
(HIG
HLA
ND
S)
NEWENGLAND P
ROVINCE
(HIG
HLANDS)
INTE
RIO
R L
OW
LAN
DS
TACONIC MOUNTAINS
NEWARK
LOWLANDS
HU
DS
ON
HIG
HLA
ND
S
MA
NH
ATTA
N P
RO
NG
CHAMPLAINLOWLANDS
Gen
eral
ized
Lan
dsca
pe R
egio
ns o
f N
ew Y
ork
Stat
e
APPALACHIAN
PLATE
AU(U
PLAN
DS)
ATLA
NTIC
CO
AS
TAL
PLA
IN
HUDSON–MOHAWKLOWLANDS
KEY
Maj
or G
eogr
aphi
c P
rovi
nce
Bou
ndar
y
Land
scap
e R
egio
n B
ound
ary
Sta
te B
ound
ary
Inte
rnat
iona
l Bou
ndar
y
N

N
Earth Science Reference Tables — 2001 Edition (Revised November 2006) 3
Gen
eral
ized
Bed
rock
Geo
logy
of
New
Yor
k St
ate
mod
ified
from
GEO
LOG
ICA
LSU
RVEY
NEW
YO
RK
STA
TEM
USE
UM
1989
NiagaraRiver
GE
OLO
GIC
AL
PE
RIO
DS
AN
D E
RA
S IN
NE
WYO
RK
CRET
ACEO
US, T
ERTI
ARY,
PLE
ISTO
CENE
(Epo
ch) w
eakly
con
solid
ated
to u
ncon
solid
ated
gra
vels,
san
ds, a
nd c
lays
LATE
TRI
ASSI
Can
dEA
RLY
JURA
SSIC
con
glom
erat
es, r
ed s
ands
tone
s, re
d sh
ales
, and
dia
base
(in
Palis
ades
Sill)
PENN
SYLV
ANIA
Nan
d M
ISSI
SSIP
PIAN
con
glom
erat
es, s
ands
tone
s, a
nd s
hale
sDE
VONI
ANlim
esto
nes,
sha
les,
san
dsto
nes,
and
con
glom
erat
esSI
LURI
ANSi
luria
n al
so c
onta
ins
salt,
gyp
sum
, and
hem
atite
.
ORD
OVIC
IAN
limes
tone
s, s
hale
s, s
ands
tone
s, a
nd d
olos
tone
sCA
MBR
IAN
CAM
BRIA
N an
d EA
RLY
ORD
OVIC
IAN
sand
ston
es a
nd d
olos
tone
s M
oder
atel
y to
inte
nsel
y m
etam
orph
osed
eas
t of t
he H
udso
n Ri
ver.
CAM
BRIA
N an
dO
RDOV
ICIA
N (u
ndiff
eren
tiate
d) q
uartz
ites,
dol
osto
nes,
mar
bles
, and
sch
ists
Inte
nsel
y m
etam
orph
osed
;inc
lude
s po
rtion
s of
the
Taco
nic
Sequ
ence
and
Cor
tland
t Com
plex
.TA
CONI
CSE
QUE
NCE
sand
ston
es, s
hale
s, a
nd s
late
sSl
ight
ly to
inte
nsel
y m
etam
orph
osed
rock
s of
CAM
BRIA
N th
roug
hM
IDDL
EO
RDOV
ICIA
N ag
es.
MID
DLE
PROT
ERO
ZOIC
gne
isses
, qua
rtzite
s, a
nd m
arbl
esLi
nes
are
gene
raliz
ed s
truct
ure
trend
s.In
tens
ely
Met
amor
phos
ed R
ocks
MID
DLE
PROT
ERO
ZOIC
ano
rthos
itic ro
cks
(regi
onal
met
amor
phism
abo
ut 1
,000
m.y.
a.)
} }
}
} }Dom
inan
tlySe
dim
enta
ryO
rigin
Dom
inan
tlyM
etam
orph
osed
Rock
s
LONG
ISLA
ND
SO
UN
D
4 Earth Science Reference Tables — 2001 Edition (Revised November 2006)
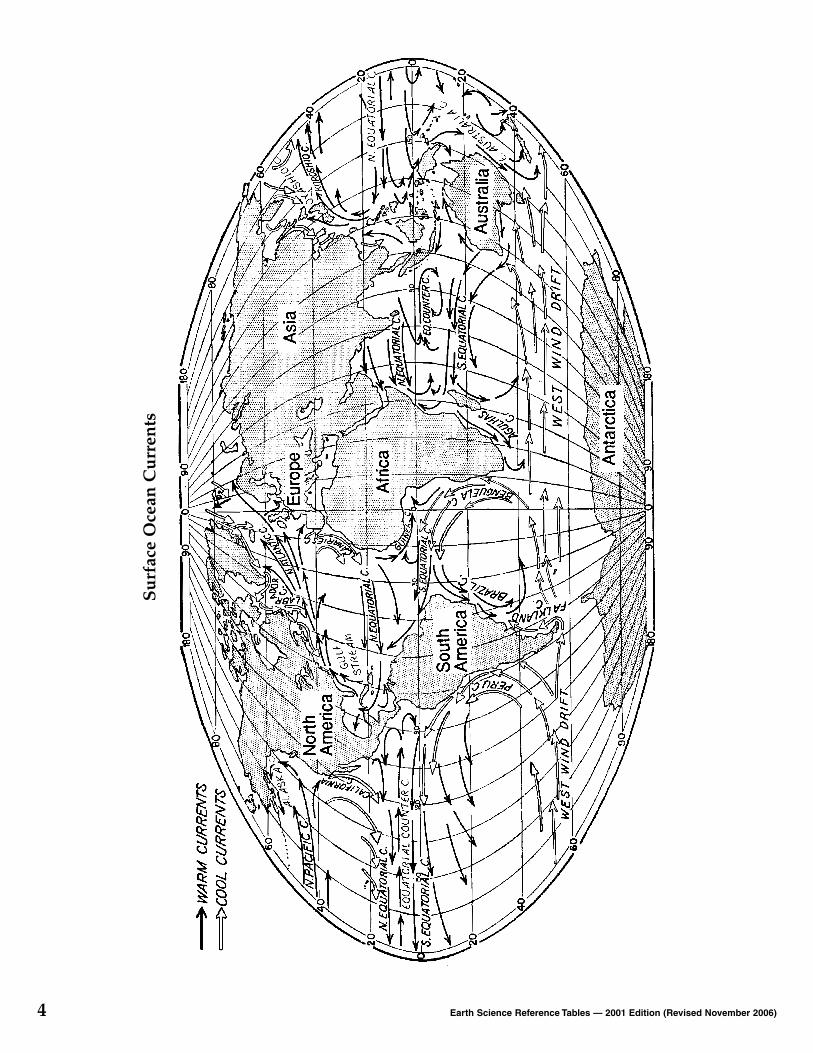
Surf
ace
Oce
an C
urre
nts

Earth Science Reference Tables — 2001 Edition (Revised November 2006) 5
Tect
onic
Pla
tes
Phil
ippi
nePl
ate
Fiji
Plat
e
Mid-Atlantic Ridge
Sand
wic
hPl
ate
KE
Y:
Div
erge
nt P
late
Bou
ndar
y (u
sual
ly b
roke
n by
tran
sfor
mfa
ults
alo
ng m
id-o
cean
rid
ges)
Con
verg
ent P
late
Bou
ndar
y(S
ubdu
ctio
n Zo
ne)
Tran
sfor
m P
late
Bou
ndar
y(T
rans
form
Fau
lt)C
ompl
ex o
r U
ncer
tain
P
late
Bou
ndar
yR
elat
ive
Mot
ion
at P
late
Bou
ndar
y
NO
TE:N
ot a
ll pl
ates
and
bou
ndar
ies
are
show
n.
Man
tleH
ot S
pot
Mid
-Oce
an R
idge
over
ridin
gpl
ate
subd
uctin
gpl
ate

6 Earth Science Reference Tables — 2001 Edition (Revised November 2006)
Cementation
BurialDeposition
Compaction
Wea
ther
ing
&E
rosi
on
Metam
orphism
SEDIMENTARYROCK
Weathering & Erosion
Weathering & Erosion
Melting
METAMORPHICROCK
IGNEOUSROCK
Melting
(Upl
ift)
Solidific
ation
Heat and/or Pressure
(Uplift)
Melting
(Uplift)
Heatand/or P
ressure
Metamorphism
Erosion
MAGMA
SEDIMENTS
0 100 200 300 400 500 600 700 800
100.0
10.0
1.0
0.1
0.01
0.001
0.0001
0.00001
STREAM VELOCITY (cm/sec)
PAR
TIC
LE D
IAM
ET
ER
(cm
)
*This generalized graph shows the water velocity needed tomaintain, but not start, movement. Variations occur due todifferences in particle density and shape.
BOULDERSCOBBLES
PEBBLES
SAND
SILT
CLAY
25.6 cm6.4 cm
0.2 cm
0.006 cm
0.0004 cm
Rock Cycle in Earth’s Crust
Scheme for Igneous Rock Identification
Relationship of TransportedParticle Size to Water Velocity
Pyroxene(green)
Amphibole(black)
Biotite(black)
Potassiumfeldspar
(pink to white)
(Rel
ativ
e by
Vol
ume)
MIN
ER
AL
CO
MP
OS
ITIO
N
Quartz(clear towhite)
CH
AR
AC
TE
RIS
TIC
S
MAFIC (Fe, Mg)
HIGH
DARK
FELSIC (Al)
LOW
LIGHT
GRAINSIZE
TEXTURE
Pumice
INT
RU
SIV
E(P
luto
nic)
EX
TR
US
IVE
(Vol
cani
c)
EN
VIR
ON
ME
NT
OF
FO
RM
ATIO
N
Plagioclase feldspar(white to gray)
Olivine(green)
COMPOSITION
DENSITY
COLOR
100%
75%
50%
25%
0%
100%
75%
50%
25%
0%
IGN
EO
US
RO
CK
S
Non
-cr
ysta
lline
GlassyBasaltic GlassObsidian
(usually appears black)
less
than
1 m
m FineBasaltAndesiteRhyolite
1 m
mto
10
mm
CoarsePeri-dotiteGabbroDioriteGranite
Pegmatite
10 m
mor
larg
er VeryCoarse
Scoria
Vesicular(gas
pockets)D
unite
Non-vesicular
Non-vesicular
Vesicular Basaltic GlassVesicular BasaltVesicular Rhyolite Vesicular
Andesite

Earth Science Reference Tables — 2001 Edition (Revised November 2006) 7
INORGANIC LAND-DERIVED SEDIMENTARY ROCKSCOMPOSITIONTEXTURE GRAIN SIZE COMMENTS ROCK NAME MAP SYMBOL
Rounded fragments
Angular fragmentsMostlyquartz,feldspar, andclay minerals;may containfragments ofother rocksand minerals
Pebbles, cobbles,and/or bouldersembedded in sand,silt, and/or clay
Clastic(fragmental)
Very fine grain
Compact; may spliteasily
Conglomerate
Breccia
CHEMICALLY AND/OR ORGANICALLY FORMED SEDIMENTARY ROCKS
Crystalline
Halite
Gypsum
Dolomite
Calcite
Carbon
Crystals fromchemicalprecipitatesand evaporites
Rock Salt
Rock Gypsum
Dolostone
Limestone
Coal
. . . . .. . . .
Sand(0.2 to 0.006 cm)
Silt(0.006 to 0.0004 cm)
Clay(less than 0.0004 cm)
Sandstone
Siltstone
Shale
Fine to coarse
COMPOSITIONTEXTURE GRAIN SIZE COMMENTS ROCK NAME MAP SYMBOL
Varied
Varied
Varied
Microscopic to coarse
Varied
Cemented shellfragments or precipitates
of biologic origin
From plant remains
. . . . .. . . .
Bioclastic
FO
LIAT
ED
NO
NF
OLI
ATE
D
Fine
Fineto
medium
Mediumto
coarse
Regional Low-grademetamorphism of shale
Platy mica crystals visible frommetamorphism of clay orfeldspars
High-grade metamorphism;some mica changed to feldspar;segregated by mineral typeinto bands
Slate
Schist
Gneiss
Metamorphism of quartzsandstone
Metamorphism oflimestone or dolostone
Pebbles may be distortedor stretched
MIC
AQ
UA
RTZ
FELD
SPA
RA
MP
HIB
OLE
GA
RN
ET
PY
RO
XE
NE
COMPOSITIONTEXTUREGRAINSIZE COMMENTS ROCK NAME
TYPE OFMETAMORPHISM
Metaconglomerate
Quartzite
Marble
Coarse
Fineto
coarse
Quartz
Calcite and/ordolomite
Various mineralsin particlesand matrix
(Heat andpressureincreasewith depth)M
INE
RA
L A
LIG
NM
EN
TB
AN
D-
ING
Contact(Heat)
Various rocks changed byheat from nearbymagma/lava
HornfelsVariableFine
Regional
or
Contact
MAP SYMBOL
Foliation surfaces shiny frommicroscopic mica crystals Phyllite
Scheme for Metamorphic Rock Identification
Scheme for Sedimentary Rock Identification

GEOLOGIC HISTORY OF NEW YORK STATE
Advance and retreat of last continental iceUplift of Adirondack region
Sands and shales underlying Long Island and StatenIsland deposited on margin of Atlantic Ocean
Development of passive continental margin
Initial opening of Atlantic OceanNorth America and Africa separate
Intrusion of Palisades sillPangea begins to break up
Extensive erosion
Appalachian (Alleghanian) Orogenycaused by collision of North Americaand Africa along transform margin,forming Pangea
Catskill Delta formsErosion of Acadian Mountains
Acadian Orogeny caused by collision ofNorth America and Avalon and closingof remaining part of Iapetus Ocean
Salt and gypsum deposited in evaporite basins
Erosion of Taconic Mountains; Queenston Delta forms
Taconian Orogeny caused by closing ofwestern part of Iapetus Ocean and collision between North America andvolcanic island arc
Iapetus passive margin forms
Rifting and initial opening of Iapetus OceanErosion of Grenville Mountains
Grenville Orogeny: Ancestral AdirondackMtns. and Hudson Highlands formed
EraEon
PH
AN
ER
O-
ZOIC
PR
EC
AM
BR
IA
NA
RC
HE
AN
PR
OT
ER
OZ
OI
C
LATE
LATE
MIDDLE
MIDDLE
EARLY
EARLY
0
500
1000
2000
3000
4000
4600
Millions of years ago
CENOZOIC
MESOZOIC
PALEOZOIC
Oldest multi-cellularlife
QUATERNARY
NEOGENE
PALEOGENET
ER
TIA
RY
CRETACEOUS
JURASSIC
TRIASSIC
PERMIAN
CA
RB
ON
IF-
ER
OU
S
DEVONIAN
Period Epoch Life on Earth
SILURIAN
ORDOVICIAN
CAMBRIAN
PLEISTOCENEPLIOCENEMIOCENE
OLIGOCENEEOCENE
PALEOCENE
LATE
EARLY
LATE
MIDDLE
EARLY
LATEMIDDLEEARLY
LATE
EARLY
LATE
MIDDLE
EARLY
LATE
EARLY
LATE
MIDDLE
EARLY
LATE
MIDDLE
EARLY
24
33.754.8
544
580
490
443
418
362
323
290
206
142
1300
Millions of years ago
RockRecord
inNYS
Time Distribution of Fossils(Including Important Fossils of New York)
TectonicEvents
AffectingNortheast
NorthAmerica
Rif
ting
Rif
ting
Pass
ive
Mar
gin Su
bduc
tion
Con
tine
ntal
Col
lisio
n
Tra
nsfo
rm C
ollis
ion
Pass
ive
Mar
gin
Important GeologicEvents in New York
Inferred Position ofEarth’s Landmasses
TERTIARY 59 millionyears
ago
CRETACEOUS 119 millionyears
ago
TRIASSIC 232 millionyears
ago
ORDOVICIAN 458 millionyears
ago
96-001TN (rev) 11/2006
PENNSYLVANIAN
MISSISSIPPIAN
First appearanceof sexually
8 Earth Science Reference Tables— 2001 Edition (Revised November 2006) Earth Science Reference Tables— 2001 Edition (Revised November 2006) 9
LATE
EARLY
LATE
EARLY
BR
AC
HIO
PO
DS
GA
STR
OP
OD
S
CO
RA
LS
CR
INO
IDS
Earth’s first forest
AM
MO
NO
IDS
VA
SCU
LA
RP
LA
NT
S
EU
RY
PT
ER
IDS
GR
AP
TO
LIT
ES
TR
ILO
BIT
ES
PL
AC
OD
ER
MF
ISH
BIR
DS
MA
MM
AL
S
DIN
OSA
UR
S
NA
UT
ILO
IDS
A
I
H
B
C F G
L
A B C D E F G
O S
E
D
J
K
N
P
T
U
VX Z
W
Y
Q R
M
Elliptocephala
(Fossils not drawn to scale)
CryptolithusPhacops
ValcourocerasHexameroceras Manticoceras
Centroceras
H I J
EucalyptocrinusCtenocrinus
Tetragraptus
K
Dicellograptus EurypterusStylonurus
Mastodont
O
BelugaWhale
P
Cooksonia
R
Bothriolepis
S
Maclurites EospiriferMucrospiriferPlatyceras
Q
Aneurophyton
T
CondorNaples Tree
Cystiphyllum
U
Lichenaria
V W Y ZX
Pleurodictyum
L
Coelophysis
NM
HOLOCENE
65
251
1.6
5.3
0.010
Earth’s firstcoral reef
Lettered circles indicate the approximate time of existence of a specificindex fossil (e.g. Fossil lived at the end of the Early Cambrian).
DEVONIAN/MISSISSIPPIAN 362 millionyears
ago
A
Oldest known rocks
Geochemical evidencefor oldest biologicalfixing of carbon
Oldest microfossils
Transition toatmospherecontainingoxygen
reproducingorganisms
Estimated time of originof Earth and solar system
Humans, mastodonts, mammothsLarge carnivoresAbundant grazing mammalsEarliest grassesLarge running mammalsMany modern groups of mammals
Extinction of dinosaurs and ammonoidsEarliest placental mammals
Climax of dinosaurs and ammonoids
Earliest flowering plantsDecline of brachiopodsDiverse bony fishes
Earliest birds Abundant dinosaurs and ammonoids
Modern coral groups appearEarliest dinosaurs and mammals with
abundant cycads and conifersExtinction of many kinds of marine
animals, including trilobitesFirst mammal-like reptiles
Earliest reptilesExtensive coal-forming forests
Abundant sharks and amphibiansLarge and numerous scale trees
and seed ferns
Earliest amphibians, ammonoids, sharksExtinction of armored fish, other
fish abundant
Earliest insectsEarliest land plants and animalsPeak development of eurypterids
Invertebrates dominant– mollusks become abundant
Diverse coral and echinoderms
Graptolites abundantEarliest fishAlgal reefsBurgess shale fauna
Earliest chordates, diverse trilobitesEarliest trilobitesEarliest marine animals with shells
Ediacaran fauna
Soft-bodied organisms
Stromatolites

10 Earth Science Reference Tables — 2001 Edition (Revised November 2006)
4
3
2
1
0
PR
ES
SU
RE
(mill
ions
of a
tmos
pher
es)
MID-ATLANTIC
RIDGE
LITHOSPHERE
CR
UST
RIGID
MAN
TLE
C A S C A D E S
T R E N C H
12.7–13.0
9.9–12.1
3.3–5.5
3.0 oceanic crust2.7 continental crust
DENSITY (g/cm3)
0 2000 4000 6000
5000
4000
3000
2000
1000
0
DEPTH (km)
TE
MP
ER
ATU
RE
(°C
)
1000 3000 5000
6000MANTLE
ATLANTIC OCEAN
NO
RTH
AMER
ICA
MOHO
INN
ER
CORE
IRO
N&
NICKELO
UTE
RCORE
(IRON?)
AST
HEN
OSP
HERE(P
LASTICMANTLE)
EARTH’S CENTER
STI
FFER
MANTLE
MELTIN
G POIN
T
??
?
?????
?
PARTIAL MELTING OFULTRAMAFIC MANTLE
ME
LTIN
G P
OIN
T
ACTUAL TEMPERATURE
OC
EA
NPA
CIF
IC
Inferred Properties of Earth’s Interior
24
23
22
21
20
19
18
17
16
15
14
13
12
11
10
9
8
7
6
5
4
3
2
1
1 2 3 4 5 6 7 8EPICENTER DISTANCE (!103 km)
TR
AVE
L T
IME
(m
inut
es)
P
9 10
S
Earth Science Reference Tables — 2001 Edition (Revised November 2006) 11
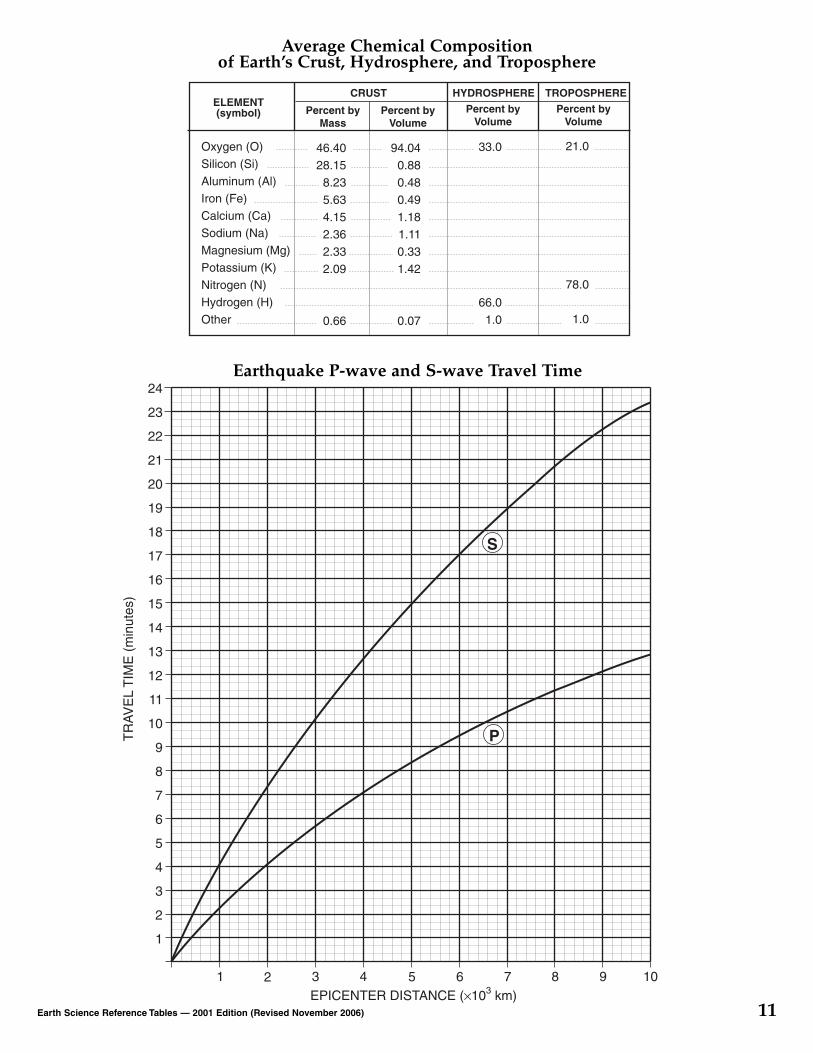
Average Chemical Compositionof Earth’s Crust, Hydrosphere, and Troposphere
ELEMENT(symbol)
CRUST HYDROSPHERE TROPOSPHERE
Oxygen (O)Silicon (Si)Aluminum (Al)Iron (Fe)Calcium (Ca)Sodium (Na)Magnesium (Mg)Potassium (K)Nitrogen (N)Hydrogen (H)Other
46.4028.15
8.235.634.152.362.332.09
0.66
Percent byMass
Percent byVolume
Percent byVolume
Percent byVolume
94.040.880.480.491.181.110.331.42
0.07
33.0
66.01.0
21.0
78.0
1.0
Earthquake P-wave and S-wave Travel Time
1– 33– 28– 24– 21–18–14–12–10– 7– 5– 3–11468
10121416192123252729
2
– 36– 28– 22–18–14–12– 8– 6– 3–11368
111315171921232527
0– 20–18–16–14–12–10– 8– 6– 4– 2
02468
1012141618202224262830
– 20–18–16–14–12–10– 8– 6– 4– 202468
1012141618202224262830
3
– 29– 22–17–13– 9– 6– 4–11469
1113151720222426
4
– 29– 20–15–11– 7– 4– 2
1469
11141618202224
5
– 24–17–11– 7– 5– 2
1479
121416182123
6
–19–13– 9– 5– 2
147
101214171921
7
– 21–14– 9– 5– 2
147
1012151719
8
–14– 9– 5–1248
10131618
9
– 28–16–10– 6– 2
258
111416
10
–17–10– 5–2369
1114
11
–17–10– 5–1269
12
12
–19–10– 5–137
10
13
–19–10– 5
048
14
–19–10– 4
15
15
–18– 9– 3
1
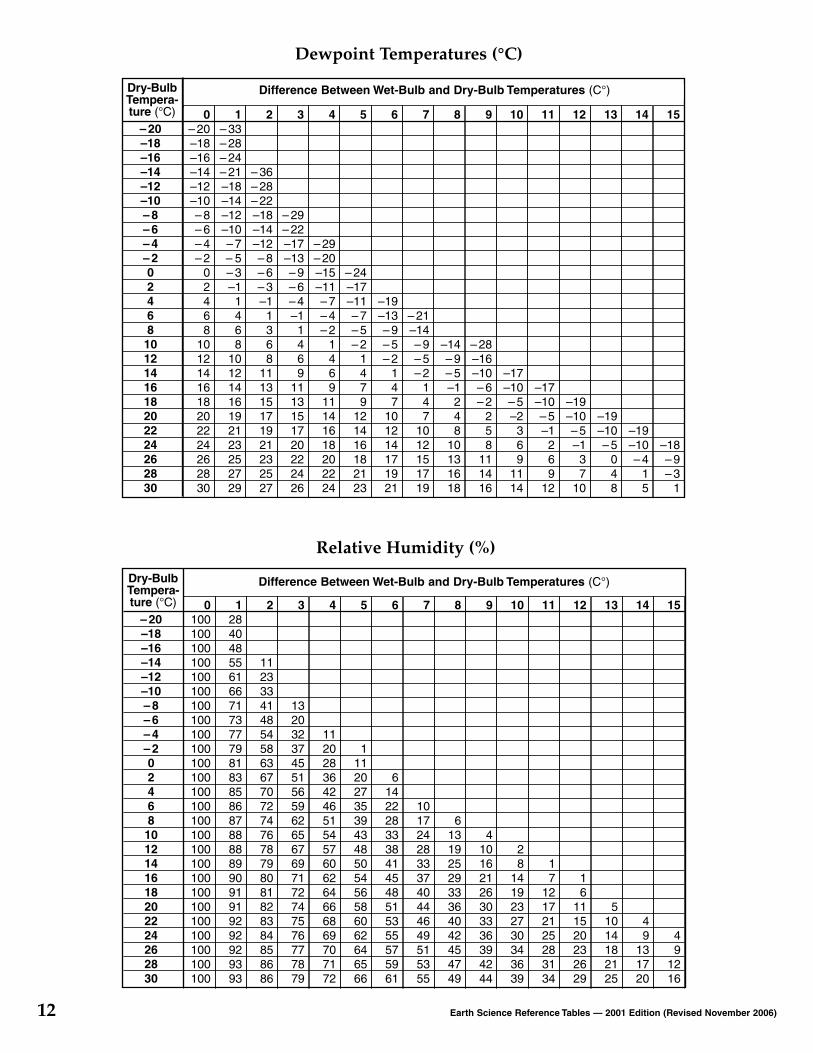
Difference Between Wet-Bulb and Dry-Bulb Temperatures (C°)
Difference Between Wet-Bulb and Dry-Bulb Temperatures (C°)Dry-BulbTempera-ture (°C)
12840485561667173777981838586878888899091919292929393
2
1123334148545863677072747678798081828384858686
0100100100100100100100100100100100100100100100100100100100100100100100100100100
– 20–18–16–14–12–10– 8– 6– 4– 2024681012141618202224262830
3
1320323745515659626567697172747576777879
4
112028364246515457606264666869707172
5
111202735394348505456586062646566
6
61422283338414548515355575961
7
10172428333740444649515355
8
61319252933364042454749
9
410162126303336394244
10
28
1419232730343639
11
17
12172125283134
12
16
111520232629
13
51014182125
14
49
131720
15
49
1216
Dry-BulbTempera-ture (°C)
12 Earth Science Reference Tables — 2001 Edition (Revised November 2006)
Dewpoint Temperatures (°C)
Relative Humidity (%)

Weather Map Symbols
Earth Science Reference Tables — 2001 Edition (Revised November 2006) 13
110
100
90
80
70
60
50
40
30
20
10
0
–10
–20
–30
–40
–50
220
200
180
160
140
120
100
80
60
40
20
0
–20
–40
–60
380
370
360
350
340
330
320
310
300
290
280
270
260
250
240
230
220
Fahrenheit Celsius Kelvin
Water boils
Human bodytemperature
Roomtemperature
Ice melts
Temperature
196+19/
.25
28
27
!
Amount of cloud cover(approximately 75% covered)
Barometric pressure(1019.6 mb)
Barometric trend(a steady 1.9-mb rise the past 3 hours)
Precipitation(inches past 6 hours)
Wind direction(from the southwest)
Temperature (°F)
Present weather
Visibility (mi)
Dewpoint (°F)
Wind speed
(1 knot = 1.15 mi/hr)
12
whole feather = 10 knotshalf feather = 5 knots
total = 15 knots
Station Model
FreezingRain
Haze
Rain
FogSnow!
Hail RainShowers
Thunder-storms
Drizzle
Sleet!
Smog
SnowShowers
!
Air Masses
cA
cP
cT
mT
mP
continental arctic
continental polar
continental tropical
maritime tropical
maritime polar
Cold
Warm
Stationary
Occluded
Present Weather Front Symbols Hurricane
30.70
30.60
30.50
30.40
30.30
30.20
30.10
30.00
29.90
29.80
29.70
29.60
29.50
29.40
29.30
29.20
29.10
29.00
28.90
28.80
28.70
28.60
28.50
1040.0
1036.0
1032.0
1028.0
1024.0
1020.0
1016.0
1012.0
1008.0
1004.0
1000.0
996.0
992.0
988.0
984.0
980.0
976.0
972.0
968.0
oneatmosphere1013.2 mb
Pressure
millibars inches
14 Earth Science Reference Tables — 2001 Edition (Revised November 2006)
30° N
60° N
60° S
30° S
0°
S.W.WINDS
DRY
DRY
WETN.E.
N.E. WINDS
S.E.WINDS
WET
DRY
WET
DRYS.E.
N.W.WINDS
Polar Front
SubtropicalJet Streams
Tropopause
Polar Front Jet Stream
Polar Front Jet Stream
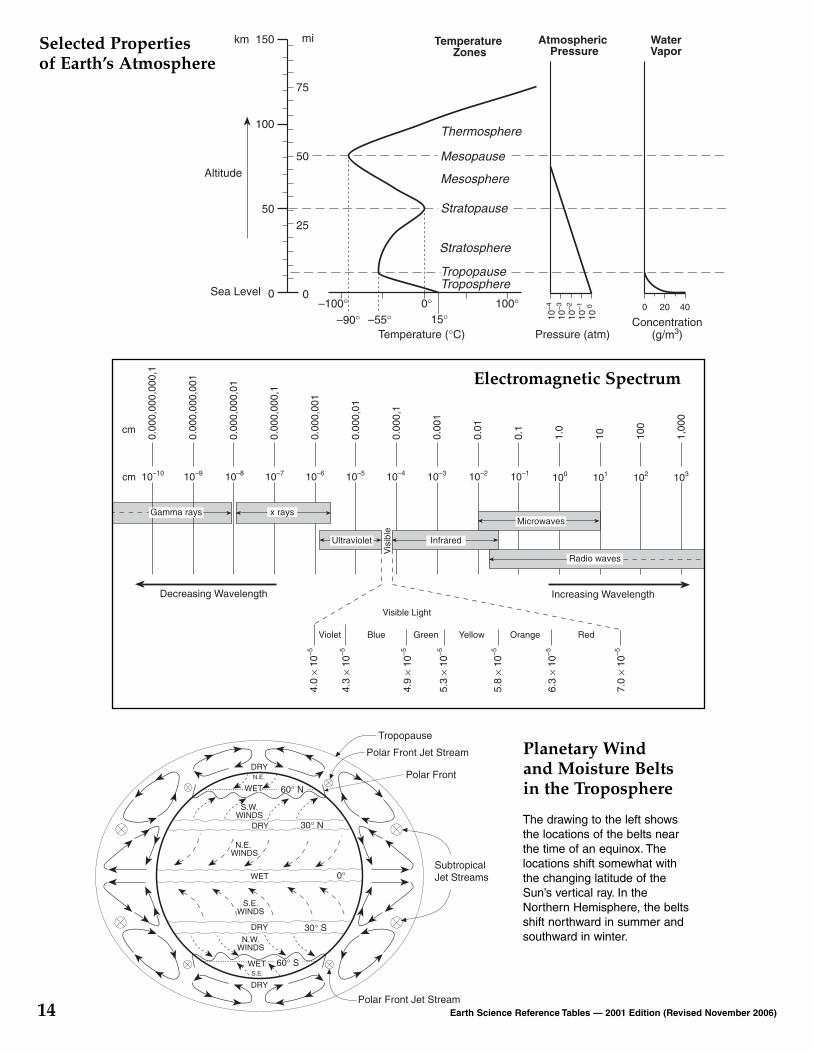
Planetary Wind and Moisture Belts in the Troposphere
km 150
100
50
0
75
50
25
0
mi
Sea Level
Altitude
Temperature Zones
Thermosphere
Mesopause
Mesosphere
Stratopause
Stratosphere
TropopauseTroposphere
Temperature (°C)
–100° 0° 100°–90° –55° 15° 10
–4
10–3
10–2
10–1
10 0
Pressure (atm)
Atmospheric Pressure
0 20 40
Concentration(g/m3)
WaterVapor
Decreasing Wavelength
10010–10
4.0
! 10
–5
10–9 10–8 10–7 10–6 10–5 10–4 10–3 10–2 10–1 101 102 103
0.00
0,00
0,00
0,1
0.00
0,00
0,00
1
0.00
0,00
0,01
0.00
0,00
0,1
0.00
0,00
1
0.00
0,01
0.00
0,1
0.00
1
0.01
0.1
1.0
10 100
1,00
0
cm
cm
Increasing Wavelength
Gamma rays x rays
Ultraviolet Infrared
Vis
ible
Radio waves
Microwaves
Violet Blue Green Yellow Orange Red
Visible Light
4.3
! 10
–5
4.9
! 10
–5
5.3
! 10
–5
5.8
! 10
–5
6.3
! 10
–5
7.0
! 10
–5
Electromagnetic Spectrum
The drawing to the left showsthe locations of the belts nearthe time of an equinox. Thelocations shift somewhat withthe changing latitude of theSun’s vertical ray. In theNorthern Hemisphere, the beltsshift northward in summer andsouthward in winter.
Selected Properties of Earth’s Atmosphere

SUN — — 27 days — 1,392,000 333,000.00 1.4 –
MERCURY 57.9 88 days 59 days 0.206 4,880 0.553 5.4 0
VENUS 108.2 224.7 days 243 days 0.007 12,104 0.815 5.2 0
EARTH 149.6 365.26 days 23 hr 0.017 12,756 1.00 5.5 156 min4 sec
MARS 227.9 687 days 24 hr 0.093 6,787 0.1074 3.9 237 min23 sec
JUPITER 778.3 11.86 years 9 hr 0.048 142,800 317.896 1.3 1650 min30 sec
SATURN 1,427 29.46 years 10 hr 0.056 120,000 95.185 0.7 1814 min
URANUS 2,869 84.0 years 17 hr 0.047 51,800 14.537 1.2 2114 min
NEPTUNE 4,496 164.8 years 16 hr 0.009 49,500 17.151 1.7 8
EARTH’S 149.6 27.3 days 27 days 0.055 3,476 0.0123 3.3 —MOON (0.386 from Earth) 8 hr
Earth Science Reference Tables — 2001 Edition (Revised November 2006) 15
Object Mean Distance from Sun
(millions of km)
Periodof
Revolution
EquatorialDiameter
(km)
Mass(Earth = 1)
Eccentricityof
Orbit
Periodof
Rotation
Density
(g/cm3)
Numberof
Moons
Solar System Data
RedDwarfs
1,000,000
10,000
100
1
0.01
0.000120,000 10,000 5,000 2,500
Red StarsYellow StarsWhite StarsBlue Stars
Temperature (°C)
Lum
inos
ity (R
elat
ive
to th
e S
un)
SmallStars
MassiveStars
BlueSupergiants
Rigel
Supergiants
Betelgeuse
Aldebaran
Red GiantsMain Sequence
Alpha CentauriSun
White Dwarfs
Sirius
Color
+
+
Procyon B+
Barnard’sStar
++
Polaris ++
+
+
Luminosity and Temperature of Stars(Name in italics refers to star shown by a + )
Luminosity is thebrightness of starscompared to thebrightness of ourSun as seen fromthe same distancefrom the observer.

Properties of Common Minerals
HARD- COMMON DISTINGUISHINGLUSTER NESS COLORS CHARACTERISTICS USE(S) MINERAL NAME COMPOSITION*
black streak,greasy feel
very dense (7.6 g/cm3),gray-black streak
attracted by magnet,black streak
green-black streak,cubic crystals
red-brown streak
greasy feel
easily melted,may smell
easily scratchedby fingernail
flexible inthin sheets
cubic cleavage, salty taste
flexible in thin sheets
bubbleswith acid
bubbles with acidwhen powdered
cleaves in4 directions
cleaves in2 directions at 90°
cleaves at56° and 124°
cleaves in2 directions at 90°
cleaves in 2 directions,striations visible
commonly light greenand granular
glassy luster, may formhexagonal crystals
glassy luster, often seen as redgrains in NYS metamorphic rocks
Graphite
Galena
Magnetite
Pyrite
Hematite
Talc
Sulfur
Gypsum
Muscovite Mica
Halite
Biotite Mica
Calcite
Dolomite
Fluorite
Pyroxene(commonly Augite)
Amphiboles(commonly Hornblende)
Potassium Feldspar(Orthoclase)
Plagioclase Feldspar(Na-Ca Feldspar)
Olivine
Quartz
Garnet(commonly Almandine)
silver togray
metallicsilver
black tosilver
brassyyellow
metallic silver orearthy red
white togreen
yellow toamber
white to pink or gray
colorless toyellow
colorless towhite
black todark brown
colorlessor variable
colorlessor variable
colorless orvariable
black todark green
black to dark green
white topink
white to gray
green togray or brown
colorless orvariable
dark redto green
pencil lead,lubricants
ore oflead
ore ofiron
ore ofsulfur
oreof iron
talcum powder,soapstone
vulcanize rubber,sulfuric acid
plaster of parisand drywall
electricalinsulator
food additive,melts ice
electricalinsulator
cement,polarizing prisms
source ofmagnesium
hydrofluoricacid
mineralcollections
mineralcollections
ceramicsand glass
ceramicsand glass
furnace bricksand jewelry
glass, jewelry,and electronics
jewelry andabrasives
16 Earth Science Reference Tables — 2001 Edition (Revised November 2006)DET 633TN
Nonm
etal
lic L
uste
r
*Chemical Symbols: Al = aluminum Cl = chlorine H = hydrogen Na = sodium S = sulfur C = carbon F = fluorine K = potassium O = oxygen Si = siliconCa = calcium Fe = iron Mg = magnesium Pb = lead Ti = titanium
! = dominant form of breakage
C
PbS
Fe3O4
FeS2
Fe2O3
Mg3Si4O10(OH)2
S
CaSO4•2H2O
KAl3Si3O10(OH)2
NaCl
K(Mg,Fe)3AlSi3O10(OH)2
CaCO3
CaMg(CO3)2
CaF2
(Ca,Na) (Mg,Fe,Al)(Si,Al)2O6
CaNa(Mg,Fe)4 (Al,Fe,Ti)3Si6O22(O,OH)2
KAlSi3O8
(Na,Ca)AlSi3O8
(Fe,Mg)2SiO4
SiO2
Fe3Al2Si3O12
1–2
2.5
5.5–6.5
6.5
1–6.5
1
2
2
2–2.5
2.5
2.5–3
3
3.5
4
5–6
5.5
6
6
6.5
7
7
!
!
!
!
!
!
!
!
!
!
!
!
!
!
!
!
!
!
!
!
!
Met
allic
Lus
ter
Eith
er
CLEA
VAG
EFR
ACTU
RE
(Selenite)