Embed Size (px)
Citation preview

The University of Texas at Brownsville
KNOWLEDGE KNOWS NO BOUNDARIES.
STEM Learning Communities End of the Year Report
Sponsored by Title V
Presented by:
Oralia De los Reyes, Ph.D.Director of Title V
Michele Hansen, Ph.D.External Evaluators from IUPUI
The University of Texas at Brownsville
PRESENTATION OVERVIEW
– Project Goals – Program Results by Grant Objectives
– 1) Professional Development– 2) Learning Communities– 3) Integration of Technology
– 4) Intervention for Math Readiness– Conclusions and Implications
BUILDING INFRASTRUCTURE TO:– Offer Professional Development– Institutionalize three High Impact Educational
Practices: Learning Communities, First Year Seminar and Service Learning Components
– Establish a Culture of Evidence– Maximize use of Blackboard Outcomes System

The University of Texas at Brownsville
PROJECT GOALS
• Restructure curricula and academic support to achieve improved SLO’s• Implement a culture of evidence that identifies and
aligns best practices for SLO’s• Study the effects of redesigned curriculum and
assessment measures in STEM learning communities
TARGET POPULATIONS • Students in STEM fields
• Increase the number of students interested in STEM fields
• Increase the success rate of students pursuing STEM fields
• Faculty• Increase the number of faculty who integrate
instructional innovations for improved SLO’s• Increase the use of assessment of SLO’s to guide
curricula improvements
The University of Texas at Brownsville
Title V Objectives I. To centralize a comprehensive faculty development program
to encourage faculty to integrate instructional course innovations for improved learning outcomes
II. To provide structured, integrated learning communities (LCs) for students pursuing STEM fields
III. To integrate the use of technology into course redesign and assessment of student learning outcomes to guide curricular improvements based on evidence.

The University of Texas at Brownsville
Comprehensive Evaluation Plan Designed to Address The Following:
1. Has the centralized, comprehensive faculty development program encouraged faculty to integrate instructional course innovations for improved learning outcomes? (Related to Objective 1)
2. In what ways have the structured, integrated learning communities (LCs) for STEM students and intrusive support interventions made distinguishable impacts on student learning and academic success outcomes? (Related to Objective 2)
3. To what extent have faculty integrated the use of technology into course redesign and assessment of student learning outcomes to guide curricular improvements based on evidence? (Related to Objective 3).
The University of Texas at Brownsville
Summative and Formative Evaluation: • Annual Faculty Survey• Student and Faculty Focus Groups • Student Academic Achievement • Retention and Graduation Rates • Critical Thinking Assessment Test (CAT) • Attitudes Toward Science Assessment Instrument (ATSI) • National Survey of Student Engagement (NSSE)• Course Embedded Assessment - Actual Student Work (papers and
assignments designed to assess critical thinking and communication skills) • Blackboard Outcomes Systems- Program & Course Level Assessment

The University of Texas at Brownsville
PROFESSIONAL DEVELOPMENT

The University of Texas at Brownsville
PROFESSIONAL DEVELOPMENT
REDESIGN COURSES
COLLEGES AND SCHOOLS 2009 2010 2011 SPRING FALL SPRING FALL SPRING FALL TOTAL
COLLEGE OF LIBERAL ARTS 1 5 5 15 6 2 34COLLEGE OF SCIENCE, MATHEMATICS AND TECHNOLOGY 1 2 4 7 1 0 15TOTAL 2 7 9 22 7 2 49
Source: Professional Development Database, compiled by Title V, Fall 2011.
CATEGORY NUMBER OF WORKSHOPS DUPLICATED HEADCOUNTAssessment 38 173Technology 18 88Miscellaneous 7 39
New Faculty Orientation 5 30
Student Support 3 27Teaching Strategies 9 21Integration 3 11Total 83 389Unduplicated headcount 134

The University of Texas at Brownsville
PROFESSIONAL DEVELOPMENT* Before Reorganization
COLLEGE FULL TIME FACULTY (FALL 2011) GOAL YEAR 1 AUG 2008 - SEP
2009 YEAR 1 GOAL YEAR 2 OCT 2009 - SEP 2010 YEAR 2 GOAL YEAR 3 OCT 2010 - SEP
2011 YEAR 3
COLLEGE OF SCIENCE MATHEMATICS AND TECHNOLOGY 96 EXCEEDED 23 EXCEEDED 29 EXCEEDED 22
10% 19% 10% 24% 10% 23%
COLLEGE OF LIBERAL ARTS 136 EXCEEDED 43 EXCEEDED 52 EXCEEDED 5010% 33% 10% 40% 10% 37%
SCHOOL OF BUSINESS 40 EXCEEDED 11 EXCEEDED 11 EXCEEDED 215% 39% 5% 39% 5% 53%
COLLEGE OF EDUCATION 77 EXCEEDED 21 EXCEEDED 14 EXCEEDED 205% 30% 5% 20% 5% 26%
SCHOOL OF HEALTH SCIENCES *53 EXCEEDED 16 EXCEEDED 16 5% 30% 5% 30%
COLLEGE OF NURSING 33
EXCEEDED 145% 42%
COLLEGE OF BIOMEDICAL SCIENCES AND HEALTH PROFESSIONS 36 EXCEEDED 7
5% 19%COLLEGE OF APPLIED TECHNOLOGY AND GENERAL STUDIES *39 EXCEEDED 15 EXCEEDED 12 5% 38% 5% 30%
UNDUPLICATED HEADCONT 129 134 134
DUPLICATED HEADCOUNT 639 529 389
STAFF 36 68 49
TOTAL WORKSHOPS OFFERED 53 35 83
Source: Professional Development Database, compiled by Title V, Fall 2011.

The University of Texas at Brownsville
Annual Faculty Survey • The UTB/TSC Annual Faculty Survey was
designed to assess: • Participation in professional development activities, • How faculty spend their time inside and outside the
classroom, • Pedagogical strategies faculty are using to engage
students, • Use of technology and assessment planning,• How faculty perceive institutional priorities.

The University of Texas at Brownsville
Faculty Survey Design • The Foundations Of Excellence In The
First College Year Project Faculty Survey, the Higher Education Research Institute Faculty Survey and the goals of the Title V evaluation plans were used as guides to develop the survey.

The University of Texas at Brownsville
Annual Faculty Survey Results • The survey was administered to 615 Faculty
members in spring 2011. • 277 responded and completed the survey.• The response rate was 45%.

The University of Texas at Brownsville
Faculty Professional Development ParticipationProfessional Development Engaged in Past Year Offered by CTL: N Yes % Yes
Internal or National Experts 116 42%
Blackboard Management Systems Outcomes Platform 95 34%
Technology Integration 95 34%
Technology Supported Teaching Support 71 26%Clubs 46 17%Paragraph Writing 48 17%Brown Bag Lunches 42 15%Summer Institute (for QEP and Title V) 37 13%
Summer Institute (annual teaching institute for PT faculty) 31 11%
Use of CTL Classroom 31 11%
Communities of Practice Participation 26 9%Donut Saturdays 22 8%Twilight Events 15 5%

The University of Texas at Brownsville
Overall Faculty Satisfaction With Professional Development at UTB/TSC
N %Satisfied 26 9%Very satisfied 184 66%Neutral 36 13%Very Dissatisfied 13 5%Dissatisfied 18 7%Total 154 100 %

The University of Texas at Brownsville
Using Assignments To Improve General Education Outcomes
Note: N/A removed from analyses N=227
How often have you developed the following assessments that assess students’…
% Often or Very Often
Critical Thinking Levels 75%Communication Skills 69%Writing Skills 65%Information Literacy 63%Scientific Reasoning 47%

The University of Texas at Brownsville
Faculty Who Participated in Title V Summer Institute were Significantly More Likely to Improve Student
Learning through… • Redesigned existing course• Integrated assignments that require students to apply
knowledge and skills learned in other courses• Assignments that assess students' critical thinking levels• Assignments that assess students' communication skills• Rubrics for assessing assignments
– Based on independent samples test results p<.05– Participating N=37 and Not Participating N=220

The University of Texas at Brownsville
LEARNING COMMUNITIES

The University of Texas at Brownsville
STUDENTS ENROLLED IN STEM LEARNING COMMUNITIES
Fall 2009 Pilot Spring 2010 Pilot Fall 2010 Spring 2011 Fall 2011
1425
237
171
212
Source: Learning Communities Student Tracking Database, compiled by Title V, Fall 2011.

The University of Texas at Brownsville
LEARNING COMMUNITY STUDENTSBY COLLEGE, N=544
Source: Datatel Database, Management and Reporting Office, compiled by Title V, Fall 2011.
40%
23%
10%
8%
5%
5%
5%5%
College of Science, Math, and TechnologyCollege of Liberal ArtsUndeclaredAA.GENCollege of Nursing College of EducationCollege of Biomedical Studies and Health ProfessionsSchool of Business
CSMT
CLA

The University of Texas at Brownsville
PERFORMANCE MEASURES: LC STUDENTS’ RETENTION BY COHORT FALL 2009 TO FALL 2011
Pilots
UTBFT Freshman
Fall ‘09 to Fall ‘10
Retention 55.4%

The University of Texas at Brownsville
CONTROL AND COMPARISON GROUPS
• The CONTROL GROUP was drawn from a database provided by the office of Institutional Effectiveness and was defined by random selection of non LC students...• with same classification• taking same courses in the same semester
• The COMPARISON GROUP was drawn from 2009 FoE Freshmen Cohort, DFWI Grade Distribution Report, published by the office of Data Management and Reporting, Fall 2010

The University of Texas at Brownsville
FALL 2010-SPRING 2011 LC STUDENTS’ DEMOGRAPHICS
Source: Learning Communities Student Tracking Database, compiled by Title V, Fall 2011.
LC’s Control Group
Age Average 19 20
GenderFemale Male
53% 47%
51% 49%
Ethnicity
HispanicWhite Non HispanicAsian/Pacific IslanderBlack Non HispanicOther
93% 3% 2%1%1%
95%3%1%0%1%
GPA Average 2.48 2.21
Classification
FreshmanSophomoreJuniorSenior
76%18%4%2%
NOTE: Control Group was defined by Student Classification and Non LC students taking same courses during the same semester

The University of Texas at Brownsville
GRADE DISTRIBUTION: FALL 2010, n=526
Comparison Group Source: Office of Data Management and Reporting Database, Fall 2011
A B C % of ABC D F W I NG % of DFIW
LEARNING COMMUNITY
13.1% 24.1% 27.4% 64.6% 17.7% 9.1% 8.4% 0.2% 0.0% 35.4%
CONTROL GROUP
0.089353612167300
5
0.209125475285171
0.268060836501901
0.566539923954373
0.182509505703422
0.186311787072243
0.055133079847908
8
0 0.009505703422053
23
0.433460076045627
5.0%
15.0%
25.0%
35.0%
45.0%
55.0%
65.0%
13.1%
24.1%27.4%
64.6%
17.7%
9.1% 8.4%
0.2% 0.0%
35.4%
8 pts.

The University of Texas at Brownsville
GRADE DISTRIBUTION: FALL 2010, PRE-CALC, n=21
Comparison Group Source: Office of Data Management and Reporting Database, Fall 2011
A B C % of ABC D F W I NG % of DFIW
LEARNING COM-MUNITY
19.0% 42.9% 23.8% 85.7% 14.3% 0.0% 0.0% 0.0% 0.0% 14.3%
CONTROL GROUP 0.2380952380952
38
0.0952380952380
953
0.3809523809523
81
0.7142857142857
14
0.1904761904761
91
0.0952380952380
953
0 0 0 0.2857142857142
86
5.0%
15.0%
25.0%
35.0%
45.0%
55.0%
65.0%
75.0%
85.0%
19.0%
42.9%
23.8%
85.7%
14.3%
0.0% 0.0% 0.0% 0.0%
14.3%
14 pts.
33 pts.

The University of Texas at Brownsville
A B C % of ABC D F W I NG % of DFIW
LEARNING COMMU-NITY
13.8% 22.4% 30.9% 67.1% 17.1% 4.6% 10.5% 0.7% 0.0% 32.9%
CONTROL GROUP 0.0723684210526
317
0.25 0.25 0.5723684210526
31
0.1381578947368
42
0.25 0.0263157894736
842
0 0.0131578947368
421
0.4276315789473
68
5.0%
15.0%
25.0%
35.0%
45.0%
55.0%
65.0%
75.0%
13.8%
22.4%
30.9%
67.1%
17.1%
4.6%
10.5%
0.7% 0.0%
32.9%
GRADE DISTRIBUTION: ENGL 1301-FALL 2010, n=152
Comparison Group Source: Office of Data Management and Reporting Database, Fall 2011
10 pts.
6 pts.
20 pts.
The University of Texas at Brownsville
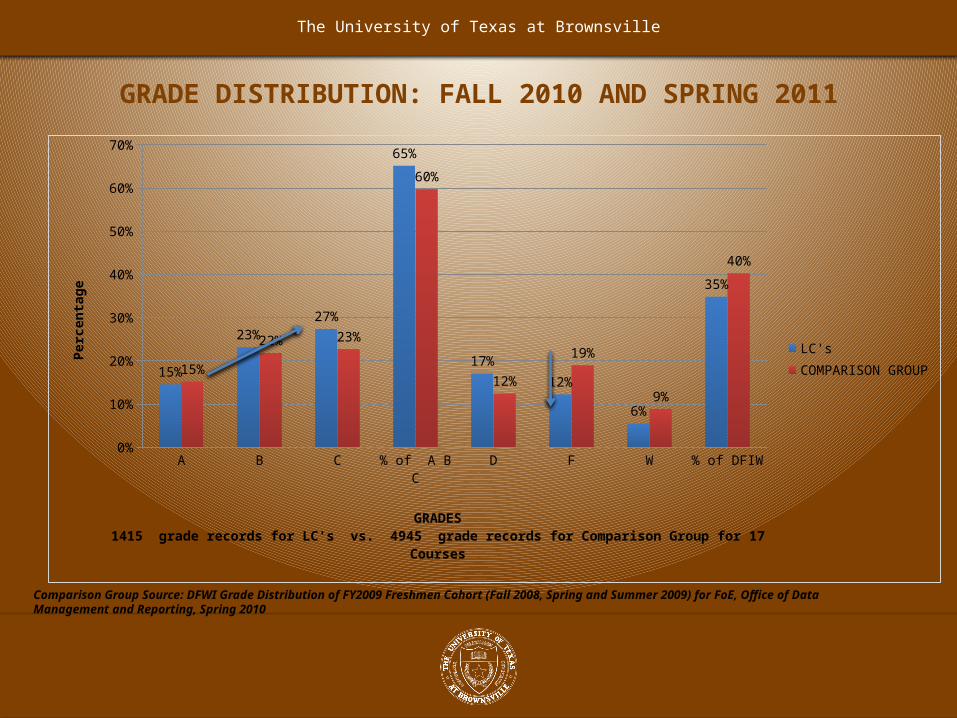
A B C % of A B C D F W % of DFIW0%
10%
20%
30%
40%
50%
60%
70%
15%
23%
27%
65%
17%
12%
6%
35%
15%
22% 23%
60%
12%
19%
9%
40%
LC'sCOMPARISON GROUP
GRADES1415 grade records for LC's vs. 4945 grade records for Comparison Group for 17 Courses
Perc
enta
ge
GRADE DISTRIBUTION: FALL 2010 AND SPRING 2011
Comparison Group Source: DFWI Grade Distribution of FY2009 Freshmen Cohort (Fall 2008, Spring and Summer 2009) for FoE, Office of Data Management and Reporting, Spring 2010

The University of Texas at Brownsville
HIGH PERFORMANCE LC’SFALL 2010-SPRING 2011: COLLEGE ALGEBRA
A B C % of A B C D F W % of DFIW0%
10%
20%
30%
40%
50%
60%
70%
8%
21%
28%
57%
10%
21%
12%
43%
7%
17%21%
45%
16%
27%
12%
55%
LC'sComparison Group
GRADES119 grade records for LC's vs. 799 grade records for Comparison Group
Perc
enta
ge
12 pts.
Comparison Group Source: DFWI Grade Distribution of FY2009 Freshmen Cohort (Fall 2008, Spring and Summer 2009) for FoE, Office of Data Management and Reporting, Spring 2010

The University of Texas at Brownsville
HIGH PERFORMANCE LC’SFALL 2010-SPRING 2011: CALCULUS I
A B C % of A B C D F W % of DFIW0%
10%
20%
30%
40%
50%
60%
70%
80%
90%
10%
35%40%
85%
15%
0% 0%
15%
21%24%
12%
57%
24%
17%
2%
43%
LC'sComparison Group
GRADES20 grade records for LC's vs. 42 grade records for Comparison Group
Perc
enta
ge
28 pts.
28 pts.11 pts.
Comparison Group Source: DFWI Grade Distribution of FY2009 Freshmen Cohort (Fall 2008, Spring and Summer 2009) for FoE, Office of Data Management and Reporting, Spring 2010

The University of Texas at Brownsville
HIGH PERFORMANCE LC’SFALL 2010-SPRING 2011: CHEMISTRY I
A B C % of A B C D F W % of DFIW0%
10%
20%
30%
40%
50%
60%
70%
9%
29%26%
64%
13% 11% 13%
36%
4%
26%23%
53%
22%
8%
17%
47%
LC'sComparison Group
GRADES80 grade records for LC's vs. 77 grade records for Comparison Group
Perc
enta
ge
11 pts.
Comparison Group Source: DFWI Grade Distribution of FY2009 Freshmen Cohort (Fall 2008, Spring and Summer 2009) for FoE, Office of Data Management and Reporting, Spring 2010

The University of Texas at Brownsville
Classroom Community Scale (CCS) (Rovai, 2002)
• The 20-item Scale measures sense of community in a learning environment.
• Research results have suggested that the Classroom Community Scale (CCS) is a valid and reliable measure of classroom community and learning.
The University of Texas at Brownsville
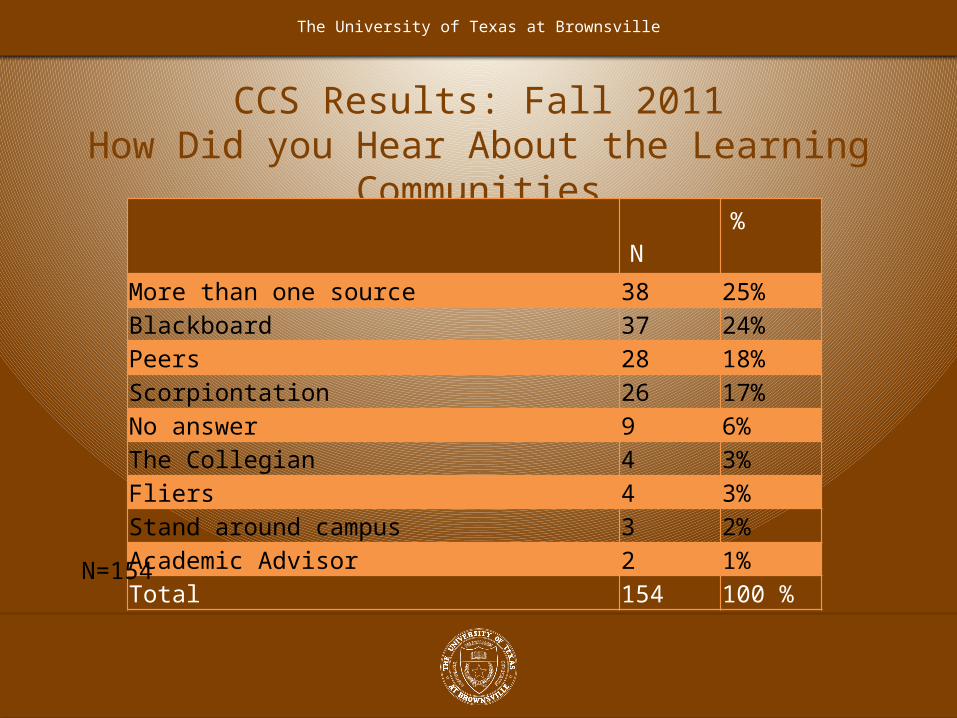
CCS Results: Fall 2011How Did you Hear About the Learning Communities
N %More than one source 38 25%Blackboard 37 24%Peers 28 18%Scorpiontation 26 17%No answer 9 6%The Collegian 4 3%Fliers 4 3%Stand around campus 3 2%Academic Advisor 2 1%Total 154 100 %
N=154

The University of Texas at Brownsville
CCS Results: Fall 2011 (Rank Ordered by Mean)1=Strongly Disagree – 5=Strongly Agree
Mean Std. DeviationTutor appeared to have knowledge of the subject. 4.27 0.87Tutor was able to speak clearly and write legibly 4.21 0.90Tutor was helpful and effective in helping me with course material. 4.08 0.99Tutor sessions were organized and clear, and explanation were understandable. 4.02 0.96I feel that I am given ample opportunities to learn. 4.01 0.91I feel that I am encouraged to ask questions. 4.00 0.92I feel connected to others in this course. 3.97 0.96I feel isolated in this course (REVERSE CODED). 3.92 1.01
N=154
The University of Texas at Brownsville
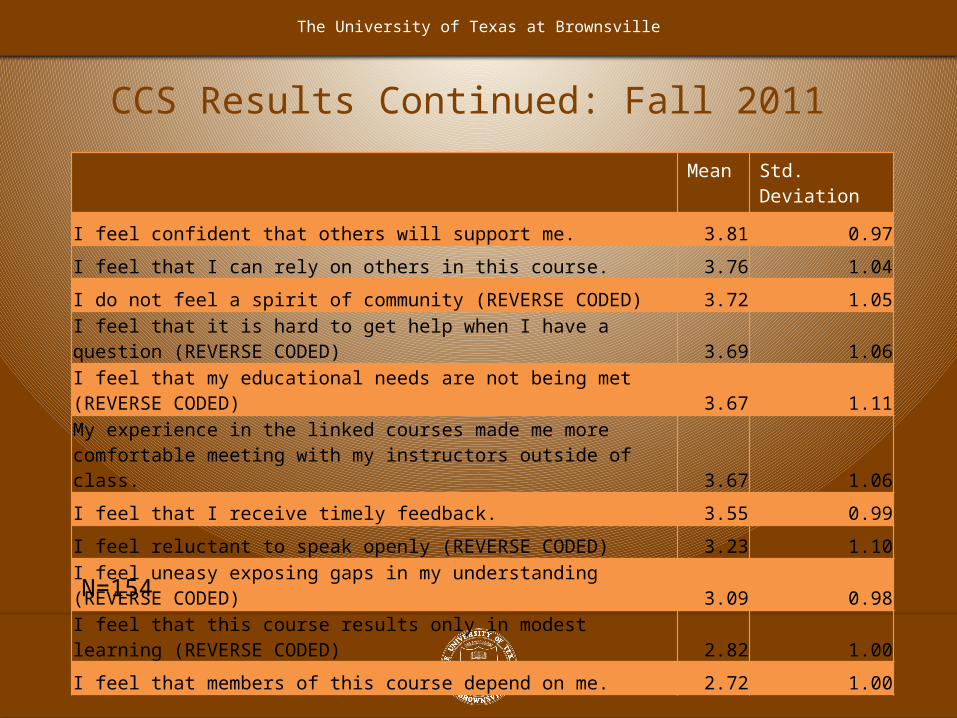
CCS Results Continued: Fall 2011
Mean Std. Deviation
I feel confident that others will support me. 3.81 0.97
I feel that I can rely on others in this course. 3.76 1.04
I do not feel a spirit of community (REVERSE CODED) 3.72 1.05
I feel that it is hard to get help when I have a question (REVERSE CODED) 3.69 1.06
I feel that my educational needs are not being met (REVERSE CODED) 3.67 1.11My experience in the linked courses made me more comfortable meeting with my instructors outside of class. 3.67 1.06
I feel that I receive timely feedback. 3.55 0.99
I feel reluctant to speak openly (REVERSE CODED) 3.23 1.10
I feel uneasy exposing gaps in my understanding (REVERSE CODED) 3.09 0.98
I feel that this course results only in modest learning (REVERSE CODED) 2.82 1.00
I feel that members of this course depend on me. 2.72 1.00
N=154

The University of Texas at Brownsville
Learning Communities Student Survey
• Designed to assess students’ satisfaction levels with their experiences in learning community courses.
• Administered Fall 2010, Spring 2011, and Fall 2011• Responses on Likert-Type Scale where 1=Very Little,
to 5=Very Much • N = 321 Students

The University of Texas at Brownsville
Learning Community Experience Satisfaction
N %Satisfied 110 35%Very satisfied 97 31%Neutral 84 27%Very Dissatisfied 11 4%Dissatisfied 13 4%Total 315 100 %
The University of Texas at Brownsville
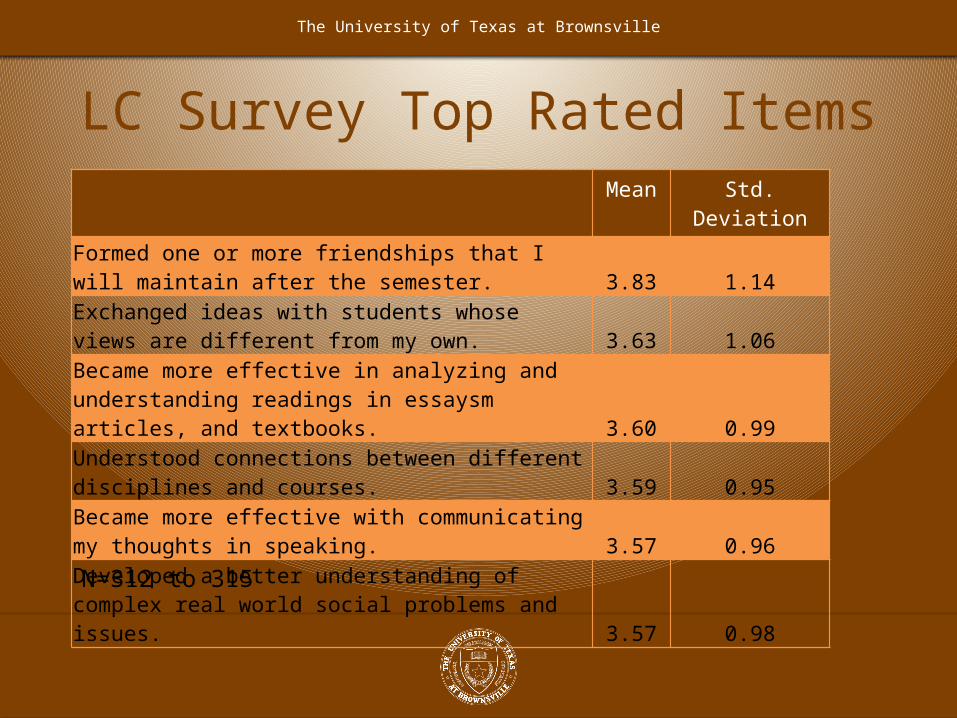
LC Survey Top Rated ItemsMean Std. Deviation
Formed one or more friendships that I will maintain after the semester. 3.83 1.14Exchanged ideas with students whose views are different from my own. 3.63 1.06Became more effective in analyzing and understanding readings in essaysm articles, and textbooks. 3.60 0.99Understood connections between different disciplines and courses. 3.59 0.95Became more effective with communicating my thoughts in speaking. 3.57 0.96Developed a better understanding of complex real world social problems and issues. 3.57 0.98
N=312 to 315

The University of Texas at Brownsville
LC Survey Results Continued…
Mean Std. Deviation
Actively discussed complex issues and ideas.3.44 1.00
Discussed ideas from the LC courses with peers outside of class.3.42 1.08
Became more effective with communicating my thoughts in writing.3.42 0.99
Applied what I learned in one course to another course in my learning community. 3.39 1.01Applied knowledge gained in learning community courses in service to broader community and social issues. 3.39 0.97Made connections with faculty outside of class.
3.24 1.11Discussed connections between any LC courses with faculty.
3.10 1.12
N=314

The University of Texas at Brownsville
Learning Community Experiences • 58% Participated in a Campus Activity or Event
Outside of Class • 43% Participated in an Activity or Event in the
Community• 40% Participated in a Community Service or
Volunteer Activity

The University of Texas at Brownsville
National Survey of Student Engagement (NSSE) • The NSSE assesses the extent to which undergraduate
students are involved in educational practices empirically linked to high levels of learning and development.
• Random sample of first-year students and seniors.• Oversampled first-year students and administered to
students in the LCs in the spring.• Strength of NSSE is that it is aligned with many of the Title
V learning objectives and allows for comparisons with internal peers (UTB/TSC students not enrolled in LCs), peer institutions, and the NSSE national sample.

The University of Texas at Brownsville
NSSE Items Significantly Different (p. < .05)
Item Learning Community
Mean SD Effect Size
Worked on a paper or project that required integrating ideas or information from various sources
Yes 3.21 .89 .18
No 2.89 .88
Put together ideas or concepts from different courses when completing assignments or during class discussions
Yes 2.98 .84 .23
No 2.49 .88
N=54 to 165

The University of Texas at Brownsville
NSSE Items Significantly Different (p. < .10)Item Learning
CommunityMean SD Effect Size
Worked with classmates OUTSIDE OF CLASS to prepare class assignments
Yes 2.67 1.05 .18
No 2.31 1.00
Had serious conversations with students who are very different from you in terms of their religious beliefs, political opinions, or personal values
Yes 2.55 1.10 .15
No 2.21 1.10
Coursework emphasized: APPLYING theories or concepts to practical problems or in new situations
Yes 3.15 .88 .12
No 2.93 .96
Institutional contribution: Using computing and information technology
Yes 3.45 .84 .12
No 3.24 .88
N=49 to 164

The University of Texas at Brownsville
LC Student Focus Groups • A total of 9 students were recruited to voluntarily
participate in an hour long semi-structured interview regarding learning communities.
• The interview was tape-recorded and subsequently content analyzed.
• The qualitative results were analyzed for content and coded into individual thematic theme categories.

The University of Texas at Brownsville
Importance of Scorpion-tation/Orientation• In Scorpion-tation they had the different booths and the
people... Looked pretty interesting… They explained to me like the different classes and having two difficult classes there would be offered tutoring -- I think that helped a lot.”
• “I was taking both so it was already there when I was at Scorpion-tation because I know I needed to take Bio and History… And they were like OK this is a linked course you want to take it? And I was like – Yeah Sure!”
• “Mine was through Orientation as well. My wife suggested – so she suggested I take the learning communities.”

The University of Texas at Brownsville
High Praise to the Tutoring Support• “They (tutors) explained everything. They had patience.”• “They helped to introduce good study habits.”• “The tutors they really helped in helping us become individual(s) off of them. Like
they kind of helped us to get our sea legs you could say.”• “Chem. and Pre-Cal. Their pretty hard classes, and even Bio, knowing that you have
the option for tutors and knowing that there’s a set time for you to study…. I think that helps a lot.”
• “At the time when you would go (tutoring) – they would always go over a chapter they would give you like an overview on every chapter. That was really helpful too. And they would always ask us like if you guys want during lecture -- write questions that you want to know-- bring it to the tutoring session -- and we’ll answer them there.”
• “Linked actually makes it more easier since the tutoring is there. If you take them separately having like that time setup for studying makes it more difficult.”

The University of Texas at Brownsville
Improving Critical Thinking • “I also liked the fact that I had to look at it through two different
philosophies. I mean the philosophy of English and Biology. I felt that it helped with a deeper understanding. It just reinforced it.”
• “Seeing them spending more time with both of them (Chemistry and Math). You’re understanding more. You’re not just understanding Chemistry better your understanding Chemistry and Math.”
• “I don’t know if this one counts but the big thing that framed the beginning part of our semester –was - What is science? What do we consider science? And what is considered science? And we basically went through the scientific process as well which eventually led to us forming our own opinion of what science (is).”

The University of Texas at Brownsville
Developing a Sense of Community• “For me I think for both classes we had the same classmates… and I know that’s a
lot of fun because you form like a little community amongst each other. So once you get that confidence of like knowing everybody for both classes you feel more free to like ask more questions or ask each other questions that we don’t understand.”
• “This is my first semester so like I didn’t know anybody and just being in the learning community and meeting new people and having them there with me - helping me… Instead of those classes that I didn’t have with other students that I know. I think it just helped me more.”
• “Having the same students and actually going to the other classes with those students was extremely helpful. And I’m a pretty open person but in other classes you could see people shut down because they’re afraid…because they don’t know their peers. And so they’re afraid to ask questions.”
The University of Texas at Brownsville
TECHNOLOGY INTEGRATION AND ASSESSMENT

The University of Texas at Brownsville
INTEGRATION OF TECHNOLOGY
Use of Technology Facts:• 23 faculty are using tablet PC in their
classrooms to grade papers and engage students
• 330 TurningPoint clickers are being used by 17 faculty in 29 sections
• COW for Mathematics LC’s and tutorials 10 sections
• Mobile Computers for faculty trainings 83 workshops
• Development of ESO’s and SLO’s Blackboard Outcomes templates
• Trained 101 faculty on Technology related topics
• A group of faculty, the “Select 40” were trained by Blackboard and piloted the Blackboard Content Management 9.1 Service Pak in Spring 2011
• 30 faculty got Laser Pointers/Podium remote controls

The University of Texas at Brownsville
Annual Faculty Survey Results: Integration of Technology
Note: N/A removed from analyses N=227
To what extent do you use the following teaching methods in your courses with undergraduates?
% Often or Very Often
Technology (e.g. web, DVD, computers, Podcasts, clickers, digital technology, etc.)
68%
Electronic quizzes with immediate feedback in class 31%
Blackboard Management System's Outcomes Platform 28%
Electronic portfolios 15%

The University of Texas at Brownsville
Annual Faculty Survey Results: Supporting a Culture of Evidence
N=277, Note: N/A removed from analyses
UTB/TSC does a good job: % Agree or Strongly Agree
Providing a good general education for all students 60%Providing a clear curricular plan for students 55%Systematically assessing students’ learning outcomes. 50%Using what we learn from those assessments to strengthen courses. 44%Creating a culture of evidence to guide curricular reform 41%Systematically assessing students' experiences. 39%

The University of Texas at Brownsville
Attitudes Toward Science Inventory (ASTI) - Gogolin (1992)
• Pre-Post Design in Learning Communities Fall 2010 • 118 Students Responded• Measures student perception of science teacher, anxiety
toward science, value of science in society, self-concept in science, enjoyment of science, and motivation in science
• 48 Item Instrument • Likert-Type Scale 1=Strongly Disagree to 6=Strongly Agree

The University of Texas at Brownsville
Significant Results and Largest Differences (based on paired samples t-test)
Adjustment to college life
Confident making argument about science
Would like to teach science
Important know science get good job
Confident feeling about science
1.00 1.50 2.00 2.50 3.00 3.50 4.00 4.50 5.00 5.50 6.00
PostPre

The University of Texas at Brownsville
WRITING ASSESSMENT FALL 2010, N= 693
01234
2.5 2.2 2.1 1.92.52.7 2.5 2.4 2.2
2.7
Pre-DiagnosticPost-Diagnostic
0
1
2
3
4
2.31.9 1.8 1.6
2.51.9 1.7 2 1.9 2.2
Pre-DiagnosticPost-Diagnostic
STEM LC’s with Peer Mentoring and Tutoring
4 Coursesn= 60 papers
LC without with-out Support Svcs.
3 Coursesn=75 papers

The University of Texas at Brownsville
INTERVENTIONS TO INCREASE MATH READINESS

The University of Texas at Brownsville
SUMMER 2010 PRE-CALCULUS BOOT CAMP
No Math College Alge-bra
Pre-Calculus Calculus I Calculus II
SPRING 2011
0.347826086956522
0.0434782608695652
0.173913043478261
0.391304347826087
0.0434782608695652
FALL 2010
0.130434782608696
0.173913043478261
0.608695652173914
NaN NaN
5.0%15.0%25.0%35.0%45.0%55.0%65.0%N %
Total Students Participating 32 100%Pre and Post Test 23 72%Tested out of Pre-Calc 4 17%Increased Test Scores between 130 and 200%
4 17%
Increased Test Scores between 50 and 94%
9 39%
Increased Test Scores by 50% 6 26%
12 of 15 students (80%) were successful in the course (fall’10)
NO MATH A B C D FFALL 2010 8 4 5 3 3 0SPRING 2011 3 10 5 3 1 1TOTAL 13 14 10 6 4 1
27% 29% 21% 12% 8% 2%
18 of 20 students (78%) were successful in the Spring
Math Enrollment after BootCamp

The University of Texas at Brownsville
COLLEGE ALGEBRA
PRECALCULUS CALCULUS I NO MATH0
2
4
6
8
10
12
14
16
CoursesSt
uden
ts 23%20%
17%
40%
SUMMER 2011 PRE-CALCULUS BOOT CAMP
Math Enrollment after BootCamp, n=35
N %
Total Students Participating 35 100%
Pre and Post Test 22 63%
Tested out of Pre-Calc 10 45%
Increased Test Scores over 100% 5 23%
Increased Test Scores between 50 and 100%
6 27%
Increased Test Scores by 50% 11 50%
The University of Texas at Brownsville
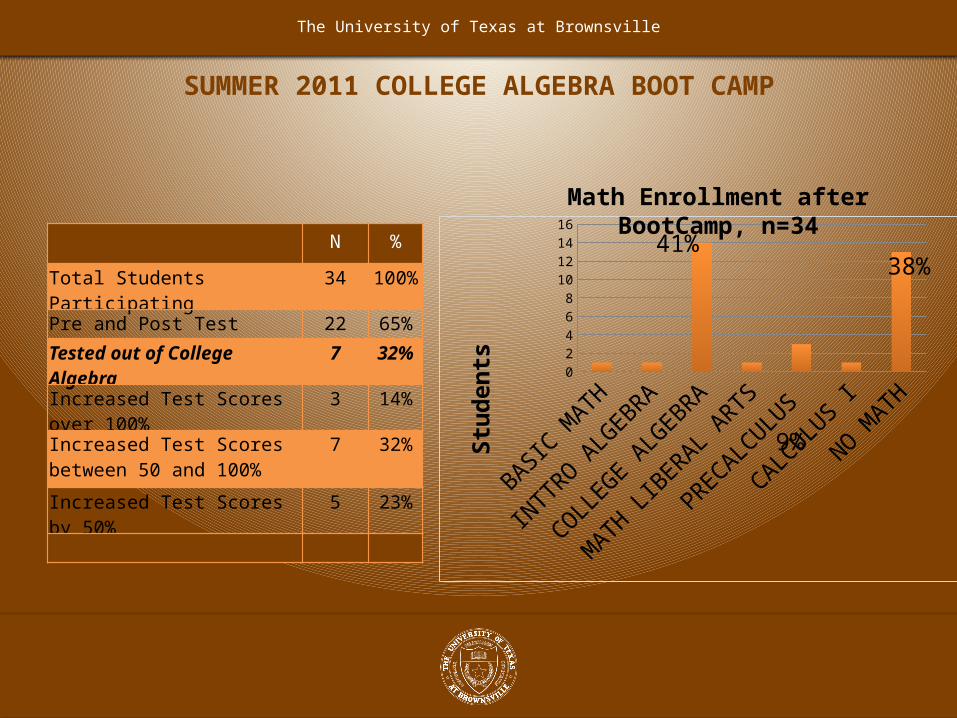
BASIC MATH
INTTRO ALGEBRA
COLLEGE ALGEBRA
MATH LIB-ERAL ARTS
PRECALCU-LUS
CALCULUS I NO MATH
Fall 2011
1 1 14 1 3 1 13
1
3
5
7
9
11
13
15
Stud
ents
SUMMER 2011 COLLEGE ALGEBRA BOOT CAMP
Math Enrollment after BootCamp, n=34
41%38%
9%
N %
Total Students Participating 34 100%
Pre and Post Test 22 65%
Tested out of College Algebra 7 32%
Increased Test Scores over 100% 3 14%
Increased Test Scores between 50 and 100%
7 32%
Increased Test Scores by 50% 5 23%

The University of Texas at Brownsville
CONCLUSIONS AND IMPLICATIONS

The University of Texas at Brownsville
WHAT IS GOING WELL…
• Faculty are participating in PD initiatives and
they are finding it useful.
• Tutoring
• LC students are building connections and
community
• LCs are improving retention rates and GPAs
• LC students are developing communication
and critical thinking skills
• Faculty are integrating technology in their
classroom to improve teaching and learning.

The University of Texas at Brownsville
WHAT IS NEXT…
• Find ways to institutionalize effective initiatives
• Tutoring, Continue LC, and Expand Math Boot Camp
• What are ongoing sources of evidence that are sustainable and useful in decision
making
• Capitalizing on Advising and other departments to help us informed students about
effective initiatives
• Making sure that progress on retention and academic achievement translates into
degree attainment in STEM fields/graduation
• Continue to measure progress in student degree attainment
• Sustaining interventions to improve math readiness because math is a impediment
to attaining a STEM degree.

The University of Texas at Brownsville
Q&A


![Brownsville herald. (Brownsville, Tex.). 1931-01-04 [p ]. · 2020. 10. 14. · gfmmmtmmmmmmmmmmmmmmmrnmm»»*>»»***mmmmmmmmmmmmmmmm..... ..... J| 1 « ----- --—— Brownsville](https://img.pdfslide.us/doc/110x75/611f38f716d6ee6a5426b1ec/brownsville-herald-brownsville-tex-1931-01-04-p-2020-10-14-gfmmmtmmmmmmmmmmmmmmmrnmmmmmmmmmmmmmmmmmm.jpg)