Embed Size (px)
Citation preview

Brownsville Independent School District Brownsville, Texas
Comprehensive Annual Financial Report
For
Fiscal Year Ended June 30, 2014
Prepared by: The Division of Finance
INTRODUCTORY SECTION
BROWNSVILLE INDEPENDENT SCHOOL DISTRICT Brownsville, Texas
COMPREHENSIVE ANNUAL FINANCIAL REPORT
JUNE 30, 2014
TABLE OF CONTENTS
Page Number Exhibit
i
INTRODUCTORY SECTION
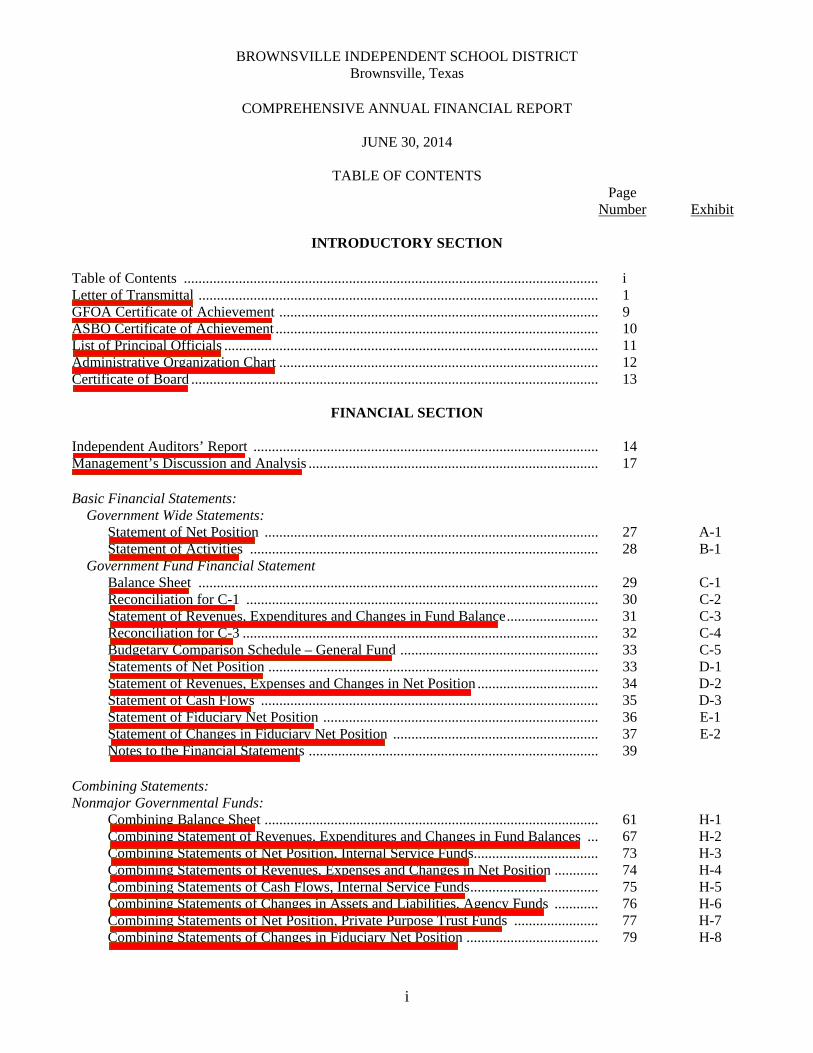
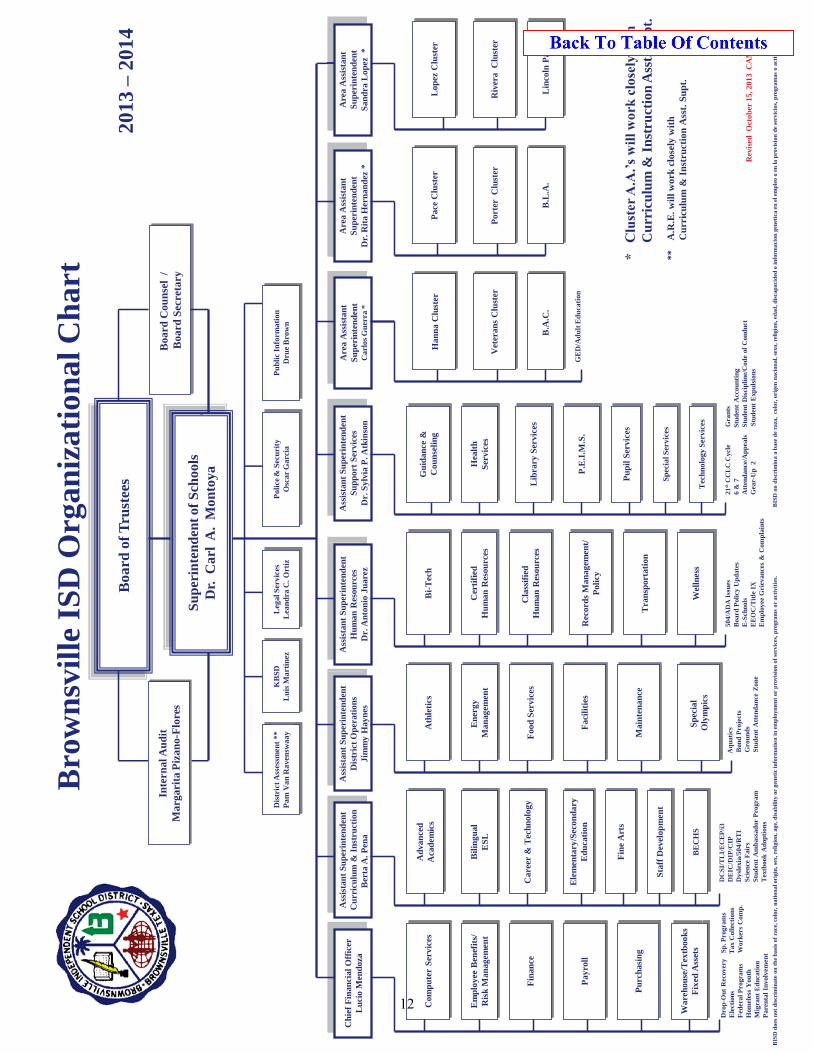
Table of Contents ................................................................................................................. i Letter of Transmittal ............................................................................................................. 1 GFOA Certificate of Achievement ....................................................................................... 9 ASBO Certificate of Achievement ........................................................................................ 10 List of Principal Officials ...................................................................................................... 11 Administrative Organization Chart ....................................................................................... 12 Certificate of Board ............................................................................................................... 13
FINANCIAL SECTION Independent Auditors’ Report .............................................................................................. 14 Management’s Discussion and Analysis ............................................................................... 17 Basic Financial Statements: Government Wide Statements: Statement of Net Position ........................................................................................... 27 A-1 Statement of Activities ............................................................................................... 28 B-1 Government Fund Financial Statement Balance Sheet ............................................................................................................. 29 C-1 Reconciliation for C-1 ................................................................................................ 30 C-2 Statement of Revenues, Expenditures and Changes in Fund Balance ......................... 31 C-3 Reconciliation for C-3 ................................................................................................. 32 C-4 Budgetary Comparison Schedule – General Fund ...................................................... 33 C-5 Statements of Net Position .......................................................................................... 33 D-1 Statement of Revenues, Expenses and Changes in Net Position ................................. 34 D-2 Statement of Cash Flows ............................................................................................ 35 D-3 Statement of Fiduciary Net Position ........................................................................... 36 E-1 Statement of Changes in Fiduciary Net Position ........................................................ 37 E-2
Notes to the Financial Statements ............................................................................... 39 Combining Statements: Nonmajor Governmental Funds: Combining Balance Sheet ........................................................................................... 61 H-1 Combining Statement of Revenues, Expenditures and Changes in Fund Balances ... 67 H-2 Combining Statements of Net Position, Internal Service Funds .................................. 73 H-3 Combining Statements of Revenues, Expenses and Changes in Net Position ............ 74 H-4 Combining Statements of Cash Flows, Internal Service Funds ................................... 75 H-5 Combining Statements of Changes in Assets and Liabilities, Agency Funds ............ 76 H-6 Combining Statements of Net Position, Private Purpose Trust Funds ....................... 77 H-7 Combining Statements of Changes in Fiduciary Net Position .................................... 79 H-8
BROWNSVILLE INDEPENDENT SCHOOL DISTRICT Brownsville, Texas
COMPREHENSIVE ANNUAL FINANCIAL REPORT
JUNE 30, 2014
TABLE OF CONTENTS
Page Number Exhibit
ii
FINANCIAL SECTION
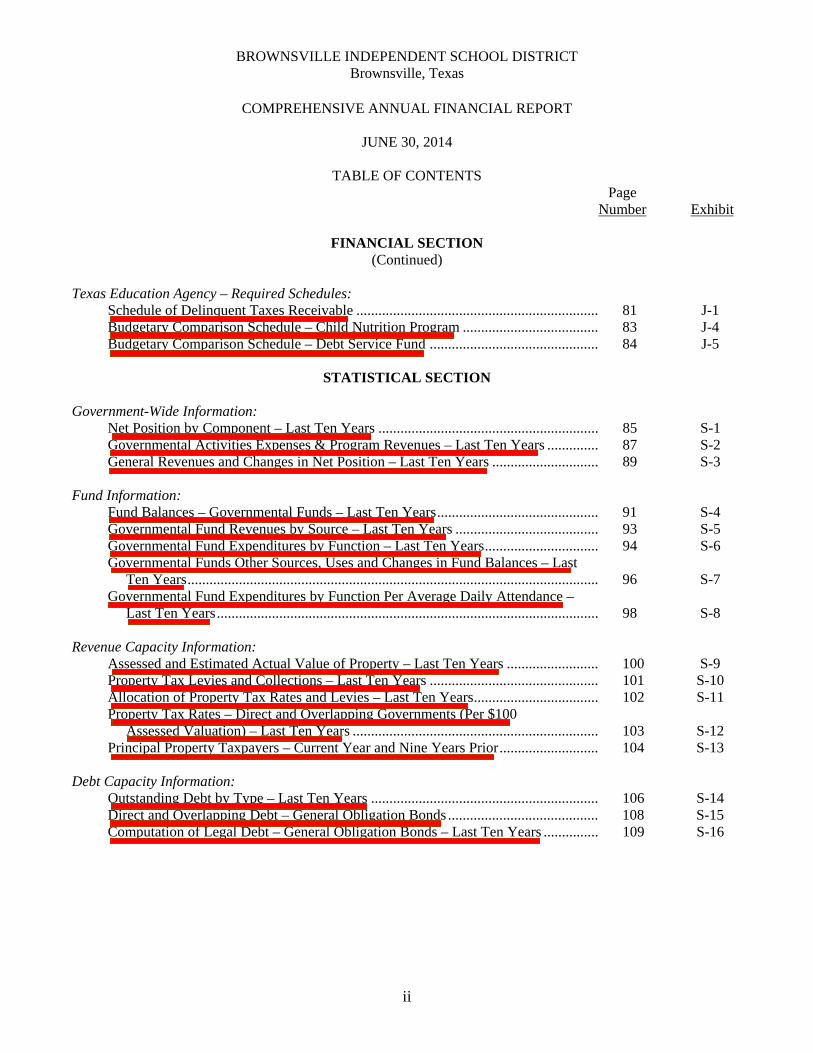
(Continued) Texas Education Agency – Required Schedules: Schedule of Delinquent Taxes Receivable .................................................................. 81 J-1 Budgetary Comparison Schedule – Child Nutrition Program ..................................... 83 J-4 Budgetary Comparison Schedule – Debt Service Fund .............................................. 84 J-5
STATISTICAL SECTION
Government-Wide Information: Net Position by Component – Last Ten Years ............................................................ 85 S-1 Governmental Activities Expenses & Program Revenues – Last Ten Years .............. 87 S-2 General Revenues and Changes in Net Position – Last Ten Years ............................. 89 S-3 Fund Information: Fund Balances – Governmental Funds – Last Ten Years ............................................ 91 S-4 Governmental Fund Revenues by Source – Last Ten Years ....................................... 93 S-5 Governmental Fund Expenditures by Function – Last Ten Years ............................... 94 S-6 Governmental Funds Other Sources, Uses and Changes in Fund Balances – Last Ten Years ................................................................................................................ 96 S-7 Governmental Fund Expenditures by Function Per Average Daily Attendance – Last Ten Years ........................................................................................................ 98 S-8 Revenue Capacity Information: Assessed and Estimated Actual Value of Property – Last Ten Years ......................... 100 S-9 Property Tax Levies and Collections – Last Ten Years .............................................. 101 S-10 Allocation of Property Tax Rates and Levies – Last Ten Years .................................. 102 S-11 Property Tax Rates – Direct and Overlapping Governments (Per $100 Assessed Valuation) – Last Ten Years ................................................................... 103 S-12 Principal Property Taxpayers – Current Year and Nine Years Prior ........................... 104 S-13 Debt Capacity Information: Outstanding Debt by Type – Last Ten Years .............................................................. 106 S-14 Direct and Overlapping Debt – General Obligation Bonds ......................................... 108 S-15 Computation of Legal Debt – General Obligation Bonds – Last Ten Years ............... 109 S-16
BROWNSVILLE INDEPENDENT SCHOOL DISTRICT Brownsville, Texas
COMPREHENSIVE ANNUAL FINANCIAL REPORT
JUNE 30, 2014
TABLE OF CONTENTS
Page Number Exhibit
iii
STATISTICAL SECTION (Continued)
Debt Capacity Information: (Continued) Ratio of Net General Obligation Bonded Debt to Estimated Actual Value And Per Average Daily Membership – Last Ten Years ......................................... 111 S-17 Ratio of Annual Debt Service for General Bonded Debt to Total General Fund Expenditures – Last Ten Years ...................................................................... 112 S-18 Demographic and Economic Information Principal Employers – Current Year and Nine Years Prior ......................................... 113 S-19 Construction and Property Values – Last Ten Years ................................................... 114 S-20 Demographic and Economic Statistics – Last Ten Years ............................................ 115 S-21 Operating Information: Work Force Composition by Employee Classification – Last Ten Years ................... 116 S-22 Schedule of Teacher Information – Last Ten Years .................................................... 118 S-23 Schedule of Attendance and Membership – Last Ten Years ....................................... 120 S-24 Operating Statistics – Last Ten Years.......................................................................... 121 S-25 Schedule of Student Information – Last Ten Years ..................................................... 122 S-26 Schedule of School Buildings ...................................................................................... 123 S-27 Miscellaneous Statistics ............................................................................................... 124
FEDERAL AWARDS SECTION
Independent Auditors’ Report on Internal Control Over Financial Reporting and on Compliance and Other Matters Based on an Audit of Financial Statements Performed in Accordance with Government Auditing Standards ......... 125 Independent Auditors’ Report on Compliance For Each Major Program and on Internal Control Over Compliance Required by OMB Circular A-133 .............. 127 Schedule of Findings and Questioned Costs ................................................................ 129 Corrective Action Plan ................................................................................................ 131 Summary Schedule of Prior Audit Findings ................................................................ 132 Schedule of Expenditures of Federal Awards .............................................................. 133 Notes to Schedule of Expenditures of Federal Awards ............................................... 136
1
Brownsville Independent School District 1900 E. Price Road · Brownsville, Texas 78521
Telephone: (956) 547-4113 Fax (956) 548-8026
November 07, 2014 Herman Otis Powers, President, Board of Trustees Members, and Citizens of the Brownsville Independent School District Brownsville, Texas 78521 Dear Mr. Powers, Board Members and Citizens: State law requires that all public school districts publish within one-hundred fifty days of the close of each fiscal year a complete set of financial statements presented in conformity with generally accepted accounting principles (GAAP) and audited in accordance with generally accepted auditing standards (GAAS) by a firm of licensed certified public accountants. Pursuant to that requirement, we hereby issue the comprehensive annual financial report of the Brownsville Independent School District (District) for the fiscal year ended June 30, 2014. This report consists of management’s representations concerning the finances of the District. Consequently, management assumes full responsibility for the completeness and reliability of all of the information presented in this report. To provide a reasonable basis for making these representations, management of the District has established a comprehensive internal control framework that is designed both to protect the government’s assets from loss, theft, or misuse and to compile sufficient reliable information for the preparation of the District’s financial statements in conformity with GAAP. Because the cost of internal controls should not outweigh their benefits, the District’s comprehensive framework of internal controls has been designed to provide reasonable rather than absolute assurance that the financial statements will be free from material misstatement. As management, we assert that, to the best of our knowledge and belief, this financial report is complete and reliable in all material respects.
BOARD OF EDUCATION
Herman Otis Powers
President Vacancy
Vice President Minerva M. Peña
Secretary Luci B. Longoria
Assistant Secretary Jose Hector Chirinos
Member Cesar Lopez
Member Caty Presas-Garcia
Member
Dr. Carl A. Montoya Superintendent
2
The District’s financial statements have been audited by Patillo, Brown & Hill, L.L.P., a firm of licensed certified public accountants. The goal of the independent audit was to provide reasonable assurance that the financial statements of the District for the fiscal year ended June 30, 2014, are free of material misstatement. The independent audit involved examining, on a test basis, evidence supporting the amounts and disclosures in the financial statements; assessing the accounting principles used and significant estimated made by management; and evaluating the overall financial statement presentation. The independent auditor concluded, based upon the audit, that there was a reasonable basis for rendering an unmodified opinion that the District’s financial statements for the fiscal year ended June 30, 2014, are fairly presented in conformity with GAAP. The independent auditor’s report is presented as the first component of the financial section of this report. The independent audit of the financial statements of the District was part of a broader, federally mandated “Single Audit” designed to meet the special need of federal grantor agencies. The standards governing Single Audit engagements require the independent auditor to report not only on the fair presentation of the financial statements, but also on the audited government’s internal controls and compliance with legal requirements, with special emphasis on internal controls and legal requirements involving the administration of federal awards. Information related to this single audit, including a schedule of federal financial assistance, the independent auditors’ reports on the internal controls and compliance with applicable laws and regulations, and a schedule of findings and questioned costs are included in the Single Audit Section of this report. GAAP require that management provide a narrative introduction, overview, and analysis to accompany the basis financial statements in the form of Management’s Discussion and Analysis (MD&A). This letter of transmittal is designed to complement MD&A and should be read in conjunction with it. The District’s MD&A can be found immediately following the report of the independent auditors. Profile of the Government The District is a political subdivision of the State of Texas and governed and operating as an independent school district under the laws thereof. The District is located entirely in Cameron County, Texas and serves the City of Brownsville, part of the Township of Rancho Viejo and some unincorporated areas of the county. The District, originally chartered by the State in March 1915, now encompasses ninety-five square miles. The District is governed by a seven-member Board of Trustees (Board) composed of District residents, who are elected by voters of the district. The Board is responsible for managing and governing the schools of the District, including adopting goals and objectives for the District, reviewing and acting on policies, adopting an annual budget, levying and collecting District taxes, hiring school personnel as recommended by the superintendent, approving salary schedules, adopting District policies and setting directions for curriculum, and reporting to the public on the District’s progress. The District’s Superintendent of Schools and staff assist the Board with financial and administrative matters and oversee the day-to-day operations of the District.
3
Mission Statement To produce well-educated graduates who can pursue higher educational opportunities and who will become responsible citizens in a changing global society by utilizing all resources to provide equitable opportunities for students. The Brownsville ISD graduate will:
Meet and/or exceed state, national, and international standards of achievement Graduate in a timely manner Experience ongoing success in their careers Be productive, responsible, and contributing members of society
Vision Our primary purpose of improving lives through a quality education is driven by an unrelenting determination to graduate all of our students and prepare them for success in higher education. Our ideology is reflected in our fundamental beliefs, commitments and core values that guide us in our daily practices. Core Commitments The District’s commitments to achieve the mission are:
All children will be taught, will learn, and will perform at or above their academic levels in all core subject areas and the District will provide a high quality curriculum and instructional program to facilitate children reaching their full potential
Will eliminate student achievement gaps in the areas of: gender, socio-economic levels, ethnicity, and program specific populations in all core subject areas
Will provide a safe, clean, and orderly learning environment for every child and staff member as a means of optimizing the teaching and learning processes
Will recruit, hire, value, and retain highly qualified and experienced personnel who will ensure that all students’ educational needs are met and that all children achieve on grade level
Will implement parent, business, and community involvement partnerships essential to enhancing the overall quality of our students’ education and fomenting every child’s academic success
Core Beliefs The District’s commitment to this mission is driven by nine fundamental beliefs around which the District has built its governing policies and daily practices:
High expectations are essential in fostering higher achievement Academic success nurtures lifelong learning Everyone flourishes in a safe and healthy environment All persons in our educational community have inherent value, gifts, and strengths The success of each student, teacher, staff member, administrator and family is
essential for the success of the entire school district community The community and families share responsibility for the development and mentoring
of our students Perseverance and hard work are essential for success
4
Sensitivity is essential to understanding the needs of others Students are the number one resource for our future
Core Values The District has adopted six core values that exemplify the nine fundamental beliefs in action. In order to achieve our goals and attain our commitment, we expect the following:
Will not tolerate educational apathy Will not compromise the efficient and effective use of any/all resources Educational and financial decisions will be based upon what is best for the future
success of our students Will foster a positive environment that recognizes and celebrates cultural diversity Will ensure a safe and healthy learning environment with a commitment to excellence Will insist that the ECE-16 instructional program is the priority
The District provides a full range of educational services appropriate to grade levels pre-kindergarten through twelve for its approximate 49,370 students. These include regular and enriched academic education, special education for students with disabilities, occupational education, bilingual instruction for those with limited English proficiency and specialized instruction for disadvantaged students. These basic programs are supplemented by additional offerings in the fine arts and athletics. In addition, the District provides for community and adult education by offering a wide variety of academic and occupational courses. District Accomplishments – The District’s accomplishments continue to be recognized by local, state, and national publications. Most recently, the District was recognized for the following achievement:
One of the District’s parents was recognized as a Hero for Children by the State Board of Education (SBOE). She was one of 15 volunteers who were honored at the SBOE September 2013 meeting.
The District’s 21st Century Community Learning Center Program (21st CCLC) was awarded 3 of 5 of the most prestigious awards in the State. 2013 PRIME Award, 2013 Most Innovative Family Engagement Activity Award and Top Administrator.
Another Veterans Memorial High School student was elected as the national SkillsUSA president. Her predecessor was also a Veterans Memorial student. Never before has this organization had “back to back” presidents from the same state, school district and high school. SkillsUSA is the largest student organization in the country with over 330,000 members.
Six of the District’s high schools have been designated by the Texas Education Agency as Early College High Schools supporting the district’s overall commitment to a college-going culture.
The District outperformed the State in 3 of 4 Target Indexes and Region One in 2 Indexes in the 2014 Texas Accountability System. The District scored in the top 11% of the State on student progress and top 22% for postsecondary readiness.
5
District campuses earned 204 Distinction Designation in the 2014 state accountability
system. A total of 29 elementaries earned 100% of the 2014 State Distinction and/or Safeguards.
Sixty-one BISD high school students were awarded the University Scholars Program at the University of Texas at Brownsville and five BISD students were selected for the 2014 Class of Gates Millennium Scholars.
More than $38 million in scholarships offers for the graduating class of 2014.
Awards per campus ranged from approximately $3.4 million to $9.3 million. Budgetary Controls - The annual budget serves as the foundation for the District’s financial planning and control. The District’s fiscal year begins July 1st and ends June 30th. The budget is initially prepared under the direction of the Superintendent. The Board reviews the budget during workshops conducted from January through May. The final budget is required by State law to be adopted by June 30th. The District maintains budgetary controls to ensure compliance with legal provisions embodied in the annual appropriated budget approved by the Board. Activities of the general fund, the debt service fund, child nutrition service fund (which is included in the general fund) and designated purpose funds are included in the annual appropriated budget. The level of budgetary control (that is, the level at which expenditures cannot legally exceed the appropriated amount) is established by major functional category. Budget-to-actual comparisons are provided in this report for each individual governmental fund for which an appropriated annual budget has been adopted. For the general fund and the child nutrition service fund, this comparison is presented on Exhibit C-5, as required supplementary information. The TEA required budget versus actual comparison for the child nutrition program can be found on Exhibit J-4 and the debt service fund comparison is presented on Exhibit J-5. Factors Affecting Financial Conditions The information presented in the financial statements is perhaps best understood when it is considered from the broader perspective of the specific environment within which the District operates. Population – Brownsville is the largest city in Cameron County. It has a population of over 175,000 residents and has experienced growth of 34,948 people between the 2000 and 2010 according to the US Census Bureau. The breakdown of our student membership as of October 2014 is as follows:
Early Ed 671 Pre-K 2,777 K-5 20,741
6
6-8 10,506 9-12 13,616 TOTAL 48,311
The projected average daily attendance (ADA) for 2014-2015 is approximately 45,200. Local Economy – The District serves the City of Brownsville, a portion of the Township of Rancho Viejo and several unincorporated areas in Cameron County including Cameron Park and San Pedro. Brownsville is the population and economic center of the expanding lower Rio Grande Valley. The area economy is largely driven by manufacturing reflecting its location across from Matamoros, Mexico and extensive transportation network (including the Port of Brownsville). The city’s low cost of living and doing business support continued economic growth, and a growing healthcare and education sector, including a branch of the University of Texas, contributes to the stability of the region. The City of Brownsville became the selected site for the Space X Exploration launching site. The city, school district and surrounding areas will be benefiting with the addition of space exploration to the area. The City experienced a 4.5 percent increase in the value of permits issued for the 2014 fiscal year indicating that the commercial building is climbing out of the economic hole created by the recession. The potential for prolonged manufacturing stress coupled with the shortcomings of a relatively low-skilled labor force and vulnerabilities in Mexico’s economic outlook are concerns inherent to the local economy. State Economic Outlook – The state continues to see an improved economy and is expected to collect approximately $96.2 billion in general revenue for the 2014-15 biennium, with an estimated $11.8 billion in the Rainy Day Fund at the end of 2015. Judge Dietz again ruled the school finance system unconstitutional. The state has appealed the case to the Supreme Court. The 84th legislature will face a potential shortfall in Medicaid, a TRS Care deficit, needs in other areas such as Higher Education, Dept. of Transportation ERS and an unequitable school finance system. Bond Funding Update – There were no new debt issuances in the 2013-2014 school year. Financial Polices – As one of the 19 largest school districts in the State of Texas, the District is constantly monitoring its financial resources, expenditures and planning for the future. Student enrollment drives the District’s planning process along with management’s commitment to providing the best education available to our students. The District’s strategic planning is an ongoing process. The District continually studies different areas of cost containment as they strategically view the demographics of the District and ongoing economic climate. Child Nutrition Program – The Child Nutrition Program continues to enhance its operations. As a result of the administrative team’s continued effort to streamline operations, increase meal participation, cut costs and increase revenue, the program experienced a profitable year and was able to maintain a positive fund balance. Since the 2011-2012 school
7
year, the District implemented breakfast in the classroom to all students whereby the District absorbs the cost of the meal and all students are allowed to eat breakfast free of charge. The District’s top priority is to ensure that each child receives a healthy breakfast and lunch. The District serves breakfast, lunches, and afterschool snacks to students through the Texas Department of Agriculture School Nutrition Program. In addition to breakfast and lunch, the District serves an afternoon snack to all students enrolled in an after school tutorial. The District will remove the afterschool snack program and implement a supper program for the 2014-2015 school year. The District is reimbursed based on the number of free, reduced, and paid breakfast and lunches served as well as on the number of after-school snacks served. Each year, the federal reimbursement rates increase. The rates increased by 2.2% for lunch, 2.8% for breakfast, and 2.6% for after-school snacks from the 2012-2013 to the 2013-2014 school year. Long-term Financial Planning – Growth in the district’s tax base has continued but at a much slower pace, averaging 1% annual growth from fiscal years 2008-13. The district’s fiscal 2014 taxable assessed valuation (TAV) grew marginally to $5.3 billion. Average daily attendance has grown at less than 1% average annual growth and is expected to continue at this pace in the near term. Typical for the border area, the area’s unemployment rate is high (8.4% in September 2014) and income levels are very low. Projected membership for school year 2014-15 is expected to reach 48,500. The District’s maintenance and operations tax rate for tax year 2013-2014 is $1.040000 per $100 valuation and the Debt Service rate is $0.102155 for a total tax rate of $1.142155. Any increase in property tax revenues are the result of increased property values. State funding for the general fund is about 76.27% of the total general fund revenue and is estimated to increase slightly over the next year. Federal funding is expected to decrease slightly due to decreased availability of federal program funding. Grant funding plays an important role as a resource to supplement regular funding and to expand programs needed for greater academic achievement. Interest Rates – The steady decline in interest rates continues to adversely affect the interest earnings of the District. To illustrate the decline in rates, the overnight Federal Funds Rate at August 2008 was at 2.00%, after a steady series of rate cuts, on December 16, 2008, this rate was set at 0.25% and continues to be artificially maintained at this rate to stimulate the economy. The effect to the District has been a noted decrease in investment earnings. Awards Association of School Business Officials International (ASBO) – At June 30, 2013, the District compiled and submitted a Comprehensive Annual Financial Report (CAFR) for consideration for ASBO’s Certificate of Achievement for Excellence in Financial Reporting. The District was notified that it had been awarded the certificate on August 29, 2014. This was the sixth time the District had submitted its financial statements for this award.
9
Association of School Business Officials International
The Certificate of Excellence in Financial Reporting Award
is presented to
Brownsville Independent School District For Its Comprehensive Annual Financial Report (CAFR)
For the Fiscal Year Ended June 30, 2013
The CAFR has been reviewed and met or exceeded ASBO International’s Certificate of Excellence standards
Terrie S. Simmons, RSBA, CSBO John D. Musso, CAE, RSBA President Executive Director
10
BROWNSVILLE INDEPENDENT SCHOOL DISTRICT Brownsville, Texas
LIST OF PRINCIPAL OFFICIALS
For The Year Ended June 30, 2014
BOARD OF TRUSTEES
Herman Otis Powers, Jr. – President
Minerva M. Pena – Secretary
Luci B. Longoria – Assistant Secretary
Jose Hector Chirinos – Member
Caty Presas-Garcia – Member
Cesar Lopez – Member
ADMINISTRATORS
Dr. Carl A. Montoya, Superintendent
Carlos Guerra, Assistant Superintendent of Human Resources/Title IX
Berta Pena, Assistant Superintendent of Curriculum and Instruction
Dr. Antonio Juarez, Assistant Superintendent of District Operations
Dr. Sylvia P. Atkinson, Assistant Superintendent of Support Services
Lucio Mendoza, Chief Financial Officer
11
Bro
wn
svil
le I
SD
Org
aniz
atio
nal
Ch
art
Boa
rd o
f T
rust
ees
Su
per
inte
nd
ent o
f S
choo
ls
Dr.
Car
l A
. M
onto
ya
Boa
rd C
oun
sel
/ B
oard
Sec
reta
ry
* C
lust
er A
.A.’s
will
wor
k cl
osel
y w
ith
C
urr
icu
lum
& I
nst
ruct
ion
Ass
t. S
up
t.
**
A.R
.E. w
ill w
ork
clos
ely
wit
h
Cu
rric
ulu
m &
In
stru
ctio
n A
sst.
Su
pt.
R
evis
ed O
ctob
er 1
5, 2
013
CA
M /
lc
20
13 –
201
4
Chi
ef F
inan
cial
Off
icer
L
ucio
Men
doza
Ass
ista
nt S
uper
inte
nden
t H
uman
Res
ourc
es
Dr.
Ant
onio
Jua
rez
Ass
ista
nt S
uper
inte
nden
t S
uppo
rt S
ervi
ces
Dr.
Syl
via
P. A
tkin
son
Are
a A
ssis
tant
S
uper
inte
nden
t D
r. R
ita
Her
nand
ez *
Are
a A
ssis
tant
S
uper
inte
nden
t C
arlo
s G
uerr
a *
Ass
ista
nt S
uper
inte
nden
t C
urri
culu
m &
Ins
truc
tion
B
erta
A. P
ena
Ass
ista
nt S
uper
inte
nden
t D
istr
ict
Ope
rati
ons
Jim
my
Hay
nes
Ene
rgy
M
anag
emen
t
Foo
d S
ervi
ces
Fac
ilit
ies
Ath
leti
cs
Bi-
Tec
h
Rec
ords
Man
agem
ent/
P
olic
y
Cla
ssif
ied
H
uman
Res
ourc
es
Cer
tifi
ed
Hum
an R
esou
rces
Pup
il S
ervi
ces
P.E
.I.M
.S.
L
ibra
ry S
ervi
ces
Hea
lth
Ser
vice
s
Gui
danc
e &
C
ouns
elin
g
Por
ter
Clu
ster
Lop
ez C
lust
er
Pac
e C
lust
er
Dro
p-O
ut R
ecov
ery
Sp.
Pro
gram
s
Ele
ctio
ns
Tax
Col
lect
ions
F
eder
al P
rogr
ams
W
orke
rs C
omp.
H
omel
ess
You
th
Mig
rant
Ed
ucat
ion
Par
enta
l Inv
olve
men
t
DC
SI/
TL
I/E
CE
P/i
3 D
EIC
/DIP
/CIP
D
ysle
xia/
504/
RT
I S
cien
ce F
airs
Stu
dent
Am
bass
ador
Pro
gram
T
extb
ook
Ado
ptio
ns
21st C
CL
C C
ycle
G
rant
s 6
& 7
S
tude
nt A
ccou
ntin
g A
tten
danc
e/A
ppea
ls
Stu
dent
Dis
cipl
ine/
Cod
e of
Con
duct
G
ear-
Up
2
S
tude
nt E
xpul
sion
s
Com
pute
r S
ervi
ces
Em
ploy
ee B
enef
its/
R
isk
Man
agem
ent
Fin
ance
Pay
roll
Pur
chas
ing
Adv
ance
d A
cade
mic
s
Bil
ingu
al
ES
L
Car
eer
& T
echn
olog
y
Ele
men
tary
/Sec
onda
ry
Edu
cati
on
Riv
era
Clu
ster
Vet
eran
s C
lust
er
Tra
nspo
rtat
ion
Fin
e A
rts
Mai
nten
ance
War
ehou
se/T
extb
ooks
F
ixed
Ass
ets
Sta
ff D
evel
opm
ent
Wel
lnes
s
Are
a A
ssis
tant
S
uper
inte
nden
t S
andr
a L
opez
*
B.A
.C.
B.L
.A.
Lin
coln
Par
k
Dis
tric
t Ass
essm
ent
**
Pam
Van
Rav
ensw
aay
H
anna
Clu
ster
BE
CH
S
Spec
ial S
ervi
ces
Tec
hnol
ogy
Serv
ices
KB
SD
L
uis
Mar
tine
z L
egal
Ser
vice
s L
ean
dra
C. O
rtiz
P
ubl
ic I
nfor
mat
ion
D
rue
Bro
wn
P
olic
e &
Sec
urit
y O
scar
Gar
cia
Inte
rnal
Au
dit
M
arga
rita
Piz
ano-
Flo
res
BIS
D d
oes
not
dis
crim
inat
e on
th
e b
asis
of
race
, col
or, n
atio
nal o
rigi
n, s
ex, r
elig
ion
, age
, dis
abili
ty o
r ge
net
ic in
form
atio
n i
n e
mp
loym
ent
or p
rovi
sion
of
serv
ices
, pro
gram
s or
act
ivit
ies.
B
ISD
no
dis
crim
ina
a b
ase
de
raza
, co
lor,
ori
gen
nac
ion
al, s
exo,
rel
igio
n, e
dad
, dis
cap
acid
ed o
info
rmac
ion
gen
etic
a en
el e
mp
leo
o en
la p
rovi
sion
de
serv
icio
s, p
rogr
amas
o a
ctiv
idad
es.
GE
D/A
du
lt E
du
cati
on
504/
AD
A I
ssue
s B
oard
Pol
icy
Up
date
s E
-Sch
ools
E
EO
C/T
itle
IX
E
mp
loye
e G
riev
ance
s &
Com
plai
nts
Spe
cial
O
lym
pics
A
qua
tics
Bon
d P
roje
cts
G
roun
ds
S
tude
nt A
tten
danc
e Z
one
12

FINANCIAL SECTION
765 EAST 7th STREET BROWNSVILLE, TX 78520 (956) 544-7778 FAX: (956) 544-8465 www.pbhcpa.com AFFILIATE OFFICES: HILLSBORO, TX (254) 582-2583 TEMPLE, TX (254) 791-3460
WACO, TX (254) 772-4901 ALBUQUERQUE, NM (505) 266-5904
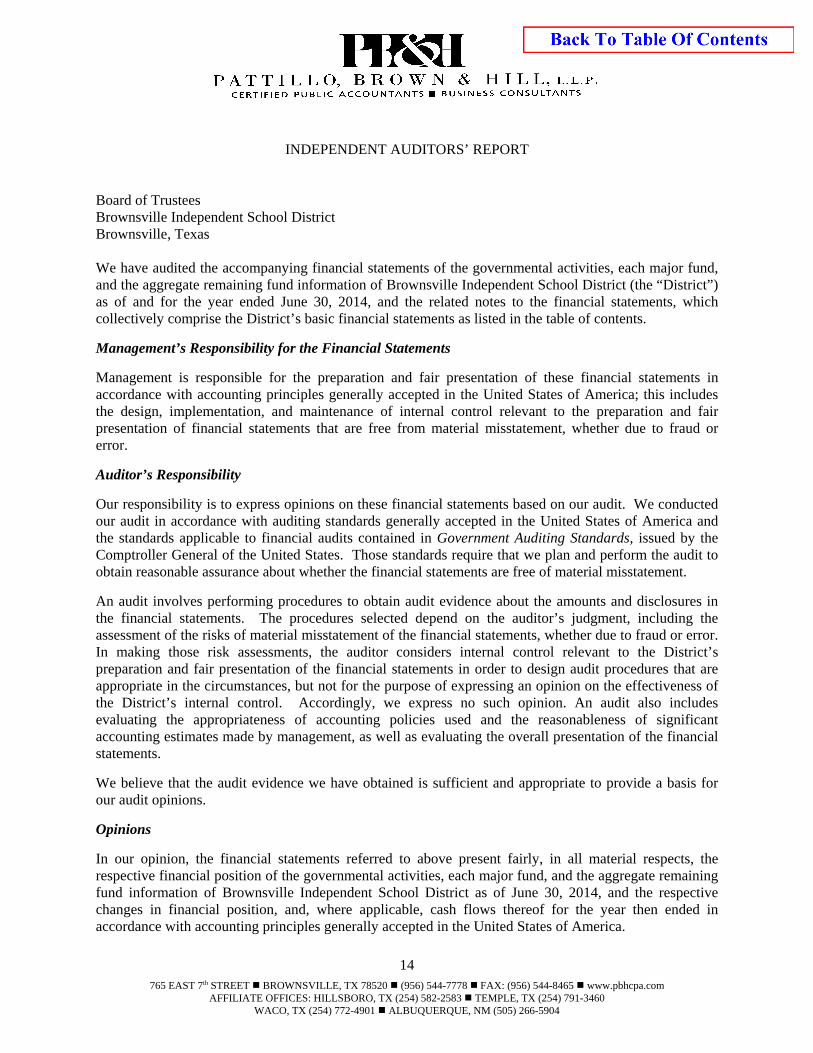
INDEPENDENT AUDITORS’ REPORT Board of Trustees Brownsville Independent School District Brownsville, Texas We have audited the accompanying financial statements of the governmental activities, each major fund, and the aggregate remaining fund information of Brownsville Independent School District (the “District”) as of and for the year ended June 30, 2014, and the related notes to the financial statements, which collectively comprise the District’s basic financial statements as listed in the table of contents.
Management’s Responsibility for the Financial Statements
Management is responsible for the preparation and fair presentation of these financial statements in accordance with accounting principles generally accepted in the United States of America; this includes the design, implementation, and maintenance of internal control relevant to the preparation and fair presentation of financial statements that are free from material misstatement, whether due to fraud or error.
Auditor’s Responsibility Our responsibility is to express opinions on these financial statements based on our audit. We conducted our audit in accordance with auditing standards generally accepted in the United States of America and the standards applicable to financial audits contained in Government Auditing Standards, issued by the Comptroller General of the United States. Those standards require that we plan and perform the audit to obtain reasonable assurance about whether the financial statements are free of material misstatement.
An audit involves performing procedures to obtain audit evidence about the amounts and disclosures in the financial statements. The procedures selected depend on the auditor’s judgment, including the assessment of the risks of material misstatement of the financial statements, whether due to fraud or error. In making those risk assessments, the auditor considers internal control relevant to the District’s preparation and fair presentation of the financial statements in order to design audit procedures that are appropriate in the circumstances, but not for the purpose of expressing an opinion on the effectiveness of the District’s internal control. Accordingly, we express no such opinion. An audit also includes evaluating the appropriateness of accounting policies used and the reasonableness of significant accounting estimates made by management, as well as evaluating the overall presentation of the financial statements.
We believe that the audit evidence we have obtained is sufficient and appropriate to provide a basis for our audit opinions.
Opinions
In our opinion, the financial statements referred to above present fairly, in all material respects, the respective financial position of the governmental activities, each major fund, and the aggregate remaining fund information of Brownsville Independent School District as of June 30, 2014, and the respective changes in financial position, and, where applicable, cash flows thereof for the year then ended in accordance with accounting principles generally accepted in the United States of America.
14
Change in Accounting Principle As discussed in Note I to the financial statements, in 2014 the District adopted new accounting guidance, GASB Statement No. 65, Items Previously Reported as assets and Liabilities. Our opinion is not modified with respect to this matter. Other Matters
Required Supplementary Information
Accounting principles generally accepted in the United States of America require that the Management’s Discussion and Analysis information on pages 17 through 26 be presented to supplement the basic financial statements. Such information, although not a part of the basic financial statements, is required by the Governmental Accounting Standards Board, who considers it to be an essential part of financial reporting for placing the basic financial statements in an appropriate operational, economic, or historical context. We have applied certain limited procedures to the required supplementary information in accordance with auditing standards generally accepted in the United States of America, which consisted of inquiries of management about the methods of preparing the information and comparing the information for consistency with management’s responses to our inquiries, the basic financial statements, and other knowledge we obtained during our audit of the basic financial statements. We do not express an opinion or provide any assurance on the information because the limited procedures do not provide us with sufficient evidence to express an opinion or provide any assurance.
Other Information
Our audit was conducted for the purpose of forming opinions on the financial statements that collectively comprise the District’s basic financial statements. The introductory section, combining and individual nonmajor fund financial statements, Texas Education Agency required schedules and statistical section are presented for purposes of additional analysis and are not a required part of the basic financial statements. The schedule of expenditures of federal awards is presented for purposes of additional analysis as required by U.S. Office of Management and Budget Circular A-133, Audits of States, Local Governments, and Non-Profit Organizations, and is also not a required part of the basic financial statements.
The combining and individual nonmajor fund financial statements, Texas Education Agency required schedules, and the schedule of expenditures of federal awards are the responsibility of management and were derived from and relate directly to the underlying accounting and other records used to prepare the basic financial statements. Such information has been subjected to the auditing procedures applied in the audit of the basic financial statements and certain additional procedures, including comparing and reconciling such information directly to the underlying accounting and other records used to prepare the basic financial statements or to the basic financial statements themselves, and other additional procedures in accordance with auditing standards generally accepted in the United States of America. In our opinion, the combining and individual nonmajor fund financial statements, Texas Education Agency required schedules, and the schedule of expenditures of federal awards are fairly stated in all material respects in relation to the basic financial statements as a whole. The introductory, statistical sections and Exhibit J-3 have not been subjected to the auditing procedures applied in the audit of the basic financial statements and, accordingly, we do not express an opinion or provide any assurance on them.
15
BROWNSVILLE INDEPENDENT SCHOOL DISTRICT MANAGEMENT’S DISCUSSION AND ANALYSIS
FOR THE YEAR ENDED JUNE 30, 2014
As management of the Brownsville Independent School District (the “District”), we are providing readers of the District’s financial statements this narrative overview and analysis of the District’s financial activities for the fiscal year ended June 30, 2014. Please read it in conjunction with the transmittal letter and the District’s financial statements, which follow this section. FINANCIAL HIGHLIGHTS
The District’s total combined Net Position as reflected in the government-wide Statement of Net
Position was $355,077,645 at June 30, 2014. Of this amount, $78,378,086 (Unrestricted Net Position) may be used to meet the District’s ongoing obligations. See Exhibit A-1.
The District’s Statement of Activities reflects an increase in Net Position for Governmental Activities in the amount of $9,189,962. This is a result of expenses being less than the $512,744,800 generated in taxes, state aid, investment earnings, and other revenues such as charges for services and federal grants. See Exhibit B-1.
The General Fund reported a fund balance in the governmental funds financial statements this year
of $102,350,625. Approximately 61% of this total amount, $ 62,776,227, is available for spending at the District’s discretion (Unassigned Fund Balance). See Exhibit C-1.
As shown on the Statement of Activities, the property tax revenue increased $4,438,951 or 8.03%
from the prior year due to a $163,270,397 increase in property values and an increase in the tax rates. The District’s M&O tax rate is $1.040000 per $100 valuation and the I&S rate is $0.102155.
OVERVIEW OF THE FINANCIAL STATEMENTS This annual report consists of a series of financial statements. The government-wide financial statements include the Statements of Net Position and the Statement of Activities. These statements provide information about the activities of the District as a whole and present a long-term view of the District’s property and obligations and other financial matters. They reflect the flow of total economic resources in a manner similar to the financial reports of a business enterprise. Fund financial statements report the District’s operations with more detail when compared to the government-wide statements by providing information about the District’s significant funds. The governmental funds statements show how general government services were funded / financed in the short-term as well as what remains for future expenditures. They reflect the flow of current financial resources, and supply the basis for tax levies and the appropriations budget. The proprietary funds statements reflect the activity related to services provided to parties within the District, for the District’s worker’s compensation fund and the self-funded insurance programs. The remaining statements, Fiduciary statements, provide financial information about the activities for which the Districts acts solely as a trustee or agent for the benefit of those outside the government. The notes to the financial statements provide narrative explanations needed for full disclosure in the government-wide statements or the fund financial statements. The combining statements for non-major governmental funds and the combining statements for Internal Service Funds contain even more information about the District’s individual Special Revenue and
17
BROWNSVILLE INDEPENDENT SCHOOL DISTRICT MANAGEMENT’S DISCUSSION AND ANALYSIS
FOR THE YEAR ENDED JUNE 30, 2014
Permanent Funds and Internal Service Funds, respectively. The Statement of Changes in Assets and Liabilities for the agency fund is also included. These are not required by the Texas Education Agency (TEA). The sections labeled Required TEA Schedules and Federal Awards Section contain data used by monitoring or regulatory agencies for assurance that the District is using the funds supplied in accordance/compliance with the terms of the grants. Reporting the District as a Whole The Statement of Net Position and the Statement of Activities The analysis of the District’s overall financial condition and operations begins on page x. The primary objective of the analysis is to show whether the District is better or worse off as a result of this year’s activities. The Statement of Net Position includes all of the District’s assets and liabilities, while the Statement of Activities includes all the revenues and expenses generated by the District’s operations during the fiscal year. These financial statements apply the same basis of accounting used by most private-sector companies, the full accrual basis. All of the current year’s revenues and expenses are taken into account regardless of when cash is paid or received. The District’s revenues are divided into one of the following areas/categories: (1) those provided by outside parties who share the costs of some programs, such as tuition received from students outside the District and grants provided by the U.S. Department of Education to assist children with disabilities or from disadvantaged backgrounds (program revenues), or (2) general revenues provided by the taxpayers or by the TEA in equalization funding processes (general revenues). All the District’s assets are reported whether they apply to the current year or subsequent years. All liabilities are also reported regardless of when they must be paid, current or future years. These two statements report the District’s net position and how it has changed. The District’s Net Position (the difference between the District’s assets and liabilities), is one way to measure the District’s financial health or financial position. Over time, increases or decreases in the District’s net position is one indicator of whether the District’s financial health is improving or deteriorating, respectively. To assess the overall financial health of the District, one needs to consider additional nonfinancial factors such as changes in the District’s tax base, average daily attendance, the District’s property tax base, and the condition of the District’s facilities. The District’s financial condition has improved as evidenced by the increase in government-wide Net Position, however, the weighted average daily attendance (WADA) continues to decline. Due to this decline in attendance, the District continues to assess facilities and staffing allocations to ensure that the students’ needs are best served. While the District’s property tax base has increased in recent years, the state funding methodology minimizes the benefit of additional increases in taxable property. Foundation School Program state funding, which is the District’s largest portion of state funding, is based on property value so as the property value increase the state funding will decrease. The District’s governmental activities are presented in the Statement of Net Position (Exhibit A-1) and the Statement of Activities (Exhibit B-1). All of the District’s basic services are reported as governmental
18
BROWNSVILLE INDEPENDENT SCHOOL DISTRICT MANAGEMENT’S DISCUSSION AND ANALYSIS
FOR THE YEAR ENDED JUNE 30, 2014
activities; including instruction, counseling, co-curricular activities, food services, transportation, maintenance, community services and general administration. Property taxes, tuition, fees, and state and federal grants finance these activities. Reporting the District’s Funds Fund financial statements The fund financial statements provide more detailed information about the District’s most significant funds—not the District as a whole. Laws and Contracts require the District to establish funds to account for grants received such as the grants on the No Child Left Behind Application (NCLB). Funds are accounting devices that the District uses to keep track of specific sources of funding and spending for particular purposes. The District’s Administration establishes many other funds to help it control and monitor activities. Governmental funds—Most of the District’s basic services are included in governmental funds.
The funds use modified accrual accounting (a method that measures the receipt and disbursement of cash and all other financial assets that can be readily converted to cash) and they report balances that are available for future spending. The governmental fund statements provide a detailed short-term view of the District’s general operations and the basic services it provides. We describe the differences between governmental activities (reported in the Statement of Net Position and the Statement of Activities) and governmental funds in reconciliation schedules following each of the governmental fund financial statements. All of the District’s activities for its governmental funds are reported in Exhibits C-1 and C-3.
Proprietary funds—Services for which the District charges users /customers a fee. Proprietary
funds, like the government-wide statements, provide both long-term and short-term financial information.
19
BROWNSVILLE INDEPENDENT SCHOOL DISTRICT MANAGEMENT’S DISCUSSION AND ANALYSIS
FOR THE YEAR ENDED JUNE 30, 2014
There are two types of Proprietary Funds, Enterprise Funds and Internal Service Funds.
Currently, the District does not have any Enterprise Funds. The District however does have two (2) Internal Service Funds. They are Fund 754-Self-Funded Insurance (Blue Cross & Blue Shield) and Fund 792-Self Funded Workers Compensation. We use Internal Service funds to report activities that provide supplies and services for the District’s other programs and activities. The District’s combined activities for its Internal Service Funds are reported in Exhibits D-1, D-2 and D-3. These activities are also reported individually for each Internal Service Fund in Exhibits H-3, H-4 and H-5.
The District as Trustee Reporting the District’s Fiduciary Responsibilities The District is the trustee, or fiduciary, for certain funds. For example for money raised by student activities. Money raised by student activities is recorded within the District’s Agency Funds. It is also responsible for other assets that because of a trust arrangement can be used only for the trust beneficiaries. The District is responsible for ensuring that the assets reported in these funds are used for their intended purposes. All of the District’s fiduciary activities are reported in a separate statement of fiduciary Net Position and a statement of changes in fiduciary Net Position. All of the District’s Fiduciary Activities are reported on Exhibit E-1 and E-2. We exclude these activities from the District’s government-wide financial statements because the District cannot use these assets to finance its operations. GOVERNMENT-WIDE FINANCIAL ANALYSIS As mentioned earlier, Net Position is one indicator of a government’s financial position. In the case of Brownsville ISD, the District’s assets exceeded liabilities by $355,077,645 for the year ended June 30, 2014. Unrestricted Net Position, which can be used to finance the District’s day-to-day operations without constraints established by debt covenants, enabling legislation, or other legal requirements represents $78,378,086 or approximately 22 % of the District’s total Net Position. The largest percentage of Net Position, approximately 69 %, is reflected in its investment in capital assets, net of related debt. This is where the District reflects land, furniture, equipment and vehicles, net of accumulated depreciation and any related debt. The District uses these Capital Assets to provide services to its students, teachers and staff. These assets are not readily available for spending. Although the District’s investment in its capital assets is reported net of related debt, it should be noted that the resources needed to repay this debt must be provided from other sources, since the capital assets themselves cannot be used to liquidate these liabilities. The following analysis will focus on the District’s Statement of Net Position (see Table 1) and the Change in Net Position (see Table 2).
20
BROWNSVILLE INDEPENDENT SCHOOL DISTRICT MANAGEMENT’S DISCUSSION AND ANALYSIS
FOR THE YEAR ENDED JUNE 30, 2014
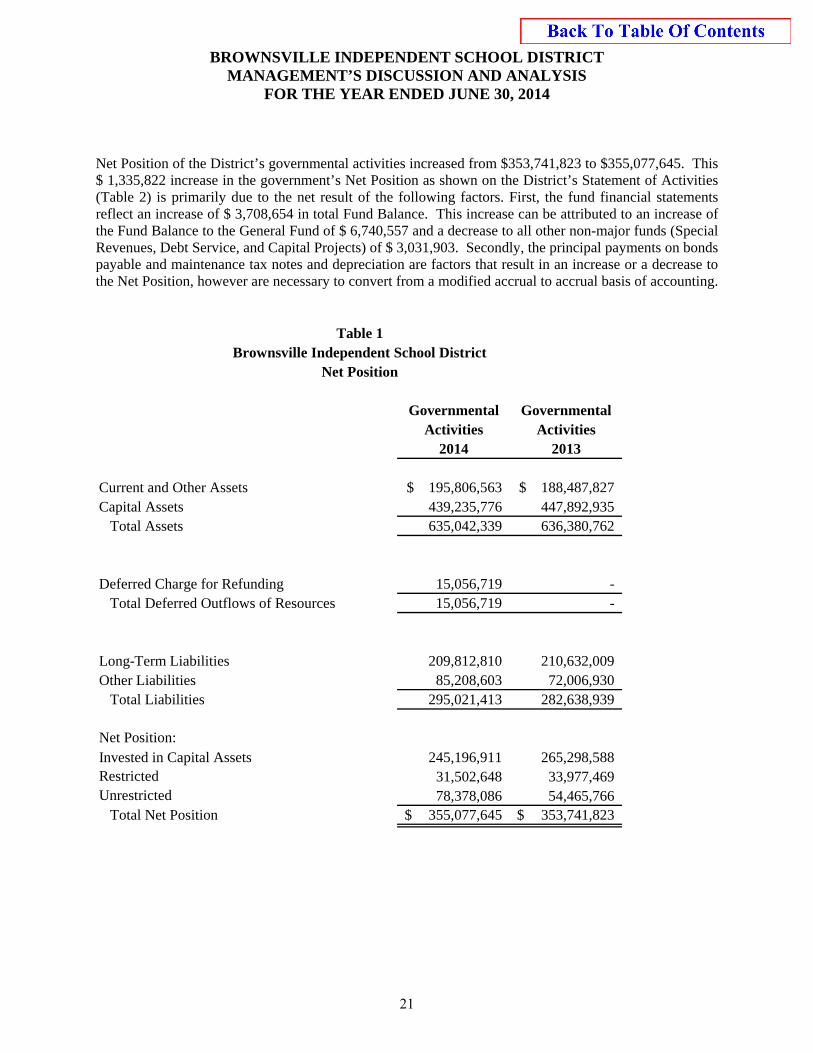
Net Position of the District’s governmental activities increased from $353,741,823 to $355,077,645. This $ 1,335,822 increase in the government’s Net Position as shown on the District’s Statement of Activities (Table 2) is primarily due to the net result of the following factors. First, the fund financial statements reflect an increase of $ 3,708,654 in total Fund Balance. This increase can be attributed to an increase of the Fund Balance to the General Fund of $ 6,740,557 and a decrease to all other non-major funds (Special Revenues, Debt Service, and Capital Projects) of $ 3,031,903. Secondly, the principal payments on bonds payable and maintenance tax notes and depreciation are factors that result in an increase or a decrease to the Net Position, however are necessary to convert from a modified accrual to accrual basis of accounting.
Governmental GovernmentalActivities Activities
2014 2013
Current and Other Assets 195,806,563$ 188,487,827$ Capital Assets 439,235,776 447,892,935 Total Assets 635,042,339 636,380,762
Deferred Charge for Refunding 15,056,719 - Total Deferred Outflows of Resources 15,056,719 -
Long-Term Liabilities 209,812,810 210,632,009 Other Liabilities 85,208,603 72,006,930 Total Liabilities 295,021,413 282,638,939
Net Position:Invested in Capital Assets 245,196,911 265,298,588 Restricted 31,502,648 33,977,469Unrestricted 78,378,086 54,465,766 Total Net Position 355,077,645$ 353,741,823$
Table 1Brownsville Independent School District
Net Position
21
BROWNSVILLE INDEPENDENT SCHOOL DISTRICT MANAGEMENT’S DISCUSSION AND ANALYSIS
FOR THE YEAR ENDED JUNE 30, 2014
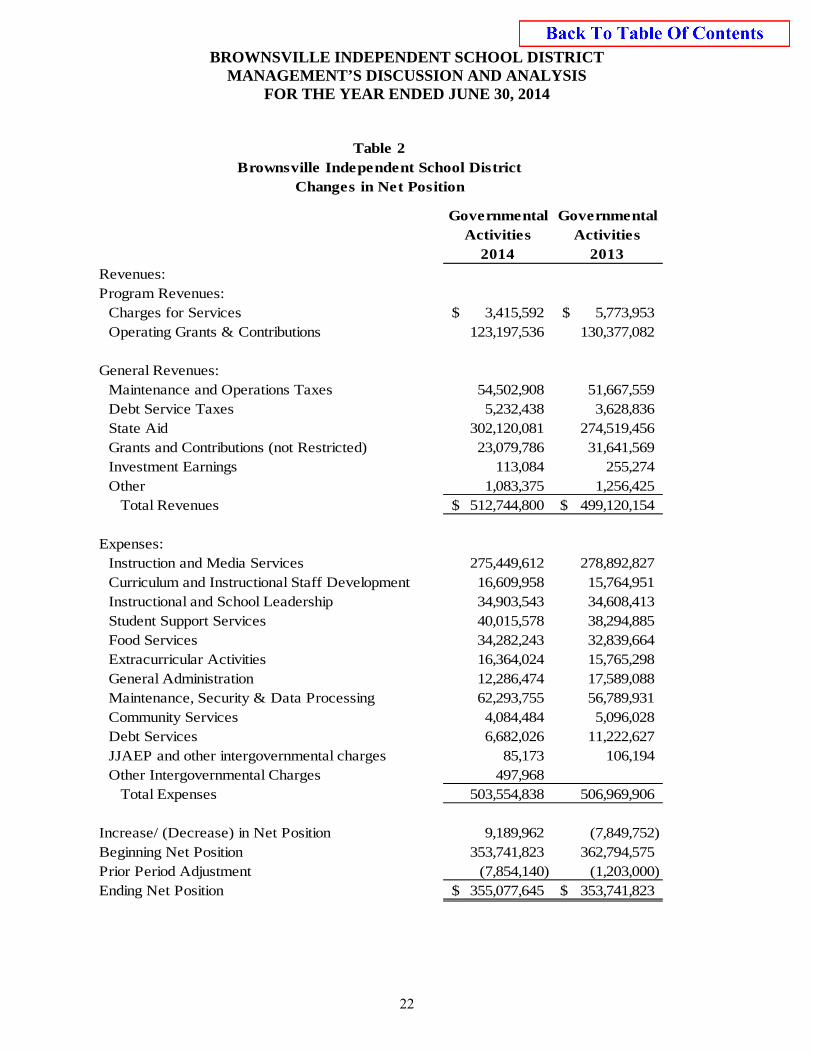
Governmental GovernmentalActivities Activities
2014 2013Revenues:Program Revenues:
Charges for Services 3,415,592$ 5,773,953$ Operating Grants & Contributions 123,197,536 130,377,082
General Revenues:Maintenance and Operations Taxes 54,502,908 51,667,559 Debt Service Taxes 5,232,438 3,628,836 State Aid 302,120,081 274,519,456 Grants and Contributions (not Restricted) 23,079,786 31,641,569 Investment Earnings 113,084 255,274 Other 1,083,375 1,256,425
Total Revenues 512,744,800$ 499,120,154$
Expenses:Instruction and Media Services 275,449,612 278,892,827 Curriculum and Instructional Staff Development 16,609,958 15,764,951 Instructional and School Leadership 34,903,543 34,608,413 Student Support Services 40,015,578 38,294,885 Food Services 34,282,243 32,839,664 Extracurricular Activities 16,364,024 15,765,298 General Administration 12,286,474 17,589,088 Maintenance, Security & Data Processing 62,293,755 56,789,931 Community Services 4,084,484 5,096,028 Debt Services 6,682,026 11,222,627 JJAEP and other intergovernmental charges 85,173 106,194 Other Intergovernmental Charges 497,968
Total Expenses 503,554,838 506,969,906
Increase/ (Decrease) in Net Position 9,189,962 (7,849,752) Beginning Net Position 353,741,823 362,794,575 Prior Period Adjustment (7,854,140) (1,203,000) Ending Net Position 355,077,645$ 353,741,823$
Table 2Brownsville Independent School District
Changes in Net Position
22
BROWNSVILLE INDEPENDENT SCHOOL DISTRICT MANAGEMENT’S DISCUSSION AND ANALYSIS
FOR THE YEAR ENDED JUNE 30, 2014
Changes in Governmental Activities Net Position are presented in Table 2. The District’s total Governmental Activities Revenue is $512,744,800 an increase of $ 13,624,646 from the previous year. This net change is primarily due to an increase in State Aid and Property Taxes revenue. The expenses for governmental activities totaled $503,554,838 a decrease of $ 3,415,068 from the prior year. The majority of the decrease is in General Administration, Instructional Resources and Media Services while increases are seen in Extracurricular Activities, Food Services and Facilities Maintenance and Operations. THE DISTRICT’S FUNDS As of the year ended, June 30, 2014, the District reported a combined Fund Balance of $ 104,473,021 for its governmental funds (as presented on Exhibit C-1 page 29). Total Revenues in the General Fund increased $23,292,658 from the prior year, primarily due to a change in the state funding formula for state revenues and to a property tax rate increase. An increase to Food Service Revenues was due to the implementation of the Breakfast in a Bag program. Total Expenditures in the General Fund increased $ 24,352,501 from the prior year. This increase can be attributed to a pay raise to employees and also to over 3million in technology upgrades, 3.5 million in Facilities Maintenance and Operations, .5 million in Security and Monitoring Services upgrades and to buses for Student Transportation. The Fund Balance of the General Fund increased $ 3,726,446 from the prior year, primarily due to increases of the Unassigned Fund Balance. GENERAL FUND BUDGETARY HIGHLIGHTS Over the course of the year, The School Board of Trustees amended the District’s budget several times. All budget amendments are categorized into four areas: (1) Carryover Funding, (2) New/Additional Funding, (3) Categorical Fund Balance, and (4) Reallocation. The total operating revenue budget was $445,139,810 and finished the year with a budget of $451,382,260. The total operating expenditure budget was $445,139,810 and finished the year with a budget of $465,127,060. This increase of $19,987,250 was due to various necessary budget adjustments including Carry-Over Purchase Orders from the prior school year.
23
BROWNSVILLE INDEPENDENT SCHOOL DISTRICT MANAGEMENT’S DISCUSSION AND ANALYSIS
FOR THE YEAR ENDED JUNE 30, 2014
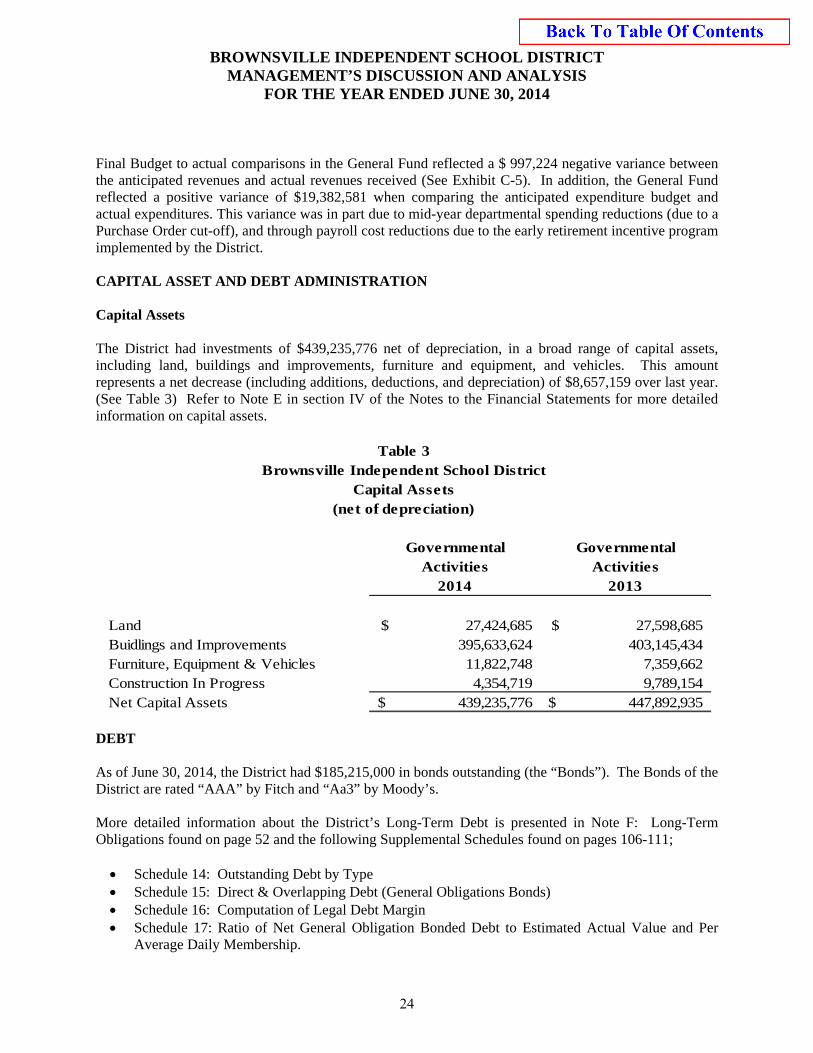
Final Budget to actual comparisons in the General Fund reflected a $ 997,224 negative variance between the anticipated revenues and actual revenues received (See Exhibit C-5). In addition, the General Fund reflected a positive variance of $19,382,581 when comparing the anticipated expenditure budget and actual expenditures. This variance was in part due to mid-year departmental spending reductions (due to a Purchase Order cut-off), and through payroll cost reductions due to the early retirement incentive program implemented by the District. CAPITAL ASSET AND DEBT ADMINISTRATION Capital Assets The District had investments of $439,235,776 net of depreciation, in a broad range of capital assets, including land, buildings and improvements, furniture and equipment, and vehicles. This amount represents a net decrease (including additions, deductions, and depreciation) of $8,657,159 over last year. (See Table 3) Refer to Note E in section IV of the Notes to the Financial Statements for more detailed information on capital assets.
Governmental GovernmentalActivities Activities
2014 2013
Land 27,424,685$ 27,598,685$ Buidlings and Improvements 395,633,624 403,145,434 Furniture, Equipment & Vehicles 11,822,748 7,359,662 Construction In Progress 4,354,719 9,789,154 Net Capital Assets 439,235,776$ 447,892,935$
Table 3Brownsville Independent School District
Capital Assets(net of depreciation)
DEBT As of June 30, 2014, the District had $185,215,000 in bonds outstanding (the “Bonds”). The Bonds of the District are rated “AAA” by Fitch and “Aa3” by Moody’s. More detailed information about the District’s Long-Term Debt is presented in Note F: Long-Term Obligations found on page 52 and the following Supplemental Schedules found on pages 106-111; Schedule 14: Outstanding Debt by Type Schedule 15: Direct & Overlapping Debt (General Obligations Bonds) Schedule 16: Computation of Legal Debt Margin Schedule 17: Ratio of Net General Obligation Bonded Debt to Estimated Actual Value and Per
Average Daily Membership.
24
BROWNSVILLE INDEPENDENT SCHOOL DISTRICT MANAGEMENT’S DISCUSSION AND ANALYSIS
FOR THE YEAR ENDED JUNE 30, 2014
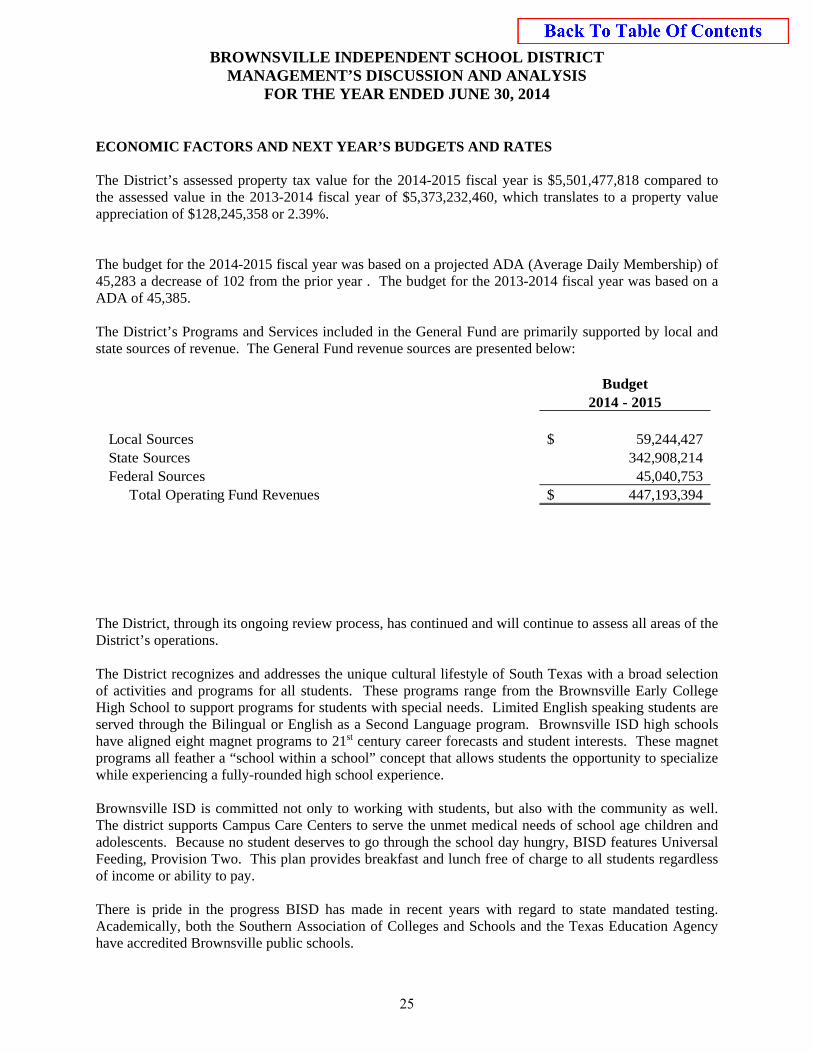
ECONOMIC FACTORS AND NEXT YEAR’S BUDGETS AND RATES The District’s assessed property tax value for the 2014-2015 fiscal year is $5,501,477,818 compared to the assessed value in the 2013-2014 fiscal year of $5,373,232,460, which translates to a property value appreciation of $128,245,358 or 2.39%. The budget for the 2014-2015 fiscal year was based on a projected ADA (Average Daily Membership) of 45,283 a decrease of 102 from the prior year . The budget for the 2013-2014 fiscal year was based on a ADA of 45,385. The District’s Programs and Services included in the General Fund are primarily supported by local and state sources of revenue. The General Fund revenue sources are presented below:
Budget2014 - 2015
Local Sources 59,244,427$ State Sources 342,908,214 Federal Sources 45,040,753
Total Operating Fund Revenues 447,193,394$
The District, through its ongoing review process, has continued and will continue to assess all areas of the District’s operations. The District recognizes and addresses the unique cultural lifestyle of South Texas with a broad selection of activities and programs for all students. These programs range from the Brownsville Early College High School to support programs for students with special needs. Limited English speaking students are served through the Bilingual or English as a Second Language program. Brownsville ISD high schools have aligned eight magnet programs to 21st century career forecasts and student interests. These magnet programs all feather a “school within a school” concept that allows students the opportunity to specialize while experiencing a fully-rounded high school experience. Brownsville ISD is committed not only to working with students, but also with the community as well. The district supports Campus Care Centers to serve the unmet medical needs of school age children and adolescents. Because no student deserves to go through the school day hungry, BISD features Universal Feeding, Provision Two. This plan provides breakfast and lunch free of charge to all students regardless of income or ability to pay. There is pride in the progress BISD has made in recent years with regard to state mandated testing. Academically, both the Southern Association of Colleges and Schools and the Texas Education Agency have accredited Brownsville public schools.
25
BROWNSVILLE INDEPENDENT SCHOOL DISTRICT MANAGEMENT’S DISCUSSION AND ANALYSIS
FOR THE YEAR ENDED JUNE 30, 2014
CONTACTING THE DISTRICT’S FINANCIAL MANAGEMENT This comprehensive financial report is designed to provide our citizens, taxpayers, customers and creditors with a general overview of the District’s finances and to demonstrate the District’s accountability for the money it receives. If you have questions about this report or need additional financial information, contact the District’s Chief Financial Officer, at 1900 E. Price Rd-Suite 306, Brownsville, Texas 78521-2417 or by calling (956) 547-4113.
26
BASIC FINANCIAL STATEMENTS
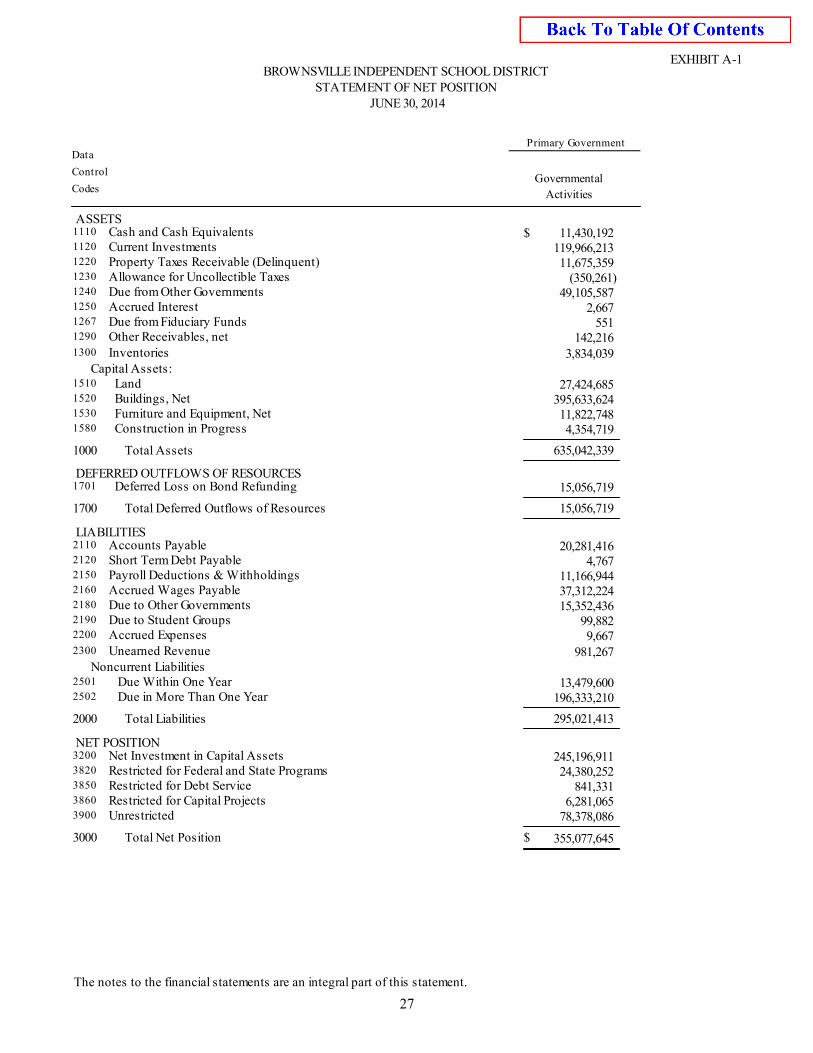
EXHIBIT A-1BROWNSVILLE INDEPENDENT SCHOOL DISTRICT
STATEMENT OF NET POSITIONJUNE 30, 2014
Control
Data
CodesGovernmental
Activities
Primary Government
ASSETS11,430,192 Cash and Cash Equivalents $1110
119,966,213 Current Investments1120
11,675,359 Property Taxes Receivable (Delinquent)1220
(350,261)Allowance for Uncollectible Taxes1230
49,105,587 Due from Other Governments1240
2,667 Accrued Interest1250
551 Due from Fiduciary Funds1267
142,216 Other Receivables, net1290
3,834,039 Inventories1300
Capital Assets:27,424,685 Land1510
395,633,624 Buildings, Net1520
11,822,748 Furniture and Equipment, Net1530
4,354,719 Construction in Progress1580
Total Assets1000 635,042,339
DEFERRED OUTFLOWS OF RESOURCES15,056,719 Deferred Loss on Bond Refunding1701
Total Deferred Outflows of Resources1700 15,056,719
LIABILITIES20,281,416 Accounts Payable2110
4,767 Short Term Debt Payable2120
11,166,944 Payroll Deductions & Withholdings2150
37,312,224 Accrued Wages Payable2160
15,352,436 Due to Other Governments2180
99,882 Due to Student Groups2190
9,667 Accrued Expenses2200
981,267 Unearned Revenue2300
Noncurrent Liabilities13,479,600 Due Within One Year2501
196,333,210 Due in More Than One Year2502
Total Liabilities2000 295,021,413
NET POSITION245,196,911 Net Investment in Capital Assets3200
24,380,252 Restricted for Federal and State Programs3820
841,331 Restricted for Debt Service3850
6,281,065 Restricted for Capital Projects3860
78,378,086 Unrestricted3900
Total Net Position3000 355,077,645 $
The notes to the financial statements are an integral part of this statement.
27
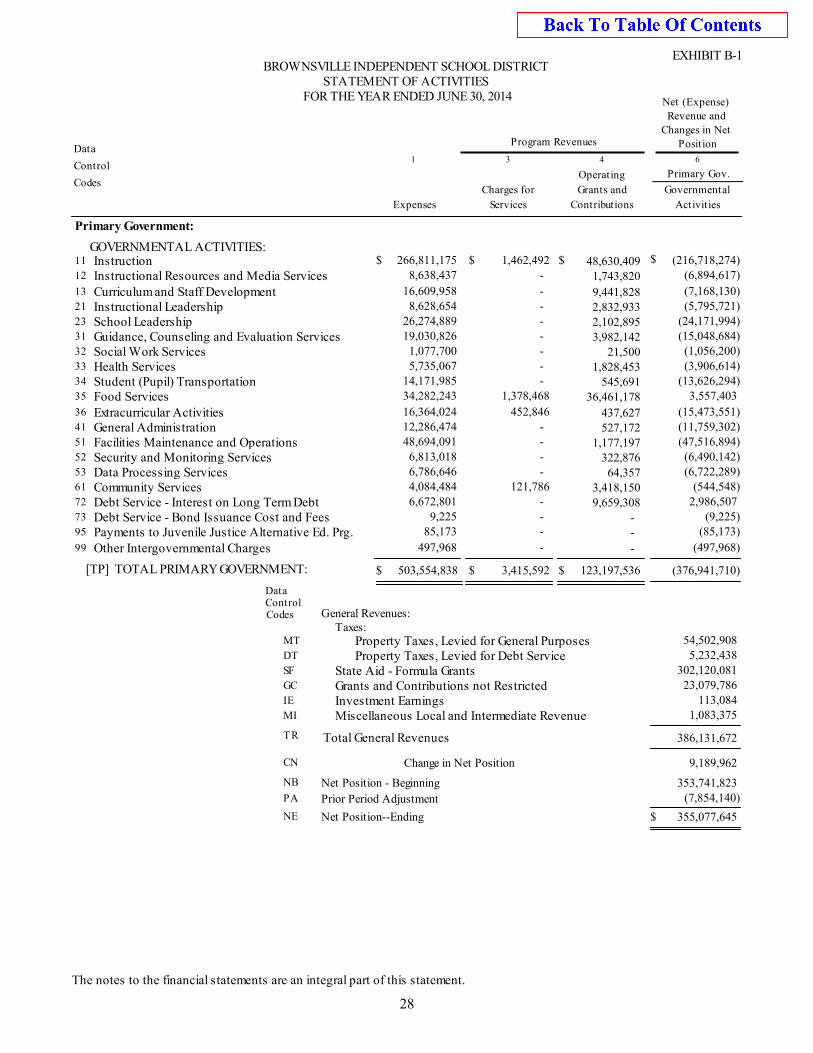
EXHIBIT B-1BROWNSVILLE INDEPENDENT SCHOOL DISTRICT
STATEMENT OF ACTIVITIESFOR THE YEAR ENDED JUNE 30, 2014 Net (Expense)
Revenue and
Changes in Net
PositionProgram RevenuesData
Control
Codes
1 3 4 6
Operating
Grants and
Contributions
Charges for
ServicesExpenses
Governmental
Activities
Primary Gov.
Primary Government:
GOVERNMENTAL ACTIVITIES:1,462,492 266,811,175 48,630,409 (216,718,274)Instruction $ $ $ $11
- 8,638,437 1,743,820 (6,894,617)Instructional Resources and Media Services12
- 16,609,958 9,441,828 (7,168,130)Curriculum and Staff Development13
- 8,628,654 2,832,933 (5,795,721)Instructional Leadership21
- 26,274,889 2,102,895 (24,171,994)School Leadership23
- 19,030,826 3,982,142 (15,048,684)Guidance, Counseling and Evaluation Services31
- 1,077,700 21,500 (1,056,200)Social Work Services32
- 5,735,067 1,828,453 (3,906,614)Health Services33
- 14,171,985 545,691 (13,626,294)Student (Pupil) Transportation34
1,378,468 34,282,243 36,461,178 3,557,403 Food Services35
452,846 16,364,024 437,627 (15,473,551)Extracurricular Activities36
- 12,286,474 527,172 (11,759,302)General Administration41
- 48,694,091 1,177,197 (47,516,894)Facilities Maintenance and Operations51
- 6,813,018 322,876 (6,490,142)Security and Monitoring Services52
- 6,786,646 64,357 (6,722,289)Data Processing Services53
121,786 4,084,484 3,418,150 (544,548)Community Services61
- 6,672,801 9,659,308 2,986,507 Debt Service - Interest on Long Term Debt72
- 9,225 - (9,225)Debt Service - Bond Issuance Cost and Fees73
- 85,173 - (85,173)Payments to Juvenile Justice Alternative Ed. Prg.95
- 497,968 - (497,968)Other Intergovernmental Charges99
[TP] TOTAL PRIMARY GOVERNMENT: 503,554,838 3,415,592 123,197,536 (376,941,710)$ $ $
DataControlCodes General Revenues:
Taxes:54,502,908 Property Taxes, Levied for General PurposesMT
5,232,438 Property Taxes, Levied for Debt ServiceDT
302,120,081 State Aid - Formula GrantsSF
23,079,786 Grants and Contributions not RestrictedGC
113,084 Investment EarningsIE
1,083,375 Miscellaneous Local and Intermediate RevenueMI
386,131,672 Total General RevenuesTR
Net Position - Beginning
Change in Net Position
Net Position--Ending
Prior Period Adjustment
CN
NB
NE
PA
9,189,962
353,741,823 (7,854,140)
355,077,645 $
The notes to the financial statements are an integral part of this statement.
28
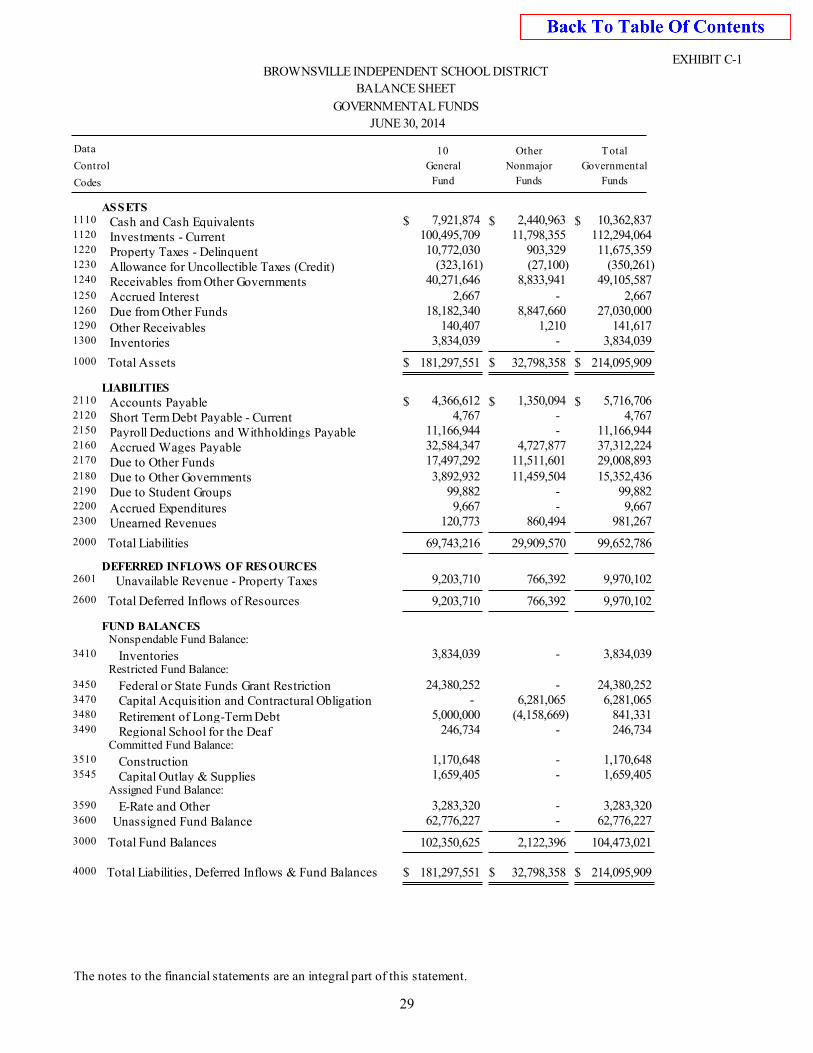
EXHIBIT C-1BROWNSVILLE INDEPENDENT SCHOOL DISTRICT
BALANCE SHEET
GOVERNMENTAL FUNDS
JUNE 30, 2014
Control
Data
Codes
General
Fund Funds
Nonmajor
Other
Funds
Governmental
Total10
ASSETS2,440,963 7,921,874 10,362,837 Cash and Cash Equivalents $ $ $1110
11,798,355 100,495,709 112,294,064 Investments - Current1120
903,329 10,772,030 11,675,359 Property Taxes - Delinquent1220
(27,100)(323,161) (350,261)Allowance for Uncollectible Taxes (Credit)1230
8,833,941 40,271,646 49,105,587 Receivables from Other Governments1240
- 2,667 2,667 Accrued Interest1250
8,847,660 18,182,340 27,030,000 Due from Other Funds1260
1,210 140,407 141,617 Other Receivables1290
- 3,834,039 3,834,039 Inventories1300
Total Assets1000 181,297,551 32,798,358 214,095,909 $ $ $
LIABILITIES1,350,094 4,366,612 5,716,706 Accounts Payable $ $ $2110
- 4,767 4,767 Short Term Debt Payable - Current2120
- 11,166,944 11,166,944 Payroll Deductions and Withholdings Payable2150
4,727,877 32,584,347 37,312,224 Accrued Wages Payable2160
11,511,601 17,497,292 29,008,893 Due to Other Funds2170
11,459,504 3,892,932 15,352,436 Due to Other Governments2180
- 99,882 99,882 Due to Student Groups2190
- 9,667 9,667 Accrued Expenditures2200
860,494 120,773 981,267 Unearned Revenues2300
Total Liabilities2000 69,743,216 29,909,570 99,652,786
DEFERRED INFLOWS OF RESOURCES766,392 9,203,710 9,970,102 Unavailable Revenue - Property Taxes2601
Total Deferred Inflows of Resources2600 9,203,710 766,392 9,970,102
FUND BALANCESNonspendable Fund Balance:
- 3,834,039 3,834,039 Inventories3410
Restricted Fund Balance:
- 24,380,252 24,380,252 Federal or State Funds Grant Restriction3450
6,281,065 - 6,281,065 Capital Acquisition and Contractural Obligation3470
(4,158,669)5,000,000 841,331 Retirement of Long-Term Debt3480
- 246,734 246,734 Regional School for the Deaf3490
Committed Fund Balance: - 1,170,648 1,170,648 Construction3510
- 1,659,405 1,659,405 Capital Outlay & Supplies3545
Assigned Fund Balance:
- 3,283,320 3,283,320 E-Rate and Other3590
- 62,776,227 62,776,227 Unassigned Fund Balance3600
Total Fund Balances3000 102,350,625 2,122,396 104,473,021
Total Liabilities, Deferred Inflows & Fund Balances4000 181,297,551 32,798,358 214,095,909 $ $ $
The notes to the financial statements are an integral part of this statement.
29
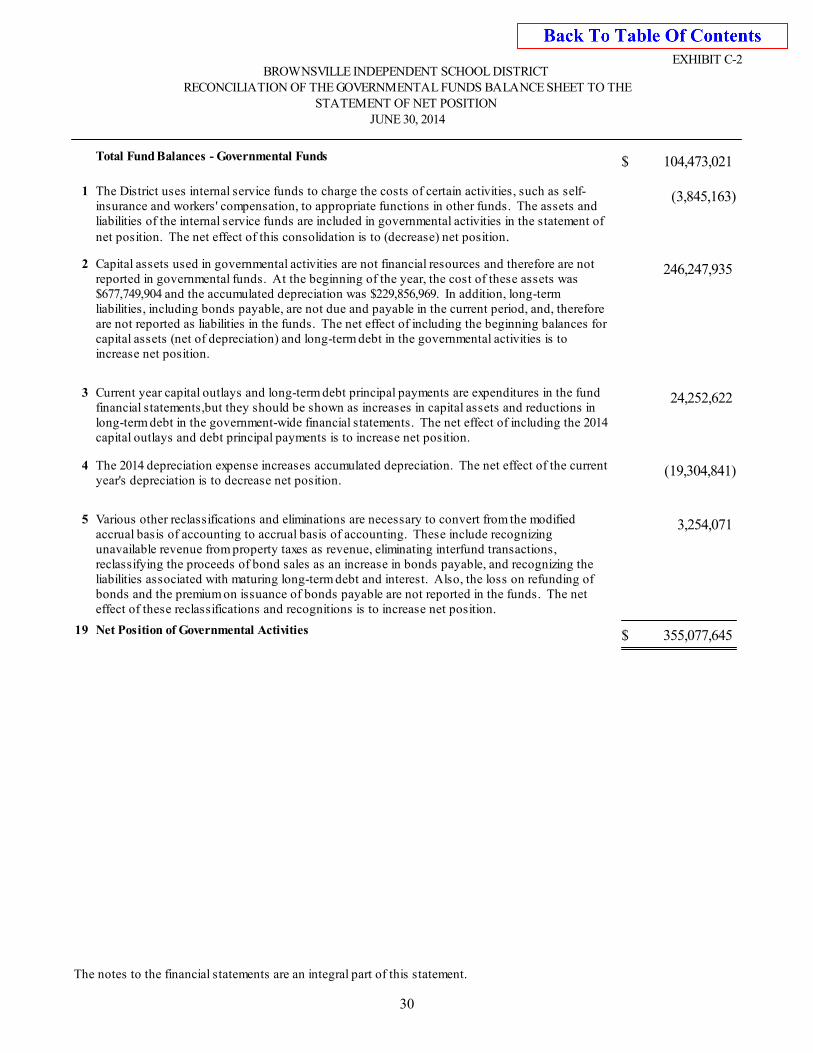
EXHIBIT C-2BROWNSVILLE INDEPENDENT SCHOOL DISTRICT
RECONCILIATION OF THE GOVERNMENTAL FUNDS BALANCE SHEET TO THESTATEMENT OF NET POSITION
JUNE 30, 2014
104,473,021 $Total Fund Balances - Governmental Funds
(3,845,163)1 The District uses internal service funds to charge the costs of certain activities, such as self-insurance and workers' compensation, to appropriate functions in other funds. The assets and liabilities of the internal service funds are included in governmental activities in the statement of net position. The net effect of this consolidation is to (decrease) net position.
246,247,935 2 Capital assets used in governmental activities are not financial resources and therefore are not reported in governmental funds. At the beginning of the year, the cost of these assets was $677,749,904 and the accumulated depreciation was $229,856,969. In addition, long-term liabilities, including bonds payable, are not due and payable in the current period, and, therefore are not reported as liabilities in the funds. The net effect of including the beginning balances for capital assets (net of depreciation) and long-term debt in the governmental activities is to increase net position.
24,252,622 3 Current year capital outlays and long-term debt principal payments are expenditures in the fund financial statements,but they should be shown as increases in capital assets and reductions in long-term debt in the government-wide financial statements. The net effect of including the 2014capital outlays and debt principal payments is to increase net position.
(19,304,841)4 The 2014 depreciation expense increases accumulated depreciation. The net effect of the currentyear's depreciation is to decrease net position.
3,254,071 5 Various other reclassifications and eliminations are necessary to convert from the modified accrual basis of accounting to accrual basis of accounting. These include recognizing unavailable revenue from property taxes as revenue, eliminating interfund transactions, reclassifying the proceeds of bond sales as an increase in bonds payable, and recognizing the liabilities associated with maturing long-term debt and interest. Also, the loss on refunding of bonds and the premium on issuance of bonds payable are not reported in the funds. The net effect of these reclassifications and recognitions is to increase net position.
355,077,645 $19 Net Position of Governmental Activities
The notes to the financial statements are an integral part of this statement.
30
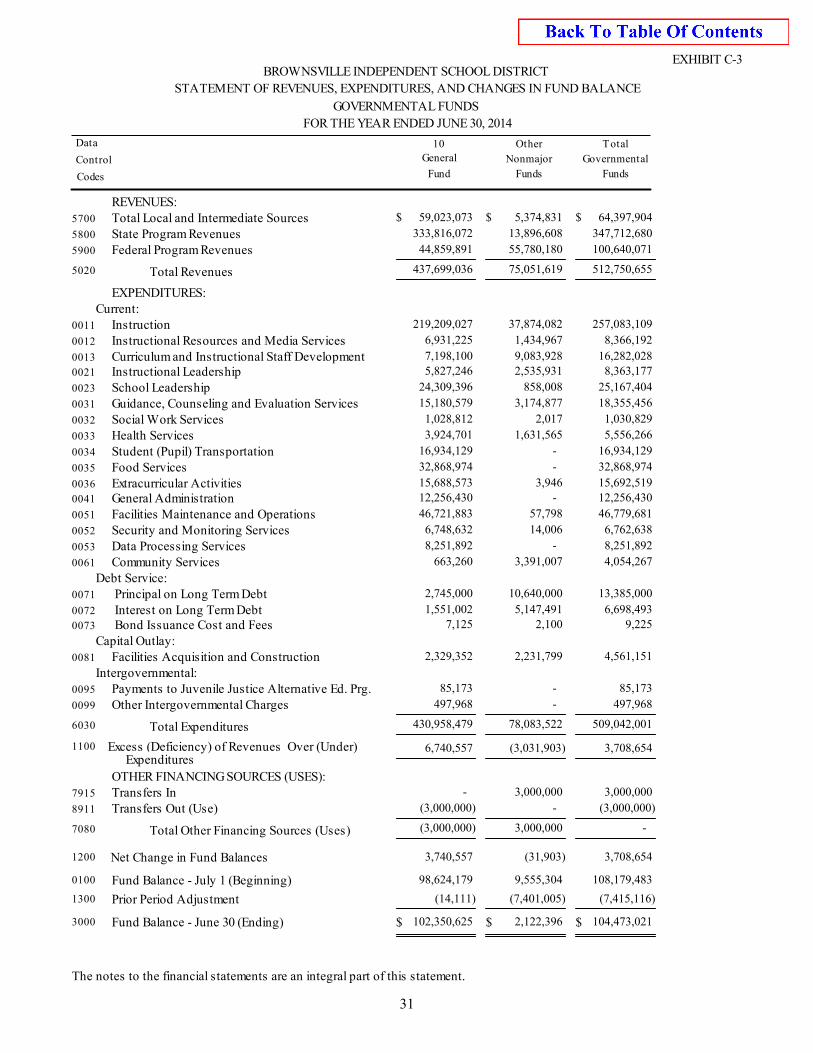
EXHIBIT C-3BROWNSVILLE INDEPENDENT SCHOOL DISTRICT
STATEMENT OF REVENUES, EXPENDITURES, AND CHANGES IN FUND BALANCE
GOVERNMENTAL FUNDS
FOR THE YEAR ENDED JUNE 30, 2014
Control
Data
Codes
10
General
Fund Funds
Nonmajor
Other
Funds
Governmental
Total
REVENUES:5,374,831 59,023,073 64,397,904 Total Local and Intermediate Sources $ $ $5700
13,896,608 333,816,072 347,712,680 State Program Revenues5800
55,780,180 44,859,891 100,640,071 Federal Program Revenues5900
Total Revenues5020 437,699,036 75,051,619 512,750,655
EXPENDITURES:Current:
37,874,082 219,209,027 257,083,109 Instruction0011
1,434,967 6,931,225 8,366,192 Instructional Resources and Media Services0012
9,083,928 7,198,100 16,282,028 Curriculum and Instructional Staff Development0013
2,535,931 5,827,246 8,363,177 Instructional Leadership0021
858,008 24,309,396 25,167,404 School Leadership0023
3,174,877 15,180,579 18,355,456 Guidance, Counseling and Evaluation Services0031
2,017 1,028,812 1,030,829 Social Work Services0032
1,631,565 3,924,701 5,556,266 Health Services0033
- 16,934,129 16,934,129 Student (Pupil) Transportation0034
- 32,868,974 32,868,974 Food Services0035
3,946 15,688,573 15,692,519 Extracurricular Activities0036
- 12,256,430 12,256,430 General Administration0041
57,798 46,721,883 46,779,681 Facilities Maintenance and Operations0051
14,006 6,748,632 6,762,638 Security and Monitoring Services0052
- 8,251,892 8,251,892 Data Processing Services0053
3,391,007 663,260 4,054,267 Community Services0061
Debt Service:10,640,000 2,745,000 13,385,000 Principal on Long Term Debt0071
5,147,491 1,551,002 6,698,493 Interest on Long Term Debt0072
2,100 7,125 9,225 Bond Issuance Cost and Fees0073
Capital Outlay:2,231,799 2,329,352 4,561,151 Facilities Acquisition and Construction0081
Intergovernmental: - 85,173 85,173 Payments to Juvenile Justice Alternative Ed. Prg.0095
- 497,968 497,968 Other Intergovernmental Charges0099
Total Expenditures6030 430,958,479 78,083,522 509,042,001
1100 Excess (Deficiency) of Revenues Over (Under) Expenditures
6,740,557 (3,031,903) 3,708,654
OTHER FINANCING SOURCES (USES): 3,000,000 - 3,000,000 Transfers In7915
- (3,000,000) (3,000,000)Transfers Out (Use)8911
Total Other Financing Sources (Uses) 7080 (3,000,000) 3,000,000 -
1200 Net Change in Fund Balances 3,740,557 (31,903) 3,708,654
0100 Fund Balance - July 1 (Beginning) 98,624,179 9,555,304 108,179,483
1300 Prior Period Adjustment (14,111) (7,401,005) (7,415,116)
3000 Fund Balance - June 30 (Ending) $ 102,350,625 $ 2,122,396 $ 104,473,021
The notes to the financial statements are an integral part of this statement.
31
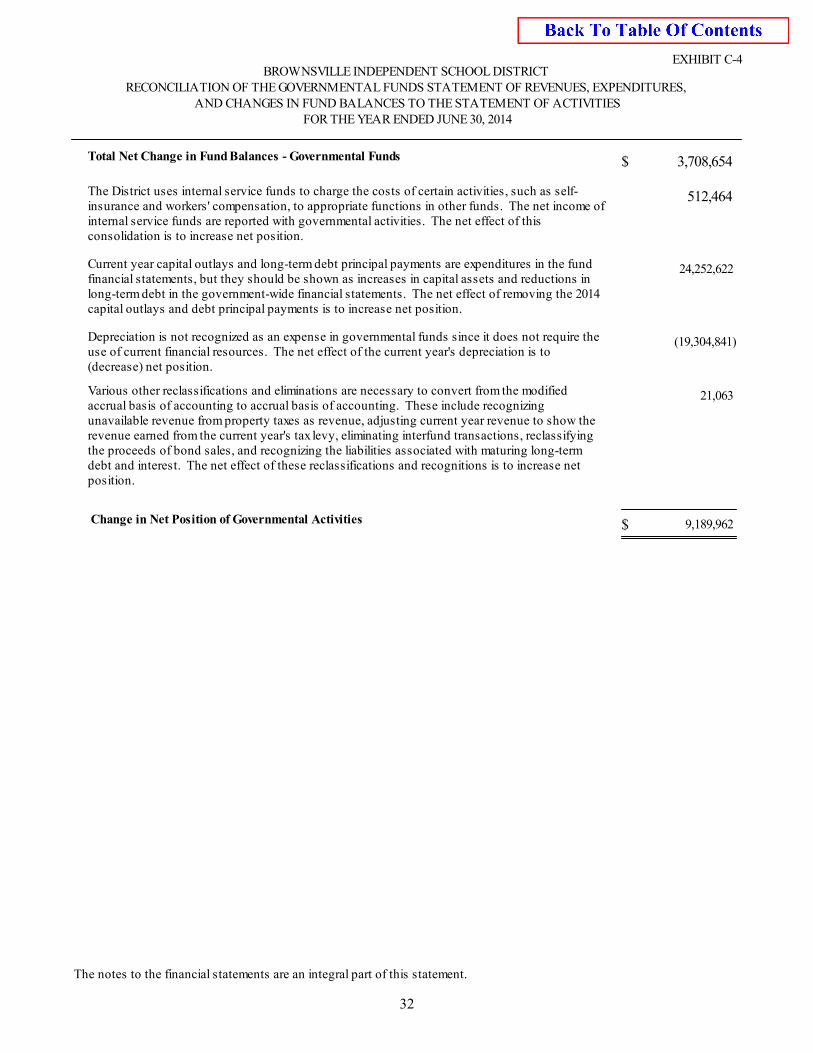
EXHIBIT C-4BROWNSVILLE INDEPENDENT SCHOOL DISTRICT
RECONCILIATION OF THE GOVERNMENTAL FUNDS STATEMENT OF REVENUES, EXPENDITURES,AND CHANGES IN FUND BALANCES TO THE STATEMENT OF ACTIVITIES
FOR THE YEAR ENDED JUNE 30, 2014
3,708,654 $Total Net Change in Fund Balances - Governmental Funds
512,464 The District uses internal service funds to charge the costs of certain activities, such as self-insurance and workers' compensation, to appropriate functions in other funds. The net income of internal service funds are reported with governmental activities. The net effect of this consolidation is to increase net position.
24,252,622 Current year capital outlays and long-term debt principal payments are expenditures in the fund financial statements, but they should be shown as increases in capital assets and reductions in long-term debt in the government-wide financial statements. The net effect of removing the 2014 capital outlays and debt principal payments is to increase net position.
(19,304,841)Depreciation is not recognized as an expense in governmental funds since it does not require the use of current financial resources. The net effect of the current year's depreciation is to (decrease) net position.
21,063 Various other reclassifications and eliminations are necessary to convert from the modified accrual basis of accounting to accrual basis of accounting. These include recognizing unavailable revenue from property taxes as revenue, adjusting current year revenue to show the revenue earned from the current year's tax levy, eliminating interfund transactions, reclassifying the proceeds of bond sales, and recognizing the liabilities associated with maturing long-term debt and interest. The net effect of these reclassifications and recognitions is to increase net position.
9,189,962 $ Change in Net Position of Governmental Activities
The notes to the financial statements are an integral part of this statement.
32
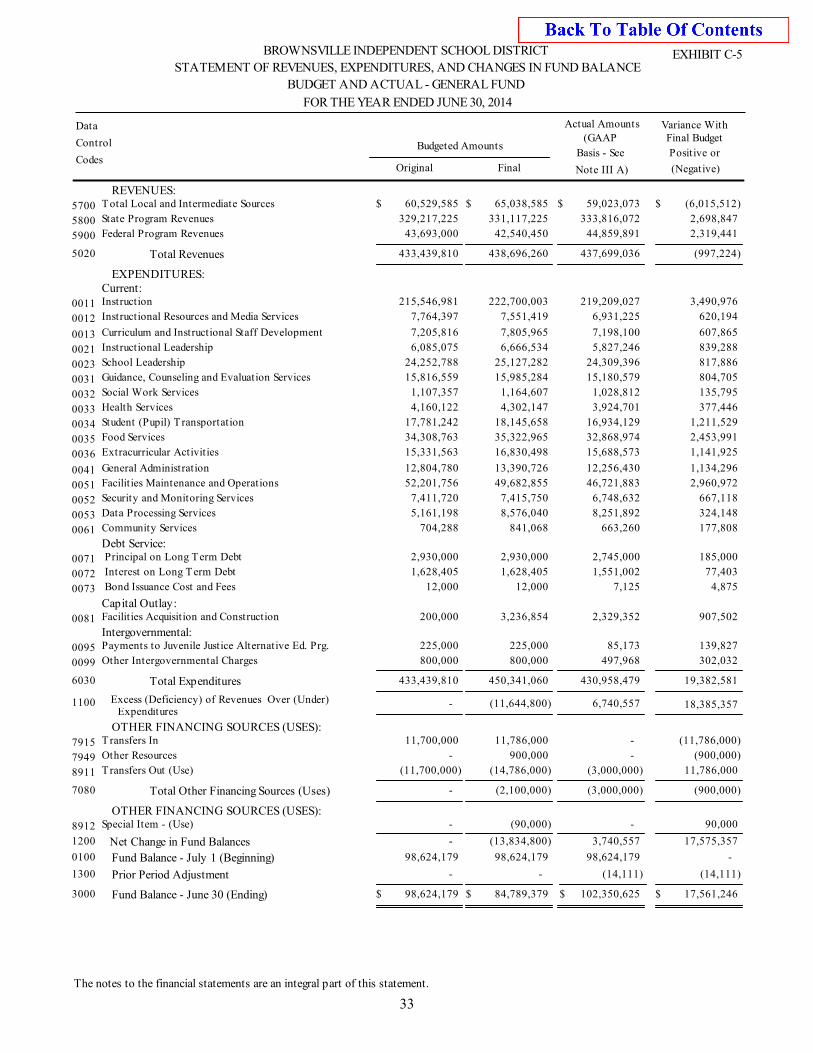
EXHIBIT C-5BROWNSVILLE INDEPENDENT SCHOOL DISTRICT
STATEMENT OF REVENUES, EXPENDITURES, AND CHANGES IN FUND BALANCE
BUDGET AND ACTUAL - GENERAL FUND
FOR THE YEAR ENDED JUNE 30, 2014
Control
Data
CodesOriginal Final Note III A)
Basis - See
(GAAP
(Negative)
Positive or
Final BudgetVariance WithActual Amounts
Budgeted Amounts
REVENUES:65,038,585 60,529,585 59,023,073 (6,015,512)Total Local and Intermediate Sources $ $ $ $5700
331,117,225 329,217,225 333,816,072 2,698,847 State Program Revenues580042,540,450 43,693,000 44,859,891 2,319,441 Federal Program Revenues5900
Total Revenues5020 433,439,810 438,696,260 437,699,036 (997,224)
EXPENDITURES:Current:
222,700,003 215,546,981 219,209,027 3,490,976 Instruction00117,551,419 7,764,397 6,931,225 620,194 Instructional Resources and Media Services0012
7,805,965 7,205,816 7,198,100 607,865 Curriculum and Instructional Staff Development00136,666,534 6,085,075 5,827,246 839,288 Instructional Leadership0021
25,127,282 24,252,788 24,309,396 817,886 School Leadership002315,985,284 15,816,559 15,180,579 804,705 Guidance, Counseling and Evaluation Services0031
1,164,607 1,107,357 1,028,812 135,795 Social Work Services00324,302,147 4,160,122 3,924,701 377,446 Health Services0033
18,145,658 17,781,242 16,934,129 1,211,529 Student (Pupil) Transportation003435,322,965 34,308,763 32,868,974 2,453,991 Food Services003516,830,498 15,331,563 15,688,573 1,141,925 Extracurricular Activities0036
13,390,726 12,804,780 12,256,430 1,134,296 General Administration004149,682,855 52,201,756 46,721,883 2,960,972 Facilities Maintenance and Operations0051
7,415,750 7,411,720 6,748,632 667,118 Security and Monitoring Services00528,576,040 5,161,198 8,251,892 324,148 Data Processing Services0053
841,068 704,288 663,260 177,808 Community Services0061
Debt Service:2,930,000 2,930,000 2,745,000 185,000 Principal on Long Term Debt00711,628,405 1,628,405 1,551,002 77,403 Interest on Long Term Debt0072
12,000 12,000 7,125 4,875 Bond Issuance Cost and Fees0073
Capital Outlay:3,236,854 200,000 2,329,352 907,502 Facilities Acquisition and Construction0081
Intergovernmental:225,000 225,000 85,173 139,827 Payments to Juvenile Justice Alternative Ed. Prg.0095800,000 800,000 497,968 302,032 Other Intergovernmental Charges0099
Total Expenditures6030 433,439,810 450,341,060 430,958,479 19,382,581
1100 Expenditures
- (11,644,800) 6,740,557 18,385,357 Excess (Deficiency) of Revenues Over (Under)
OTHER FINANCING SOURCES (USES): 11,786,000 11,700,000 - (11,786,000)Transfers In7915
900,000 - - (900,000)Other Resources7949(14,786,000)(11,700,000) (3,000,000) 11,786,000 Transfers Out (Use)8911
Total Other Financing Sources (Uses) 7080 - (2,100,000) (3,000,000) (900,000)
OTHER FINANCING SOURCES (USES): (90,000) - - 90,000 Special Item - (Use)8912
1200 Net Change in Fund Balances - (13,834,800) 3,740,557 17,575,357
0100 Fund Balance - July 1 (Beginning) 98,624,179 98,624,179 98,624,179 -
1300 Prior Period Adjustment - - (14,111) (14,111)
3000 Fund Balance - June 30 (Ending) $ 98,624,179 $ 84,789,379 $ 102,350,625 $ 17,561,246
The notes to the financial statements are an integral part of this statement.
33
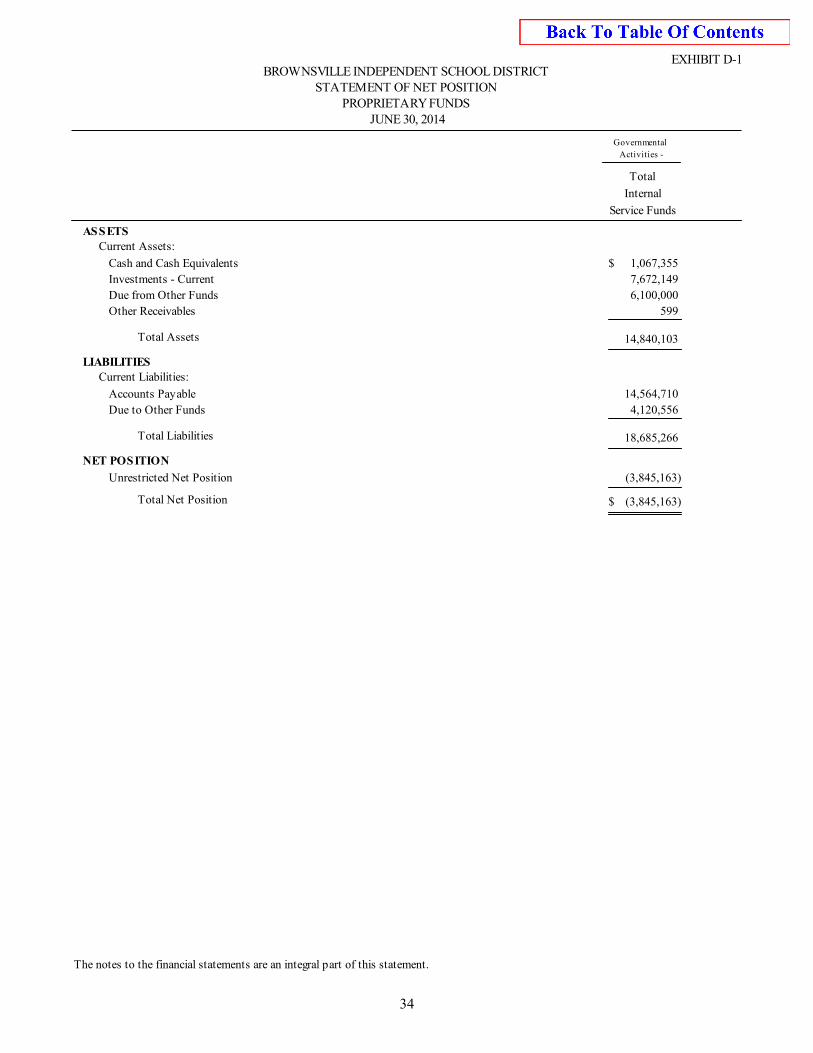
EXHIBIT D-1BROWNSVILLE INDEPENDENT SCHOOL DISTRICT
STATEMENT OF NET POSITIONPROPRIETARY FUNDS
JUNE 30, 2014
Total
Internal
Service Funds
Governmental
Activities -
ASSETSCurrent Assets:
1,067,355 Cash and Cash Equivalents $
7,672,149 Investments - Current
6,100,000 Due from Other Funds
599 Other Receivables
Total Assets 14,840,103
LIABILITIESCurrent Liabilities:
14,564,710 Accounts Payable
4,120,556 Due to Other Funds
Total Liabilities 18,685,266
NET POSITION
(3,845,163)Unrestricted Net Position
Total Net Position (3,845,163)$
The notes to the financial statements are an integral part of this statement.
34
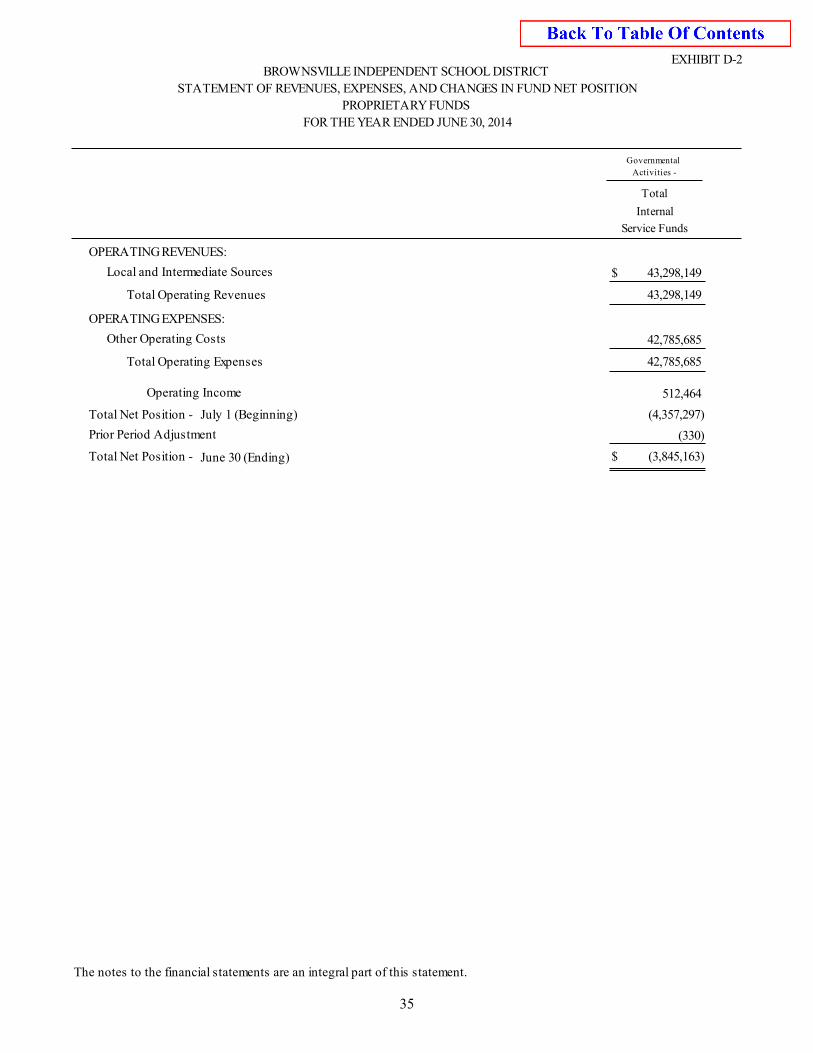
EXHIBIT D-2BROWNSVILLE INDEPENDENT SCHOOL DISTRICT
STATEMENT OF REVENUES, EXPENSES, AND CHANGES IN FUND NET POSITION
PROPRIETARY FUNDS
FOR THE YEAR ENDED JUNE 30, 2014
Total
Internal
Service Funds
Governmental
Activities -
OPERATING REVENUES:
43,298,149 Local and Intermediate Sources $
Total Operating Revenues 43,298,149
OPERATING EXPENSES:
42,785,685 Other Operating Costs
Total Operating Expenses 42,785,685
Operating Income
Total Net Position - July 1 (Beginning)
Prior Period Adjustment
Total Net Position - June 30 (Ending)
512,464
(4,357,297)
(330)
$ (3,845,163)
The notes to the financial statements are an integral part of this statement.
35
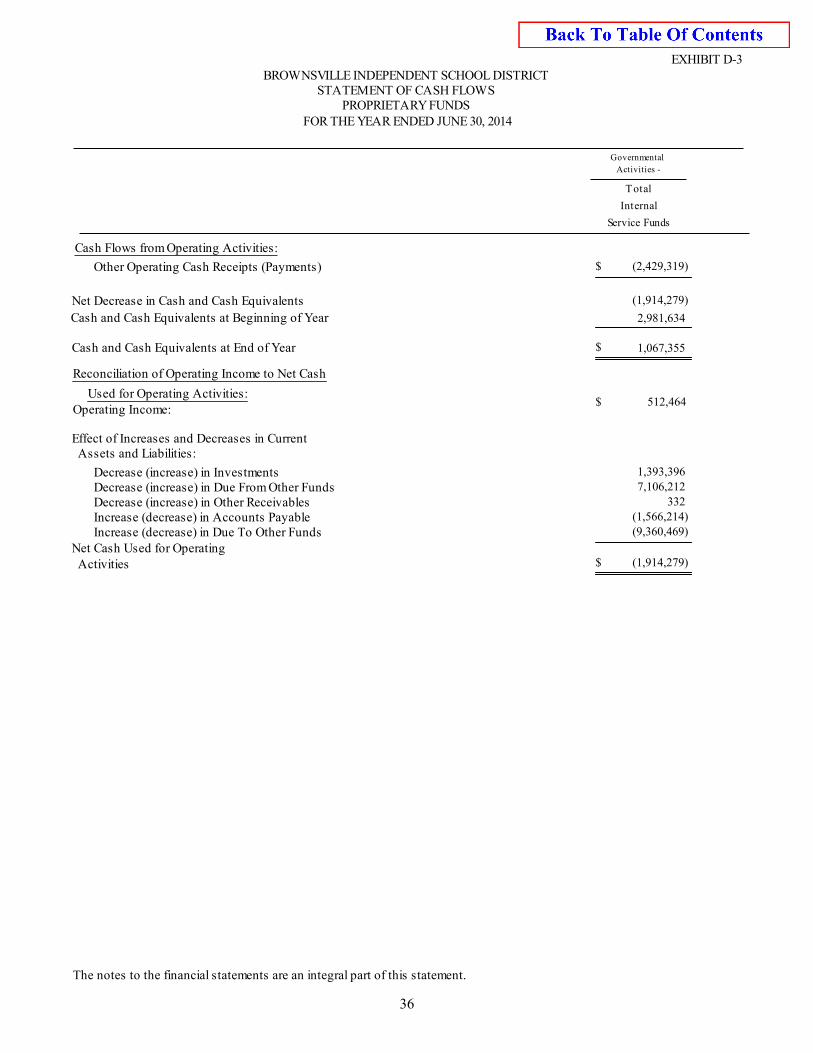
EXHIBIT D-3BROWNSVILLE INDEPENDENT SCHOOL DISTRICT
STATEMENT OF CASH FLOWS
FOR THE YEAR ENDED JUNE 30, 2014PROPRIETARY FUNDS
Total
Internal
Service Funds
Governmental
Activities -
Cash Flows from Operating Activities:
(2,429,319)Other Operating Cash Receipts (Payments) $
Net Decrease in Cash and Cash Equivalents (1,914,279)
Cash and Cash Equivalents at Beginning of Year 2,981,634
Cash and Cash Equivalents at End of Year 1,067,355 $
Operating Income:$
Reconciliation of Operating Income to Net Cash
Used for Operating Activities:512,464
Assets and Liabilities:Effect of Increases and Decreases in Current
1,393,396 Decrease (increase) in Investments7,106,212 Decrease (increase) in Due From Other Funds
332 Decrease (increase) in Other Receivables(1,566,214)Increase (decrease) in Accounts Payable(9,360,469)Increase (decrease) in Due To Other Funds
Net Cash Used for OperatingActivities (1,914,279)$
The notes to the financial statements are an integral part of this statement.
36
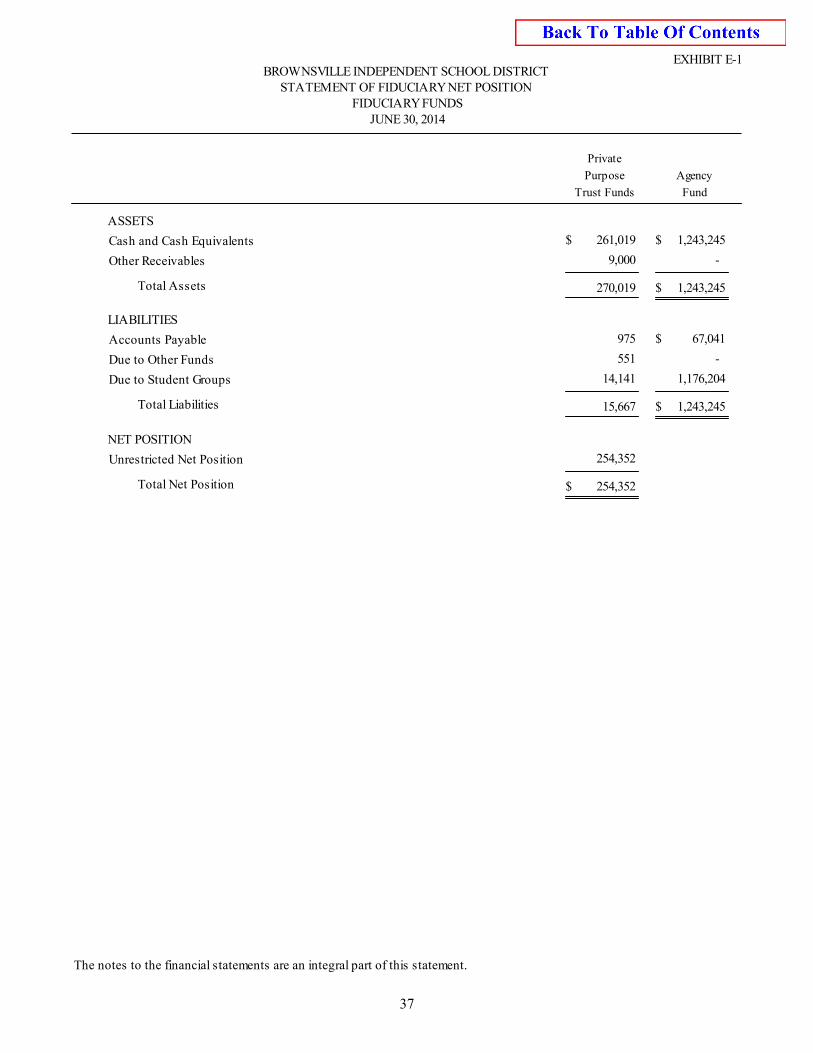
EXHIBIT E-1BROWNSVILLE INDEPENDENT SCHOOL DISTRICT
STATEMENT OF FIDUCIARY NET POSITIONFIDUCIARY FUNDS
JUNE 30, 2014
Private
Purpose
Trust Funds Fund
Agency
ASSETS
1,243,245 261,019 Cash and Cash Equivalents $ $
- 9,000 Other Receivables
Total Assets 270,019 1,243,245 $
LIABILITIES
67,041 975 Accounts Payable $
- 551 Due to Other Funds
1,176,204 14,141 Due to Student Groups
Total Liabilities 15,667 1,243,245 $
NET POSITION
254,352 Unrestricted Net Position
Total Net Position 254,352 $
The notes to the financial statements are an integral part of this statement.
37
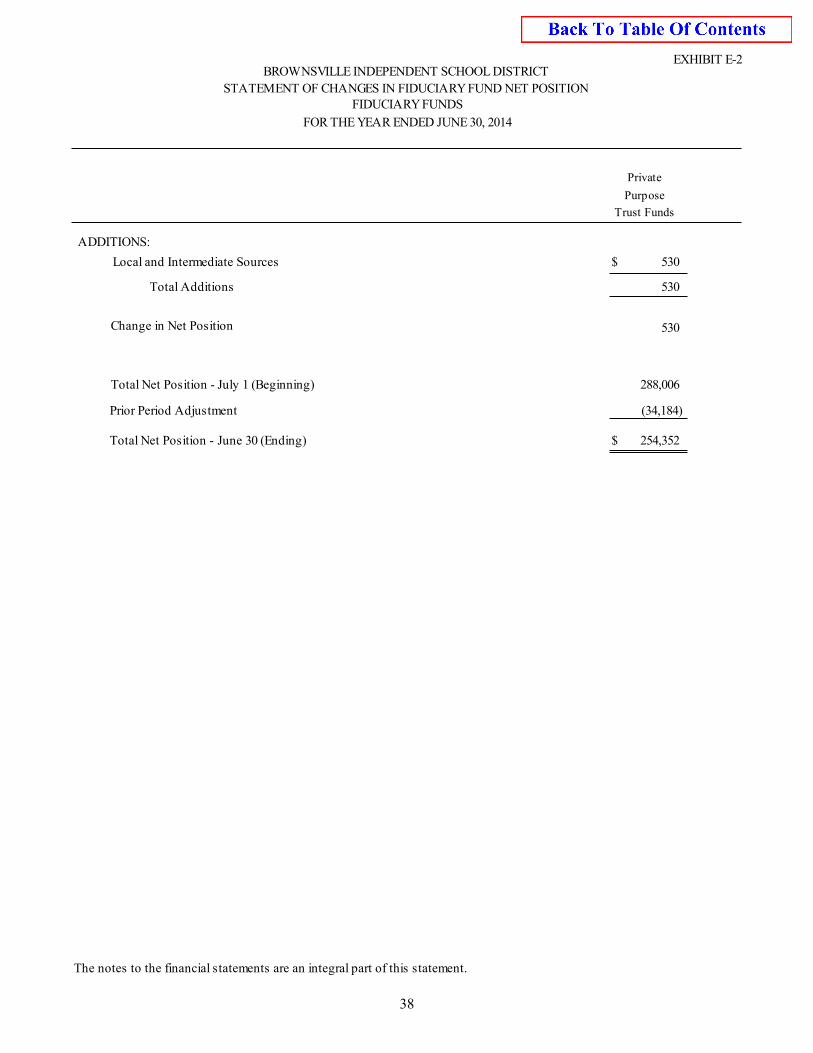
EXHIBIT E-2BROWNSVILLE INDEPENDENT SCHOOL DISTRICT
STATEMENT OF CHANGES IN FIDUCIARY FUND NET POSITIONFIDUCIARY FUNDS
FOR THE YEAR ENDED JUNE 30, 2014
Private
Purpose
Trust Funds
ADDITIONS:
530 Local and Intermediate Sources $
Total Additions 530
Change in Net Position
Total Net Position - July 1 (Beginning)
Prior Period Adjustment
Total Net Position - June 30 (Ending)
530
288,006
(34,184)
$ 254,352
The notes to the financial statements are an integral part of this statement.
38
BROWNSVILLE INDEPENDENT SCHOOL DISTRICT Brownsville, Texas
NOTES TO THE FINANCIAL STATEMENTS
For The Year Ended June 30, 2014
I. SUMMARY OF SIGNIFICANT ACCOUNTING POLICIES
Brownsville Independent School District (the “District”) is a public educational agency operating under the applicable laws and regulations of the State of Texas. The Board of Trustees (“Board”), a seven-member group, has governance responsibilities over all activities related to educational services within the jurisdiction of the District. The District prepares its basic financial statements in conformity with generally accepted accounting principles promulgated by the Governmental Accounting Standards Board and it complies with the requirements of the appropriate version of Texas Education Agency’s Financial Accountability System Resource Guide (the “Resource Guide”) and the requirements of contracts and grants of agencies from which it receives funds.
A. REPORTING ENTITY
The Board is elected by the public and has the authority to make decisions, appoint administrators and managers, significantly influence operations of the district, and has the primary accountability for fiscal matters. The District is not included in any other governmental “reporting entity” as defined by the Governmental Accounting Standards Board (“GASB”) and there are no component units included within the reporting entity.
B. GOVERNMENT-WIDE AND FUND FINANCIAL STATEMENTS
The Statement of Net Position and the Statement of Activities are government-wide financial statements. They report information on the entire District with the interfund activities removed. Governmental activities include programs supported primarily by grants, state foundation funds and other intergovernmental revenues. The Statement of Activities demonstrates how other people or entities that participate in programs the District operates have shared in the payment of the direct costs. The “charges for services” column includes payments made by parties that purchase, use or directly benefit from goods or services provided by a given function or segment of the District. The “grants and contributions” column includes amounts paid by organizations outside the District to help meet the operational or capital requirements of a given function. Examples include grants through the Department of Education, Department of Health & Human Services and Texas Education Agency. If revenue is not program revenue, it is general revenue used to support all of the District’s functions. Interfund activities between governmental funds appear as due to/due froms on the Governmental Fund Balance Sheet and Proprietary Fund Statement of Net Position and as other resources and other uses on the governmental fund Statement of Revenues, Expenditures and Changes in Fund Balance and on the Proprietary Fund Statement of Revenues, Expenses and Changes in Net Position. All interfund transactions between governmental funds and between governmental funds and internal service funds are eliminated on the government-wide statements. The fund financial statements provide reports on the financial condition and results of operations for three fund categories - governmental, proprietary, and fiduciary. Since the resources in the fiduciary funds cannot be used for District operations, they are not included in the government-wide statements. The District considers some governmental funds major and reports their financial condition and results of operations in a separate column. Proprietary funds distinguish operating revenues and expenses from nonoperating items. Operating revenues and expenses result from providing services and producing and delivering goods in connection with a proprietary fund’s principal ongoing operations. All other revenues and expenses are nonoperating.
39
BROWNSVILLE INDEPENDENT SCHOOL DISTRICT Brownsville, Texas
NOTES TO THE FINANCIAL STATEMENTS
For The Year Ended June 30, 2014
I. SUMMARY OF SIGNIFICANT ACCOUNTING POLICIES
C. MEASUREMENT FOCUS, BASIS OF ACCOUNTING AND FINANCIAL STATEMENT PRESENTATION The government-wide financial statements use the economic resources measurement focus and the accrual basis of accounting, as do the proprietary fund and fiduciary fund financial statements. Revenues are recorded when earned and expenses are recorded when a liability is incurred, regardless of the timing of the related cash flows. Grants and similar items are recognized as revenue as soon as all eligibility requirements imposed by the provider have been met. Governmental fund financial statements use the current financial resources measurement focus and the modified accrual basis of accounting. With this measurement focus, only current assets, current liabilities and fund balances are included on the balance sheet. Operating statements of these funds present net increases and decreases in current assets (i.e., revenues and other financing sources and expenditures and other financing uses). The modified accrual basis of accounting recognizes revenues in the accounting period in which they become both measurable and available, and it recognizes expenditures in the accounting period in which the fund liability is incurred, if measurable, except for unmatured interest and principal on long-term debt, which is recognized when due. The expenditures related to certain compensated absences and claims and judgments are recognized when the obligations are expected to be liquidated with expendable available financial resources. The District considers all revenues available if they are collectible within 60 days after year end. Revenues from local sources consist primarily of property tax revenue. Miscellaneous revenues are recorded as revenue when received in cash because they are generally not measurable until actually received. Investment earnings are recorded as earned, since they are both measurable and available. Grant funds are considered to be earned to the extent of expenditures made under the provisions of the grant. Accordingly, when such funds are received, they are recorded as deferred revenues until related and authorized expenditures have been made. If balances have not been expended by the end of the project period, grantors sometimes require the District to refund all or part of the unused amount. The Proprietary Fund Types and Fiduciary Funds are accounted for on a flow of economic resources measurement focus and utilize the accrual basis of accounting. This basis of accounting recognizes revenues in the accounting period in which they are earned and become measurable and expenses in the accounting period in which they are incurred and become measurable. Agency Funds utilize the accrual basis of accounting but do not have a measurement focus as they report only assets and liabilities.
40
BROWNSVILLE INDEPENDENT SCHOOL DISTRICT Brownsville, Texas
NOTES TO THE FINANCIAL STATEMENTS
For The Year Ended June 30, 2014
I. SUMMARY OF SIGNIFICANT ACCOUNTING POLICIES
D. BASIS OF PRESENTATION - FUND ACCOUNTING
The District reports the following major governmental funds:
1. General Fund - is used to account for financial resources used for general operations. This is a budgeted fund and any fund balances are considered resources available for current operations. All revenues and expenditures not required to be accounted for in other funds, are accounted for in this fund.
Additionally, the District reports the following fund type(s): Governmental Funds:
1. Special Revenue Funds - are used to account for resources restricted to, or designated for,
specific purposes by a grantor. Federal and state financial assistance generally is accounted for in a Special Revenue Fund. Normally, unused balances are returned to the grantor at the close of specified project periods.
2. Debt Service Fund - is used to account for resources accumulated and payments made for
principal and interest on long-term general obligation debt of governmental funds in a debt service fund.
2. Capital Projects Fund - is used to account for proceeds from long-term debt financing and
revenues and expenditures related to authorized construction and other capital asset acquisitions.
3. Permanent Funds - is used to account for donations for which the donor has stipulated that the principal may not be expended and where the income may only be used for purposes that support the District’s programs. The District has no permanent funds.
Proprietary Fund:
1. Enterprise Funds - are used to account for those operations that are financed and operated in
a manner similar to private business. The District has no enterprise funds. 2. Internal Service Funds - are used to account for revenues and expenses related to self-
funded insurance and workers’ compensation provided to employees within the District which are accounted for as internal service funds.
Fiduciary Funds:
1. Private Purpose Trust Funds - are used to account for scholarships, which have stipulations
for the participants awarded; only the income may be used for a specific purpose.
2. Agency Funds – are used to account for resources held for others in a custodial capacity in an Agency Fund. The District’s Agency Fund is the Student Activity Funds.
41
BROWNSVILLE INDEPENDENT SCHOOL DISTRICT Brownsville, Texas
NOTES TO THE FINANCIAL STATEMENTS
For The Year Ended June 30, 2014
I. SUMMARY OF SIGNIFICANT ACCOUNTING POLICIES
E. OTHER ACCOUNTING POLICIES
1. For purposes of the statement of cash flows, the District considers highly liquid investments to be cash equivalents if they have a maturity of three months or less when purchased.
2. Inventory is valued at cost (average). The District accounts for school supply and food inventories
by using the consumption method whereby expenditures are recognized only when inventory items are used. Maintenance supplies inventory is accounted for by using the purchase method whereby purchases of inventories are recognized as expenditures when the goods are received and the transaction is vouchered. Reported inventories are equally offset by a fund balance reserve, which indicates that they do not constitute “available spendable resources” even though they are a component of net current assets. Commodity inventory is offset by deferred revenue.
3. Other current assets are prepaid expenses that will benefit periods beyond June 30, 2013. The only
prepaid expenses included are for unexpired insurance policy premiums paid by June 30, 2013, and which extend beyond that date. The reported prepaid insurance is equally offset by a fund balance reserve, which indicates that they do not constitute “available spendable resources” even though they are a component of net current assets.
4. In the government-wide financial statements, and proprietary fund types in the fund financial
statements, long-term obligations are reported as liabilities in the applicable governmental activities statement of net position.
5. Capital assets, which include land, buildings, vehicles, furniture & equipment and construction in
progress, are reported in the applicable governmental activities columns in the government-wide financial statements. Capital assets are defined by the District as assets with an initial, individual cost of more than $5,000 and an estimated useful life in excess of two years. Such assets are recorded at historical cost or estimated historical cost if purchased or constructed. Donated capital assets are recorded at the estimated fair market value at the date of donation.
The costs of normal maintenance and repairs that do not add to the value of the asset or materially extend assets lives are not capitalized. Major outlays for capital assets and improvements are capitalized as projects are constructed. Buildings, vehicles and furniture & equipment of the District are depreciated using the straight line method over the following estimated useful lives:
Assets Years
Buildings & Improvements 50 Vehicles 10 Furniture & Equipment 3-15
6. Interfund activity results from loans, services provided, reimbursements or transfers between funds.
Loans are reported as interfund receivables and payables as appropriate, and are subject to elimination upon consolidation. Services provided are treated as revenues or expenditures. Transfers In and Transfers Out are netted and presented as a single “Transfers” line on the government-wide statement of activities. Similarly, interfund receivables and payables are netted and presented as a single “Internal Balances” line of the government-wide statement of net position.
7. When the District incurs an expense for which it may use either restricted or unrestricted assets, it
uses the restricted assets first unless unrestricted assets will have to be returned because they were not used.
42
BROWNSVILLE INDEPENDENT SCHOOL DISTRICT Brownsville, Texas
NOTES TO THE FINANCIAL STATEMENTS
For The Year Ended June 30, 2014
I. SUMMARY OF SIGNIFICANT ACCOUNTING POLICIES
8. Accumulated compensatory absences that is expected to be liquidated with expendable available resources is reported as an expenditure and a liability in the Governmental Funds only if they have matured.
9. In addition to assets, the statement of financial position will sometimes report a separate section for
deferred outflows of resources. This separate financial statements element, deferred outflows of resources, presents a consumption of net position that applies to a future period(s) and so will not be recognized as an outflow of resources (expense/expenditure) until then. The District only has one item that qualifies for reporting in this category. It is deferred charged on refunding reported in the government-wide statement of net position. A deferred charge on refunding results from the difference in the carrying value of refunded debt and its reacquisition price. This amount is deferred and amortized over the shorter of the life of the refunded or refunding debt. In addition to liabilities, the statement of financial position will sometimes report a separate section for deferred inflows of resources. This separate financial statements element, deferred inflows or resources, represents an acquisition of net position that applies to a future period(s) and so will not be recognized as an inflow of resources (revenue) until that time. The District has only one type of item, which arises only under a modified accrual basis of accounting, which qualifies for reporting in this category. Accordingly, the item, unavailable, is reported only in the governmental funds balance sheet. The governmental funds report unavailable revenues from one source: property taxes. These amounts are deferred and recognized as an inflow of resources in the period that the amounts become available.
10. Net position represents the differences between assets, deferred outflows (inflows) of resources and
liabilities. Net investment in capital assets consists of capital assets, net of accumulated depreciation, reduced by the outstanding balances of any borrowing used for the acquisition, construction or improvements of those assets, and adding back unspent proceeds. Net position is reported as restricted when there are limitations imposed on their use either through the enabling legislations adopted by the District or through external restrictions imposed by creditors, grantors or laws or regulations of other governments.
11. Sometimes the District will fund outlays for a particular purpose from both restricted (e.g., restricted bond and grant proceeds) and unrestricted resources. In order to calculate the amounts to report as restricted – net position and unrestricted – net position in the government-wide financial statements, a flow assumption must be made about the order in which the resources are considered applied. It is the District’s policy to consider restricted – net position to have been depleted before unrestricted – net position is applied.
12. Sometimes the District will fund outlays for a particular purpose from both restricted (the total of
committed, assigned, and unassigned fund balance). In order to calculate the amounts to report as restricted, committed, assigned, and unassigned fund balance in the governmental fund financial statements a flow assumption must be made about the order in which the resources are considered to be applied. It is the District’s policy to consider restricted fund balance to have been depleted before using any of the components of unrestricted fund balance. Further, when the components of unrestricted fund balance can be used for the same purpose, committed fund balance is depleted first, followed by assigned fund balance. Unassigned fund balance is applied last.
13. The governmental fund financial statements present fund balances based on classifications that comprise a hierarchy that is based primarily on the extent to which the District is bound to honor constraints on the specific purposes for which amounts in the respective governmental funds can be spent. The classifications used in the governmental fund financial statements are as follows:
43

BROWNSVILLE INDEPENDENT SCHOOL DISTRICT Brownsville, Texas
NOTES TO THE FINANCIAL STATEMENTS
For The Year Ended June 30, 2014
I. SUMMARY OF SIGNIFICANT ACCOUNTING POLICIES
Nonspendable: This classification includes amounts that cannot be spent because they are either (a) not in spendable form or (b) are legally or contractually required to be maintained intact. Nonspendable items are not expected to be converted to cash or are not expected to be converted to cash within the next year.
Restricted: This classification includes amounts for which constraints have been placed on
the use of the resources either (a) externally imposed by creditors, grantors, contributors, or laws or regulations of other governments, or (b) imposed by law through constitutional provisions or enabling legislation.
Committed: This classification includes amounts that can be used only for specific purposes
pursuant to constraints imposed by board resolution by the Board. The Board's commitment may be modified or rescinded by a majority vote in a scheduled meeting. Board commitments cannot exceed the amount of fund balance that is greater than the sum of non-spendable and restricted fund balances since that practice would commit funds that the District does not have. Board commitments must occur before the end of the reporting period with amounts to be determined subsequently.
Assigned: This classification includes amounts that are constrained by the District’s intent to
be used for a specific purpose but are neither restricted nor committed. This intent can be expresses by the Board, the Superintendent, or Superintendent’s designee.
Unassigned: This classification includes the residual fund balance for the General Fund.
The unassigned classification also includes negative residual fund balance of any other governmental fund that cannot be eliminated by offsetting of assigned fund balance amounts.
The order of spending and availability shall be to reduce funds from the listed areas in the following order: restricted, committed, assigned, and unassigned.
14. The Data Control Codes refer to the account code structure prescribed by TEA in the Financial
Accountability System Resource Guide. The Texas Education Agency requires school districts to display these codes in the financial statements filed with the Agency in order to insure accuracy in building a statewide data base for policy development and funding plans.
15. Compensated absences for the District consist of vacation days not taken during the year are not
accumulated and carried over to subsequent years. Local sick leave is however, accumulated, but only paid to the employee upon retirement up to a maximum of 30 days. The estimated amount of sick leave expected to be paid at retirement during the year ended June 30, 2013, is $597,408, and an accrual has been made. A liability for these amounts is reported in governmental funds only if they have matured, as a result of employee resignation and/or retirement.
II. RECONCILIATION OF GOVERNMENT-WIDE & FUND FINANCIAL STATEMENTS
A. EXPLANATION OF DIFFERENCES BETWEEN THE GOVERNMENTAL FUND BALANCE SHEET AND THE GOVERNMENT-WIDE STATEMENT OF NET POSITION Exhibit C-2 provides the reconciliation between the fund balance for total governmental funds on the governmental fund balance sheet and the net position for governmental activities as reported in the government-wide statement of net position.
44
BROWNSVILLE INDEPENDENT SCHOOL DISTRICT Brownsville, Texas
NOTES TO THE FINANCIAL STATEMENTS
For The Year Ended June 30, 2014
II. RECONCILIATION OF GOVERNMENT-WIDE & FUND FINANCIAL STATEMENTS One element of that reconciliation explains that capital assets are not financial resources and are therefore not reported in governmental funds. In addition, long-term liabilities, including capital leases payable, are not due and payable in the current period and are not reported as liabilities in the funds. The details of capital assets and long-term debt at the beginning of the year were as follows:
Capital Assets at the Historic Accumulated Net Value at the Change in
Beginning of Year Cost Depreciation Beginning of Year Net Position
Land 27,598,685$ -$ 27,598,685$ Buildings & Improvements 598,785,636 (195,640,202) 403,145,434 Vehicles 23,578,729 (20,770,332) 2,808,397 Furniture & Equipment 17,997,700 (13,446,435) 4,551,265 Construction in Progress 9,789,154 - 9,789,154
Change in Net Position 447,892,935$
Long -Term Liabilities at the Payable at the
Beginning of Year Beginning of Year
Bonds Payable (197,910,000)$ Notes Payable (3,735,000) Change in Net Position (201,645,000)
Net Adjustment to Net Position 246,247,935$
II. RECONCILIATION OF GOVERNMENT-WIDE & FUND FINANCIAL STATEMENTS
B. EXPLANATION OF DIFFERENCES BETWEEN THE GOVERNMENTAL FUND STATEMENT OF REVENUES, EXPENDITURES AND CHANGES IN FUND BALANCES AND THE GOVERNMENT-WIDE STATEMENT OF ACTIVITIES
Exhibit C-4 provides reconciliation between the net changes in fund balance as shown on the governmental fund statement of revenues, expenditures and changes in fund balances and the changes in net position of governmental activities as reported on the government-wide statement of activities. One element of that reconciliation explains that current year capital outlays and debt principal payments are expenditures in the fund financial statements, but should be shown as increases in capital assets and decreases in long-term debt in the government-wide statements. This adjustment affects both the net asset balance and the change in net position. The details of this adjustment are as follows:
45
BROWNSVILLE INDEPENDENT SCHOOL DISTRICT Brownsville, Texas
NOTES TO THE FINANCIAL STATEMENTS
For The Year Ended June 30, 2014
II. RECONCILIATION OF GOVERNMENT-WIDE & FUND FINANCIAL STATEMENTS
Adjustments to Adjustments in
Current Year Capital Outlay Amount Changes in Net Position Net Position
Land -$ -$ Buildings & Improvements 191,550 191,550 Furniture & Equipment 2,336,612 2,336,612 Vehicles 4,124,288 4,124,288 Construction in Progress 4,215,172 4,215,172 Total Capital Outlay 10,867,622$
Debt Principal Payments Note Payable (690,000) (690,000) Bonds Payable (12,695,000) (12,695,000) Total Principal Payments (13,385,000) (13,385,000) (13,385,000)
Net Adjustment to Net Position (2,517,378)$
III. STEWARDSHIP, COMPLIANCE AND ACCOUNTABILITY
A. BUDGETARY DATA
The Board of Trustees adopts an “appropriated budget” on a basis consistent with generally accepted accounting principles for the General Fund, Debt Service Fund and Food Service Fund (which is included in the General Fund). The District is required to present the adopted and final amended budgeted revenues and expenditures for these three funds. The General Fund Budget report is presented in Exhibit C-5 and the Child Nutrition Program Budget and Debt Service Fund Budget report is presented in Exhibit J-4 and J-5. The following procedures are followed in establishing the budgetary data reflected in the basic financial statements: 1. Prior to June 20th the District prepares a budget for the next succeeding fiscal year beginning July
1st. The operating budget includes proposed expenditures and the means of financing them.
2. A meeting of the Board is then called for the purpose of adopting the proposed budget. Public notice of the meeting must be given at least ten days prior to the meeting.
3. Prior to July 1st, the budget is legally enacted through passage of a resolution by the Board. Once a budget is approved, it can only be amended at the function and fund level by approval of a majority of the members of the Board. Amendments are presented to the Board at its regular meetings. Each amendment must have Board approval. As required by law, such amendments are made before the fact, are reflected in the official minutes of the Board, and are not made after fiscal year-end. During the year, the budget was amended as necessary.
4. Each budget is controlled by the budget coordinator at the revenue and expenditure functions or object level. Budgeted amounts are as amended by the Board. All budget appropriations lapse at year-end.
5. Encumbrances for goods or purchased services are documented by purchase orders or contracts. Under Texas law, appropriations lapse at June 30th, and encumbrances outstanding at that time are to be either canceled or appropriately provided for in the subsequent year’s budget.
46
BROWNSVILLE INDEPENDENT SCHOOL DISTRICT Brownsville, Texas
NOTES TO THE FINANCIAL STATEMENTS
For The Year Ended June 30, 2014
IV. DETAILED NOTES ON ALL FUNDS A. DEPOSITS AND INVESTMENTS
The funds of the District must be deposited and invested under the terms of a contract, contents of which are set out in the Depository Contract Law. The depository bank places approved pledged securities for safekeeping and trust with counterparty’s trust department in the Districts name in an amount sufficient to protect District funds on a day-to-day basis during the period of the contract. The pledge of approved securities is waived only to the extent of the depository bank's dollar amount of Federal Deposit Insurance Corporation (“FDIC”) insurance. At June 30, 2014, the carrying amount of the District’s deposits, including agency funds, was $12,934,457, and the bank balance was $13,496,248. The District's cash deposits at June 30, 2014 and during the year, except as listed below, were covered by FIDIC insurance or by pledged collateral held by the District’s agent bank in the District’s name. The District monitors cash flows regularly when TEA funds are received to ensure that the bank pledges sufficient collateral.
In addition, the following is disclosed regarding coverage of combined balances on the date of highest deposit:
a. Depository: Wells Fargo Bank, N.A.
b. The market value of securities pledged as of the date of the highest combined balance on deposit was $13,787,123.
c. The highest combined balances of cash, savings, and time deposit accounts amounted to $28,702,288 and occurred during the month of July 2013.
d. Total amount of FDIC coverage at the time of the highest combined balance was $250,000. District Policies and Legal Contractual Provisions Governing Deposits
Custodial Credit Risk for Deposits – State law requires governmental entities to contract with financial institutions in which funds will be deposited to secure on deposit at the end of each business day. The pledged securities must be in the name of the governmental entity and held by the entity or its agent. Since the District complies with this law, it has no custodial risk for deposits.
Foreign Currency Risk for Deposits – The District limits the risk that changes in exchange rates will adversely affect the fair value of a deposit. At year-end, the District was not exposed to foreign currency risk.
District Policies and Legal Contractual Provisions Governing Investments
The Public Funds Investment Act (Government Code Chapter 2256) contains specific provisions in the areas of investment practices, management reports and establishment of appropriate policies. Among other things, it requires the District to adopt, implement, and publicize an investment policy. The policy must address the following areas: (1) safety of principal and liquidity, (2) portfolio diversification, (3) allowable investments, (4) acceptable risk levels, (5) expected rates of return, (6) maximum allowable stated maturity of portfolio investments, (7) maximum average dollar-weighted maturity allowed based on the stated maturity date for the portfolio, (8) investment staff quality and capabilities, (9) and bid solicitation preferences for certificates of deposit.
47
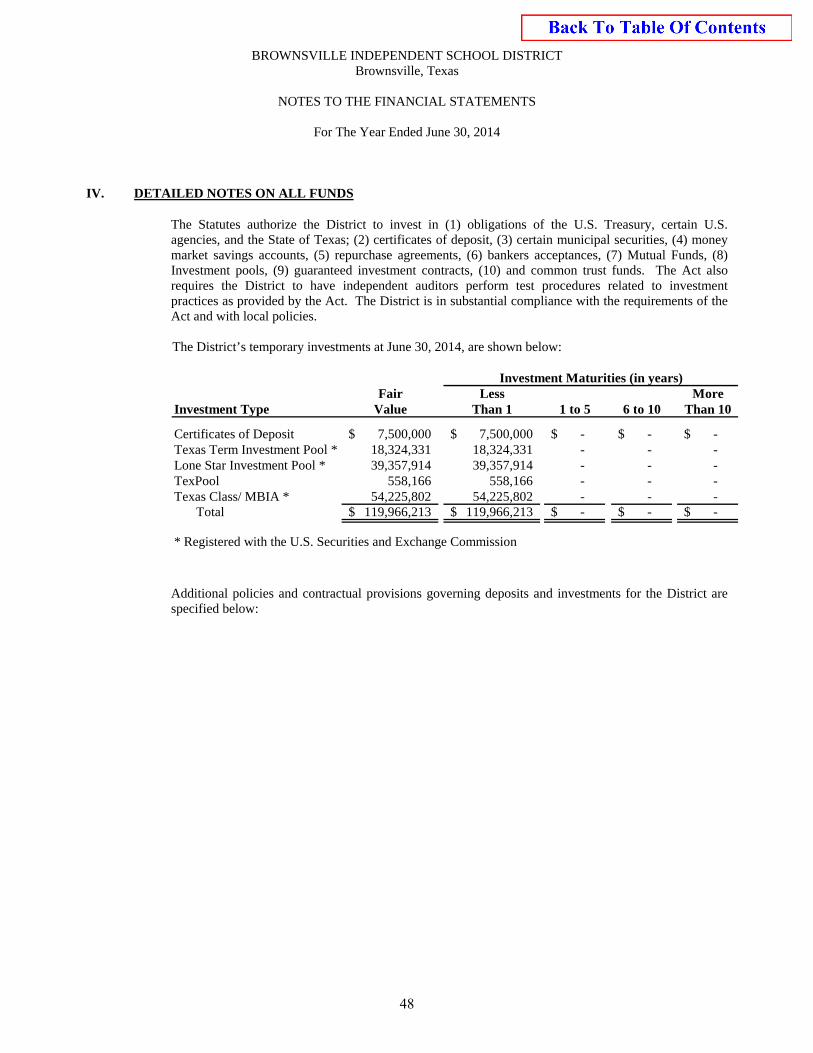
BROWNSVILLE INDEPENDENT SCHOOL DISTRICT Brownsville, Texas
NOTES TO THE FINANCIAL STATEMENTS
For The Year Ended June 30, 2014
IV. DETAILED NOTES ON ALL FUNDS
The Statutes authorize the District to invest in (1) obligations of the U.S. Treasury, certain U.S. agencies, and the State of Texas; (2) certificates of deposit, (3) certain municipal securities, (4) money market savings accounts, (5) repurchase agreements, (6) bankers acceptances, (7) Mutual Funds, (8) Investment pools, (9) guaranteed investment contracts, (10) and common trust funds. The Act also requires the District to have independent auditors perform test procedures related to investment practices as provided by the Act. The District is in substantial compliance with the requirements of the Act and with local policies. The District’s temporary investments at June 30, 2014, are shown below:
Fair Less MoreInvestment Type Value Than 1 1 to 5 6 to 10 Than 10
Certificates of Deposit 7,500,000$ 7,500,000$ -$ -$ -$ Texas Term Investment Pool * 18,324,331 18,324,331 - - - Lone Star Investment Pool * 39,357,914 39,357,914 - - - TexPool 558,166 558,166 - - - Texas Class/ MBIA * 54,225,802 54,225,802 - - -
Total 119,966,213$ 119,966,213$ -$ -$ -$
* Registered with the U.S. Securities and Exchange Commission
Investment Maturities (in years)
Additional policies and contractual provisions governing deposits and investments for the District are specified below:
48
BROWNSVILLE INDEPENDENT SCHOOL DISTRICT Brownsville, Texas
NOTES TO THE FINANCIAL STATEMENTS
For The Year Ended June 30, 2014
IV. DETAILED NOTES ON ALL FUNDS
Credit Risk – In accordance with state law and the District’s investment policy, investments in mutual funds and investment pools must be rated at least AAA or have an equivalent rating, commercial paper must be rated at least A-1, P-1 or have an equivalent rating, and obligations of states, agencies, counties, and cities must be at least A or its equivalent. As of June 30, 2014, the District’s investments in Lone Star Investment Pool were rated AAAf/S1 by Standard and Poor’s (S&P), TexPool was rated AAAm by Standard and Poor’s (S&P), Texas Term was rated AAAf by Standard and Poor’s (S&P), and MBIA was rated AAA/m by Standard and Poor’s Ratings Services.
Custodial Risk for Investments – For an investment, this is the risk that, in the event of the failure of the counterparty, the District will not be able to recover the value of its investments or collateral securities that are in the possession of an outside party. All investments held by third parties were fully collateralized and held in the District’s name.
Concentration of Credit Risk – The investment portfolio is diversified in terms of investment instruments and maturity scheduling to reduce risk of loss resulting from over concentration of assets in specific class of investments, specific maturity or specific issuer. As of June 30, 2014, the District had 6% of its investments in certificates of deposits in its depository bank, BBVA Compass Bank. These certificates of deposit were fully covered by eligible pledged securities. The District had 94% of its investments in TASB investment pools rated AAA as noted above.
Interest Rate Risk – In accordance with state law and the District’s investment policy, the District does not purchase any investments greater than five (5) years for its operating funds.
Foreign Currency Risk for Investments – The District limits the risk that changes in exchange rates will adversely affect the fair value of an investment. At year-end, the District was not exposed to foreign currency risk.
B. PROPERTY TAXES
Property taxes are considered available when collected within the current period or expected to be collected soon enough thereafter to be used to pay liabilities of the current period. The District levies its taxes on October 1st in conformity with Subtitle E, Texas Property Tax Code. The assessed value of the property tax roll on August 1, 2013, upon which the levy for the 2013-2014 fiscal year was based, as $5,373,232,460. Taxes are due upon receipt of the tax bill and are past due and subject to interest if not paid by February 1st of the year following the October 1st levy date. Taxes are delinquent if not paid by June 30th. Delinquent taxes are subject to both penalty and interest charges plus 15% delinquent collection fees for attorney costs. The tax rates assessed for the year ended June 30, 2014, to finance General Fund operations and the payment of principal and interest on general obligation long-term debt were $1.040000 and $0.102155 per $100 valuation, respectively, for a total of $1.142155 per $100 valuation. Current tax collections for the year ended June 30, 2014, were 93% of the year-end adjusted tax levy. Delinquent taxes are prorated between maintenance and debt service based on rates adopted for the year of the levy. Allowances for uncollectible taxes within the General and Debt Service Funds are based on historical experience in collecting taxes. Uncollectible personal property taxes are periodically reviewed and written off, but the District is prohibited from writing off real property taxes without specific statutory authority from the Texas Legislature. As of June 30, 2014, property taxes receivable of $10,772,030 and $903,329, net of estimated uncollectible taxes of $323,161 and $27,100, totaled $10,448,869 and $876,229 for the General and Debt Service Funds, respectively.
49
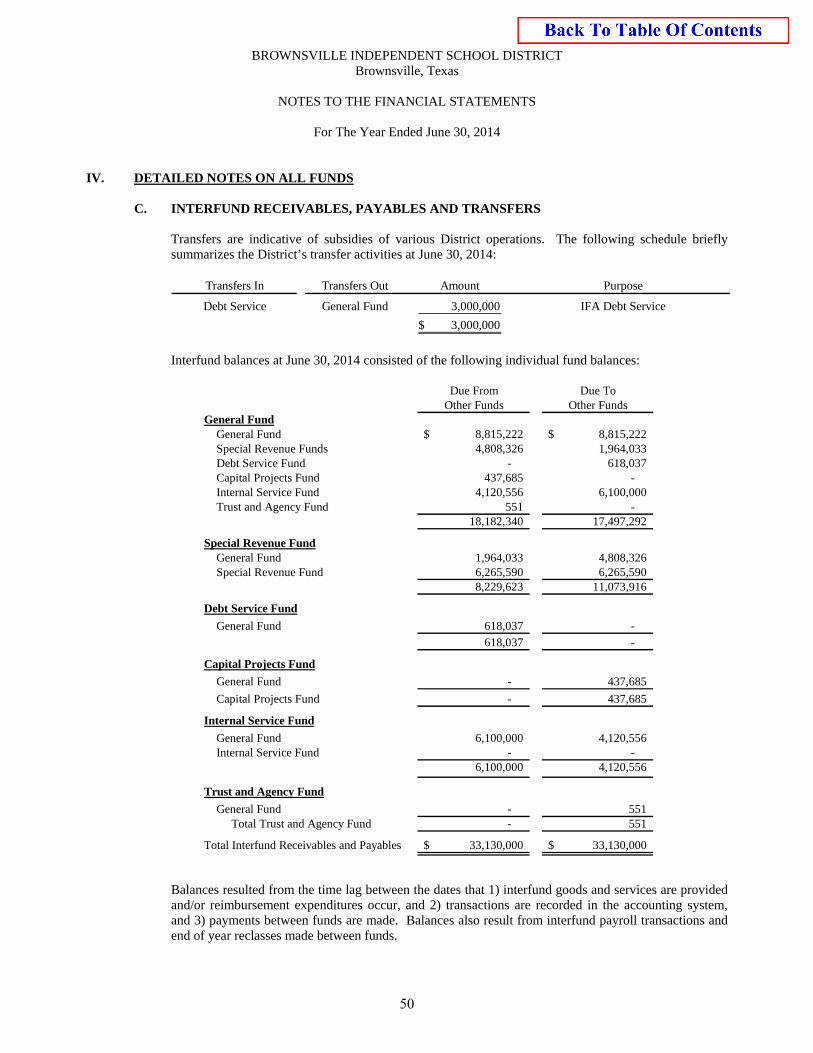
BROWNSVILLE INDEPENDENT SCHOOL DISTRICT Brownsville, Texas
NOTES TO THE FINANCIAL STATEMENTS
For The Year Ended June 30, 2014
IV. DETAILED NOTES ON ALL FUNDS C. INTERFUND RECEIVABLES, PAYABLES AND TRANSFERS
Transfers are indicative of subsidies of various District operations. The following schedule briefly summarizes the District’s transfer activities at June 30, 2014:
Transfers In Transfers Out Amount Purpose
Debt Service General Fund 3,000,000 IFA Debt Service
3,000,000$
Interfund balances at June 30, 2014 consisted of the following individual fund balances:
Due From Due ToOther Funds Other Funds
General FundGeneral Fund 8,815,222$ 8,815,222$ Special Revenue Funds 4,808,326 1,964,033 Debt Service Fund - 618,037 Capital Projects Fund 437,685 - Internal Service Fund 4,120,556 6,100,000 Trust and Agency Fund 551 -
18,182,340 17,497,292
Special Revenue FundGeneral Fund 1,964,033 4,808,326 Special Revenue Fund 6,265,590 6,265,590
8,229,623 11,073,916
Debt Service Fund
General Fund 618,037 -
618,037 -
Capital Projects Fund
General Fund - 437,685
Capital Projects Fund - 437,685
Internal Service Fund
General Fund 6,100,000 4,120,556 Internal Service Fund - -
6,100,000 4,120,556
Trust and Agency Fund
General Fund - 551 Total Trust and Agency Fund - 551
Total Interfund Receivables and Payables 33,130,000$ 33,130,000$
Balances resulted from the time lag between the dates that 1) interfund goods and services are provided and/or reimbursement expenditures occur, and 2) transactions are recorded in the accounting system, and 3) payments between funds are made. Balances also result from interfund payroll transactions and end of year reclasses made between funds.
50
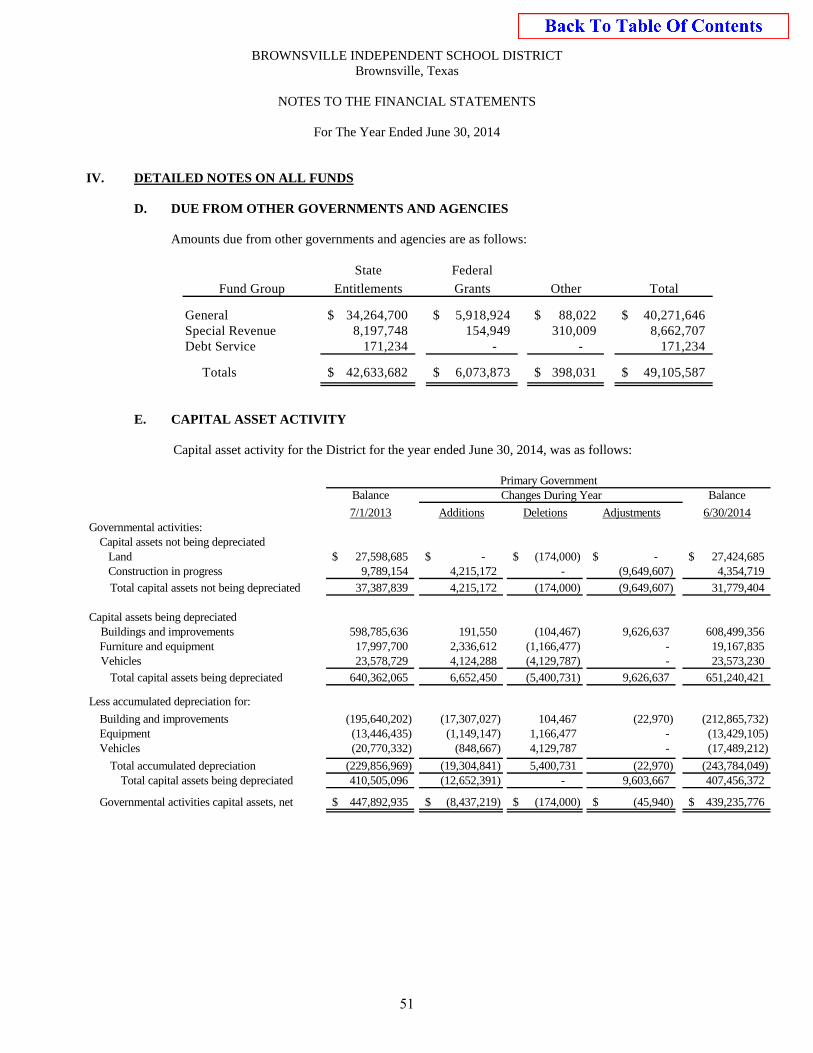
BROWNSVILLE INDEPENDENT SCHOOL DISTRICT Brownsville, Texas
NOTES TO THE FINANCIAL STATEMENTS
For The Year Ended June 30, 2014
IV. DETAILED NOTES ON ALL FUNDS
D. DUE FROM OTHER GOVERNMENTS AND AGENCIES Amounts due from other governments and agencies are as follows:
State Federal
Fund Group Entitlements Grants Other Total
General 34,264,700$ 5,918,924$ 88,022$ 40,271,646$ Special Revenue 8,197,748 154,949 310,009 8,662,707 Debt Service 171,234 - - 171,234
Totals 42,633,682$ 6,073,873$ 398,031$ 49,105,587$
E. CAPITAL ASSET ACTIVITY
Capital asset activity for the District for the year ended June 30, 2014, was as follows:
Balance Balance
7/1/2013 Additions Deletions Adjustments 6/30/2014Governmental activities:
Capital assets not being depreciated Land 27,598,685$ -$ (174,000)$ -$ 27,424,685$ Construction in progress 9,789,154 4,215,172 - (9,649,607) 4,354,719
Total capital assets not being depreciated 37,387,839 4,215,172 (174,000) (9,649,607) 31,779,404
Capital assets being depreciated Buildings and improvements 598,785,636 191,550 (104,467) 9,626,637 608,499,356
Furniture and equipment 17,997,700 2,336,612 (1,166,477) - 19,167,835 Vehicles 23,578,729 4,124,288 (4,129,787) - 23,573,230
Total capital assets being depreciated 640,362,065 6,652,450 (5,400,731) 9,626,637 651,240,421
Less accumulated depreciation for:
Building and improvements (195,640,202) (17,307,027) 104,467 (22,970) (212,865,732) Equipment (13,446,435) (1,149,147) 1,166,477 - (13,429,105) Vehicles (20,770,332) (848,667) 4,129,787 - (17,489,212)
Total accumulated depreciation (229,856,969) (19,304,841) 5,400,731 (22,970) (243,784,049) Total capital assets being depreciated 410,505,096 (12,652,391) - 9,603,667 407,456,372
Governmental activities capital assets, net 447,892,935$ (8,437,219)$ (174,000)$ (45,940)$ 439,235,776$
Primary GovernmentChanges During Year
51
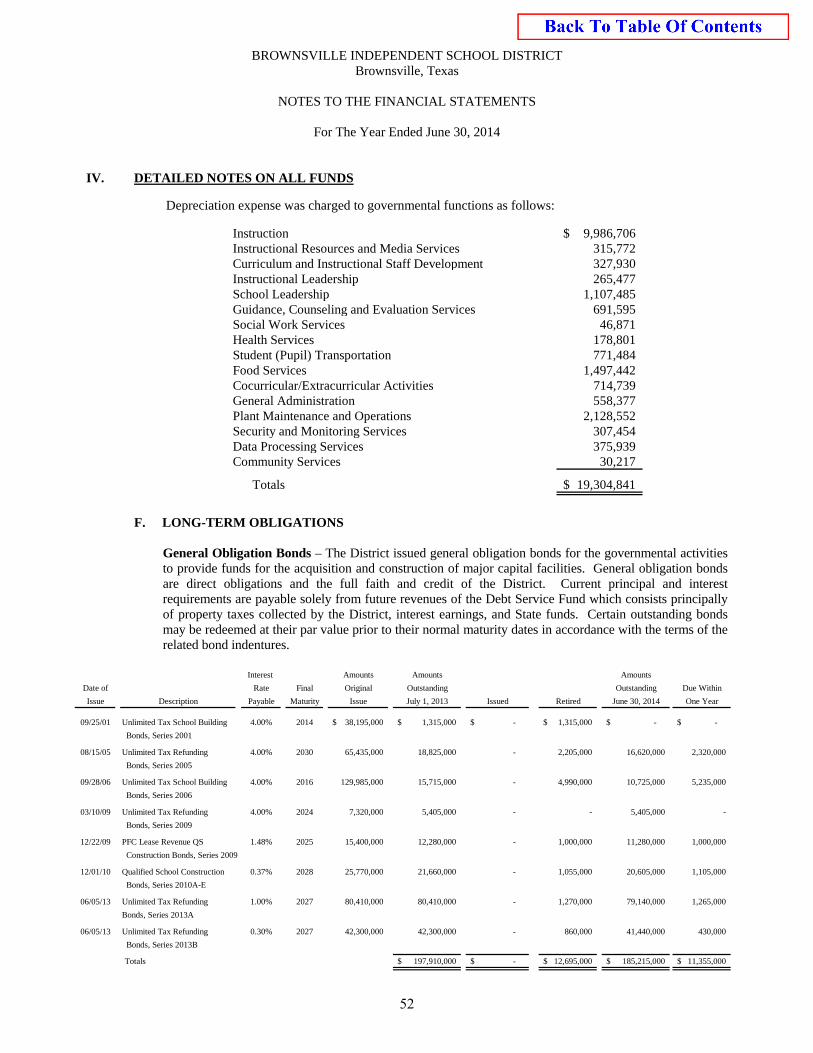
BROWNSVILLE INDEPENDENT SCHOOL DISTRICT Brownsville, Texas
NOTES TO THE FINANCIAL STATEMENTS
For The Year Ended June 30, 2014
IV. DETAILED NOTES ON ALL FUNDS
Depreciation expense was charged to governmental functions as follows:
Instruction 9,986,706$ Instructional Resources and Media Services 315,772 Curriculum and Instructional Staff Development 327,930 Instructional Leadership 265,477 School Leadership 1,107,485 Guidance, Counseling and Evaluation Services 691,595 Social Work Services 46,871 Health Services 178,801 Student (Pupil) Transportation 771,484 Food Services 1,497,442 Cocurricular/Extracurricular Activities 714,739 General Administration 558,377 Plant Maintenance and Operations 2,128,552 Security and Monitoring Services 307,454 Data Processing Services 375,939 Community Services 30,217
Totals 19,304,841$
F. LONG-TERM OBLIGATIONS General Obligation Bonds – The District issued general obligation bonds for the governmental activities to provide funds for the acquisition and construction of major capital facilities. General obligation bonds are direct obligations and the full faith and credit of the District. Current principal and interest requirements are payable solely from future revenues of the Debt Service Fund which consists principally of property taxes collected by the District, interest earnings, and State funds. Certain outstanding bonds may be redeemed at their par value prior to their normal maturity dates in accordance with the terms of the related bond indentures.
Interest Amounts Amounts Amounts
Date of Rate Final Original Outstanding Outstanding Due Within
Issue Description Payable Maturity Issue July 1, 2013 Issued Retired June 30, 2014 One Year
09/25/01 Unlimited Tax School Building 4.00% 2014 38,195,000$ 1,315,000$ -$ 1,315,000$ -$ -$
Bonds, Series 2001
08/15/05 Unlimited Tax Refunding 4.00% 2030 65,435,000 18,825,000 - 2,205,000 16,620,000 2,320,000
Bonds, Series 2005
09/28/06 Unlimited Tax School Building 4.00% 2016 129,985,000 15,715,000 - 4,990,000 10,725,000 5,235,000
Bonds, Series 2006
03/10/09 Unlimited Tax Refunding 4.00% 2024 7,320,000 5,405,000 - - 5,405,000 -
Bonds, Series 2009
12/22/09 PFC Lease Revenue QS 1.48% 2025 15,400,000 12,280,000 - 1,000,000 11,280,000 1,000,000
Construction Bonds, Series 2009
12/01/10 Qualified School Construction 0.37% 2028 25,770,000 21,660,000 - 1,055,000 20,605,000 1,105,000
Bonds, Series 2010A-E
06/05/13 Unlimited Tax Refunding 1.00% 2027 80,410,000 80,410,000 - 1,270,000 79,140,000 1,265,000
Bonds, Series 2013A
06/05/13 Unlimited Tax Refunding 0.30% 2027 42,300,000 42,300,000 - 860,000 41,440,000 430,000
Bonds, Series 2013B
Totals 197,910,000$ -$ 12,695,000$ 185,215,000$ 11,355,000$
52
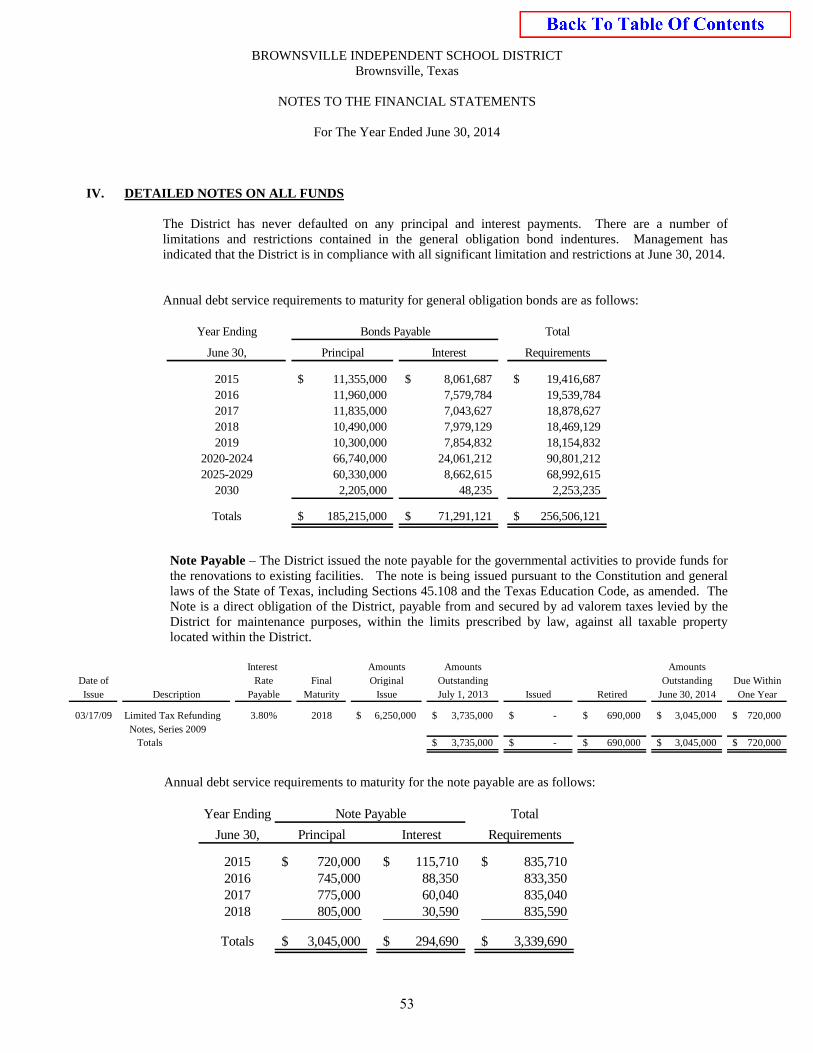
BROWNSVILLE INDEPENDENT SCHOOL DISTRICT Brownsville, Texas
NOTES TO THE FINANCIAL STATEMENTS
For The Year Ended June 30, 2014
IV. DETAILED NOTES ON ALL FUNDS
The District has never defaulted on any principal and interest payments. There are a number of limitations and restrictions contained in the general obligation bond indentures. Management has indicated that the District is in compliance with all significant limitation and restrictions at June 30, 2014.
Annual debt service requirements to maturity for general obligation bonds are as follows:
Year Ending Total
June 30, Principal Interest Requirements
2015 11,355,000$ 8,061,687$ 19,416,687$ 2016 11,960,000 7,579,784 19,539,784 2017 11,835,000 7,043,627 18,878,627 2018 10,490,000 7,979,129 18,469,129 2019 10,300,000 7,854,832 18,154,832
2020-2024 66,740,000 24,061,212 90,801,212 2025-2029 60,330,000 8,662,615 68,992,615
2030 2,205,000 48,235 2,253,235
Totals 185,215,000$ 71,291,121$ 256,506,121$
Bonds Payable
Note Payable – The District issued the note payable for the governmental activities to provide funds for the renovations to existing facilities. The note is being issued pursuant to the Constitution and general laws of the State of Texas, including Sections 45.108 and the Texas Education Code, as amended. The Note is a direct obligation of the District, payable from and secured by ad valorem taxes levied by the District for maintenance purposes, within the limits prescribed by law, against all taxable property located within the District.
Interest Amounts Amounts Amounts
Date of Rate Final Original Outstanding Outstanding Due WithinIssue Description Payable Maturity Issue July 1, 2013 Issued Retired June 30, 2014 One Year
03/17/09 Limited Tax Refunding 3.80% 2018 6,250,000$ 3,735,000$ -$ 690,000$ 3,045,000$ 720,000$ Notes, Series 2009
Totals 3,735,000$ -$ 690,000$ 3,045,000$ 720,000$
Annual debt service requirements to maturity for the note payable are as follows:
Year Ending Total
June 30, Principal Interest Requirements
2015 720,000$ 115,710$ 835,710$ 2016 745,000 88,350 833,350 2017 775,000 60,040 835,040 2018 805,000 30,590 835,590
Totals 3,045,000$ 294,690$ 3,339,690$
Note Payable
53
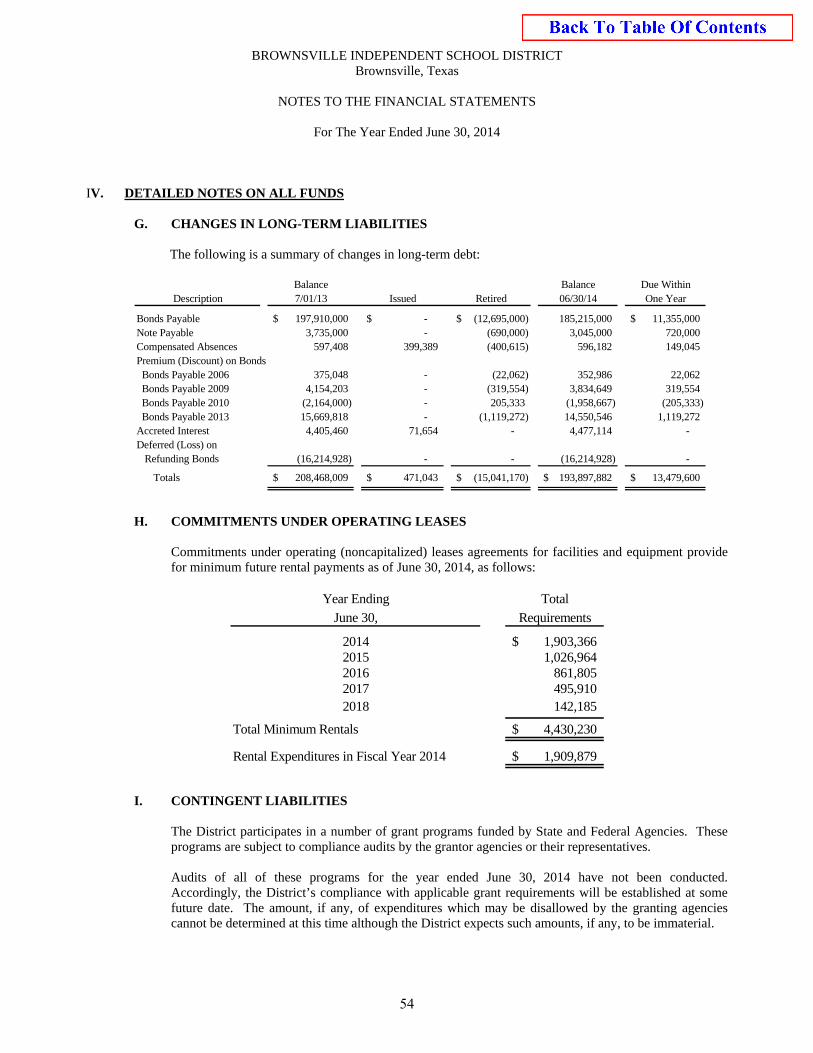
BROWNSVILLE INDEPENDENT SCHOOL DISTRICT Brownsville, Texas
NOTES TO THE FINANCIAL STATEMENTS
For The Year Ended June 30, 2014
IV. DETAILED NOTES ON ALL FUNDS
G. CHANGES IN LONG-TERM LIABILITIES
The following is a summary of changes in long-term debt:
Balance Balance Due WithinDescription 7/01/13 Issued Retired 06/30/14 One Year
Bonds Payable 197,910,000$ -$ (12,695,000)$ 185,215,000 11,355,000$ Note Payable 3,735,000 - (690,000) 3,045,000 720,000 Compensated Absences 597,408 399,389 (400,615) 596,182 149,045 Premium (Discount) on Bonds Bonds Payable 2006 375,048 - (22,062) 352,986 22,062 Bonds Payable 2009 4,154,203 - (319,554) 3,834,649 319,554 Bonds Payable 2010 (2,164,000) - 205,333 (1,958,667) (205,333) Bonds Payable 2013 15,669,818 - (1,119,272) 14,550,546 1,119,272 Accreted Interest 4,405,460 71,654 - 4,477,114 - Deferred (Loss) on Refunding Bonds (16,214,928) - - (16,214,928) -
Totals 208,468,009$ 471,043$ (15,041,170)$ 193,897,882$ 13,479,600$
H. COMMITMENTS UNDER OPERATING LEASES
Commitments under operating (noncapitalized) leases agreements for facilities and equipment provide
for minimum future rental payments as of June 30, 2014, as follows:
Year Ending Total
June 30, Requirements
2014 1,903,366$ 2015 1,026,964 2016 861,805 2017 495,910 2018 142,185
Total Minimum Rentals 4,430,230$
Rental Expenditures in Fiscal Year 2014 1,909,879$
I. CONTINGENT LIABILITIES
The District participates in a number of grant programs funded by State and Federal Agencies. These programs are subject to compliance audits by the grantor agencies or their representatives. Audits of all of these programs for the year ended June 30, 2014 have not been conducted. Accordingly, the District’s compliance with applicable grant requirements will be established at some future date. The amount, if any, of expenditures which may be disallowed by the granting agencies cannot be determined at this time although the District expects such amounts, if any, to be immaterial.
54
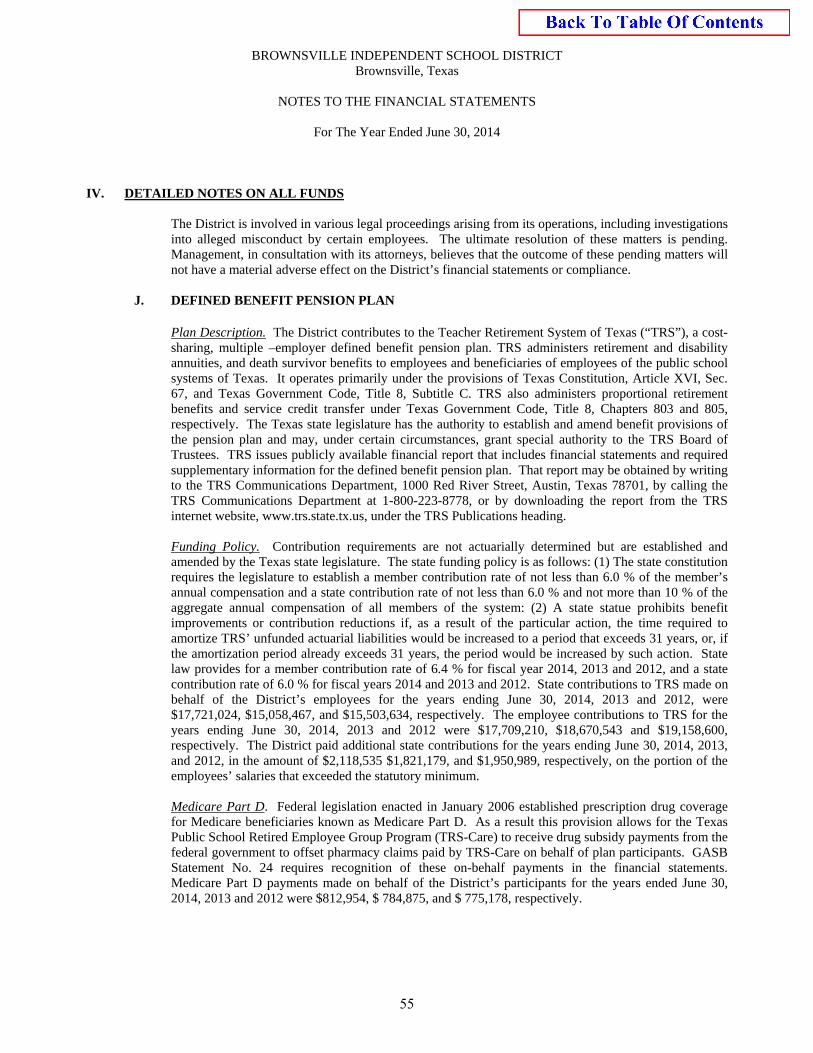
BROWNSVILLE INDEPENDENT SCHOOL DISTRICT Brownsville, Texas
NOTES TO THE FINANCIAL STATEMENTS
For The Year Ended June 30, 2014
IV. DETAILED NOTES ON ALL FUNDS
The District is involved in various legal proceedings arising from its operations, including investigations into alleged misconduct by certain employees. The ultimate resolution of these matters is pending. Management, in consultation with its attorneys, believes that the outcome of these pending matters will not have a material adverse effect on the District’s financial statements or compliance.
J. DEFINED BENEFIT PENSION PLAN
Plan Description. The District contributes to the Teacher Retirement System of Texas (“TRS”), a cost-sharing, multiple –employer defined benefit pension plan. TRS administers retirement and disability annuities, and death survivor benefits to employees and beneficiaries of employees of the public school systems of Texas. It operates primarily under the provisions of Texas Constitution, Article XVI, Sec. 67, and Texas Government Code, Title 8, Subtitle C. TRS also administers proportional retirement benefits and service credit transfer under Texas Government Code, Title 8, Chapters 803 and 805, respectively. The Texas state legislature has the authority to establish and amend benefit provisions of the pension plan and may, under certain circumstances, grant special authority to the TRS Board of Trustees. TRS issues publicly available financial report that includes financial statements and required supplementary information for the defined benefit pension plan. That report may be obtained by writing to the TRS Communications Department, 1000 Red River Street, Austin, Texas 78701, by calling the TRS Communications Department at 1-800-223-8778, or by downloading the report from the TRS internet website, www.trs.state.tx.us, under the TRS Publications heading.
Funding Policy. Contribution requirements are not actuarially determined but are established and amended by the Texas state legislature. The state funding policy is as follows: (1) The state constitution requires the legislature to establish a member contribution rate of not less than 6.0 % of the member’s annual compensation and a state contribution rate of not less than 6.0 % and not more than 10 % of the aggregate annual compensation of all members of the system: (2) A state statue prohibits benefit improvements or contribution reductions if, as a result of the particular action, the time required to amortize TRS’ unfunded actuarial liabilities would be increased to a period that exceeds 31 years, or, if the amortization period already exceeds 31 years, the period would be increased by such action. State law provides for a member contribution rate of 6.4 % for fiscal year 2014, 2013 and 2012, and a state contribution rate of 6.0 % for fiscal years 2014 and 2013 and 2012. State contributions to TRS made on behalf of the District’s employees for the years ending June 30, 2014, 2013 and 2012, were $17,721,024, $15,058,467, and $15,503,634, respectively. The employee contributions to TRS for the years ending June 30, 2014, 2013 and 2012 were $17,709,210, $18,670,543 and $19,158,600, respectively. The District paid additional state contributions for the years ending June 30, 2014, 2013, and 2012, in the amount of $2,118,535 $1,821,179, and $1,950,989, respectively, on the portion of the employees’ salaries that exceeded the statutory minimum.
Medicare Part D. Federal legislation enacted in January 2006 established prescription drug coverage for Medicare beneficiaries known as Medicare Part D. As a result this provision allows for the Texas Public School Retired Employee Group Program (TRS-Care) to receive drug subsidy payments from the federal government to offset pharmacy claims paid by TRS-Care on behalf of plan participants. GASB Statement No. 24 requires recognition of these on-behalf payments in the financial statements. Medicare Part D payments made on behalf of the District’s participants for the years ended June 30, 2014, 2013 and 2012 were $812,954, $ 784,875, and $ 775,178, respectively.
55
BROWNSVILLE INDEPENDENT SCHOOL DISTRICT Brownsville, Texas
NOTES TO THE FINANCIAL STATEMENTS
For The Year Ended June 30, 2014
IV. DETAILED NOTES ON ALL FUNDS
K. RISK MANAGEMENT
Health Care Coverage
During the fiscal year ended June 30, 2014, the District sponsored a self-funded insurance plan to provide health care benefits to employees and their dependents. The District paid premiums of $380.00 per month per employee to the fund. Total employee contributions are required for coverage of dependents. The contract between the District and the licensed insurer is renewable, and terms of coverage and premium costs are included in the contractual provisions. The latest financial statements available for Blue Cross Blue Shield (BCBS) are filed with the Texas State Board of Insurance, Austin, Texas, and are public records. The following is a summary of the changes in the balances of claims liabilities for the year ended June 30, 2014:
2014 2013
Unpaid claims, beginning of the year 5,827,635$ 5,565,149$ Incurred claims (including IBNRs) 35,898,698 36,593,526 Claim payments (37,527,450) (36,331,040)
Unpaid claims, end of the year 4,198,883$ 5,827,635$
Worker’s Compensation Coverage For the year ended June 30, 2014, the District met its statutory worker’s compensation obligations through participation in a Self-Funded Worker’s Compensation Plan with TRISTAR Risk Management as the TPA (Third Party Administrator). This plan is authorized by Article 8309, Vernon’s Annotated Texas Statutes. The District provides statutory worker’s compensation benefits to its employees. The District’s and TRISTAR Risk Management are protected against higher than expected claims costs through the purchase of stop loss coverage for any claim in excess of the self-insured retention of $1 million. For the year ended June 30, 2014, the fund purchased excess coverage from Montalvo Insurance Agency. The fund uses an independent actuary to determine reserve adequacy and fully funds those reserves.
As of June 30, 2014, the District has reserved for estimated claims incurred, but not reported that do not exceed the required reserves. The liability reported at June 30, 2014 is based on the requirements of Governmental Accounting Standards Board No. 10, which requires that a liability for claims be reported if information prior to the issuance of the financial statements indicates that it is probable that a liability has been incurred as of the date of the financial statements, and the amount of loss can be reasonably estimated. Because actual claim liabilities depend on complex factors such as inflation, changes in legal doctrines, and damage awards, the process used in computing the liability does not necessarily result in an exact amount.
56
BROWNSVILLE INDEPENDENT SCHOOL DISTRICT Brownsville, Texas
NOTES TO THE FINANCIAL STATEMENTS
For The Year Ended June 30, 2014
IV. DETAILED NOTES ON ALL FUNDS
L. CONSTRUCTION COMMITMENTS
At June 30, 2014, the District had the following construction commitments:
Expended Estimated Through Amount
2006 Bond Projects Project Cost June 30, Committed
District Wide Projects 4,077,287$ 3,360,061$ 717,226$ 4,077,287 3,360,061 717,226
Local Funds Projects
Hanna High School - Trainers Room 76,188 59,545 16,643 Rivera High School - HVAC Upgrades 2,044,670 1,893,427 151,243 Faulk Middle School Weight Room 400,000 17,280 382,720 Sams Stadium Parking Lot Additions 80,720 - 80,720
2,601,578 1,970,252 631,326
Total Construction In Progress 6,678,865$ 5,330,313$ 1,348,552$
M. UNEARNED REVENUE
Unearned revenue at year-end consisted of the following:
General Special Description Fund Revenue Total
BISD - GED Testing 2,236$ -$ 2,236$ BISD - Athletics 1,280 - 1,280 BISD - Other 33,800 - 33,800 BISD - Rendition Fees 16,441 - 16,441 BISD - CCED Taxes 60,604 - 60,604 Food service receipts 6,412 - 6,412 Special revenue grants - 860,494 860,494 Total unearned revenue 120,773$ 860,494$ 981,267$
57
BROWNSVILLE INDEPENDENT SCHOOL DISTRICT Brownsville, Texas
NOTES TO THE FINANCIAL STATEMENTS
For The Year Ended June 30, 2014
IV. DETAILED NOTES ON ALL FUNDS N. REVENUE FROM LOCAL AND INTERMEDIATE SOURCES
During the current year, revenues from local and intermediate sources consisted of the following:
Other Internal
General Governmental Service Description Fund Funds Funds Total
Property Taxes 53,464,059$ 5,166,412$ -$ 58,630,471$ Penalties, Interest & Other Tax-Related Income 1,906,845 155,096 - 2,061,941 Tuition and Fees 491,150 - - 491,150 Food Sales 1,169,573 - - 1,169,573 Investment Income 104,413 8,671 8,842 121,926 Co-curricular Student Act. 446,049 - - 446,049 CCED 122,680 - - 122,680 Other 1,318,304 44,652 43,289,307 44,652,263
Totals 59,023,073$ 5,374,831$ 43,298,149$ 107,696,053$
O. USE OF ESTIMATES IN THE PREPARATION OF FINANCIAL STATEMENTS
The preparation of financial statements in conformity with generally accepted accounting principles requires management to make estimates and assumptions that affect the reported amounts of assets, liabilities and/or disclosures of contingent liabilities at the date of the financial statements and the reported amounts of revenues and expenses during the reporting period. Actual results could differ from those estimates.
P. PRIOR PERIOD ADJUSTMENTS
Adjustments to the fund balance and net position during the 2013-2014 school year consisted of the following:
General Other Nonmajor Internal
Description Fund Funds Service Funds Total
To close out balance sheet accounts that never materialized (365,177)$ -$ (330)$ (365,507)$ Adjustments for Summary of Finances 351,066 (7,401,005) - (7,049,939) Total per Exhibit C-3 and D-2 (14,111)$ (7,401,005)$ (330)$ (7,415,446)
Adjustments to capital assets (219,940) Removal of bond issuance cost per GASB 65 (218,754) Total per Exhibit B-1 (7,854,140)$
58
BROWNSVILLE INDEPENDENT SCHOOL DISTRICT Brownsville, Texas
NOTES TO THE FINANCIAL STATEMENTS
For The Year Ended June 30, 2014
IV. DETAILED NOTES ON ALL FUNDS
Q. MAINTENANCE OF EFFORT
The District sponsors a modified self-insurance plan to provide health care benefits to staff members and their dependents.
A. Total District premium paid for health care for 2013-2014: 32,948,234$
B. Subtract any non-medical expenditures:Life insurance 174,055$ Dental insurance - Vision insurance - Long-term disability - Short-term disability - Alternate plans - COBRA expense - Retiree expense -
174,055
C. 2013-2014 Maintenance of Effort: 32,774,179$
R. SHARED SERVICES AGREEMENTS
The District is the fiscal agent for a Shared Service Arrangement (“SSA”), which provides special education services to the member districts listed below. The fiscal agent provides all services. The member districts provide the funds to the fiscal agent, who provides all services. According to guidance provided in TEA’s Resource Guide, the District has accounted for fiscal agent’s activities of the SSA in a special revenue fund and will be accounted for using Model 3 in the SSA section of the Resource Guide. Expenditures of the SSA are summarized below:
Member Districts Expenditures
Harlingen CISD 127,500$
Los Fresnos CISD 50,000
Point Isabel ISD 32,500
Raymondville ISD 85,000
San Benito CISD 176,250 Total 471,250$
S. GENERAL FUND FEDERAL SOURCE REVENUES
Federally financed programs are generally accounted for in the Special Revenue funds of the District, except for indirect costs charged to federal programs which are accounted for in the General Fund as prescribed by TEA and certain direct revenues. The District recognized in the General Fund such revenues for the year ended June 30, 2014 from various federal sources as follows:
59
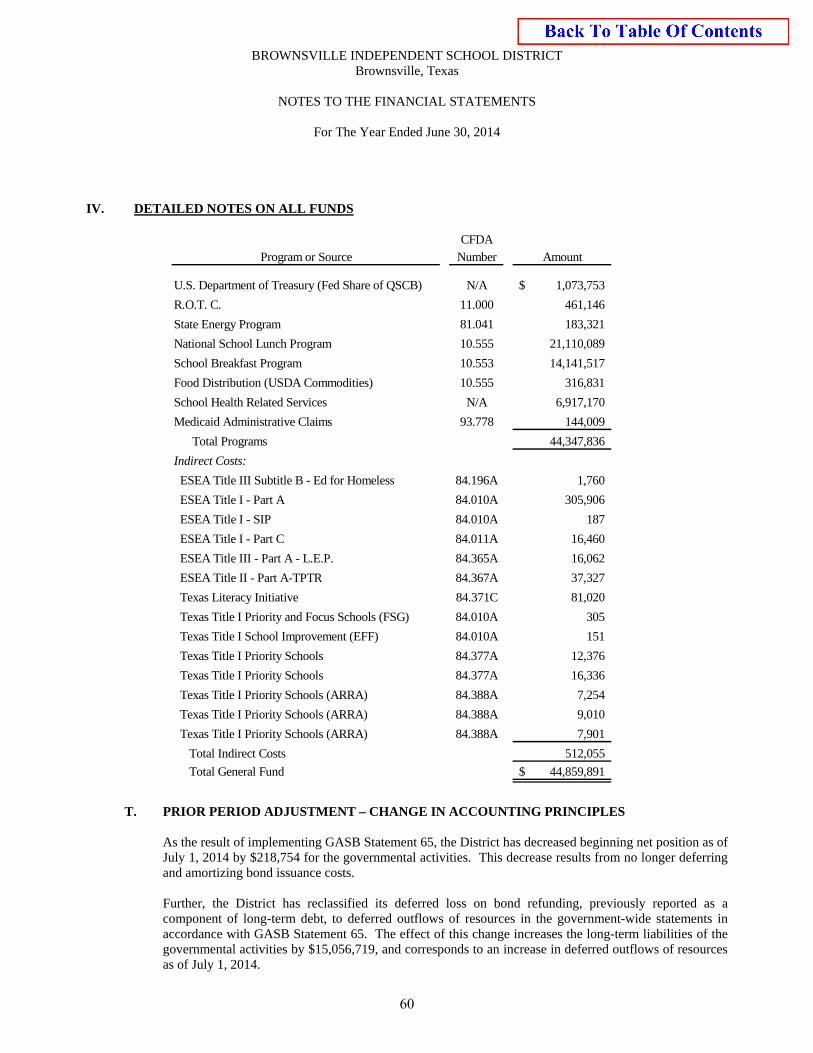
BROWNSVILLE INDEPENDENT SCHOOL DISTRICT Brownsville, Texas
NOTES TO THE FINANCIAL STATEMENTS
For The Year Ended June 30, 2014
IV. DETAILED NOTES ON ALL FUNDS
CFDA
Program or Source Number Amount
U.S. Department of Treasury (Fed Share of QSCB) N/A 1,073,753$
R.O.T. C. 11.000 461,146
State Energy Program 81.041 183,321
National School Lunch Program 10.555 21,110,089
School Breakfast Program 10.553 14,141,517
Food Distribution (USDA Commodities) 10.555 316,831
School Health Related Services N/A 6,917,170
Medicaid Administrative Claims 93.778 144,009
Total Programs 44,347,836
Indirect Costs:
ESEA Title III Subtitle B - Ed for Homeless 84.196A 1,760
ESEA Title I - Part A 84.010A 305,906
ESEA Title I - SIP 84.010A 187
ESEA Title I - Part C 84.011A 16,460
ESEA Title III - Part A - L.E.P. 84.365A 16,062
ESEA Title II - Part A-TPTR 84.367A 37,327
Texas Literacy Initiative 84.371C 81,020
Texas Title I Priority and Focus Schools (FSG) 84.010A 305
Texas Title I School Improvement (EFF) 84.010A 151
Texas Title I Priority Schools 84.377A 12,376
Texas Title I Priority Schools 84.377A 16,336
Texas Title I Priority Schools (ARRA) 84.388A 7,254
Texas Title I Priority Schools (ARRA) 84.388A 9,010
Texas Title I Priority Schools (ARRA) 84.388A 7,901
Total Indirect Costs 512,055
Total General Fund 44,859,891$
T. PRIOR PERIOD ADJUSTMENT – CHANGE IN ACCOUNTING PRINCIPLES
As the result of implementing GASB Statement 65, the District has decreased beginning net position as of July 1, 2014 by $218,754 for the governmental activities. This decrease results from no longer deferring and amortizing bond issuance costs. Further, the District has reclassified its deferred loss on bond refunding, previously reported as a component of long-term debt, to deferred outflows of resources in the government-wide statements in accordance with GASB Statement 65. The effect of this change increases the long-term liabilities of the governmental activities by $15,056,719, and corresponds to an increase in deferred outflows of resources as of July 1, 2014.
60
COMBINING STATEMENTS
SPECIAL REVENUE FUNDS
The Special Revenue Funds generally account for state and federally financed programs where unused balances are returned to the grantors at the close of specified project periods. Project accounting is employed to maintain integrity for the various sources of funds. Funds included in the Special Revenue Funds are described in the following pages.
ESEA, TITLE II-SUBTITLE B-EDUCATION FOR THE HOMELESS CHILDREN (206) To account for funds granted for a variety of staff development and supplemental services, including in-service training, counseling, psychological services and tutoring. ESEA TITLE I PART A-IMPROVING BASIC PROGRAMS (211) To account for funds allocated to local educational agencies to enable schools to provide opportunities for children served to acquire the knowledge and skills contained in the challenging State content standards and to meet the challenging State performance standards developed for all children. ESEA, TITLE I PART C-EDUCATION OF MIGRATORY CHILDREN (212) To account for funds granted for programs benefiting children of migrant agriculture-related workers and children of migrant fishermen. ADULT EDUCATION ENGLISH LITERANCE AND CIVICS (220) To account for funds granted to assist adults who are parents to obtain the educational skills necessary to become full partners in the educational development of their children. This fund also is to assist adults to become literate and obtain the knowledge and skills necessary for employment and self-sufficiency. IDEA-PART B, FORMULA (224) To account for funds granted to operate educational programs for handicapped children with disabilities. IDEA PART B, PRESCHOOL (225) To account for funds granted for preschool handicapped children. CARL D. PERKINS, TITLE I PART C (244) To account for funds granted to provide career and technology education to develop new and/or improve career and technology education programs for paid and unpaid employment. Full participation in the basic grant is from individuals who are members of special populations, at (1) a limited number of campuses or (2) a limited number of program areas. ESEA TITLE II PART A TEACHER AND PRINCIPAL TRAINING AND RECRUITING (255) To provide financial assistance to LEAs to increase student academic achievement through improving teacher and principal quality and increasing the number of highly qualified teachers in classrooms and highly qualified principals and assistant principals in schools, also, to hold local education agencies and schools accountable for improving student academic achievement. TITLE III, ENGLISH LANGUAGE ACQUISISTION AND LANGUAGE ENHANCEMENT (263) To account for funds granted to improve the education of limited English proficient children, by assisting them to learn English and meet challenging State academic content and student academic achievement standards.
21ST CENTURY COMMUNITY LEARNING CENTERS (265) This fund classification is to be used to account, on a project basis, for funds granted to provide opportunities for communities to establish or expand activities in community learning centers that provide opportunities for academic enrichment and additional services to students and literary and related educational development for families of students. GAINING EARLY AWARNESS FOR COLLEGE READINESS: GEAR UP (274) To account for funds granted to provide services and support to low-income minority school districts to ensure that students are academically prepared for higher education, graduate from high school, and have access to higher education opportunities. TEXAS TITLE I PRIORITY SCHOOLS PROGRAM (276) This fund is to be used for campuses identified for improvement, corrective action, or restructuring. These funds will be used to provide adequate resources in order to substantially raise the achievement of students as to enable the schools to make adequate yearly progress and exit improvement status. TEXAS TITLE I PRIORITY SCHOOLS PROGRAM (ARRA T-TIPS 286) This fund is to be used for campuses identified for improvement, corrective action, or restructuring. These funds will be used to provide adequate resources in order to substantially raise the achievement of students as to enable the schools to make adequate yearly progress and exit improvement status. EDUCATION JOBS FUND (287) This fund is to be used for compensation and benefits that are not prohibited by Texas law or statue, and other expenses, such as support services, necessary to retain existing school-level employees, to recall or rehire former school-level employees, and to hire new school-level employees in order to provide early childhood, elementary, or secondary educational and related services . FEDERALLY FUNDED SPECIAL REVENUE FUNDS (289) This fund classification is to be used to account, on a project basis, for federally funded special revenue funds that have not been specified above. ADULT BASIC EDUCATION-FEDERAL (309) To account for funds granted to provide or support programs for educational services to adults who are beyond compulsory school attendance age, are not enrolled in school and function at less than secondary completion level. TEMPORARY ASSISTANCE FOR NEEDY FAMILIES (TANF) (312) To account for funds granted to provide education services to undereducated adult recipients of cash assistance under TANF. IDEA PART B, DISCRETIONARY (315) To account for funds used to support an Education Service Center (ESC) special education component and also: targeted support to LEAs, private residential placements, priority projects, and other emerging needs. IDEA PART B DEAF (316) To account for funds granted to operate educational programs for children with disabilities. IDEA PART B, PRESCHOOL DEAF (317) To account for funds granted for preschool children with disabilities.
IDEA PART C, DEAF, EARLY INTERVENTION (340) To account for funds granted to assist local Regional Day School for the Deaf programs and the Texas School for the Deaf in providing direct services to hearing impaired infants and toddlers. ADVANCED PLACEMENT (397) To account for funds used to promote pre-AP and AP programs thus increasing the number of student and teachers enrolled and teaching pre – AP and AP courses at each participating school. This grant also supports activities to increase the participation of low income students in pre advanced placement and advanced placement courses. STUDENT SUCCESS INITIIATIVE (404) To account for funds used to provide support for the training of teachers and the implementation of scientific, research-based programs to support students in their reading development in the early grades of school. STATE TEXTBOOK FUND (410) This fund classification is to be used to account, on a project basis, for funds awarded to school districts under the textbook allotment. STATE FUNDED SPECIAL REVENUE FUNDS (429) State funded special revenue funds not listed above are to be accounted for in this fund. ADULT BASIC EDUCATION STATE (431) To account for funds granted to provide adult education, literacy services and instruction below the college level for undereducated adults who are beyond the age of compulsory attendance. SHARED SERVICES ARRANGEMENTS - TANF (432) To account, on a project basis, for funds granted to provide education services to undereducated adult recipients of cash assistance under Temporary Assistance for Needy Families (TANF). STATE DEAF (435) To account for funds granted to account, on a project basis for funds allocated for staff and activities of the Regional Day School Program for the Deaf (RDSPD). LOCALLY FUNDED SPECIAL REVENUE FUNDS – LOCALLY DEFINED (498) These fund classifications are used, at the option of the school district to classify locally funded special revenue funds such as grants by corporations to specific campuses not define elsewhere. LOCALLY FUNDED SPECIAL REVENUE FUNDS (499) Locally funded special revenue funds not listed above are to be accounted for in this fund.
INTERNAL SERVICE FUNDS
The Internal Service Funds are used to account for activities where the District charges fees to internal users for goods or services.
SELF FUNDED INSURANCE (753) This fund is used to account for the operations of the District’s old self-funded insurance program, which ended September 2011. SELF FUNDED INSURANCE: Blue Cross/Blue Shield (754) This fund is used to account for the operations of the District’s self-funded insurance program which started in October 2011. SELF FUNDED WORKERS COMPENSATION (792) This fund is used to account for the operations of the District’s self-funded insurance program, which meets the state mandate that all District employees are covered by worker’s compensation insurance. Premiums are collected from the various campuses and departments based on predetermined experience rates. Claim costs, administrative costs, and stop loss insurance premiums are paid from the premiums collected. Excess claims are covered by a stop loss carrier.
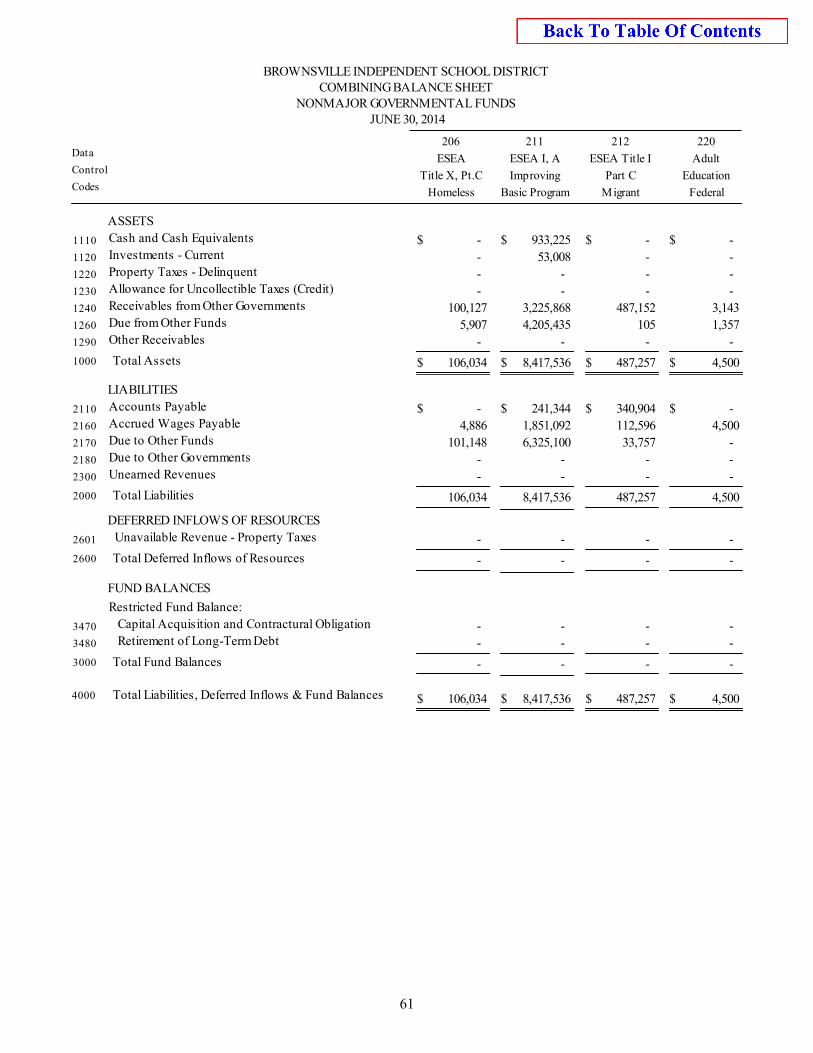
BROWNSVILLE INDEPENDENT SCHOOL DISTRICT
COMBINING BALANCE SHEETNONMAJOR GOVERNMENTAL FUNDS
JUNE 30, 2014
Control
Data
Codes
ESEA
Title X, Pt.C
Homeless Basic Program
Improving
ESEA I, A
Migrant
Part C
ESEA Title I
Federal
Education
Adult
206 211 212 220
ASSETS
933,225 - - - $ $ $ $1110 Cash and Cash Equivalents
53,008 - - - 1120 Investments - Current
- - - - 1220 Property Taxes - Delinquent
- - - - 1230 Allowance for Uncollectible Taxes (Credit)
3,225,868 100,127 487,152 3,143 1240 Receivables from Other Governments
4,205,435 5,907 105 1,357 1260 Due from Other Funds
- - - - 1290 Other Receivables
Total Assets1000 106,034 8,417,536 487,257 4,500 $ $ $ $
LIABILITIES
241,344 - 340,904 - $ $ $ $2110 Accounts Payable
1,851,092 4,886 112,596 4,500 2160 Accrued Wages Payable
6,325,100 101,148 33,757 - 2170 Due to Other Funds
- - - - 2180 Due to Other Governments
- - - - 2300 Unearned Revenues
Total Liabilities2000 106,034 8,417,536 487,257 4,500
DEFERRED INFLOWS OF RESOURCES
- - - - 2601 Unavailable Revenue - Property Taxes
Total Deferred Inflows of Resources2600 - - - -
FUND BALANCES
Restricted Fund Balance:
- - - - 3470 Capital Acquisition and Contractural Obligation
- - - - 3480 Retirement of Long-Term Debt
Total Fund Balances3000 - - - -
4000 Total Liabilities, Deferred Inflows & Fund Balances 106,034 8,417,536 487,257 4,500 $ $ $ $
61
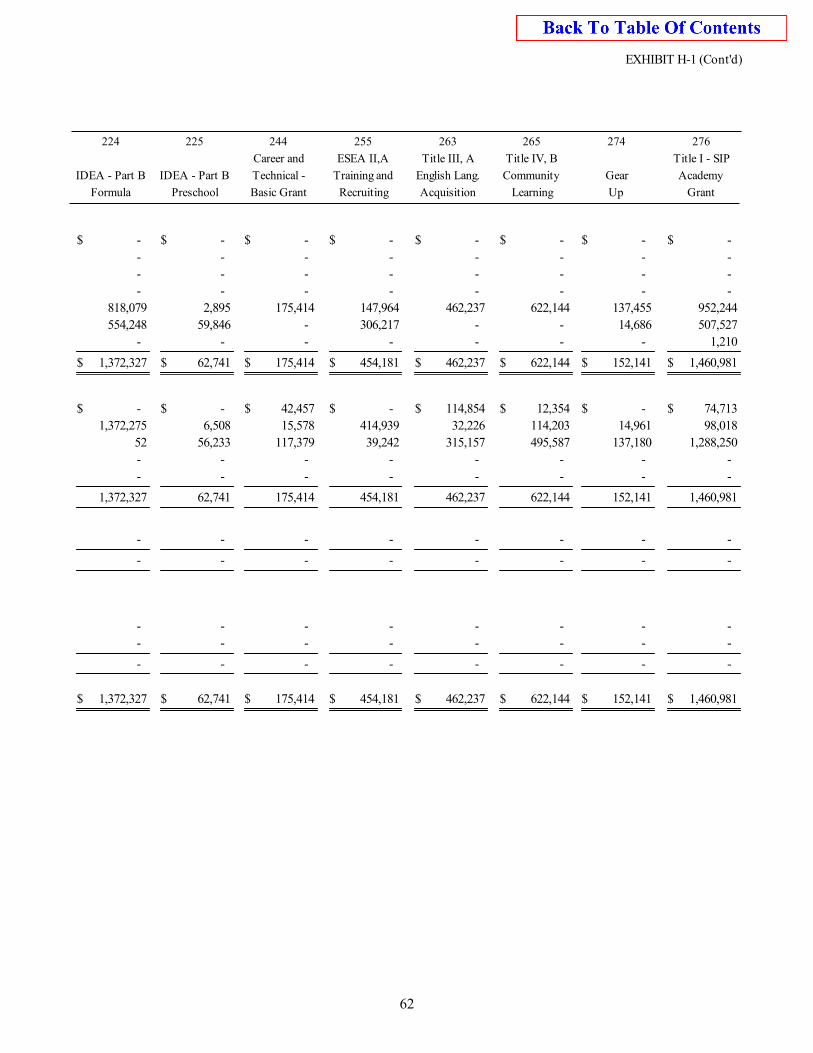
EXHIBIT H-1 (Cont'd)
IDEA - Part B
Preschool
IDEA - Part B
Basic Grant
Technical -
Career and
Recruiting
Training and
ESEA II,A Title III, A
English Lang.
Acquisition
Title IV, B
Community
Learning
Title I - SIP
Academy
Grant
Gear
Up
224 225 244 255 263 265 274 276
Formula
- - - - - - - - $ $ $ $ $ $ $ $
- - - - - - - -
- - - - - - - -
- - - - - - - -
462,237 147,964 622,144 818,079 2,895 175,414 137,455 952,244
- 306,217 - 554,248 59,846 - 14,686 507,527
- - - - - - - 1,210
1,372,327 62,741 175,414 454,181 462,237 622,144 152,141 1,460,981 $ $ $ $ $ $ $ $
114,854 - 12,354 - - 42,457 - 74,713 $ $ $ $ $ $ $ $
32,226 414,939 114,203 1,372,275 6,508 15,578 14,961 98,018
315,157 39,242 495,587 52 56,233 117,379 137,180 1,288,250
- - - - - - - -
- - - - - - - -
1,372,327 62,741 175,414 454,181 462,237 622,144 152,141 1,460,981
- - - - - - - -
- - - - - - - -
- - - - - - - -
- - - - - - - -
- - - - - - - -
1,372,327 62,741 175,414 454,181 462,237 622,144 152,141 1,460,981 $ $ $ $ $ $ $ $
62
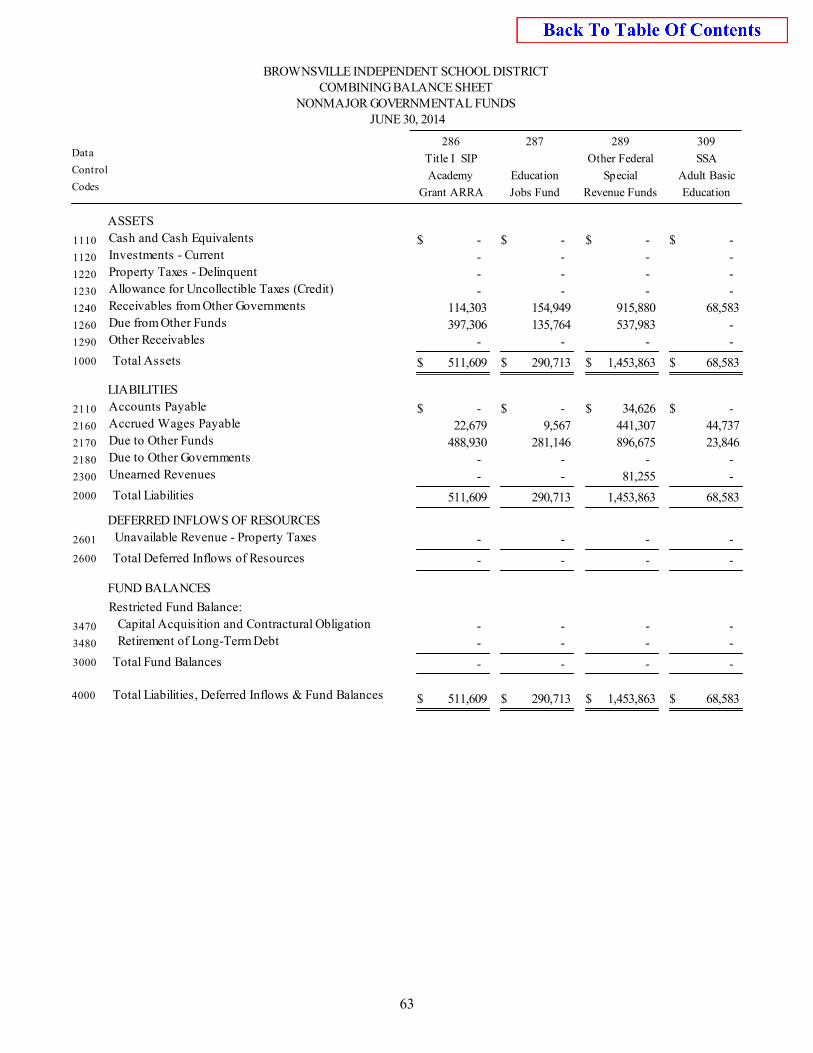
BROWNSVILLE INDEPENDENT SCHOOL DISTRICT
COMBINING BALANCE SHEETNONMAJOR GOVERNMENTAL FUNDS
JUNE 30, 2014
Control
Data
Codes
Title I SIP
Academy
Grant ARRA Jobs Fund
Education
Revenue Funds
Special
Other Federal
Education
Adult Basic
SSA
286 287 289 309
ASSETS
- - - - Cash and Cash Equivalents $ $ $ $1110
- - - - Investments - Current1120
- - - - Property Taxes - Delinquent1220
- - - - Allowance for Uncollectible Taxes (Credit)1230
154,949 114,303 915,880 68,583 Receivables from Other Governments1240
135,764 397,306 537,983 - Due from Other Funds1260
- - - - Other Receivables1290
Total Assets1000 511,609 290,713 1,453,863 68,583 $ $ $ $
LIABILITIES
- - 34,626 - Accounts Payable $ $ $ $2110
9,567 22,679 441,307 44,737 Accrued Wages Payable2160
281,146 488,930 896,675 23,846 Due to Other Funds2170
- - - - Due to Other Governments2180
- - 81,255 - Unearned Revenues2300
Total Liabilities2000 511,609 290,713 1,453,863 68,583
DEFERRED INFLOWS OF RESOURCES
- - - - Unavailable Revenue - Property Taxes2601
Total Deferred Inflows of Resources2600 - - - -
FUND BALANCES
Restricted Fund Balance:
- - - - Capital Acquisition and Contractural Obligation3470
- - - - Retirement of Long-Term Debt3480
Total Fund Balances3000 - - - -
4000 Total Liabilities, Deferred Inflows & Fund Balances 511,609 290,713 1,453,863 68,583 $ $ $ $
63
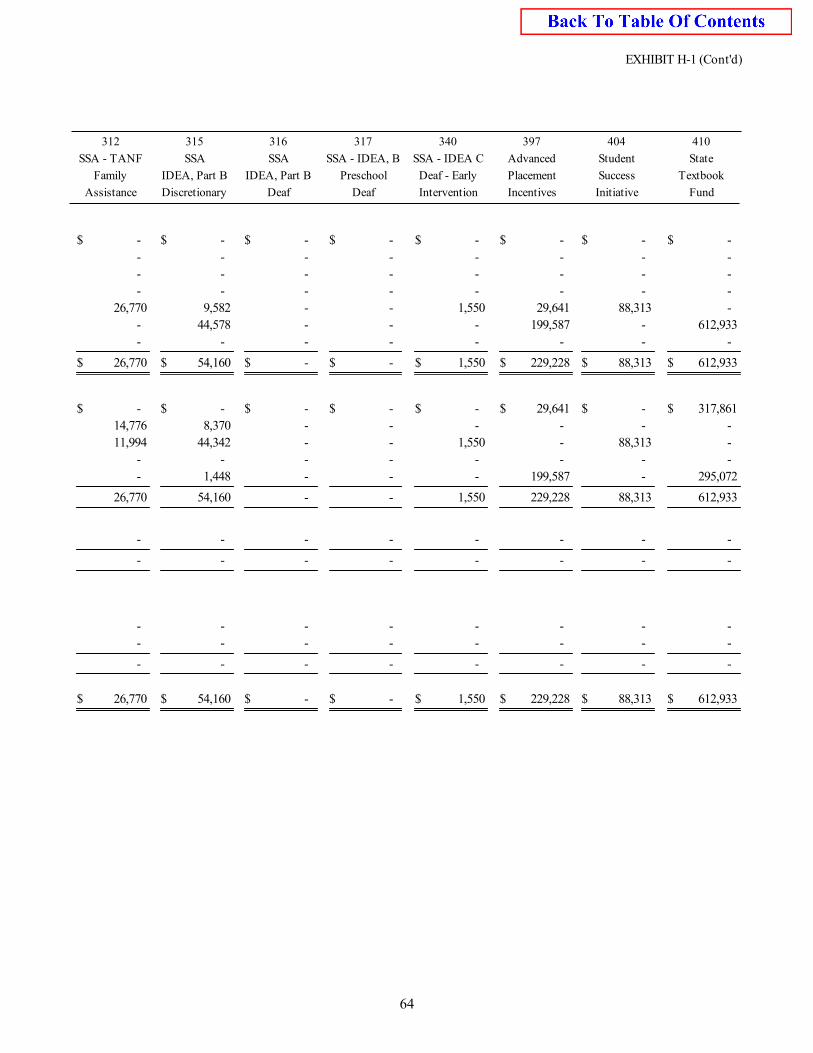
EXHIBIT H-1 (Cont'd)
SSA - TANF
Family
Discretionary
IDEA, Part B
SSA
Deaf
IDEA, Part B
SSA
Deaf
Preschool
SSA - IDEA, B SSA - IDEA C
Deaf - Early
Intervention
Advanced
Placement
Incentives
State
Textbook
Fund
Student
Success
Initiative
312 315 316 317 340 397 404 410
Assistance
- - - - - - - - $ $ $ $ $ $ $ $
- - - - - - - -
- - - - - - - -
- - - - - - - -
1,550 - 29,641 26,770 9,582 - 88,313 -
- - 199,587 - 44,578 - - 612,933
- - - - - - - -
26,770 54,160 - - 1,550 229,228 88,313 612,933 $ $ $ $ $ $ $ $
- - 29,641 - - - - 317,861 $ $ $ $ $ $ $ $
- - - 14,776 8,370 - - -
1,550 - - 11,994 44,342 - 88,313 -
- - - - - - - -
- - 199,587 - 1,448 - - 295,072
26,770 54,160 - - 1,550 229,228 88,313 612,933
- - - - - - - -
- - - - - - - -
- - - - - - - -
- - - - - - - -
- - - - - - - -
26,770 54,160 - - 1,550 229,228 88,313 612,933 $ $ $ $ $ $ $ $
64
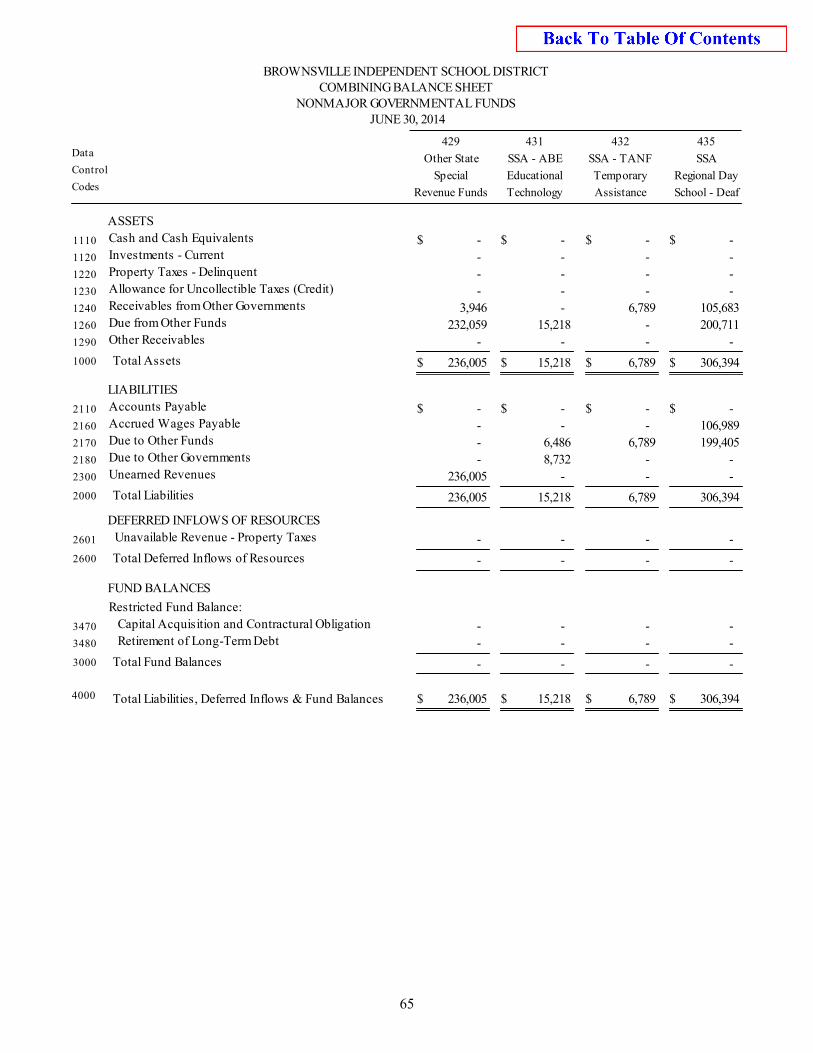
BROWNSVILLE INDEPENDENT SCHOOL DISTRICT
COMBINING BALANCE SHEETNONMAJOR GOVERNMENTAL FUNDS
JUNE 30, 2014
Control
Data
Codes
Other State
Special
Revenue Funds Technology
Educational
SSA - ABE
Assistance
Temporary
SSA - TANF
School - Deaf
Regional Day
SSA
429 431 432 435
ASSETS
- - - - Cash and Cash Equivalents $ $ $ $1110
- - - - Investments - Current1120
- - - - Property Taxes - Delinquent1220
- - - - Allowance for Uncollectible Taxes (Credit)1230
- 3,946 6,789 105,683 Receivables from Other Governments1240
15,218 232,059 - 200,711 Due from Other Funds1260
- - - - Other Receivables1290
Total Assets1000 236,005 15,218 6,789 306,394 $ $ $ $
LIABILITIES
- - - - Accounts Payable $ $ $ $2110
- - - 106,989 Accrued Wages Payable2160
6,486 - 6,789 199,405 Due to Other Funds2170
8,732 - - - Due to Other Governments2180
- 236,005 - - Unearned Revenues2300
Total Liabilities2000 236,005 15,218 6,789 306,394
DEFERRED INFLOWS OF RESOURCES
- - - - Unavailable Revenue - Property Taxes2601
Total Deferred Inflows of Resources2600 - - - -
FUND BALANCES
Restricted Fund Balance:
- - - - Capital Acquisition and Contractural Obligation3470
- - - - Retirement of Long-Term Debt3480
Total Fund Balances3000 - - - -
4000 Total Liabilities, Deferred Inflows & Fund Balances 236,005 15,218 6,789 306,394 $ $ $ $
65
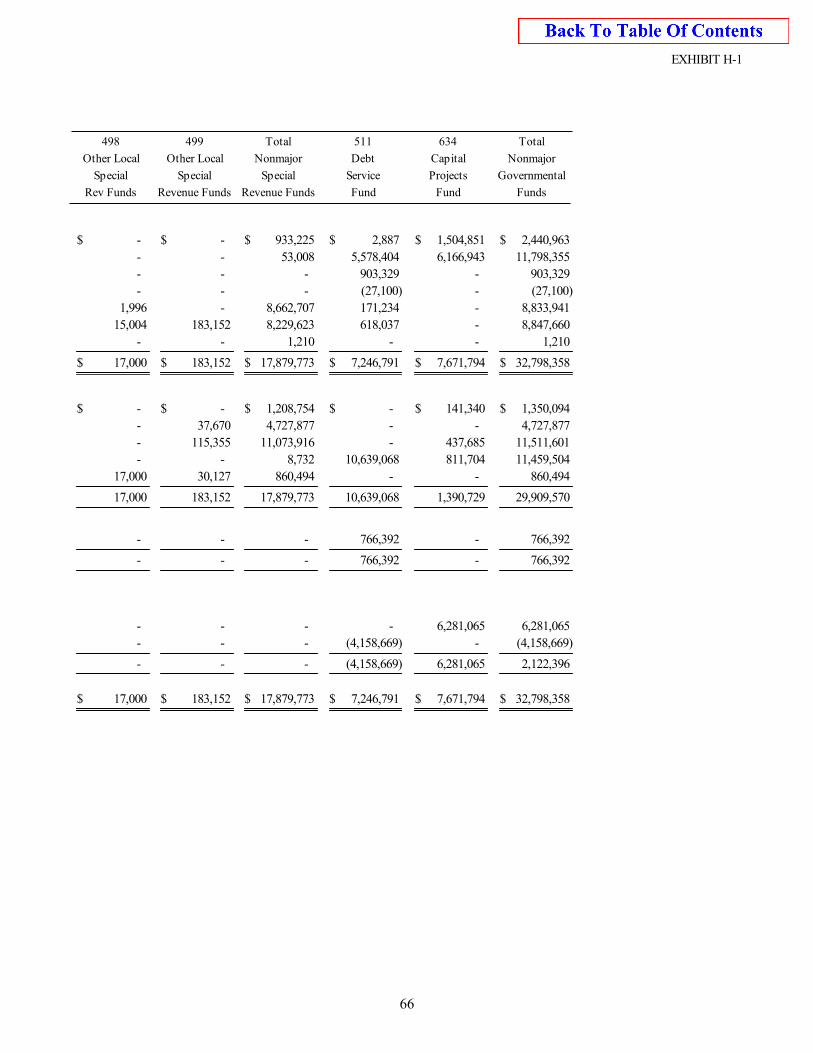
EXHIBIT H-1
Other Local
Special
Revenue Funds
Special
Other Local
Revenue Funds
Special
Nonmajor
Fund
Service
Debt Capital
Projects
Fund
Nonmajor
Governmental
Funds
498 499 Total 511 634 Total
Rev Funds
1,504,851 2,887 2,440,963 - - 933,225 $ $ $ $ $ $
6,166,943 5,578,404 11,798,355 - - 53,008
- 903,329 903,329 - - -
- (27,100) (27,100) - - -
- 171,234 8,833,941 1,996 - 8,662,707
- 618,037 8,847,660 15,004 183,152 8,229,623
- - 1,210 - - 1,210
17,000 183,152 17,879,773 7,246,791 7,671,794 32,798,358 $ $ $ $ $ $
141,340 - 1,350,094 - - 1,208,754 $ $ $ $ $ $
- - 4,727,877 - 37,670 4,727,877
437,685 - 11,511,601 - 115,355 11,073,916
811,704 10,639,068 11,459,504 - - 8,732
- - 860,494 17,000 30,127 860,494
17,000 183,152 17,879,773 10,639,068 1,390,729 29,909,570
- 766,392 766,392 - - -
- - - 766,392 - 766,392
6,281,065 - 6,281,065 - - -
- (4,158,669) (4,158,669) - - -
- - - (4,158,669) 6,281,065 2,122,396
17,000 183,152 17,879,773 7,246,791 7,671,794 32,798,358 $ $ $ $ $ $
66
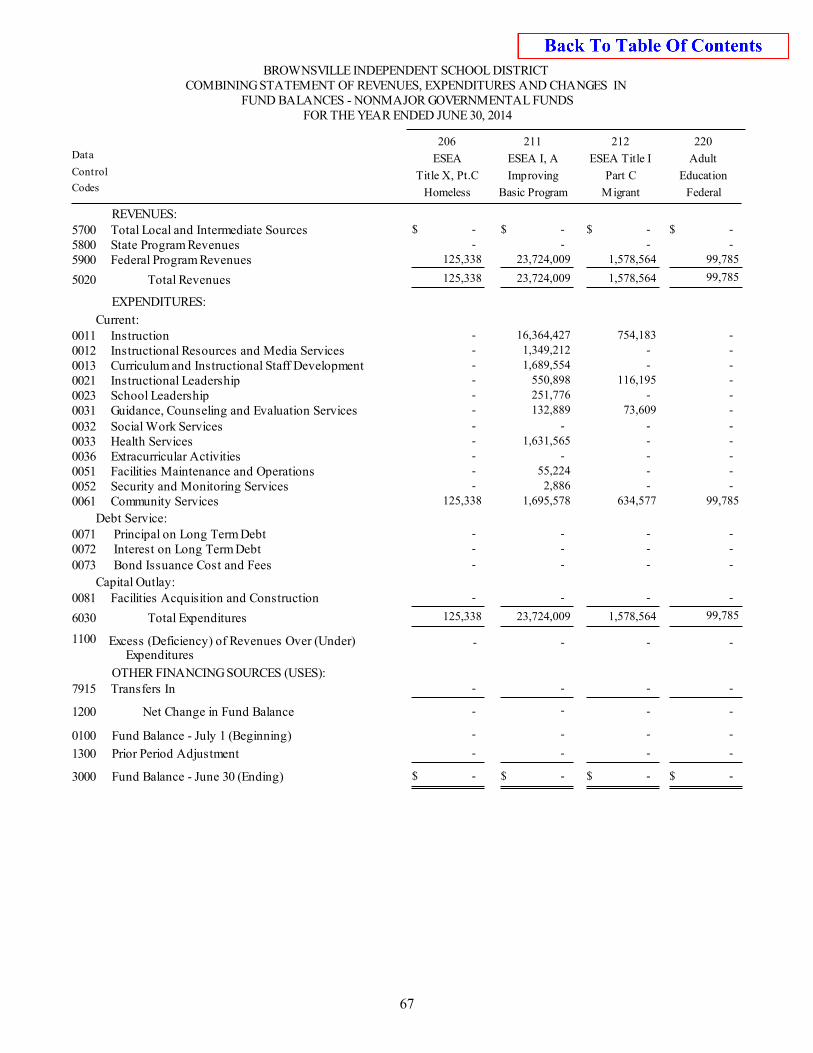
BROWNSVILLE INDEPENDENT SCHOOL DISTRICT
COMBINING STATEMENT OF REVENUES, EXPENDITURES AND CHANGES INFUND BALANCES - NONMAJOR GOVERNMENTAL FUNDS
FOR THE YEAR ENDED JUNE 30, 2014
Control
Data
Codes
ESEA
Title X, Pt.C
Homeless Basic Program
Improving
ESEA I, A
Migrant
Part C
ESEA Title I
Federal
Education
Adult
206 211 212 220
REVENUES: - - - - Total Local and Intermediate Sources5700 $ $ $ $ - - - - State Program Revenues5800
23,724,009 125,338 1,578,564 99,785 Federal Program Revenues5900
Total Revenues5020 125,338 23,724,009 1,578,564 99,785
EXPENDITURES:
Current:16,364,427 - 754,183 - Instruction00111,349,212 - - - Instructional Resources and Media Services00121,689,554 - - - Curriculum and Instructional Staff Development0013
550,898 - 116,195 - Instructional Leadership0021251,776 - - - School Leadership0023132,889 - 73,609 - Guidance, Counseling and Evaluation Services0031
- - - - Social Work Services00321,631,565 - - - Health Services0033
- - - - Extracurricular Activities003655,224 - - - Facilities Maintenance and Operations00512,886 - - - Security and Monitoring Services0052
1,695,578 125,338 634,577 99,785 Community Services0061
Debt Service: - - - - Principal on Long Term Debt0071 - - - - Interest on Long Term Debt0072 - - - - Bond Issuance Cost and Fees0073
Capital Outlay: - - - - Facilities Acquisition and Construction0081
Total Expenditures6030 125,338 23,724,009 1,578,564 99,785
1100 Excess (Deficiency) of Revenues Over (Under) Expenditures
- - - -
OTHER FINANCING SOURCES (USES): - - - - Transfers In7915
1200 Net Change in Fund Balance - - - -
0100 Fund Balance - July 1 (Beginning) - - - -
1300 Prior Period Adjustment -
3000 Fund Balance - June 30 (Ending)
- - -
$ - $ - $ - $ -
67
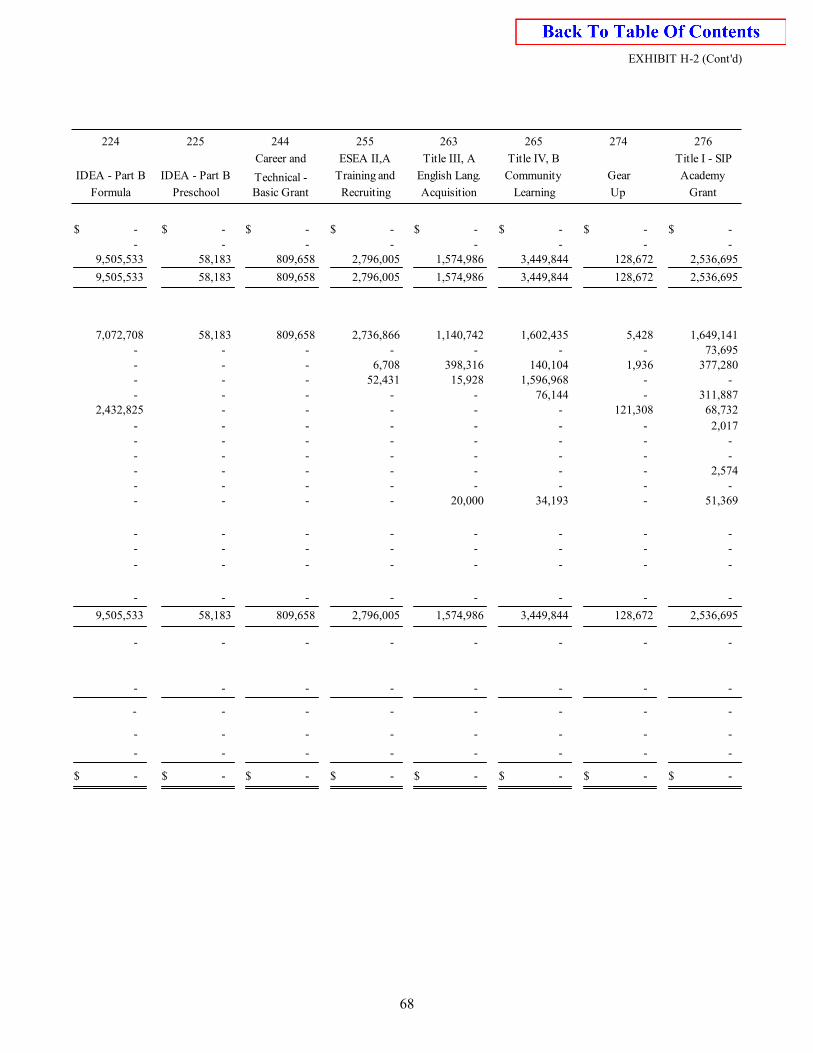
EXHIBIT H-2 (Cont'd)
IDEA - Part B
Formula Preschool
IDEA - Part B
Basic GrantTechnical -
Career and
Recruiting
Training and
ESEA II,A
224 225 244 255 276
Title I - SIP
Academy
Grant
274
Gear
Up
265
Title IV, B
Community
Learning
263
Title III, A
English Lang.
Acquisition
- - - - - - - - $ $ $ $ $ $ $ $ - - - - - - - -
58,183 9,505,533 809,658 2,796,005 2,536,695 128,672 3,449,844 1,574,986
9,505,533 58,183 809,658 2,796,005 2,536,695 128,672 3,449,844 1,574,986
58,183 7,072,708 809,658 2,736,866 1,649,141 5,428 1,602,435 1,140,742 - - - - 73,695 - - - - - - 6,708 377,280 1,936 140,104 398,316 - - - 52,431 - - 1,596,968 15,928 - - - - 311,887 - 76,144 - - 2,432,825 - - 68,732 121,308 - -
- - - - 2,017 - - - - - - - - - - - - - - - - - - - - - - - 2,574 - - - - - - - - - - - - - - - 51,369 - 34,193 20,000
- - - - - - - - - - - - - - - -
- - - - - - - -
- - - - - - - -
9,505,533 58,183 809,658 2,796,005 2,536,695 128,672 3,449,844 1,574,986
- - - - - - - -
- - - - - - - -
- - - - - - - -
- - - - - - - -
- - - - - - - -
$ - $ - $ - $ - $ - $ - $ - $ -
68
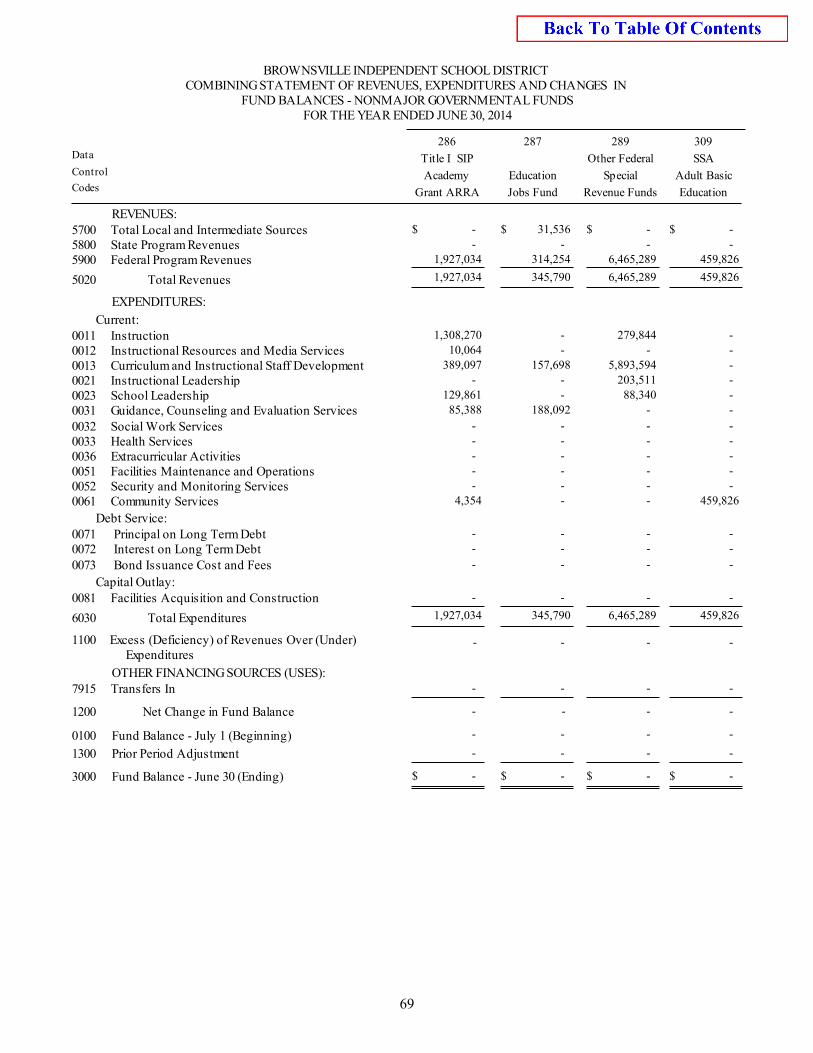
BROWNSVILLE INDEPENDENT SCHOOL DISTRICT
COMBINING STATEMENT OF REVENUES, EXPENDITURES AND CHANGES INFUND BALANCES - NONMAJOR GOVERNMENTAL FUNDS
FOR THE YEAR ENDED JUNE 30, 2014
Control
Data
Codes
Title I SIP
Academy
Grant ARRA Jobs Fund
Education
Revenue Funds
Special
Other Federal
Education
Adult Basic
SSA
286 287 289 309
REVENUES:31,536 - - - Total Local and Intermediate Sources5700 $ $ $ $
- - - - State Program Revenues5800314,254 1,927,034 6,465,289 459,826 Federal Program Revenues5900
Total Revenues5020 1,927,034 345,790 6,465,289 459,826
EXPENDITURES:
Current: - 1,308,270 279,844 - Instruction0011 - 10,064 - - Instructional Resources and Media Services0012
157,698 389,097 5,893,594 - Curriculum and Instructional Staff Development0013 - - 203,511 - Instructional Leadership0021 - 129,861 88,340 - School Leadership0023
188,092 85,388 - - Guidance, Counseling and Evaluation Services0031 - - - - Social Work Services0032 - - - - Health Services0033 - - - - Extracurricular Activities0036 - - - - Facilities Maintenance and Operations0051 - - - - Security and Monitoring Services0052 - 4,354 - 459,826 Community Services0061
Debt Service: - - - - Principal on Long Term Debt0071 - - - - Interest on Long Term Debt0072 - - - - Bond Issuance Cost and Fees0073
Capital Outlay: - - - - Facilities Acquisition and Construction0081
Total Expenditures6030 1,927,034 345,790 6,465,289 459,826
1100 Excess (Deficiency) of Revenues Over (Under) Expenditures
- - - -
OTHER FINANCING SOURCES (USES): - - - - Transfers In7915
1200 Net Change in Fund Balance - - - -
0100 Fund Balance - July 1 (Beginning) - - - -
1300 Prior Period Adjustment -
3000 Fund Balance - June 30 (Ending)
- - -
$ - $ - $ - $ -
69
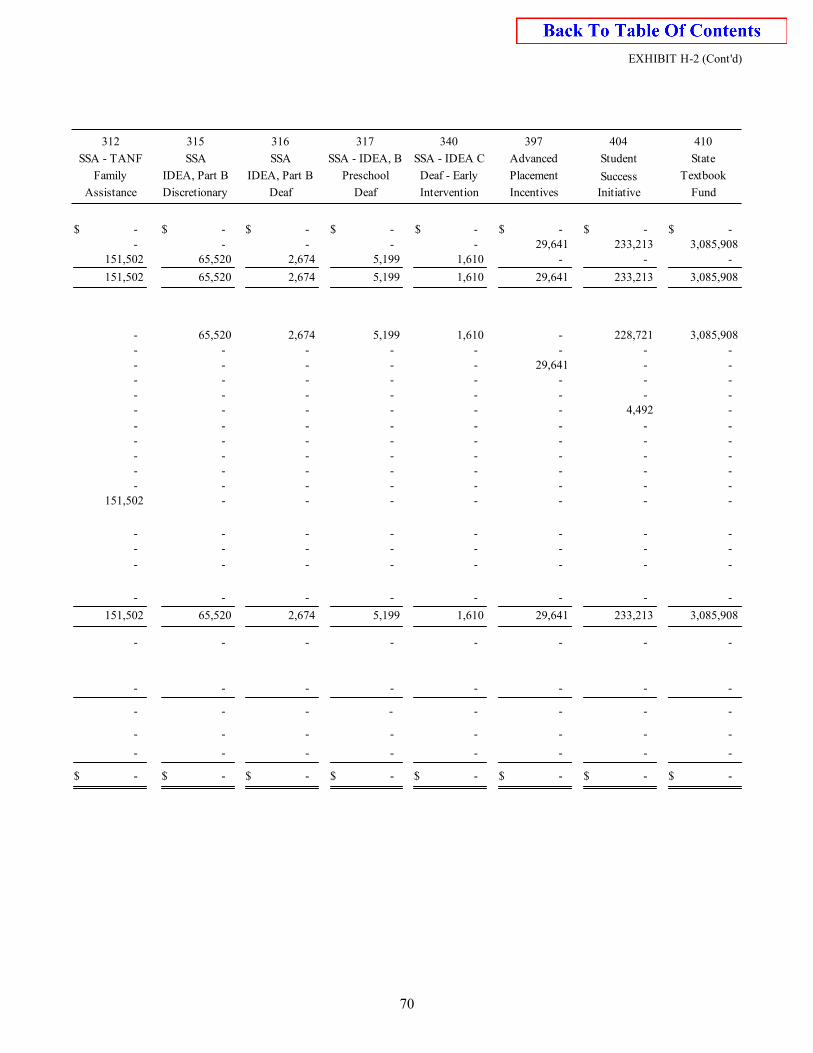
EXHIBIT H-2 (Cont'd)
SSA - TANF
Family
Assistance Discretionary
IDEA, Part B
SSA
Deaf
IDEA, Part B
SSA
Deaf
Preschool
SSA - IDEA, B
312 315 316 317 410
State
Textbook
Fund
404
Student
Success
Initiative
397
Advanced
Placement
Incentives
340
SSA - IDEA C
Deaf - Early
Intervention
- - - - - - - - $ $ $ $ $ $ $ $ - - - - 3,085,908 233,213 29,641 -
65,520 151,502 2,674 5,199 - - - 1,610
151,502 65,520 2,674 5,199 3,085,908 233,213 29,641 1,610
65,520 - 2,674 5,199 3,085,908 228,721 - 1,610 - - - - - - - - - - - - - - 29,641 - - - - - - - - - - - - - - - - - - - - - - 4,492 - -
- - - - - - - - - - - - - - - - - - - - - - - - - - - - - - - - - - - - - - - - - 151,502 - - - - - -
- - - - - - - - - - - - - - - -
- - - - - - - -
- - - - - - - -
151,502 65,520 2,674 5,199 3,085,908 233,213 29,641 1,610
- - - - - - - -
- - - - - - - -
- - - - - - - -
- - - - - - - -
- - - - - - - -
- $ - $ - $ - $ - $ - $ - $ - $
70
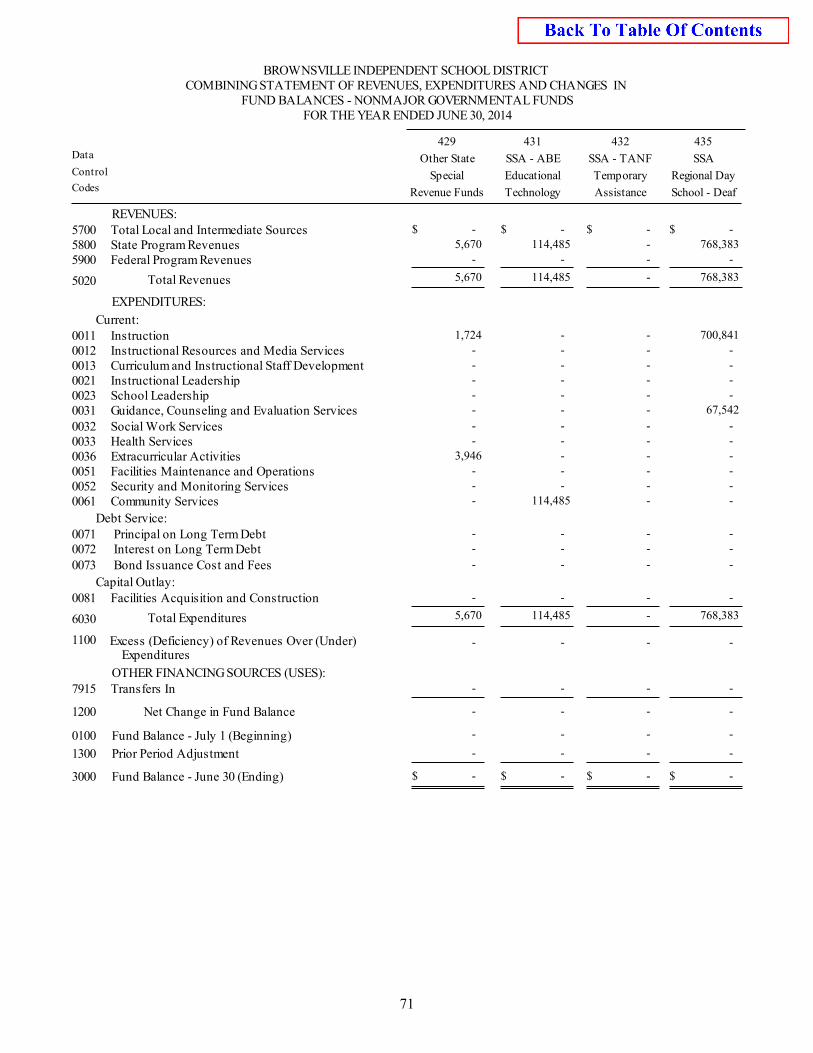
BROWNSVILLE INDEPENDENT SCHOOL DISTRICT
COMBINING STATEMENT OF REVENUES, EXPENDITURES AND CHANGES INFUND BALANCES - NONMAJOR GOVERNMENTAL FUNDS
FOR THE YEAR ENDED JUNE 30, 2014
Control
Data
Codes
Other State
Special
Revenue Funds Technology
Educational
SSA - ABE
Assistance
Temporary
SSA - TANF
School - Deaf
Regional Day
SSA
429 431 432 435
REVENUES: - - - - Total Local and Intermediate Sources5700 $ $ $ $
114,485 5,670 - 768,383 State Program Revenues5800 - - - - Federal Program Revenues5900
Total Revenues5020 5,670 114,485 - 768,383
EXPENDITURES:
Current: - 1,724 - 700,841 Instruction0011 - - - - Instructional Resources and Media Services0012 - - - - Curriculum and Instructional Staff Development0013 - - - - Instructional Leadership0021 - - - - School Leadership0023 - - - 67,542 Guidance, Counseling and Evaluation Services0031 - - - - Social Work Services0032 - - - - Health Services0033 - 3,946 - - Extracurricular Activities0036 - - - - Facilities Maintenance and Operations0051 - - - - Security and Monitoring Services0052
114,485 - - - Community Services0061
Debt Service: - - - - Principal on Long Term Debt0071 - - - - Interest on Long Term Debt0072 - - - - Bond Issuance Cost and Fees0073
Capital Outlay: - - - - Facilities Acquisition and Construction0081
Total Expenditures6030 5,670 114,485 - 768,383
1100 Excess (Deficiency) of Revenues Over (Under) Expenditures
- - - -
OTHER FINANCING SOURCES (USES): - - - - Transfers In7915
1200 Net Change in Fund Balance
0100 Fund Balance - July 1 (Beginning)
1300 Prior Period Adjustment
3000 Fund Balance - June 30 (Ending)
- - - -
-
-
- $
-
-
$ -
-
-
$ -
-
-
$ -
71
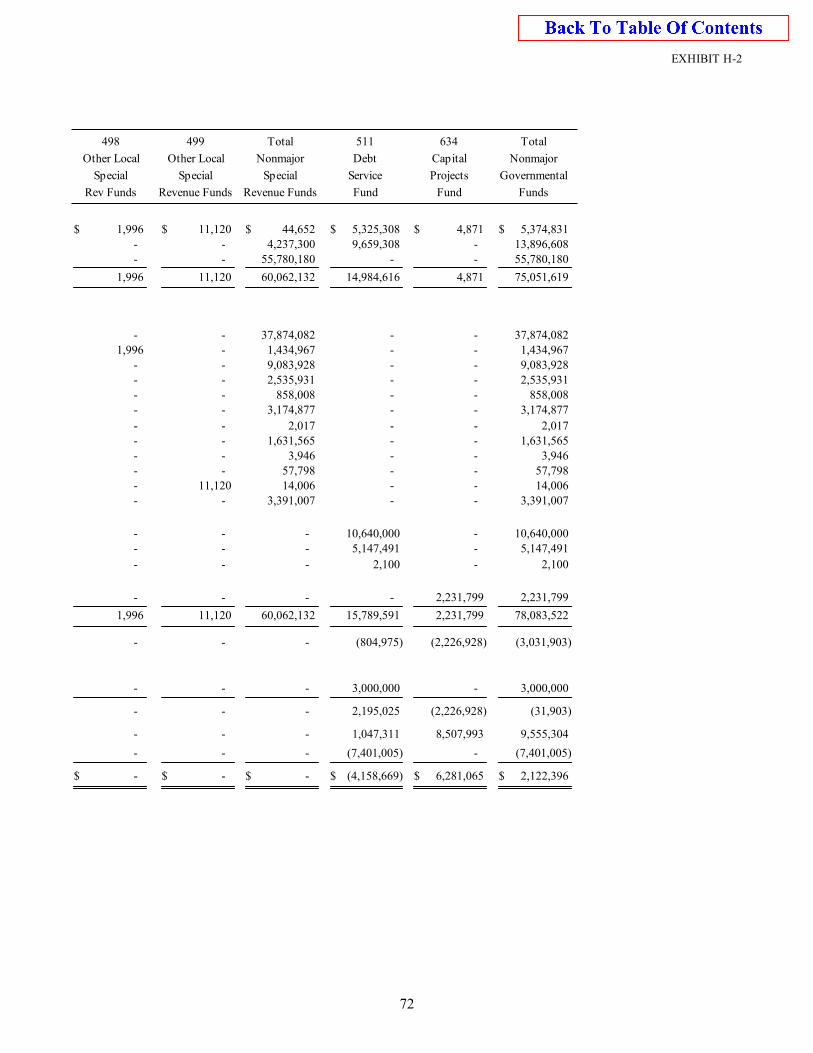
EXHIBIT H-2
Other Local
Special
Rev Funds Revenue Funds
Special
Other Local
Revenue Funds
Special
Nonmajor
Fund
Service
Debt
498 499 Total 511 Total
Nonmajor
Governmental
Funds
634
Capital
Projects
Fund
11,120 1,996 44,652 5,325,308 5,374,831 4,871 $ $ $ $ $ $ - - 4,237,300 9,659,308 13,896,608 - - - 55,780,180 - 55,780,180 -
1,996 11,120 60,062,132 14,984,616 75,051,619 4,871
- - 37,874,082 - 37,874,082 - - 1,996 1,434,967 - 1,434,967 - - - 9,083,928 - 9,083,928 - - - 2,535,931 - 2,535,931 - - - 858,008 - 858,008 - - - 3,174,877 - 3,174,877 -
- - 2,017 - 2,017 - - - 1,631,565 - 1,631,565 - - - 3,946 - 3,946 - - - 57,798 - 57,798 -
11,120 - 14,006 - 14,006 - - - 3,391,007 - 3,391,007 -
- - - 10,640,000 10,640,000 - - - - 5,147,491 5,147,491 -
- - - 2,100 2,100 -
- - - - 2,231,799 2,231,799
1,996 11,120 60,062,132 15,789,591 78,083,522 2,231,799
- - - (804,975) (2,226,928) (3,031,903)
- - - 3,000,000 3,000,000 -
- - - 2,195,025 (2,226,928) (31,903)
- - - 1,047,311 8,507,993 9,555,304
(7,401,005)
$ 2,122,396
-
$ 6,281,065
(7,401,005)
$ (4,158,669)
-
$ -
-
$ -
-
$ -
72
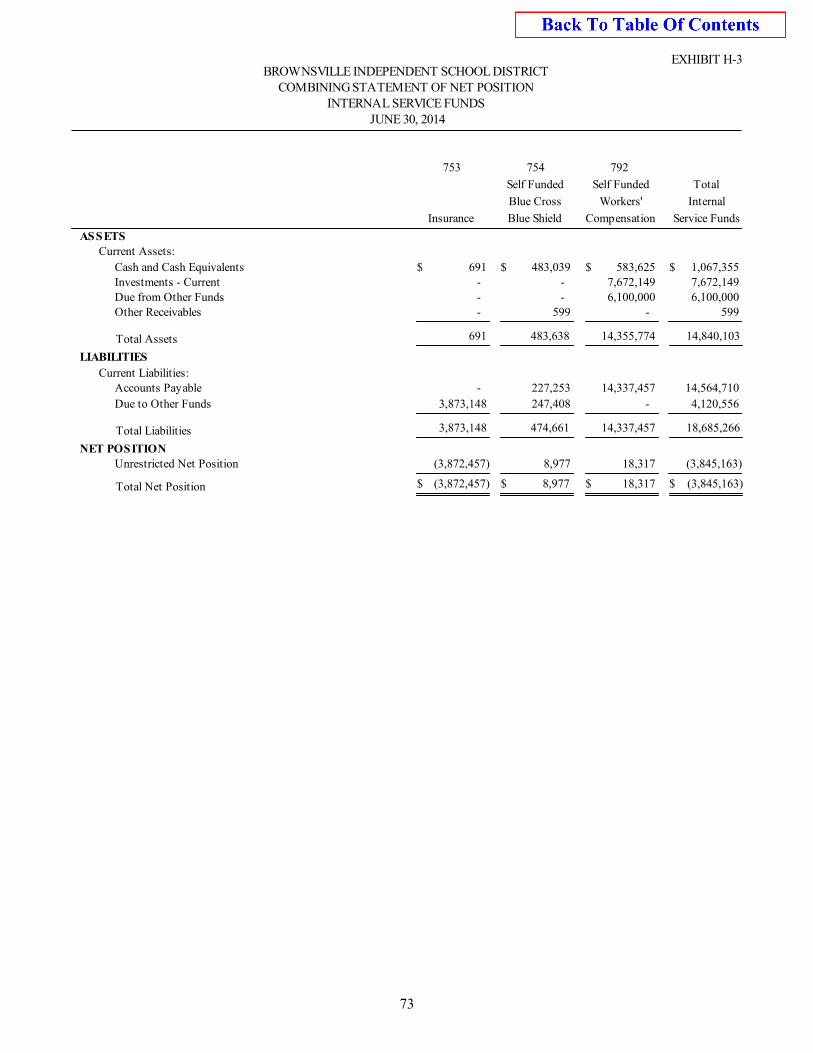
EXHIBIT H-3BROWNSVILLE INDEPENDENT SCHOOL DISTRICT
COMBINING STATEMENT OF NET POSITIONINTERNAL SERVICE FUNDS
JUNE 30, 2014
Insurance Blue Shield
Blue Cross
Self Funded
Compensation
Workers'
Self Funded
Service Funds
Internal
Total
792753 754
ASSETSCurrent Assets:
483,039 691 583,625 1,067,355 Cash and Cash Equivalents $ $ $ $ - - 7,672,149 7,672,149 Investments - Current - - 6,100,000 6,100,000 Due from Other Funds
599 - - 599 Other Receivables
Total Assets 691 483,638 14,355,774 14,840,103
LIABILITIES
Current Liabilities:227,253 - 14,337,457 14,564,710 Accounts Payable
247,408 3,873,148 - 4,120,556 Due to Other Funds
Total Liabilities 3,873,148 474,661 14,337,457 18,685,266
NET POSITION8,977 (3,872,457) 18,317 (3,845,163)Unrestricted Net Position
Total Net Position (3,872,457) 8,977 18,317 (3,845,163)$ $ $ $
73
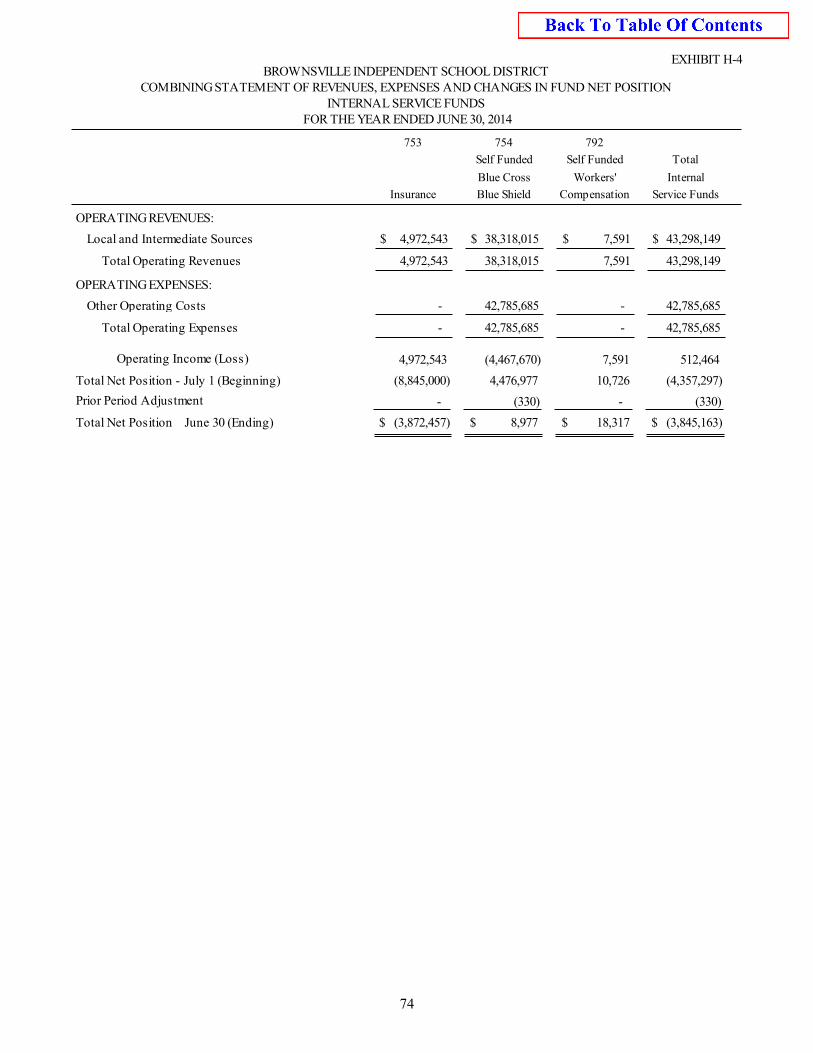
EXHIBIT H-4BROWNSVILLE INDEPENDENT SCHOOL DISTRICT
COMBINING STATEMENT OF REVENUES, EXPENSES AND CHANGES IN FUND NET POSITIONINTERNAL SERVICE FUNDS
FOR THE YEAR ENDED JUNE 30, 2014
Insurance Blue Shield
Blue Cross
Self Funded
Compensation
Workers'
Self Funded
Service Funds
Internal
Total
792753 754
OPERATING REVENUES:
38,318,015 4,972,543 7,591 43,298,149 Local and Intermediate Sources $ $ $ $
Total Operating Revenues 4,972,543 38,318,015 7,591 43,298,149
OPERATING EXPENSES:
42,785,685 - - 42,785,685 Other Operating Costs
Total Operating Expenses - 42,785,685 - 42,785,685
Operating Income (Loss)
Total Net Position - July 1 (Beginning)
Prior Period Adjustment
Total Net Position June 30 (Ending)
4,972,543
(8,845,000)
-
$ (3,872,457)
(4,467,670)
4,476,977
(330)
$ 8,977
7,591
10,726
-
$ 18,317
512,464
(4,357,297)
(330)
$ (3,845,163)
74
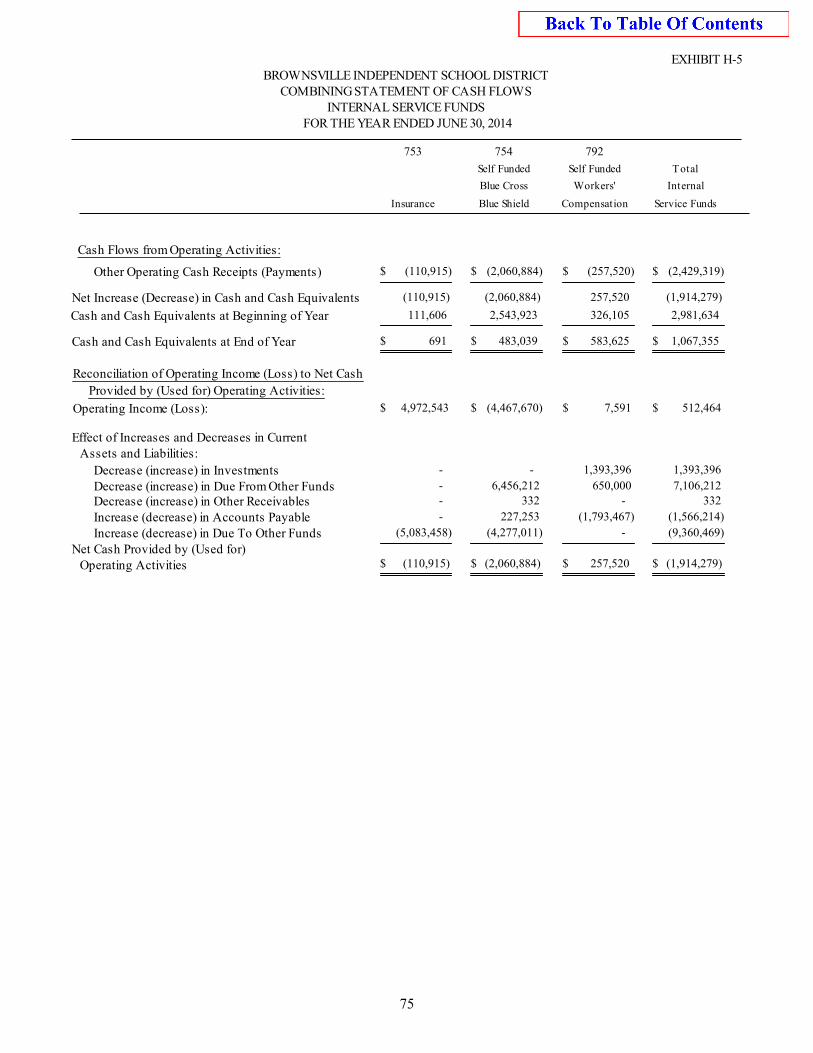
EXHIBIT H-5BROWNSVILLE INDEPENDENT SCHOOL DISTRICT
COMBINING STATEMENT OF CASH FLOWS
FOR THE YEAR ENDED JUNE 30, 2014INTERNAL SERVICE FUNDS
Self Funded Self Funded Total
Blue Cross Workers' Internal
Insurance Blue Shield Compensation Service Funds
753 754 792
Cash Flows from Operating Activities:
(2,060,884)(110,915) (257,520) (2,429,319)Other Operating Cash Receipts (Payments) $ $ $ $
Net Increase (Decrease) in Cash and Cash Equivalents (110,915) (2,060,884) 257,520 (1,914,279)
Cash and Cash Equivalents at Beginning of Year 111,606 2,543,923 326,105 2,981,634
Cash and Cash Equivalents at End of Year 691 483,039 583,625 1,067,355 $ $ $ $
Operating Income (Loss): $ $ $ $
Reconciliation of Operating Income (Loss) to Net Cash
Provided by (Used for) Operating Activities:
4,972,543 (4,467,670) 7,591 512,464
Assets and Liabilities:Effect of Increases and Decreases in Current
- - 1,393,396 1,393,396 Decrease (increase) in Investments6,456,212 - 650,000 7,106,212 Decrease (increase) in Due From Other Funds
332 - - 332 Decrease (increase) in Other Receivables227,253 - (1,793,467) (1,566,214)Increase (decrease) in Accounts Payable
(4,277,011)(5,083,458) - (9,360,469)Increase (decrease) in Due To Other FundsNet Cash Provided by (Used for)
(2,060,884) 257,520 (1,914,279)Operating Activities (110,915)$ $ $ $
75
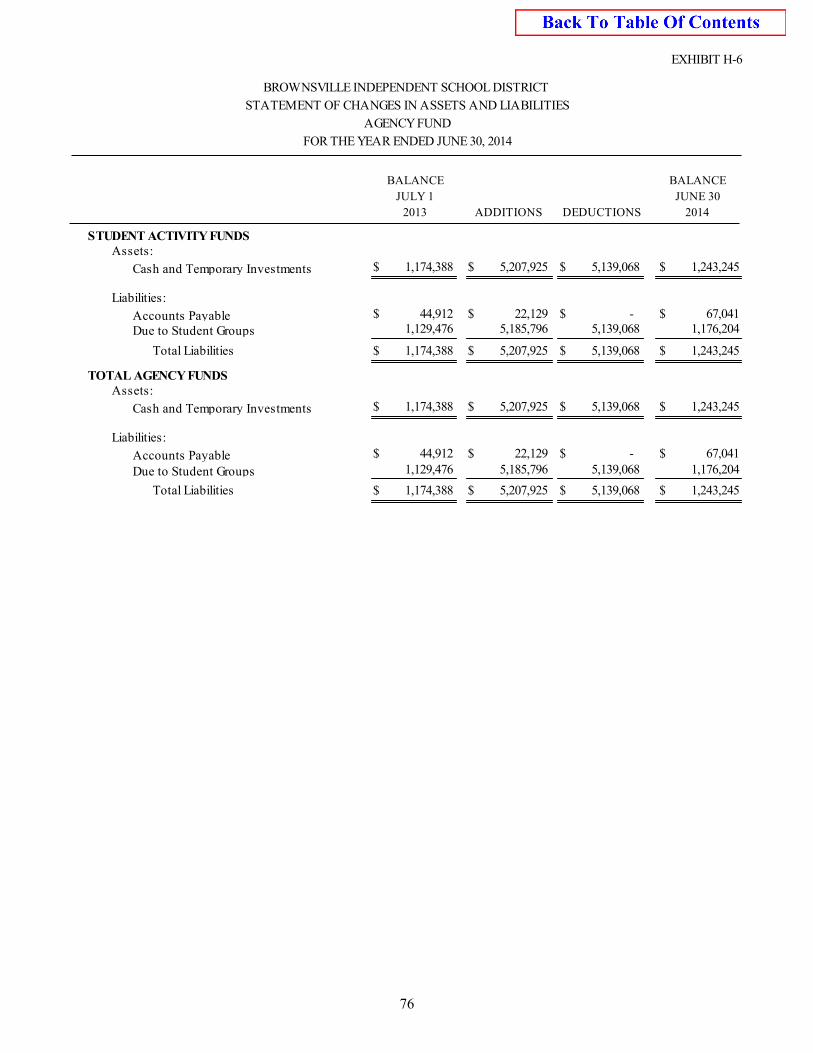
EXHIBIT H-6
BROWNSVILLE INDEPENDENT SCHOOL DISTRICT
STATEMENT OF CHANGES IN ASSETS AND LIABILITIES
AGENCY FUND
FOR THE YEAR ENDED JUNE 30, 2014
BALANCE
JULY 1
2013 ADDITIONS
DEDUCTIONS
2014
JUNE 30
BALANCE
STUDENT ACTIVITY FUNDSAssets:
5,207,925 1,174,388 5,139,068 Cash and Temporary Investments 1,243,245 $ $ $ $
Liabilities:22,129 44,912 - Accounts Payable 67,041 $ $ $ $
5,185,796 1,129,476 5,139,068 Due to Student Groups 1,176,204
Total Liabilities 1,174,388 5,207,925 5,139,068 1,243,245 $ $ $ $
TOTAL AGENCY FUNDSAssets:
5,207,925 1,174,388 5,139,068 Cash and Temporary Investments 1,243,245 $ $ $ $
Liabilities:22,129 44,912 - Accounts Payable 67,041 $ $ $ $
5,185,796 1,129,476 5,139,068 Due to Student Groups 1,176,204
Total Liabilities 1,174,388 5,207,925 5,139,068 1,243,245 $ $ $ $
76
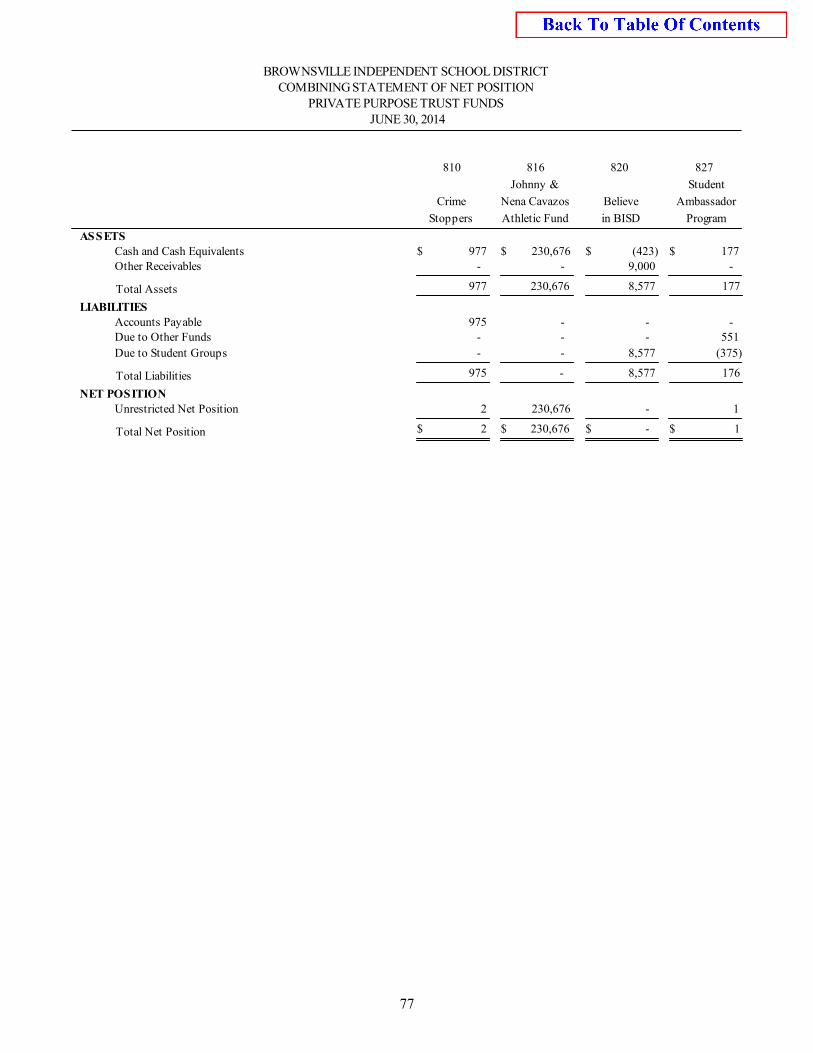
BROWNSVILLE INDEPENDENT SCHOOL DISTRICT
COMBINING STATEMENT OF NET POSITIONPRIVATE PURPOSE TRUST FUNDS
JUNE 30, 2014
Crime
Stoppers Athletic Fund
Nena Cavazos
Johnny &
in BISD
Believe
Program
Ambassador
Student
820 827810 816
ASSETS230,676 977 (423) 177 Cash and Cash Equivalents $ $ $ $
- - 9,000 - Other Receivables
Total Assets 977 230,676 8,577 177
LIABILITIES - 975 - - Accounts Payable - - - 551 Due to Other Funds
- - 8,577 (375)Due to Student Groups
Total Liabilities 975 - 8,577 176
NET POSITION230,676 2 - 1 Unrestricted Net Position
Total Net Position 2 230,676 - 1 $ $ $ $
77
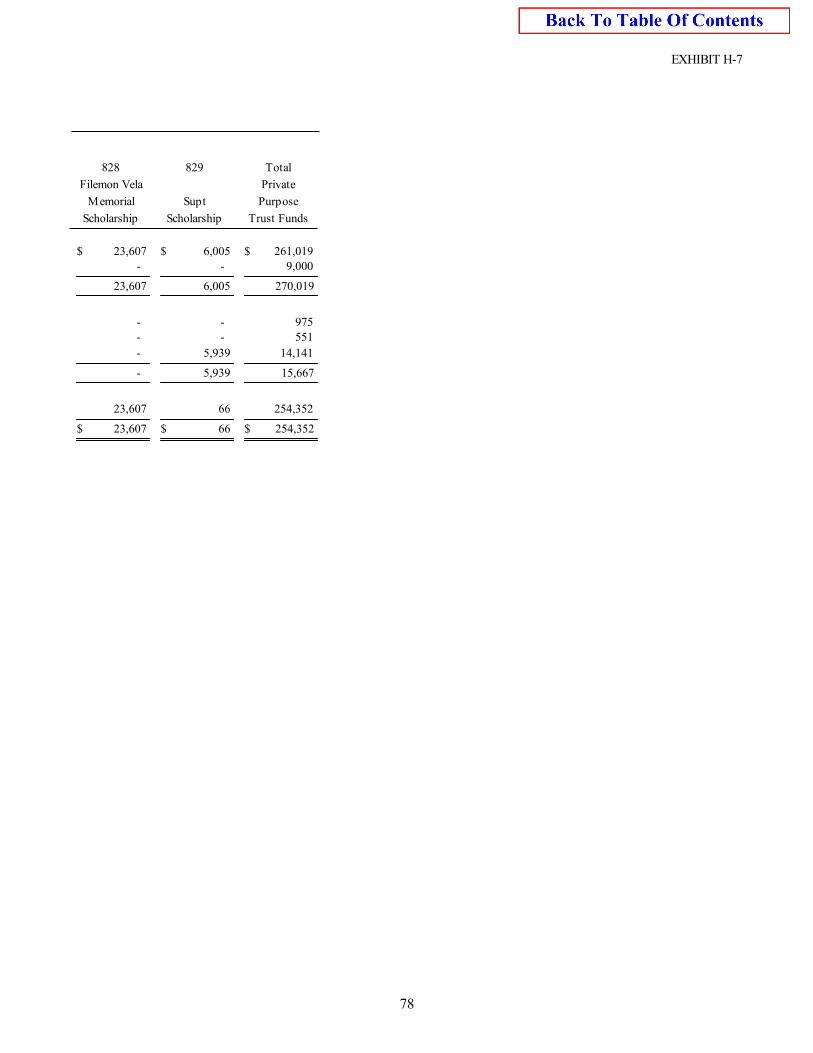
EXHIBIT H-7
Filemon Vela
Memorial
Scholarship
Supt
Trust Funds
Purpose
Private
Scholarship
828 829 Total
23,607 6,005 261,019 $ $ $ - - 9,000
23,607 6,005 270,019
- - 975 - - 551
- 5,939 14,141
- 5,939 15,667
23,607 66 254,352
23,607 66 254,352 $ $ $
78
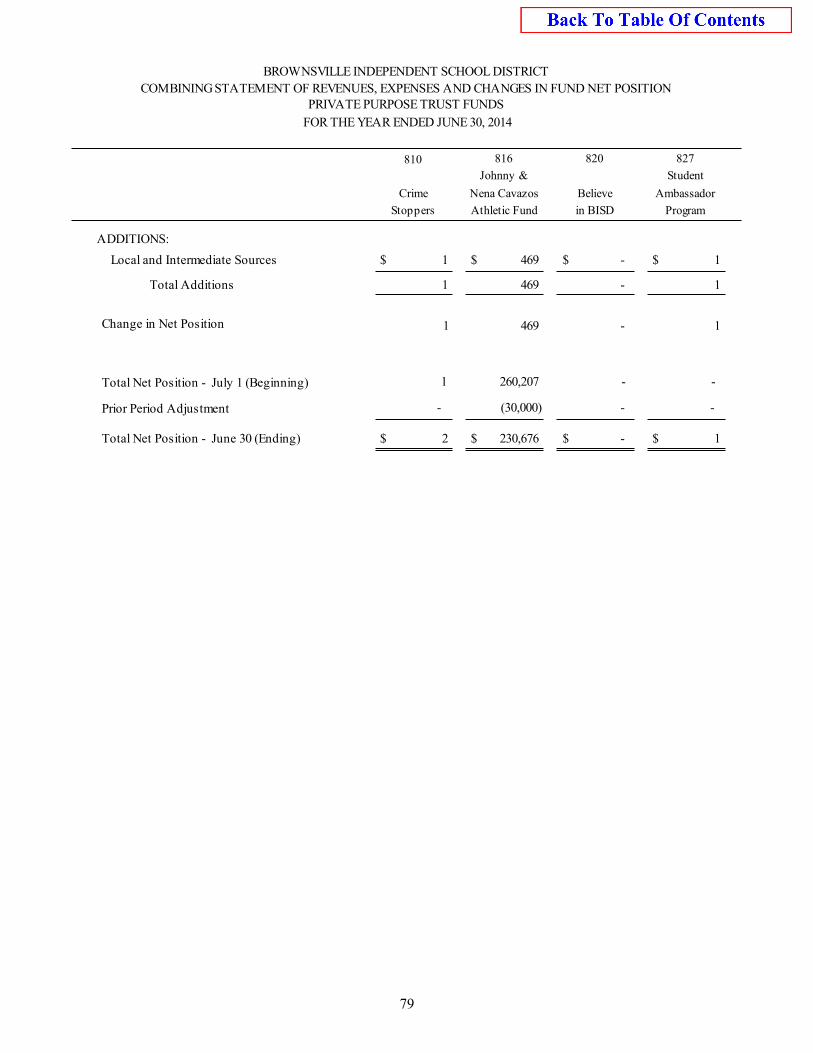
BROWNSVILLE INDEPENDENT SCHOOL DISTRICT
COMBINING STATEMENT OF REVENUES, EXPENSES AND CHANGES IN FUND NET POSITIONPRIVATE PURPOSE TRUST FUNDS
FOR THE YEAR ENDED JUNE 30, 2014
Crime
Stoppers Athletic Fund
Nena Cavazos
Johnny &
in BISD
Believe
Program
Ambassador
Student
810 816 820 827
ADDITIONS:
469 1 - 1 Local and Intermediate Sources $ $ $ $
Total Additions 1 469 - 1
Change in Net Position 1
1
469 - 1
260,207 - - Total Net Position - July 1 (Beginning)
Prior Period Adjustment
Total Net Position - June 30 (Ending)
- (30,000) - -
$ 2 $ 230,676 $ - $ 1
79
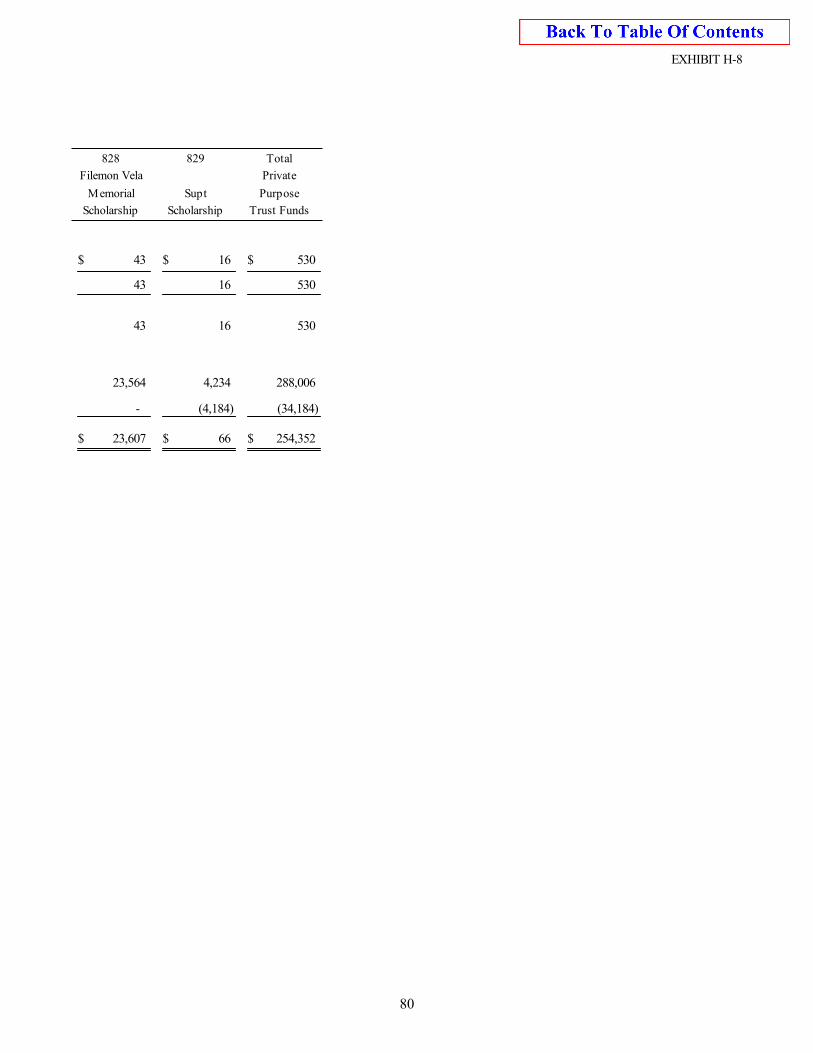
EXHIBIT H-8
Memorial
Scholarship Scholarship
Supt
Trust Funds
Purpose
Private
828 829 Total
Filemon Vela
16 43 530 $ $ $
43 16 530
43 16 530
23,564 4,234 288,006
- (4,184) (34,184)
$ 23,607 $ 66 $ 254,352
80
TEXAS EDUCATION AGENCY REQUIRED SCHEDULES
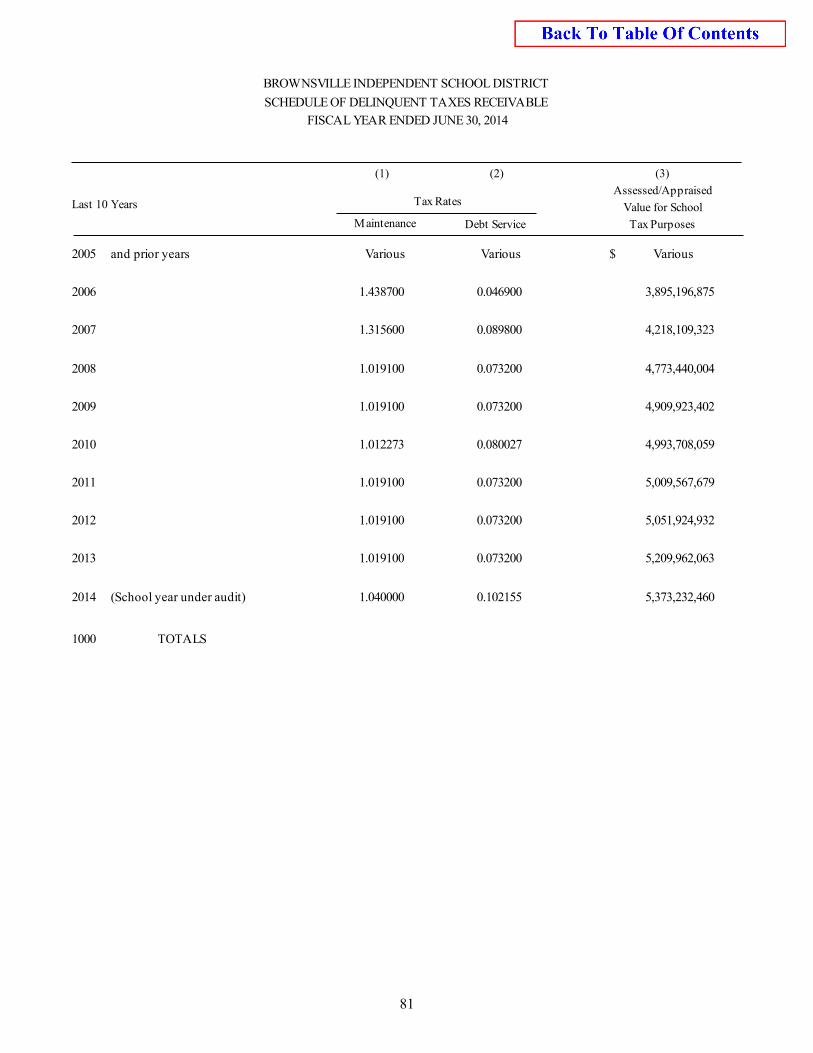
BROWNSVILLE INDEPENDENT SCHOOL DISTRICT
SCHEDULE OF DELINQUENT TAXES RECEIVABLE
FISCAL YEAR ENDED JUNE 30, 2014
Last 10 Years
Tax Rates
Debt ServiceMaintenance Tax Purposes
Value for School
Assessed/Appraised
(1) (2) (3)
VariousVariousand prior years2005 $ Various
0.0469001.438700 3,895,196,875 2006
0.0898001.315600 4,218,109,323 2007
0.0732001.019100 4,773,440,004 2008
0.0732001.019100 4,909,923,402 2009
0.0800271.012273 4,993,708,059 2010
0.0732001.019100 5,009,567,679 2011
0.0732001.019100 5,051,924,932 2012
0.0732001.019100 5,209,962,063 2013
0.1021551.040000 5,373,232,460 (School year under audit)2014
1000 TOTALS
81
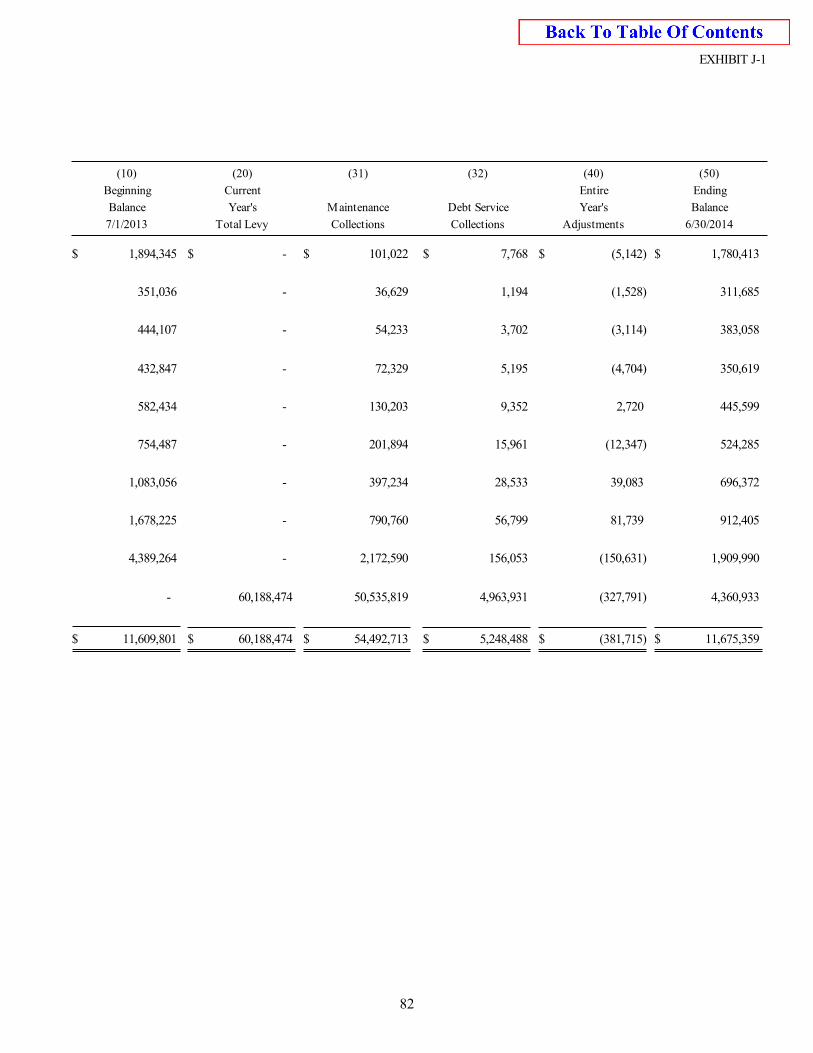
EXHIBIT J-1
7/1/2013
Balance
Beginning
Total Levy
Year's
Current
(20)(10) (50)
Ending
Balance
6/30/2014
(40)
Entire
Year's
Adjustments
(31)
Maintenance
Collections
(32)
Debt Service
Collections
- 1,894,345 101,022 (5,142)$ $ $ $ $ 1,780,413 $ 7,768
- 351,036 36,629 (1,528) 311,685 1,194
- 444,107 54,233 (3,114) 383,058 3,702
- 432,847 72,329 (4,704) 350,619 5,195
- 582,434 130,203 2,720 445,599 9,352
- 754,487 201,894 (12,347) 524,285 15,961
- 1,083,056 397,234 39,083 696,372 28,533
- 1,678,225 790,760 81,739 912,405 56,799
- 4,389,264 2,172,590 (150,631) 1,909,990 156,053
60,188,474 - 50,535,819 (327,791) 4,360,933 4,963,931
$ 11,675,359 $ (381,715)$ 54,492,713 $ 60,188,474 $ 11,609,801 $ 5,248,488
82
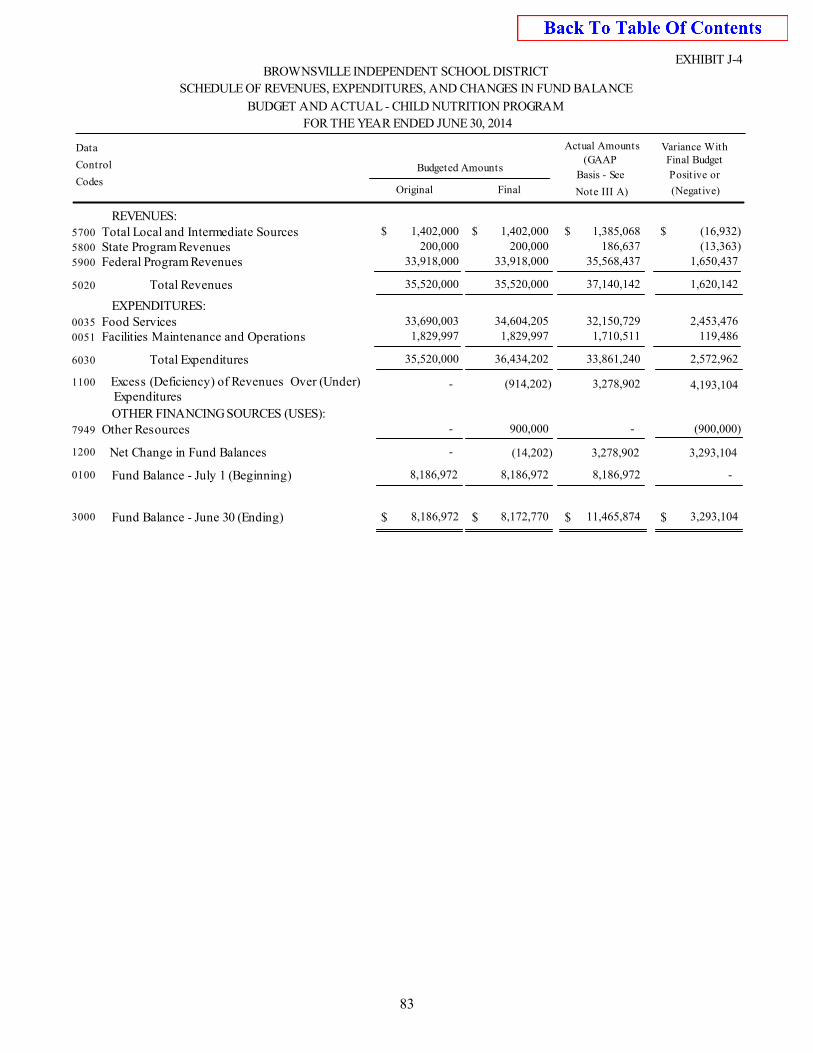
EXHIBIT J-4BROWNSVILLE INDEPENDENT SCHOOL DISTRICT
SCHEDULE OF REVENUES, EXPENDITURES, AND CHANGES IN FUND BALANCE
BUDGET AND ACTUAL - CHILD NUTRITION PROGRAM
FOR THE YEAR ENDED JUNE 30, 2014
Control
Data
CodesOriginal Final Note III A)
Basis - See
(GAAP
(Negative)
Positive or
Final BudgetVariance WithActual Amounts
Budgeted Amounts
REVENUES:1,402,000 1,402,000 1,385,068 (16,932)Total Local and Intermediate Sources $ $ $ $5700
200,000 200,000 186,637 (13,363)State Program Revenues5800
33,918,000 33,918,000 35,568,437 1,650,437 Federal Program Revenues5900
Total Revenues5020 35,520,000 35,520,000 37,140,142 1,620,142
EXPENDITURES:34,604,205 33,690,003 32,150,729 2,453,476 Food Services0035
1,829,997 1,829,997 1,710,511 119,486 Facilities Maintenance and Operations0051
Total Expenditures6030 35,520,000 36,434,202 33,861,240 2,572,962
1100 Excess (Deficiency) of Revenues Over (Under) Expenditures
- (914,202) 3,278,902 4,193,104
OTHER FINANCING SOURCES (USES): 900,000 - - (900,000)Other Resources7949
1200 Net Change in Fund Balances - (14,202) 3,278,902 3,293,104
0100 Fund Balance - July 1 (Beginning) 8,186,972 8,186,972 8,186,972 -
3000 Fund Balance - June 30 (Ending) $ 8,186,972 $ 8,172,770 $ 11,465,874 $ 3,293,104
83
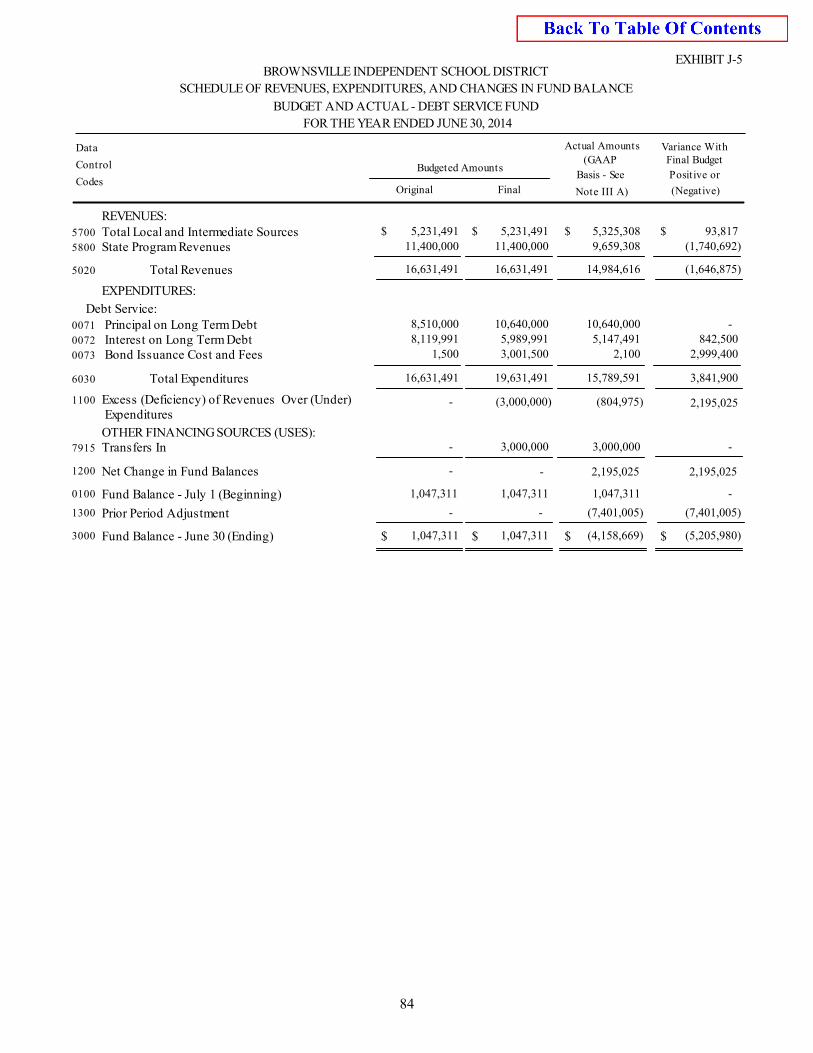
EXHIBIT J-5BROWNSVILLE INDEPENDENT SCHOOL DISTRICT
SCHEDULE OF REVENUES, EXPENDITURES, AND CHANGES IN FUND BALANCE
BUDGET AND ACTUAL - DEBT SERVICE FUND
FOR THE YEAR ENDED JUNE 30, 2014
Control
Data
CodesOriginal Final Note III A)
Basis - See
(GAAP
(Negative)
Positive or
Final BudgetVariance WithActual Amounts
Budgeted Amounts
REVENUES:5,231,491 5,231,491 5,325,308 93,817 Total Local and Intermediate Sources $ $ $ $5700
11,400,000 11,400,000 9,659,308 (1,740,692)State Program Revenues5800
Total Revenues5020 16,631,491 16,631,491 14,984,616 (1,646,875)
EXPENDITURES:
Debt Service:10,640,000 8,510,000 10,640,000 - Principal on Long Term Debt0071
5,989,991 8,119,991 5,147,491 842,500 Interest on Long Term Debt0072
3,001,500 1,500 2,100 2,999,400 Bond Issuance Cost and Fees0073
Total Expenditures6030 16,631,491 19,631,491 15,789,591 3,841,900
1100 Excess (Deficiency) of Revenues Over (Under) Expenditures
- (3,000,000) (804,975) 2,195,025
OTHER FINANCING SOURCES (USES): 3,000,000 - 3,000,000 - Transfers In7915
1200 Net Change in Fund Balances - - 2,195,025 2,195,025
0100 Fund Balance - July 1 (Beginning) 1,047,311 1,047,311 1,047,311 -
1300 Prior Period Adjustment - - (7,401,005) (7,401,005)
3000 Fund Balance - June 30 (Ending) $ 1,047,311 $ 1,047,311 $ (4,158,669) $ (5,205,980)
84
STATISTICAL SECTION
BROWNSVILLE INDEPENDENT SCHOOL DISTRICT
STATISTICAL SECTION OVERVIEW
This part of the District’s comprehensive annual financial report presents detailed information to provide the readers of the District’s financial information with a background for a better understanding of the information in the financial statements, note disclosures, and required supplementary information.
The statistical section is organized in the following sections:
Government-Wide Information – This section contains schedules that reflect current year and past years amounts on the District’s government-wide financial statements.
Fund Information – This section contains schedules that reflect current year and past years amounts on the District’s fund financial statements.
Revenue Capacity Information – This section contains schedules that provide information about the District’s most significant major own-source revenue, which is property taxes, and the factors that impact the District’s ability to generate such revenue.
Debt Capacity Information – This section contains schedules that provide information on the District’s current levels of outstanding debt, the District’s ability to repay the debt, and to issue additional debt in the future.
Demographic and Economic Information – This section contains schedule that provide an understanding of the environment within which the District’s financial activities take place.
Operating Information – This section contains schedules that provide information about the services the District provides and the activities it performs; such as, employees and facilities of the District.
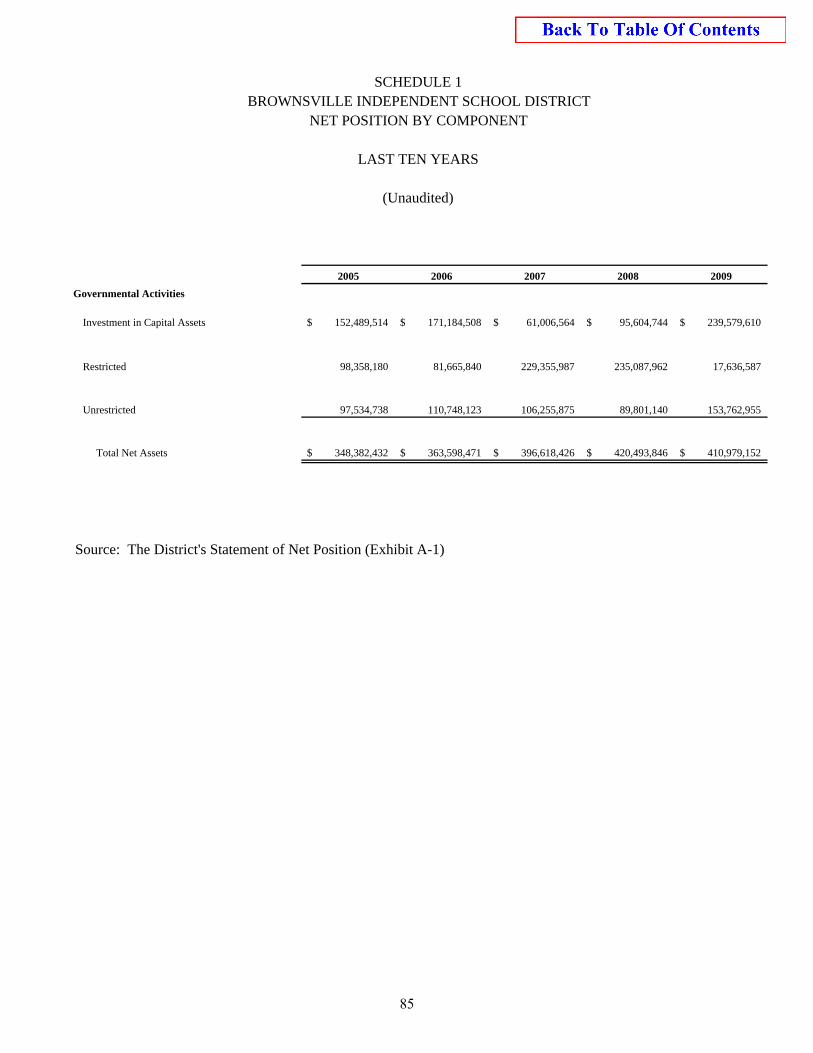
2005 2006 2007 2008 2009
Governmental Activities
Investment in Capital Assets 152,489,514$ 171,184,508$ 61,006,564$ 95,604,744$ 239,579,610$
Restricted 98,358,180 81,665,840 229,355,987 235,087,962 17,636,587
Unrestricted 97,534,738 110,748,123 106,255,875 89,801,140 153,762,955
Total Net Assets 348,382,432$ 363,598,471$ 396,618,426$ 420,493,846$ 410,979,152$
Source: The District's Statement of Net Position (Exhibit A-1)
LAST TEN YEARS
(Unaudited)
SCHEDULE 1BROWNSVILLE INDEPENDENT SCHOOL DISTRICT
NET POSITION BY COMPONENT
85
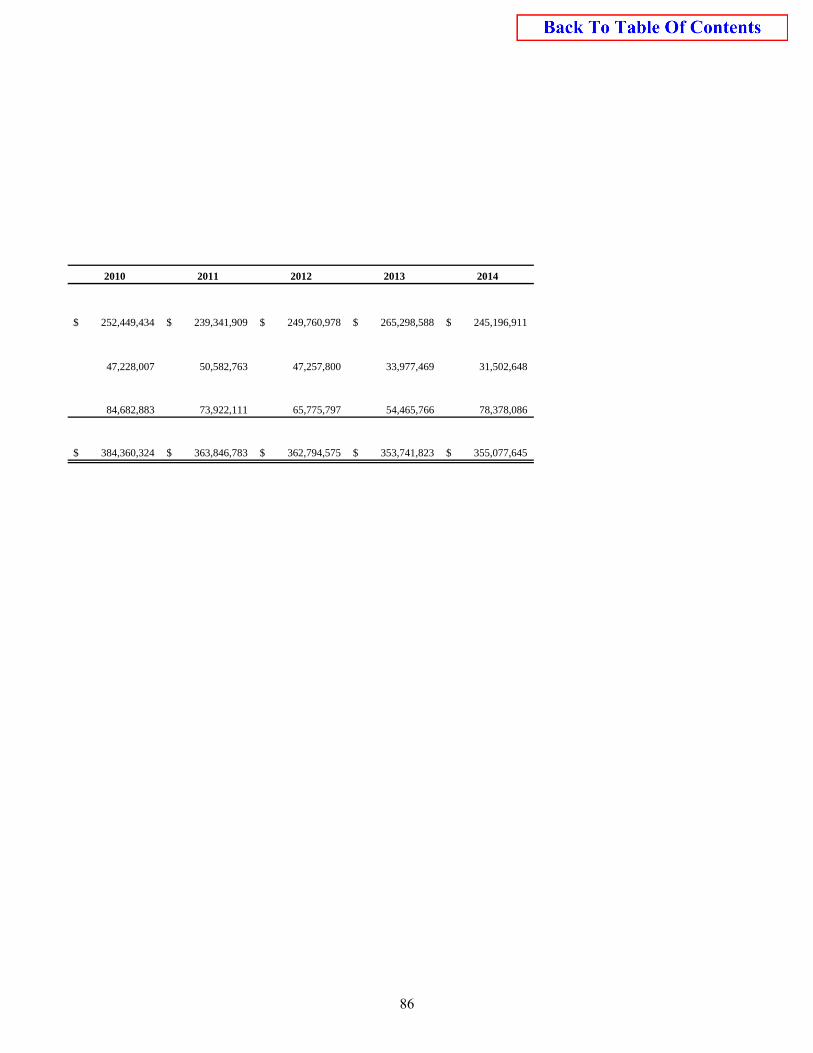
2010 2011 2012 2013 2014
252,449,434$ 239,341,909$ 249,760,978$ 265,298,588$ 245,196,911$
47,228,007 50,582,763 47,257,800 33,977,469 31,502,648
84,682,883 73,922,111 65,775,797 54,465,766 78,378,086
384,360,324$ 363,846,783$ 362,794,575$ 353,741,823$ 355,077,645$
86
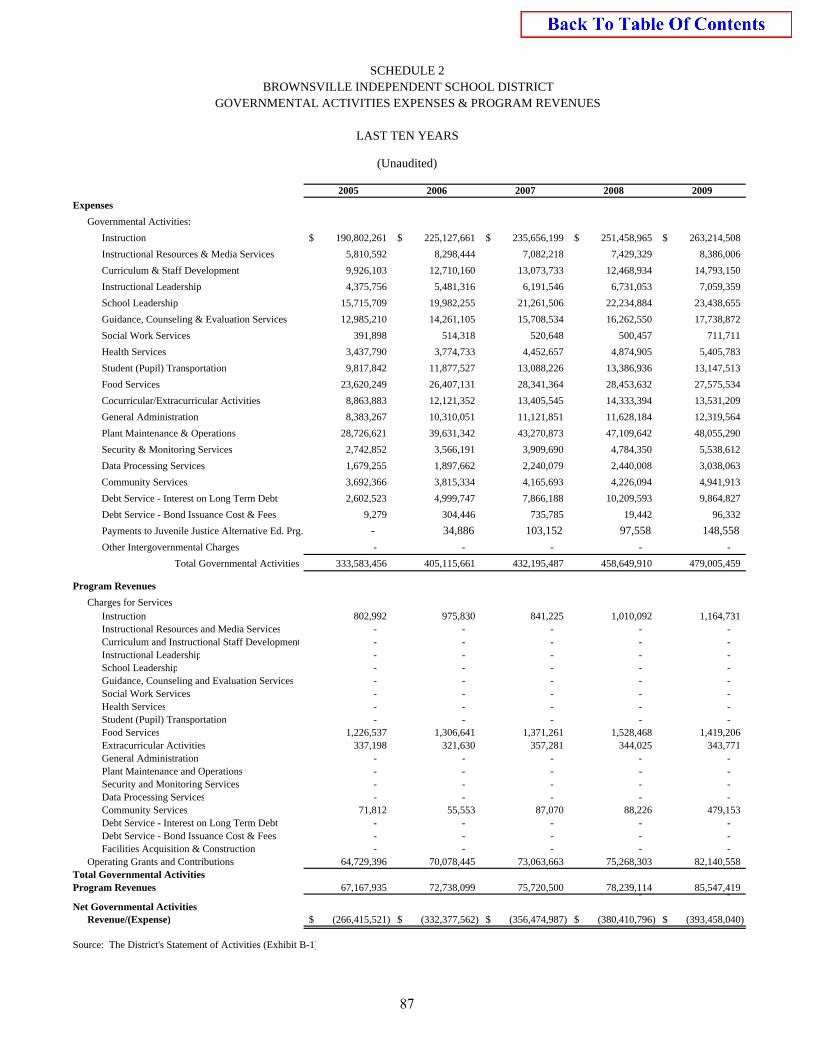
2005 2006 2007 2008 2009
Expenses
Governmental Activities:
Instruction 190,802,261$ 225,127,661$ 235,656,199$ 251,458,965$ 263,214,508$
Instructional Resources & Media Services 5,810,592 8,298,444 7,082,218 7,429,329 8,386,006
Curriculum & Staff Development 9,926,103 12,710,160 13,073,733 12,468,934 14,793,150
Instructional Leadership 4,375,756 5,481,316 6,191,546 6,731,053 7,059,359
School Leadership 15,715,709 19,982,255 21,261,506 22,234,884 23,438,655
Guidance, Counseling & Evaluation Services 12,985,210 14,261,105 15,708,534 16,262,550 17,738,872
Social Work Services 391,898 514,318 520,648 500,457 711,711
Health Services 3,437,790 3,774,733 4,452,657 4,874,905 5,405,783
Student (Pupil) Transportation 9,817,842 11,877,527 13,088,226 13,386,936 13,147,513
Food Services 23,620,249 26,407,131 28,341,364 28,453,632 27,575,534
Cocurricular/Extracurricular Activities 8,863,883 12,121,352 13,405,545 14,333,394 13,531,209
General Administration 8,383,267 10,310,051 11,121,851 11,628,184 12,319,564
Plant Maintenance & Operations 28,726,621 39,631,342 43,270,873 47,109,642 48,055,290
Security & Monitoring Services 2,742,852 3,566,191 3,909,690 4,784,350 5,538,612
Data Processing Services 1,679,255 1,897,662 2,240,079 2,440,008 3,038,063
Community Services 3,692,366 3,815,334 4,165,693 4,226,094 4,941,913
Debt Service - Interest on Long Term Debt 2,602,523 4,999,747 7,866,188 10,209,593 9,864,827
Debt Service - Bond Issuance Cost & Fees 9,279 304,446 735,785 19,442 96,332
Payments to Juvenile Justice Alternative Ed. Prg. - 34,886 103,152 97,558 148,558
Other Intergovernmental Charges - - - - -
Total Governmental Activities 333,583,456 405,115,661 432,195,487 458,649,910 479,005,459
Program Revenues
Charges for ServicesInstruction 802,992 975,830 841,225 1,010,092 1,164,731 Instructional Resources and Media Services - - - - - Curriculum and Instructional Staff Development - - - - - Instructional Leadership - - - - - School Leadership - - - - - Guidance, Counseling and Evaluation Services - - - - - Social Work Services - - - - - Health Services - - - - - Student (Pupil) Transportation - - - - - Food Services 1,226,537 1,306,641 1,371,261 1,528,468 1,419,206 Extracurricular Activities 337,198 321,630 357,281 344,025 343,771 General Administration - - - - - Plant Maintenance and Operations - - - - - Security and Monitoring Services - - - - - Data Processing Services - - - - - Community Services 71,812 55,553 87,070 88,226 479,153 Debt Service - Interest on Long Term Debt - - - - - Debt Service - Bond Issuance Cost & Fees - - - - - Facilities Acquisition & Construction - - - - -
Operating Grants and Contributions 64,729,396 70,078,445 73,063,663 75,268,303 82,140,558 Total Governmental ActivitiesProgram Revenues 67,167,935 72,738,099 75,720,500 78,239,114 85,547,419
- - Net Governmental Activities
Revenue/(Expense) (266,415,521)$ (332,377,562)$ (356,474,987)$ (380,410,796)$ (393,458,040)$
Source: The District's Statement of Activities (Exhibit B-1)
SCHEDULE 2BROWNSVILLE INDEPENDENT SCHOOL DISTRICT
GOVERNMENTAL ACTIVITIES EXPENSES & PROGRAM REVENUES
LAST TEN YEARS
(Unaudited)
87
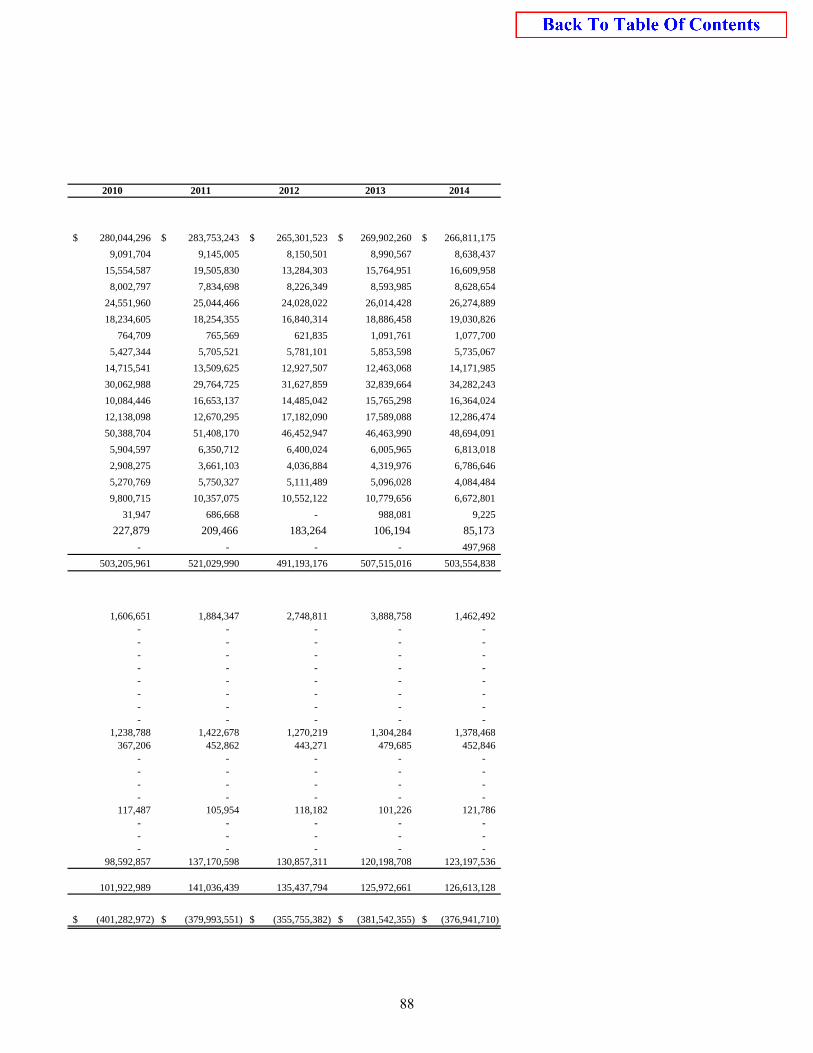
2010 2011 2012 2013 2014
280,044,296$ 283,753,243$ 265,301,523$ 269,902,260$ 266,811,175$
9,091,704 9,145,005 8,150,501 8,990,567 8,638,437
15,554,587 19,505,830 13,284,303 15,764,951 16,609,958
8,002,797 7,834,698 8,226,349 8,593,985 8,628,654
24,551,960 25,044,466 24,028,022 26,014,428 26,274,889
18,234,605 18,254,355 16,840,314 18,886,458 19,030,826
764,709 765,569 621,835 1,091,761 1,077,700
5,427,344 5,705,521 5,781,101 5,853,598 5,735,067
14,715,541 13,509,625 12,927,507 12,463,068 14,171,985
30,062,988 29,764,725 31,627,859 32,839,664 34,282,243
10,084,446 16,653,137 14,485,042 15,765,298 16,364,024
12,138,098 12,670,295 17,182,090 17,589,088 12,286,474
50,388,704 51,408,170 46,452,947 46,463,990 48,694,091
5,904,597 6,350,712 6,400,024 6,005,965 6,813,018
2,908,275 3,661,103 4,036,884 4,319,976 6,786,646
5,270,769 5,750,327 5,111,489 5,096,028 4,084,484
9,800,715 10,357,075 10,552,122 10,779,656 6,672,801
31,947 686,668 - 988,081 9,225
227,879 209,466 183,264 106,194 85,173
- - - - 497,968
503,205,961 521,029,990 491,193,176 507,515,016 503,554,838
1,606,651 1,884,347 2,748,811 3,888,758 1,462,492 - - - - - - - - - - - - - - - - - - - - - - - - - - - - - - - - - - - - - - - -
1,238,788 1,422,678 1,270,219 1,304,284 1,378,468 367,206 452,862 443,271 479,685 452,846
- - - - - - - - - - - - - - - - - - - -
117,487 105,954 118,182 101,226 121,786 - - - - - - - - - - - - - - -
98,592,857 137,170,598 130,857,311 120,198,708 123,197,536
101,922,989 141,036,439 135,437,794 125,972,661 126,613,128
(401,282,972)$ (379,993,551)$ (355,755,382)$ (381,542,355)$ (376,941,710)$
88
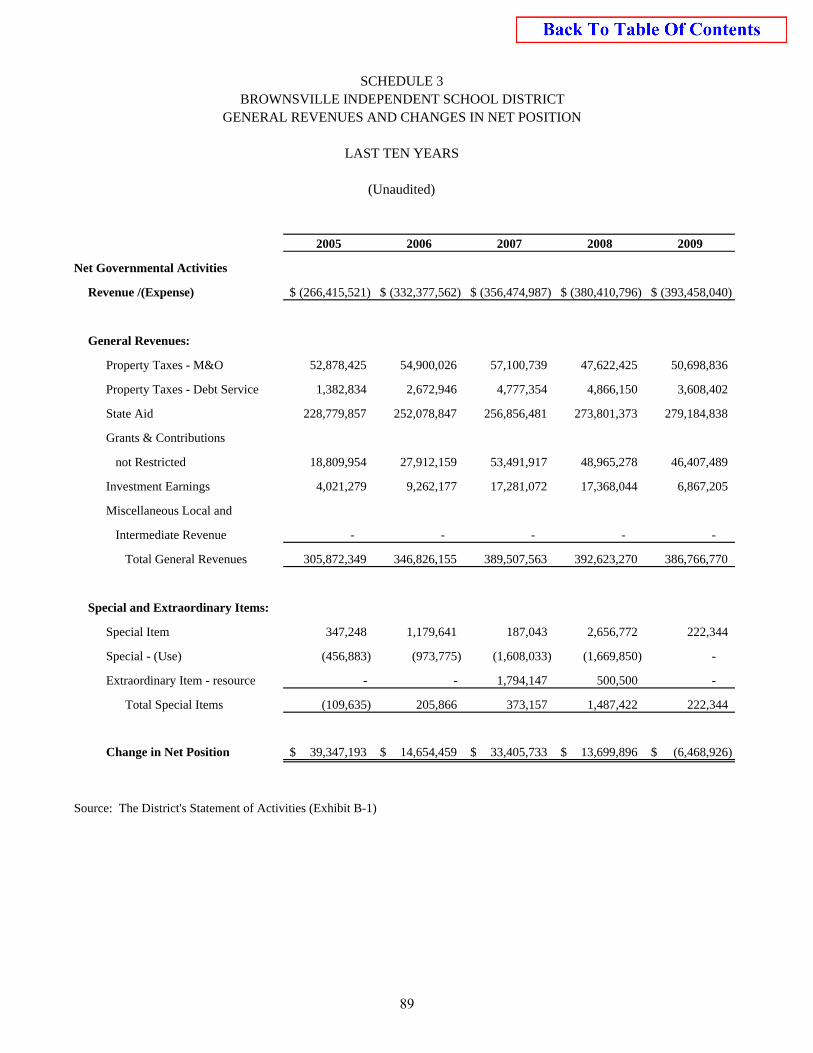
2005 2006 2007 2008 2009
Net Governmental Activities
Revenue /(Expense) (266,415,521)$ (332,377,562)$ (356,474,987)$ (380,410,796)$ (393,458,040)$
General Revenues:
Property Taxes - M&O 52,878,425 54,900,026 57,100,739 47,622,425 50,698,836
Property Taxes - Debt Service 1,382,834 2,672,946 4,777,354 4,866,150 3,608,402
State Aid 228,779,857 252,078,847 256,856,481 273,801,373 279,184,838
Grants & Contributions
not Restricted 18,809,954 27,912,159 53,491,917 48,965,278 46,407,489
Investment Earnings 4,021,279 9,262,177 17,281,072 17,368,044 6,867,205
Miscellaneous Local and
Intermediate Revenue - - - - -
Total General Revenues 305,872,349 346,826,155 389,507,563 392,623,270 386,766,770
Special and Extraordinary Items:
Special Item 347,248 1,179,641 187,043 2,656,772 222,344
Special - (Use) (456,883) (973,775) (1,608,033) (1,669,850) -
Extraordinary Item - resource - - 1,794,147 500,500 -
Total Special Items (109,635) 205,866 373,157 1,487,422 222,344
Change in Net Position 39,347,193$ 14,654,459$ 33,405,733$ 13,699,896$ (6,468,926)$
Source: The District's Statement of Activities (Exhibit B-1)
SCHEDULE 3BROWNSVILLE INDEPENDENT SCHOOL DISTRICT
GENERAL REVENUES AND CHANGES IN NET POSITION
LAST TEN YEARS
(Unaudited)
89
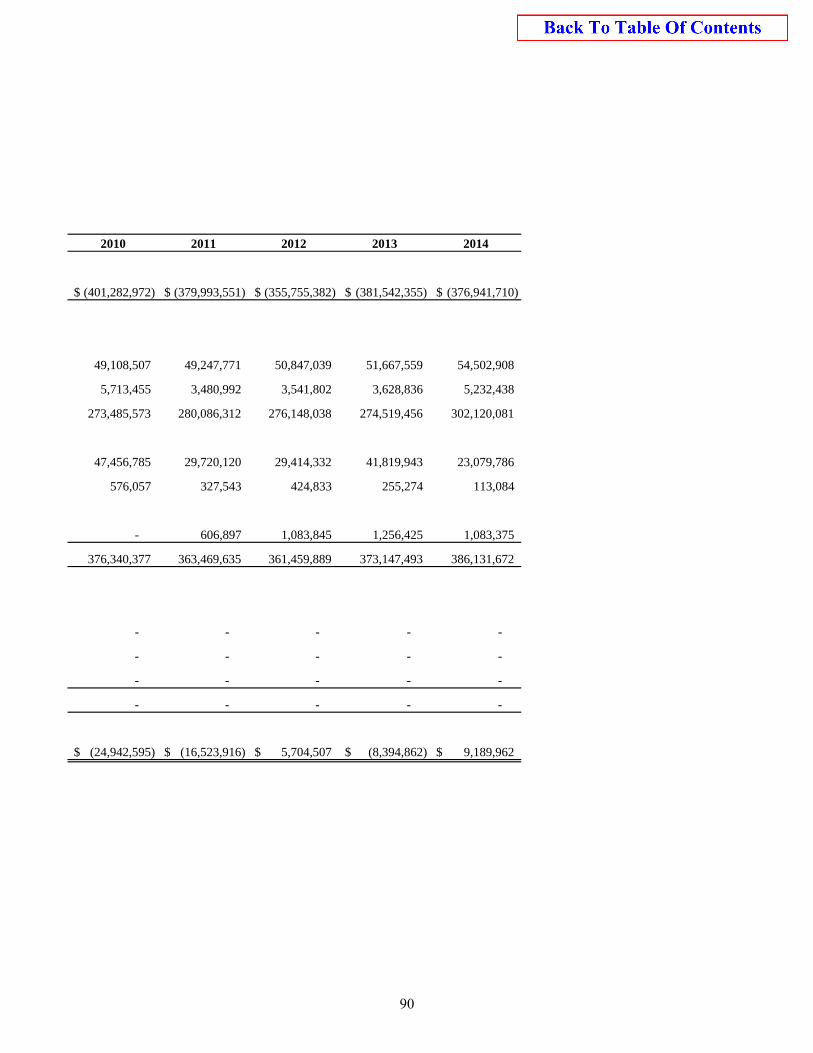
2010 2011 2012 2013 2014
(401,282,972)$ (379,993,551)$ (355,755,382)$ (381,542,355)$ (376,941,710)$
49,108,507 49,247,771 50,847,039 51,667,559 54,502,908
5,713,455 3,480,992 3,541,802 3,628,836 5,232,438
273,485,573 280,086,312 276,148,038 274,519,456 302,120,081
47,456,785 29,720,120 29,414,332 41,819,943 23,079,786
576,057 327,543 424,833 255,274 113,084
- 606,897 1,083,845 1,256,425 1,083,375
376,340,377 363,469,635 361,459,889 373,147,493 386,131,672
- - - - -
- - - - -
- - - - -
- - - - -
(24,942,595)$ (16,523,916)$ 5,704,507$ (8,394,862)$ 9,189,962$
90
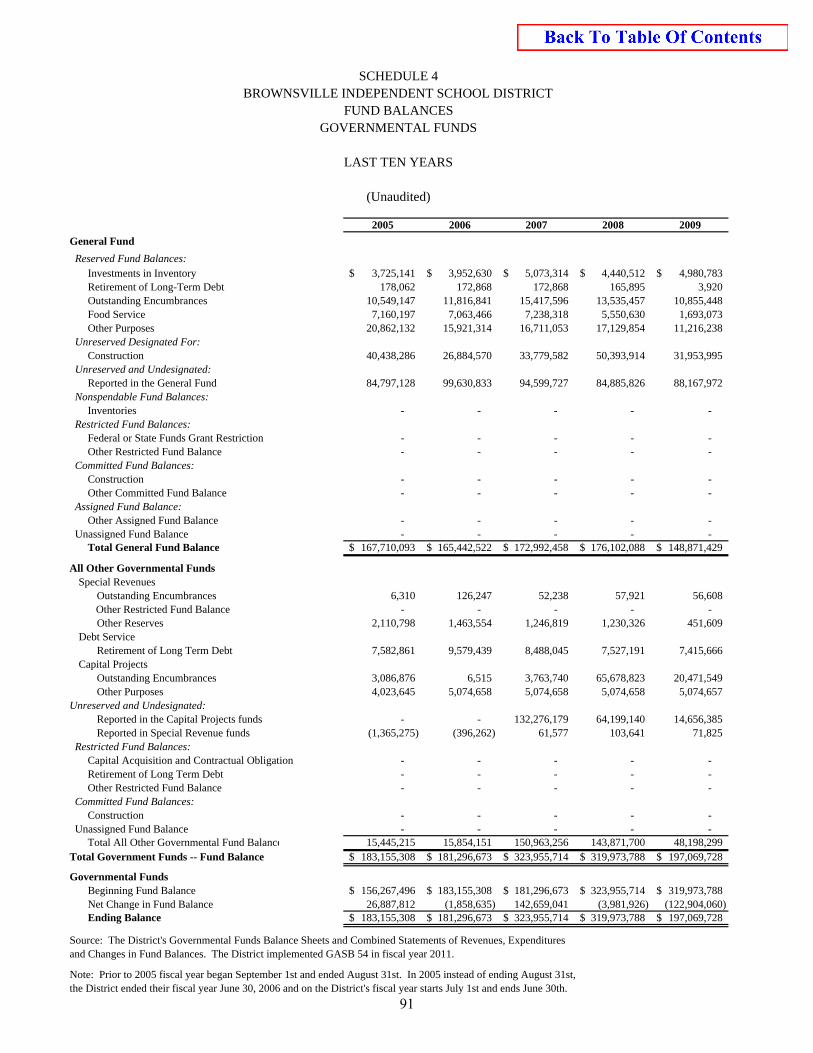
2005 2006 2007 2008 2009
General Fund
Reserved Fund Balances:Investments in Inventory 3,725,141$ 3,952,630$ 5,073,314$ 4,440,512$ 4,980,783$ Retirement of Long-Term Debt 178,062 172,868 172,868 165,895 3,920 Outstanding Encumbrances 10,549,147 11,816,841 15,417,596 13,535,457 10,855,448 Food Service 7,160,197 7,063,466 7,238,318 5,550,630 1,693,073 Other Purposes 20,862,132 15,921,314 16,711,053 17,129,854 11,216,238
Unreserved Designated For:Construction 40,438,286 26,884,570 33,779,582 50,393,914 31,953,995
Unreserved and Undesignated: Reported in the General Fund 84,797,128 99,630,833 94,599,727 84,885,826 88,167,972
Nonspendable Fund Balances:Inventories - - - - -
Restricted Fund Balances:Federal or State Funds Grant Restriction - - - - - Other Restricted Fund Balance - - - - -
Committed Fund Balances:Construction - - - - - Other Committed Fund Balance - - - - -
Assigned Fund Balance:Other Assigned Fund Balance - - - - -
Unassigned Fund Balance - - - - - Total General Fund Balance 167,710,093$ 165,442,522$ 172,992,458$ 176,102,088$ 148,871,429$
All Other Governmental FundsSpecial Revenues
Outstanding Encumbrances 6,310 126,247 52,238 57,921 56,608 Other Restricted Fund Balance - - - - -
Other Reserves 2,110,798 1,463,554 1,246,819 1,230,326 451,609 Debt Service
Retirement of Long Term Debt 7,582,861 9,579,439 8,488,045 7,527,191 7,415,666 Capital Projects
Outstanding Encumbrances 3,086,876 6,515 3,763,740 65,678,823 20,471,549 Other Purposes 4,023,645 5,074,658 5,074,658 5,074,658 5,074,657
Unreserved and Undesignated:Reported in the Capital Projects funds - - 132,276,179 64,199,140 14,656,385 Reported in Special Revenue funds (1,365,275) (396,262) 61,577 103,641 71,825
Restricted Fund Balances:Capital Acquisition and Contractual Obligation - - - - - Retirement of Long Term Debt - - - - - Other Restricted Fund Balance - - - - -
Committed Fund Balances:Construction - - - - -
Unassigned Fund Balance - - - - - Total All Other Governmental Fund Balance 15,445,215 15,854,151 150,963,256 143,871,700 48,198,299
Total Government Funds -- Fund Balance 183,155,308$ 181,296,673$ 323,955,714$ 319,973,788$ 197,069,728$
Governmental FundsBeginning Fund Balance 156,267,496$ 183,155,308$ 181,296,673$ 323,955,714$ 319,973,788$ Net Change in Fund Balance 26,887,812 (1,858,635) 142,659,041 (3,981,926) (122,904,060) Ending Balance 183,155,308$ 181,296,673$ 323,955,714$ 319,973,788$ 197,069,728$
Source: The District's Governmental Funds Balance Sheets and Combined Statements of Revenues, Expendituresand Changes in Fund Balances. The District implemented GASB 54 in fiscal year 2011.
Note: Prior to 2005 fiscal year began September 1st and ended August 31st. In 2005 instead of ending August 31st, the District ended their fiscal year June 30, 2006 and on the District's fiscal year starts July 1st and ends June 30th.
LAST TEN YEARS
(Unaudited)
SCHEDULE 4BROWNSVILLE INDEPENDENT SCHOOL DISTRICT
FUND BALANCESGOVERNMENTAL FUNDS
91
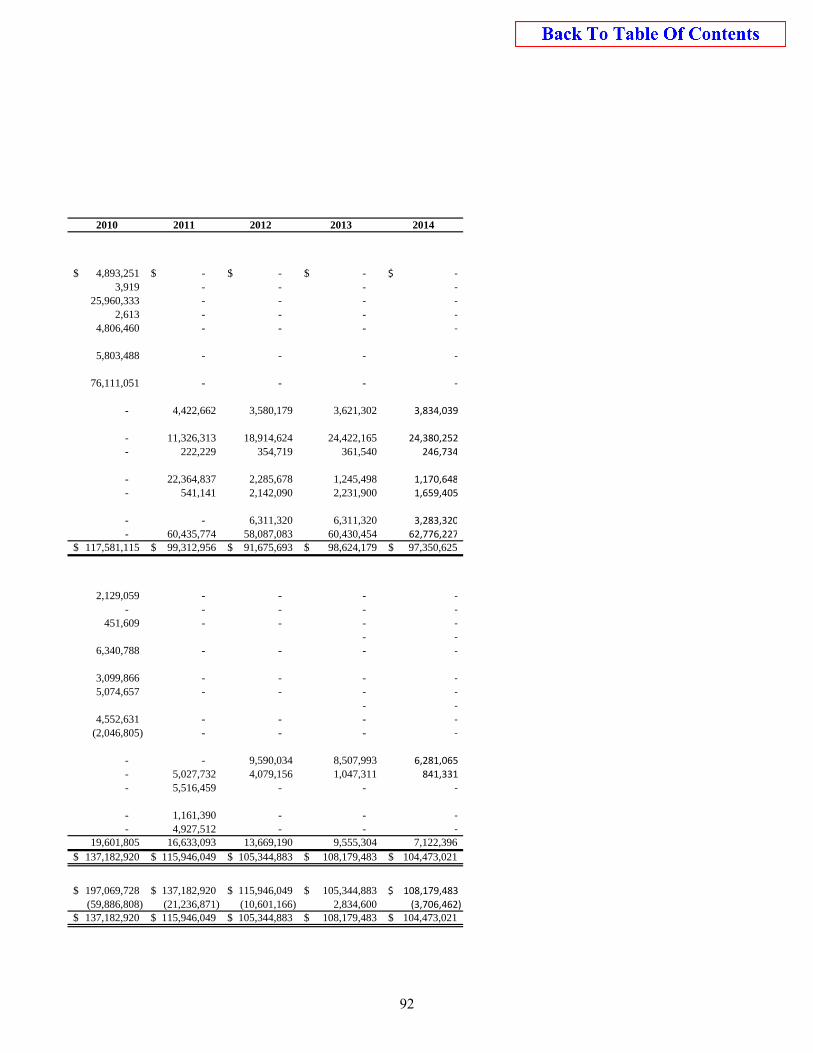
2010 2011 2012 2013 2014
4,893,251$ -$ -$ -$ ‐$
3,919 - - - ‐
25,960,333 - - - ‐
2,613 - - - ‐
4,806,460 - - - ‐
5,803,488 - - - ‐
76,111,051 - - - ‐
- 4,422,662 3,580,179 3,621,302 3,834,039
- 11,326,313 18,914,624 24,422,165 24,380,252
- 222,229 354,719 361,540 246,734
- 22,364,837 2,285,678 1,245,498 1,170,648
- 541,141 2,142,090 2,231,900 1,659,405
- - 6,311,320 6,311,320 3,283,320
- 60,435,774 58,087,083 60,430,454 62,776,227 117,581,115$ 99,312,956$ 91,675,693$ 98,624,179$ 97,350,625$
2,129,059 - - - ‐
- - - - ‐
451,609 - - - ‐
- ‐
6,340,788 - - - ‐
3,099,866 - - - ‐
5,074,657 - - - ‐
- ‐
4,552,631 - - - ‐
(2,046,805) - - - ‐
- - 9,590,034 8,507,993 6,281,065
- 5,027,732 4,079,156 1,047,311 841,331
- 5,516,459 - - ‐
- 1,161,390 - - ‐
- 4,927,512 - - ‐ 19,601,805 16,633,093 13,669,190 9,555,304 7,122,396
137,182,920$ 115,946,049$ 105,344,883$ 108,179,483$ 104,473,021$
197,069,728$ 137,182,920$ 115,946,049$ 105,344,883$ 108,179,483$
(59,886,808) (21,236,871) (10,601,166) 2,834,600 (3,706,462) 137,182,920$ 115,946,049$ 105,344,883$ 108,179,483$ 104,473,021$
92
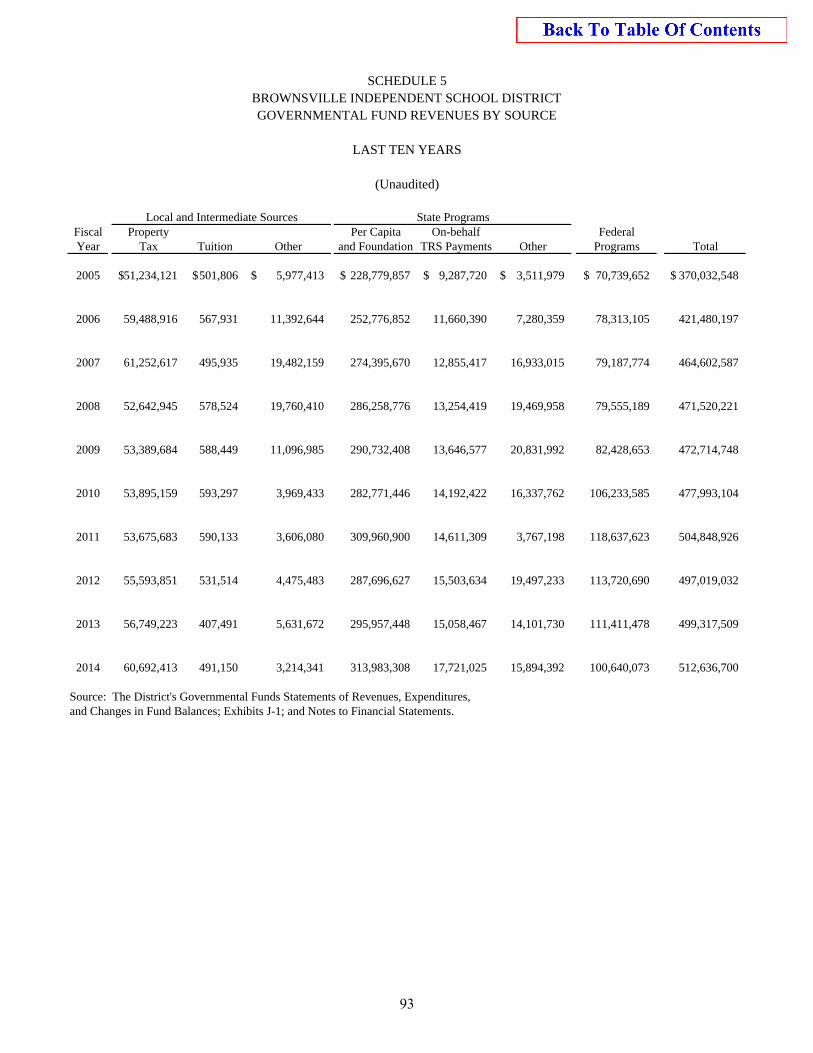
Fiscal Property Per Capita On-behalf FederalYear Tax Tuition Other and Foundation TRS Payments Other Programs Total
2005 51,234,121$ 501,806$ 5,977,413$ 228,779,857$ 9,287,720$ 3,511,979$ 70,739,652$ 370,032,548$
2006 59,488,916 567,931 11,392,644 252,776,852 11,660,390 7,280,359 78,313,105 421,480,197
2007 61,252,617 495,935 19,482,159 274,395,670 12,855,417 16,933,015 79,187,774 464,602,587
2008 52,642,945 578,524 19,760,410 286,258,776 13,254,419 19,469,958 79,555,189 471,520,221
2009 53,389,684 588,449 11,096,985 290,732,408 13,646,577 20,831,992 82,428,653 472,714,748
2010 53,895,159 593,297 3,969,433 282,771,446 14,192,422 16,337,762 106,233,585 477,993,104
2011 53,675,683 590,133 3,606,080 309,960,900 14,611,309 3,767,198 118,637,623 504,848,926
2012 55,593,851 531,514 4,475,483 287,696,627 15,503,634 19,497,233 113,720,690 497,019,032
2013 56,749,223 407,491 5,631,672 295,957,448 15,058,467 14,101,730 111,411,478 499,317,509
2014 60,692,413 491,150 3,214,341 313,983,308 17,721,025 15,894,392 100,640,073 512,636,700
Source: The District's Governmental Funds Statements of Revenues, Expenditures, and Changes in Fund Balances; Exhibits J-1; and Notes to Financial Statements.
SCHEDULE 5
Local and Intermediate Sources State Programs
BROWNSVILLE INDEPENDENT SCHOOL DISTRICTGOVERNMENTAL FUND REVENUES BY SOURCE
LAST TEN YEARS
(Unaudited)
93
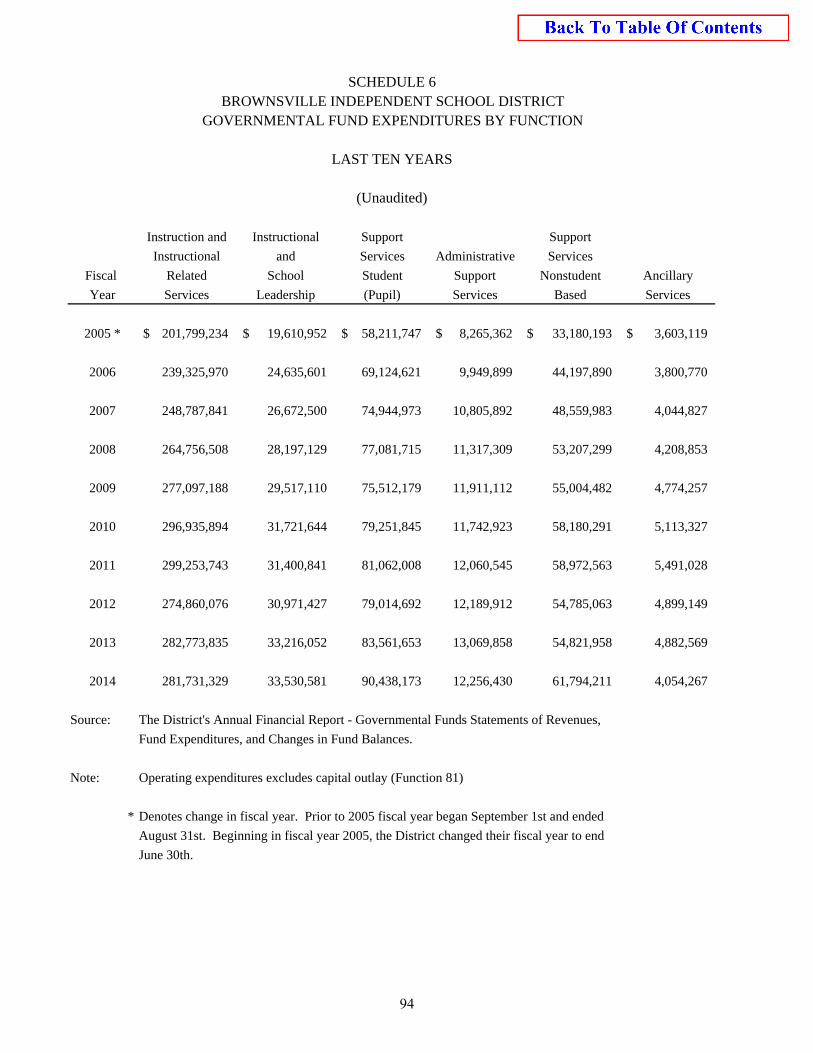
Instruction and Instructional Support Support
Instructional and Services Administrative Services
Fiscal Related School Student Support Nonstudent Ancillary
Year Services Leadership (Pupil) Services Based Services
2005 * 201,799,234$ 19,610,952$ 58,211,747$ 8,265,362$ 33,180,193$ 3,603,119$
2006 239,325,970 24,635,601 69,124,621 9,949,899 44,197,890 3,800,770
2007 248,787,841 26,672,500 74,944,973 10,805,892 48,559,983 4,044,827
2008 264,756,508 28,197,129 77,081,715 11,317,309 53,207,299 4,208,853
2009 277,097,188 29,517,110 75,512,179 11,911,112 55,004,482 4,774,257
2010 296,935,894 31,721,644 79,251,845 11,742,923 58,180,291 5,113,327
2011 299,253,743 31,400,841 81,062,008 12,060,545 58,972,563 5,491,028
2012 274,860,076 30,971,427 79,014,692 12,189,912 54,785,063 4,899,149
2013 282,773,835 33,216,052 83,561,653 13,069,858 54,821,958 4,882,569
2014 281,731,329 33,530,581 90,438,173 12,256,430 61,794,211 4,054,267
Source: The District's Annual Financial Report - Governmental Funds Statements of Revenues,
Fund Expenditures, and Changes in Fund Balances.
Note: Operating expenditures excludes capital outlay (Function 81)
* Denotes change in fiscal year. Prior to 2005 fiscal year began September 1st and ended
August 31st. Beginning in fiscal year 2005, the District changed their fiscal year to end
June 30th.
BROWNSVILLE INDEPENDENT SCHOOL DISTRICTGOVERNMENTAL FUND EXPENDITURES BY FUNCTION
LAST TEN YEARS
(Unaudited)
SCHEDULE 6
94
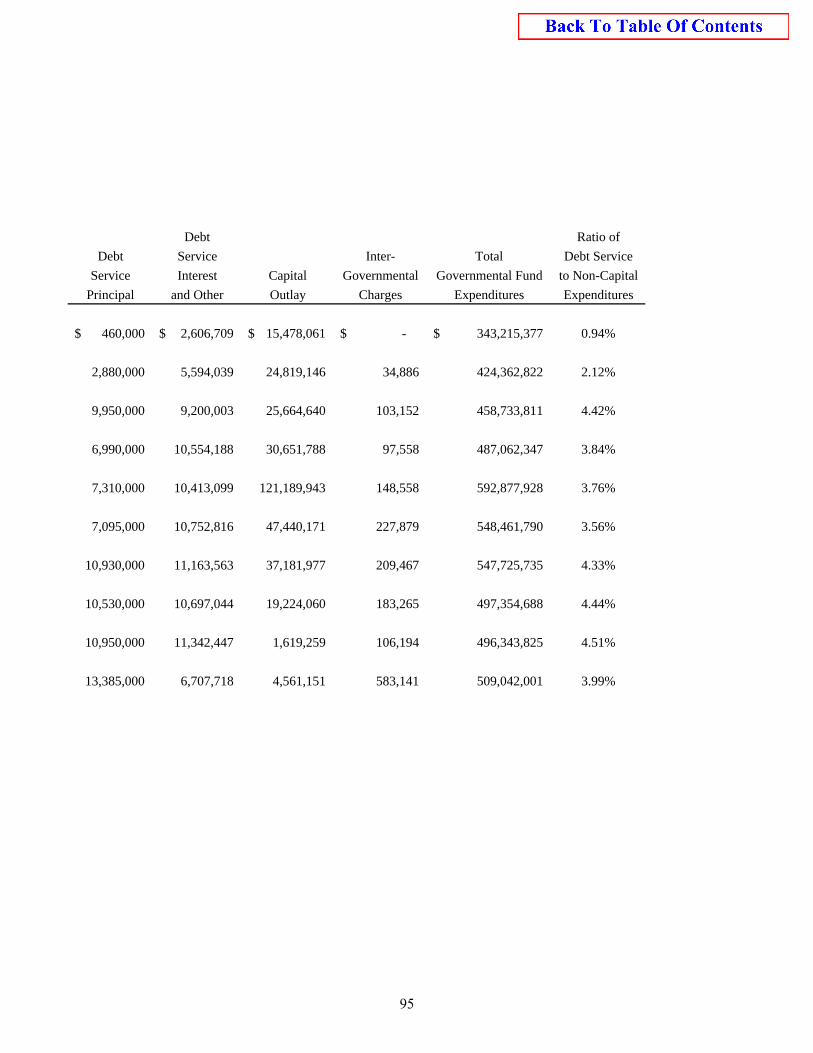
Debt Ratio of
Debt Service Inter- Total Debt Service
Service Interest Capital Governmental Governmental Fund to Non-Capital
Principal and Other Outlay Charges Expenditures Expenditures
460,000$ 2,606,709$ 15,478,061$ -$ 343,215,377$ 0.94%
2,880,000 5,594,039 24,819,146 34,886 424,362,822 2.12%
9,950,000 9,200,003 25,664,640 103,152 458,733,811 4.42%
6,990,000 10,554,188 30,651,788 97,558 487,062,347 3.84%
7,310,000 10,413,099 121,189,943 148,558 592,877,928 3.76%
7,095,000 10,752,816 47,440,171 227,879 548,461,790 3.56%
10,930,000 11,163,563 37,181,977 209,467 547,725,735 4.33%
10,530,000 10,697,044 19,224,060 183,265 497,354,688 4.44%
10,950,000 11,342,447 1,619,259 106,194 496,343,825 4.51%
13,385,000 6,707,718 4,561,151 583,141 509,042,001 3.99%
95
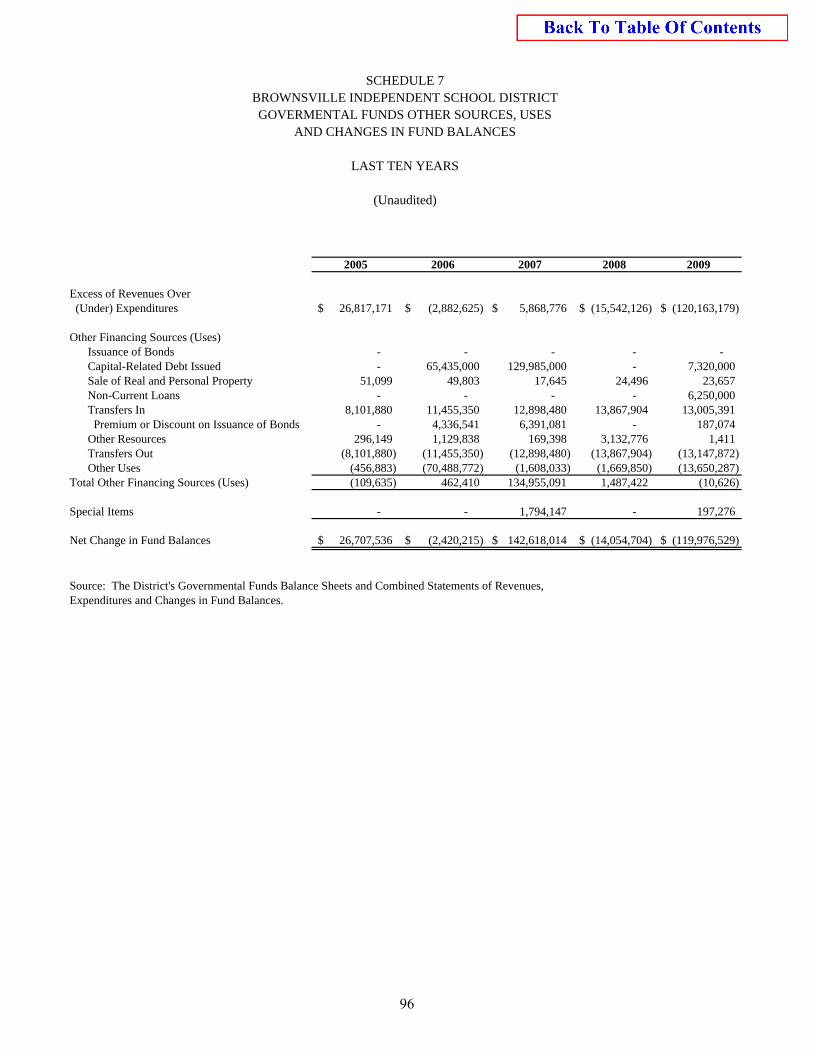
2005 2006 2007 2008 2009
Excess of Revenues Over (Under) Expenditures 26,817,171$ (2,882,625)$ 5,868,776$ (15,542,126)$ (120,163,179)$
Other Financing Sources (Uses)Issuance of Bonds - - - - - Capital-Related Debt Issued - 65,435,000 129,985,000 - 7,320,000 Sale of Real and Personal Property 51,099 49,803 17,645 24,496 23,657 Non-Current Loans - - - - 6,250,000 Transfers In 8,101,880 11,455,350 12,898,480 13,867,904 13,005,391 Premium or Discount on Issuance of Bonds - 4,336,541 6,391,081 - 187,074 Other Resources 296,149 1,129,838 169,398 3,132,776 1,411 Transfers Out (8,101,880) (11,455,350) (12,898,480) (13,867,904) (13,147,872) Other Uses (456,883) (70,488,772) (1,608,033) (1,669,850) (13,650,287)
Total Other Financing Sources (Uses) (109,635) 462,410 134,955,091 1,487,422 (10,626)
Special Items - - 1,794,147 - 197,276
Net Change in Fund Balances 26,707,536$ (2,420,215)$ 142,618,014$ (14,054,704)$ (119,976,529)$
Source: The District's Governmental Funds Balance Sheets and Combined Statements of Revenues, Expenditures and Changes in Fund Balances.
(Unaudited)
SCHEDULE 7BROWNSVILLE INDEPENDENT SCHOOL DISTRICTGOVERMENTAL FUNDS OTHER SOURCES, USES
AND CHANGES IN FUND BALANCES
LAST TEN YEARS
96
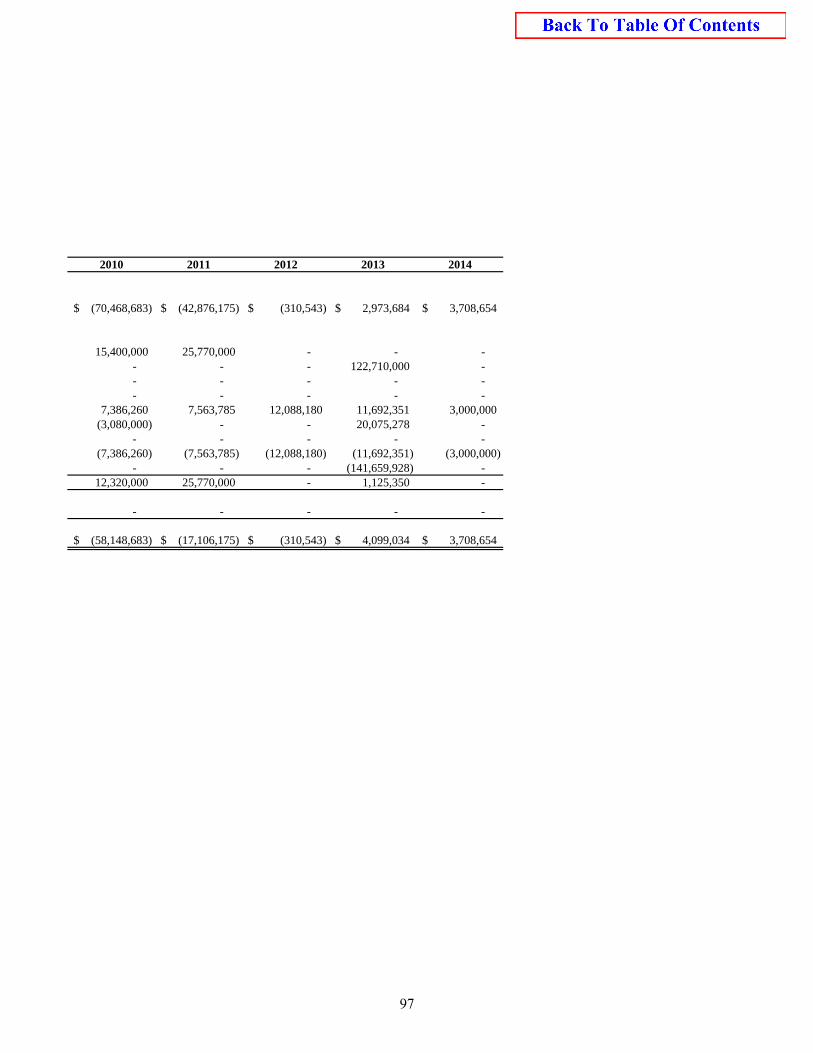
2010 2011 2012 2013 2014
(70,468,683)$ (42,876,175)$ (310,543)$ 2,973,684$ 3,708,654$
15,400,000 25,770,000 - - - - - - 122,710,000 - - - - - - - - - - -
7,386,260 7,563,785 12,088,180 11,692,351 3,000,000 (3,080,000) - - 20,075,278 -
- - - - - (7,386,260) (7,563,785) (12,088,180) (11,692,351) (3,000,000)
- - - (141,659,928) - 12,320,000 25,770,000 - 1,125,350 -
- - - - -
(58,148,683)$ (17,106,175)$ (310,543)$ 4,099,034$ 3,708,654$
97
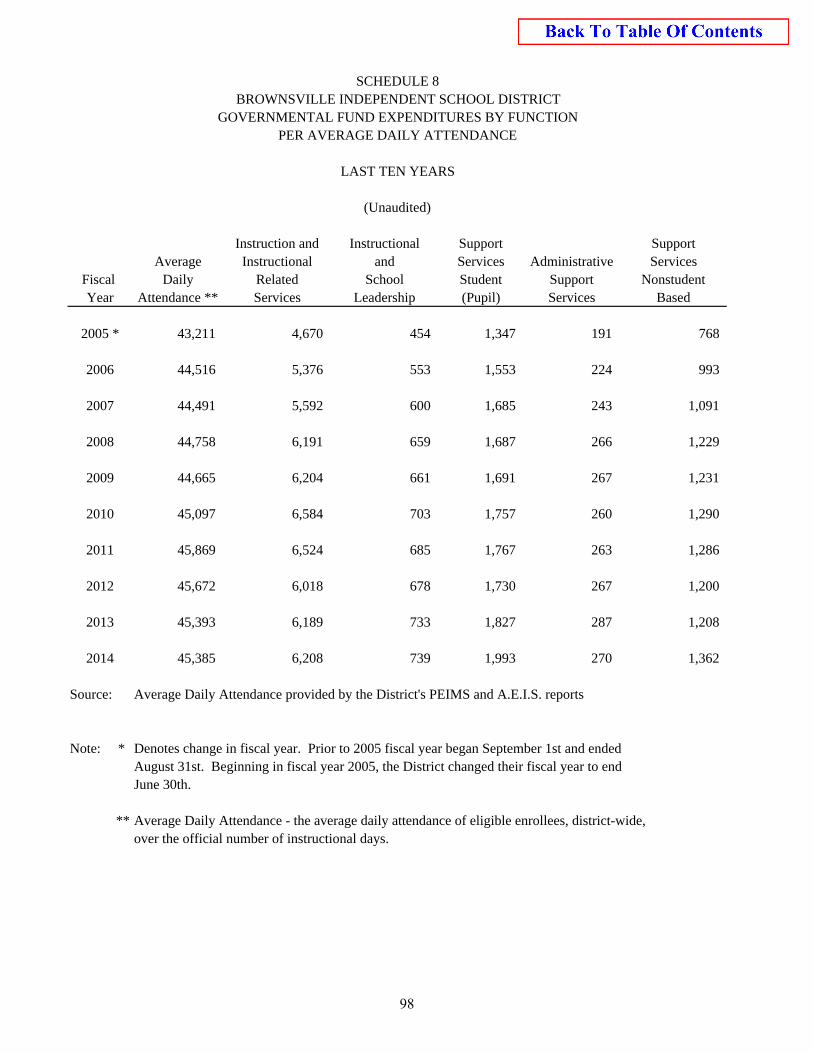
Instruction and Instructional Support SupportAverage Instructional and Services Administrative Services
Fiscal Daily Related School Student Support NonstudentYear Attendance ** Services Leadership (Pupil) Services Based
2005 * 43,211 4,670 454 1,347 191 768
2006 44,516 5,376 553 1,553 224 993
2007 44,491 5,592 600 1,685 243 1,091
2008 44,758 6,191 659 1,687 266 1,229
2009 44,665 6,204 661 1,691 267 1,231
2010 45,097 6,584 703 1,757 260 1,290
2011 45,869 6,524 685 1,767 263 1,286
2012 45,672 6,018 678 1,730 267 1,200
2013 45,393 6,189 733 1,827 287 1,208
2014 45,385 6,208 739 1,993 270 1,362
Source: Average Daily Attendance provided by the District's PEIMS and A.E.I.S. reports
Note: * Denotes change in fiscal year. Prior to 2005 fiscal year began September 1st and endedAugust 31st. Beginning in fiscal year 2005, the District changed their fiscal year to endJune 30th.
** Average Daily Attendance - the average daily attendance of eligible enrollees, district-wide,over the official number of instructional days.
SCHEDULE 8BROWNSVILLE INDEPENDENT SCHOOL DISTRICT
(Unaudited)
GOVERNMENTAL FUND EXPENDITURES BY FUNCTIONPER AVERAGE DAILY ATTENDANCE
LAST TEN YEARS
98
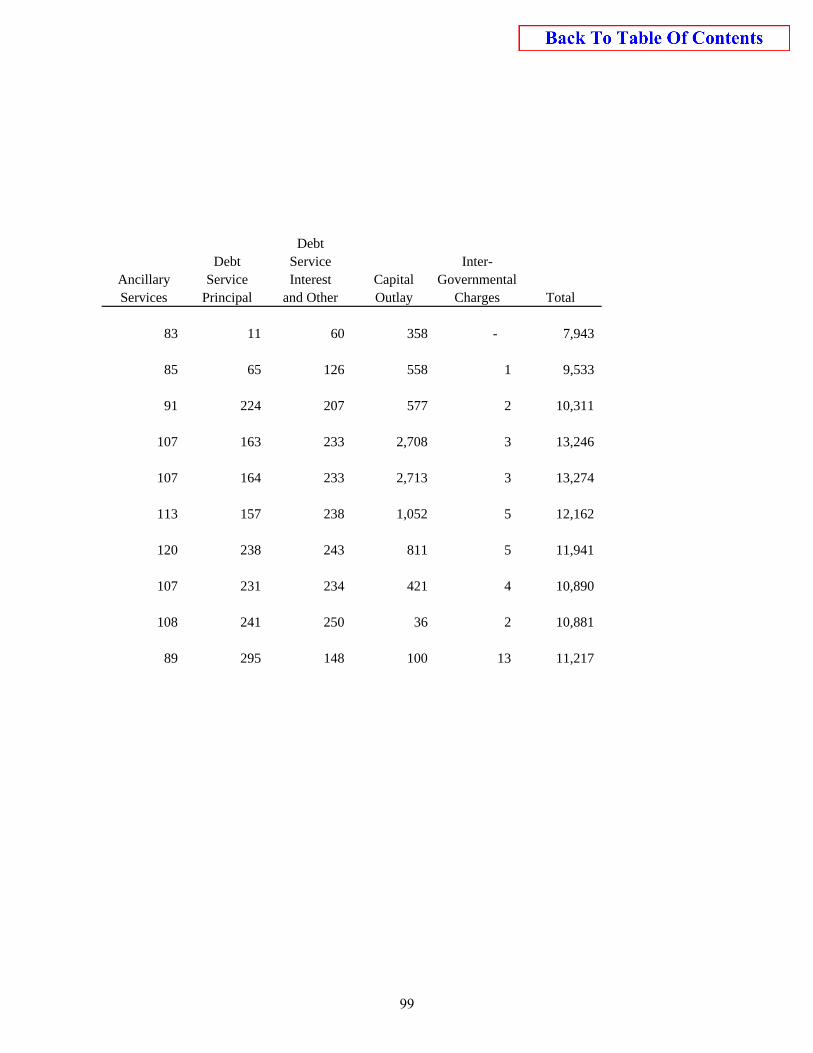
DebtDebt Service Inter-
Ancillary Service Interest Capital GovernmentalServices Principal and Other Outlay Charges Total
83 11 60 358 - 7,943
85 65 126 558 1 9,533
91 224 207 577 2 10,311
107 163 233 2,708 3 13,246
107 164 233 2,713 3 13,274
113 157 238 1,052 5 12,162
120 238 243 811 5 11,941
107 231 234 421 4 10,890
108 241 250 36 2 10,881
89 295 148 100 13 11,217
99
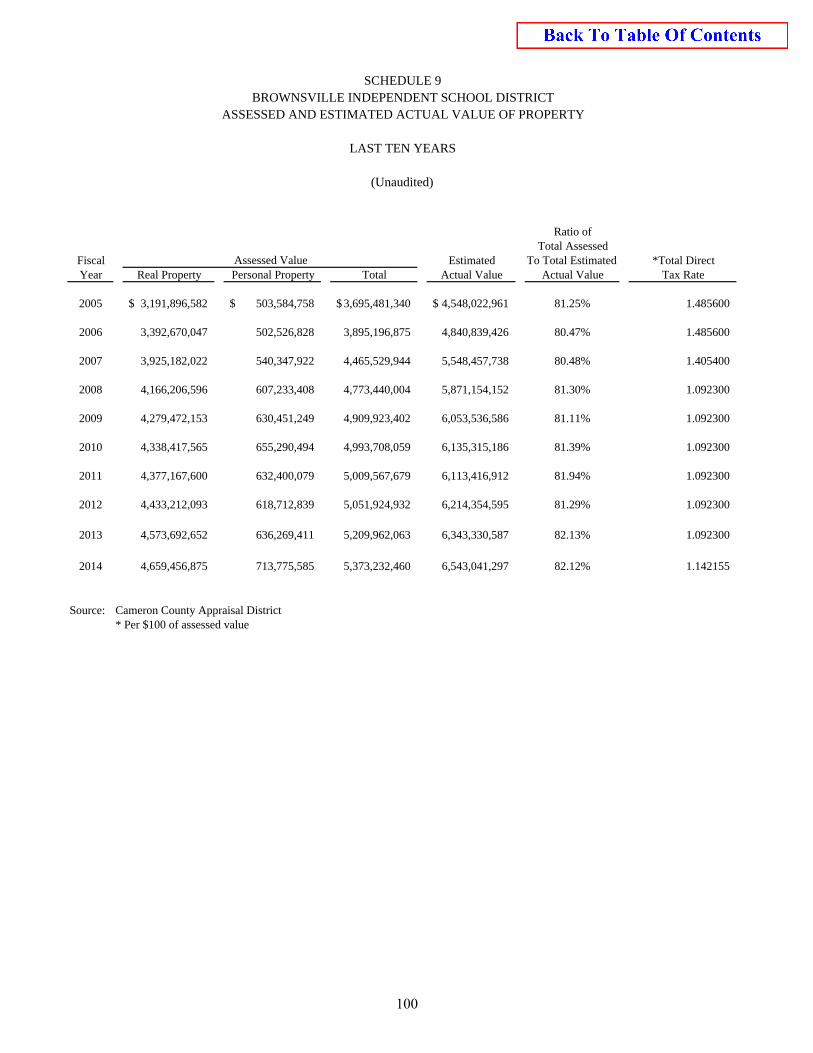
Ratio ofTotal Assessed
Fiscal Estimated To Total Estimated *Total DirectYear Real Property Personal Property Total Actual Value Actual Value Tax Rate
2005 3,191,896,582$ 503,584,758$ 3,695,481,340$ 4,548,022,961$ 81.25% 1.485600
2006 3,392,670,047 502,526,828 3,895,196,875 4,840,839,426 80.47% 1.485600
2007 3,925,182,022 540,347,922 4,465,529,944 5,548,457,738 80.48% 1.405400
2008 4,166,206,596 607,233,408 4,773,440,004 5,871,154,152 81.30% 1.092300
2009 4,279,472,153 630,451,249 4,909,923,402 6,053,536,586 81.11% 1.092300
2010 4,338,417,565 655,290,494 4,993,708,059 6,135,315,186 81.39% 1.092300
2011 4,377,167,600 632,400,079 5,009,567,679 6,113,416,912 81.94% 1.092300
2012 4,433,212,093 618,712,839 5,051,924,932 6,214,354,595 81.29% 1.092300
2013 4,573,692,652 636,269,411 5,209,962,063 6,343,330,587 82.13% 1.092300
2014 4,659,456,875 713,775,585 5,373,232,460 6,543,041,297 82.12% 1.142155
Source: Cameron County Appraisal District* Per $100 of assessed value
SCHEDULE 9
Assessed Value
BROWNSVILLE INDEPENDENT SCHOOL DISTRICTASSESSED AND ESTIMATED ACTUAL VALUE OF PROPERTY
LAST TEN YEARS
(Unaudited)
100
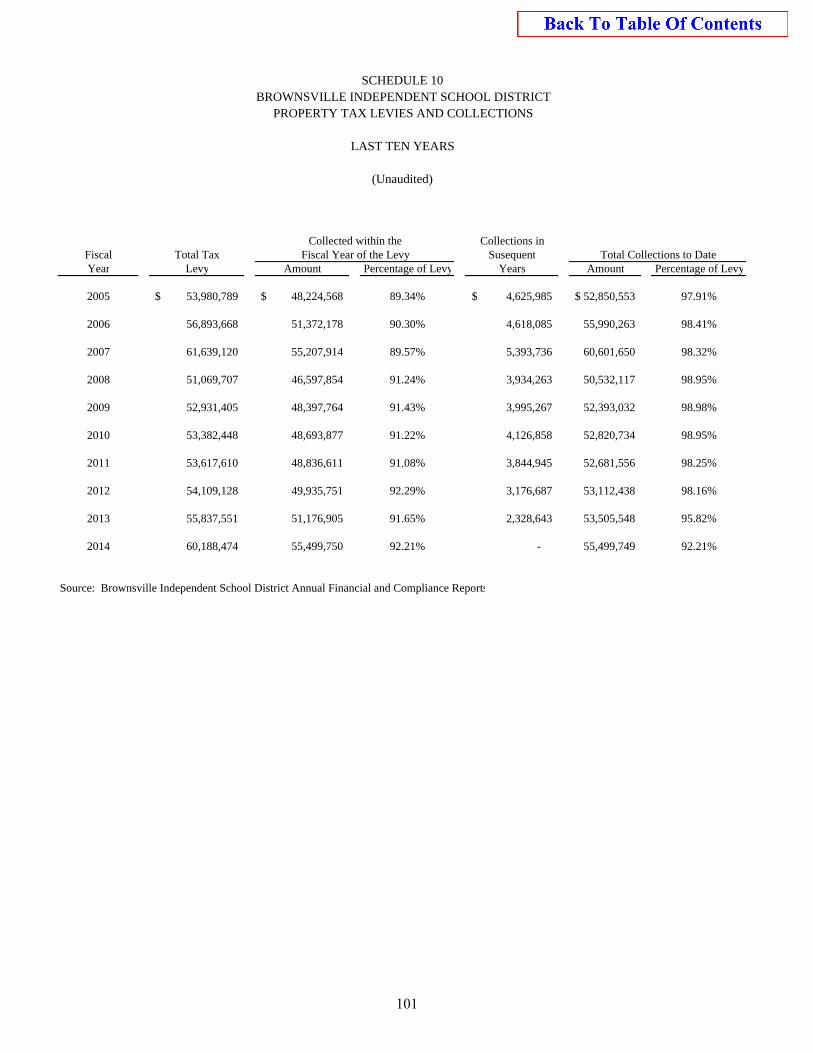
Collections in Fiscal Total Tax SusequentYear Levy Amount Percentage of Levy Years Amount Percentage of Levy
2005 53,980,789$ 48,224,568$ 89.34% 4,625,985$ 52,850,553$ 97.91%
2006 56,893,668 51,372,178 90.30% 4,618,085 55,990,263 98.41%
2007 61,639,120 55,207,914 89.57% 5,393,736 60,601,650 98.32%
2008 51,069,707 46,597,854 91.24% 3,934,263 50,532,117 98.95%
2009 52,931,405 48,397,764 91.43% 3,995,267 52,393,032 98.98%
2010 53,382,448 48,693,877 91.22% 4,126,858 52,820,734 98.95%
2011 53,617,610 48,836,611 91.08% 3,844,945 52,681,556 98.25%
2012 54,109,128 49,935,751 92.29% 3,176,687 53,112,438 98.16%
2013 55,837,551 51,176,905 91.65% 2,328,643 53,505,548 95.82%
2014 60,188,474 55,499,750 92.21% - 55,499,749 92.21%
Source: Brownsville Independent School District Annual Financial and Compliance Reports
SCHEDULE 10BROWNSVILLE INDEPENDENT SCHOOL DISTRICT
PROPERTY TAX LEVIES AND COLLECTIONS
LAST TEN YEARS
(Unaudited)
Fiscal Year of the Levy
Collected within the
Total Collections to Date
101
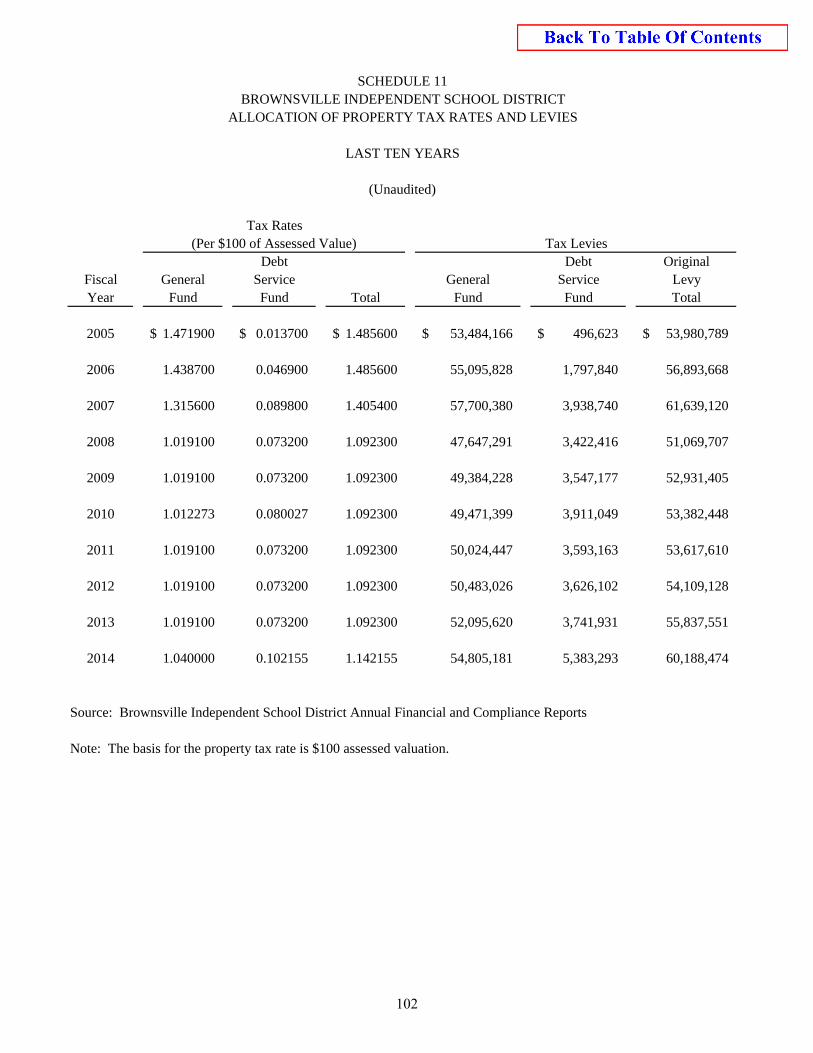
Debt Debt OriginalFiscal General Service General Service LevyYear Fund Fund Total Fund Fund Total
2005 1.471900$ 0.013700$ 1.485600$ 53,484,166$ 496,623$ 53,980,789$
2006 1.438700 0.046900 1.485600 55,095,828 1,797,840 56,893,668
2007 1.315600 0.089800 1.405400 57,700,380 3,938,740 61,639,120
2008 1.019100 0.073200 1.092300 47,647,291 3,422,416 51,069,707
2009 1.019100 0.073200 1.092300 49,384,228 3,547,177 52,931,405
2010 1.012273 0.080027 1.092300 49,471,399 3,911,049 53,382,448
2011 1.019100 0.073200 1.092300 50,024,447 3,593,163 53,617,610
2012 1.019100 0.073200 1.092300 50,483,026 3,626,102 54,109,128
2013 1.019100 0.073200 1.092300 52,095,620 3,741,931 55,837,551
2014 1.040000 0.102155 1.142155 54,805,181 5,383,293 60,188,474
Source: Brownsville Independent School District Annual Financial and Compliance Reports
Note: The basis for the property tax rate is $100 assessed valuation.
Tax Rates(Per $100 of Assessed Value) Tax Levies
(Unaudited)
SCHEDULE 11BROWNSVILLE INDEPENDENT SCHOOL DISTRICT
ALLOCATION OF PROPERTY TAX RATES AND LEVIES
LAST TEN YEARS
102
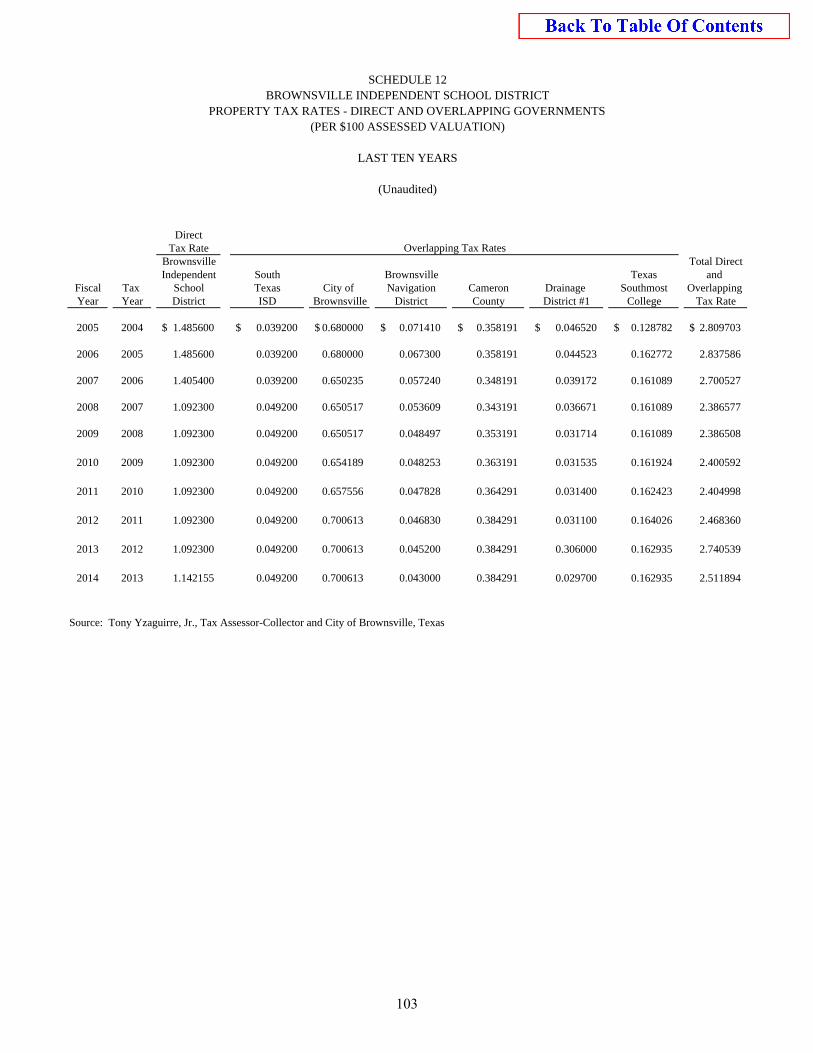
DirectTax Rate
Brownsville Total DirectIndependent South Brownsville Texas and
Fiscal Tax School Texas City of Navigation Cameron Drainage Southmost Overlapping Year Year District ISD Brownsville District County District #1 College Tax Rate
2005 2004 1.485600$ 0.039200$ 0.680000$ 0.071410$ 0.358191$ 0.046520$ 0.128782$ 2.809703$
2006 2005 1.485600 0.039200 0.680000 0.067300 0.358191 0.044523 0.162772 2.837586
2007 2006 1.405400 0.039200 0.650235 0.057240 0.348191 0.039172 0.161089 2.700527
2008 2007 1.092300 0.049200 0.650517 0.053609 0.343191 0.036671 0.161089 2.386577
2009 2008 1.092300 0.049200 0.650517 0.048497 0.353191 0.031714 0.161089 2.386508
2010 2009 1.092300 0.049200 0.654189 0.048253 0.363191 0.031535 0.161924 2.400592
2011 2010 1.092300 0.049200 0.657556 0.047828 0.364291 0.031400 0.162423 2.404998
2012 2011 1.092300 0.049200 0.700613 0.046830 0.384291 0.031100 0.164026 2.468360
2013 2012 1.092300 0.049200 0.700613 0.045200 0.384291 0.306000 0.162935 2.740539
2014 2013 1.142155 0.049200 0.700613 0.043000 0.384291 0.029700 0.162935 2.511894
Source: Tony Yzaguirre, Jr., Tax Assessor-Collector and City of Brownsville, Texas
Overlapping Tax Rates
SCHEDULE 12BROWNSVILLE INDEPENDENT SCHOOL DISTRICT
PROPERTY TAX RATES - DIRECT AND OVERLAPPING GOVERNMENTS(PER $100 ASSESSED VALUATION)
LAST TEN YEARS
(Unaudited)
103
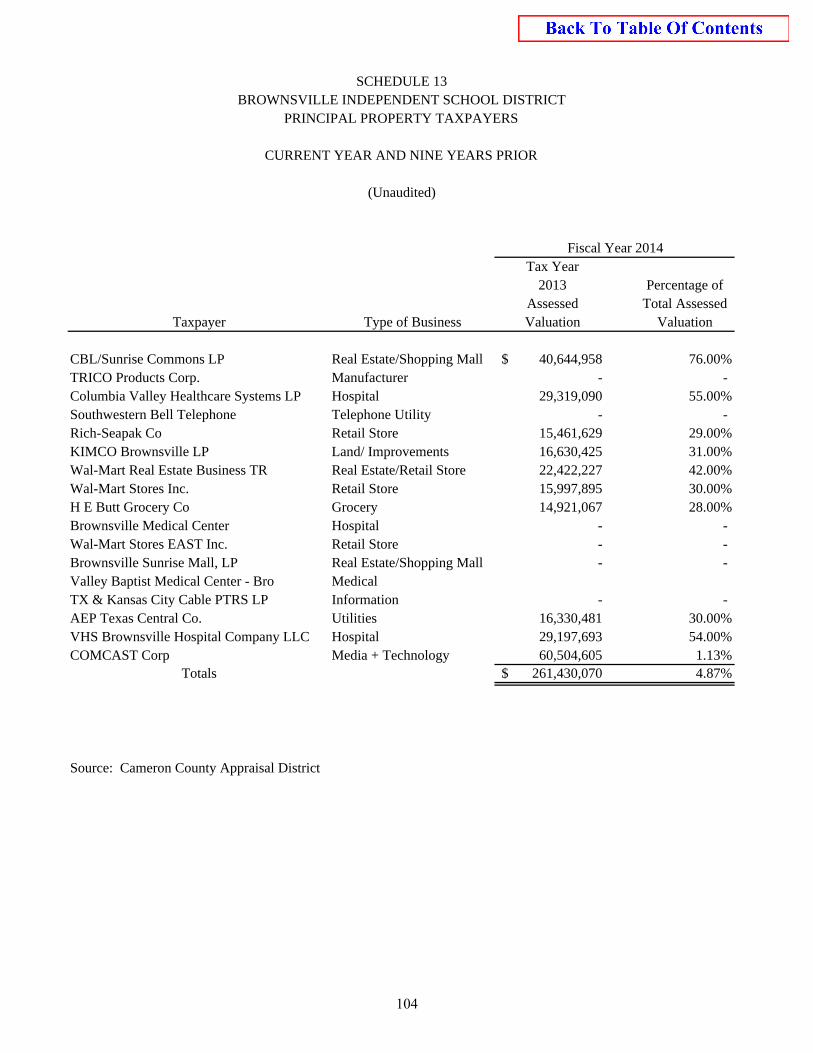
Tax Year2013 Percentage of
Assessed Total AssessedTaxpayer Type of Business Valuation Valuation
CBL/Sunrise Commons LP Real Estate/Shopping Mall 40,644,958$ 76.00%TRICO Products Corp. Manufacturer - - Columbia Valley Healthcare Systems LP Hospital 29,319,090 55.00%Southwestern Bell Telephone Telephone Utility - - Rich-Seapak Co Retail Store 15,461,629 29.00%KIMCO Brownsville LP Land/ Improvements 16,630,425 31.00%Wal-Mart Real Estate Business TR Real Estate/Retail Store 22,422,227 42.00%Wal-Mart Stores Inc. Retail Store 15,997,895 30.00%H E Butt Grocery Co Grocery 14,921,067 28.00%Brownsville Medical Center Hospital - - Wal-Mart Stores EAST Inc. Retail Store - - Brownsville Sunrise Mall, LP Real Estate/Shopping Mall - - Valley Baptist Medical Center - Bro MedicalTX & Kansas City Cable PTRS LP Information - - AEP Texas Central Co. Utilities 16,330,481 30.00%VHS Brownsville Hospital Company LLC Hospital 29,197,693 54.00%COMCAST Corp Media + Technology 60,504,605 1.13%
Totals 261,430,070$ 4.87%
Source: Cameron County Appraisal District
SCHEDULE 13BROWNSVILLE INDEPENDENT SCHOOL DISTRICT
PRINCIPAL PROPERTY TAXPAYERS
CURRENT YEAR AND NINE YEARS PRIOR
Fiscal Year 2014
(Unaudited)
104
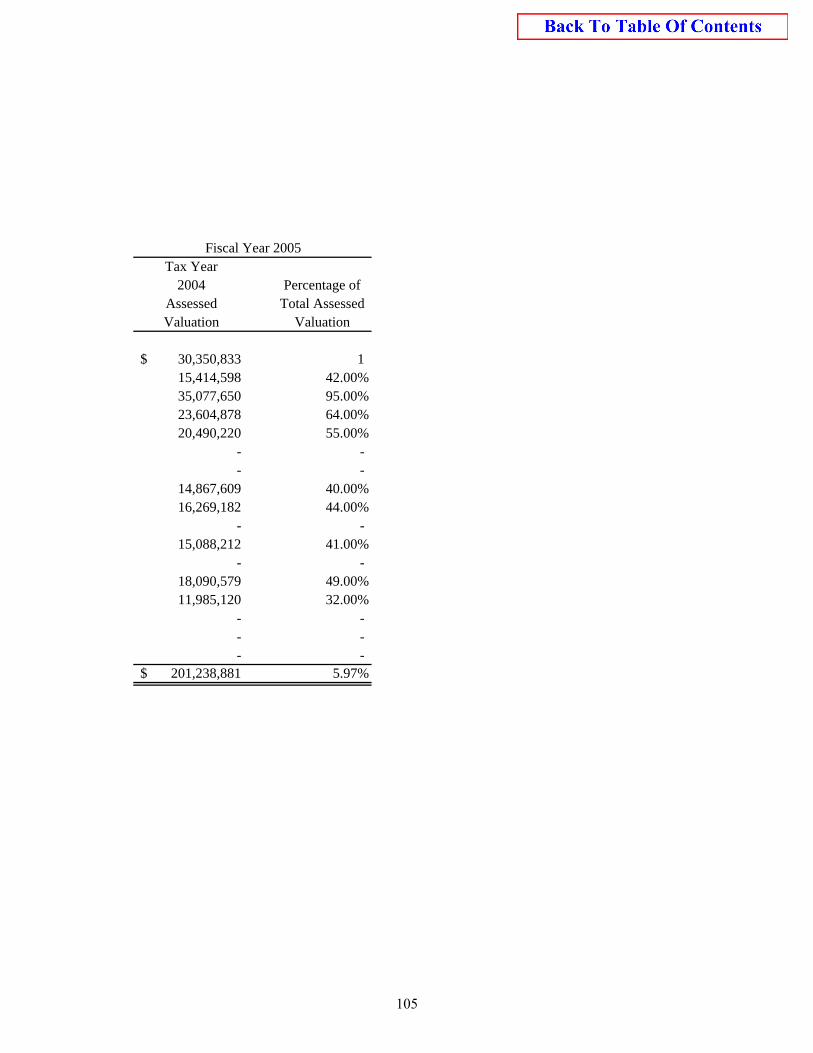
Tax Year2004 Percentage of
Assessed Total AssessedValuation Valuation
30,350,833$ 1 15,414,598 42.00%35,077,650 95.00%23,604,878 64.00%20,490,220 55.00%
- - - -
14,867,609 40.00%16,269,182 44.00%
- - 15,088,212 41.00%
- - 18,090,579 49.00%11,985,120 32.00%
- - - - - -
201,238,881$ 5.97%
Fiscal Year 2005
105
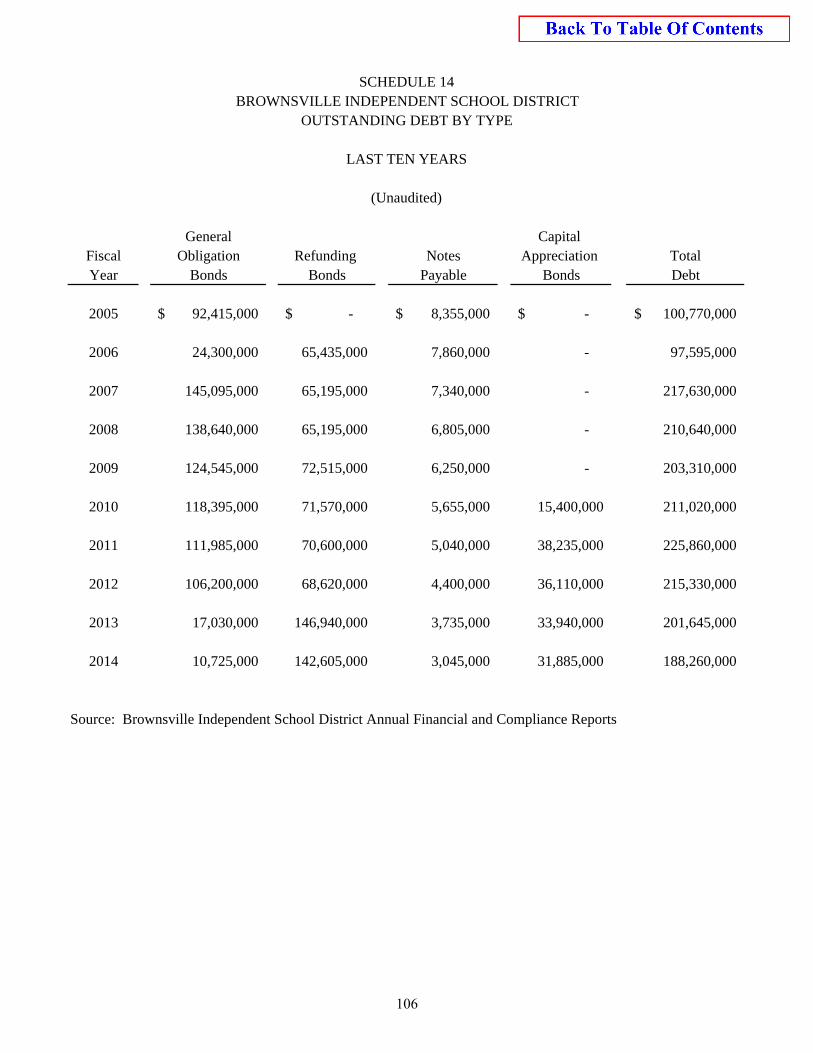
General Capital Fiscal Obligation Refunding Notes Appreciation TotalYear Bonds Bonds Payable Bonds Debt
2005 92,415,000$ -$ 8,355,000$ -$ 100,770,000$
2006 24,300,000 65,435,000 7,860,000 - 97,595,000
2007 145,095,000 65,195,000 7,340,000 - 217,630,000
2008 138,640,000 65,195,000 6,805,000 - 210,640,000
2009 124,545,000 72,515,000 6,250,000 - 203,310,000
2010 118,395,000 71,570,000 5,655,000 15,400,000 211,020,000
2011 111,985,000 70,600,000 5,040,000 38,235,000 225,860,000
2012 106,200,000 68,620,000 4,400,000 36,110,000 215,330,000
2013 17,030,000 146,940,000 3,735,000 33,940,000 201,645,000
2014 10,725,000 142,605,000 3,045,000 31,885,000 188,260,000
Source: Brownsville Independent School District Annual Financial and Compliance Reports
SCHEDULE 14BROWNSVILLE INDEPENDENT SCHOOL DISTRICT
OUTSTANDING DEBT BY TYPE
LAST TEN YEARS
(Unaudited)
106
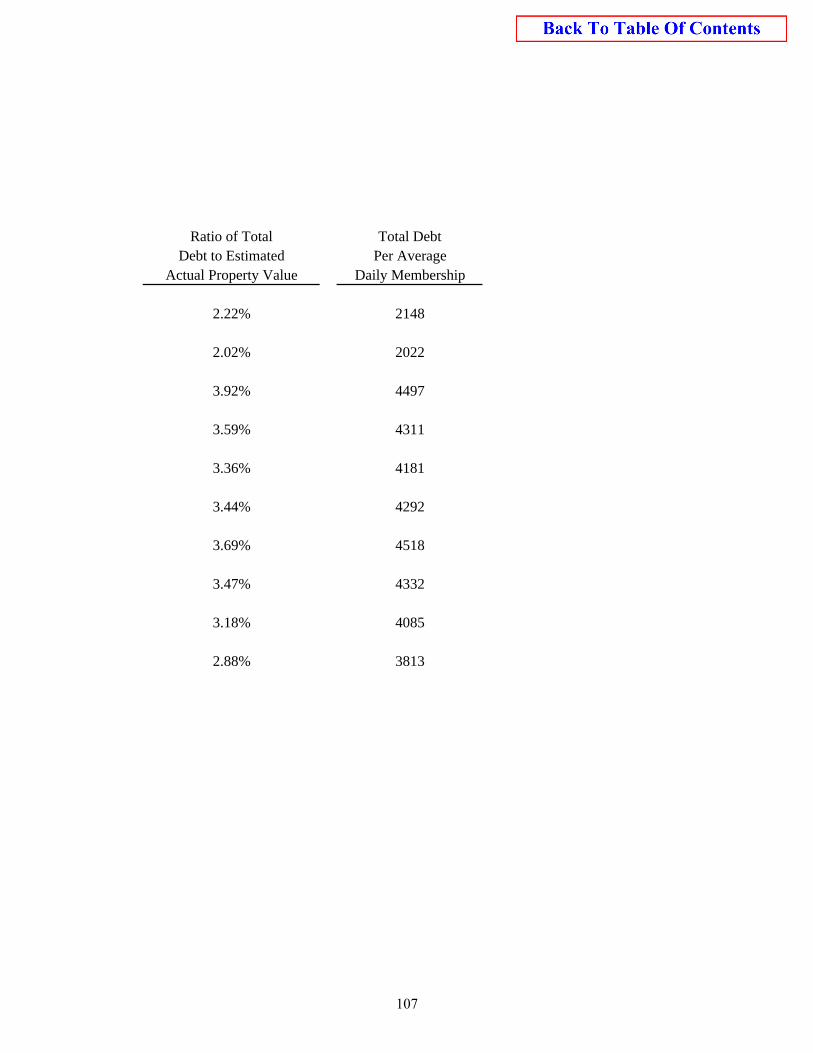
Ratio of Total Total DebtDebt to Estimated Per Average
Actual Property Value Daily Membership
2.22% 2148
2.02% 2022
3.92% 4497
3.59% 4311
3.36% 4181
3.44% 4292
3.69% 4518
3.47% 4332
3.18% 4085
2.88% 3813
107
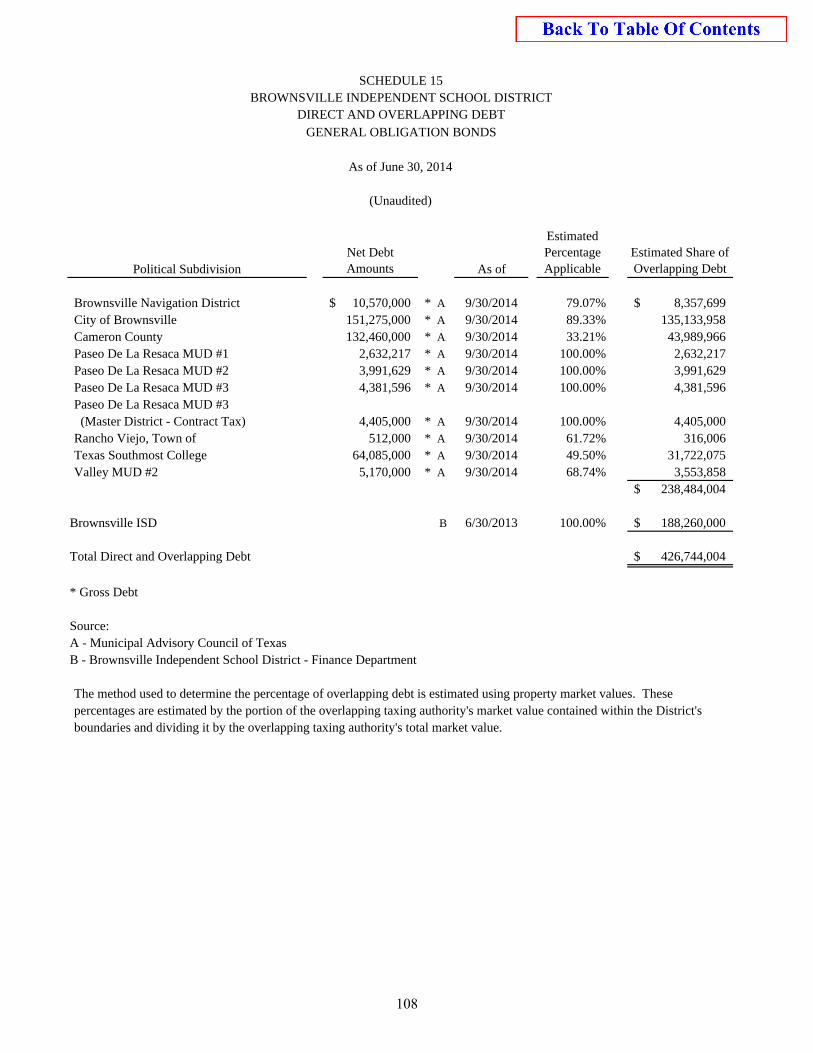
Political SubdivisionNet Debt Amounts As of
Estimated Percentage Applicable
Estimated Share of Overlapping Debt
Brownsville Navigation District 10,570,000$ * A 9/30/2014 79.07% 8,357,699$ City of Brownsville 151,275,000 * A 9/30/2014 89.33% 135,133,958 Cameron County 132,460,000 * A 9/30/2014 33.21% 43,989,966 Paseo De La Resaca MUD #1 2,632,217 * A 9/30/2014 100.00% 2,632,217 Paseo De La Resaca MUD #2 3,991,629 * A 9/30/2014 100.00% 3,991,629 Paseo De La Resaca MUD #3 4,381,596 * A 9/30/2014 100.00% 4,381,596 Paseo De La Resaca MUD #3 (Master District - Contract Tax) 4,405,000 * A 9/30/2014 100.00% 4,405,000 Rancho Viejo, Town of 512,000 * A 9/30/2014 61.72% 316,006 Texas Southmost College 64,085,000 * A 9/30/2014 49.50% 31,722,075 Valley MUD #2 5,170,000 * A 9/30/2014 68.74% 3,553,858
238,484,004$
Brownsville ISD B 6/30/2013 100.00% 188,260,000$
Total Direct and Overlapping Debt 426,744,004$
* Gross Debt
Source: A - Municipal Advisory Council of TexasB - Brownsville Independent School District - Finance Department
The method used to determine the percentage of overlapping debt is estimated using property market values. Thesepercentages are estimated by the portion of the overlapping taxing authority's market value contained within the District'sboundaries and dividing it by the overlapping taxing authority's total market value.
As of June 30, 2014
(Unaudited)
DIRECT AND OVERLAPPING DEBT
SCHEDULE 15BROWNSVILLE INDEPENDENT SCHOOL DISTRICT
GENERAL OBLIGATION BONDS
108
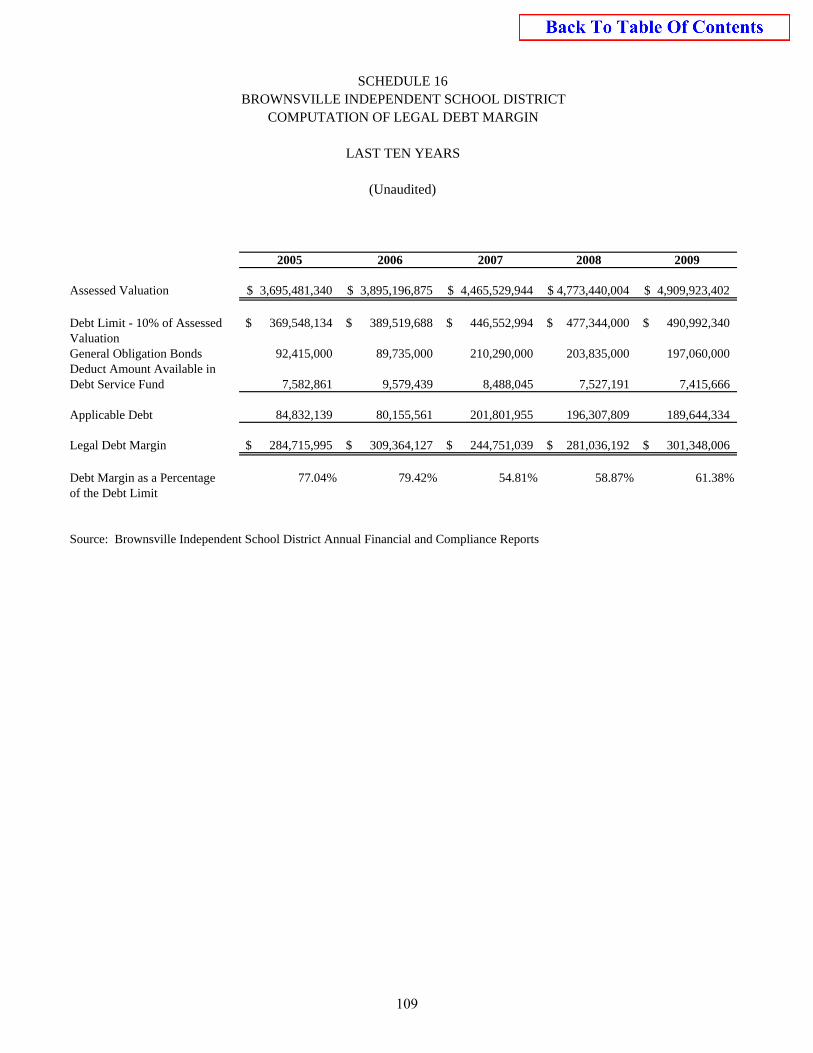
2005 2006 2007 2008 2009
Assessed Valuation 3,695,481,340$ 3,895,196,875$ 4,465,529,944$ 4,773,440,004$ 4,909,923,402$
Debt Limit - 10% of Assessed 369,548,134$ 389,519,688$ 446,552,994$ 477,344,000$ 490,992,340$ ValuationGeneral Obligation Bonds 92,415,000 89,735,000 210,290,000 203,835,000 197,060,000 Deduct Amount Available in Debt Service Fund 7,582,861 9,579,439 8,488,045 7,527,191 7,415,666
Applicable Debt 84,832,139 80,155,561 201,801,955 196,307,809 189,644,334
Legal Debt Margin 284,715,995$ 309,364,127$ 244,751,039$ 281,036,192$ 301,348,006$
Debt Margin as a Percentage 77.04% 79.42% 54.81% 58.87% 61.38%of the Debt Limit
Source: Brownsville Independent School District Annual Financial and Compliance Reports
(Unaudited)
BROWNSVILLE INDEPENDENT SCHOOL DISTRICT
LAST TEN YEARS
COMPUTATION OF LEGAL DEBT MARGIN
SCHEDULE 16
109
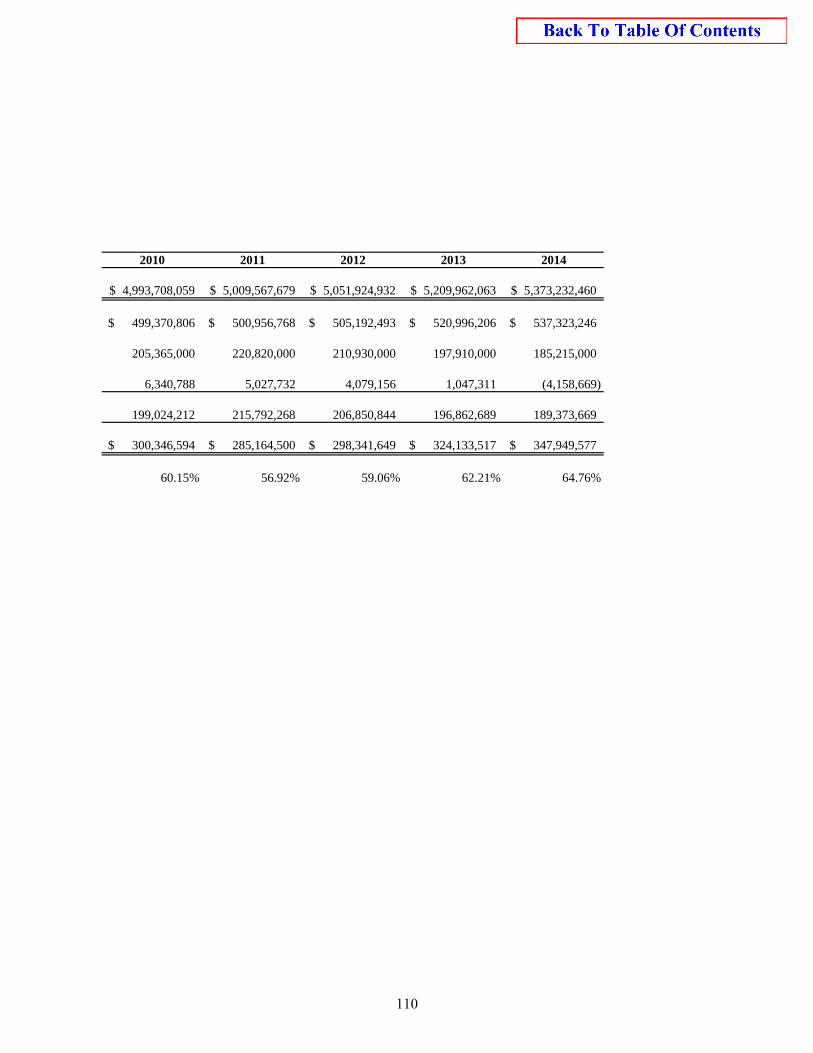
2010 2011 2012 2013 2014
4,993,708,059$ 5,009,567,679$ 5,051,924,932$ 5,209,962,063$ 5,373,232,460$
499,370,806$ 500,956,768$ 505,192,493$ 520,996,206$ 537,323,246$
205,365,000 220,820,000 210,930,000 197,910,000 185,215,000
6,340,788 5,027,732 4,079,156 1,047,311 (4,158,669)
199,024,212 215,792,268 206,850,844 196,862,689 189,373,669
300,346,594$ 285,164,500$ 298,341,649$ 324,133,517$ 347,949,577$
60.15% 56.92% 59.06% 62.21% 64.76%
110
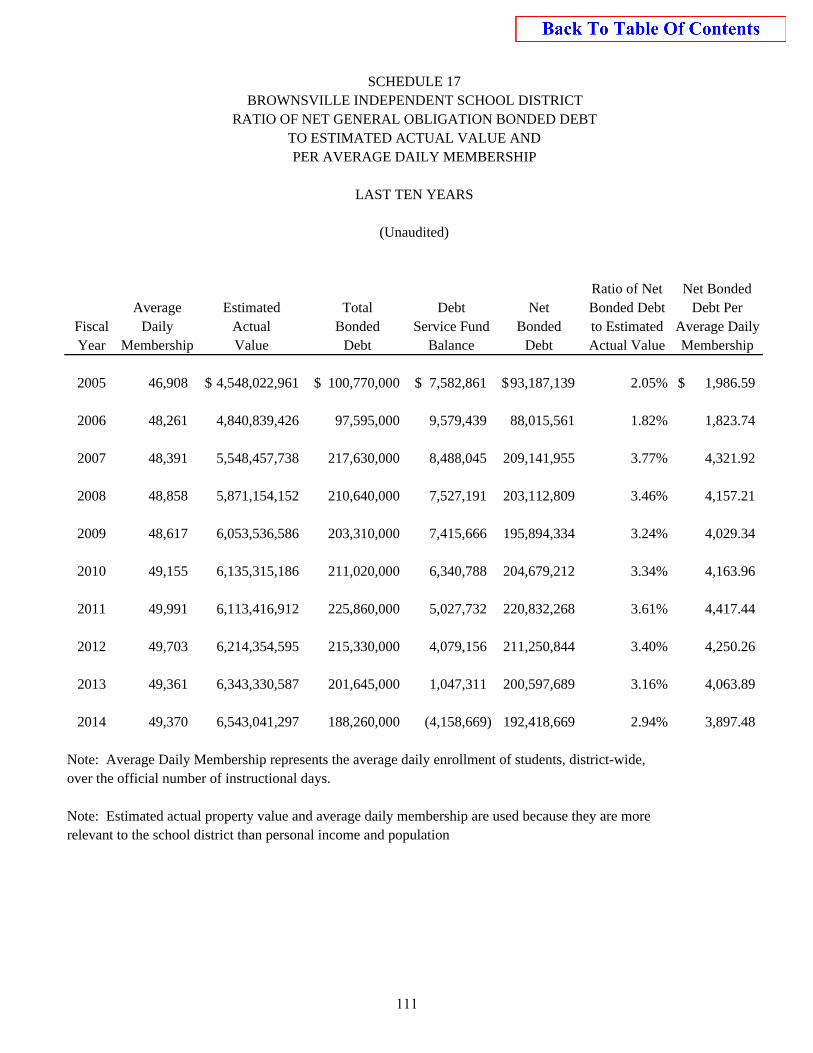
Ratio of Net Net BondedAverage Estimated Total Debt Net Bonded Debt Debt Per
Fiscal Daily Actual Bonded Service Fund Bonded to Estimated Average DailyYear Membership Value Debt Balance Debt Actual Value Membership
2005 46,908 4,548,022,961$ 100,770,000$ 7,582,861$ 93,187,139$ 2.05% 1,986.59$
2006 48,261 4,840,839,426 97,595,000 9,579,439 88,015,561 1.82% 1,823.74
2007 48,391 5,548,457,738 217,630,000 8,488,045 209,141,955 3.77% 4,321.92
2008 48,858 5,871,154,152 210,640,000 7,527,191 203,112,809 3.46% 4,157.21
2009 48,617 6,053,536,586 203,310,000 7,415,666 195,894,334 3.24% 4,029.34
2010 49,155 6,135,315,186 211,020,000 6,340,788 204,679,212 3.34% 4,163.96
2011 49,991 6,113,416,912 225,860,000 5,027,732 220,832,268 3.61% 4,417.44
2012 49,703 6,214,354,595 215,330,000 4,079,156 211,250,844 3.40% 4,250.26
2013 49,361 6,343,330,587 201,645,000 1,047,311 200,597,689 3.16% 4,063.89
2014 49,370 6,543,041,297 188,260,000 (4,158,669) 192,418,669 2.94% 3,897.48
Note: Average Daily Membership represents the average daily enrollment of students, district-wide, over the official number of instructional days.
Note: Estimated actual property value and average daily membership are used because they are morerelevant to the school district than personal income and population
(Unaudited)
SCHEDULE 17BROWNSVILLE INDEPENDENT SCHOOL DISTRICT
RATIO OF NET GENERAL OBLIGATION BONDED DEBTTO ESTIMATED ACTUAL VALUE ANDPER AVERAGE DAILY MEMBERSHIP
LAST TEN YEARS
111
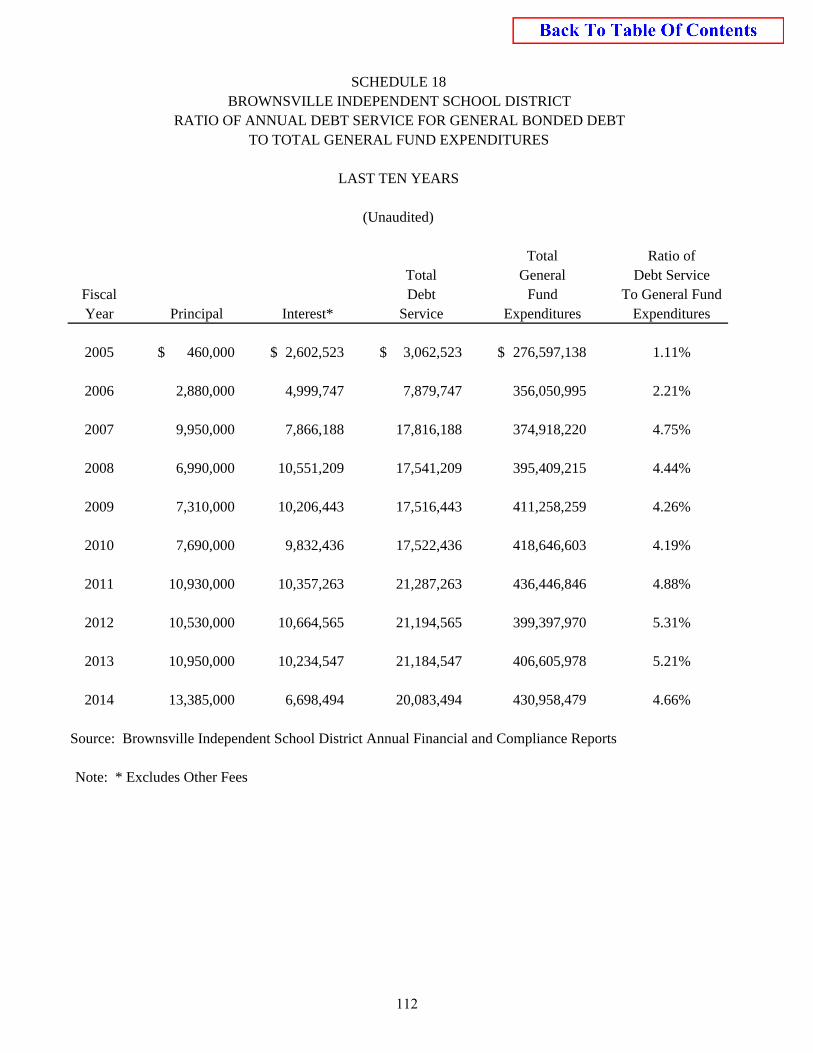
Total Ratio ofTotal General Debt Service
Fiscal Debt Fund To General FundYear Principal Interest* Service Expenditures Expenditures
2005 460,000$ 2,602,523$ 3,062,523$ 276,597,138$ 1.11%
2006 2,880,000 4,999,747 7,879,747 356,050,995 2.21%
2007 9,950,000 7,866,188 17,816,188 374,918,220 4.75%
2008 6,990,000 10,551,209 17,541,209 395,409,215 4.44%
2009 7,310,000 10,206,443 17,516,443 411,258,259 4.26%
2010 7,690,000 9,832,436 17,522,436 418,646,603 4.19%
2011 10,930,000 10,357,263 21,287,263 436,446,846 4.88%
2012 10,530,000 10,664,565 21,194,565 399,397,970 5.31%
2013 10,950,000 10,234,547 21,184,547 406,605,978 5.21%
2014 13,385,000 6,698,494 20,083,494 430,958,479 4.66%
Source: Brownsville Independent School District Annual Financial and Compliance Reports
Note: * Excludes Other Fees
(Unaudited)
SCHEDULE 18BROWNSVILLE INDEPENDENT SCHOOL DISTRICT
RATIO OF ANNUAL DEBT SERVICE FOR GENERAL BONDED DEBTTO TOTAL GENERAL FUND EXPENDITURES
LAST TEN YEARS
112
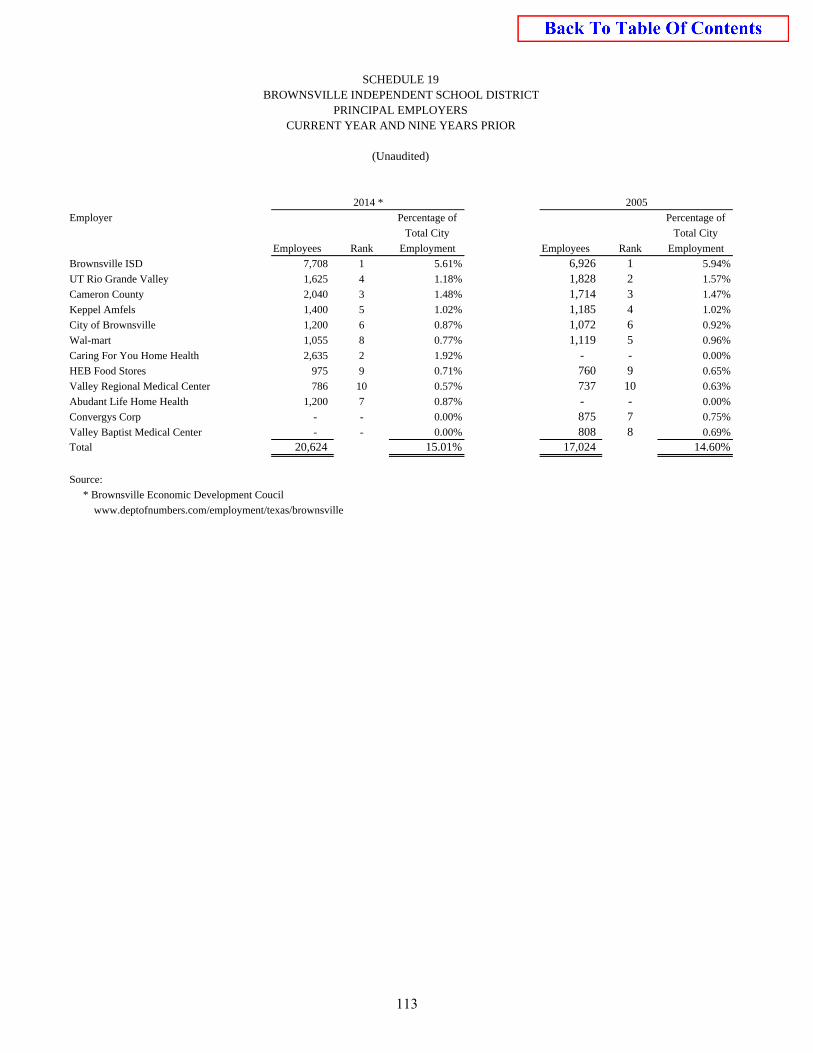
Employer Percentage of Percentage of
Total City Total City
Employees Rank Employment Employees Rank Employment
Brownsville ISD 7,708 1 5.61% 6,926 1 5.94%
UT Rio Grande Valley 1,625 4 1.18% 1,828 2 1.57%
Cameron County 2,040 3 1.48% 1,714 3 1.47%
Keppel Amfels 1,400 5 1.02% 1,185 4 1.02%
City of Brownsville 1,200 6 0.87% 1,072 6 0.92%
Wal-mart 1,055 8 0.77% 1,119 5 0.96%
Caring For You Home Health 2,635 2 1.92% - - 0.00%
HEB Food Stores 975 9 0.71% 760 9 0.65%
Valley Regional Medical Center 786 10 0.57% 737 10 0.63%
Abudant Life Home Health 1,200 7 0.87% - - 0.00%
Convergys Corp - - 0.00% 875 7 0.75%
Valley Baptist Medical Center - - 0.00% 808 8 0.69%Total 20,624 15.01% 17,024 14.60%
Source:
* Brownsville Economic Development Coucil
www.deptofnumbers.com/employment/texas/brownsville
20052014 *
BROWNSVILLE INDEPENDENT SCHOOL DISTRICTSCHEDULE 19
PRINCIPAL EMPLOYERSCURRENT YEAR AND NINE YEARS PRIOR
(Unaudited)
113
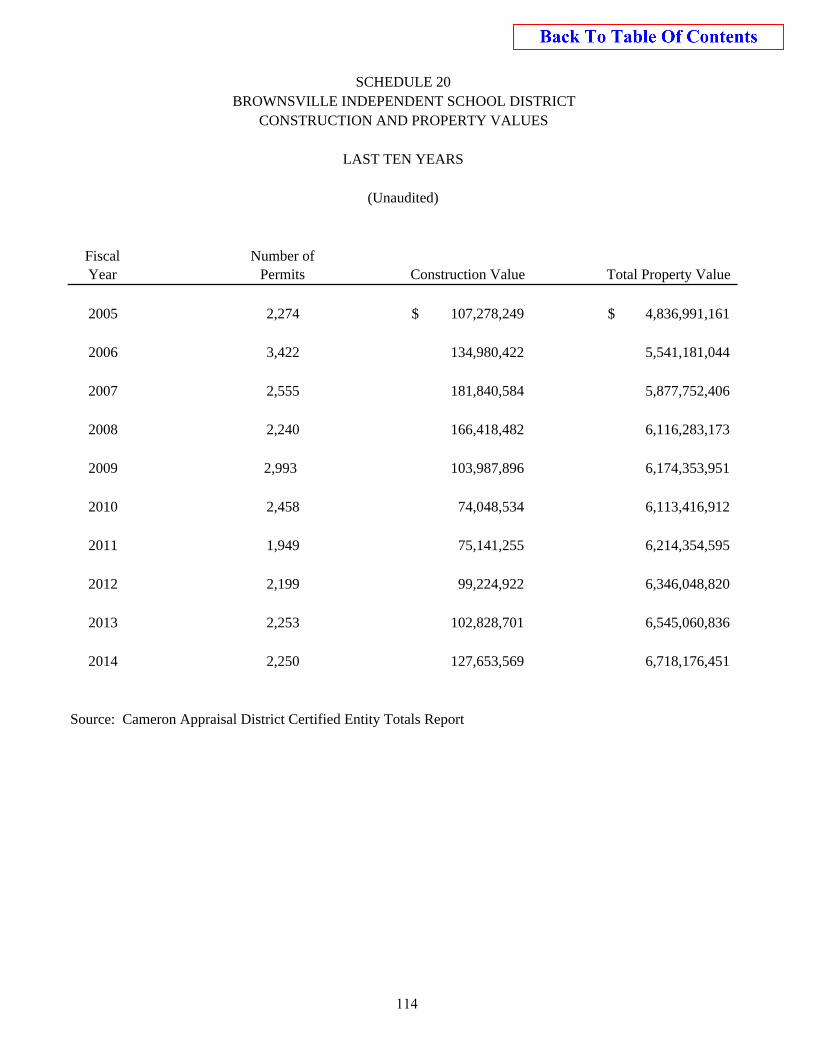
Fiscal Year
Number of Permits Construction Value Total Property Value
2005 2,274 107,278,249$ 4,836,991,161$
2006 3,422 134,980,422 5,541,181,044
2007 2,555 181,840,584 5,877,752,406
2008 2,240 166,418,482 6,116,283,173
2009 2,993 103,987,896 6,174,353,951
2010 2,458 74,048,534 6,113,416,912
2011 1,949 75,141,255 6,214,354,595
2012 2,199 99,224,922 6,346,048,820
2013 2,253 102,828,701 6,545,060,836
2014 2,250 127,653,569 6,718,176,451
Source: Cameron Appraisal District Certified Entity Totals Report
SCHEDULE 20BROWNSVILLE INDEPENDENT SCHOOL DISTRICT
CONSTRUCTION AND PROPERTY VALUES
LAST TEN YEARS
(Unaudited)
114
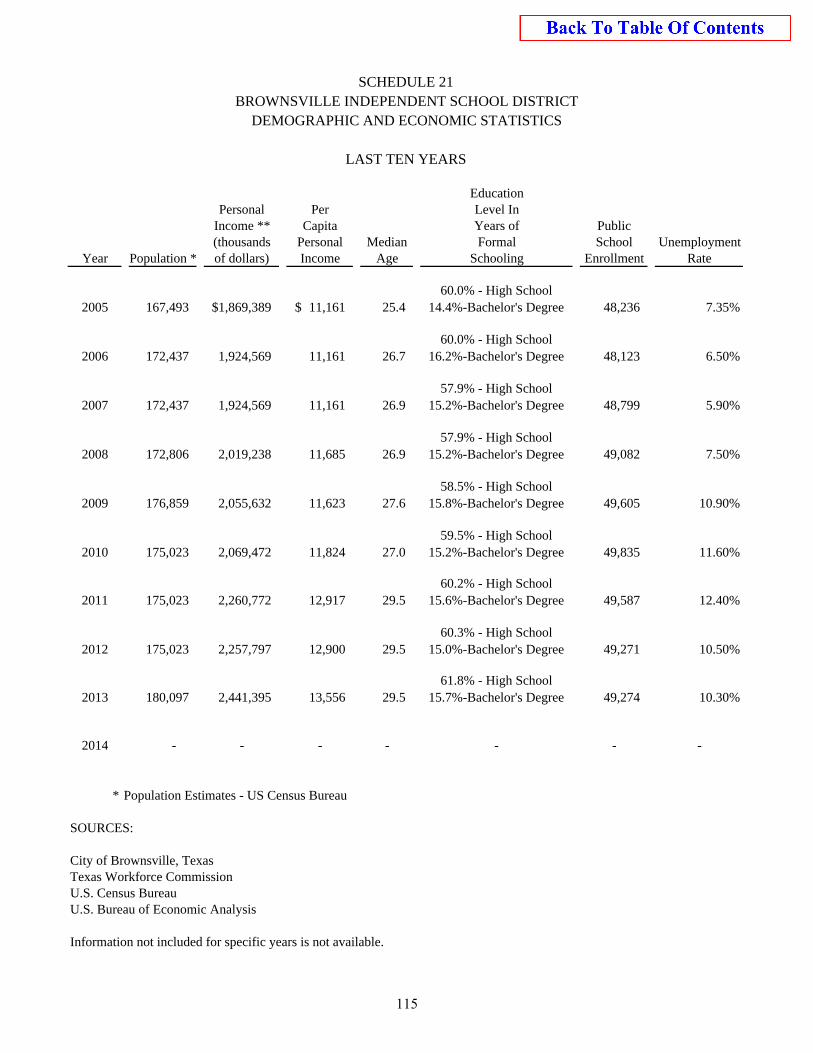
EducationPersonal Per Level In
Income ** Capita Years of Public(thousands Personal Median Formal School Unemployment
Year Population * of dollars) Income Age Schooling Enrollment Rate
2005 167,493 1,869,389$ 11,161$ 25.4 60.0% - High School
14.4%-Bachelor's Degree 48,236 7.35%
2006 172,437 1,924,569 11,161 26.7 60.0% - High School
16.2%-Bachelor's Degree 48,123 6.50%
2007 172,437 1,924,569 11,161 26.9 57.9% - High School
15.2%-Bachelor's Degree 48,799 5.90%
2008 172,806 2,019,238 11,685 26.9 57.9% - High School
15.2%-Bachelor's Degree 49,082 7.50%
2009 176,859 2,055,632 11,623 27.6 58.5% - High School
15.8%-Bachelor's Degree 49,605 10.90%
2010 175,023 2,069,472 11,824 27.0 59.5% - High School
15.2%-Bachelor's Degree 49,835 11.60%
2011 175,023 2,260,772 12,917 29.5 60.2% - High School
15.6%-Bachelor's Degree 49,587 12.40%
2012 175,023 2,257,797 12,900 29.5 60.3% - High School
15.0%-Bachelor's Degree 49,271 10.50%
2013 180,097 2,441,395 13,556 29.5 61.8% - High School
15.7%-Bachelor's Degree 49,274 10.30%
2014 - - - - - - -
* Population Estimates - US Census Bureau
SOURCES:
City of Brownsville, TexasTexas Workforce CommissionU.S. Census BureauU.S. Bureau of Economic Analysis
Information not included for specific years is not available.
LAST TEN YEARS
BROWNSVILLE INDEPENDENT SCHOOL DISTRICTDEMOGRAPHIC AND ECONOMIC STATISTICS
SCHEDULE 21
115
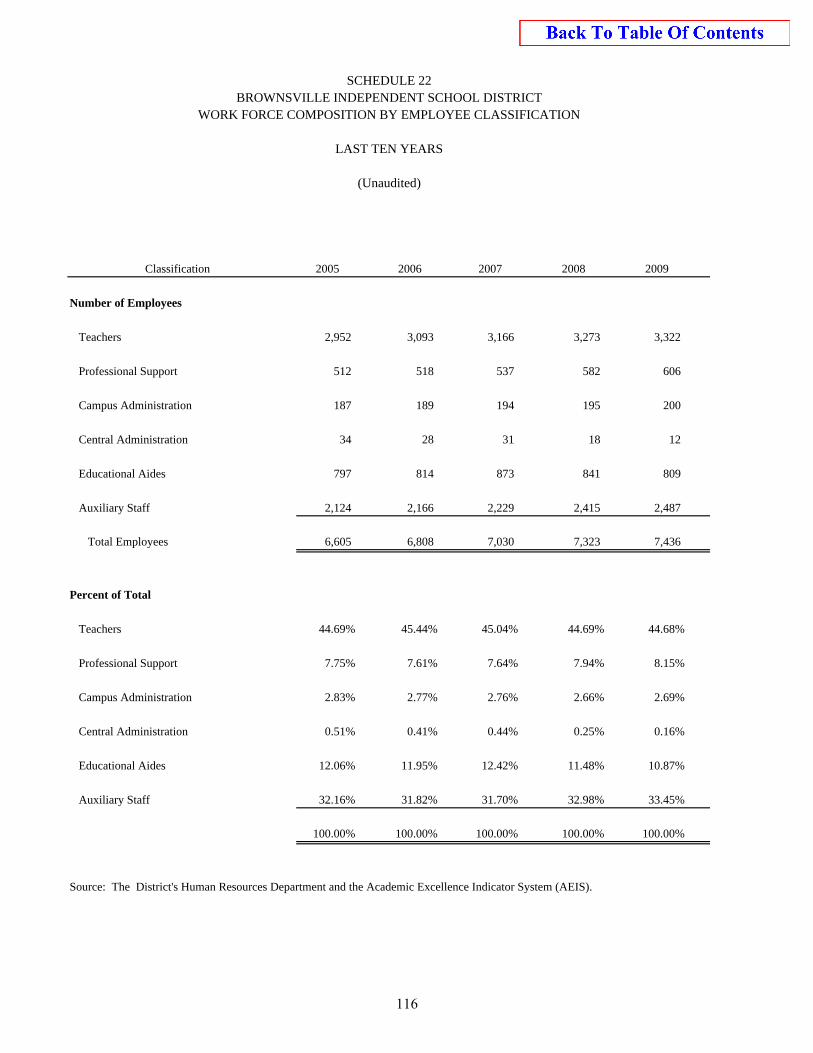
2005 2006 2007 2008 2009
Number of Employees
Teachers 2,952 3,093 3,166 3,273 3,322
Professional Support 512 518 537 582 606
Campus Administration 187 189 194 195 200
Central Administration 34 28 31 18 12
Educational Aides 797 814 873 841 809
Auxiliary Staff 2,124 2,166 2,229 2,415 2,487
Total Employees 6,605 6,808 7,030 7,323 7,436
Percent of Total
Teachers 44.69% 45.44% 45.04% 44.69% 44.68%
Professional Support 7.75% 7.61% 7.64% 7.94% 8.15%
Campus Administration 2.83% 2.77% 2.76% 2.66% 2.69%
Central Administration 0.51% 0.41% 0.44% 0.25% 0.16%
Educational Aides 12.06% 11.95% 12.42% 11.48% 10.87%
Auxiliary Staff 32.16% 31.82% 31.70% 32.98% 33.45%
100.00% 100.00% 100.00% 100.00% 100.00%
Source: The District's Human Resources Department and the Academic Excellence Indicator System (AEIS).
SCHEDULE 22BROWNSVILLE INDEPENDENT SCHOOL DISTRICT
WORK FORCE COMPOSITION BY EMPLOYEE CLASSIFICATION
LAST TEN YEARS
(Unaudited)
Classification
116
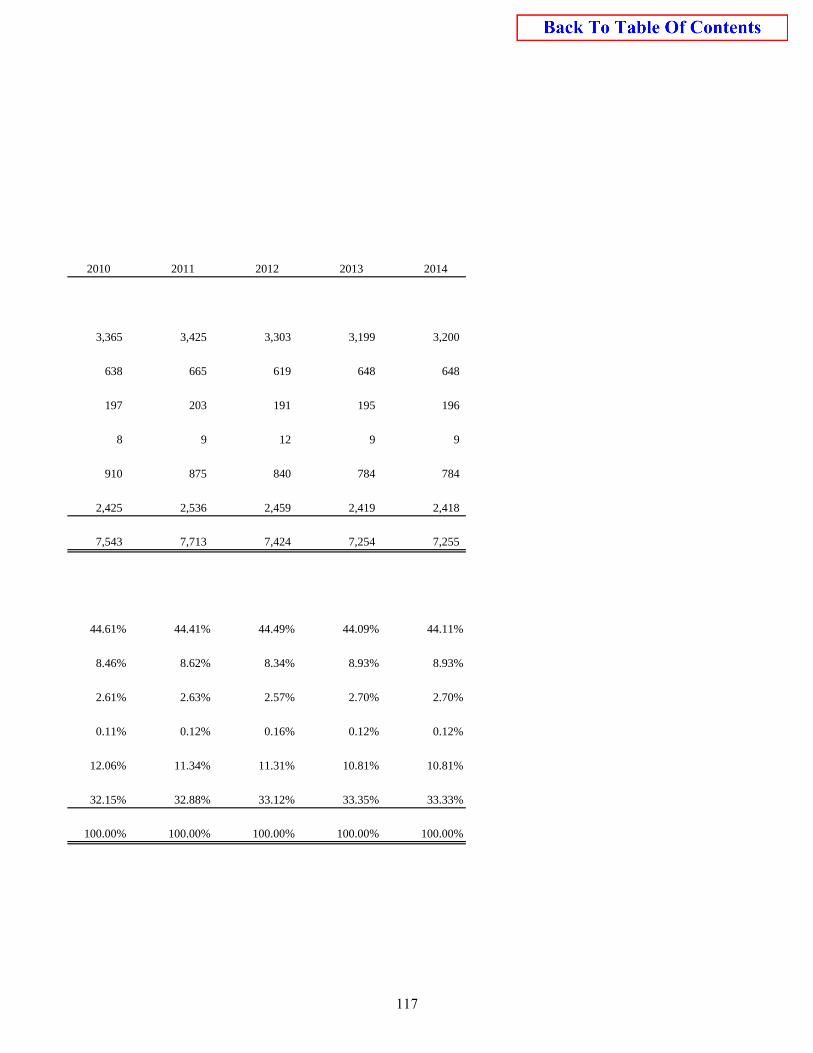
2010 2011 2012 2013 2014
3,365 3,425 3,303 3,199 3,200
638 665 619 648 648
197 203 191 195 196
8 9 12 9 9
910 875 840 784 784
2,425 2,536 2,459 2,419 2,418
7,543 7,713 7,424 7,254 7,255
44.61% 44.41% 44.49% 44.09% 44.11%
8.46% 8.62% 8.34% 8.93% 8.93%
2.61% 2.63% 2.57% 2.70% 2.70%
0.11% 0.12% 0.16% 0.12% 0.12%
12.06% 11.34% 11.31% 10.81% 10.81%
32.15% 32.88% 33.12% 33.35% 33.33%
100.00% 100.00% 100.00% 100.00% 100.00%
117
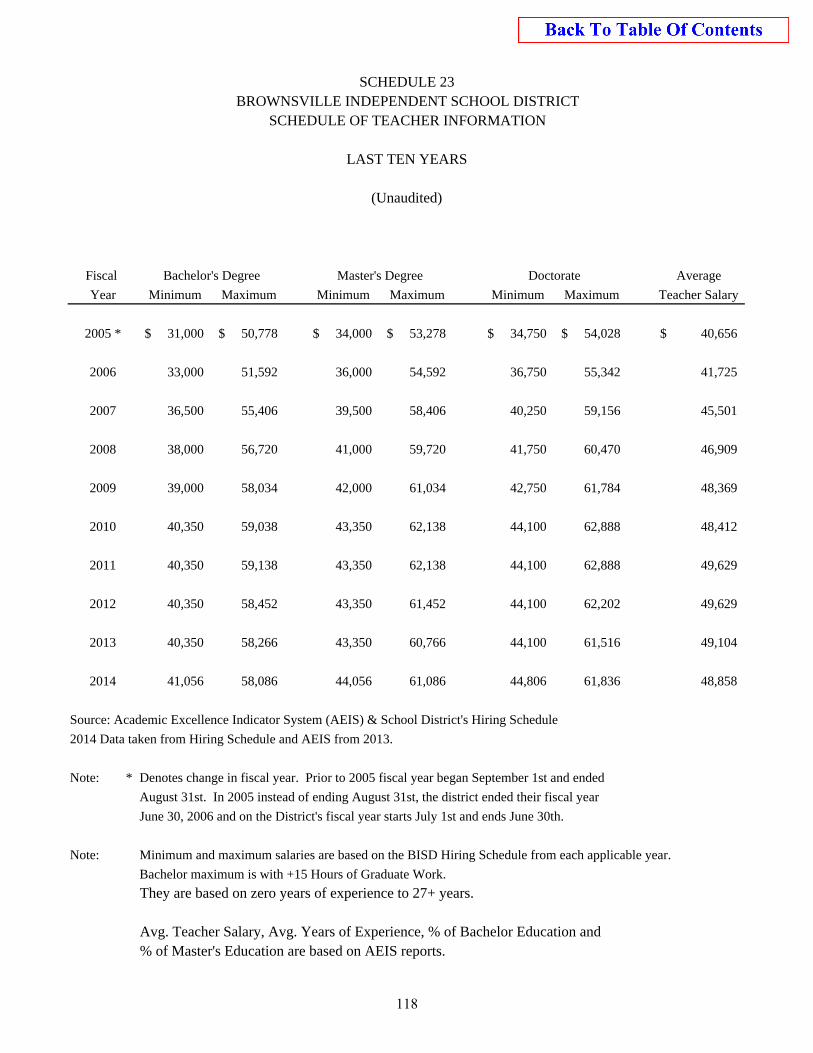
Fiscal Average
Year Minimum Maximum Minimum Maximum Minimum Maximum Teacher Salary
2005 * 31,000$ 50,778$ 34,000$ 53,278$ 34,750$ 54,028$ 40,656$
2006 33,000 51,592 36,000 54,592 36,750 55,342 41,725
2007 36,500 55,406 39,500 58,406 40,250 59,156 45,501
2008 38,000 56,720 41,000 59,720 41,750 60,470 46,909
2009 39,000 58,034 42,000 61,034 42,750 61,784 48,369
2010 40,350 59,038 43,350 62,138 44,100 62,888 48,412
2011 40,350 59,138 43,350 62,138 44,100 62,888 49,629
2012 40,350 58,452 43,350 61,452 44,100 62,202 49,629
2013 40,350 58,266 43,350 60,766 44,100 61,516 49,104
2014 41,056 58,086 44,056 61,086 44,806 61,836 48,858
Source: Academic Excellence Indicator System (AEIS) & School District's Hiring Schedule
2014 Data taken from Hiring Schedule and AEIS from 2013.
Note: * Denotes change in fiscal year. Prior to 2005 fiscal year began September 1st and ended
August 31st. In 2005 instead of ending August 31st, the district ended their fiscal year
June 30, 2006 and on the District's fiscal year starts July 1st and ends June 30th.
Note: Minimum and maximum salaries are based on the BISD Hiring Schedule from each applicable year.
Bachelor maximum is with +15 Hours of Graduate Work.
They are based on zero years of experience to 27+ years.
Avg. Teacher Salary, Avg. Years of Experience, % of Bachelor Education and % of Master's Education are based on AEIS reports.
BROWNSVILLE INDEPENDENT SCHOOL DISTRICTSCHEDULE OF TEACHER INFORMATION
LAST TEN YEARS
SCHEDULE 23
(Unaudited)
Bachelor's Degree Master's Degree Doctorate
118
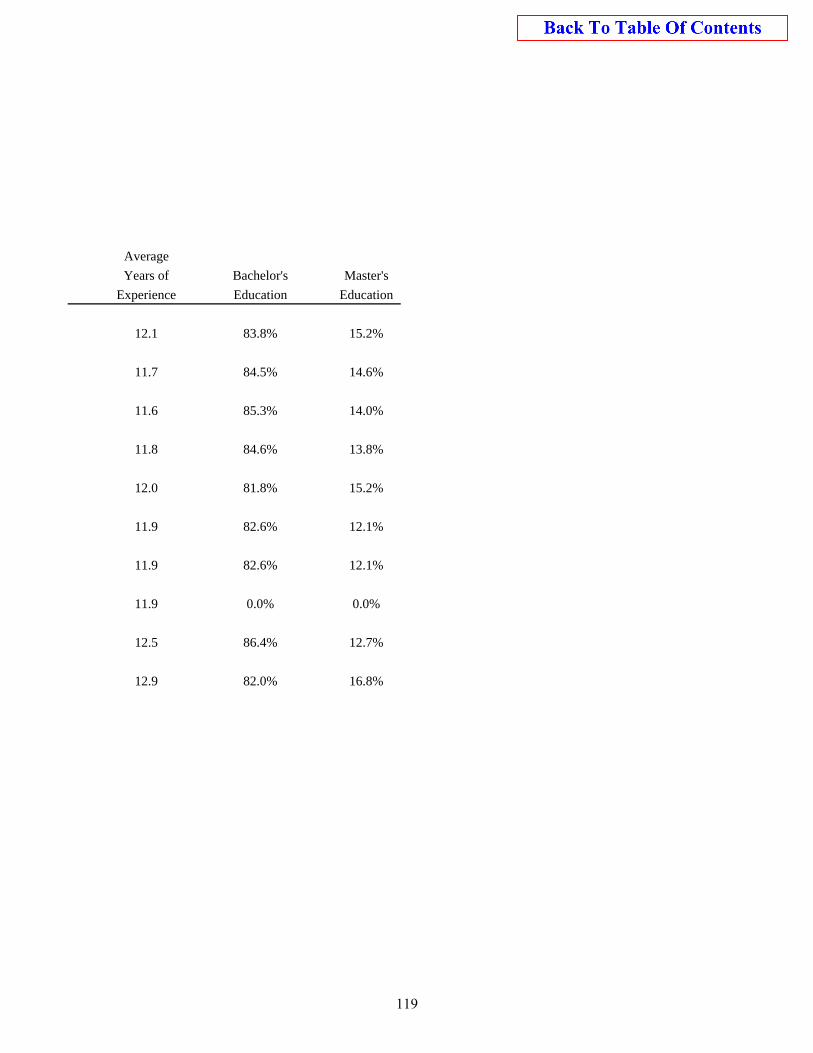
Average
Years of Bachelor's Master's
Experience Education Education
12.1 83.8% 15.2%
11.7 84.5% 14.6%
11.6 85.3% 14.0%
11.8 84.6% 13.8%
12.0 81.8% 15.2%
11.9 82.6% 12.1%
11.9 82.6% 12.1%
11.9 0.0% 0.0%
12.5 86.4% 12.7%
12.9 82.0% 16.8%
119
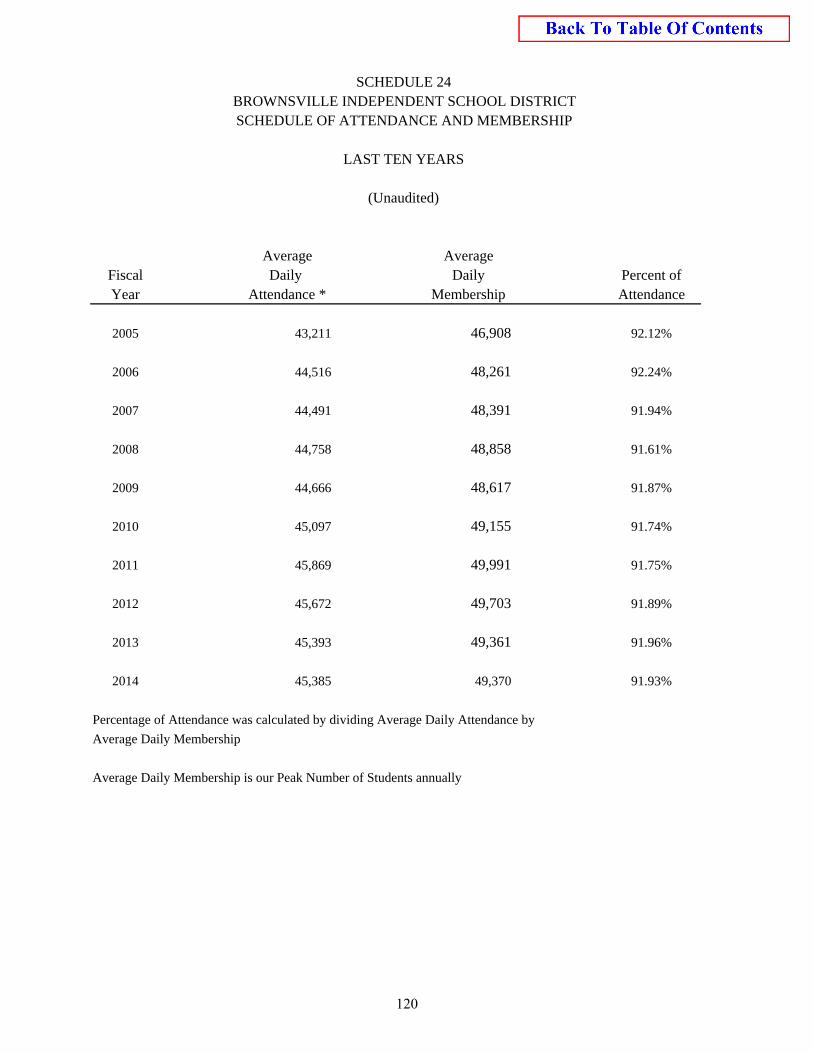
Average AverageFiscal Daily Daily Percent ofYear Attendance * Membership Attendance
2005 43,211 46,908 92.12%
2006 44,516 48,261 92.24%
2007 44,491 48,391 91.94%
2008 44,758 48,858 91.61%
2009 44,666 48,617 91.87%
2010 45,097 49,155 91.74%
2011 45,869 49,991 91.75%
2012 45,672 49,703 91.89%
2013 45,393 49,361 91.96%
2014 45,385 49,370 91.93%
Percentage of Attendance was calculated by dividing Average Daily Attendance by
Average Daily Membership
Average Daily Membership is our Peak Number of Students annually
SCHEDULE 24BROWNSVILLE INDEPENDENT SCHOOL DISTRICTSCHEDULE OF ATTENDANCE AND MEMBERSHIP
LAST TEN YEARS
(Unaudited)
120
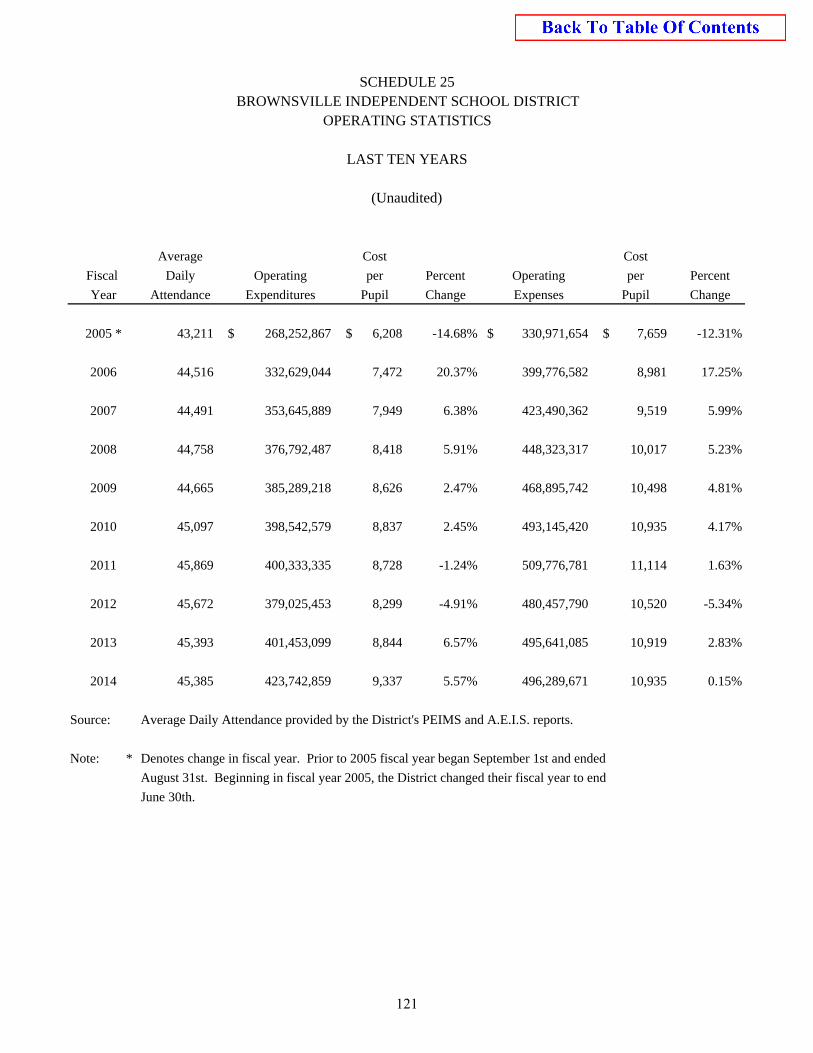
Average Cost Cost
Fiscal Daily Operating per Percent Operating per Percent
Year Attendance Expenditures Pupil Change Expenses Pupil Change
2005 * 43,211 268,252,867$ 6,208$ -14.68% 330,971,654$ 7,659$ -12.31%
2006 44,516 332,629,044 7,472 20.37% 399,776,582 8,981 17.25%
2007 44,491 353,645,889 7,949 6.38% 423,490,362 9,519 5.99%
2008 44,758 376,792,487 8,418 5.91% 448,323,317 10,017 5.23%
2009 44,665 385,289,218 8,626 2.47% 468,895,742 10,498 4.81%
2010 45,097 398,542,579 8,837 2.45% 493,145,420 10,935 4.17%
2011 45,869 400,333,335 8,728 -1.24% 509,776,781 11,114 1.63%
2012 45,672 379,025,453 8,299 -4.91% 480,457,790 10,520 -5.34%
2013 45,393 401,453,099 8,844 6.57% 495,641,085 10,919 2.83%
2014 45,385 423,742,859 9,337 5.57% 496,289,671 10,935 0.15%
Source: Average Daily Attendance provided by the District's PEIMS and A.E.I.S. reports.
Note: * Denotes change in fiscal year. Prior to 2005 fiscal year began September 1st and ended
August 31st. Beginning in fiscal year 2005, the District changed their fiscal year to end
June 30th.
SCHEDULE 25BROWNSVILLE INDEPENDENT SCHOOL DISTRICT
OPERATING STATISTICS
LAST TEN YEARS
(Unaudited)
121
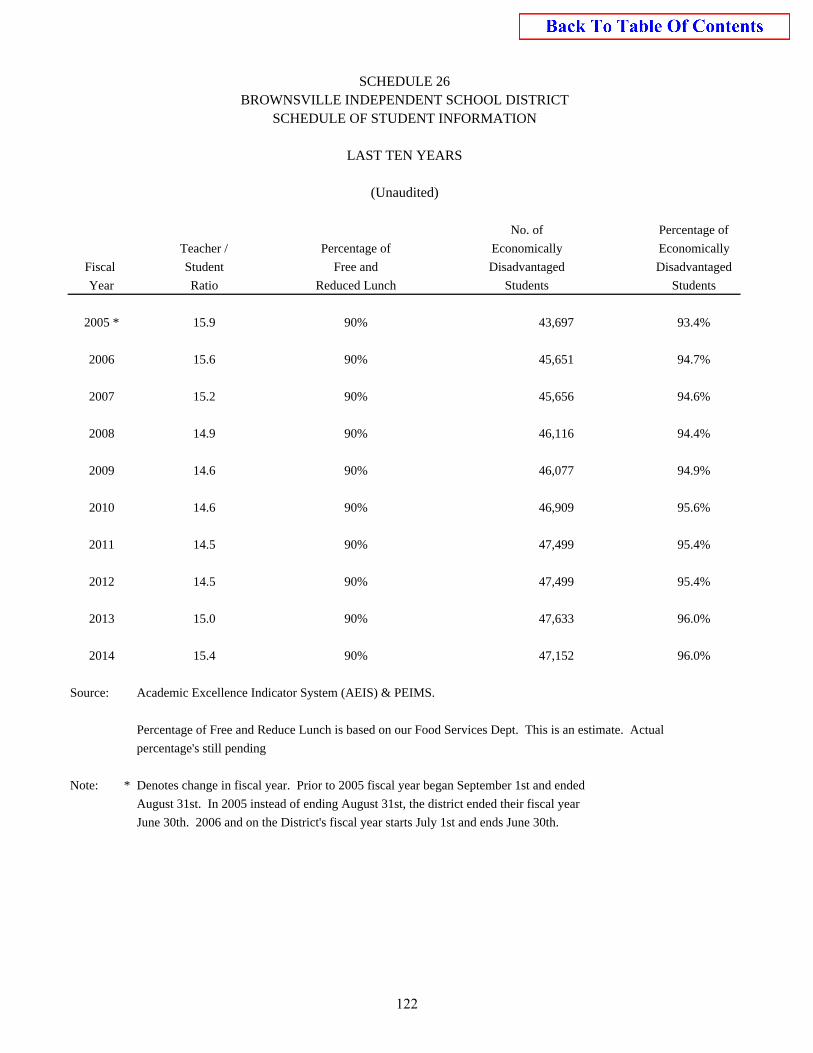
No. of Percentage of
Teacher / Percentage of Economically Economically
Fiscal Student Free and Disadvantaged Disadvantaged
Year Ratio Reduced Lunch Students Students
2005 * 15.9 90% 43,697 93.4%
2006 15.6 90% 45,651 94.7%
2007 15.2 90% 45,656 94.6%
2008 14.9 90% 46,116 94.4%
2009 14.6 90% 46,077 94.9%
2010 14.6 90% 46,909 95.6%
2011 14.5 90% 47,499 95.4%
2012 14.5 90% 47,499 95.4%
2013 15.0 90% 47,633 96.0%
2014 15.4 90% 47,152 96.0%
Source: Academic Excellence Indicator System (AEIS) & PEIMS.
Percentage of Free and Reduce Lunch is based on our Food Services Dept. This is an estimate. Actual
percentage's still pending
Note: * Denotes change in fiscal year. Prior to 2005 fiscal year began September 1st and ended
August 31st. In 2005 instead of ending August 31st, the district ended their fiscal year
June 30th. 2006 and on the District's fiscal year starts July 1st and ends June 30th.
SCHEDULE 26BROWNSVILLE INDEPENDENT SCHOOL DISTRICT
SCHEDULE OF STUDENT INFORMATION
LAST TEN YEARS
(Unaudited)
122
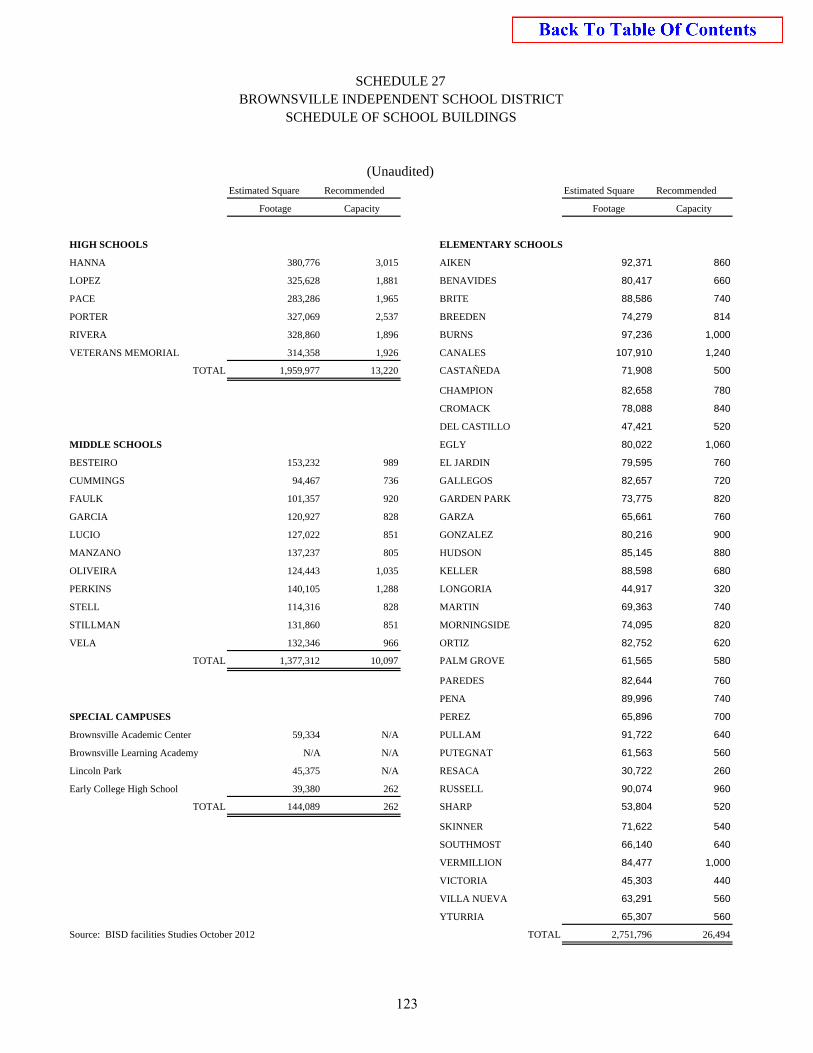
Estimated Square Recommended Estimated Square Recommended
Footage Capacity Footage Capacity
HIGH SCHOOLS ELEMENTARY SCHOOLS
HANNA 380,776 3,015 AIKEN 92,371 860
LOPEZ 325,628 1,881 BENAVIDES 80,417 660
PACE 283,286 1,965 BRITE 88,586 740
PORTER 327,069 2,537 BREEDEN 74,279 814
RIVERA 328,860 1,896 BURNS 97,236 1,000
VETERANS MEMORIAL 314,358 1,926 CANALES 107,910 1,240
TOTAL 1,959,977 13,220 CASTAÑEDA 71,908 500
CHAMPION 82,658 780
CROMACK 78,088 840
DEL CASTILLO 47,421 520
MIDDLE SCHOOLS EGLY 80,022 1,060
BESTEIRO 153,232 989 EL JARDIN 79,595 760
CUMMINGS 94,467 736 GALLEGOS 82,657 720
FAULK 101,357 920 GARDEN PARK 73,775 820
GARCIA 120,927 828 GARZA 65,661 760
LUCIO 127,022 851 GONZALEZ 80,216 900
MANZANO 137,237 805 HUDSON 85,145 880
OLIVEIRA 124,443 1,035 KELLER 88,598 680
PERKINS 140,105 1,288 LONGORIA 44,917 320
STELL 114,316 828 MARTIN 69,363 740
STILLMAN 131,860 851 MORNINGSIDE 74,095 820
VELA 132,346 966 ORTIZ 82,752 620
TOTAL 1,377,312 10,097 PALM GROVE 61,565 580
PAREDES 82,644 760
PENA 89,996 740
SPECIAL CAMPUSES PEREZ 65,896 700
Brownsville Academic Center 59,334 N/A PULLAM 91,722 640
Brownsville Learning Academy N/A N/A PUTEGNAT 61,563 560
Lincoln Park 45,375 N/A RESACA 30,722 260
Early College High School 39,380 262 RUSSELL 90,074 960
TOTAL 144,089 262 SHARP 53,804 520
SKINNER 71,622 540
SOUTHMOST 66,140 640
VERMILLION 84,477 1,000
VICTORIA 45,303 440
VILLA NUEVA 63,291 560
YTURRIA 65,307 560
Source: BISD facilities Studies October 2012 TOTAL 2,751,796 26,494
SCHEDULE 27BROWNSVILLE INDEPENDENT SCHOOL DISTRICT
SCHEDULE OF SCHOOL BUILDINGS
(Unaudited)
123
BROWNSVILLE INDEPENDENT SCHOOL DISTRICT
MISCELLANEOUS STATISTICS
The Brownsville Independent School District has, as part of its efforts to serve all of its students, expanded its educational off campus to serve specific student needs. Some off campus educational programs are staffed with District teachers and teacher assistants. As of June 30, 2014, it included such programs as follows: Adult Continuing Education BISD Adult Education is a department of Brownsville Independent School District and the fiscal agent for Cameron County Co-op, which includes Los Fresnos, Port Isabel, Rio Hondo, San Benito, Santa Rosa and Santa Maria. BISD Adult Education provides services to a multicultural population who are educationally and economically and educationally disadvantaged adults, 17 years and older. Brownsville Academic Center (BAC) The BISD Brownsville Academic Center is an alternative education program which has as its goal to provide a meaningful educational experience for assigned students in grades sixth to twelfth in a well disciplined environment that provides consistency, structure, intense academics, and supportive related services so that each student will grow intellectually, socially, emotionally, and psychologically. Upon exiting the program, BISD BAC students will be effective communicators, competent problem solvers, self-directed learners, and responsible citizens. Brownsville Learning Academy (BLA) The BISD Brownsville Learning Academy is an alternative educational program that offers academic options for students who want to complete the necessary requirements for obtaining a high school diploma. The BLA is a competency-based learning system with flexible scheduling for young adults who are not successfully completing a traditional high school program. The student’s commitment and desire to earn a high school diploma, combined with a caring, positive learning climate, determines the student’s degree of success. Juvenile Justice Alternative Education Programs (JJAEP) Cameron County Juvenile Probation is required by state law to provide a Juvenile Justice Alternative Education Program (J.J.A.E.P.) to those students who have been expelled by one of the schools in Cameron County and who have been adjudicated, or are pending adjudication, as a delinquent by a juvenile court. In addition, the school districts may, in its discretion, order or, by agreement, refer students who continue to have serious and persistent misbehavior. Lincoln Park School Lincoln Park School is a “school of choice” alternative high school. The school serves sixth to twelfth grade students from all middle and high schools in BISD. A variety of programs are offered that meet the individual needs of students in the Teen Parenting Accelerated Program (TPAP). Lincoln Park School has a day care center for birth – 17 month old babies for the enrolled teen parents. The primary goal is to provide an opportunity for teen-aged parents to obtain a high school diploma and develop work skills in their area of interest. The school operates differently from traditional high schools, because of the individualized, self-paced, performance based, accelerated curriculum.
124

FEDERAL AWARDS SECTION
765 EAST 7TH STREET BROWNSVILLE, TX 78520 (956) 544-7778 FAX: (956) 544-8465 www.pbhcpa.com AFFILIATE OFFICES: HILLSBORO, TX (254) 582-2583 TEMPLE, TX (254) 791-3460
WACO, TX (254) 772-4901 ALBUQUERQUE, NM (505) 266-5904
INDEPENDENT AUDITORS’ REPORT ON INTERNAL CONTROL OVER FINANCIAL REPORTING AND ON COMPLIANCE AND
OTHER MATTERS BASED ON AN AUDIT OF FINANCIAL STATEMENTS PERFORMED IN ACCORDANCE WITH
GOVERNMENT AUDITING STANDARDS Board of Trustees Brownsville Independent School District Brownsville, Texas We have audited, in accordance with the auditing standards generally accepted in the United States of America and the standards applicable to financial audits contained in Government Auditing Standards issued by the Comptroller General of the United States, the financial statements of the governmental activities, each major fund, and the aggregate remaining fund information of Brownsville Independent School District (the “District”) as of and for the year ended June 30, 2014, and the related notes to the financial statements, which collectively comprise the District’s basic financial statements, and have issued our report thereon dated November 7, 2014. Internal Control Over Financial Reporting In planning and performing our audit of the financial statements, we considered the District’s internal control over financial reporting (internal control) to determine the audit procedures that are appropriate in the circumstances for the purpose of expressing our opinions on the financial statements, but not for the purpose of expressing an opinion on the effectiveness of the District’s internal control. Accordingly, we do not express an opinion on the effectiveness of Brownsville Independent School District’s internal control. A deficiency in internal control exists when the design or operation of a control does not allow management or employees, in the normal course of performing their assigned functions, to prevent, or detect and correct, misstatements on a timely basis. A material weakness is a deficiency, or a combination of deficiencies, in internal control, such that there is a reasonable possibility that a material misstatement of the District’s financial statements will not be prevented, or detected and corrected on a timely basis. A significant deficiency is a deficiency, or a combination of deficiencies, in internal control that is less severe than a material weakness, yet important enough to merit attention by those charged with governance. Our consideration of internal control was for the limited purpose described in the first paragraph of this section and was not designed to identify all deficiencies in internal control that might be material weaknesses or, significant deficiencies. Given these limitations, during our audit we did not identify any deficiencies in internal control that we consider to be material weaknesses. However, material weaknesses may exist that have not been identified.
125

765 EAST 7TH STREET BROWNSVILLE, TX 78520 (956) 544-7778 FAX: (956) 544-8465 www.pbhcpa.com AFFILIATE OFFICES: HILLSBORO, TX (254) 582-2583 TEMPLE, TX (254) 791-3460
WACO, TX (254) 772-4901 ALBUQUERQUE, NM (505) 266-5904
INDEPENDENT AUDITORS’ REPORT ON COMPLIANCE FOR EACH MAJOR PROGRAM AND ON INTERNAL CONTROL
OVER COMPLIANCE REQUIRED BY OMB CIRCULAR A-133
Board of Trustees Brownsville Independent School District Brownsville, Texas Report on Compliance for Each Major Federal Program We have audited Brownsville Independent School District’s (the “District”) compliance with the types of compliance requirements described in the OMB Circular A-133 Compliance Supplement that could have a direct and material effect on each of the District’s major federal programs for the year ended June 30, 2014. The District’s major federal programs are identified in the summary of auditor’s results section of the accompanying schedule of findings and questioned costs. Management’s Responsibility Management is responsible for compliance with the requirements of laws, regulations, contracts, and grants applicable to its federal programs. Auditor’s Responsibility Our responsibility is to express an opinion on compliance for each of the District’s major federal programs based on our audit of types of compliance requirements referred to above. We conducted our audit of compliance in accordance with auditing standards generally accepted in the United States of America; the standards applicable to financial audits contained in Government Auditing Standards, issued by the Comptroller General of the United States; and OMB Circular A-133, Audits of States, Local Governments, and Non-Profit Organizations. Those standards and OMB Circular A-133 require that we plan and perform the audit to obtain reasonable assurance about whether noncompliance with the types of compliance requirements referred to above that could have a direct and material effect on a major federal program occurred. An audit includes examining, on a test basis, evidence about the District’s compliance with those requirements and performing such other procedures as we considered necessary in the circumstances. We believe that our audit provides a reasonable basis for our opinion on compliance for each major federal program. However, our audit does not provide a legal determination of the District’s compliance. Opinion on Each Major Federal Program In our opinion, the District complied, in all material respects, with the types of compliance requirements referred to above that could have a direct and material effect on each of its major federal programs for the year ended June 30, 2014.
127
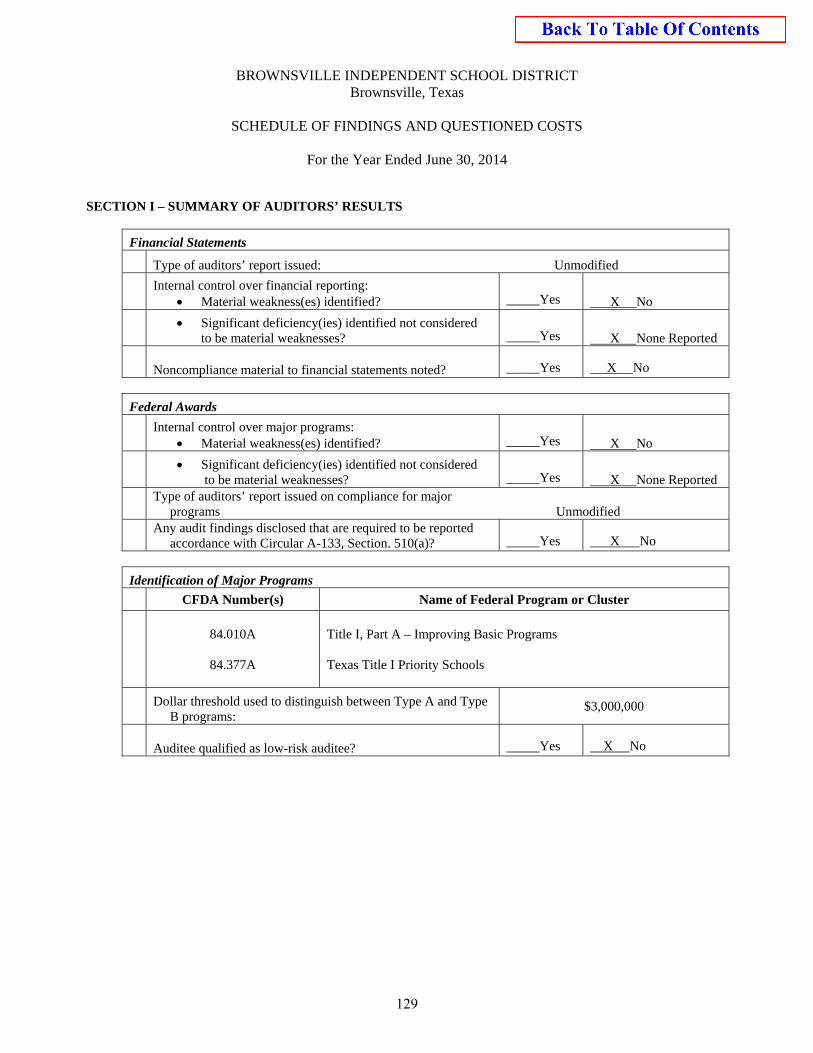
BROWNSVILLE INDEPENDENT SCHOOL DISTRICT Brownsville, Texas
SCHEDULE OF FINDINGS AND QUESTIONED COSTS
For the Year Ended June 30, 2014
SECTION I – SUMMARY OF AUDITORS’ RESULTS
Financial Statements Type of auditors’ report issued: Unmodified Internal control over financial reporting:
Material weakness(es) identified? _____Yes X No Significant deficiency(ies) identified not considered
to be material weaknesses? Yes X None Reported
Noncompliance material to financial statements noted? _____Yes X No
Federal Awards Internal control over major programs:
Material weakness(es) identified? _____Yes X No Significant deficiency(ies) identified not considered
to be material weaknesses? Yes X None Reported Type of auditors’ report issued on compliance for major
programs Unmodified Any audit findings disclosed that are required to be reported
accordance with Circular A-133, Section. 510(a)? Yes X No
Identification of Major Programs CFDA Number(s) Name of Federal Program or Cluster
84.010A
84.377A
Title I, Part A – Improving Basic Programs Texas Title I Priority Schools
Dollar threshold used to distinguish between Type A and Type B programs:
$3,000,000
Auditee qualified as low-risk auditee? Yes X No
129
BROWNSVILLE INDEPENDENT SCHOOL DISTRICT Brownsville, Texas
SCHEDULE OF FINDINGS AND QUESTIONED COSTS
For the Year Ended June 30, 2014
SECTION II – FINANCIAL STATEMENT FINDINGS Program Findings/Noncompliance None Noted SECTION III – FEDERAL AWARD FINDINGS AND QUESTIONED COSTS Program Findings/Noncompliance None Noted
130
BROWNSVILLE INDEPENDENT SCHOOL DISTRICT Brownsville, Texas
CORRECTIVE ACTION PLAN
For the Year Ended June 30, 2014
Program Findings/Noncompliance Not Applicable
131
BROWNSVILLE INDEPENDENT SCHOOL DISTRICT Brownsville, Texas
SUMMARY SCHEDULE OF PRIOR AUDIT FINDINGS
For the Year Ended June 30, 2014
Program Findings/Noncompliance Not Applicable
132
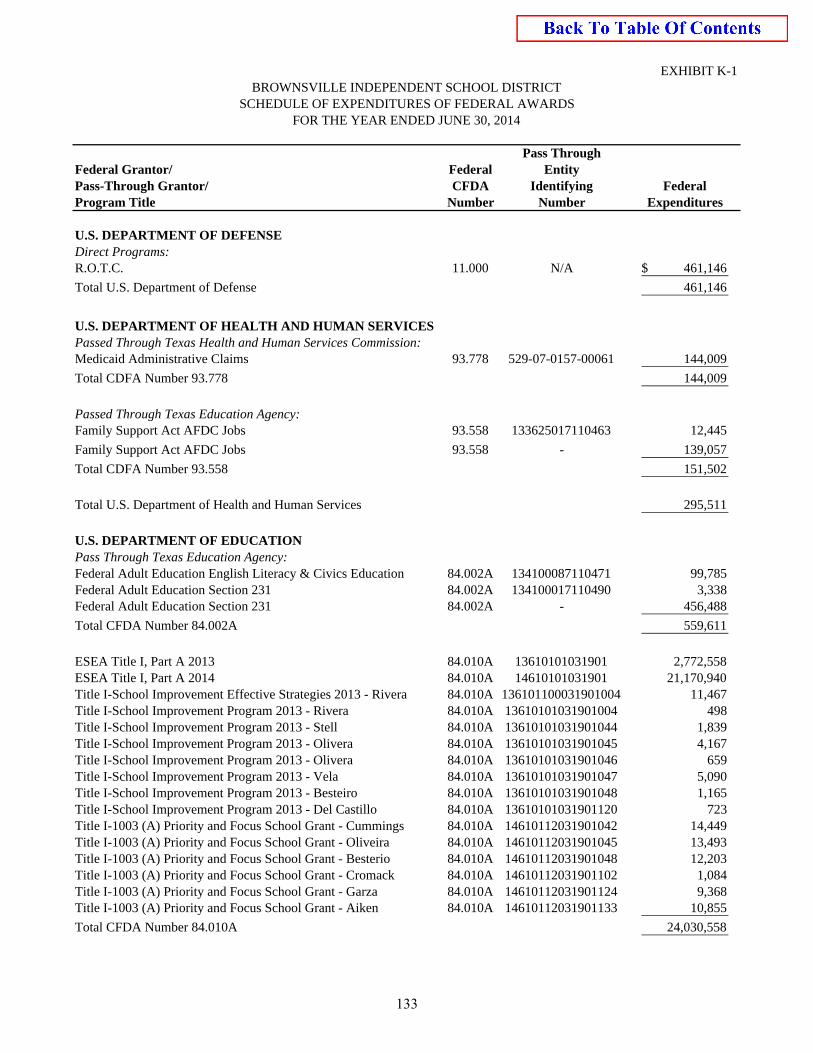
Pass ThroughFederal Grantor/ Federal EntityPass-Through Grantor/ CFDA Identifying FederalProgram Title Number Number Expenditures
U.S. DEPARTMENT OF DEFENSEDirect Programs:R.O.T.C. 11.000 N/A 461,146$
Total U.S. Department of Defense 461,146
U.S. DEPARTMENT OF HEALTH AND HUMAN SERVICESPassed Through Texas Health and Human Services Commission:Medicaid Administrative Claims 93.778 529-07-0157-00061 144,009
Total CDFA Number 93.778 144,009
Passed Through Texas Education Agency:Family Support Act AFDC Jobs 93.558 133625017110463 12,445
Family Support Act AFDC Jobs 93.558 - 139,057
Total CDFA Number 93.558 151,502
Total U.S. Department of Health and Human Services 295,511
U.S. DEPARTMENT OF EDUCATIONPass Through Texas Education Agency:Federal Adult Education English Literacy & Civics Education 84.002A 134100087110471 99,785 Federal Adult Education Section 231 84.002A 134100017110490 3,338 Federal Adult Education Section 231 84.002A - 456,488
Total CFDA Number 84.002A 559,611
ESEA Title I, Part A 2013 84.010A 13610101031901 2,772,558 ESEA Title I, Part A 2014 84.010A 14610101031901 21,170,940 Title I-School Improvement Effective Strategies 2013 - Rivera 84.010A 136101100031901004 11,467 Title I-School Improvement Program 2013 - Rivera 84.010A 13610101031901004 498 Title I-School Improvement Program 2013 - Stell 84.010A 13610101031901044 1,839 Title I-School Improvement Program 2013 - Olivera 84.010A 13610101031901045 4,167 Title I-School Improvement Program 2013 - Olivera 84.010A 13610101031901046 659 Title I-School Improvement Program 2013 - Vela 84.010A 13610101031901047 5,090 Title I-School Improvement Program 2013 - Besteiro 84.010A 13610101031901048 1,165 Title I-School Improvement Program 2013 - Del Castillo 84.010A 13610101031901120 723 Title I-1003 (A) Priority and Focus School Grant - Cummings 84.010A 14610112031901042 14,449 Title I-1003 (A) Priority and Focus School Grant - Oliveira 84.010A 14610112031901045 13,493 Title I-1003 (A) Priority and Focus School Grant - Besterio 84.010A 14610112031901048 12,203 Title I-1003 (A) Priority and Focus School Grant - Cromack 84.010A 14610112031901102 1,084 Title I-1003 (A) Priority and Focus School Grant - Garza 84.010A 14610112031901124 9,368 Title I-1003 (A) Priority and Focus School Grant - Aiken 84.010A 14610112031901133 10,855
Total CFDA Number 84.010A 24,030,558
EXHIBIT K-1
SCHEDULE OF EXPENDITURES OF FEDERAL AWARDSFOR THE YEAR ENDED JUNE 30, 2014
BROWNSVILLE INDEPENDENT SCHOOL DISTRICT
133
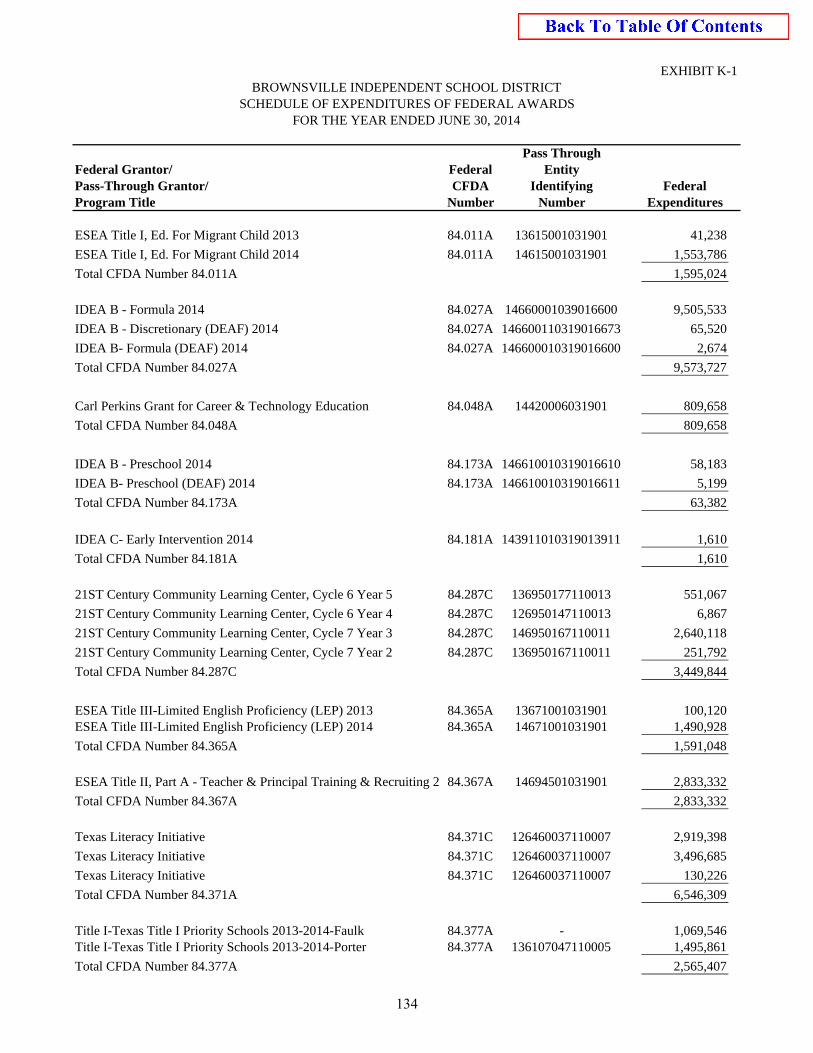
Pass ThroughFederal Grantor/ Federal EntityPass-Through Grantor/ CFDA Identifying FederalProgram Title Number Number Expenditures
EXHIBIT K-1
SCHEDULE OF EXPENDITURES OF FEDERAL AWARDSFOR THE YEAR ENDED JUNE 30, 2014
BROWNSVILLE INDEPENDENT SCHOOL DISTRICT
ESEA Title I, Ed. For Migrant Child 2013 84.011A 13615001031901 41,238
ESEA Title I, Ed. For Migrant Child 2014 84.011A 14615001031901 1,553,786
Total CFDA Number 84.011A 1,595,024
IDEA B - Formula 2014 84.027A 14660001039016600 9,505,533
IDEA B - Discretionary (DEAF) 2014 84.027A 146600110319016673 65,520
IDEA B- Formula (DEAF) 2014 84.027A 146600010319016600 2,674
Total CFDA Number 84.027A 9,573,727
Carl Perkins Grant for Career & Technology Education 84.048A 14420006031901 809,658
Total CFDA Number 84.048A 809,658
IDEA B - Preschool 2014 84.173A 146610010319016610 58,183
IDEA B- Preschool (DEAF) 2014 84.173A 146610010319016611 5,199
Total CFDA Number 84.173A 63,382
IDEA C- Early Intervention 2014 84.181A 143911010319013911 1,610
Total CFDA Number 84.181A 1,610
21ST Century Community Learning Center, Cycle 6 Year 5 84.287C 136950177110013 551,067
21ST Century Community Learning Center, Cycle 6 Year 4 84.287C 126950147110013 6,867
21ST Century Community Learning Center, Cycle 7 Year 3 84.287C 146950167110011 2,640,118
21ST Century Community Learning Center, Cycle 7 Year 2 84.287C 136950167110011 251,792
Total CFDA Number 84.287C 3,449,844
ESEA Title III-Limited English Proficiency (LEP) 2013 84.365A 13671001031901 100,120 ESEA Title III-Limited English Proficiency (LEP) 2014 84.365A 14671001031901 1,490,928
Total CFDA Number 84.365A 1,591,048
ESEA Title II, Part A - Teacher & Principal Training & Recruiting 2 84.367A 14694501031901 2,833,332
Total CFDA Number 84.367A 2,833,332
Texas Literacy Initiative 84.371C 126460037110007 2,919,398
Texas Literacy Initiative 84.371C 126460037110007 3,496,685
Texas Literacy Initiative 84.371C 126460037110007 130,226
Total CFDA Number 84.371A 6,546,309
Title I-Texas Title I Priority Schools 2013-2014-Faulk 84.377A - 1,069,546 Title I-Texas Title I Priority Schools 2013-2014-Porter 84.377A 136107047110005 1,495,861
Total CFDA Number 84.377A 2,565,407
134
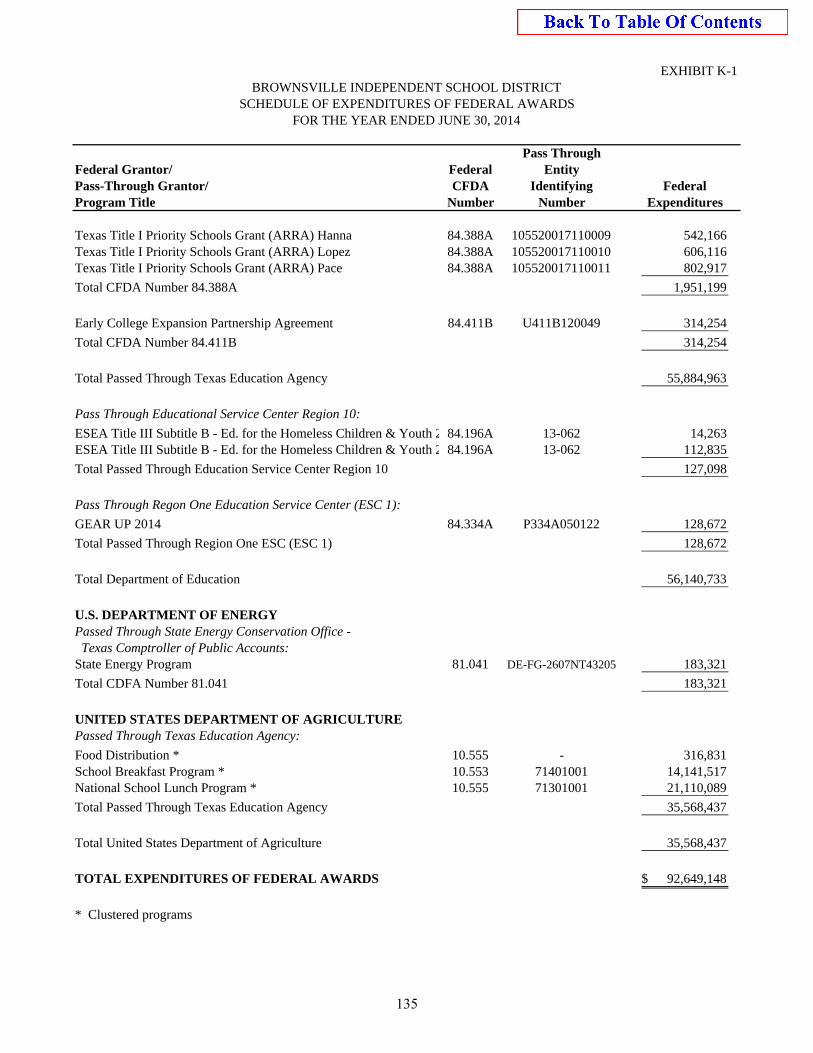
Pass ThroughFederal Grantor/ Federal EntityPass-Through Grantor/ CFDA Identifying FederalProgram Title Number Number Expenditures
EXHIBIT K-1
SCHEDULE OF EXPENDITURES OF FEDERAL AWARDSFOR THE YEAR ENDED JUNE 30, 2014
BROWNSVILLE INDEPENDENT SCHOOL DISTRICT
Texas Title I Priority Schools Grant (ARRA) Hanna 84.388A 105520017110009 542,166 Texas Title I Priority Schools Grant (ARRA) Lopez 84.388A 105520017110010 606,116 Texas Title I Priority Schools Grant (ARRA) Pace 84.388A 105520017110011 802,917
Total CFDA Number 84.388A 1,951,199
Early College Expansion Partnership Agreement 84.411B U411B120049 314,254
Total CFDA Number 84.411B 314,254
Total Passed Through Texas Education Agency 55,884,963
Pass Through Educational Service Center Region 10:
ESEA Title III Subtitle B - Ed. for the Homeless Children & Youth 2 84.196A 13-062 14,263 ESEA Title III Subtitle B - Ed. for the Homeless Children & Youth 2 84.196A 13-062 112,835
Total Passed Through Education Service Center Region 10 127,098
Pass Through Regon One Education Service Center (ESC 1):
GEAR UP 2014 84.334A P334A050122 128,672
Total Passed Through Region One ESC (ESC 1) 128,672
Total Department of Education 56,140,733
U.S. DEPARTMENT OF ENERGYPassed Through State Energy Conservation Office - Texas Comptroller of Public Accounts:State Energy Program 81.041 DE-FG-2607NT43205 183,321
Total CDFA Number 81.041 183,321
UNITED STATES DEPARTMENT OF AGRICULTUREPassed Through Texas Education Agency:
Food Distribution * 10.555 - 316,831 School Breakfast Program * 10.553 71401001 14,141,517 National School Lunch Program * 10.555 71301001 21,110,089
Total Passed Through Texas Education Agency 35,568,437
Total United States Department of Agriculture 35,568,437
TOTAL EXPENDITURES OF FEDERAL AWARDS 92,649,148$
* Clustered programs
135
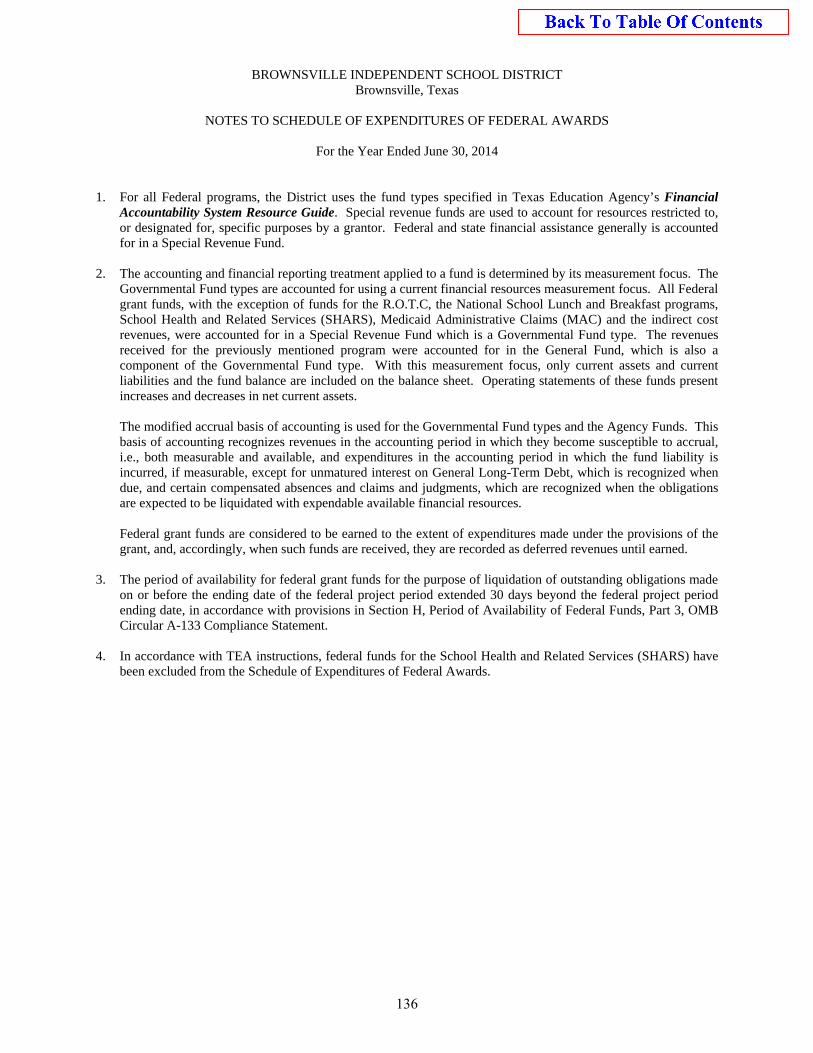
BROWNSVILLE INDEPENDENT SCHOOL DISTRICT Brownsville, Texas
NOTES TO SCHEDULE OF EXPENDITURES OF FEDERAL AWARDS
For the Year Ended June 30, 2014
1. For all Federal programs, the District uses the fund types specified in Texas Education Agency’s Financial Accountability System Resource Guide. Special revenue funds are used to account for resources restricted to, or designated for, specific purposes by a grantor. Federal and state financial assistance generally is accounted for in a Special Revenue Fund.
2. The accounting and financial reporting treatment applied to a fund is determined by its measurement focus. The
Governmental Fund types are accounted for using a current financial resources measurement focus. All Federal grant funds, with the exception of funds for the R.O.T.C, the National School Lunch and Breakfast programs, School Health and Related Services (SHARS), Medicaid Administrative Claims (MAC) and the indirect cost revenues, were accounted for in a Special Revenue Fund which is a Governmental Fund type. The revenues received for the previously mentioned program were accounted for in the General Fund, which is also a component of the Governmental Fund type. With this measurement focus, only current assets and current liabilities and the fund balance are included on the balance sheet. Operating statements of these funds present increases and decreases in net current assets.
The modified accrual basis of accounting is used for the Governmental Fund types and the Agency Funds. This basis of accounting recognizes revenues in the accounting period in which they become susceptible to accrual, i.e., both measurable and available, and expenditures in the accounting period in which the fund liability is incurred, if measurable, except for unmatured interest on General Long-Term Debt, which is recognized when due, and certain compensated absences and claims and judgments, which are recognized when the obligations are expected to be liquidated with expendable available financial resources. Federal grant funds are considered to be earned to the extent of expenditures made under the provisions of the grant, and, accordingly, when such funds are received, they are recorded as deferred revenues until earned.
3. The period of availability for federal grant funds for the purpose of liquidation of outstanding obligations made on or before the ending date of the federal project period extended 30 days beyond the federal project period ending date, in accordance with provisions in Section H, Period of Availability of Federal Funds, Part 3, OMB Circular A-133 Compliance Statement.
4. In accordance with TEA instructions, federal funds for the School Health and Related Services (SHARS) have been excluded from the Schedule of Expenditures of Federal Awards.
136


![Brownsville herald. (Brownsville, Tex.). 1931-01-04 [p ]. · 2020. 10. 14. · gfmmmtmmmmmmmmmmmmmmmrnmm»»*>»»***mmmmmmmmmmmmmmmm..... ..... J| 1 « ----- --—— Brownsville](https://img.pdfslide.us/doc/110x75/611f38f716d6ee6a5426b1ec/brownsville-herald-brownsville-tex-1931-01-04-p-2020-10-14-gfmmmtmmmmmmmmmmmmmmmrnmmmmmmmmmmmmmmmmmm.jpg)