Embed Size (px)
Citation preview
The UK Forest Market ReportIssue 17 2015
www.tilhill.comwww.johnclegg.co.uk
John Clegg & CoCHARTERED SURVEYORS & FORESTRY AGENTS
1www.johnclegg.co.uk www.tilhill.com
The Buyer’s PerspectiveIt has been another record year for UK forestry, with excellentfinancial returns and ready liquidity. Over the last decade, theaverage return from UK forestry has been 18.8% (Source: IPD,2015) and the market has shown an almost insatiable appetite forquality properties, with a total market of over £150 million in 2015.
By historic terms, this is a big market and this very scale is startingto interest institutional investors. For example, the sale of theUPM UK portfolio attracted interest from UK and internationalinstitutions. Such strong demand could continue to drive prices.
Currently, relatively few owners sell each year and indeed only0.6% of the total woodland area is traded annually. This addsanother interesting dynamic to the UK market and begs thequestion – what would make them sell?
Returns from UK forestry are driven by timber returns. As aglobal commodity, some commentators are concerned aboutthe end of the ‘commodity super-cycle’. The theory is thattimber prices could crash like oil prices or demand for steel asemerging economies, such as China, slow.
Such commentators would point to the recent fall in UK timberprices as evidence of this. However, the mainstream view is thatrecent price falls are simply a function of a temporaryweakness in the euro.
Timber is a versatile renewable material and this range of usesmeans that it is affected by many different economic drivers. Forexample, between 2000 and 2015, global wood-pellet productionincreased from 2 to 28 million tonnes per annum. A convenientsource of energy, Drax Power Station in the UK is now the world’slargest consumer of timber – gearing up to an annual consumptionof 15 million tonnes per annum of wood equivalent.
Capital values are also affected by availability of ‘cheapmoney’ within the economy. However, despite the prospect ofincreases in Bank of England interest rates, this does not lookset to end anytime soon. After all, there is a real shortage ofhigh yielding investment projects.
Returns from UK forestry are driven by steady biological growth,with rotation lengths spanning decades. Traditionally considereda ‘safe’ investment, it is well-suited to long-term ownership,providing low correlation with other asset classes, a hedgeagainst inflation and excellent tax advantages. If you want along-term, ‘green’ investment, then UK forestry is hard to beat.
Jason SindenBSc (For) Hons, MICFor, MRICS, MBA
Head of Investment and Property,Tilhill Forestry
The UK Forest Market Report 2015
Tilhill Forestry are the leading forestmanagement and timber harvestingcompany in the UK.
The Seller’s PerspectiveOur analysis of the 2015 forest market shows continued growth invalues during a year when total sales exceeded £150 million. It isstill a slightly esoteric asset but, for those who have joined in, it hasthe benefits of being a real, land-based investment together withreal physical growth to set alongside growth in prices and a benigntax regime.
Home grown timber production is rising on the back of extensiveprivate sector planting in the 1970s and 1980s. Looking to thefuture we need to concentrate on maintaining timber supplies to thedownstream processing industries and the jobs they support.Forestry underpins vital rural employment, jobs in industry andconstruction, not to mention biomass energy and societal benefits interms of biodiversity and recreational opportunities.
The long-term nature of the investment from seed to harvest dependson confidence. Frequent changes to the administrative environment– whether from quinquennial CAP reviews, election years and fiscalpolicy – can undermine the whole sector. The nurseries whogerminate the seeds to create new trees cannot change tack on awhim; the investor requires some certainty that sensible long-termplans will not be unduly frustrated and the whole managementinfrastructure is sustained by continuity. The timescales are sodifferent from agriculture that we must stress this point repeatedly.
Political appreciation of forestry’s ability to deliver benefits to therural economy and raw material to downstream industries andconstruction is increasing, and we must ensure that this message isas constant as the requirement for stability is to encouraginginvestment in the growing of trees for timber. “A wood that pays is awood that stays.”
As we seem to be in an era of low interest rates, possibly for sometime to come, forestry looks to be a promising option for investment.With physical growth in a tangible asset forestry has much tocommend it. We have now had several years of strong growth butthe drivers for that growth still hold true. Global demand for timberis increasing and it is as finite as any other primary resource. If weare to set aside natural forests as refuges for wildlife and ecosystemstability then our industrial timber is best secured from well-structured commercial plantations. In the UK, we have some of thebest and most regulated in the world. The green economy has now,more than ever, become of greater global importance. Commercialforestry has to play a significant role in reducing and offsettingcarbon, as we move towards sustainability.
Fenning WelsteadBSc (For) Hons, FICFor, FRICS
Partner, John Clegg & Co LLP
John Clegg & Co are the leading forestryagent, particularly active in forestry sales.
This is the definitive report on the UK Forestry Property Market. The data-set now includes 1,489 transactionsrecorded over the last 18 years, covering 229,000 hectares and worth £843 million.
2www.johnclegg.co.uk www.tilhill.com
The UK Forest Market Report 2015
Summary
Forest property sales reached a record £151million in 2015, smashing the previous recordset in 2013 by over 50%. Indeed, as Fig. 1illustrates, the current level of activity is morethan double anything seen before 2013 and 13times the size of the market in 2000.
During the year to September 2015, forest property tothe value of £151.15 million was traded. In total, 98properties, comprising 18,435 hectares were sold. Interms of number of properties, total area and value, thisis clearly a very significant year and it is worthconsidering why the market has grown so much.
Analysis of the graph in Fig. 1 shows the increasingvalue of the forest property market since 2000, with thetrend being particularly smooth since 2010. However,the value of transactions actually fell in 2014. The mainreason for this was the ‘pause for breath’ around theScottish Independence referendum, which was reportedin ‘The Buyers Perspective’ of last year’s Forest MarketReport. This led to delays in the conclusion of a numberof important deals and, as forecast, to the substantialincreases in the size of the market in 2015.
Reference to the Scottish Independence Referendum of2014 reminds us of the dominance of Scotland in UKcommercial forestry, accounting for some 77% oftransactions by value.
Compared with 2014, the number of properties fellslightly (5%), but the total area increased by 48%, due tothe sale of a number of large properties. Indeed, themean property size is 55% greater than 2014.
The year was characterised by the number of highvalue transactions. Interestingly, there were as manytransactions in the £2 million to £5 million range as in the£100,001 to £250,000 range. Furthermore, there were fivetransactions of over £5 million and two of over £10 million.
The mean value per hectare jumped by 22% comparedwith 2014 and is now £8,145 per hectare. This jumppartly reflects the continuing increase in mean values (e.g.IPD reported 18.4%). However, it is also a reflection of theparticularly high quality of the forests sold during the year,with South Scotland being especially well represented.
Forestry returns in recent years have been driven by acombination of increasing capital values and risingtimber prices. This is illustrated by record UK timberproduction in 2014, together with an almost 30%increase in unit prices. During 2015, however, UK timberprices have begun to fall, largely because of the impactof the strength of sterling on UK markets for sawn timber.
Analysis of the figures shows that the market stilldemands a premium for properties in England and Walescompared with Scotland. However, some analysts nowconsider that Scotland effectively comprises two separatemarkets. In the south, good growing conditions andaccess to well developed markets, together with a highproportion of Sitka spruce mean that average propertyvalues are high compared with northern Scotland.
As forests mature, they are normally harvested inphases, re-structuring their age-class. This makes age-based analysis increasingly complex. In generalhowever, crops increase in value as they mature.
Most forests sold on the open-market exceed the guideprice.
Currently, there is no sign of any reduction in activity andindeed most investors view the recent reduction in UKtimber prices as a temporary ‘blip’. However, prudencerequires us to keep an eye on the impact of changes inthe global economy, particularly in relation to globaleconomic growth and demand for commodities thatcould have an impact in 2016.
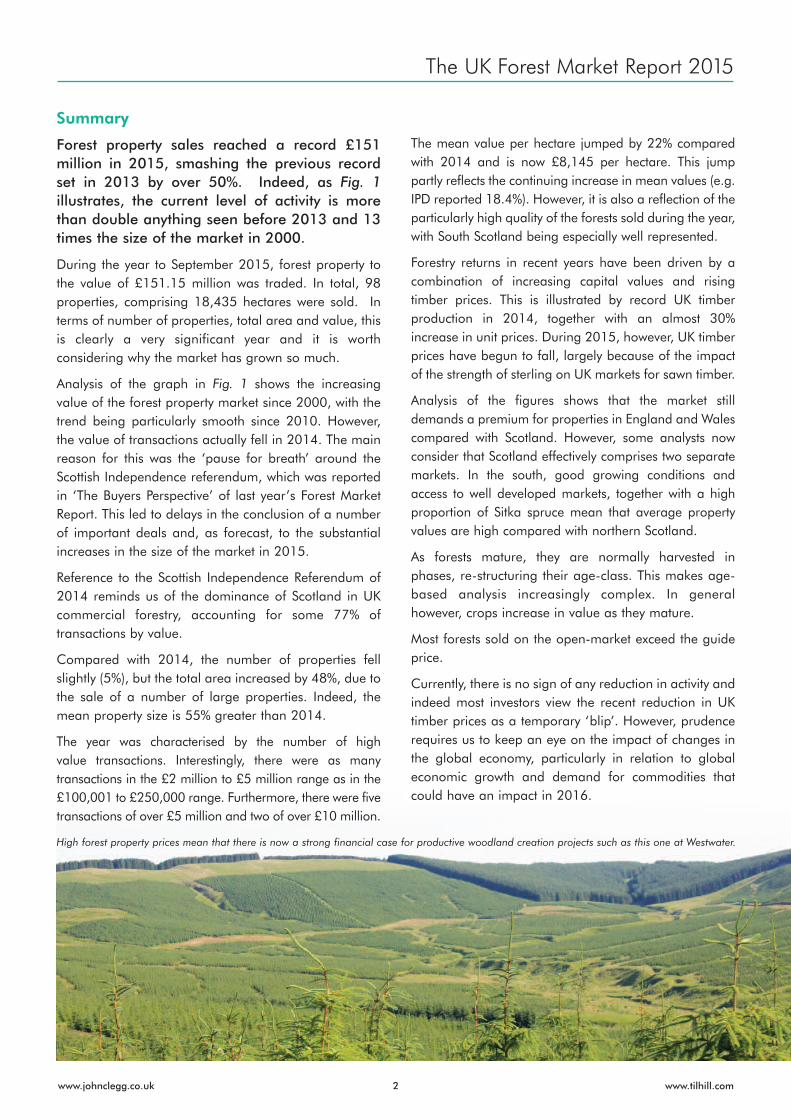
High forest property prices mean that there is now a strong financial case for productive woodland creation projects such as this one at Westwater.
The UK Forest Market Report 2015
Total Market
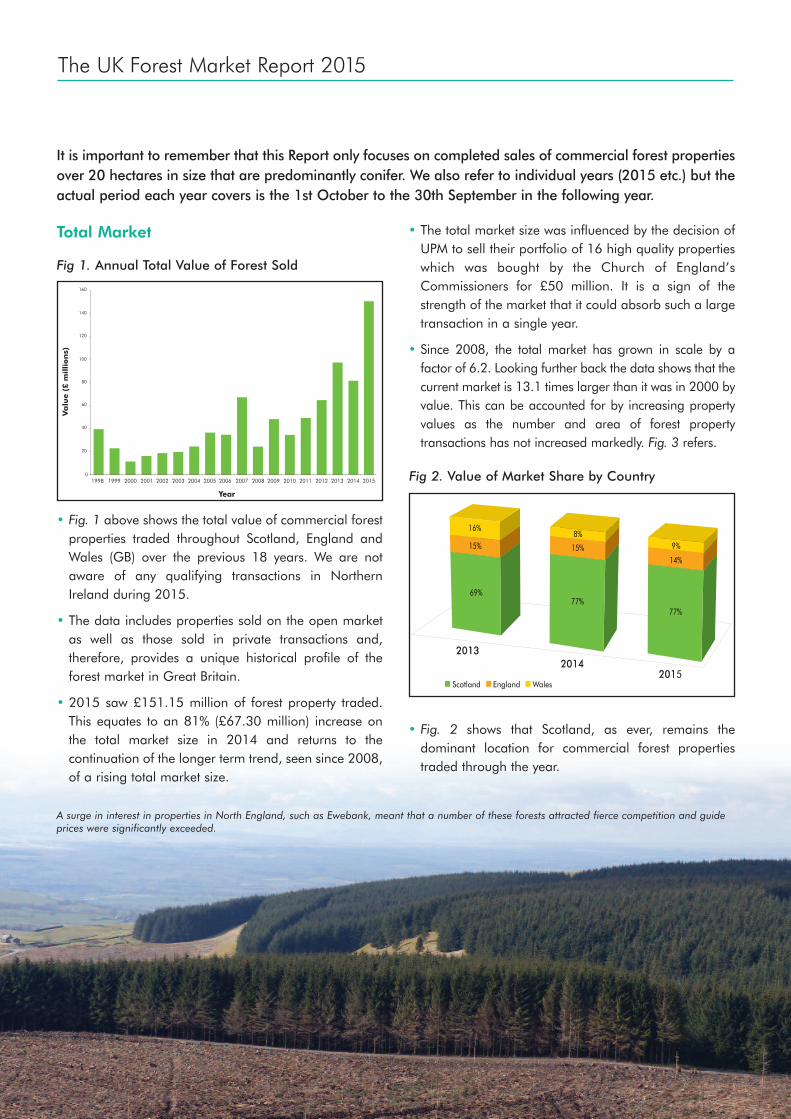
• Fig. 1 above shows the total value of commercial forestproperties traded throughout Scotland, England andWales (GB) over the previous 18 years. We are notaware of any qualifying transactions in NorthernIreland during 2015.
• The data includes properties sold on the open marketas well as those sold in private transactions and,therefore, provides a unique historical profile of theforest market in Great Britain.
• 2015 saw £151.15 million of forest property traded.This equates to an 81% (£67.30 million) increase onthe total market size in 2014 and returns to thecontinuation of the longer term trend, seen since 2008,of a rising total market size.
• The total market size was influenced by the decision ofUPM to sell their portfolio of 16 high quality propertieswhich was bought by the Church of England’sCommissioners for £50 million. It is a sign of thestrength of the market that it could absorb such a largetransaction in a single year.
• Since 2008, the total market has grown in scale by afactor of 6.2. Looking further back the data shows that thecurrent market is 13.1 times larger than it was in 2000 byvalue. This can be accounted for by increasing propertyvalues as the number and area of forest propertytransactions has not increased markedly. Fig. 3 refers.
• Fig. 2 shows that Scotland, as ever, remains thedominant location for commercial forest propertiestraded through the year.
Fig 1. Annual Total Value of Forest Sold
Va
lue (
£ m
illion
s)
1998 1999 2000 2001 2002 2003 2004 2005 2006 2007 2008 2009 2011 2012 2013 20142010
Year
0
20
40
60
80
100
120
140
160
2015 Fig 2. Value of Market Share by Country
2200113322001144
69%
15%
16%
77%
15%
8%
2200115
77%
14%
9%
Scotland England Wales
It is important to remember that this Report only focuses on completed sales of commercial forest propertiesover 20 hectares in size that are predominantly conifer. We also refer to individual years (2015 etc.) but theactual period each year covers is the 1st October to the 30th September in the following year.
A surge in interest in properties in North England, such as Ewebank, meant that a number of these forests attracted fierce competition and guideprices were significantly exceeded.
4www.johnclegg.co.uk www.tilhill.com
The UK Forest Market Report 2015
• 77% of the properties traded, by total value, were inScotland, the same proportion as in 2014. This is 4%up on Scotland’s average share of 73% since 2009.
• England and Wales’ shares have remained stable withEngland down 1% at 14% of total market, and Walesup 1% at 9% of total market traded in 2014. Over thelast three years (2013–2015) England’s share of thetotal market has averaged 15% whilst it was 23% in thethree years prior to that (2010–2012).
Market Analysis
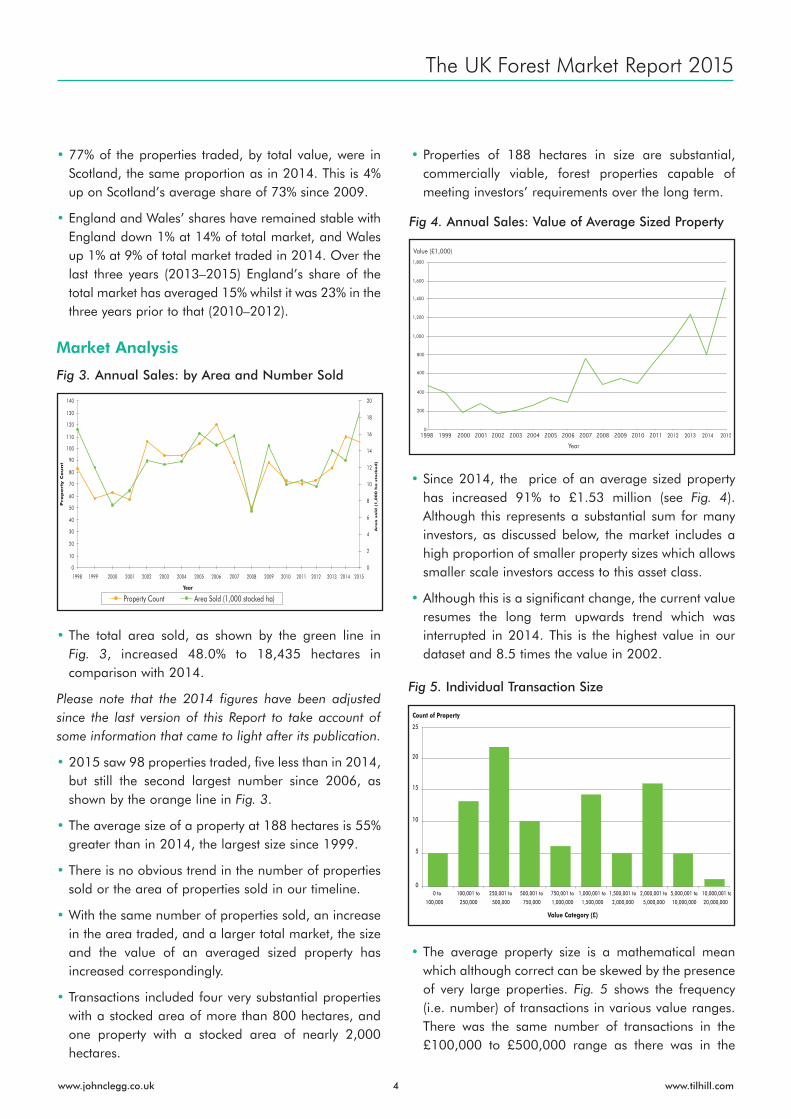
• The total area sold, as shown by the green line inFig. 3, increased 48.0% to 18,435 hectares incomparison with 2014.
Please note that the 2014 figures have been adjustedsince the last version of this Report to take account ofsome information that came to light after its publication.
• 2015 saw 98 properties traded, five less than in 2014,but still the second largest number since 2006, asshown by the orange line in Fig. 3.
• The average size of a property at 188 hectares is 55%greater than in 2014, the largest size since 1999.
• There is no obvious trend in the number of propertiessold or the area of properties sold in our timeline.
• With the same number of properties sold, an increasein the area traded, and a larger total market, the sizeand the value of an averaged sized property hasincreased correspondingly.
• Transactions included four very substantial propertieswith a stocked area of more than 800 hectares, andone property with a stocked area of nearly 2,000hectares.
• Properties of 188 hectares in size are substantial,commercially viable, forest properties capable ofmeeting investors’ requirements over the long term.
• Since 2014, the price of an average sized propertyhas increased 91% to £1.53 million (see Fig. 4).Although this represents a substantial sum for manyinvestors, as discussed below, the market includes ahigh proportion of smaller property sizes which allowssmaller scale investors access to this asset class.
• Although this is a significant change, the current valueresumes the long term upwards trend which wasinterrupted in 2014. This is the highest value in ourdataset and 8.5 times the value in 2002.
• The average property size is a mathematical meanwhich although correct can be skewed by the presenceof very large properties. Fig. 5 shows the frequency(i.e. number) of transactions in various value ranges.There was the same number of transactions in the£100,000 to £500,000 range as there was in the
Fig 3. Annual Sales: by Area and Number Sold
0
20
40
60
80
100
120
130
110
90
70
50
30
10
140
1998 1999 2000 2001 2002 2003 2004 2005 2006 2007 2008 2009 2010 2011 2013 2014 20152012
Year
Pro
pert
y C
ou
nt
0
2
4
6
8
10
12
14
16
18
20
Are
a s
old
(1,0
00 h
a s
tocked
)
Property Count Area Sold (1,000 stocked ha)
Fig 4. Annual Sales: Value of Average Sized Property
Value (£1,000)
Year
2012 2013 2014 2015
1,400
1,200
1,800
1,600
1,000
800
600
400
200
0
Fig 5. Individual Transaction Size
0 to
100,000
100,001 to
250,000
250,001 to
500,000
500,001 to
750,000
750,001 to
1,000,000
1,000,001 to
1,500,000
1,500,001 to
2,000,000
2,000,001 to
5,000,000
5,000,001 to
10,000,000
10,000,001 to
20,000,000
Count of Property
Value Category (£)
0
5
10
15
20
25
5www.johnclegg.co.uk www.tilhill.com
£1 million to £5 million range, but there has also beena significant proportion of very high value transactionsin 2015. These higher value transactions explain thehigher average price paid.
• The £100,000 to £500,000 categories account for36% of all the sales (by number of transactions) in theyear in contrast to 2014 when the same categoriesaccounted for 55%. 36% of all the transactions were forproperties between £1 million and £5 million (24% in2014) with 7% being over £5 million (1% in 2014).
• The average value of a hectare of commercial conifertraded in the year to October 2015 across the UK nowstands at £8,145 per hectare. This is 22% up on 2014(£6,653).
This is in line with the trend in forestry property values overthe last 10 years (which showed a small fall last year).
• This Report is based on actual transactions in a yearand is therefore generated using a different sample ofproperties every year. By contrast, the IPD Index usesthe same sample of forests each year. This index,which is based on a combination of valuations andtransactions, has reported continued increases inproperty prices. The Index shows an increase of 18.4%in the year ending 2014. (Source: www.ipd.com)
• A review of the properties sold shows that, comparedwith the previous year, a higher proportion were inhigher value areas such as South Scotland, wherebetter prices should be expected. The majority of theUPM Portfolio was located in the better areas of SouthScotland and Wales.
• The average value per hectare is now at the highestlevel recorded since our records started in 1998 andrepresents an annualised growth in value since 2002of 14.1%.
• The annualised growth rate of 14.1% illustrates thestrength of commercial forestry as an investment assetand positions it very favourably against a wide rangeof other asset classes.
• The Forestry Commission Timber Index tracks thevalue of all the timber sold by the ForestryCommission throughout the UK. The index illustratesthe trend and relative level of timber prices achievedthrough the year and is a good indicator ofconfidence within the timber industry.
• The Forestry Commission data is published twice ayear, March and September, and this data is shown inFig. 6 as a red line. The line plots the highest value of
Fig 6. Average Sale Price per Hectare and the FCConiferous Standing Sales Index
0
1,000
2,000
3,000
4,000
5,000
6,000
7,000
8,000
9,000
1998 1999 2000 2001 2002 2003 2004 2005 2006 2007 2008 2009 2010 2011 2012 2013 2014 2015
Year
Value (£/stocked ha)
0
20
40
60
80
100
120
140
160
180
200
FC Timber Index
Average Value (£/stocked ha) FC Timber Index (Fisher, nominal terms) LARGEST ANNUAL VALUE
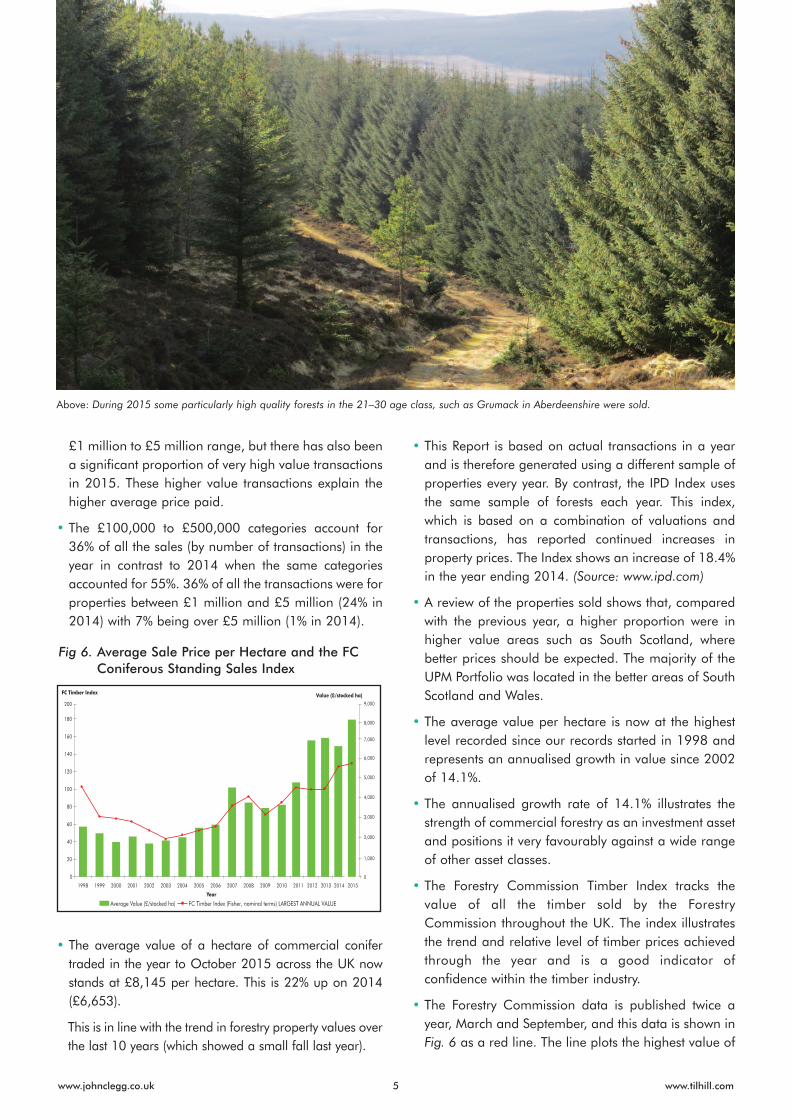
Above: During 2015 some particularly high quality forests in the 21–30 age class, such as Grumack in Aberdeenshire were sold.
6www.johnclegg.co.uk www.tilhill.com
The UK Forest Market Report 2015
the Fisher 5 Year Nominal Index recorded in the yearrather than each six-monthly value.
• The Index now stands 29.6% up on its position lastyear at a level equivalent to annualised growth since2002 of 6.7%.
• The long-term increase in value (since 2002) continuesto exceed the increase in timber values over the sameperiod. A more detailed discussion of standing conifertimber prices and their influencing factors can befound in the Tilhill Forestry Timber Bulletin published insummer 2015. A copy of this Bulletin can bedownloaded from the Publications section of the TilhillForestry website: www.tilhill.com.
• Some observers have commented on the way in which,over the last few years, forestry property prices haveincreased faster than published timber prices. A simpleexplanation for this is that forestry investors are nowusing lower return on capital expectations in theirinvestment appraisals. This partly reflects increasingconfidence in the sector, but also wider financialfactors, particularly long-run expectations of interestrates, returns from alternative investments, and a viewof real term increases in the value of land and timber.
• UK timber production in 2014 was a record 12.0 milliongreen tonnes, an increase of 4% on 2013 (the previousrecord). Over 95% of this comprises softwood timber.
During the last decade, UK timber production hasincreased from 8.7 million green tonnes to the currentlevel (38% increase). This has been entirely due to theincrease in private sector softwood production, which
has almost doubled. Over the same period, totalhardwood timber production and softwoodproduction from state forests have fallen slightly.
• Given the long-term nature of forest investments wemust be cautious about reacting to annual changesrather than tracking the longer term underlying trends.Increasing timber prices are good for the forestindustry and good for investors who want to increasecapital values. Properties with significant timberreserves will benefit from strengthening prices, despiteannual fluctuations, over the lifespan of the crop.
• A rise in the calculated property unit values reflects themarket as well as the nature of the particularproperties traded and their complex age andharvesting profiles. Each year the mix of property typeschanges as do their crop profiles, as we discuss below.
Demand Drivers
As we have reported in previous years, there is asignificant strengthening of interest, and allocation ofvalue, in more than just the current timber price, inparticular:
– The potential for log values (the most valuablecomponent of the growing tree) to rise considerably inthe medium to long term.
– A potential shortfall in available timber volumes, of allgrades and types, compared with expected demandlevels, especially in relation to wood for energyproduction. The Forestry Commission’s 50 yearForecast of softwood timber availability sees an
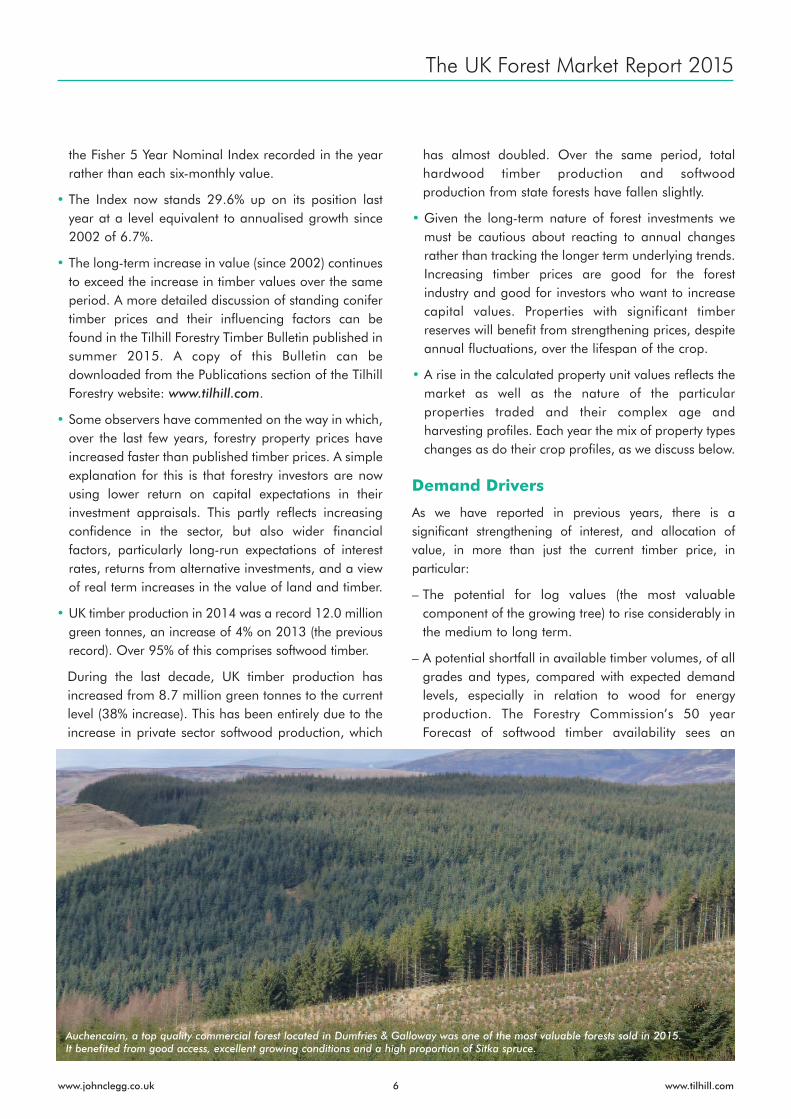
Auchencairn, a top quality commercial forest located in Dumfries & Galloway was one of the most valuable forests sold in 2015.It benefited from good access, excellent growing conditions and a high proportion of Sitka spruce.
7www.johnclegg.co.uk www.tilhill.com
The UK Forest Market Report 2015
increase in supply up to a peak in 2027–2031, afterwhich supply is forecast to drop off significantly.
– An appreciation of woodland as an asset backedinvestment, rather than simply as a nominal value asset.
– Increased values associated with land generally,especially farm land, and infrastructure.
We see no reason to change this view and ourperception over the year is of continuing strong demandfrom investors.
• Examination of the data at a national level as well asby property size helps us to get a better understandingof the factors that influence property values. Fig. 7shows this data.
• In Scotland, prices rise markedly as the property sizeincreases. The strongest category is for propertiesbetween 101 and 200 hectares which has an averagevalue of £8,497 per hectare. Larger properties arecheaper, which reflects the fact that they tend to belocated further north.
• England shows a steady increase in values by size class.In 2015, England has seen 6 properties sold in the‘greater than 100 hectare’ categories (against only 1 in2014). These have seen a good deal of interest andprices of up to 190% of guide price have been paid.
• English prices range from around the £10,800 to£12,800 per hectare level, far higher than those seenin Scotland or Wales. English properties in generalhave lower values for standing timber, so higher pricesreflect higher underlying land values. There is a highdegree of variation of underlying land values andstanding timber values in the English data.
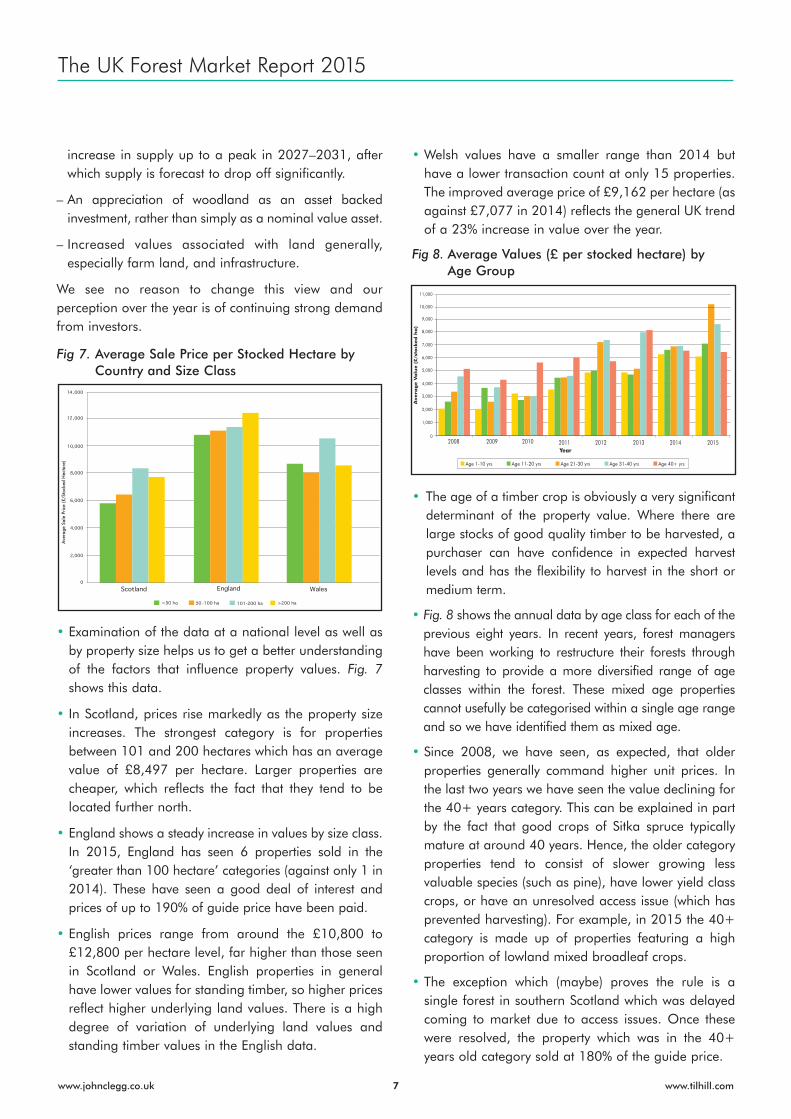
• Welsh values have a smaller range than 2014 buthave a lower transaction count at only 15 properties.The improved average price of £9,162 per hectare (asagainst £7,077 in 2014) reflects the general UK trendof a 23% increase in value over the year.
• The age of a timber crop is obviously a very significantdeterminant of the property value. Where there arelarge stocks of good quality timber to be harvested, apurchaser can have confidence in expected harvestlevels and has the flexibility to harvest in the short ormedium term.
• Fig. 8 shows the annual data by age class for each of theprevious eight years. In recent years, forest managershave been working to restructure their forests throughharvesting to provide a more diversified range of ageclasses within the forest. These mixed age propertiescannot usefully be categorised within a single age rangeand so we have identified them as mixed age.
• Since 2008, we have seen, as expected, that olderproperties generally command higher unit prices. Inthe last two years we have seen the value declining forthe 40+ years category. This can be explained in partby the fact that good crops of Sitka spruce typicallymature at around 40 years. Hence, the older categoryproperties tend to consist of slower growing lessvaluable species (such as pine), have lower yield classcrops, or have an unresolved access issue (which hasprevented harvesting). For example, in 2015 the 40+category is made up of properties featuring a highproportion of lowland mixed broadleaf crops.
• The exception which (maybe) proves the rule is asingle forest in southern Scotland which was delayedcoming to market due to access issues. Once thesewere resolved, the property which was in the 40+years old category sold at 180% of the guide price.
Fig 8. Average Values (£ per stocked hectare) byAge Group
2008 2009 2010 2011 2012 2013 2014 2015Year
Age 1-10 yrs Age 11-20 yrs Age 21-30 yrs Age 31-40 yrs Age 40+ yrs
0
1,000
2,000
3,000
4,000
5,000
6,000
7,000
8,000
9,000
10,000
11,000
Avera
ge V
alu
e (
£/s
tock
ed
ha
)
Fig 7. Average Sale Price per Stocked Hectare byCountry and Size Class
<50 ha 50
Ave
rage
Sal
e Pr
ice
(£/S
tock
ed H
ecta
re)
8www.johnclegg.co.uk www.tilhill.com
The UK Forest Market Report 2015
• In 2015, we have seen a peak in prices for thoseproperties in the 21–30 years age group. This is hardto explain, but may be due to a forecast drop in timberavailability at around the time these properties are dueto harvest.
• The influence of property size can have a significantimpact on the unit value of a property. Generally,larger properties command lower unit values thansmaller ones.
• Fig. 9 shows the relationship between property sizeand unit value over the 15-year period from 2000 to2015. Since 2006, the relationship has not alwaysfollowed the expected pattern, with large (>200hectare) properties achieving the highest unit values in2007 and 2012.
• In 2014, we saw a narrowing of the range of unitprices for all size classes down to £1,000 per hectare.In 2015, unit prices have all increased and the rangehas expanded to £1,553 per hectare although therelative positions of the size classes are the same. Asnoted above however, it is the 100–200 hectare sizeclass which commands the best average prices overall.
• Note that this survey sets a minimum size limit of 20hectares. Unit prices per hectare increase markedlybelow this point.
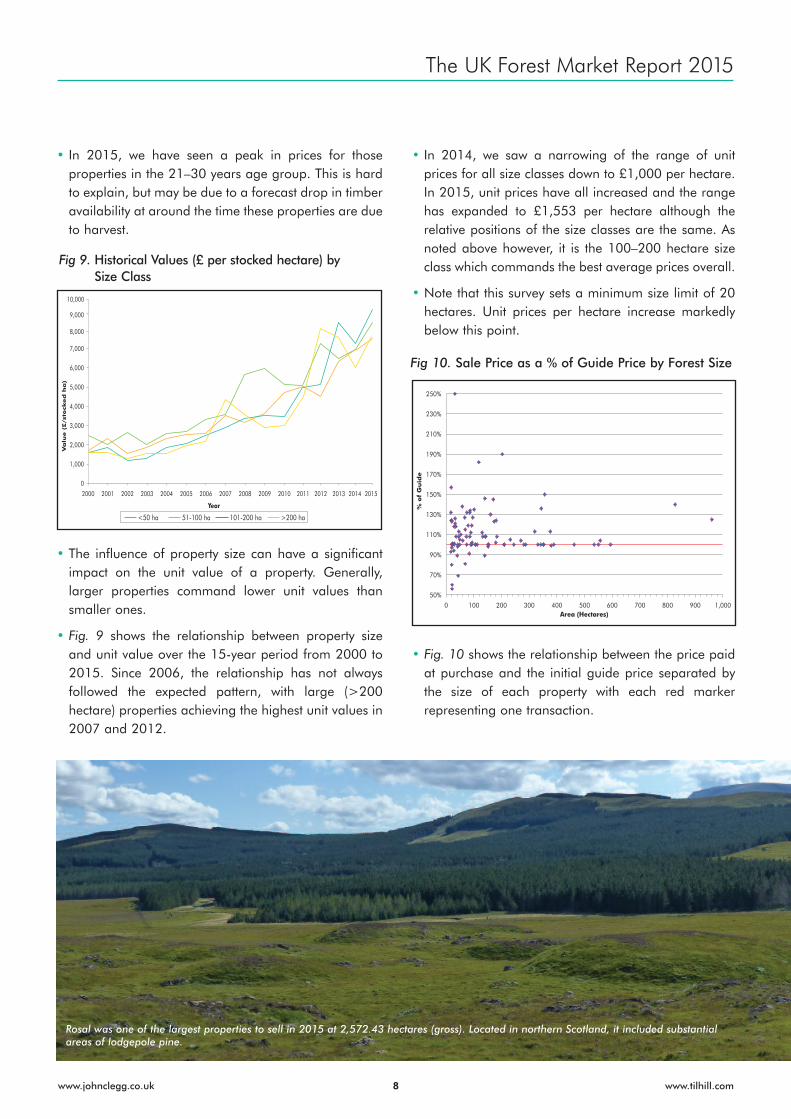
• Fig. 10 shows the relationship between the price paidat purchase and the initial guide price separated bythe size of each property with each red markerrepresenting one transaction.
Fig 9. Historical Values (£ per stocked hectare) bySize Class
0
1,000
2,000
3,000
4,000
5,000
6,000
7,000
8,000
9,000
10,000
2000 2001 2002 2003 2004 2005 2006 2007 2008 2009 2010 2011 2012 2013 2014 2015
Year
Va
lue (
£/s
tock
ed
ha
)
<50 ha 51-100 ha 101-200 ha >200 ha
Fig 10. Sale Price as a % of Guide Price by Forest Size
50%
70%
90%
110%
130%
150%
170%
190%
210%
230%
250%
0 100 200 300 400 500 600 700 800 900 1,000Area (Hectares)
% o
f G
uid
e
Rosal was one of the largest properties to sell in 2015 at 2,572.43 hectares (gross). Located in northern Scotland, it included substantialareas of lodgepole pine.
The UK Forest Market Report 2015
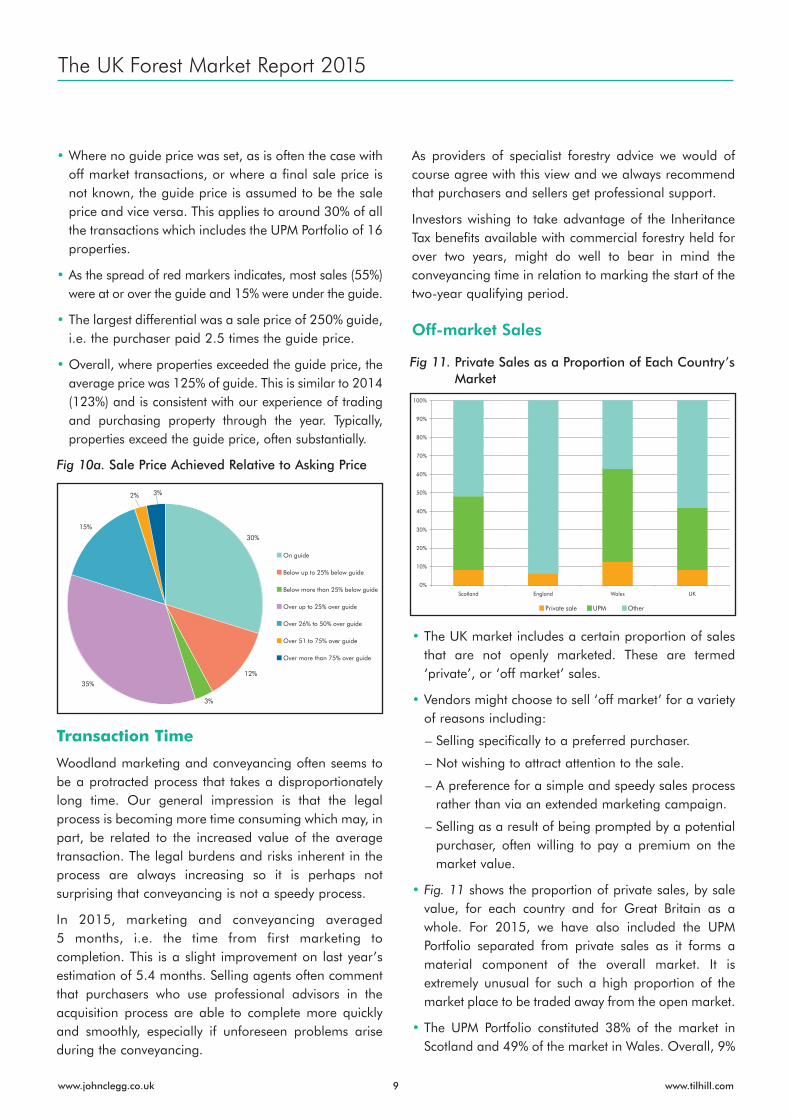
• Where no guide price was set, as is often the case withoff market transactions, or where a final sale price isnot known, the guide price is assumed to be the saleprice and vice versa. This applies to around 30% of allthe transactions which includes the UPM Portfolio of 16properties.
• As the spread of red markers indicates, most sales (55%)were at or over the guide and 15% were under the guide.
• The largest differential was a sale price of 250% guide,i.e. the purchaser paid 2.5 times the guide price.
• Overall, where properties exceeded the guide price, theaverage price was 125% of guide. This is similar to 2014(123%) and is consistent with our experience of tradingand purchasing property through the year. Typically,properties exceed the guide price, often substantially.
Transaction Time
Woodland marketing and conveyancing often seems tobe a protracted process that takes a disproportionatelylong time. Our general impression is that the legalprocess is becoming more time consuming which may, inpart, be related to the increased value of the averagetransaction. The legal burdens and risks inherent in theprocess are always increasing so it is perhaps notsurprising that conveyancing is not a speedy process.
In 2015, marketing and conveyancing averaged5 months, i.e. the time from first marketing tocompletion. This is a slight improvement on last year’sestimation of 5.4 months. Selling agents often commentthat purchasers who use professional advisors in theacquisition process are able to complete more quicklyand smoothly, especially if unforeseen problems ariseduring the conveyancing.
As providers of specialist forestry advice we would ofcourse agree with this view and we always recommendthat purchasers and sellers get professional support.
Investors wishing to take advantage of the InheritanceTax benefits available with commercial forestry held forover two years, might do well to bear in mind theconveyancing time in relation to marking the start of thetwo-year qualifying period.
Off-market Sales
• The UK market includes a certain proportion of salesthat are not openly marketed. These are termed‘private’, or ‘off market’ sales.
• Vendors might choose to sell ‘off market’ for a varietyof reasons including:
– Selling specifically to a preferred purchaser.
– Not wishing to attract attention to the sale.
– A preference for a simple and speedy sales processrather than via an extended marketing campaign.
– Selling as a result of being prompted by a potentialpurchaser, often willing to pay a premium on themarket value.
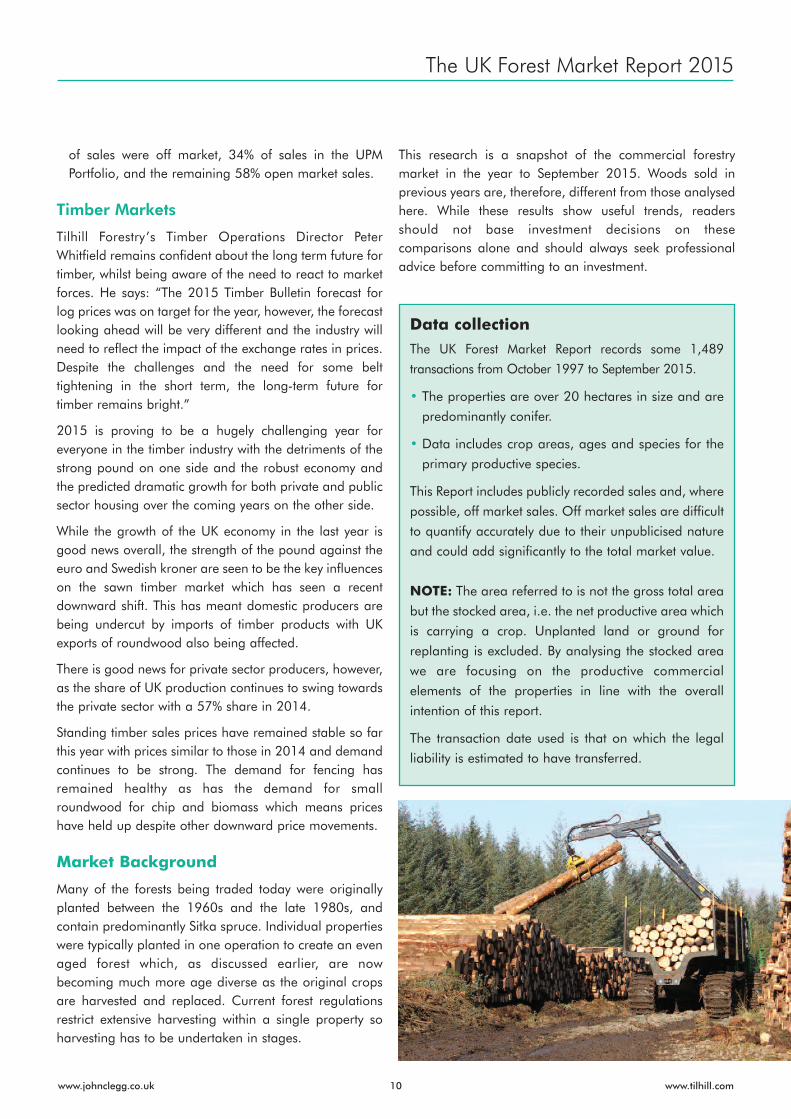
• Fig. 11 shows the proportion of private sales, by salevalue, for each country and for Great Britain as awhole. For 2015, we have also included the UPMPortfolio separated from private sales as it forms amaterial component of the overall market. It isextremely unusual for such a high proportion of themarket place to be traded away from the open market.
• The UPM Portfolio constituted 38% of the market inScotland and 49% of the market in Wales. Overall, 9%
30%
12%
3%
35%
15%
2% 3%
On guide
Below up to 25% below guide
Below more than 25% below guide
Over up to 25% over guide
Over 26% to 50% over guide
Over 51 to 75% over guide
Over more than 75% over guide
Fig 10a. Sale Price Achieved Relative to Asking Price
0%
10%
20%
30%
40%
50%
60%
70%
80%
90%
100%
Scotland England Wales UK
Private sale UPM Other
Fig 11. Private Sales as a Proportion of Each Country’sMarket
9www.johnclegg.co.uk www.tilhill.com
10www.johnclegg.co.uk www.tilhill.com
The UK Forest Market Report 2015
of sales were off market, 34% of sales in the UPMPortfolio, and the remaining 58% open market sales.
Timber Markets
Tilhill Forestry’s Timber Operations Director PeterWhitfield remains confident about the long term future fortimber, whilst being aware of the need to react to marketforces. He says: “The 2015 Timber Bulletin forecast forlog prices was on target for the year, however, the forecastlooking ahead will be very different and the industry willneed to reflect the impact of the exchange rates in prices.Despite the challenges and the need for some belttightening in the short term, the long-term future fortimber remains bright.”
2015 is proving to be a hugely challenging year foreveryone in the timber industry with the detriments of thestrong pound on one side and the robust economy andthe predicted dramatic growth for both private and publicsector housing over the coming years on the other side.
While the growth of the UK economy in the last year isgood news overall, the strength of the pound against theeuro and Swedish kroner are seen to be the key influenceson the sawn timber market which has seen a recentdownward shift. This has meant domestic producers arebeing undercut by imports of timber products with UKexports of roundwood also being affected.
There is good news for private sector producers, however,as the share of UK production continues to swing towardsthe private sector with a 57% share in 2014.
Standing timber sales prices have remained stable so farthis year with prices similar to those in 2014 and demandcontinues to be strong. The demand for fencing hasremained healthy as has the demand for smallroundwood for chip and biomass which means priceshave held up despite other downward price movements.
Market Background
Many of the forests being traded today were originallyplanted between the 1960s and the late 1980s, andcontain predominantly Sitka spruce. Individual propertieswere typically planted in one operation to create an evenaged forest which, as discussed earlier, are nowbecoming much more age diverse as the original cropsare harvested and replaced. Current forest regulationsrestrict extensive harvesting within a single property soharvesting has to be undertaken in stages.
This research is a snapshot of the commercial forestrymarket in the year to September 2015. Woods sold inprevious years are, therefore, different from those analysedhere. While these results show useful trends, readersshould not base investment decisions on thesecomparisons alone and should always seek professionaladvice before committing to an investment.
Data collectionThe UK Forest Market Report records some 1,489
transactions from October 1997 to September 2015.
• The properties are over 20 hectares in size and are
predominantly conifer.
• Data includes crop areas, ages and species for the
primary productive species.
This Report includes publicly recorded sales and, where
possible, off market sales. Off market sales are difficult
to quantify accurately due to their unpublicised nature
and could add significantly to the total market value.
NOTE: The area referred to is not the gross total areabut the stocked area, i.e. the net productive area which
is carrying a crop. Unplanted land or ground for
replanting is excluded. By analysing the stocked area
we are focusing on the productive commercial
elements of the properties in line with the overall
intention of this report.
The transaction date used is that on which the legal
liability is estimated to have transferred.
England and Wales
Scotland and Northern England
Scotland and Northern England
Wales and Southern England
Central Borders and England
Jason SindenTel: 01387 711211Mob: 07768 [email protected]
Peter ChappellTel: 01550 721442Mob: 07825 [email protected]
Bruce RichardsonTel: 01387 711211Mob: 07789 [email protected]
Fenning WelsteadTel: 0131 2298800Mob: 07836 [email protected]
Jon LambertTel: 0131 2298800Mob: 07778 [email protected]
Patrick PorteousTel: 0131 2298800Mob: 07789 [email protected]
John CleggTel: 01844 291384Mob: 07702 [email protected]
Mike TustinTel: 01844 291384Mob: 07500 [email protected]
Erik OdendaalTel: 01387 711211Mob: 07500 [email protected]
Shaun MochanTel: 01786 821666Mob: 07703 [email protected]
Scotland
Scotland
England and Wales
Head of Investment and Property (UK) Scotland and Northern England
www.johnclegg.co.uk TFL0
107
–11
.15
www.tilhill.com