Embed Size (px)
Citation preview
Evaluation of the Quality and Changes in UK Forest soils
Elena Vanguelova
Centre for Forestry and Climate Change
Forest Research, UK
BioSoil, Brussels, 9 November, 2009
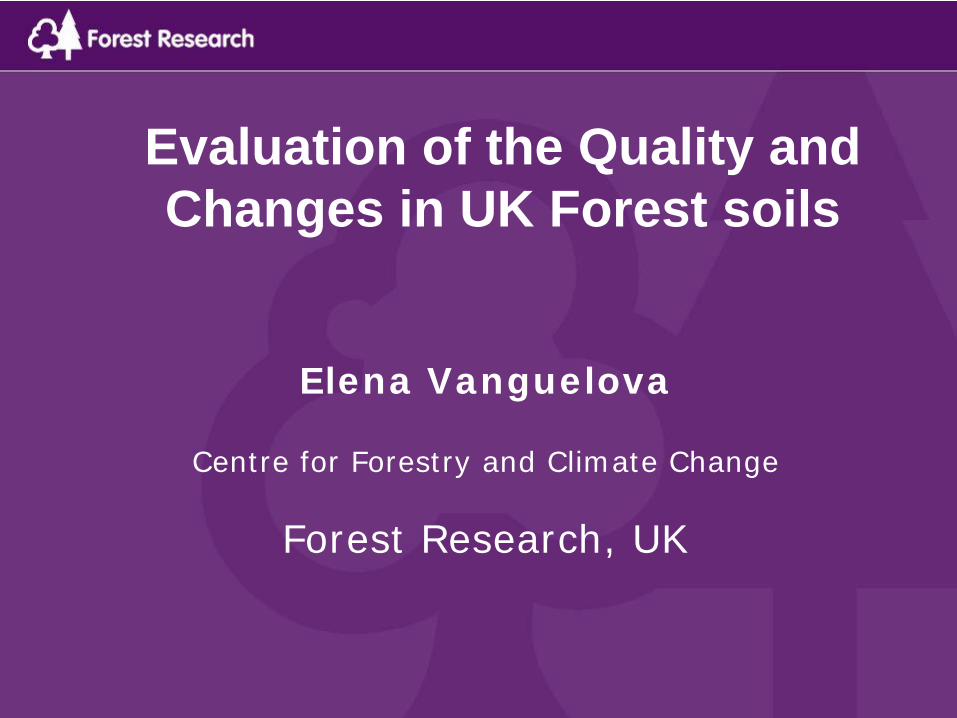
Soil quality in UK forestry
Soil Sustainability ResearchStrategy
Forest Management Practices
•Whole Tree harvesting•Short Rotation Forestry•Continuous Cover Forestry•Brash Management•Wood Ash Application
Climate change and C sequestration
•Forest C balance•Soil C stocks and changes•Peat soils
Atmospheric pollution (acidification and eutrophication)
•Critical Loads•N and forest edge effect•Belowground tree responses•Soil acidification/recovery
Soil Quality Indicators•Chemical•Physical•Biological
Forest soil monitoring
•Level I•Level II•BioSoil
BioSoil, Brussels, 9 November, 2009
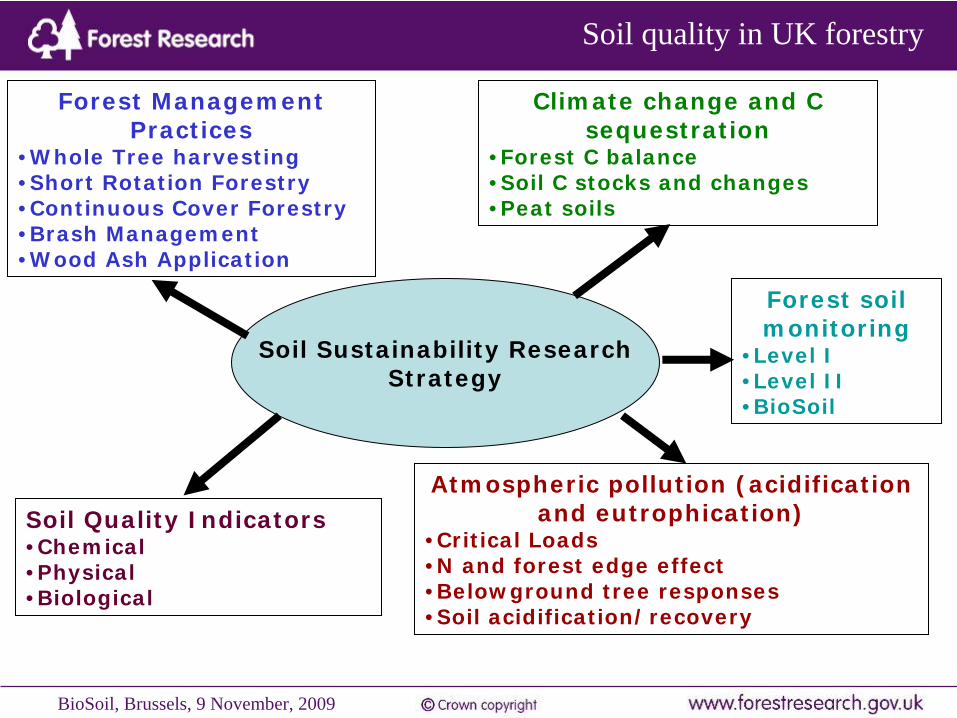
Soil quality in UK forestry
Processes and cycling in Forest Ecosystems
BioSoil, Brussels, 9 November, 2009
Soil quality in UK forestry
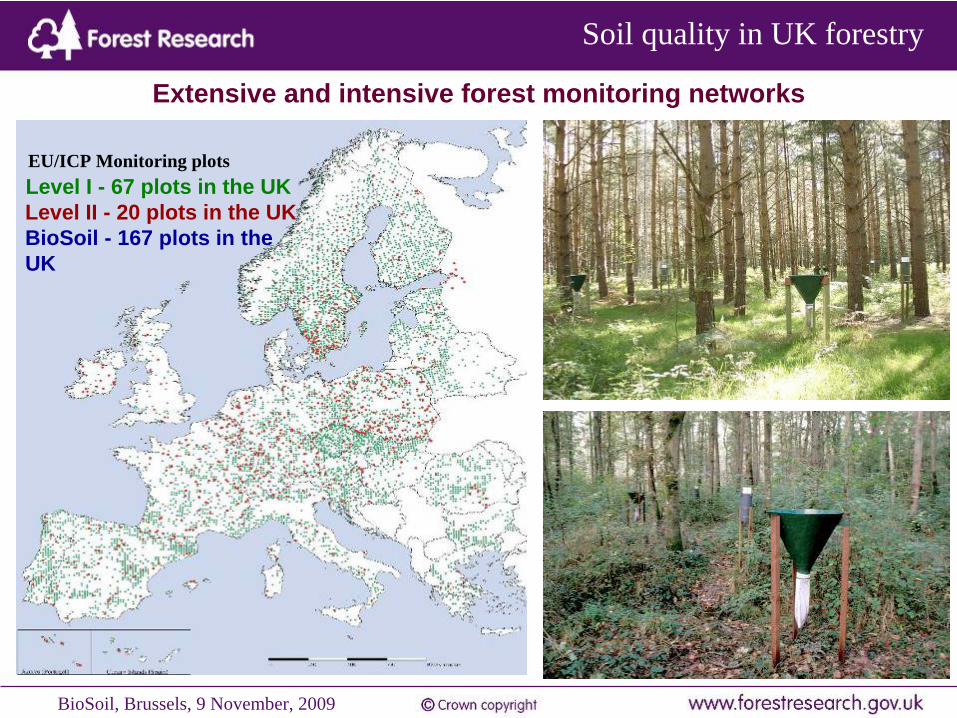
Extensive and intensive forest monitoring networks
Level II - 20 plots in the UKBioSoil - 167 plots in the UK
EU/ICP Monitoring plotsLevel I - 67 plots in the UK
BioSoil, Brussels, 9 November, 2009
Soil quality in UK forestry
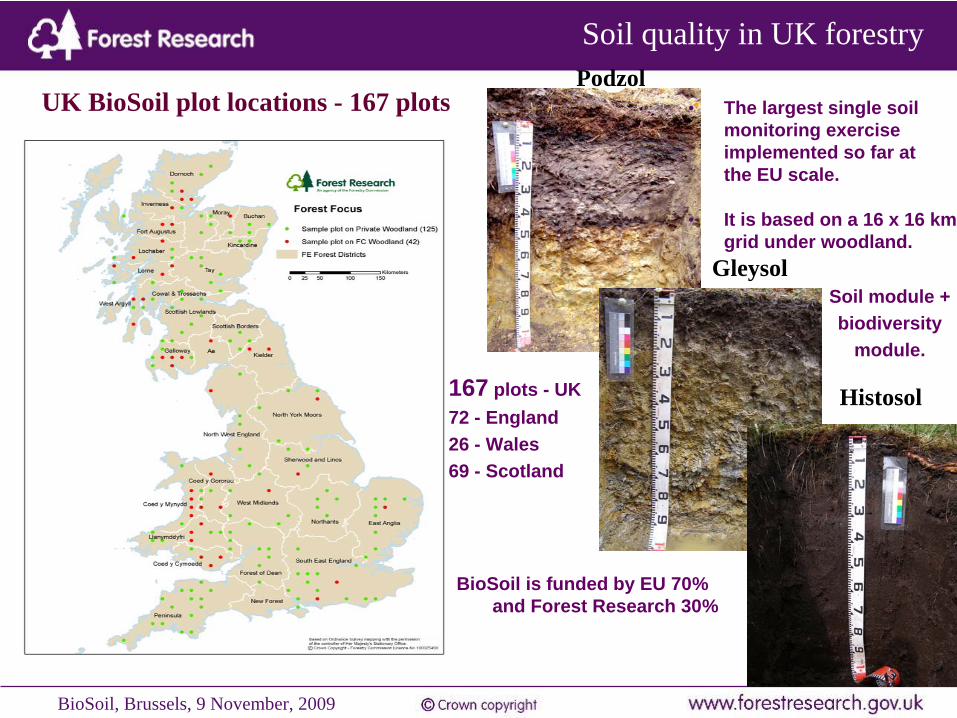
UK BioSoil plot locations - 167 plots
Gleysol
Podzol
Histosol
• The largest single soil monitoring exercise implemented so far at the EU scale.
Soil module + biodiversity
module.
• It is based on a 16 x 16 km grid under woodland.
167 plots - UK72 - England 26 - Wales 69 - Scotland
BioSoil is funded by EU 70% and Forest Research 30%

BioSoil, Brussels, 9 November, 2009
Soil quality in UK forestry
BioSoil aims and objectives• To establish an improved common European baseline of forest
soils for environmental applications (e.g. acidification and/or eutrophication; C stock assessments, impacts of climate changes)
• To finalise the common European methodology for forest soil monitoring and to upgrade the quality of the existing forest soil database and its evaluation
• To improve the existing QA/QC strategy for European forest soil condition survey
• To quantify spatial variability on the basis of information available and supplementary field experiments.
• To detect and explain temporal changes in forest soils.
• To evaluate the applicability of the methodology adopted by the European forest soil monitoring programme before setting up the monitoring for other land use types

BioSoil, Brussels, 9 November, 2009
Soil quality in UK forestry

BioSoil, Brussels, 9 November, 2009
Soil quality in UK forestry
BioSoil, Brussels, 9 November, 2009
Soil quality in UK forestry
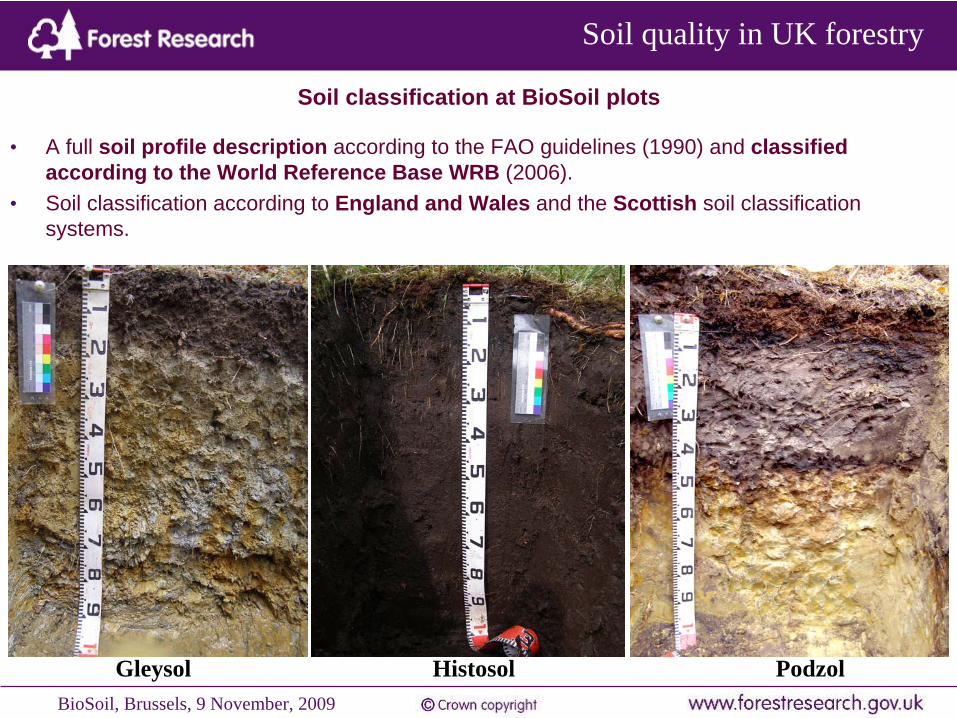
Soil classification at BioSoil plots
• A full soil profile description according to the FAO guidelines (1990) and classified according to the World Reference Base WRB (2006).
• Soil classification according to England and Wales and the Scottish soil classification systems.
Gleysol Histosol Podzol

BioSoil, Brussels, 9 November, 2009
Soil quality in UK forestry
Measurements and analyses are performed on:1)organic soil horizons and 2) the mineral soil layers and soil depths 0-5 cm, 5-10 10-20 cm, 20-40 cm and 40-80 cm.
• Analyses performed at National level by laboratories that performed well in interlaboratory comparison exercises following the analytical procedures described in the EU soil manual. A 20 %of plots samples from benchmark BioSoil sites analysed in parallel by a central European laboratory.
Main Soil Analysis in BioSoil
Oxalate extractable Al and Fe
Total elements
Aqua regia
Exchangeable cations, acidity & H+
Modified Kjeldalh N
Total NOrganic CarbonCarbonatespHParticle size analysisSoil moisture content
Bulk density
BioSoil, Brussels, 9 November, 2009
Soil quality in UK forestry
0
5
10
15
20
25
30
35
40
45
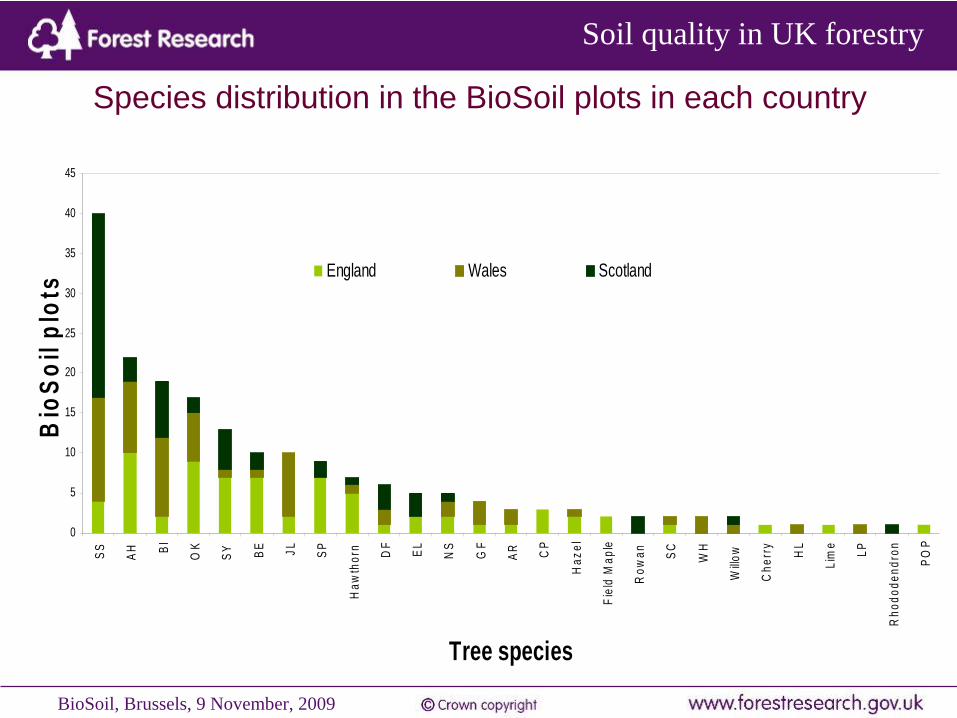
SS AH BI OK
SY BE JL SP
Haw
thor
n DF EL NS
GF
AR CP
Haz
el
Fiel
d M
aple
Row
an SC WH
Willo
w
Che
rry
HL
Lim
e LP
Rho
dode
ndro
n
POP
Tree species
Bio
Soil
plot
s England Wales Scotland
Species distribution in the BioSoil plots in each country

BioSoil, Brussels, 9 November, 2009
Soil quality in UK forestry
• Forest management practices that disturb the soil can promote carbon loss while climate change can have both positive and negative impacts
Why we need to monitor and evaluate forest soil C ?
• Forest soils represent a major carbon store with carbon stocks exceeding those under most other land uses so the stability of this store is of primary importance to climate change mitigation
• Global warming rising CO2 levels in the atmosphere can enhance forest growth, which in turn could increase soil organic matter through greater litter input
• Conversely, increasing soil temperatures are predicted to promote microbial activity and therefore decomposition and loss of soil organic matter.
The balance of these processes remains uncertain

BioSoil, Brussels, 9 November, 2009
Soil quality in UK forestry
Carbon Pools in UK Forests (Million Tonnes)
150
640
80 trees
soil and litter
timber & woodproducts

BioSoil, Brussels, 9 November, 2009
Soil quality in UK forestry
CARBON STOCKS: Soil carbon stocks (t C ha-1) at the BioSoil sites for each main soil group
Deep peats > Peaty gleys/Podzols > Rankers and redzinas > Ground water gleys > Surface water gleys > Podzols > Brown earths
Vanguelova et al, 2009
Soil type Brown Earths Podzols and Surface water Ground water Rankers and Peaty gleys/ Deep peats68 Ironpans 10 gleys 13 gleys 9 rendzinas 3 Podzols 32 12
Soil depth 0-5 cm 24 22 27 24 50 41 315-10 cm 15 15 18 16 24 36 3310-20 cm 25 29 27 35 37 61 6720-40cm 37 39 34 43 48 102 13540-80 cm 34 32 40 37 18 81 182Total (0-80 cm) 135 138 147 152 162 313 435

BioSoil, Brussels, 9 November, 2009
Soil quality in UK forestry
0
50
100
150
200
250
300
350
400
450
500
Brown E
arths
Podzo
ls an
d Iron
pans
Surfac
e wate
r gley
sGrou
nd w
ater g
leys
Rendz
inas a
nd ra
nkers
Peaty
gleys
/podz
ols
Deep p
eats
Soil type
Soil
C s
tock
(t C
ha-1
)
CARBON STOCKS: Variability of soil C stock in each soil group
Vanguelova et al, 2009
Forest soil C stocks related to peat layer depth
0
50
100
150
200
250
300
350
400
450
500
0 20 40 60 80 100
Peat depth (cm)So
il C
sto
ck (t
C h
a-1)
BioSoil, Brussels, 9 November, 2009
Soil quality in UK forestry
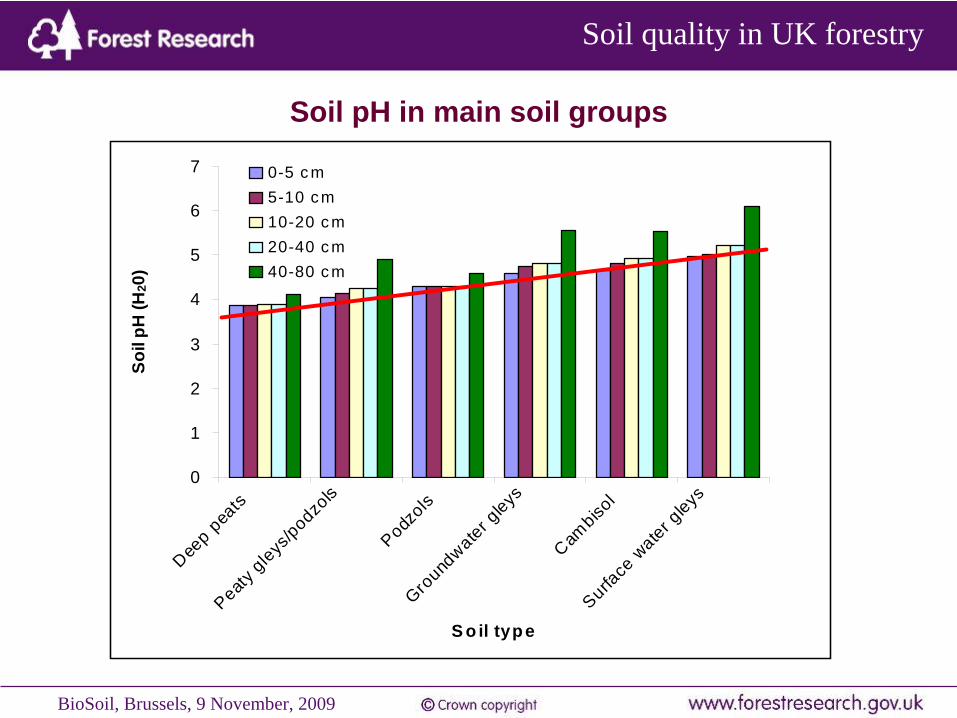
Soil pH in main soil groups
0
1
2
3
4
5
6
7
Deep p
eats
Peaty gleys
/podzols
Podzols
Ground
water gleys
Cambiso
lSurfa
ce w
ater gleys
S o il type
Soil
pH (H
20)
0-5 c m5-10 cm10-20 c m20-40 c m40-80 c m
BioSoil, Brussels, 9 November, 2009
Soil quality in UK forestry
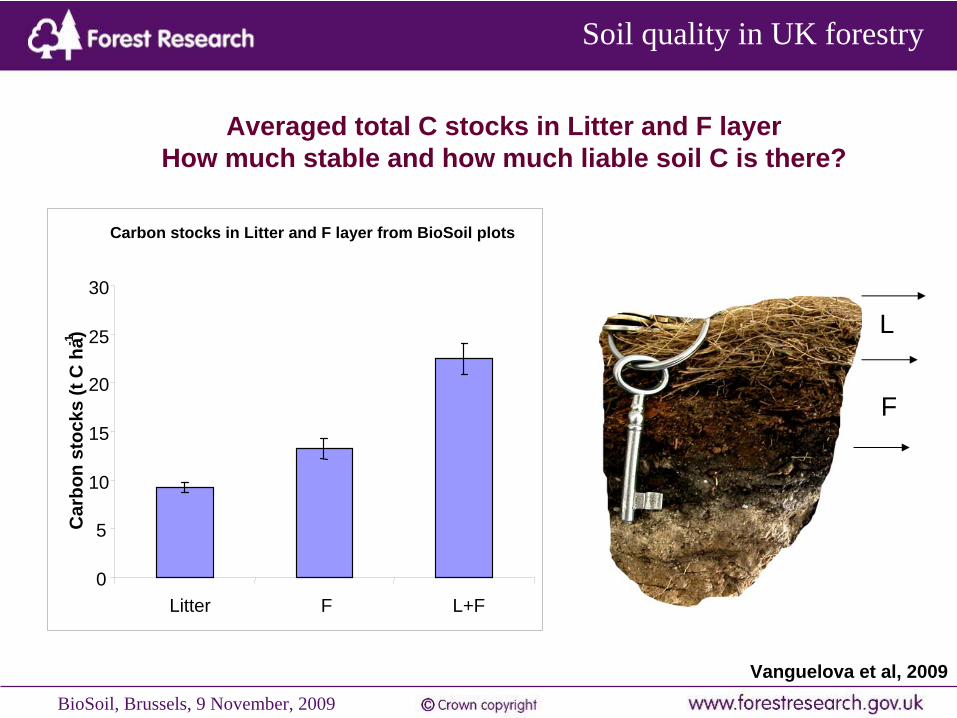
Averaged total C stocks in Litter and F layerHow much stable and how much liable soil C is there?
Carbon stocks in Litter and F layer from BioSoil plots
0
5
10
15
20
25
30
Litter F L+F
Car
bon
stoc
ks (t
C h
a-1 )
Vanguelova et al, 2009
L
F
BioSoil, Brussels, 9 November, 2009
Soil quality in UK forestry
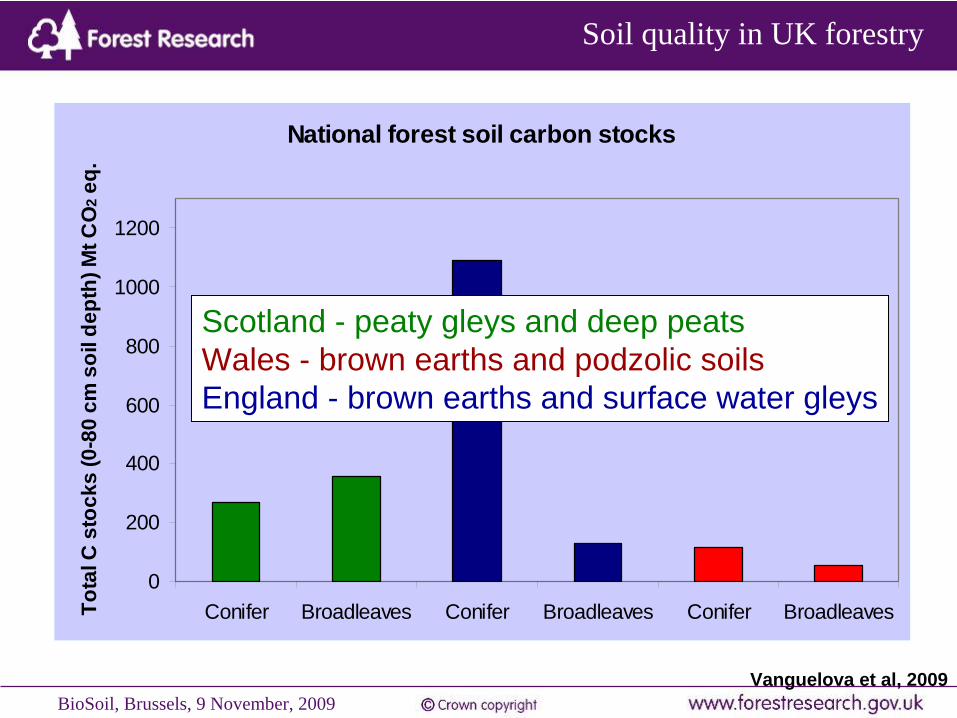
National forest soil carbon stocks
0
200
400
600
800
1000
1200
Conifer Broadleaves Conifer Broadleaves Conifer BroadleavesTota
l C s
tock
s (0
-80
cm s
oil d
epth
) Mt C
O2 e
q.
Scotland WalesEngland
Scotland - peaty gleys and deep peatsWales - brown earths and podzolic soilsEngland - brown earths and surface water gleys
Vanguelova et al, 2009

BioSoil, Brussels, 9 November, 2009
Soil quality in UK forestryCHANGES: Soil carbon change under broadleaved woodland from the
ECN Oak sites (1994, 1999 and 2004) and chronosequence study
Benham, 2008
Soil depth
Soil horizon
Soil C accumulation rate between 0.2-0.3 t/ha/a
Pitman et al, 2009
Soil C density in 0-15 cm mineral soil in Alice Holt Forest
20.0
25.0
30.0
35.0
40.0
45.0
50.0
55.0
60.0
young mid-rot old
oak
Car
bon
t ha-1
BioSoil, Brussels, 9 November, 2009
Soil quality in UK forestry
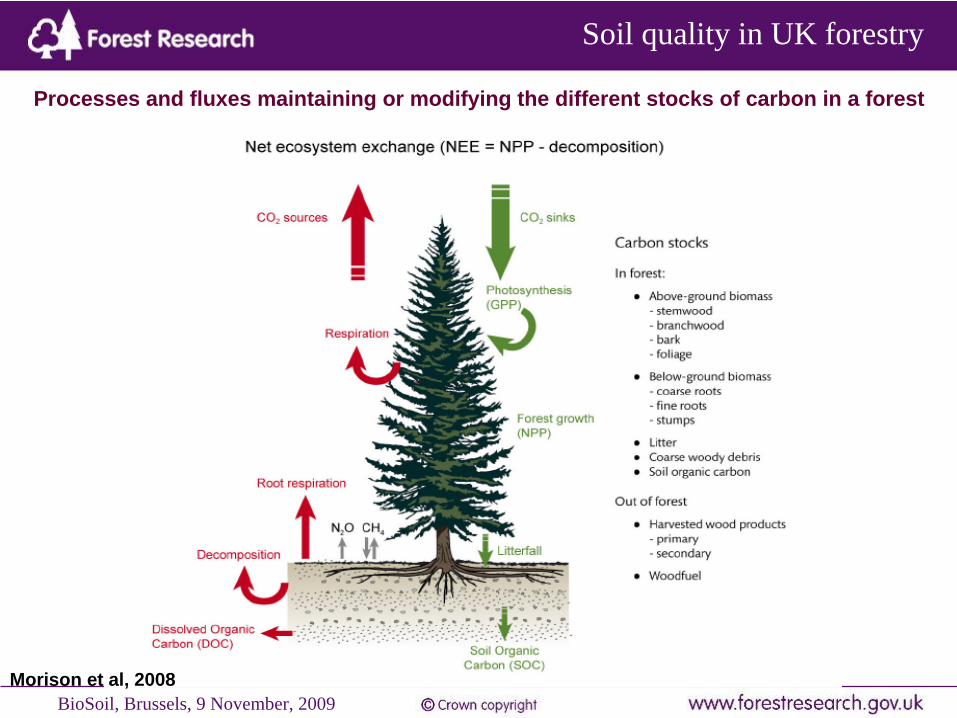
Morison et al, 2008
Processes and fluxes maintaining or modifying the different stocks of carbon in a forest

BioSoil, Brussels, 9 November, 2009
Soil quality in UK forestry
Standard thin & fell, 50 year rotation
Minimum Intervention
Afforestation: Sitka spruce, peaty gley, YC 12, previously grassland

BioSoil, Brussels, 9 November, 2009
Soil quality in UK forestry
Standard thin & fell, 80 year rotation
Minimum Intervention
Afforestation: oak, brown earths, YC 6, previously grassland

BioSoil, Brussels, 9 November, 2009
Soil quality in UK forestryTime averaged C stocks in key forest components (and associatedharvested wood products) for a Forest Management cycle
First rotation yield class 12 Sitka spruce, managed for production (thinning and felling) on a 35 year rotation, in t CO2 eq ha-1
First rotation yield class 4 oak managed for minimum intervention, in t CO2 eq ha-1.
Morison et al, 2008

BioSoil, Brussels, 9 November, 2009
Soil quality in UK forestryBioSoil plots in UK
Peaty Gleysoil
Coniferous Broadleaf
Pressure on forest soils in UK

BioSoil, Brussels, 9 November, 2009
Soil quality in UK forestry
Current guidelines for best practices in the UK
Future directions and needs:1) Comprehensive scientific underpinning 2) Site specific soil nutrient balances3) National mapping of forest
nutrient balances
S o il g ro u pS o il
ty p e
G ro u n d
d a m a g e
S o il
ca rb o n
l
S o il
in fe rtility
S o il
a c id if ica tio n
C o m b in e d
R is k
B row n ea rth s 1 , 1 d , u L L L L L
1 z L L M M M
Pod zo ls 3 , 3m L L H H H
3 p M * * M H H H
Ironpan so ils 4 , 4 p M * * M M M M * *
4 b M L M M M
4 z, 4 e M L H H H
C a lca reous so ils 1 2 b , t L L L L L
1 2 a L L H * L H *
G round -w a te r 5 M L L L M
5 p M * * M L L M * *
Pea ty g le ys 6 M M M M M
6 z M M H H H
6 p H M M M H
Su rface -w a te r 7 , 7 b M L L M M
7 z M L M M M
Ju n c u s b og s 8 a , b , H H L L H
M o lin ia b og s 9 a , b H H M M H
9 c, d , e H H H H H
U n flushed 1 1 a , b , H H H H H
R anke rs 1 3 b , z L L H H H
1 3 g M L H H H
1 3 p M M H H H
Ske le ta l so ils 1 3 s L L H H H
L itto ra l so ils 1 5 s , d , L L H H H
1 5 g , w H L H H H
L: low r isk ; M : m ed ium r isk ; H : h igh r isk . *O n ly fo r con ife r s tands , o th e rw iselow r isk . ** 3p , 4p and 5p a re h igh r isk w he re the dep th o f the p ea ty su r fa celaye r is > 25 cm .
Site suitability
BioSoil, Brussels, 9 November, 2009
Soil quality in UK forestry
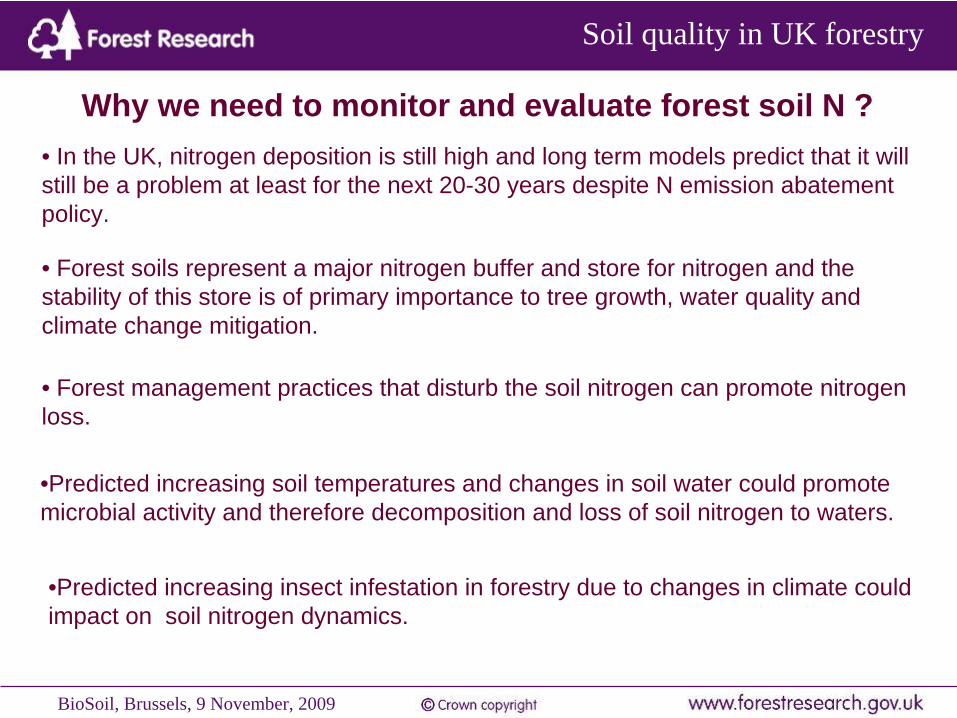
• Forest management practices that disturb the soil nitrogen can promote nitrogen loss.
Why we need to monitor and evaluate forest soil N ?
• Forest soils represent a major nitrogen buffer and store for nitrogen and the stability of this store is of primary importance to tree growth, water quality and climate change mitigation.
• In the UK, nitrogen deposition is still high and long term models predict that it will still be a problem at least for the next 20-30 years despite N emission abatement policy.
•Predicted increasing soil temperatures and changes in soil water could promote microbial activity and therefore decomposition and loss of soil nitrogen to waters.
•Predicted increasing insect infestation in forestry due to changes in climate could impact on soil nitrogen dynamics.

BioSoil, Brussels, 9 November, 2009
Soil quality in UK forestry
SOIL NITROGEN STOCKS: Variability of soil N stock in each soil group
0
5
10
15
20
25
Podzo
lsGrou
nd w
ater g
leys
Cambis
olSurf
ace w
ater g
leys
Peaty
gleys
/podz
ols
Deep p
eats
Soil type
Soil
N s
tock
(t h
a-1)
BioSoil, Brussels, 9 November, 2009
Soil quality in UK forestry
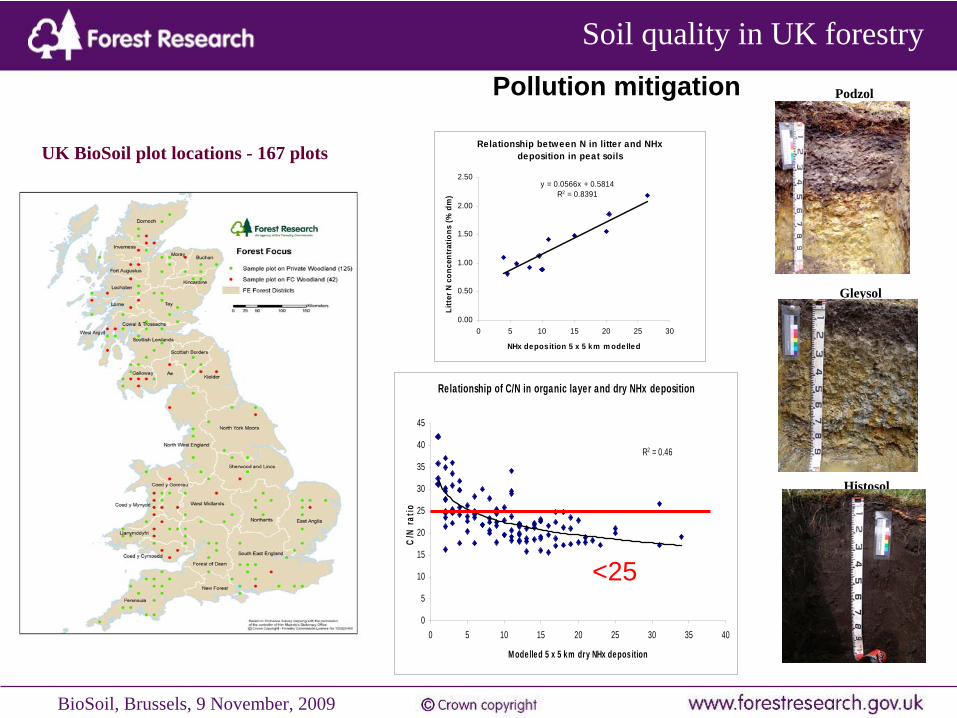
UK BioSoil plot locations - 167 plots
Gleysol
Podzol
Histosol
Relationship of C/N in organic layer and dry NHx deposition
R2 = 0.46
0
5
10
15
20
25
30
35
40
45
0 5 10 15 20 25 30 35 40
M odelled 5 x 5 km dry NHx deposition
C/N
ratio
Relationship between N in litter and NHx deposition in peat soils
y = 0.0566x + 0.5814R2 = 0.8391
0.00
0.50
1.00
1.50
2.00
2.50
0 5 10 15 20 25 30
NHx deposition 5 x 5 km m odelled
Litt
er N
con
cent
ratio
ns (%
dm
)
Pollution mitigation
<25
BioSoil, Brussels, 9 November, 2009
Soil quality in UK forestry
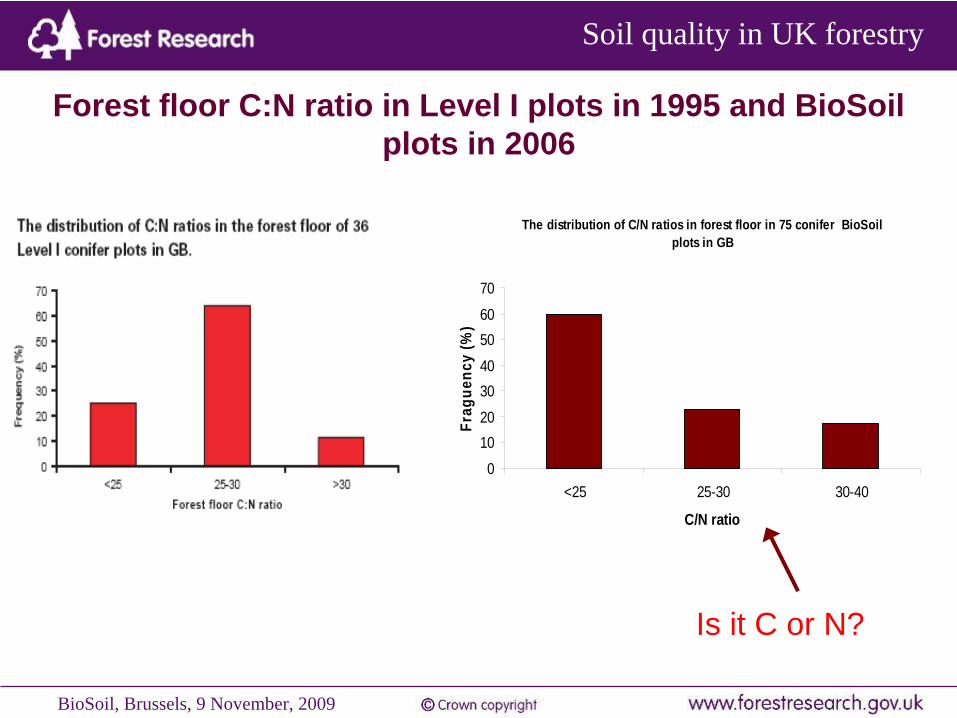
Forest floor C:N ratio in Level I plots in 1995 and BioSoil plots in 2006
The distribution of C/N ratios in forest floor in 75 conifer BioSoil plots in GB
0
1020
3040
5060
70
<25 25-30 30-40
C/N ratio
Frag
uenc
y (%
)
Is it C or N?

BioSoil, Brussels, 9 November, 2009
Soil quality in UK forestry
Alice Holt
Thetford
N deposition and its effect on the biochemistry and nutrient cycling in woodland 4
R2 = 0.75
0
5
10
15
20
25
30
0 20 40 60 80 100120140160180200Distance from woodland edge (m)S
oil N
H4-
N (m
g/kg
ove
n dr
y so
il)
Litter decomposition under Corsican pine
y = 0.6198x + 0.24R2 = 0.89
0
1
2
3
4
5
6
7
8
0 20 40 60 80 100 120 140 160 180
Distance from woodland edge
Litte
r m
ass
loss
(g)
ThetfordAlice Holt
Throughfall NH4-N and NO3-N concentrations under Corsican pine
0
2
4
6
8
10
12
20 40 60 80 100 120 140 160 180 200
Distance from woodland edge (m)
Thro
ughf
all N
H 4-N
and
NO 3
-N
conc
entr
atio
ns (m
g/l)
NH4-N
NO3-NR2 = 0.57
3.2
3.4
3.6
3.8
4
4.2
4.4
0 50 100 150 200Distance from the woodland edge (m)
Soi
l pH
(H20
)
Litterfall of Corsican pine (30 years-old)
0
1000
2000
3000
4000
5000
6000
7000
8000
9000
Total Needles Twigs & frass Flowers andsepals
Cones
Biom
ass
(kg
ha-1
a-1)
ThetfordAlice Holt

BioSoil, Brussels, 9 November, 2009
Soil quality in UK forestry
Lakes
Sherwood
Thetford
SavernakeAlice Holt
RannochLoch Awe
Coalburn
Llyn Brianne
Scots pineOakSitka spruce
Tummel
Changes in soil solution NO3 and NH4 in 9 Level II sites (1994-2006)
Nitrate Ammonium
•Decrease in soil solution NO3 only at two sites, Thetford and Sherwood due to decrease in N deposition or overall acidic pollution
•The increase in soil solution NO3 in a few sites is associated with canopy generated nitrogen, e.g. repeated insect infestations (green spruce aphids and caterpillar)
•NO3 concentrations in the soils are very dependent on water cycling at the sites, e.g. build up or leaching
•No changes in soil solution NH4 were observed in time although NH4 in deposition has declined
BioSoil, Brussels, 9 November, 2009
Soil quality in UK forestry
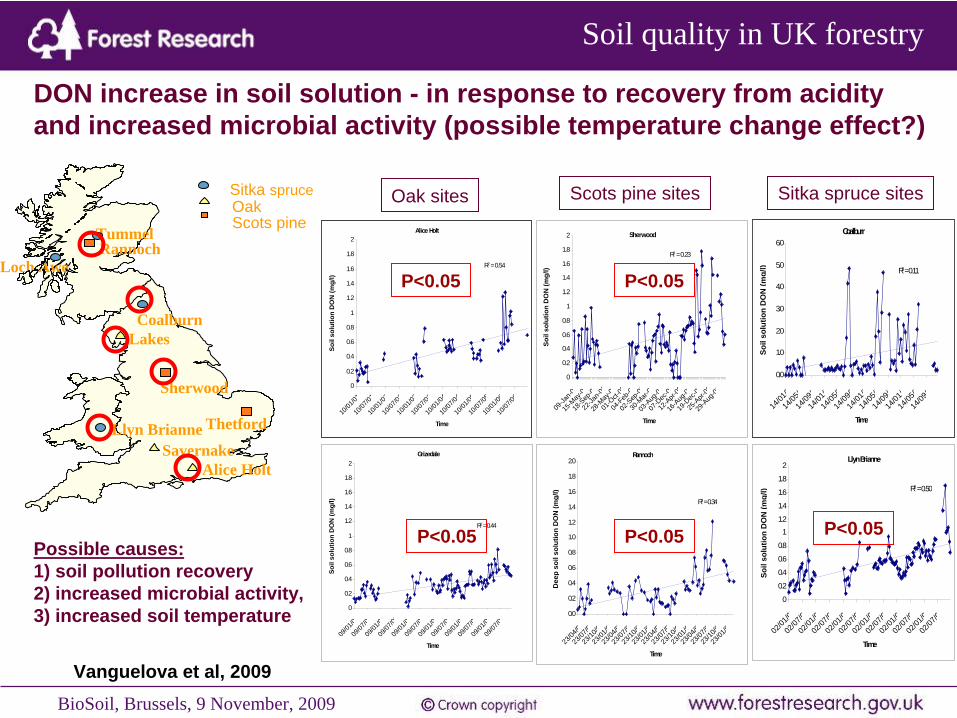
DON increase in soil solution - in response to recovery from acidity and increased microbial activity (possible temperature change effect?)
Oak sites Scots pine sites Sitka spruce sites
Alice Holt
R2 = 0.54
0
0.2
0.4
0.6
0.8
1
1.2
1.4
1.6
1.8
2
10/01
/0110
/07/01
10/01
/0210
/07/02
10/01
/0310
/07/03
10/01
/0410
/07/04
10/01
/0510
/07/05
10/01
/0610
/07/06
Time
Soil
solu
tion
DO
N (m
g/l)
Grizedale
R2 = 0.44
0
0.2
0.4
0.6
0.8
1
1.2
1.4
1.6
1.8
2
09/01
/0109
/07/01
09/01
/0209
/07/02
09/01
/0309
/07/03
09/01
/0409
/07/04
09/01
/0509
/07/05
09/01
/0609
/07/06
Time
Soil
solu
tion
DO
N (m
g/l)
Sherwood
R2 = 0.23
0
0.2
0.4
0.6
0.8
1
1.2
1.4
1.6
1.8
2
09-Ja
n-01
15-M
ay-01
18-S
ep-01
22-Ja
n-02
28-M
ay-02
01-O
ct-02
04-Feb
-0302
-Sep
-0330
-Mar-
0403
-Aug
-0407
-Dec
-0412
-Apr-
0516
-Aug
-0519
-Dec
-0525
-Apr-
0629
-Aug
-06
Time
Soil
solu
tion
DO
N (m
g/l)
Rannoch
R2= 0.34
0.0
0.2
0.4
0.6
0.8
1.0
1.2
1.4
1.6
1.8
2.0
23/04
/023
/07/0
23/10
/023
/01/0
23/04
/023
/07/0
23/10
/023
/01/0
23/04
/023
/07/0
23/10
/023
/01/0
23/04
/023
/07/0
23/10
/023
/01/0
Time
Dee
p so
il so
lutio
n D
ON
(mg/
l)
Coalburn
R2 = 0.11
0.0
1.0
2.0
3.0
4.0
5.0
6.0
14/01
/014
/05/0
14/09
/014
/01/0
14/05
/014
/09/0
14/01
/014
/05/0
14/09
/014
/01/0
14/05
/014
/09/0
Time
Soil
solu
tion
DO
N (m
g/l)
Llyn Brianne
R2 = 0.50
0
0.2
0.4
0.6
0.8
11.2
1.4
1.6
1.8
2
02/01
/002
/07/0
02/01
/0202
/07/02
02/01
/002
/07/03
02/01
/0402
/07/04
02/01
/002
/07/0
02/01
/0602
/07/06
Time
Soil
solu
tion
DO
N (m
g/l)
Lakes
Sherwood
Thetford
SavernakeAlice Holt
RannochLoch Awe
Coalburn
Llyn Brianne
Scots pineOakSitka spruce
Tummel
P<0.05 P<0.05
P<0.05P<0.05
P<0.05Possible causes:1) soil pollution recovery2) increased microbial activity, 3) increased soil temperature
Vanguelova et al, 2009

BioSoil, Brussels, 9 November, 2009
Soil quality in UK forestry
Lakes
Sherwood
Thetford
SavernakeAlice Holt
RannochLoch Awe
Coalburn
Llyn Brianne
Scots pineOakSitka spruce
Tummel
Changes in DOC fluxes in 9 Level II sites (1994-2006)
Possible causes:1) soil pollution recovery2) increased microbial activity, 3) increased soil temperature4) additional input in throughfall as honey dew generated from aphids infestation
Vanguelova et al, 2009
Alice Holt
0.0
5.0
10.0
15.0
20.0
25.0
30.0
35.0
40.0
06/02
/0206
/08/02
06/02
/0306
/08/03
06/02
/0406
/08/04
06/02
/0506
/08/05
06/02
/0606
/08/06
Time
Soil
solu
tion
DO
C (m
g/l)
SavernakeR2 = 0.29
0.0
5.0
10.0
15.0
20.0
25.0
30.0
35.0
40.0
16/01
/0216
/05/02
16/09
/0216
/01/03
16/05
/0316
/09/03
16/01
/0416
/05/04
16/09
/0416
/01/05
16/05
/0516
/09/05
16/01
/0616
/05/06
Time
Soil
solu
tion
DO
C (m
g/l)
Grizedale
R2 = 0.19
0.0
5.0
10.0
15.0
20.0
25.0
30.0
35.0
40.0
08/01
/0208
/07/02
08/01
/0308
/07/03
08/01
/0408
/07/04
08/01
/0508
/07/05
08/01
/0608
/07/06
Time
Soil
solu
tion
DO
C (m
g/l)
Thetford
R2 = 0.13
0.0
20.0
40.0
60.0
80.0
100.0
120.0
140.0
160.0
08/01
/0208
/07/02
08/01
/0308
/07/03
08/01
/0408
/07/04
08/01
/0508
/07/05
08/01
/0608
/07/06
Time
Soil
solu
tion
DO
C (m
g/l)
SherwoodR2 = 0.22
0.0
5.0
10.0
15.0
20.0
25.0
30.0
35.0
40.0
08-Ja
n-02
30-A
pr-02
20-A
ug-02
10-D
ec-02
15-A
pr-03
28-O
ct-03
30-M
ar-04
20-Ju
l-04
09-N
ov-04
01-M
ar-05
21-Ju
n-05
11-O
ct-05
31-Ja
n-06
23-M
ay-06
12-S
ep-06
Time
Soil
solu
tion
DO
C (m
g/l)
Rannoch
R2 = 0.13
0.0
5.0
10.0
15.0
20.0
25.0
30.0
35.0
40.0
23/04
/0223
/08/02
23/12
/0223
/04/03
23/08
/0323
/12/03
23/04
/0423
/08/04
23/12
/0423
/04/05
23/08
/0523
/12/05
23/04
/0623
/08/06
Time
Soil
solu
tion
DO
C (m
g/l)
Coalburn
R2 = 0.51
0.0
5.0
10.0
15.0
20.0
25.0
30.0
35.0
40.0
21/05
/0221
/09/02
21/01
/0321
/05/03
21/09
/0321
/01/04
21/05
/0421
/09/04
21/01
/0521
/05/05
21/09
/0521
/01/06
21/05
/0621
/09/06
Time
Soil
solu
tion
DO
C (m
g/l)
TummelR2 = 0.26
0.0
10.0
20.0
30.0
40.0
50.0
60.0
70.0
80.0
02/01
/0202
/07/02
02/01
/0302
/07/03
02/01
/0402
/07/04
02/01
/0502
/07/05
02/01
/0602
/07/06
Time
Soil
solu
tion
DO
C (m
g/l)
Llyn BrianneR2 = 0.40
0.0
5.0
10.0
15.0
20.0
25.0
30.0
35.0
40.0
02/01
/0202
/07/02
02/01
/0302
/07/03
02/01
/0402
/07/04
02/01
/0502
/07/05
02/01
/0602
/07/06
Time
Soil
solu
tion
DO
C (m
g/l)P<0.05 P<0.05
P<0.05
P<0.05
0
5
1 0
1 5
2 0
2 5
3 0
3 5
4 0
4 5
5 0
C o a l b u r n
Soil
C (%
) in
H h
oriz
on
1 9 9 5
2 0 0 8
0
5
1 0
1 5
2 0
2 5
3 0
3 5
4 0
4 5
5 0
L l y n B r i a n n e
Soil
C (%
) in
H h
oriz
on
1 9 9 5
2 0 0 8

What more do we know about our forest soils quality and changes?
• Total averaged carbon content in forest soils across Great Britain ranged between 130 and 450 t ha-1 . Total averaged soil nitrogen content ranged between 5 and 20 t ha-1.
•Forest management can have a significant impact on soil carbon. Overall impact of forest management on GHG balances in forest ecosystems is more informative for decisions on climate change mitigation options. More empirical data and research is needed to underpin the calculations and modelling approach.
• Concerns over the N saturation of forest soils and N buffering capacity remain, particularly the potential for nitrate leaching after increased storm events in addition to the impact of N on forest soil C dynamics.
How BioSoil will help for sustainable forestry in UK?
Will test soil chemical and physical indicators and their thresholds related to soil and forest sustainability
BioSoil data will feed into to estimations and modelling of overall C and nutrient stocks of forests
Excellent platform for further research to be based on as well as national and international collaboration opportunities
BioSoil plots will be a subset of National Inventory of Woodland and Trees (NITW2) and will provide information about the sustainability of our forest soils
BioSoil is baseline of the UK forest soil conditions on which changes can be assess in the future

BioSoil, Brussels, 9 November, 2009
Soil quality in UK forestry
Thanks to:Intensive MonitoringRona PitmanSue BenhamAndy MoffatTony HutchingsDave DurrantPeter CrowNadia BarsoumTracy Houston
Technical Support Unit at all stations All at Forest Research Laboratory Alice Holt
BioSoilSoil Surveyors:Malcolm Reeves, Frank Heaven, Richard Hartnup,Andrew HipkinGordon Hudson
Tom NisbetTanja WahlleberSam BroadmeadowPaul Taylor
ManForC programmeJames MorisonRobert MattewsTim RandleMirriam WhiteSirwan Yamulki