Embed Size (px)
Citation preview

Economic Policy Sixty-first Panel Meeting
Hosted by the Bank of Latvia Riga, 17-18 April 2015
The organisers would like to thank the Bank of Latvia for their support. The views expressed in this paper are those of the author(s) and not those of the supporting organization.
The Turnaround of Swedish Industry: Reforms, Firm Diversity and Job and Productivity Dynamics
Fredrik Heyman (Research Institute for Industrial Economics, Stockholm)
Pehr-Johan Norbäck (Research Institute for Industrial Economics, Stockholm) Lars Persson (Research Institute for Industrial Economics, Stockholm)

1
The Turnaround of Swedish Industry: Reforms,
Firm Diversity and Job and Productivity
Dynamics
Fredrik Heyman, Pehr-Johan Norba ck, Lars Persson
This version: April 2015
Abstract
In this paper, we argue that fundamental reforms of the Swedish business sector can explain its remarkable productivity and
employment growth following Sweden’s significant economic crisis in the early 1990s. In the 1970s and 1980s, Sweden had
one of the most regulated business sectors in the developed world. In the 1990s, however, Sweden reformed its labour
market, the product market, and corporate tax system and removed barriers to foreign direct investment (FDI). Our main
finding from our institutional and theoretical examination is that the removal of barriers to entry and growth for new and
productive firms and the increased rewards for investments in human capital and effort in workplaces were crucial to the
success of these reforms. We find support for our thesis using detailed, matched plant-firm-worker data. In particular, we
observe increased allocative efficiency, measured as an increased market share for more productive firms. Moreover, we
show that foreign firms substantially contributed to productivity and employment growth during this period, which suggests
that the liberalization of FDI was an important factor in the reforms’ success. Finally, we discuss how other countries can
benefit from the Swedish experience by examining factors that appear to be specific to Sweden and others that can be
generalized to other countries.
* Research Institute for Industrial Economics (IFN), P.O. Box 55665, SE-102 15 Stockholm, Sweden,
[email protected], [email protected], and [email protected].

2
1. INTRODUCTION
Europe is facing one of the most significant economic challenges in its history. In the wake of the financial crisis, many
countries have been forced to downsize employment in the government sector, restructure the industrial sector, and create
jobs in the private sector. Sweden is one of the few countries in Europe that has shown both high productivity and job
growth in its business sector in recent decades. In the 1980s and the early 1990s, however, Sweden experienced similar
problems to those presently affecting many countries in Europe and faced its most severe economic crisis in the post-war
period: Swedish companies lost their competitiveness in the global market while the Swedish state became very highly
leveraged. The period 1991–1994 was characterized by a substantial decline in GDP and increasing unemployment.
The purpose of this study is to examine the Swedish industrial reorganization process that occurred during the period
1990–2009 and to analyse the economic forces underlying the successful transformation of the Swedish economy and, in
particular, the Swedish business sector. We argue that an important explanation for the recovery of the Swedish economy
following the crisis was that during the latter part of the 1980s and, particularly, the 1990s, Sweden implemented several
important economic reforms that improved efficiency in the business sector. These reforms included labour market and
product market deregulation, efficiency-enhancing tax reforms, and the removal of barriers to foreign direct investment
(FDI). These efficiency-focused reforms then continued over the subsequent decades. We also argue that the success of
Sweden’s industrial restructuring was aided by a strong efficiency-oriented business culture and openness to new
technologies, thus enabling Sweden to become one of the first countries in the world to achieve full-scale implementation of
information and communications technology (ICT) in industry. These actions not only enabled Sweden to catch up to most
comparable countries after its poor performance in the 1980s and early 1990s but also to outperform most of them in terms
of GDP per capita and employment growth in the business sector in recent decades.
We begin by establishing that productivity growth in the Swedish business sector has been extraordinary in the last two
decades in comparison to comparable countries. With the exception of Ireland, evidence from the OECD (2013) shows that
Sweden and the US experienced the highest labour productivity growth in the OECD during the period 1995–2011.
Sweden’s high labour productivity growth has primarily been driven by factors that increased the effectiveness of the
Swedish business sector. We then document that labour force participation in Sweden is very high but has decreased
somewhat since the early 1990s. However, labour force participation in the business sector has increased considerably in
relation to comparable countries over the last two decades. In particular, Sweden experienced high growth in private sector
employment as a share of the total labour force during the period 1995–2011.
To understand the restructuring processes implemented in Swedish industry in the 1990s and 2000s, we survey the
industrial restructuring literature in search of mechanisms shown to be important in explaining firm, employment, and
productivity dynamics. The overview indicates that productive, expanding firms are typically associated with active owners
and well-functioning management. Thereby, economically efficient decisions are made and well-functioning business
cultures are developed, thus leading to a motivated workforce. Employing skilled workers and the early adoption of new
technologies have also been shown to create competitive advantages in both local and global markets, thereby spurring
productivity growth. Start-ups and expansions are associated with high degrees of uncertainty, meaning that many
businesses will fail and, thus, that the observed number of highly successful and expanding ventures will be low, but they
will still be an important factor in productivity and employment growth.
Firms’ productivity and employment also crucially depend on external factors such as institutions and access to
production factors. In our empirical study of firms in the Swedish business sector, we focus on external factors that were
changed as a result of a large reform package introduced in the early 1990s, including reforms of the labour, product and
corporate ownership markets. We survey these reforms and analyse them in relation to their role in the Swedish industrial

3
and job restructuring processes. The picture emerging from this institutional analysis is that Sweden developed good
economic institutions in the late 1800s and experienced sustained and very high growth in the period 1870-1970. In the
1970s, considerably more interventionist policies were developed, implying that Sweden exhibited the most regulated
business sector in the developed world during the 1970s and 1980s. Growth then slowed substantially, which led to the
economic crisis of the early 1990s. This experience paved the way for several reforms intended to increase the efficiency of
the Swedish economy and, particularly, the Swedish business sector. Our main finding from this institutional and theoretical
examination is that the removal of barriers to entry and growth for new and productive firms, and increased rewards for
investments in human capital and effort in workplaces were crucial to the success of these reforms. These actions, we argue,
led to remarkable growth in productivity and employment in the Swedish business sector in the two decades that followed.
Our empirical analysis is based on broad predictions from the theoretical and institutional discussion. Our focus is on
firm-level employment and productivity dynamics during Sweden’s reformation and recovery period from 1990 to 2009.
The analysis uses data from an extensive and detailed database maintained by Statistics Sweden (SCB). The data consist of
matched plant-firm-worker data for the 1990–2009 period. Using detailed information on firms, plants, and employees
makes it possible to analyse issues related to firm employment and productivity dynamics in greater detail than what has
been possible in most other international studies.
While it is difficult to obtain causal evidence for our general theoretical and institutional predictions in a single-country
study such as ours, we do find indicative support for our predictions in the empirical analysis. In particular, we observe
increased allocative efficiency in Sweden, measured as increased market share for the more productive firms in the
economy. This finding suggests that the implemented reforms mitigated the insider and incumbency problems in the
Swedish business sector and enabled more productive firms to better attract capital and employees than previously. We also
find that the relationship between productivity and wage increases in firms increased over the period we study, which
suggests that productive firms and productive employees are better compensated by Swedish industry.
Moreover, we find that firm dynamics are systematically related to product market competition. Greater competition
affects the composition of new firms that survive in the market and those that exit. We establish that net jobs were created in
small firms, while most of the productivity gains were created in large incumbent firms, thus suggesting that the reforms
simplified the division of labour between large incumbents and small, growing firms. Finally, we show that foreign firms
contributed significantly to productivity and employment growth in the business sector during this period, which suggests
that the liberalization of FDI was an important factor in the success of Sweden’s industrial restructuring process.
Turning to policy implications, we argue that countries in Europe struggling with slow or no growth may have much to
learn from the Swedish experience of the 1990s. In particular, our institutional and empirical analysis supports the idea that
reforms that remove barriers to entry and growth for new and productive firms and increase the return on investment,
similar to those implemented in Sweden during the 1990s, can spur economic growth. Finally, we argue that specific factors
such as efficiency-oriented business norms and open mindedness to new technology in combination with the ICT revolution
that was occurring at the time might have been important factors in the extraordinary benefits of these reforms in Sweden.

4
2. PRODUCTIVITY AND EMPLOYMENT DYNAMICS IN SWEDISH INDUSTRY
Figure 1 compares the long-term development in GDP per capita in Sweden with that of US and a simple average of the EU
15 countries. 1
In 1970, Swedish GDP per capita exceeded the average GDP per capita of the EU 15 group but was lower
than that of the US. During the period 1970–1990, Sweden performed worse than both the US and the EU 15 average. When
Sweden entered a severe crisis in the early 1990s as a result of a combination of mismanaged economic policy and the
inherent instability of the so-called Swedish model, its GDP per capita fell below that of the EU 15 average.
In the years after the crisis of the 1990s, propelled by significant reforms to its economy, Sweden showed a much
stronger trend, and its GDP per capita grew faster than that of the EU 15 while keeping up with US growth. At the end of
the 1990s, Swedish GDP per capita yet again surpassed the EU 15 average. The gap in GDP per capita between Sweden and
the EU 15 even widened after the turn of the millennium. It is also clear that Sweden appears to have managed the recent
crisis better than the EU countries as manifested by a further increase in the gap in GDP per capita as the financial crisis
unfolded. The latter observation suggests that the performance of Sweden beginning in the mid-1990s does not simply
represent the well-known “catch-up” phenomenon (where growth is high simply because the economy takes off from a low
level of activity where there are extensive idle production factors available). The fact that Sweden seems to have been able
to sustain its better performance over a very long period of time suggests that the Swedish economy underwent profound
changes during the 1990s and that these changes laid the foundation for a sustained period of growth and a successful
transformation of the economy.
Figure 1. Comparing long term trends in GDP per capita for Sweden, the US, and the first 15 European Union
member countries, 1970–2013 Notes: GDP per capita is expressed in USD constant PPPs with base year 2005.
Source: OECD, National Accounts.
Figure 1 thus suggests that Swedish growth in the last two decades has been high based on international comparisons. It is
also instructive to explore the sources of this growth. Growth in GDP per capita can be decomposed into growth in labour
productivity (i.e., production of goods and services per employed person) and growth in work time (i.e., hours supplied by
each person).
Let us begin with labour productivity, which has been found to be the main driver of GDP or income per capita. Labour
productivity growth can in turn be decomposed into two components: (1) “Multifactor productivity growth”, which can be
broadly interpreted as a more efficient use of available production factors due to improved management and technological
1 The EU 15 includes Austria, Belgium, Denmark, Finland, France, Germany, Greece, Ireland, Italy, Luxembourg, the Netherlands, Portugal, Spain,
Sweden and the United Kingdom. These are the member countries of the European Union just prior to the accession of the East European countries on 1
May 2004. Several of these countries were not members of the EU (or EEC) at the beginning of the period considered. We use the term “EU 15” as a convenient European benchmark.

5
development, and (2) so–called “capital deepening” or investments in capital.2 Figure 2 compares labour productivity
growth and its components during the post-crisis period 1995–2011 for Sweden and 12 other EU countries as well as the US
and Japan.
Figure 2. Labour productivity growth and its components, 1995-2011 Notes: The annual percentage point contribution for the total economy.
Source: OECD Compendium of Productivity Indicators, 2013.
With the exception of Ireland, Figure 2 shows that Sweden and the US had the highest labour productivity growth during
the period 1995–2011. The figure also illustrates that in both the US and Sweden, multifactor productivity growth (more
efficient use of production factors) was more important to labour productivity growth than capital deepening (investments in
capital). This result is in contrast to, for instance, Italy, where labour productivity growth was completely driven by capital
investments and multifactor productivity growth was even negative.
Let us now turn to the employment trend in Sweden during this period. Figure 3 compares the employment dynamics in
Sweden with the EU 15 countries and the US for the period 1990–2011. Throughout the period, employment as a share of
the total labour force, the so-called participation rate, was very high in Sweden. After a substantial decline after the crisis in
the 1990s due to layoffs in both the private and public sectors in the initial restructuring process, there was a steady increase
in the labour force participation rate, and it was yet again substantially higher than in the EU 15 and the US. In particular,
Sweden showed high growth in private sector employment as a share of its total labour force in the period 1995–2011.
Although substantially lower than the EU 15 average, it surpassed the EU 15 levels after the financial crises.
Figure 3. Total and private sector employment rates, 1990-2011 Notes: The EU 15 rate is based on own calculations. Private sector employment data are missing for Germany and Greece for the entire period. Total
employment data are missing for Germany for 1991 and for Greece until 1994. Private sector data for Austria are taken from the OECD Economic Outlook No. 85, where historical data are only available until 2008.
Source: OECD Economic Outlook No.95, OECD Labour Market Statistics.
2 Intuitively, when workers have more capital, better technology or production methods, or better management, we expect to see higher production per employee.

6
In summary, we observed substantially higher productivity growth in the Swedish business sector in the last few decades
than in other EU countries. Moreover, after the Swedish crisis in the early 1990s, we observed a strong recovery in private
sector employment as a share of the total labour force. To understand the economic forces underlying the Swedish industrial
and job restructuring processes, we will describe the crucial economic reforms that Sweden implemented. However, first,
we briefly survey the industrial restructuring literature in search of mechanisms through which these reforms could have had
an impact on firm and job dynamics.
3. CONCEPTUAL FRAMEWORK: INDUSTRIAL RESTRUCTURING AND ECONOMIC REFORMS
To understand the restructuring processes that took place in Swedish industry in the 1990s and 2000s, we begin with a very
brief overview of the basic economic mechanisms that have been shown to be important in explaining employment and
productivity dynamics in general.3 Beginning from this general knowledge of the functioning of industrial restructuring
processes, we analyse the potential effects of the economic reforms undertaken in Sweden in the 1990s on employment and
productivity dynamics.
Figure 4 depicts a schematic picture of how firm and business sector employment and productivity can be understood.
The figure categorizes “firm-specific factors” that the firms themselves can choose and influence. As explained in greater
detail in Box 1, firm-specific factors concern how firms are organized or which business strategies are used. The overview
suggests that expanding productive firms are typically associated with active owners and well-functioning management.
Thereby, economically efficient decisions are made and well-functioning business cultures are developed, thus leading to a
motivated workforce. Employing skilled workers and adapting new technologies early have also been shown to create
competitive advantages in local and global markets and to thereby spur productivity growth. Start-ups and expansions are
often associated with high degrees of uncertainty, which means that many businesses will fail and, thus, that the observed
number of highly successful and expanding ventures will be low.
The figure also includes “external factors”. These are factors over which firms have no influence but that can both
directly and indirectly affect firm productivity and employment through the limitations that they set or the incentives they
provide regarding firm-specific choices. In our study of the Swedish business sector, we focus on external factors in a large
reform package implemented in Sweden in the early 1990s that included reforms of the labour market and the product
market, tax reforms and the removal of barriers to FDI. We should also highlight that the ICT revolution took place during
this period. This external factor was very important to the industrial restructuring process in most developed countries
during this period. Finally, firm-specific and external factors affect firm performance in terms of measurable productivity
and employment dynamics. Different methods can later be used to sum up these dynamics at the aggregated business-sector
level, as shown at the bottom of Figure 4.
Let us now examine the impact on firm performance of the changes in external factors caused by the package of
economic reforms undertaken in Sweden in the 1990s.
3 See Acs and Audretsch (2005), Caves (1998), Santarelli and Vivarelli (2007), and Sutton (1997) for an overview of the literature on market
structure and firm dynamics. For specific articles, see, e.g., Audretsch (1991), Bartelsman et al. (2005), Ericson and Pakes (1995), Hjalmarson
(1974), Hopenhayn (1992), Klepper (1996), Jovanovic (1982), and Luttmer (2007). See also Nelson and Winter (1982) for an analysis of firm growth processes with bounded rational decision makers.

7
Figure 4: Explanatory factors underlying productivity and employment trends in the business sector
External factors:
• Labour market• Corporate ownership market• Product market
Firm-specific factors:
• Strategy and Organization• Ownership and Management• Capital and Human Capital
Firm characteristics:
• Productivity dynamics• Employment dynamics
Private sector:
• Productivity dynamics• Employment dynamics
8
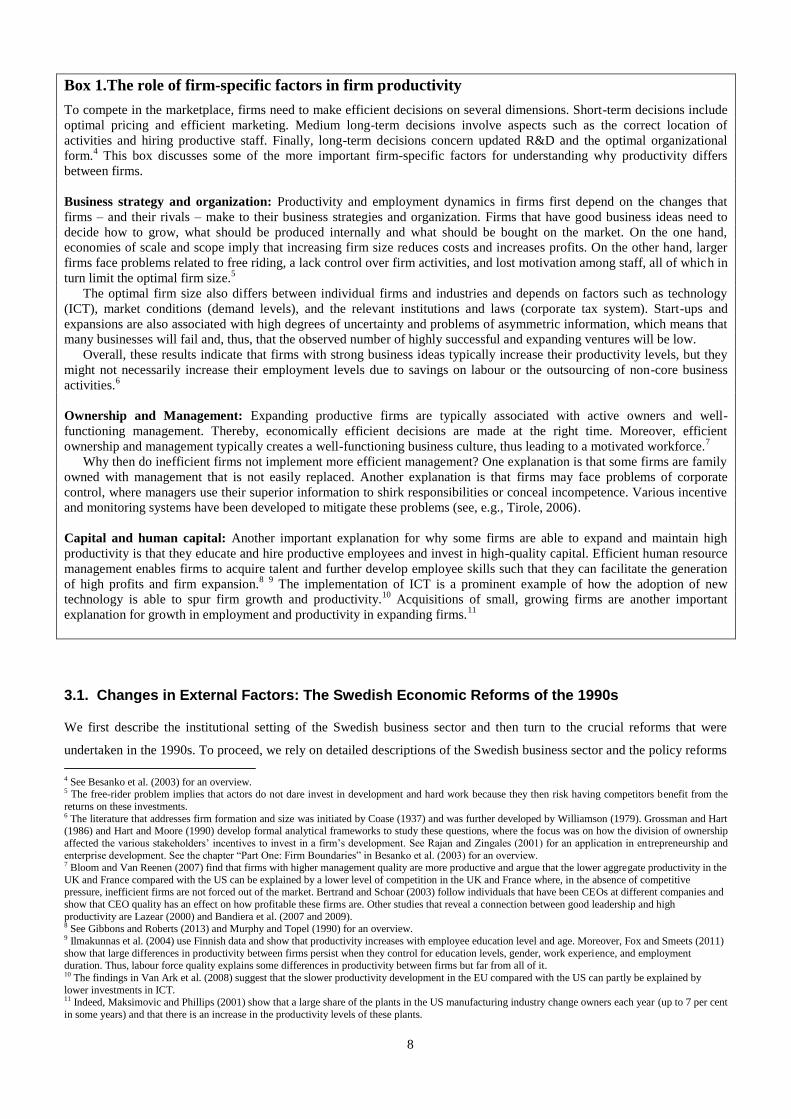
Box 1.The role of firm-specific factors in firm productivity
To compete in the marketplace, firms need to make efficient decisions on several dimensions. Short-term decisions include
optimal pricing and efficient marketing. Medium long-term decisions involve aspects such as the correct location of
activities and hiring productive staff. Finally, long-term decisions concern updated R&D and the optimal organizational
form.4 This box discusses some of the more important firm-specific factors for understanding why productivity differs
between firms.
Business strategy and organization: Productivity and employment dynamics in firms first depend on the changes that
firms – and their rivals – make to their business strategies and organization. Firms that have good business ideas need to
decide how to grow, what should be produced internally and what should be bought on the market. On the one hand,
economies of scale and scope imply that increasing firm size reduces costs and increases profits. On the other hand, larger
firms face problems related to free riding, a lack control over firm activities, and lost motivation among staff, all of which in
turn limit the optimal firm size.5
The optimal firm size also differs between individual firms and industries and depends on factors such as technology
(ICT), market conditions (demand levels), and the relevant institutions and laws (corporate tax system). Start-ups and
expansions are also associated with high degrees of uncertainty and problems of asymmetric information, which means that
many businesses will fail and, thus, that the observed number of highly successful and expanding ventures will be low.
Overall, these results indicate that firms with strong business ideas typically increase their productivity levels, but they
might not necessarily increase their employment levels due to savings on labour or the outsourcing of non-core business
activities.6
Ownership and Management: Expanding productive firms are typically associated with active owners and well-
functioning management. Thereby, economically efficient decisions are made at the right time. Moreover, efficient
ownership and management typically creates a well-functioning business culture, thus leading to a motivated workforce.7
Why then do inefficient firms not implement more efficient management? One explanation is that some firms are family
owned with management that is not easily replaced. Another explanation is that firms may face problems of corporate
control, where managers use their superior information to shirk responsibilities or conceal incompetence. Various incentive
and monitoring systems have been developed to mitigate these problems (see, e.g., Tirole, 2006).
Capital and human capital: Another important explanation for why some firms are able to expand and maintain high
productivity is that they educate and hire productive employees and invest in high-quality capital. Efficient human resource
management enables firms to acquire talent and further develop employee skills such that they can facilitate the generation
of high profits and firm expansion.8
9 The implementation of ICT is a prominent example of how the adoption of new
technology is able to spur firm growth and productivity.10
Acquisitions of small, growing firms are another important
explanation for growth in employment and productivity in expanding firms.11
3.1. Changes in External Factors: The Swedish Economic Reforms of the 1990s
We first describe the institutional setting of the Swedish business sector and then turn to the crucial reforms that were
undertaken in the 1990s. To proceed, we rely on detailed descriptions of the Swedish business sector and the policy reforms
4 See Besanko et al. (2003) for an overview. 5 The free-rider problem implies that actors do not dare invest in development and hard work because they then risk having competitors benefit from the
returns on these investments. 6 The literature that addresses firm formation and size was initiated by Coase (1937) and was further developed by Williamson (1979). Grossman and Hart (1986) and Hart and Moore (1990) develop formal analytical frameworks to study these questions, where the focus was on how the division of ownership
affected the various stakeholders’ incentives to invest in a firm’s development. See Rajan and Zingales (2001) for an application in entrepreneurship and
enterprise development. See the chapter “Part One: Firm Boundaries” in Besanko et al. (2003) for an overview. 7 Bloom and Van Reenen (2007) find that firms with higher management quality are more productive and argue that the lower aggregate productivity in the
UK and France compared with the US can be explained by a lower level of competition in the UK and France where, in the absence of competitive pressure, inefficient firms are not forced out of the market. Bertrand and Schoar (2003) follow individuals that have been CEOs at different companies and
show that CEO quality has an effect on how profitable these firms are. Other studies that reveal a connection between good leadership and high
productivity are Lazear (2000) and Bandiera et al. (2007 and 2009). 8 See Gibbons and Roberts (2013) and Murphy and Topel (1990) for an overview. 9 Ilmakunnas et al. (2004) use Finnish data and show that productivity increases with employee education level and age. Moreover, Fox and Smeets (2011)
show that large differences in productivity between firms persist when they control for education levels, gender, work experience, and employment duration. Thus, labour force quality explains some differences in productivity between firms but far from all of it. 10 The findings in Van Ark et al. (2008) suggest that the slower productivity development in the EU compared with the US can partly be explained by
lower investments in ICT. 11 Indeed, Maksimovic and Phillips (2001) show that a large share of the plants in the US manufacturing industry change owners each year (up to 7 per cent
in some years) and that there is an increase in the productivity levels of these plants.

9
that affected firms in Sweden as described by, e.g., Bergh (2014), Bergh and Erlingsson (2006), Calmfors (2012), Edquist
and Henrekson (2013), Henrekson and Jakobsson (2005), Jonung et al. (2008), Lindbeck (1997), and the references therein.
Let us begin with a brief description of the development of economic institutions in Sweden prior to the reforms. Staying
out of two world wars and engaging in international trade by exploiting its abundant natural resources while developing
efficient institutions, Sweden experienced a long period of sustained growth, the so-called “golden years” of 1870-1970. At
the end of this century-long period, Sweden was fourth in the OECD ranking of GNP per capita. In the decades after the
Second World War, a relatively rapid GDP growth rate was combined with full employment and a fairly egalitarian
distribution of income due to the early establishment of welfare-state arrangements.
In the 1970s, government policies became increasingly interventionist under the influence of the more radical political
ideas that emerged during the decade. Tight labour market regulations were implemented in the early 1970s, and an active
labour-market policy was established at a large scale in the late 1970s. So called “solidaristic wage policies” led to a
compressed wage structure, and workers’ wages became detached from individual firm productivity. Marginal tax rates
gradually increased, ultimately culminating in a 1971 tax reform that made Sweden’s tax rate very high in comparison with
those of comparable countries.
In the business sector, the government, trade unions and bank-related business groups embodied an explicit tripartite
negotiating culture. A fairly small number of dominating owners or ownership groups of corporations acknowledged and
accepted that the government would use its political power to implement far-reaching welfare reforms, and the labour
movement would abstain from socializing the industrial sector. Moreover, the government implemented policies to
influence aggregate savings, the credit supply and investment through public-sector saving, capital market regulations, taxes
and subsidies, which all affected the functioning of the business sector. As noted by Lindbeck (1997), this approach mirrors
a view of the world in which markets, economic incentives and private entrepreneurship not associated with large firms is
regarded with suspicion.
The interventionist policies reduced the efficiency of the economy and were likely the main contributing factor to
Sweden’s comparatively worse performance than both the EU 15 countries and the US during the period 1970-1990 in
terms of GDP per capita growth (as illustrated in Figure 1 above). As described in detail in Box 2, internal problems in the
Swedish model and external shocks eventually led to deep economic crises that included a significant decrease in output and
soaring unemployment in the early 1990s. In response, economic-efficiency and growth-induced institutional reforms
were undertaken in the 1980s and 1990s. In addition, macroeconomic policy reforms were implemented in the
1990s to reduce the inflationary bias in the Swedish economy. These reforms included the establishment of an
independent central bank and a floating currency.
The majority of the literature has focused on the importance of the macroeconomic reforms. In contrast, the focus in this
study is on the reforms that were undertaken to improve the resource allocation and the microeconomic functioning of the
markets in response to the underperforming Swedish economy. Notable reforms included the decentralization of the wage
negotiation system and the liberalization of temporary work contracts, deregulation of the product market, greater openness
to inward FDI and reform of the tax system (Bergh, 2013, Calmfors, 2012, Edquist and Henrekson, 2013 and Lindbeck,
1997).
In the following sub-sections, we proceed with a detailed review of the Swedish reforms before attempting to establish
empirical evidence that the reforms increased economic efficiency in the Swedish business sector. To provide such
evidence, we study different facets of productivity and employment dynamics using Swedish micro data.

10
Box 2. The Swedish Financial Crises in the Early 1990s
In the decades following the end of the Second World War, Sweden applied capital account controls that enabled the
country to use Keynesian monetary and fiscal policies to maintain full employment in a world where the Swedish Krona
was pegged to the US dollar under the Bretton Woods system. Expansionary fiscal and monetary policies at low
unemployment levels, however, lead to overheating, high inflation and problems with international competitiveness. The
Swedish government therefore devalued the Krona several times at the end of the 1970s and the beginning of the 1980s.
Following international developments, Sweden began to deregulate its credit market in 1985. These actions triggered a
chain of events that led to financial crises at the beginning of the 1990s due to a significant reduction in economic output
and soaring unemployment.
The tax system, which featured high marginal tax rates and generous tax deductions for interest paid on loans, combined
with high inflation produced very low – or even negative – real interest rates, which provided strong incentives for firms
and consumers to increase their borrowing. The credit deregulation policy of 1985 exacerbated these issues, as larger
volumes of credit found their way into the asset markets (i.e., housing, commercial properties and stocks). When asset
prices began to rise, households and firms used the higher asset prices as collateral for further borrowing, which in turn
further increased the demand for and prices of assets. Thus, a financial bubble emerged.
The bubble eventually burst in 1991, when a major financial institution (Nyckeln) was declared bankrupt. When asset
sales began on a large scale, asset prices began to fall, thus reducing the wealth of asset owners. A downward spiral of debt-
deflation took place in which the value of assets declined while the nominal value of debt remained unchanged, which
forced agents to sell more assets to restore their balance sheets and caused asset prices to decline further.
Internal policies and external events exacerbated the situation. A tax reform that was intended to increase economic
efficiency made loan financing less advantageous. There was also an unexpected rise in international interest rates triggered
by the contractionary monetary policy pursued in Germany, where inflationary pressure arose from the huge costs of
German reunification. The rise in the real interest rate sparked a banking crisis.
The imbalances in the Swedish economy ignited speculation in the Swedish Krona, which was then pegged against a
basket of European currencies (the ECU). Policy makers – marked by their experience with the ineffectiveness of previous
devaluations – attempted to defend the exchange rate by raising the interest rate. Because capital controls had been lifted,
large capital outflows occurred, and ultimately, the Swedish Riksbank was forced to abandon such efforts and let the Krona
float freely.
3.1.1. The Labour Market
Labour market regulations significantly affect firm employment and productivity development. On the one hand, labour
market institutions can increase hiring and productivity by reducing matching and search problems in the labour market. On
the other hand, rigid labour markets may offer too much protection for insiders, thereby hampering creative destruction
processes and, to a lesser extent, rewarding productive labour and firms. Various types of labour turnover costs give insiders
market power, which has implications for talent allocation, work incentives, and employment and unemployment patterns
(see Lindbeck and Snower, 2002 for an overview). In particular, such insider market power might distort incentives for firm
development, education, and effort at the workplace. We refer to this problem as the insider-outsider problem of the labour
market.
Let us now use this background to discuss the implications of the crucial labour market reforms in Sweden in the 1990s,
the decentralization of the wage negotiation system and the liberalization of temporary work contracts, on the efficiency of
the restructuring of the Swedish business sector.
3.1.1.1. The Decentralization of the Swedish Wage Negotiation System and the Liberalization of
Temporary Work Contracts
After the Second World War, wage bargaining was highly centralized in Sweden. In the 1950s and 1960s, economy-wide
wage increases were negotiated centrally between the Swedish Employers’ Confederation and the Trade Union
Confederation. In the 1970s, wages were set according to solidaristic wage policies under the principle of “equal pay for
equal work, whereby wages should be equalized between sectors for similar tasks and occupations. Ideally, the system
would have mimicked a competitive labour market, where low productivity firms would be driven out of the market, thus

11
freeing labour to seek high-productivity firms that are able to support higher wages. In practice, however, considerable wage
compression occurred as ambitions moved from equity goals to promoting more outright equality (Davis and Henrekson,
2000 and Lindbeck, 1997). A market mechanism through which high-productivity firms could attract labour by paying
higher wages was absent, and instead, active labour market policies were pursued. It is questionable how well the
government was able fulfil this allocative task. With constraints on wage setting, the ability to incentivize workers in firms
was also hampered.
In 1974, a new employment protection law (LAS) was implemented. The law mandated that employees could not be
fired without reasonable cause such as abuse or a lack of work opportunities. Insiders were also favoured with respect to
firing and hiring procedures through the so-called “last in, first out” rule, which further reduced workers’ incentives to
change jobs. Temporary contracts also became limited. Figure 5 shows that the introduction of LAS had a significant impact
on the so-called Allard index of the strictness of employment protections (Allard, 2005), which nearly doubled during this
period. This measure of the strictness of employment protections continued to increase until the beginning of the 1990s. The
average employment protection in the EU 15 countries also increased over this period, but not to the same extent as in
Sweden. The US labour market continued to maintain a low level of employment protection.
The push for more radical reforms produced a tenser climate in the relations between the unions and the employer
confederation. Centralized bargaining for private-sector, blue-collar workers gradually broke down in the 1980s and was
replaced by uncoordinated industry-level bargaining. Intermediate industry-level bargaining is a form of collective
bargaining that should be more conducive to wage inflation.12
In 1990, the Employers’ Confederation attempted to
introduce a more decentralized system. This attempt failed, however, and instead, a fully centralized wage stabilization deal
was negotiated for 1991–92. In 1994, state-owned firms joined the employers’ organization, which weakened the political
influence in wage setting (Nycander, 2008). In 1997, the so-called Industry Agreement was concluded. The agreement
included a system that continued industry-level bargaining but with strong informal coordination based on pattern
bargaining with the manufacturing sector to conclude initial wage agreements in a bargaining round. This system
established a norm for wage increases for others to follow. The reformed wage bargaining system turned out to be consistent
with lower nominal wage increases than in the past. Moreover, it allowed for greater individual wage flexibility (Calmfors,
2012). As shown in Figure 6, Sweden thus progressed from a more centralized wage negotiation system than other EU
countries in the 1980s to a moderately centralized wage negotiation system in the 1990s.
In 1992, a major employment protection reform was implemented that permitted staffing agencies (Skedinger, 2010),
and the regulations concerning temporary work were relaxed. This development created what is referred to as the dual
Swedish labour market, with strong employment protections for regular workers and weak employment protections for
temporary workers. This reform was also evident in the Allard index of employment protection, which declined
significantly, as shown in Figure 5. Using another measure of the strictness of employment protections from the OECD, as
shown in Figure 7, demonstrates that the strictness of employment protections concerning temporary contracts was
significantly reduced in Sweden from a very high level in 1985 to a very low level in 2010. However, the strictness of the
employment protections concerning regular contracts remained at a relatively high level over the same period.
12 Both highly coordinated wage bargaining and decentralized firm-level bargaining deliver higher wage moderation: highly coordinated bargaining because wage setters are
forced to make economy-wide considerations and decentralized bargaining because wage setters have to take competitive pressures into account. This hypothesis seemed to be
borne out by the high wage increases in Sweden in the 1980s (Calmfors, 2012).

12
Figure 5. Employment protection legislation, 1950–2003 Notes: Scale 0–5, the higher the index is, the stricter the employment protection legislation is. The EU 15 values are based on own calculations and exclude
Luxembourg. Source: Allard (2005)
Figure 6. Predominant levels at which wage bargaining takes place, 1960–2013 Notes: Scale 1–5, the higher the index is, the more centralized the level of wage bargaining is. The EU 15 values are based on own calculations and
exclude Luxembourg.
Source: Amsterdam Institute for Advanced Labour Studies (AIAS)
Figure 7. Employment protection – temporary contracts, 1985–2013 Notes: Scale 0–6, the higher the index is, the stricter the employment protection legislation is. The EU 15 values are based on own calculations and exclude
Luxembourg.
Source: OECD Employment Database (2013)
We conclude our description of the reforms of the labour market as follows:
Conclusion 1. The incentive and insider-outsider problems in the Swedish labour market should have been mitigated by the
labour market reforms undertaken in the 1990s. These reforms should also have improved firms’ flexibility and thereby
their ability to adjust their workforce and invest in and reward human capital.

13
3.1.2. Product Market Regulation
The absence of artificial barriers to entry and expansion is crucial for employment and productivity growth. Incumbent
firms have incentives to exploit their market power to protect their market share by preventing rivals from expanding and
new firms from entering their markets. Incumbent firms can, for instance, practice different forms of predatory behaviour
such as engaging in exclusive dealing contracts or input cartels, lobbying for special restrictions on entry, or making entry-
deterring acquisitions. Even if incumbents are ineffective, they may not be replaced by more productive entrepreneurs due
to excessive barriers to entry.
We refer to these product market problems as the problem of weak creative destruction. A well-functioning competition
policy and legislation can mitigate such entry-deterring and predatory problems (see Motta, 2004 and Tirole, 2006).
Moreover, a well-functioning competition policy must ensure that innovative firms are able to reap the benefits of
temporary market power and drive down the profits of firms that are lagging behind (Aghion et al., 2005, Norbäck and
Persson, 2012, and Vives, 2008).
3.1.2.1. The Deregulation of Product Markets in Sweden
Throughout most of the twentieth century, many product markets in Sweden were public monopolies. Thus, new firms had
no or very few opportunities to enter these markets, and consumers’ influence was also limited (SOU 2005:4). Moreover,
the competition law was rather lax for a long period. The first competition legislation was implemented in 1925, which
enabled authorities to investigate companies that could have monopolistic characteristics. In 1946, the legislation became
stricter and was centred on the idea of monitoring competition restrictions in the business sector.13
Nevertheless, from an
international perspective, the competition law was very lax. A new Competition Act was implemented in 1993 that was
based on three cornerstones: the prohibition of restrictive agreements, prohibition of abuse of dominance, and prohibition of
control of concentrations (mergers). This new competition law indicated that the competition policy had become much
stricter than before.
In the 1980s, discussions on how to reform the Swedish welfare state became increasingly intense. The centre-right
government that came to power in 1991 was seemingly intent on implementing an economic policy based on extensive
deregulation in response to the country’s economic crisis in the 1990s. However, many of these reforms, such as the
deregulation of the air traffic system, the electricity market, and the postal service, had already been thoroughly
investigated, and government policies had previously been outlined in government white papers prepared by the Social
Democratic government in the late 1980s and early 1990s. Moreover, in 1993 (SOU 1993:16), the so-called Lindbeck
Commission presented a number of proposals to improve the efficiency and functioning of product markets in Sweden.
Overall, the intensity of competition increased substantially in many Swedish product markets during the 1990s.
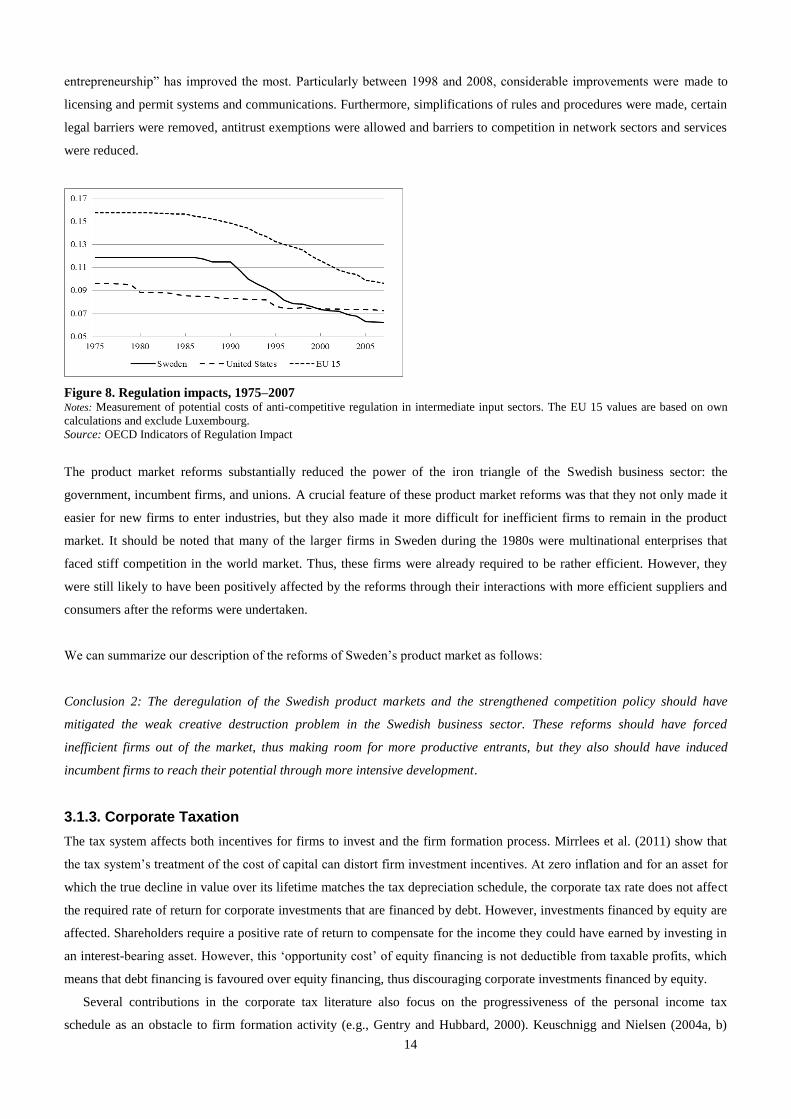
The OECD has long calculated an index of the “knock-on” cost to manufacturing industries of regulations in the service
and utility industries. This index is shown in Figure 8, where we see that regulations on utilities and services imposed high
additional costs on manufacturing in the 1970s and 1980s, but these costs decreased sharply as Sweden began to deregulate
in the late 1980s and early 1990s. Thus, beginning in the mid-1990s, the costs of regulation in the services and utilities
sectors were substantially lower in Sweden than the average of the EU 15 and were even lower than such costs in the US
and the UK.
Since the late 1990s, the OECD has also constructed a system of indicators to measure on-going developments in
Product Market Regulations (PMR) across the OECD countries (Wölfl et al., 2009). For Sweden, the category “barriers to
13 This monitoring was enabled through investigations but also through the registration of cartels in a public record called the Cartel Register (CR), or Kartellregistret. The idea
behind the CR was to highlight the extent of anti-competitive agreements in the Swedish business community and, by doing so, to help prevent possible adverse effects of such
agreements on competition.
14
entrepreneurship” has improved the most. Particularly between 1998 and 2008, considerable improvements were made to
licensing and permit systems and communications. Furthermore, simplifications of rules and procedures were made, certain
legal barriers were removed, antitrust exemptions were allowed and barriers to competition in network sectors and services
were reduced.
Figure 8. Regulation impacts, 1975–2007 Notes: Measurement of potential costs of anti-competitive regulation in intermediate input sectors. The EU 15 values are based on own
calculations and exclude Luxembourg.
Source: OECD Indicators of Regulation Impact
The product market reforms substantially reduced the power of the iron triangle of the Swedish business sector: the
government, incumbent firms, and unions. A crucial feature of these product market reforms was that they not only made it
easier for new firms to enter industries, but they also made it more difficult for inefficient firms to remain in the product
market. It should be noted that many of the larger firms in Sweden during the 1980s were multinational enterprises that
faced stiff competition in the world market. Thus, these firms were already required to be rather efficient. However, they
were still likely to have been positively affected by the reforms through their interactions with more efficient suppliers and
consumers after the reforms were undertaken.
We can summarize our description of the reforms of Sweden’s product market as follows:
Conclusion 2: The deregulation of the Swedish product markets and the strengthened competition policy should have
mitigated the weak creative destruction problem in the Swedish business sector. These reforms should have forced
inefficient firms out of the market, thus making room for more productive entrants, but they also should have induced
incumbent firms to reach their potential through more intensive development.
3.1.3. Corporate Taxation
The tax system affects both incentives for firms to invest and the firm formation process. Mirrlees et al. (2011) show that
the tax system’s treatment of the cost of capital can distort firm investment incentives. At zero inflation and for an asset for
which the true decline in value over its lifetime matches the tax depreciation schedule, the corporate tax rate does not affect
the required rate of return for corporate investments that are financed by debt. However, investments financed by equity are
affected. Shareholders require a positive rate of return to compensate for the income they could have earned by investing in
an interest-bearing asset. However, this ‘opportunity cost’ of equity financing is not deductible from taxable profits, which
means that debt financing is favoured over equity financing, thus discouraging corporate investments financed by equity.
Several contributions in the corporate tax literature also focus on the progressiveness of the personal income tax
schedule as an obstacle to firm formation activity (e.g., Gentry and Hubbard, 2000). Keuschnigg and Nielsen (2004a, b)

15
focus on the effects of various tax policies when entrepreneurs face financial constraints and must enter into contracts with
venture capitalists under conditions of one-sided or two-sided moral hazard. Haufler et al. (2014) show that the tax system
might create distortions in the types of projects that entrepreneurial start-up firms undertake.14
Thus, the corporate tax system runs the risk of reducing the incentives for investments and of distorting the efficiency of
the market by favouring certain types of corporate ownership over others, such as incumbents over start-ups. We refer to
this problem as the tax incentives and discrimination problem in the business sector. Let us now use this background to
discuss the implications of the Swedish reforms in the corporate ownership market to predict how these reforms might have
affected the performance of the Swedish business sector.
3.2.3.1 Corporate Taxation Reforms in Sweden
Corporate taxation increased substantially in Sweden during the 1970s and the 1980s, leading to very high corporate taxes
from an international perspective. Due to the increased awareness of the negative effects of high taxation on business
activities and increased international competition, the tax was reduced from 52 to 30 per cent in the 1990–91 tax reform
package. The rate was then further reduced to 28 per cent in 1994.
Owners of corporations may not only pay taxes indirectly through corporate taxes; they may also pay taxes on capital
gains. The Swedish marginal tax rate on capital gains on long-term holdings was zero until 1965. The tax changes
implemented in 1976 sharply increased the top marginal tax rate to more than 30 per cent, and it reached a peak in 1979 at
nearly 35 per cent. Thereafter, it decreased to approximately 25 per cent prior to the 1990–1991 tax reforms (Stenkula et al.,
2014). The 1990–1991 tax reforms made all capital gains fully taxable independent of the holding period. However, capital
gains were no longer taxed jointly with labour income but rather by a separate capital income tax at a flat rate of 30 per cent.
In 1992–93, this separate capital income tax rate was temporarily reduced to 25 per cent, and in 1994 it was temporarily
reduced to 12.5 per cent.
Importantly, until 1991, the Swedish tax system did not favour new, small, and less capital-intensive firms, but it did
favour large firms and institutional ownership (pension funds, insurance companies, etc.). The 1991 tax reform and some
subsequent minor reforms considerably levelled the playing field for different combinations of owners and sources of
financing (Edquist and Henrekson, 2013). The reforms in the 1990s generated a tax system that was far more positive for
individuals who wished to start, develop, and act as the controlling owners of firms compared with the situation in the 1970s
and 1980s.
However, it should be noted that it does not suffice to only examine the (marginal) tax rates to judge a tax system’s
effect on firm performance. Evaluating the effect of a tax system on corporate capital investment is a complicated task.
Many aspects, such as project type and the form of financing, need to be considered. Here, the devil is in the details. A
generally accepted method of evaluating a capital tax system is to calculate the marginal effective tax rate on capital
(METR) based on the method originally presented by King and Fullerton (1984).
Devereux et al. (2002) use a simplified version of this method to compare the marginal effective corporate taxes for a
number of EU countries, Japan and the US in 1982 and 2001. These comparisons are shown in Figure 9. The figure shows
that Sweden had the second highest rate in 1982 at approximately 53 per cent but the second lowest rate in 2001 at
14 The empirical literature on the productivity effects of corporate taxation has mostly inferred effects from indirect channels such as R&D and capital investment. The relationship between tax policy (mostly R&D tax credits) and the volume or location of R&D across countries and US states is reviewed by Hall and van Reenen (2000). See Auerbach (2002), Gordon and Hines (2002), Hasset and Hubbard (2002), and Hines (2005) for the relationship between taxation and investments. Evidence on the effects of taxation on industry entry and exit rates is presented by Da Rin et al. (2011), Djankov et al. (2010), and Kneller and McGowan (2012). Carroll et al. (2000, 2001) examine the effects of the US tax reforms in the 1980s on the investment and hiring decisions of small businesses and find significant effects. Arnold et al. (2011) demonstrate that corporate taxation has a direct effect on firm productivity growth by lowering the growth rate of firms that are in more profitable industries. Using data for 11 European countries, Gemmell et al. (2013) find evidence that productivity growth in small firms is lower the higher that the corporate tax rates are.

16
approximately 22 per cent. Hence, corporate taxes were indeed reduced from very high levels to low levels during the
reforms of the 1990s.
Figure 9. Effective marginal corporate tax rates Notes: Replication of author’s Figure 5, pg. 462, “Calculations based on a hypothetical investment in plant and machinery for one period, financed by
equity or retained earnings (but not debt). Taxation at the shareholder level is not included. The project is expected to break even, i.e., there is no economic
rent. Other assumptions are that the real discount rate is 10 per cent, the inflation rate 3.5 per cent, and the depreciation rate is 12.25 per cent. Source: Devereux et al. (2002)
Figure 10. Marginal effective tax rate on capital income, 1960–2013 Notes: Values concern the marginal tax of a taxpayer with the average annual wage of a production worker.
Source: Stenkula et al. (2014)
Using the King and Fullerton (1984) approach, Johansson et al. (2014) examine the marginal effective tax rate on capital
(METR) for a longer time period for Sweden. Figure 10 depicts the METR (in per cent) of an investment financed with new
share issues, retained earnings and debt in Sweden for the period 1962–2010. The figure provides further evidence
regarding the high METR for external capital in the 1980s and its significant reduction in the tax reform of 1991. These
corporate and capital tax reforms created opportunities for firm development, particularly for small new firm growth and
firm formation. Thus, we make the following conclusion:
Conclusion 3. The corporate tax reforms in Sweden in the 1990s should have mitigated the problem of outsider
discrimination in the market for corporate ownership. The reduced taxes on corporate external financing should have led to
increased entry and growth of new, productive firms in the Swedish business sector.
3.1.4. Foreign Direct Investment (FDI)
Business regulation affects the actions that firms can take and the balance of power that exists between various firm
stakeholders. Politicians may benefit from protecting owners from competition and then sharing the rents that arise from
such protection (Olson, 1965, Stigler, 1971, and Perotti and Volpin, 2007). Moreover, in more open economies, lobbying

17
for international protection might occur (Spencer and Brander, 1983, and Grossman and Helpman, 1994). Politicians might
also have an incentive to favour domestic owners in the market for corporate control (Horn and Persson, 2001, and Norbäck
et al. 2014).
Thus, regulation might affect the efficiency of the corporate ownership market by favouring certain types of ownership
over others, such as domestic over foreign. We refer to the problem as the foreign discrimination problem in the market for
corporate ownership. Let us now use this background to discuss the implications of the Swedish reforms in the corporate
ownership market to predict how such reforms might have affected the performance of the Swedish business sector.
3.1.4.1. The Liberalization of Foreign Direct Investment in Sweden
Foreign exchange controls were introduced in Sweden shortly after the onset of World War II. In practice, this legislation
excluded any substantial foreign ownership of Swedish industry. The purpose of this legislation was openly protectionist,
i.e., to ascertain that “Swedish firms remain controlled by Swedish interests” (SOU 1986:23, p. 143). As expected, legal
impediments ensured that foreign ownership remained low, with foreign ownership of listed stocks never exceeding 8 per
cent throughout the 1980s, and less than 5 per cent of private sector employees worked in foreign-owned companies
(Henrekson and Jakobsson, 2005).
Between 1989 and 1993, the government undertook measures that opened the market for foreign ownership. This change
could be considered the final deregulation of the Swedish capital market that began in the early 1980s, thus following a
global trend of credit market deregulation in response to the more globalized economy (see Henrekson and Jakobsson,
2005, for a description of the major steps in the international deregulation process).
At a mere 7 per cent in 1989, the share of foreign ownership had skyrocketed to 40 per cent only ten years later
(Henrekson and Jakobsson, 2005). This increase also led to significant growth in the share of employees working in foreign-
owned firms, which increased from approximately 5 per cent at the end of the 1980s to 23 per cent in 2011. This change in
inward FDI was indeed dramatic, even from an international perspective. Figure 11 shows that the inward FDI stock as a
percentage of GDP in Sweden was approximately 5 per cent in the early 1990s, which was approximate half the EU 15
average. After the 1990s, Sweden’s inward FDI stock became substantially higher than the EU 15 average.15
Figure 11. Inward FDI stock (per cent of GDP), 1990–2013 Notes: The EU 15 values are based on own calculations and exclude Luxembourg. Source: World Investment Report
The injection of foreign ownership likely improved productivity development in the Swedish business sector. Having a
larger pool of potential owners should increase the potential for synergies. Foreign ownership may not only increase
15 The increase in foreign ownership was especially strong in the mid-1990s. Employment in foreign-owned firms almost tripled between 1995 and 2013, from approximately
240,000 in 1995 to 630,000 in 2013.

18
productivity through better use of assets but bidding competitions may also generate large asset returns for previous
Swedish owners who can then use these proceeds to invest in new projects or industries (Norbäck and Persson (2007).
We conclude the description of the liberalization process of inward FDI in Sweden in the 1990s as follows:
Conclusion 4. The liberalization of inward FDI in Sweden should have substantially mitigated the problem of foreign
discrimination in the corporate ownership market in the Swedish business sector. These reforms should have meant that
inefficient Swedish target firms would be acquired by more efficient foreign owners, which should have improved these
firms’ productivity. Moreover, this development should have spurred the incentive to create start-ups for sale in the market
for corporate control.
4. EMPIRICAL ANALYSIS
The previous section documented that after a period of interventionist policies in the 1970s and 1980s, Sweden deregulated
its product and labour markets, reformed the corporate tax system and opened itself up to FDI. We have argued that these
reforms should have reduced incumbents’ and insiders’ advantages and benefitted the growth of new, efficient firms. As a
first examination of this proposition, we explore how this package of reforms affected allocative efficiency in the business
sector, i.e., how prone the market is to allocate market share to the most efficient firms in the market. We also examine the
importance of entries and exits by firms in the productivity growth of the Swedish business sector. Finally, we examine
whether the reforms affected how the market rewards productive labour and firms by investigating how the relationship
between productivity and wages has changed over time. This approach provides us with an overall picture of the change in
the efficiency of the Swedish business sector.
We then examine the job creation-job destruction process, where we focus on the different roles played by small and
large firms and note that the reforms in the labour and product market and the changes in the tax system should have
benefitted smaller firms. We also consider the ICT revolution and the skill-biased technology changes, which should have
affected the matching process in the labour market, by examining how the employment of unskilled and skilled labour has
evolved.
We are able to undertake a more detailed empirical investigation in two of our reform areas: how the intensity of product
market competition affects firm productivity patterns and - in particular - how FDI and foreign ownership have impacted the
productivity process.
Data
The empirical analysis requires that we are able to follow firms and individuals over time, which therefore necessitates
access to highly detailed data. Therefore, we base our analysis on detailed employer-employee data from Statistics Sweden
(SCB) covering the period 1990–2009.16
The data originate from several register-based data sets from Statistics Sweden and
cover all firms in the private sector. First, the financial statistics contain detailed firm-level information on all Swedish firms
in the private sector during the period 1996-2009. Examples of variables are value added, capital stock (book value),
number of employees, total wages, ownership status, profits, sales, and industry affiliation. Second, the Regional Labour
Market Statistics (RAMS) include data on all plants for the period 1990-2009. The RAMS adds information on the
composition of the labour force with respect to educational level and demographics at the plant level, which we aggregate to
16 See, e.g., Davidson et al. (2014) and Hakkala et al. (2014) for recent articles based on the data.

19
the firm level. Individual-, plant- and firm-level data can be linked together using unique tracking numbers. From an
international perspective, the data are rather unique in terms of both magnitude and level of detail. A description of the
included variables is presented in Table A1 in the Appendix.
A potential problem in an analysis of employment dynamics is the difficulty of following firms over time. Using
organization numbers as a method for identifying continuing, entering and exiting firms can be problematic because such
numbers can change for various reasons. To more reliably follow firms over time, we use additional data from Statistics
Sweden (FAD data). These data make it possible to identify new firm entry and firm exits, which means that we can analyse
employment changes in (i) completely new units, (ii) continuing units and (iii) exiting units.17
To measure productivity, we use labour productivity, which is defined as value added per employee. Value added per
employee is a commonly used measure of productivity and is easily comparable across countries. Value added is calculated
as output value minus costs of purchased goods and services excluding wages and other personnel costs (calculated by SCB
according to the international definition).18
4.1. Productivity Dynamics in the Swedish Business Sector
Figure 12 depicts the evolution of employment-weighted and un-weighted labour productivity in Sweden in firms with at
least 10 employees for the period 1996–2009.19
The weighted measure is defined as
tf
If
tft psP ,,
where Pt is employment-weighted labour productivity in year t, sf,t is firm f’s employment share at year t and pf,t is labour
productivity per employee in firm f at time t. We see that labour productivity increased steadily during the period, with
slumps in the aftermath of the IT crash in 2001 and during the outbreak of the financial crisis in 2008. Note that because the
employment-weighted labour productivity is higher than the un-weighted measure, productivity has increased more in larger
firms than in smaller firms. We will return to this observation in the next section.
Figure 12: Labour productivity 1996–2009
17 See Andersson and Arvidsson (2011) for details on the FAD data. 18 Another measure of productivity is Total Factor Productivity (TFP). Studies that use both labour productivity and TFP typically find similar results irrespective of
the measure used (see, for instance, Bartelsman and Doms (2000) and Syverson (2011) for discussions of different productivity concepts). 19 Note that productivity data for all firms are only available for the period 1996-2009.

20
4.1.1. Allocative Efficiency
Figure 12 illustrates the strong recovery of the Swedish economy after the crisis at the beginning of the 1990s. In the
previous section, we emphasized the structural reforms that began in the 1980s: the reforms in the product market, the
reforms affecting inward FDI, and the reforms of the labour market with more decentralized wage setting and less job
security for workers with temporary contracts. We also emphasized that the tax system discriminated against smaller firms
with high growth potential.
In this section, we begin to develop evidence regarding the reforms’ effect on the efficiency of the economy. We begin
by using a productivity decomposition proposed by Olley and Pakes (1996) to analyse productivity and reallocation. The
Olley and Pakes method decomposes aggregate productivity into two terms, thus implying that the weighted productivity in
the business sector can be written as the sum of the simple (un-weighted) average productivity and the covariance between
productivity and market share.20
That is,
Pt = E[pt ] +cov(pf, t, sf, t )
The second term has a natural efficiency interpretation term and can be interpreted as the extent to which market share is
allocated to high-productivity firms. If the covariance between firms’ productivity and their share of labour is strictly
positive, then more productive firms tend to attract a larger share of workers, which is what we would expect in a well-
functioning market economy.
To examine whether such allocative efficiency has changed over time in Sweden, we compute the Olley and Pakes
covariance term at the two-digit industry level for each year during the period 1996-2009. Figure 13 presents the result
measured as yearly figures on the mean of the covariance term. As seen in Figure 13, we find an increasing allocative
efficiency in Sweden, which demonstrates that the reforms should have improved the market allocation of resources.
One drawback of this calculation is that we cannot compare developments in Sweden with those of other countries.
However, Andrews and Cingano (2014) use firm-level data from a commercial data source covering 21 OECD countries for
2005 to analyse how structural policies affect resource allocation efficiency. Investigating the Olley and Pakes covariance,
they find that Sweden has the largest allocative efficiency. This result is consistent with the substantial changes in Sweden
that we have accounted for in the previous section and the increase in allocative efficiency that we depict in Figure 13.
Interestingly, Andrews and Cingano (2014) also examine the source of the variation in the allocative efficiency term. The
authors report that regulations related to employment protection, product market competition and FDI are negatively related
to productivity through a worsening of allocative efficiency, which indicates a reduced ability to allocate resources to more
productive firms.
20 See, e.g., Foster el al., 2001 for details. One advantage of their cross-sectional decomposition method is that cross-sectional productivity differences are more persistent and
possibly less sensitive to measurement errors and temporary shocks. The Olley and Pakes approach also does not depend on how the entries and exits of firms are measured.

21
Figure 13: The development of the Olley and Pakes covariance term, 1996-2009; means across two-digit industries
4.1.2. Entry and Exit of Firms
In Section 3, we suggested that labour market and in particular product market reforms combined with tax reforms may
have reduced the barriers to entry, and these actions might have played an important role in the turnaround of the Swedish
business sector by improving the creative destruction process.
To distinguish the effect of the entry of new firms and exits of incumbents from the expansion and contraction of
existing firms, we now use a decomposition method to analyse the drivers of overall productivity in greater detail (see
Foster et al., 2001 for a discussion of different decomposition methods). The decomposition allows us to distinguish
aggregate productivity changes at the intensive margin from those at the extensive margin.21
effectExit .5
1,1,
effectEntry .4
1,,
effect Cross.3
,,
effect firmBetween .2
,1,
effect firmWithin .1
,1,
ttf
Uf
tf
Nf
ttftftf
Ff
tf
Ff
tfttftf
Ff
tft
Pps
PpsspsPppsP
(1)
Using firm‐level data allows us to disentangle overall productivity growth into different components, which can indicate
whether Swedish productivity growth originated from within‐industry dynamics (firm‐level productivity growth), a
reallocation of market share between existing firms (incumbents) or the entry and exit of firms. Even if the productivity of
individual firms does not change, productivity can change substantially due to changes in the market shares of firms with
different productivity levels. These insights are difficult to obtain with more aggregated data.
The first component in Equation 1 reflects the extent to which productivity growth resulted from changes in firm‐level
productivity growth (∆𝑝𝑓,𝑡) for given market shares (𝑠𝑓,𝑡−1). The second component shows the extent to which changes in
firms’ market shares explain productivity growth at a given productivity level. This effect is positive if, for instance,
employment shares (∆𝑠𝑓,𝑡) are increasing for firms that are more productive than the average productivity in the previous
21 The results are qualitatively similar when we use Griliches and Regev’s (1995) alternative decomposition method.

22
year (𝑝𝑓,𝑡 − 𝑃𝑡−1). The third component interacts changes in firm‐level productivity with changes in employment shares.
This term is positive if firms with positive productivity growth increase their market shares. It is also positive if firms with
negative productivity growth decrease their market shares. Analogously, it is negative if firms with positive (negative)
productivity growth decrease (increase) their market shares. The final two components indicate the effects on productivity
growth of firms that enter or exit markets. The entry effect will increase average productivity if new firms have higher-than-
average productivity. Similarly, the exit of firms will have a positive effect on overall productivity growth if the firms that
exit have lower-than-average productivity.
As discussed in Section 3, a new firm with good business ideas and products and innovative production processes will
have good opportunities to rapidly increase its productivity if the product market is competitive. If the firm enters the
market with a superior technology or product, the increase in competition may cause exits by less efficient rivals, and the
firm will take an increasing share of the market. However, if a new firm finds that its technology or product is not good
enough to compete in the market, it will have to exit.
Both of these effects are clearly visible in Figure 14, which presents the results from our productivity decomposition for
the entire period 1996–2009. Here, we see that more than half of the overall increase in productivity in the business sector
originated from new firms. New firms that survive will gradually become more efficient than the average firm and will
therefore contribute positively to long-term productivity growth. As seen in Figure 14, the contribution to productivity
growth made by entering firms exceeded that of incumbents (firms that are active throughout the period 1996–2009).
Hence, over the period studied, it is clear that the entry of new firms is the main factor driving the increase in productivity in
the Swedish business sector. This result is consistent with the lower entry barriers in Sweden enhancing the creative
destruction process (Conclusion 2). Increased entry also emerged due to the corporate tax reforms (which levied the playing
field between entrants and incumbents) by promoting new firm start-ups and, as we will see below, opening-up the economy
to FDI (Conclusions 3 and 4).
Figure 14: Labour productivity growth decomposition, 1996–2009
Figure 14 also shows similar results for firms in the manufacturing and service sectors. The overall change in productivity
between 1996 and 2009 appears to have been somewhat larger in the manufacturing sector than in the service sector. We
also observe a positive cross effect in the manufacturing sector. This result indicates that the established manufacturing
firms that expanded also increased their productivity (or that established manufacturing firms that reduced their productivity
23
also experienced decreasing employment shares). Interestingly, this cross effect is negative in the services sector, however.
This result is consistent with the fast-growing nature of the service sector, where there are many expanding firms that
experience declining productivity during their growth phase.
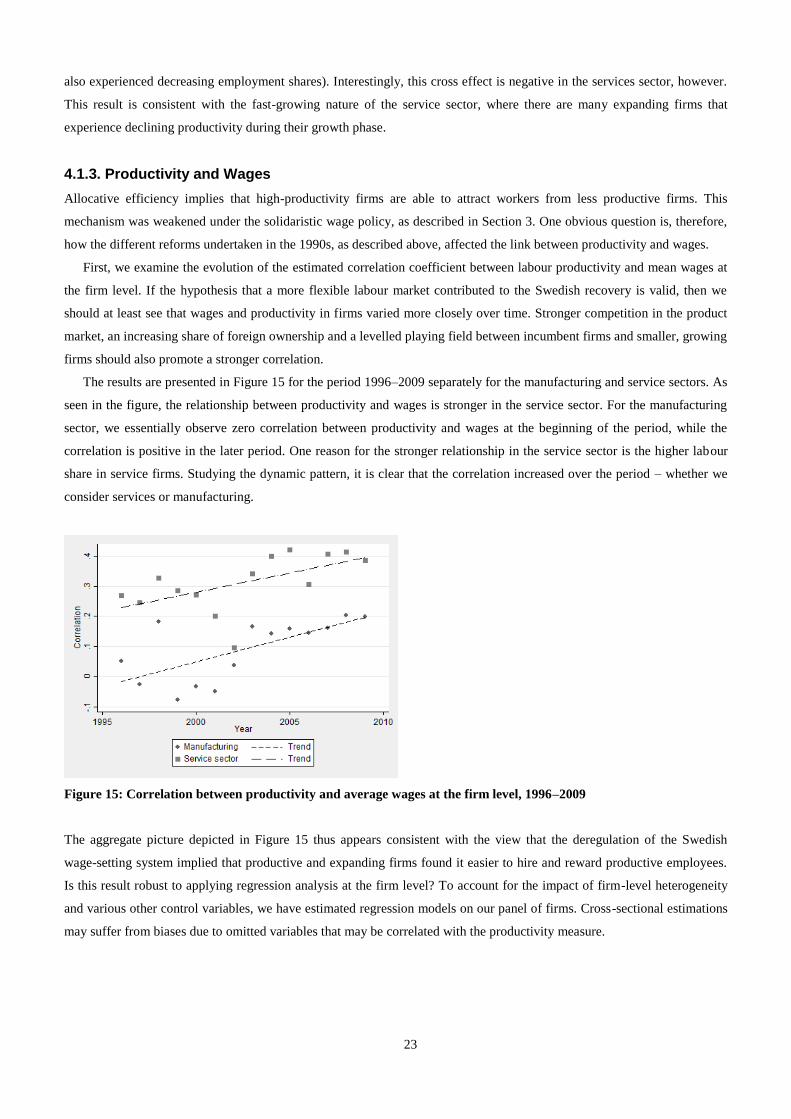
4.1.3. Productivity and Wages
Allocative efficiency implies that high-productivity firms are able to attract workers from less productive firms. This
mechanism was weakened under the solidaristic wage policy, as described in Section 3. One obvious question is, therefore,
how the different reforms undertaken in the 1990s, as described above, affected the link between productivity and wages.
First, we examine the evolution of the estimated correlation coefficient between labour productivity and mean wages at
the firm level. If the hypothesis that a more flexible labour market contributed to the Swedish recovery is valid, then we
should at least see that wages and productivity in firms varied more closely over time. Stronger competition in the product
market, an increasing share of foreign ownership and a levelled playing field between incumbent firms and smaller, growing
firms should also promote a stronger correlation.
The results are presented in Figure 15 for the period 1996–2009 separately for the manufacturing and service sectors. As
seen in the figure, the relationship between productivity and wages is stronger in the service sector. For the manufacturing
sector, we essentially observe zero correlation between productivity and wages at the beginning of the period, while the
correlation is positive in the later period. One reason for the stronger relationship in the service sector is the higher labour
share in service firms. Studying the dynamic pattern, it is clear that the correlation increased over the period – whether we
consider services or manufacturing.
Figure 15: Correlation between productivity and average wages at the firm level, 1996–2009
The aggregate picture depicted in Figure 15 thus appears consistent with the view that the deregulation of the Swedish
wage-setting system implied that productive and expanding firms found it easier to hire and reward productive employees.
Is this result robust to applying regression analysis at the firm level? To account for the impact of firm-level heterogeneity
and various other control variables, we have estimated regression models on our panel of firms. Cross-sectional estimations
may suffer from biases due to omitted variables that may be correlated with the productivity measure.
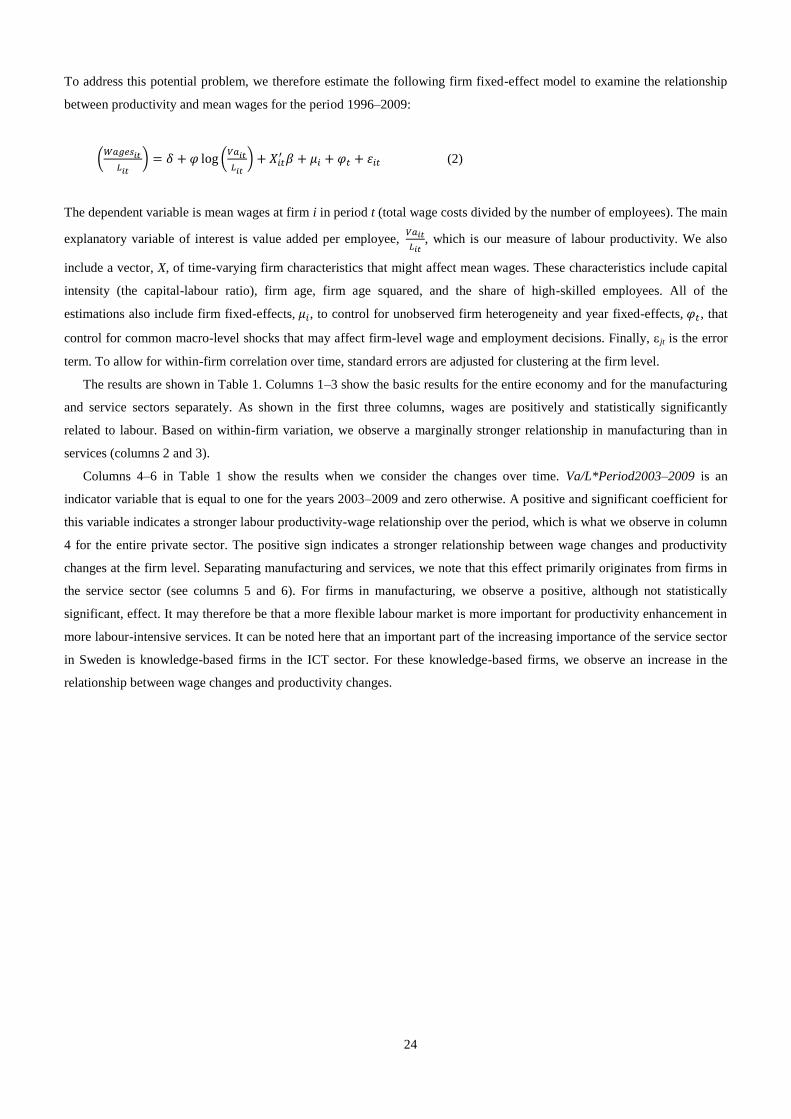
24
To address this potential problem, we therefore estimate the following firm fixed-effect model to examine the relationship
between productivity and mean wages for the period 1996–2009:
(𝑊𝑎𝑔𝑒𝑠𝑖𝑡
𝐿𝑖𝑡
) = 𝛿 + 𝜑 log (𝑉𝑎𝑖𝑡
𝐿𝑖𝑡
) + 𝑋𝑖𝑡′ 𝛽 + 𝜇𝑖 + 𝜑𝑡 + 휀𝑖𝑡 (2)
The dependent variable is mean wages at firm i in period t (total wage costs divided by the number of employees). The main
explanatory variable of interest is value added per employee, 𝑉𝑎𝑖𝑡
𝐿𝑖𝑡, which is our measure of labour productivity. We also
include a vector, X, of time-varying firm characteristics that might affect mean wages. These characteristics include capital
intensity (the capital-labour ratio), firm age, firm age squared, and the share of high-skilled employees. All of the
estimations also include firm fixed-effects, 𝜇𝑖, to control for unobserved firm heterogeneity and year fixed-effects, 𝜑𝑡 , that
control for common macro-level shocks that may affect firm-level wage and employment decisions. Finally, jt is the error
term. To allow for within-firm correlation over time, standard errors are adjusted for clustering at the firm level.
The results are shown in Table 1. Columns 1–3 show the basic results for the entire economy and for the manufacturing
and service sectors separately. As shown in the first three columns, wages are positively and statistically significantly
related to labour. Based on within-firm variation, we observe a marginally stronger relationship in manufacturing than in
services (columns 2 and 3).
Columns 4–6 in Table 1 show the results when we consider the changes over time. Va/L*Period2003–2009 is an
indicator variable that is equal to one for the years 2003–2009 and zero otherwise. A positive and significant coefficient for
this variable indicates a stronger labour productivity-wage relationship over the period, which is what we observe in column
4 for the entire private sector. The positive sign indicates a stronger relationship between wage changes and productivity
changes at the firm level. Separating manufacturing and services, we note that this effect primarily originates from firms in
the service sector (see columns 5 and 6). For firms in manufacturing, we observe a positive, although not statistically
significant, effect. It may therefore be that a more flexible labour market is more important for productivity enhancement in
more labour-intensive services. It can be noted here that an important part of the increasing importance of the service sector
in Sweden is knowledge-based firms in the ICT sector. For these knowledge-based firms, we observe an increase in the
relationship between wage changes and productivity changes.
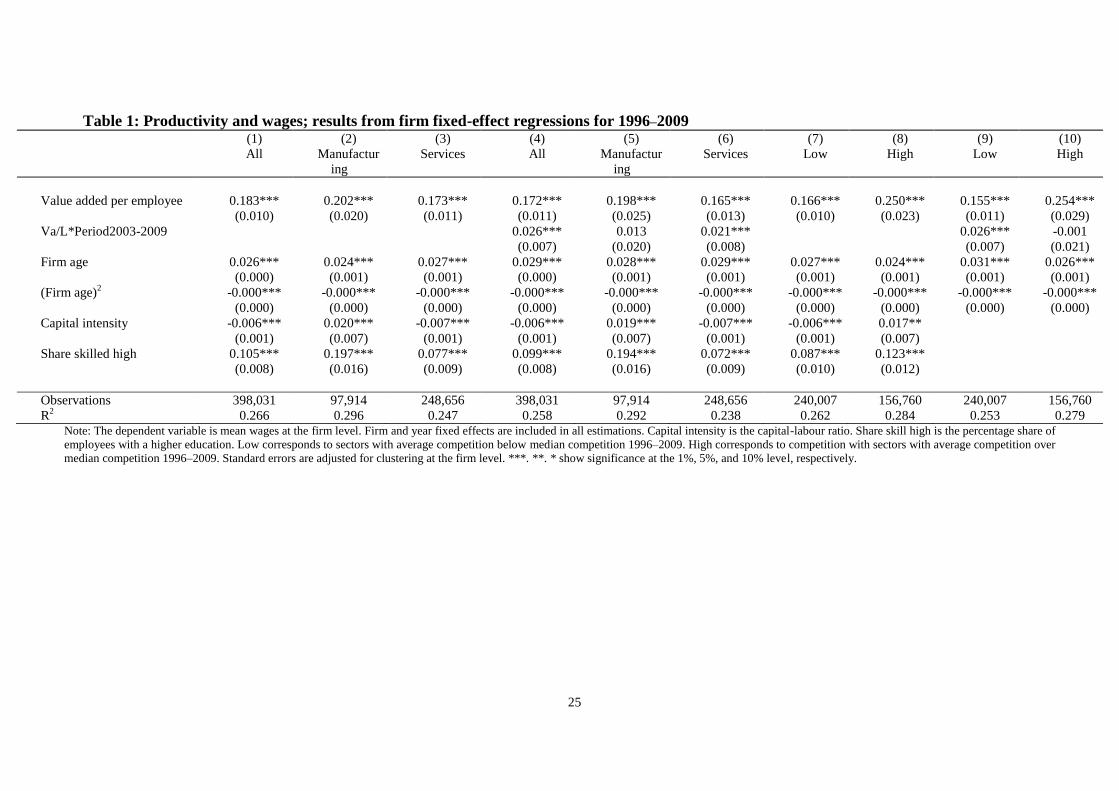
25
Table 1: Productivity and wages; results from firm fixed-effect regressions for 1996–2009 (1) (2) (3) (4) (5) (6) (7) (8) (9) (10)
All Manufactur
ing
Services All Manufactur
ing
Services Low High Low High
Value added per employee 0.183*** 0.202*** 0.173*** 0.172*** 0.198*** 0.165*** 0.166*** 0.250*** 0.155*** 0.254***
(0.010) (0.020) (0.011) (0.011) (0.025) (0.013) (0.010) (0.023) (0.011) (0.029)
Va/L*Period2003-2009 0.026*** 0.013 0.021*** 0.026*** -0.001
(0.007) (0.020) (0.008) (0.007) (0.021)
Firm age 0.026*** 0.024*** 0.027*** 0.029*** 0.028*** 0.029*** 0.027*** 0.024*** 0.031*** 0.026***
(0.000) (0.001) (0.001) (0.000) (0.001) (0.001) (0.001) (0.001) (0.001) (0.001)
(Firm age)2 -0.000*** -0.000*** -0.000*** -0.000*** -0.000*** -0.000*** -0.000*** -0.000*** -0.000*** -0.000***
(0.000) (0.000) (0.000) (0.000) (0.000) (0.000) (0.000) (0.000) (0.000) (0.000)
Capital intensity -0.006*** 0.020*** -0.007*** -0.006*** 0.019*** -0.007*** -0.006*** 0.017**
(0.001) (0.007) (0.001) (0.001) (0.007) (0.001) (0.001) (0.007)
Share skilled high 0.105*** 0.197*** 0.077*** 0.099*** 0.194*** 0.072*** 0.087*** 0.123***
(0.008) (0.016) (0.009) (0.008) (0.016) (0.009) (0.010) (0.012)
Observations 398,031 97,914 248,656 398,031 97,914 248,656 240,007 156,760 240,007 156,760
R2 0.266 0.296 0.247 0.258 0.292 0.238 0.262 0.284 0.253 0.279
Note: The dependent variable is mean wages at the firm level. Firm and year fixed effects are included in all estimations. Capital intensity is the capital-labour ratio. Share skill high is the percentage share of
employees with a higher education. Low corresponds to sectors with average competition below median competition 1996–2009. High corresponds to competition with sectors with average competition over
median competition 1996–2009. Standard errors are adjusted for clustering at the firm level. ***. **. * show significance at the 1%, 5%, and 10% level, respectively.

26
4.2. Employment, Productivity and Firm Size
We now turn to an examination of how the Swedish restructuring process influenced the combined job and productivity
dynamics process. Here, we apply a method for studying job dynamics introduced in seminal papers by Dunne et al. (1989)
and Davis and Haltiwanger (1990, 1992). The method allows us to observe which type of gross job flows drive a given
change in net employment by decomposing aggregate employment changes into their underlying components. Net
employment change is defined as the difference between the jobs created in expanding and new firms and the jobs destroyed
in shrinking and closing firms. Using this concept, we obtain measures of job creation, job destruction, and total job
reallocation and observe how they are related to net employment changes. Because we are interested in job creation and
value creation and how they interact, we also extend this method to productivity dynamics. Box 3 describes the
methodology in greater detail.
In Section 3.2, we argued that labour and product market regulations and the structure of the tax system favoured large,
incumbent firms over small, new firms. In the aftermath of the deregulations, we would therefore expect employment to
increase in small firms and decrease in larger firms. In addition, other factors might contribute to these changes. The
introduction and development of ICT meant that smaller firms could better compete in the market and that they could
expand and hire.
We begin by examining job flows and net employment changes across five different firm-size classes: small firms are
those with 3–9 employees, medium-sized firms are those with 10–49 or 50–199 employees, and large firms are defined as
having 200–499 or more than 499 employees.
Figure 16 depicts a clear, negative relationship between firm size and the various job flow components. While there is a
positive employment trend for small and medium-sized firms (net job creation is positive), there is a negative net
employment change for the largest firms. While small and medium-sized firms created approximately 300,000 jobs in the
business sector from 1990–2009, large firms reduced employment by approximately 120,000 jobs (primarily during the
crisis of the 1990s). Hence, over the full 1990–2009 period, small firms, and especially the smaller medium-sized firms,
generated the increased employment, which is a result in accordance with Conclusions 2 and 3.
Box 3. A framework for job flows and productivity changes based on Davis and Haltiwanger
Definition 1: Job flows. Changes in employment (or job flows) during a period (usually one year) are given by
1. JC (”Job Creation”): the sum of employment gains in new firms or expanding employment in existing firms.
2. JD (”Job Destruction”): the sum of employment losses in contracting firms or exiting firms.
3. JR (”Job Reallocation”): The sum of job creation and job destruction, i.e., JR=JC+JD.
4. NET: The difference between job creation and job destruction is equal to the net employment change, i.e., NET=JC-JD.
Of these various job flow measures, our primary interest resides in the net employment change, NET, because this measure indicates
whether employment increases or decreases. See Appendix A2 for further details.
Definition 2: Productivity. Changes in employment-weighted productivity during a period (usually one year) are given by
1. VC (Value Creation”): the sum of employment-weighted created value added per employee originating from increased
productivity in continuing firms or through the entry of new firms.
2. VD (”Value Destruction”): the sum of employment-weighted destroyed value added per employee originating from
firms with a declining value added and through the exit of firms.
3. VR (”Job Reallocation”): The sum of value creation and value destruction is equal to value reallocation, i.e., JR=JC+JD.
4. NV: The difference between value creation and value destruction is equal to the net productivity change, i.e., NET=JC-
JD.
Again, of these various job flow measures, our primary interest resides in the net productivity change, NV. See Appendix A2 for further
details.

27
These results also translate into a decreasing share of employment in large firms. The largest firms (with at least 500
employees) had an employment share equal to 35 per cent in 1991. This share was reduced to approximately 30 per cent in
2009. Moreover, the results show that smaller medium-sized firms (10–49 employees) increased their share from
approximately 21 to 25 per cent. This result implies that the firm-size distribution in Sweden changed after the reforms, with
a larger number of medium-sized firms.
Studying total job reallocation (the sum of job creation and job destruction), we note that the smallest firms (3–9
employees) had a job reallocation rate that exceeded 40 per cent. This result can be compared to the 20 per cent rate for
firms with 11–49 employees and the below 10 per cent rate for the largest firms. This result suggests large differences in job
dynamics across firms of different sizes.22
Figure 16: Gross and net job flows, separated by firm size (number of employees) and number of jobs (in millions),
1991–2009
To examine how firm-size differences are related to productivity, Figure 17 depicts the mean contribution of total labour
productivity for each firm-size group over the period 1996–2009 using calculations based on the method developed to study
job dynamics outlined in Box 3.23
Panel (i) of Figure 17 shows that the largest firms (with at least 500 employees) accounted for more than half of the total
growth in value added per employee for firms with at least 10 employees. We also note that there are considerable
differences in productivity growth between large firms and small firms in the manufacturing sector. The corresponding
differences across firm size are much smaller in the service sector.
Panel (ii) of Figure 17 also depicts the job flow dynamics for the same sample of firms and during the same period
calculated using the same methodology (see Box 3, Definition 1). Similar to the results for the period 1990–2009 for firms
with at least three employees, we see that employment growth was strongest in small and medium-sized firms. Comparing
panels (i) and (ii) in Figure 17, we see that while large firms accounted for the largest share of the creation of value added
per employee, the largest firms also constituted the group with the fewest new net jobs created during the period (together
with firms with 200–499 employees). The strong productivity growth in the Swedish business sector contributed to higher
incomes that increased the demand for services in the economy. The low capital intensity in the service sector also implies
22 In terms of number of jobs, the results show that the smallest firms’ share of the total job reallocation was higher than their employment share. The opposite is true for job
reallocation in the largest firms. 23 See Box 3 (Definition 2). We first calculate an employment-weighted measure of created value added per employee for each firm-size class stemming from increased
productivity from continuing firms or through the entry of new firms. We label this component VC (“Value Creation”). Correspondingly, VD (“Value Destruction”) is equal to
the reduced value added per employee in each firm-size class that stems from firms becoming less productive or from destroyed value added per employee through the exit of
firms. Then, we calculate an employment-weighted measure of net labour productivity for each firm-size group, NV, which is defined as NV = VC – VD. This measure amounts
to the difference between the created and destroyed value added. Details on these calculations are presented in the Appendix.
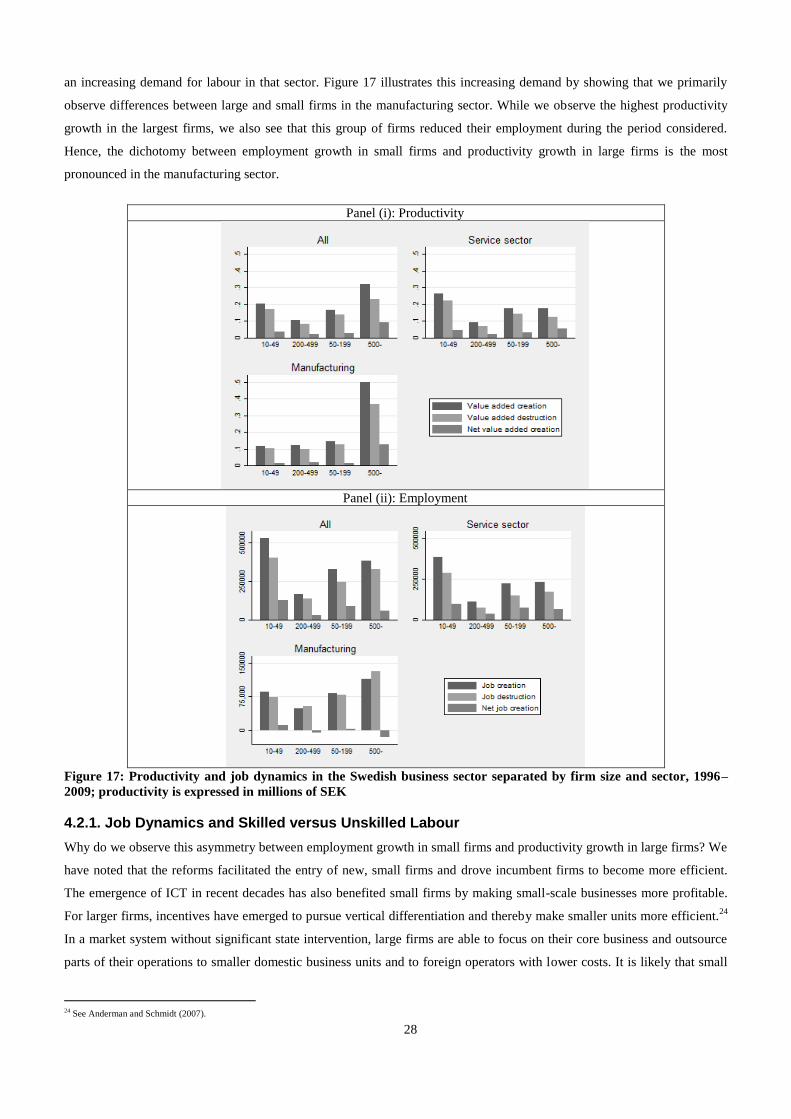
28
an increasing demand for labour in that sector. Figure 17 illustrates this increasing demand by showing that we primarily
observe differences between large and small firms in the manufacturing sector. While we observe the highest productivity
growth in the largest firms, we also see that this group of firms reduced their employment during the period considered.
Hence, the dichotomy between employment growth in small firms and productivity growth in large firms is the most
pronounced in the manufacturing sector.
Panel (i): Productivity
Panel (ii): Employment
Figure 17: Productivity and job dynamics in the Swedish business sector separated by firm size and sector, 1996–
2009; productivity is expressed in millions of SEK
4.2.1. Job Dynamics and Skilled versus Unskilled Labour
Why do we observe this asymmetry between employment growth in small firms and productivity growth in large firms? We
have noted that the reforms facilitated the entry of new, small firms and drove incumbent firms to become more efficient.
The emergence of ICT in recent decades has also benefited small firms by making small-scale businesses more profitable.
For larger firms, incentives have emerged to pursue vertical differentiation and thereby make smaller units more efficient.24
In a market system without significant state intervention, large firms are able to focus on their core business and outsource
parts of their operations to smaller domestic business units and to foreign operators with lower costs. It is likely that small
24 See Anderman and Schmidt (2007).

29
and large firms specialized in different activities during the ICT revolution and in the presence of so-called skill-biased
technological change. Large, incumbent firms should then have reduced their employment of less skilled labour while
improving their productivity by upgrading their technology and increasing their employment of skilled labour. Moreover,
the increased income from higher productivity and the increased demand for services should promote employment growth
in smaller firms, particularly in the service sector, in an economy with low barriers to entry.
To investigate these issues, we group employees into three different categories: (1) workers with at most 9 years of
elementary education, (2) workers with 1–2 years of upper secondary education and (3) workers with at least 3 years of
post-secondary education. Figure 18 shows the gross job flows separated by educational level and firm size.25
The figure
also shows job creation (JC), job destruction (JD) and the net employment change for employees with different educational
levels and how these measures vary with firm size. A number of interesting observations emerge from the figure.
First, we see that essentially half of the total reduction in low-educated employees originated from the largest firms. The
bulk of these lost jobs originated from large firms in the manufacturing sector. The corresponding reduction in the smallest
firms is considerably lower.
Compulsory education Secondary education Post-secondary education
Figure 18: Gross job flows for individuals with only compulsory education, secondary education, and post-secondary
education separated by firm size (number of employees), number of jobs (in millions), 1991–2009
Turning to the medium educated (at most secondary education), we observe an increase in all size classes except for the
largest firms. Finally, job flows for the highly educated show an increase for all size groups. However, the strongest growth
is observed in the largest firms. Our results indicate that large firms experienced an increasing trend in the overall
educational level of their workforce. During the period 1996–2009, the largest firms hired more highly educated employees
while simultaneously reducing the number of workers with only compulsory or secondary education. Increased
opportunities for outsourcing due to the economic reforms described in Section 3.2 and the use of ICT in combination with
skill-biased technological change likely facilitated large firms’ efforts to concentrate on their core production activities and
outsource their other activities to small and medium-sized firms.
Overall, these results are consistent with the impact of the economic reforms described in Section 3.2 and the skill-
biased technological change that resulted in differences in job dynamics across firm size, sector, and type of jobs.
25 This separation of job flows across educational attainment is uncommon in the job dynamics literature, where essentially all of the evidence concerns the total
number of jobs and does not distinguish between the types of jobs that are created and destroyed. One exception is Gartell et al. (2010).

30
4.2.2. Product Market Competition
As posted in Conclusion 2, the deregulation of the Swedish product markets should have implied that efficient firms
expanded and that inefficient firms were to a large extent forced out of markets. Thus, the weak creative destruction
problem in the Swedish business sector would have been mitigated.
Our next take on productivity and how strengthened competition policies have affected the Swedish creative destruction
process is to first relate competition to the relationship between productivity and wages. This is related to Conclusion 1,
which proposes that the deregulation of the wage setting system in Sweden should have strengthened the relationship
between productivity and wages. This effect should be stronger in low competitive industries, since the creative destruction
process should work sufficiently well in industries with intense product market competition (Conclusion 2). Thus,
deregulations of the labour market and deregulations of the product markets work as substitutes.
A measure of product market competition
Competition has usually been measured using industry-level concentration ratios and firm-level measures of market power.
However, product market competition is a concept that is not easily captured in a single empirical measure. The
measurement issue is even more difficult since different changes in market conditions can have different implications for
firm behaviour. Therefore, the appropriate measure of product market competition is context specific. In our case, we want
to use a measure of competition capturing how severely the market punishes inefficient firm behaviour. To this end, we use
a sophisticated measure of product market competition developed by Boone et al. (2007).
Based on the theoretical work in Boone (2008), Boone et al. (2007) derive an empirical measure of product market
competition precisely along these lines. The starting point is that traditional measures of competition are theoretically
invalid and especially concentration ratios are of limited empirical value. The measure of competition that they derive is
based on the within-industry elasticity of profits with respect to marginal costs. The higher the absolute value of this
elasticity, the fiercer is competition. In other words, the measure is based on an estimate of how much relative profits are
reduced when there is an increase in firms’ marginal costs. The measure of competition is generated by estimating the
following model for each two-digit industry, using OLS:
ln (it) = t ln (ACit)+ i + t + εit (3)
Subscript i is a firm-level identifier and t indicates time period. Variable profits, it, are defined as value added less the total
wage bill. Marginal costs are approximated by average variable costs, c, which are defined as the total wage bill plus the
costs of variable inputs (sales less value added), divided by sales. Unobservable heterogeneity is taken into account by firm
fixed effects, I, and time fixed effects, t. The absolute value of the estimated profit elasticity, t, is used as our time-
varying industry measure of product market competition.
The resulting ranking of industries based on our measure shows that industries characterized by weak competition are
mainly active on the domestic market, whereas industries exposed to tough international competition are active on markets
characterized by strong product market competition.
Composition effects
Conclusion 2 proposes that the deregulation of Swedish product markets and the strengthening of competition policies
would have led to the expansion of new efficient firms and the exit of inefficient firms from markets. We analyse this by

31
investigating transition probability matrices of labour productivity across years and relate these to differences in
competition. Does product market competition influence the mobility of firms across different parts of the productivity
distribution? For each year, we divide firms into four quartiles based on industry adjusted productivity. Group 1 includes the
25 per cent firms with the lowest productivity; whereas group 4 includes the top 25 per cent of firms in terms of
productivity. Then, we compute transition probability rates for the productivity distribution between different years.26
The
results are presented in Table 2, showing result for the latest period 2003–2009.27
The table shows the transition patterns
separately for firms in industries below and above the median product market competition.
Table 2: Transition matrix for labour productivity 2003–2009, separated by product market competition. 1=Low
competition (sectors with average competition below median competition 1996–2009). 2=High competition (sectors
with average competition over median competition 1996–2009).
1 Low competition
1 Low competition
2009
2009
2003 1 2 3 4 Total
2003 1 2 3 4 Total
1 605 423 215 123 1366
1 0.44 0.31 0.16 0.09 1
2 308 906 653 205 2072
2 0.15 0.44 0.32 0.1 1
3 198 548 1177 688 2611
3 0.08 0.21 0.45 0.26 1
4 136 191 671 2358 3356
4 0.04 0.06 0.2 0.7 1
Total 1247 2068 2716 3374 9405
2 High competition
2 High competition
2009
2009
2003 1 2 3 4 Total
2003 1 2 3 4 Total
1 632 417 189 60 1298
1 0.49 0.32 0.15 0.05 1
2 549 832 449 113 1943
2 0.28 0.43 0.23 0.06 1
3 306 572 707 276 1861
3 0.16 0.31 0.38 0.15 1
4 108 173 382 681 1344
4 0.08 0.13 0.28 0.51 1
Total 1595 1994 1727 1130 6446
We first note that regardless of the degree of competition, firms tend to stay in the same quartile of the labour productivity
distribution that they started in. For instance, in the low (high) competition group, we see that 44 (49) per cent of the firms
that began in the lowest productivity quartile were still there six years later. The corresponding figures for firms in the
highest productivity quartile are 0.7 and 0.51, respectively.
The latter figures indicate that the persistence over time is much smaller for firms in the highest quartile if they are
active in a high competition environment. This is also the case in the second highest quartile where the probability for a firm
to belong to that group six years later is lower if the firm is active in a high competition environment. We also see that it is
tougher for a firm to move from the lowest to the highest or second highest productivity quartile if competition is high.
Similarly, high competition also implies a higher risk to move from the top to the bottom of the productivity distribution.
26 At a more general level, previous research has documented a high degree of persistence in productivity over time (see e.g. Baily et al. (1992) and Faggio et al. (2010). These
studies do not, however, take into account how product market competition affects the composition of firms in terms of the overall productivity distribution. 27 We have also calculated transition matrices for other periods to take into account differences in business cycle conditions, for instance. The results are not affected by the
choice of time periods.

32
We have also analysed how competition is related to the evolution of new firms. Unreported results show that tougher
competition is positive for overall productivity since it affects which firms that survive and which firms that exit markets. In
markets with high productivity, we see that the best firms in terms of relative productivity survive and grow while, at the
same time, firms in the bottom part of the productivity distribution exit. The likelihood of surviving in markets as a low
productivity firm is basically halved if the firm is active in an industry with high competition.
Overall, our results indicate that competition affects the composition of firms in terms of the overall productivity
distribution and the evaluation of productivity over time. These results are consistent with increased intensity of product
market competition (deregulations of product markets) improving the efficiency of the creative destruction process
(Conclusion 2).
Competition and the relationship between productivity and wages
To determine how product market competition is connected to the relationship between productivity and wages, we re-
estimate the models in Table 1 above on different product markets. We divide firms into two groups according to mean
competition during the period.
The results from the low- and high-competition groups are presented in columns 7 and 8. Comparing the results for these
two groups, we observe a significantly higher productivity-wage relationship in markets with higher competition. If we
instead focus on the development over the period studied, the results indicate interesting catch-up effects. It is only in the
low-competition group that we witness a strengthening of the relationship between productivity and wages over time (see
columns 9 and 10). These results indicate that although the association is generally higher in markets with relatively high
product market competition, the changes in Sweden led to a strengthened relationship between productivity and wages in
firms belonging to industries with relatively low competition.
4.2.3. Liberalization of Foreign Direct Investment
As explained in Section 3.2, one of the major reforms that was undertaken in Sweden was to lift the restrictions on foreign
ownership. This reform led to remarkably strong employment growth in foreign-owned affiliates in Sweden between 1980
and 2013, when nearly one one-fourth of workers was employed by a foreign-controlled firm. In Section 3.2, we also argued
that the increase in foreign ownership represented a much-needed injection to boost productivity in the business sector, as a
much larger pool of potential owners became available.
A caveat is that foreign acquisitions (and domestic acquisitions) in concentrated markets may occur for market power
reasons, particularly for high-quality target firms.28
If such acquisitions are dominated by foreign takeovers of Swedish
firms, the productivity effects could be small or even negative. However, even if inefficient acquisitions occur, the
requirement that an acquisition must be profitable limits the possibility of value-destroying takeovers. Moreover, market-
power-driven acquisitions should also be subject to scrutiny based on the new Competition Law, which should make such
acquisitions less frequent.
The impact of foreign acquisitions of Swedish firms on productivity in the Swedish business sector is an empirical
question. In the next section, we therefore explore the productivity effects of foreign ownership and foreign acquisitions.
28 See, e.g., Norbäck and Persson (2007).
33
We also attempt to measure the impact of foreign ownership on aggregate productivity to assess the magnitude of the
contribution of foreign ownership and increased globalization on productivity growth in Sweden.29
4.2.4. Empirical Strategy
The foreign firms that are used to estimate Equation 2 are subsidiaries that were established before 1996 either as start-ups
or greenfields during the given time period or through acquisitions of Swedish firms. Differences in labour productivity
between foreign-owned firms and Swedish-owned firms might arise because foreign firms acquire (“cherry pick”) high-
quality Swedish firms. To account for the problem of foreign-owned firms cherry picking productive Swedish firms as
targets for acquisitions and to control for unobservable firm characteristics, we estimate firm fixed-effect regression models.
These models estimate the average effect of the change from Swedish to foreign ownership on productivity. Making specific
assumptions regarding firms’ technology (i.e., that firms use a so-called Cobb-Douglas production function) and that firms
compete in an oligopoly (for example, through Cournot competition), one can derive the following equation:
log (𝑉𝐴𝑖𝑡
𝐿𝑖𝑡
) = 𝛾𝐴𝑐𝑞𝑖𝑡 + 𝜑 log (𝐾𝑖𝑡
𝐿𝑖𝑡
) + 𝜓 log(𝐿𝑖𝑡) + 𝜗𝑆ℎ𝑎𝑟𝑒_𝑠𝑘𝑖𝑙𝑙𝑒𝑑+𝜇𝑡+𝜙𝑖 + 휀𝑖𝑡. (4)
The dependent variable in Equation (4) is value added per employee in firm i at time t. Acq is an indicator variable that takes
the value of one in the period when an ownership change is recorded and thereafter. In Equation (4), we control for a firm’s
capital intensity and size in terms of employment using logs. The share of skilled workers, which is defined as the
percentage share of employees with higher education, is added as an additional control. Because all of these variables can be
endogenous to takeovers, we present specifications with and without these controls. Finally, 𝜇𝑡+𝜙𝑖 represents time and firm
fixed effects, and jt is the error term. To allow for within-firm correlation over time, standard errors are adjusted for
clustering at the firm level.
The firm fixed effects control for unobserved heterogeneity. However, firms that change ownership may already be
developing differently before a takeover relative to firms that are not acquired.30
Our approach to this problem is to address
the issue of potentially omitted variables that may be related to the likelihood of being a takeover target. For this purpose,
we exploit the fact that all of the acquisitions did not occur during the same time period. Using the “staggered” nature of the
data, we can compare estimates from the full sample of firms to estimates obtained when we drop all of the firms that were
never takeover targets from the sample. Because identification in both cases comes from within-firm variation, the
difference between the two approaches lies in the choice of the control group.31
If takeover targets as a group have different
observable and unobservable characteristics than other firms, using the target sample would provide a better estimate of the
actual takeover effect, provided that the characteristics are not time varying.
Thus, our foreign acquisition specifications are estimated on the sample of Swedish firms that were acquired by a
foreign firm at some point between 1996 and 2009.32
This approach implies that the identification of the effect of foreign
ownership stems from the variation within firms over time. In this “difference-in-difference” approach, the estimated
29 In this study, we do not track movements of workers between firms to analyze assortative matching. In a related paper by one of the authors, strong evidence is found that
increased globalization and trade liberalization improves the matching between workers and firms (Davidson et al., 2014). The analysis is conducted on similar matched worker-
firm data from Statistics Sweden. The results described in that article suggest that there may be significant gains from trade liberalization that have not been identified in the past,
i.e., increased globalization may improve the efficiency of the matching process in the labour market. 30 In other words, the concern is that the “parallel trends” assumption is violated or, more technically, that acquisitions are correlated with the error term. 31 See Stevenson and Wolfers (2006) for a detailed discussion of such a “staggered” difference-in-difference approach. 32 As a comparison, we also estimated foreign acquisition regressions on the sample of all firms (not only on target firms). This estimation provided qualitatively identical results
that are available upon request.
34
coefficient, 𝛾, indicates the average difference in the change in labour productivity that occurs in a Swedish firm after a
change to foreign ownership.
In addition, to estimate Equation (4), we also conduct an “event analysis”. Here, we undertake a before-and-after
analysis to assess whether the timing of events is consistent with takeovers being the driving force. We investigate the effect
of the takeover after one, two, and three years or more. To this end, we include a dummy for the year of the takeover,
Acquisition t = 0, and three dummies that capture the periods after the change of ownership. Acquisition t+1 is a dummy for
the period after the takeover, Acquisition t+2 for two periods after the takeover, and Acquisition>t+2 refers to a dummy that
takes the value of 1 for three periods or more after the takeover.
In all of our regressions, we also distinguish between Swedish local firms and Swedish parent MNEs.
4.2.5. Results
The unreported results when estimating the effect of foreign ownership without firm fixed effects shows that the average
difference in labour productivity between a foreign-owned firm and a Swedish-owned firm is approximately 11 per cent.
Distinguishing between Swedish local firms and Swedish multinationals, we naturally find a larger difference between
foreign-owned firms and Swedish local firms (approximately 13 per cent) than between foreign-owned firms and Swedish
multinationals (approximately 4 per cent). This foreign productivity premium suggests that the surge in foreign direct
investment in Sweden during the last two decades had a significant impact on productivity growth.
Turning to the results of Equation (4), we find that, on average, labour productivity increased by approximately 3 per
cent when ownership is transferred from Swedish to foreign ownership. We find that this effect is completely driven by
local Swedish firms without any foreign operations being taken over by foreign firms. When we examine the effect of
foreign acquisition of Swedish multinationals, we find no statistically significant effect. This result seems to be consistent
with the theory described in Section 3, as that synergies may be more easily generated when an MNE takes over a local firm
than when two MNEs merge.
In unreported regressions, we repeated the analysis of foreign ownership and foreign acquisition on other performance
measures such as average wage and employment. The results are consistent with those reported in Table 3, which indicates
the existence of a significant wage and employment premium when considering both average differences and the average
change after an acquisition. Thus, foreign ownership and acquisition also appear to have contributed to higher employment
and wages, which is what we would expect if foreign firms provide new knowledge, better management, and better products
and production methods.
The results from the “event analysis” are presented in columns 7-9. These regressions show whether the timing of events
is consistent with takeovers being the driving force. The results show no instant effect of a takeover but an effect that
increases over time. Overall, these results support Conclusion 4 in Section 3.
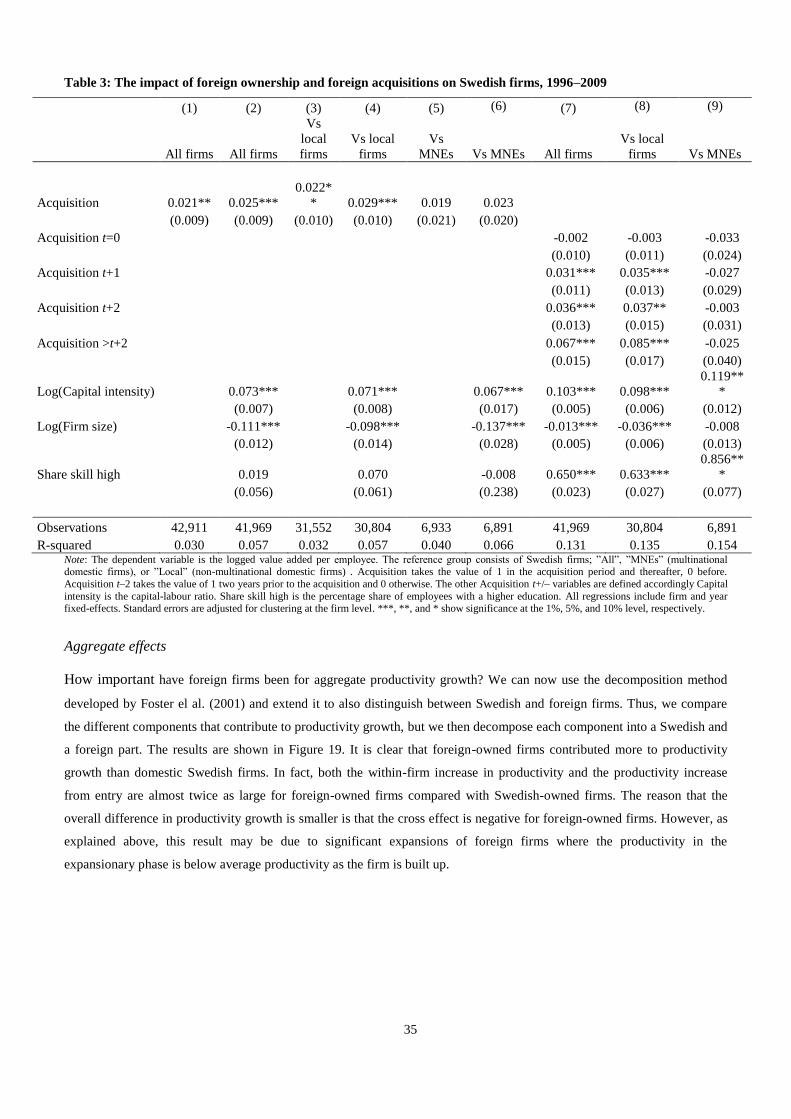
35
Table 3: The impact of foreign ownership and foreign acquisitions on Swedish firms, 1996–2009
(1) (2) (3) (4) (5) (6) (7) (8) (9)
All firms All firms
Vs
local
firms
Vs local
firms
Vs
MNEs
Vs MNEs All firms
Vs local
firms
Vs MNEs
Acquisition 0.021** 0.025***
0.022*
* 0.029*** 0.019 0.023
(0.009) (0.009) (0.010) (0.010) (0.021) (0.020)
Acquisition t=0 -0.002 -0.003 -0.033
(0.010) (0.011) (0.024)
Acquisition t+1 0.031*** 0.035*** -0.027
(0.011) (0.013) (0.029)
Acquisition t+2 0.036*** 0.037** -0.003
(0.013) (0.015) (0.031)
Acquisition >t+2 0.067*** 0.085*** -0.025
(0.015) (0.017) (0.040)
Log(Capital intensity)
0.073***
0.071***
0.067*** 0.103*** 0.098***
0.119**
*
(0.007)
(0.008)
(0.017) (0.005) (0.006) (0.012)
Log(Firm size)
-0.111***
-0.098***
-0.137*** -0.013*** -0.036*** -0.008
(0.012)
(0.014)
(0.028) (0.005) (0.006) (0.013)
Share skill high
0.019
0.070
-0.008 0.650*** 0.633***
0.856**
*
(0.056)
(0.061)
(0.238) (0.023) (0.027) (0.077)
Observations 42,911 41,969 31,552 30,804 6,933 6,891 41,969 30,804 6,891
R-squared 0.030 0.057 0.032 0.057 0.040 0.066 0.131 0.135 0.154 Note: The dependent variable is the logged value added per employee. The reference group consists of Swedish firms; ”All”, ”MNEs” (multinational domestic firms), or ”Local” (non-multinational domestic firms) . Acquisition takes the value of 1 in the acquisition period and thereafter, 0 before.
Acquisition t–2 takes the value of 1 two years prior to the acquisition and 0 otherwise. The other Acquisition t+/– variables are defined accordingly Capital
intensity is the capital-labour ratio. Share skill high is the percentage share of employees with a higher education. All regressions include firm and year fixed-effects. Standard errors are adjusted for clustering at the firm level. ***, **, and * show significance at the 1%, 5%, and 10% level, respectively.
Aggregate effects
How important have foreign firms been for aggregate productivity growth? We can now use the decomposition method
developed by Foster el al. (2001) and extend it to also distinguish between Swedish and foreign firms. Thus, we compare
the different components that contribute to productivity growth, but we then decompose each component into a Swedish and
a foreign part. The results are shown in Figure 19. It is clear that foreign-owned firms contributed more to productivity
growth than domestic Swedish firms. In fact, both the within-firm increase in productivity and the productivity increase
from entry are almost twice as large for foreign-owned firms compared with Swedish-owned firms. The reason that the
overall difference in productivity growth is smaller is that the cross effect is negative for foreign-owned firms. However, as
explained above, this result may be due to significant expansions of foreign firms where the productivity in the
expansionary phase is below average productivity as the firm is built up.

36
Figure 19: Labour productivity growth decomposition for the entire economy separated by ownership status, 1996–
2009
5. CONCLUSION AND POLICY DISCUSSION
In this paper, we have argued that fundamental reforms of the business sector in Sweden in the 1990s can explain the
remarkable productivity and employment growth of the business sector after Sweden’s significant economic crisis in the
early 1990s. Why were these reforms so successful? We have argued that these reforms solved fundamental market and
political failures that were present in the Swedish economy during the 1970s and the 1980s.
The fundamental market failure in the Swedish business sector in the 1970s and the 1980s was that incumbent firms and
labour unions had gained too much power to protect their markets from competition. This increased power had negative
externalities on potential entrants, consumers, and labour market outsiders. The dominance of incumbents and insiders in
labour unions was substantially mitigated by the deregulation of the labour and product markets.
The fundamental political failure regarding the business sector was that politicians favoured incumbent firms and insider
employees. The corporate tax system and restrictions on FDI impeded ownership changes and business formation that, in
turn, harmed entrepreneurs, labour, and consumers. Moreover, the political system underestimated the cost of removing
economic incentives from the business sector when pursuing political goals such as very low unemployment and highly
compressed wages. These political failures were severely mitigated by the tax reforms, opening the economy to FDI, and
the decentralization of the labour market.
Why more than just catching up? The above-described process suggests that deregulating the business sector in one of
the most regulated countries in Europe to an average level could explain part of Sweden’s turnaround. However, why, over
the last decade, has Sweden not only caught up to the EU average but also outperformed nearly all other countries in terms
of productivity growth and employment growth in the business sector?
One possible explanation is that Swedish firms have made more efficient investments in R&D and ICT. Investments in
intangibles including software, R&D, mineral exploration, copyright and licensing costs, financial industry development,
design, brand equity, vocational training, and organizational structure are considered very important in Sweden. According
to Edquist (2011), intangible investments constituted nearly 10 per cent of GDP and accounted for nearly 30 per cent of
labour productivity growth in the business sector in Sweden in the period 1995–2006. Why then did this occur in Sweden?
One proposed reason is that Swedish society has been open-minded to the adoption of new technologies and new trends.
-0,05 0 0,05 0,1 0,15
ProductivityGrowth
Within
Between
Cross
Entry
Exit
Swedish Foreign

37
Another is that young persons were exposed to the new ICT technology early, both in school and at home, which suggests
that the young generation could be a driver of the digitalization of the Swedish business sector.
The inflow of FDI to Sweden has also been extraordinary. It has meant that an increasing number of firms in Sweden are
foreign-owned, and an increasing number of employees work in foreign-owned firms. Sweden had approximately 13,500
foreign-owned firms with 630,000 employees in 2013 according to the Swedish Agency for Growth Policy Analysis
(Tillväxtanalys, 2014). These totals can be compared with 1980 values, when there were only 150,000 employees in
foreign-owned firms. Not only has FDI created employment and increased productivity in the target firms, but the indirect
dynamic effects also appear to have been important. For example, the Wallenberg group held controlling positions in
companies accounting for 42 per cent of the market cap of the Stockholm Stock Exchange in 1998. By November 2010,
their control had declined to 17.1 per cent of the total market cap. Between 1999 and 2009, Investor AB nearly trebled the
share of its portfolio allocated to new growth markets while scaling back its more traditional investments, where it
controlled a few very large firms. Of these growth investments, 62 per cent went to the Nordic region. Thus, the
deregulation of FDI flows into Sweden appears to have created synergies in the acquired target firms and generated
financial capital for entrepreneurial firms in growth markets. Moreover, the possibility of selling successful ventures to
large, foreign incumbent firms such as Microsoft may have been a driver of the vibrant Swedish start-up markets in new
services, computers, and computer and internet games. Prominent examples of such Swedish tech start-ups that have been
sold for astronomical sums include Skype and World of Warcraft. Network effects in these businesses then create synergies
when large foreign incumbents obtain new products from smaller firms. Bidding competition creates substantial gains for
these sellers, which are then invested in new projects. This internationalization of the industry appears to have been both
particularly large and efficient in Sweden compared with most of the other countries in Europe.
Finally, we would like to highlight a less researched but likely important reason that Swedish firms perform better than
firms in other countries that refers to the country’s favourable business and within-firm culture, which to a large extent is
country-specific. We find that trust levels in Sweden are very high in general and that this high level of trust is likely to
mitigate hold-up problems in firms (Bergh and Bjornskov, 2011). Moreover, the combination of high levels of trust and a
low power distance in Swedish firms should spur intrapreneurship because employees then have the opportunity to exploit
entrepreneurial ideas within firms. This culture could partly explain the high productivity growth observed in large Swedish
firms during the period studied. Moreover, during periods of rapid technological change, such intrapreneurship might be of
special importance. Indeed, Bosma et al. (2013) find that Sweden has high levels of intrapreneurship in large firms.
However, it should also be noted that a lack of incentives might distort work-ethic norms, as Lindbeck et al. (1999) show.
Thus, sufficiently strong incentives for investment and work combined with an efficiency-oriented business culture appear
to create a stable system for wealth creation.
What then can other European countries learn from the Swedish example? Let us take Italy as a country for comparison.
Italy’s development appears very similar to Sweden’s after World War II, but with a twenty-year delay. Italy was growing
rapidly during the 1980s and 1990s but has struggled since, which is similar to Sweden’s struggles during the same period.
Much of the debate concerning the problems in Italy has centred around macro and political issues with a focus on the
country’s considerable government debt, budget deficits, and political turmoil. Of course, these aspects are important and
need to be taken into consideration. However, our reading of the Swedish example is that the reforms in the Swedish private
sector should be emphasized. We have argued that several reforms in the 1990s mitigated the insider-outsider and incentive
problems in the Swedish business sector. We have particularly argued that four areas are of particular importance:
(i) The deregulation of the labour market in Sweden twenty years ago created incentives for productive firms to grow
and for individuals to pursue education and careers. In this respect, Italy has gone in the opposite direction. Indeed, in the

38
1990s, the wage negotiation system in Sweden was substantially more centralized than in Italy, whereas the opposite has
been the case in recent decades (see Visser, 2013).
(ii) The deregulation of product markets and the increased scope of competition policy in Sweden spurred the entry of
new firms and forced inefficient firms out of markets either through exits or acquisitions by more efficient firms. Italy has
made progress in this area, but there are still specific regulations that benefit incumbent firms. Indeed, Sweden is ranked 11th
and Italy 56th
of 189 countries in the World Bank Ease of Doing Business ranking (see World Bank, 2014). If we estimate
basic cross-country regressions on GDP per capita and an indicator for product market competition (the OECD NMR
indicator), we find that a change in NMR from the Italian position to that of Sweden in the final year of the sample (2013) is
associated with an increase in productivity of approximately five per cent.33
(iii) The reform of the Swedish corporate tax system not only increased incentives for corporate investments in general
but especially for new start-ups and growing firms. If we apply cross-country regressions on GDP per capita and the Doing
Business variable Paying taxes and compare Sweden with Italy for 2014, we find that a shift in the paying taxes variable
from the position of Italy to the lower level of Sweden is associated with a gain in GDP per capita of approximately six per
cent.
(iv) The deregulation of FDI flows into Sweden implied that new, efficient owners and firms could enter the Swedish
market, which created strong incentives for innovation and spurred entrepreneurship in Sweden. Italy currently looks very
similar to Sweden in the 1980s, with low levels of FDI and foreign ownership and a non-functioning market for corporate
ownership. Indeed, in Sweden, the inward FDI stock as a share of GDP increased from approximately 5 per cent in the early
1990s to approximately 75 per cent in 2010, whereas in Italy this variable changed from approximately 5 per cent to
approximately 16 per cent over the same period.
Our conclusion is that Italy and other European countries that are struggling with a lack of growth have much to gain
from examining the reforms undertaken in Sweden during the 1990s to create efficient creative destruction processes in
their business sectors. However, we have also argued that Sweden benefitted from an efficiency norm in its business culture
and open-minded and technology-interested consumers. These traits are not easy to copy and may not even be worth
copying. Perhaps Italy needs to combine these reforms with its own inherent strengths, such as creativity and social skills,
which might in turn provide the country with its own competitive advantage. However, as in the Swedish case, if one
removes incentives, natural strengths can turn into weaknesses.
A fundamental aspect of the success of the Swedish reforms was that they were implemented and not then reversed by
subsequent governments. Many strong groups lost power in the reforms, at least in the short term. One of the arguments to
explain the success of the reforms is the strong power of bureaucrats and experts in formulating economic policy in Sweden.
Building on a history of trust and respect for knowledge, the political system, industry, and unions have often been able to
reach decisions based on consensus on issues of great importance to the efficiency of the Swedish economy. The process
has also been open to influence by many different parties, which has helped provide commitment value for the reforms.
We believe that our study of the Swedish experience of industrial reorganization in the 1990s can be a valuable case
study for crisis response. It can serve as an important example of how an economy undergoing a deep crisis can respond and
recover by undertaking economically sound industrial reforms. Furthermore, by comparing insights from economic theory
to patterns in an actual restructuring process, we believe that we can provide valuable knowledge concerning the economic
forces driving creative destruction, which can potentially provide solid ground for policy discussions, particularly those
relating to how Europe can improve its competitiveness and employment levels.
33 NMR stands for Non-manufacturing sector regulations. This index from OECD is available for a long time period, 1975-2013. See the Web Appendix for details.
39
REFERENCES
Acs, Z. J. and D. B. Audretsch (2005). ‘Entrepreneurship, innovation and technological change’, Foundations and
Trends in Entrepreneurship, 1(4), 149–195.
Aghion, P., N. Bloom, R. Blundell, R. Griffith and P. Howitt (2005). ‘Competition and innovation: an inverted-u
relationship’, The Quarterly Journal of Economics, 120(2), 701–728.
Allard, G. (2005). ‘Measuring job security over time: in search of a historical indicator for EPL (Employment
Protection Legislation)’, Working Paper WP05-17, Instituto de Empresa, Madrid.
Anderman S. D. and H. Schmidt (2007). ‘EC competition policy and IPRs’, in S. D. Anderman (ed.), Intellectual
property rights and competition policy, Cambridge University Press, Cambridge.
Andersson, J. and G. Arvidson (2011). ‘Företagens och arbetsställenas dynamik (FAD)’, Statistics Sweden Working
manuscript.
Andrews, D. and F. Cingano (2014). ‘Public policy and resource allocation: evidence from firms in OECD
countries’, Economic Policy, 29(78), 253–296.
Arnold, J.M., B. Brys, C. Heady, A. Johansson, C. Schwellnus, and L. Vartia (2011). ‘Tax policy for economic
recovery and growth’, Economic Journal, 121(550), F59–F80.
Audretsch, D. B. (1991). ‘New-firm survival and the technological regime’, The Review of Economics and Statistics,
73(3), 441–450.
Auerbach, A. J. (2002). ‘Taxation and corporate financial policy’, in A. J. Auerbach and M. Feldstein (eds.),
Handbook of public economics, 1st edition, 3(19), 1251–1292, Elsevier.
Baily, M. N., C. Hulten and D. Campbell (1992). ‘Productivity dynamics in manufacturing plants’, Brokings papers
on economic activity: Microeconomics, 1992, 187–249.
Bandiera, O. I. Barankay och I. Rasul (2007). ‘Incentives for managers and inequality among workers: evidence
from a firm-level experiment’, Quarterly Journal of Economics, 122(2), 729–773.
Bandiera, O. I. Barankay and I. Rasul (2009). ‘Social connections and incentives in the workplace: evidence from
personnel data’, Econometrica, 77(4), 1047–1094.
Bartelsman, E. J. and M. Doms (2000). ‘Understanding productivity: lessons from longitudinal microdata’, Journal
of Economic Literature, 38(3), 569–594.
Bartelsman, E., S. Scarpetta, and F. Schivardi (2005). ‘Comparative analysis of firm demographics and survival:
evidence from micro-level sources in OECD countries’, Industrial and Corporate Change, 14(3), 365–391.
Bergh, A. (2013). ‘What are the policy lessons from Sweden? On the rise, fall and revival of a capitalist welfare
state’, New Political Economy, Published online: 20 Dec 2013.
Bergh, A. (2014). Sweden and the revival of the capitalist welfare state, Edward Elgar, Northampton, MA.
Bergh, A. and C. Bjornskov (2011). ‘Historical trust levels predict the current size of the welfare state’, Kyklos,
64(1), 1–19.
Bergh, A. and G. Erlingsson (2006). ‘Resilience through restructuring: Swedish policy-making style and the
consensus on liberalisations 1980-2000’, Ratio Working Papers No. 110. Available at RePEc:
http://ideas.repec.org/p/hhs/ratioi/0110.html.
Bertrand, M. and A. Schoar (2003), ‘Managing with style: the effect of managers on firm policies’, Quarterly
Journal of Economics, 118(4), 1169–1208.
Besanko, D., D. Dranove, M. Shanley, and S. Schaefer (2003). Economics of strategy, 3rd edition, John Wiley &
Sons, Inc, NY.
Bloom, N. and J. Van Reenen (2007). ‘Measuring and explaining management practices across firms and countries’,
Quarterly Journal of Economics, 122(4), 1351–1408.
Boone, J. (2008). ‘A new way to measure competition’, The Economic Journal, 118(531),1245–1261.
Boone, J., J. C. van Ours, and H. van der Wiel (2007). ‘How (not) to measure competition’, CEPR Discussion paper
No. 6275.
Bosma, N., E. Stam, and S. Wennekers (2013). ‘Institutions and the allocation of entrepreneurship across new and
established organizations’, Scales Research Reports H201213. Available at Repec:
http://ideas.repec.org/p/use/tkiwps/1104.html.
Calmfors, L. (2012). ‘Sweden: from macroeconomic failure to macroeconomic success’, CESifo working paper:
Fiscal Policy, Macroeconomics and Growth, No. 3790.
Carroll, R., D. Holtz-Eakin, M. Rider and H. S. Rosen (2000). ‘Income taxes and entrepreneurs' use of labor’,
Journal of Labor Economics, 18(2), 324–351.
Carroll, R., D. Holtz-Eakin, M. Rider and H. S. Rosen (2001). ‘Personal income taxes and the growth of small firms,
in J. M. Poterba (ed.), Tax Policy and the Economy, 15, 121–148, MIT Press, Cambridge.
Caves, R. E. (1998). ‘Industrial organization and new findings on the turnover and mobility of firms’, Journal of
Economic Literature, 36(4), 1947–1982.
Coase, R. (1937). ‘The Nature of the Firm’, Economica, 4(16), 386–405.
Da Rin, M., M. Di Giacomo and A. Sembenelli (2011). ‘Entrepreneurship, firm entry, and the taxation of corporate
income: evidence from Europe’, Journal of Public Economics, 95(9), 1048–1066.
40
Davidson, C., F. Heyman, S. Matusz, F. Sjöholm and S. Chun Zhu (2014). ‘Globalization and imperfect labor market
sorting’, Journal of International Economics, 94(2), 177–194.
Davis, S. J. and J. Haltiwanger (1990). ‘Gross job creation and destruction: microeconomic evidence and
macroeconomic implications’, NBER Macroeconomics Annual 1990, 5, 123–186.
Davis, S. J. and J. Haltiwanger (1992). ‘Gross job creation, gross job destruction and employment reallocation’,
Quarterly Journal of Economics 107(3), 819–863.
Davis, S. J. and M. Henrekson (2000). ‘Wage-setting institutions as industrial policy’, NBER Working Paper No.
7502.
Devereux, M. P., R. Griffith, and A. Klemm (2002). ‘Corporate income tax reforms and international tax
competition’, Economic Policy, 17(35), 449–495.
Djankov, S., T. Ganser, C. McLiesh, R. Ramalho and A. Schleifer (2010). ‘The effect of corporate taxes on
investment and entrepreneurship’, American Economic Journal: Macroeconomics, 2(3), 31–64.
Dunne, T., M. Roberts and L. Samuelson (1989). ‘Plant turnover and gross employment flows in the US
manufacturing sector’, Journal of Labor Economics, 7(1), 48–71.
Edquist C. (2011). ‘Innovation policy design: identification of systematic problems’, CIRCLE Electronic Working
Papers No. 2011/6.
Edquist, H. and M. Henrekson (2013). ‘Product market reforms and incentives to innovate in Sweden’, in M.
Choupres and H. Edquist (eds.), What can we learn from economic reforms in Greece and Sweden?, European
Liberal Forum, Brussels.
Ericson, R. and A. Pakes (1995). ‘Markov-perfect industry dynamics: a framework for empirical work’, The Review
of Economic Studies, 62(1), 53–82.
Faggio, G., K. G. Salvanes and J. Van Reenen (2010). ‘The evolution of inequality in productivity and wages: panel
data evidence’, Industrial and Corporate Change, 19(6), 1919–1951.
Foster, L., J. Haltiwanger and C. J. Krizan (2001). ‘Aggregate productivity growth. Lessons from microeconomic
evidence’, in C. R. Hulten, E. R. Dean, and M. J. Harper (eds.), New developments in productivity analysis,’
University of Chicago Press, Chicago.
Fox, J. T. and V. Smeets (2011). ‘Does input quality drive measured differences in firm productivity?’, NBER
Working Paper No. 16853.
Gartell, M., A. C. Jans, and H. Persson (2010). ‘The importance of education for the reallocation of labour: evidence
from Swedish linked employer–employee data 1986–2002’, Labour Economics,17(1), 206–214.
Gemmel, N., R. Kneller, D. McGowan and I. Sanz (2013). ‘Corporate taxation and productivity catch-up: evidence
from European firms’, Working Papers No. 13001, Bangor Business School, Prifysgol Bangor University
(Cymru / Wales).
Gentry W. M. and G. Hubbard (2000). ‘Entrepreneurship and houshold saving’, NBER Working Papers No. 7894.
Gibbons, R. and J. Roberts (eds.) (2013). The handbook of organizational economics, Princeton University Press,
Princeton.
Gordon, R. H. and J. Jr. Hines (2002). ‘International taxation’, in A. J. Auerbach and M. Feldstein (eds.), Handbook
of public economics, 1st edition, 4(28), 1935–1995, Elsevier.
Gibrat, R. (1931). Les Inégalités économiques, Librairie du Recueil Sirey, Paris, France.
Griliches, Z. and H. Regev (1995). ‘Firm productivity in Israeli industry 1979-1988’, Journal of Econometrics,
65(1), 175–203.
Grossman, S. and O. Hart (1986). ‘The costs and the benefits of ownership: a theory of vertical and lateral
integration’, Journal of Political Economy, 94(4), 691–719.
Grossman, G. M. and E. Helpman (1994). ‘Protection for sale’, American Economic Review, 84(4), 833–850.
Hakkala, K., F. Heyman and F. Sjöholm (2014). ‘Multinational firms and job tasks’, European Economic Review,
66, 248–265.
Hall, B. and J. Van Reenen (2000). ‘How effective are fiscal incentives for R&D? A review of the evidence’,
Research Policy, 29(4), 449–469.
Hart, O. and J. Moore (1990). ‘Property rights and the nature of the firm’, The Journal of Political Economy, 98(6),
1119–1158.
Hassett, K. A. and R. G. Hubbard (2002). ‘Tax policy and business investment’, in: A. J. Auerbach and M. Feldstein
(eds.), Handbook of public economics, 1st edition, 3(20), 1293–1343, Elsevier.
Haufler, A., P.-J. Norbäck and L. Persson (2014). ‘Entrepreneurial innovations and taxation’, Journal of Public
Economics, 113(May), 13–31.
Henrekson, M. and U. Jakobsson (2005). ‘The Swedish model of corporate ownership and control in transition’, in
Huizinga, H. and L. Jonung (eds.), The internationalization of asset ownership in Europe, Cambridge
University Press, Cambridge.
Hines, J. Jr. (2005). ‘Do tax havens flourish?’, NBER Working Papers No. 10936.
Hjalmarsson, L. (1974). ‘The size distribution of establishments and firms derived from an optimal process of
capacity expansion’, European Economic Review, 5(2), 123–140.
Hopenhayn, H. (1992). ‘Entry, exit, and firm dynamics in long run equilibrium’, Econometrica, 60(5), 1127–1150.
41
Horn, H. and L. Persson (2001). ‘The equilibrium ownership of an international oligopoly’, Journal of International
Economics, 53(2), 307–333.
Ilmakunnas, P., M. Maliranta and J. Vainiomäki (2004). ‘The roles of employer and employee Ccaracteristics for
plant productivity’, Journal of Productivity Analysis, 21(3), 249–276.
Jonung, L., J. Kiander and P. Vartia (2008). ‘The great financial crisis in Finland and Sweden – the dynamics of
boom, bust and recovery, 1985–2000’, European Economy, Economic Papers 367, European Commission,
Brussels.
Jovanovic, B. (1982). ‘Selection and the evolution of industry’, Econometrica, 50(3), 649–670.
Keuschnigg, C. and S. B. Nielsen (2004a). ‘Taxation and venture capital backed entrepreneurship’, International Tax
and Public Finance, 11(4), 369–390.
Keuschnigg, C. and S. B. Nielsen (2004b). ‘Start-ups, venture capitalists, and the capital gains tax’, Journal of Public
Economics, 88(5) 1011–1042.
King, M. and D. Fullerton (1984). The taxation of income from capital: a comparative study of the United States, the
United Kingdom, Sweden and West Germany, The Chicago University Press, Chicago.
Klepper, S. (1996). ‘Entry, exit, growth, and innovation over the product life cycle’, American Economic Review,
86(3), 562–583.
Kneller, R. and D. McGowan (2012). ‘Tax policy and firm entry and exit dynamics: evidence from OECD
countries’, Working Papers No. 12006, Bangor Business School, Prifysgol Bangor University (Cymru / Wales).
Lazear, E. P. (2000). ‘Performance pay and productivity’, American Economic Review, 90(5), 1346–1361.
Lindbeck, A. (1997). The Swedish experiment, SNS, Stockholm.
Lindbeck, A., S. Nyberg and J. W. Weibull (1999). ‘Social norms and economic incentives in the welfare state’, The
Quarterly Journal of Economics, 114(1), 1–35.
Lindbeck, A. and D. J. Snower (2002). ‘The insider-outsider theory: a survey’, IZA Discussion Paper No. 534.
Luttmer, E. G. J. (2007). ‘Selection, growth, and the size distribution of firms’, The Quarterly Journal of Economics,
122(3), 1103–1144.
Maksimovic V. and G. Phillips (2001). ‘The market for corporate assets: who engages in mergers and asset sales, and
are there efficiency gains?’, Journal of Finance, 56(6), 2019–2065.
Mirrlees, J., S. Adam, T. Besley, R. Blundell, S. Bond, R. Chote, M. Gammie, P. Johnson, G. Myles, and J. Poterba
(2011) Tax by design: the Mirrlees review, Oxford University Press for Institute for Fiscal Studies, Oxford.
Motta, M. (2004). Competition policy: theory and practice, Cambridge University Press, Cambridge.
Murphy, K. M. and R. H. Topel (1990). ‘Efficiency Wages Reconsidered: Theory and Evidence’, in Y. Weiss and G.
Fishelson (eds.), Advances in the theory and measurement of unemployment, Palgrave Macmillan, London.
Nelson, R. R. and S. G. Winter (1982). An evolutionary theory of economic change, Belknap Press, Cambridge, MA.
Norbäck, P.-J. and L. Persson (2007). ‘Investment liberalizations:wWhy a restrictive cross-border merger policy can be
counterproductive’, Journal of International Economics, 72(2), 366–380.
Norbäck, P.-J. and L. Persson (2012). ‘Entrepreneurial innovations, competition and competition policy’, European
Economic Review, 56(6), 488–506.
Norbäck, P.-J., L. Persson and R. Douhan (2014). ‘Entrepreneurship policy and globalization’, Journal of
Development Economics, 110(September), 22–38.
Nycander, S. (2008). Makten över arbetsmarknaden: ett perspektiv på Sveriges 1900-tal, SNS Publishing,
Stockholm.
OECD (2013). OECD compendium of productivity indicators 2013, OECD Publishing.
Olley, S. and A. Pakes (1996). ‘The dynamics of productivity in the telecommunications industry’, Econometrica,
64(6), 1263–1298.
Olson, M. (1965). The logic of collective action, Harvard University Press, Harvard.
Perotti, E. and P. Volpin (2007). ‘Investor protection and entry’, Tinbergen Institute Discussion Papers 07-006/2.
Rajan, R. G. and L. Zingales (2001). ‘The firm as a dedicated hierarchy: a theory of the origins and growth of firms’,
The Quarterly Journal of Economics, 116(3), 805–851.
Santarelli, E. and M. Vivarelli (2007). ‘Entrepreneurship and the process of firms’ entry, survival and growth’,
Industry and Corporate Change, 16(3), 455–488.
Skedinger, P. (2010). ‘Employment protection legislation. Evolution, effects, winners and losers’, Edward Elgar,
Northampton, MA.
SOU 1986:23 (1986). Aktiers röstvärde, Report by the Voting Rights Committee, Liber, Stockholm.
SOU 1993:16 (1993). Nya villkor för ekonomi och politik, Report from the Economics Commison, Allmänna
förlaget, Stockholm.
SOU 2005:4 (2005). Liberalisering, regler och marknader, Ministry for Enterprise, Stockholm.
Spencer, B. J. and J. A. Brander (1983). ‘International R&D rivalry and industrial strategy’, Review of Economic
Studies, 50(4), 707–722.
Stenkula, M., D. Johansson and G. Du Rietz (2014). ‘Capital income taxation of Swedish households, 1862 to 2010’,
Scandinavian Economic History Review, DOI: 10.1080/03585522.2014.980314.

42
Stevenson, B. and J. Wolfers (2006). ‘Bargaining in the shadow of the law: divorce laws and family distress’,
Quarterly Journal of Economics, 121 (1), 267–288.
Stigler, G. J. (1971). ‘The theory of economic regulation’, The Bell Journal of Economics and Management Science,
2(1), 3–21.
Sutton, J. (1997). ‘Gibrat’s legacy’, Journal of Economic Literature, 35(1), 40–59.
Syverson, C. (2011). ‘What determines productivity?’, Journal of Economic Literature 49(2), 326–365.
Tillväxtanalys (2012). Statligt stöd till näringslivet 2011, Tillväxtanalys (Statistics 2012:05).
Tirole, J. (2006). The theory of corporate finance, Princeton University Press, Princeton.
Van Ark, B., M. O’Mahony, and M. P. Timmer (2008). ‘The productivity gap between Europe and the United States:
trends and causes’, Journal of Economic Perspectives, 22(1), 25–44.
Vives, X. (2008). ‘Innovation and competitive pressure’, The Journal of Industrial Economics, 56(3), 419–469.
Visser, J. (2013). ‘Wage bargaining institutions-from crisis to crisis’, European Commission Economic Papers 488
Williamson, O. E. (1979). ‘Transaction-cost economics: the governance of contractual relations’, Journal of Law and
Economics, 22(2), 233–261.
World Bank (2014). ‘Doing business 2015: going beyond efficiency’, A World Bank Group Flagship Report, World
Bank, Washington, DC.
Wölfl, A., I. Wanner, T. Kozluk, and G. Nicoletti (2009). ‘Ten years of product market reform in OECD countries:
insights from a revised PMR indicator’, OECD Economics Department Working Papers No. 695
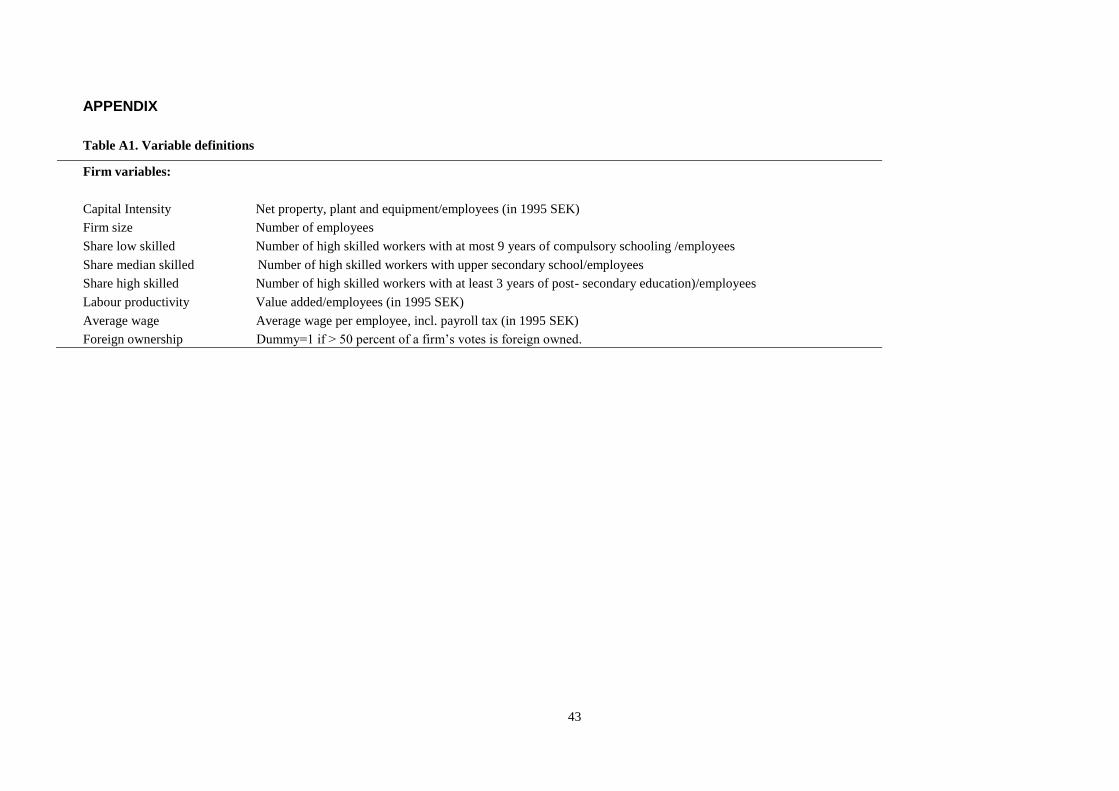
43
APPENDIX
Table A1. Variable definitions
Firm variables:
Capital Intensity Net property, plant and equipment/employees (in 1995 SEK)
Firm size Number of employees
Share low skilled Number of high skilled workers with at most 9 years of compulsory schooling /employees
Share median skilled Number of high skilled workers with upper secondary school/employees
Share high skilled Number of high skilled workers with at least 3 years of post- secondary education)/employees
Labour productivity Value added/employees (in 1995 SEK)
Average wage Average wage per employee, incl. payroll tax (in 1995 SEK)
Foreign ownership Dummy=1 if > 50 percent of a firm’s votes is foreign owned.

44
A2: DEFINITIONS OF MEASURES OF JOB AND PRODUCTIVY DYNAMICS
Job flows
In this framework, net employment changes at firm f in period t can be decomposed into two types of gross job flows: Job
Creation (JC) and Job Destruction (JD):
J𝐶𝑓𝑡 = 𝐸𝑓𝑡 – 𝐸𝑓𝑡−1 = ∆𝐸𝑓𝑡 om ∆𝐸𝑓𝑡 > 0 (A1)
J𝐶𝑓𝑡 = 𝐸𝑓𝑡 – 𝐸𝑓𝑡−1 = ∆𝐸𝑓𝑡 om ∆𝐸𝑓𝑡 < 0 (A2)
where 𝐸𝑓𝑡 is the number of employees in firm f at time t. JC is calculated as the sum of employment gains in new firms or
expanding employment in existing firms. Correspondingly, JD is calculated as the absolute sum of employment losses in
contracting firms or exiting firms. We can now based on (A1) and (A2) calculate the total job creation and job destruction in
a specific year t as:
J𝐶𝑡∑∆𝐸𝑓𝑡 om ∆𝐸𝑓𝑡 > 0 (A3)
J𝐶𝑡∑∆𝐸𝑓𝑡 om ∆𝐸𝑓𝑡 < 0 (A4)
The sum of job creation and job destruction is the job reallocation, which measures the total number of jobs reallocated. The
difference between job creation and job destruction is equal to the net employment change. In order to express the job flow
measures as rates, we divide by average firm size in period t and t-1, defined as 𝑋𝑒𝑓𝑡 =𝐸𝑓𝑡+𝐸𝑓𝑡−1
2, implying a total
employment, 𝑋𝑡, equal to 𝑋𝑡 = ∑ 𝑋𝑓𝑡𝑒𝑓 .
We can now define job creation and job destruction rates as job creation (destruction) divided by average employment:34
implying a job reallocation rate, JRR, equal to 𝐽𝐶𝑅𝑡 + 𝐽𝐷𝑅𝑡 and a net employment rate, 𝑁𝑒𝑡𝑡, equal to 𝐽𝐶𝑅𝑡 − 𝐽𝐷𝑅𝑡.
Productivity dynamics
Here we describe an alternative approach to analysing productivity dynamics, analogous to the job flows approach
described above. Let 𝑉𝐴𝑓𝑡 be value added of firm f at time t. Let 𝐿𝑓𝑡 be the number of employees in firm f at time t and
�̅�𝑓𝑡 average firm size in period t and t-1, defined as �̅�𝑓𝑡 =𝐿𝑓𝑡+𝐿𝑓𝑡−1
2. We then define firm f’s share of total employment in
year t as �̅�𝑓𝑡 =�̅�𝑓𝑡
∑ �̅�𝑓𝑡𝑓∈𝐼 where ∑ �̅�𝑓𝑡𝑓∈𝐼 is the total employment in year t calculated from average employment between years t
and t-1. Firm f’s value added per employee in year t is 𝑝𝑓𝑡 =𝑉𝐴𝑓𝑡
𝐿𝑓𝑡 . The change in value added per employed person between
34 The growth rate is symmetric around zero and bounded in the [-2,2] interval, where the boundaries are equal to the growth rate of an entering plant and an
existing plant, respectively.
𝐽𝐶𝑅𝑡 = (1
𝑋𝑡
) [∑ ∆𝐸𝑓𝑡
𝑒
] 𝑜𝑚 ∆𝐸𝑓𝑡
> 0 (𝐴5)
𝐽𝐶𝑅𝑡 = (1
𝑋𝑡
) [∑ ∆𝐸𝑓𝑡
𝑒
] 𝑜𝑚 ∆𝐸𝑓𝑡
< 0 (𝐴6)
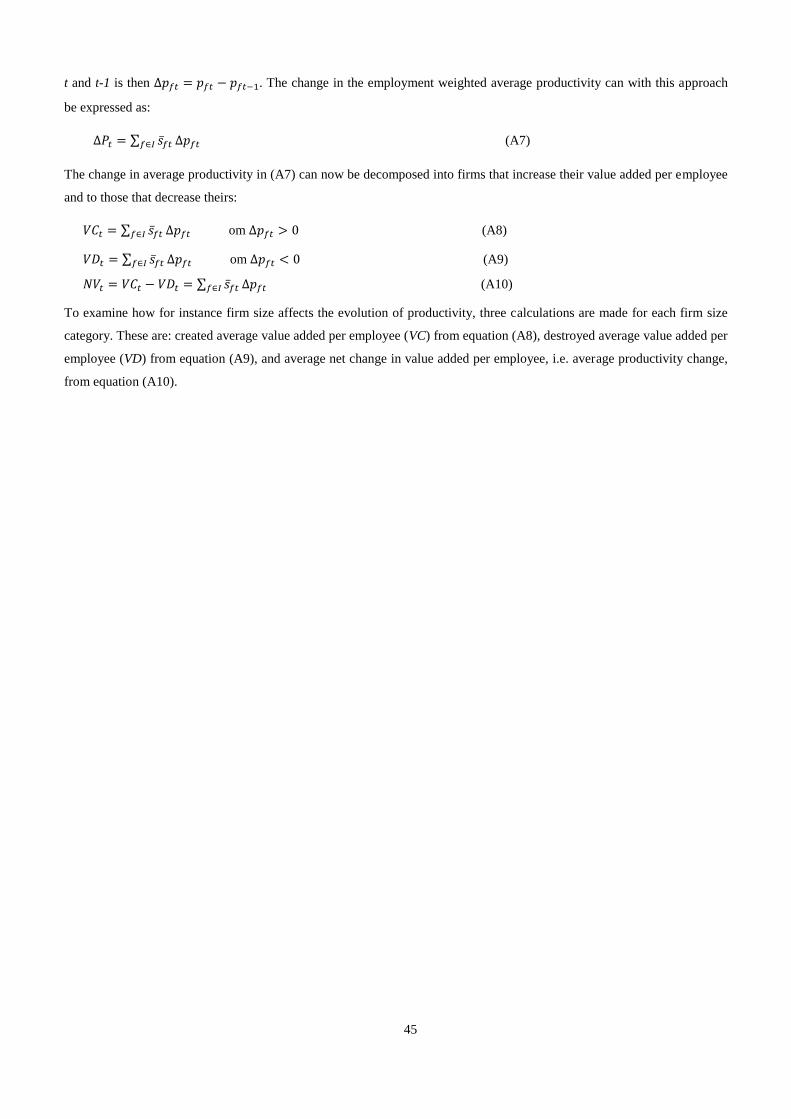
45
t and t-1 is then ∆𝑝𝑓𝑡 = 𝑝𝑓𝑡 − 𝑝𝑓𝑡−1. The change in the employment weighted average productivity can with this approach
be expressed as:
∆𝑃𝑡 = ∑ �̅�𝑓𝑡𝑓∈𝐼 ∆𝑝𝑓𝑡 (A7)
The change in average productivity in (A7) can now be decomposed into firms that increase their value added per employee
and to those that decrease theirs:
𝑉𝐶𝑡 = ∑ �̅�𝑓𝑡𝑓∈𝐼 ∆𝑝𝑓𝑡 om ∆𝑝𝑓𝑡 > 0 (A8)
𝑉𝐷𝑡 = ∑ �̅�𝑓𝑡𝑓∈𝐼 ∆𝑝𝑓𝑡 om ∆𝑝𝑓𝑡 < 0 (A9)
𝑁𝑉𝑡 = 𝑉𝐶𝑡 − 𝑉𝐷𝑡 = ∑ �̅�𝑓𝑡𝑓∈𝐼 ∆𝑝𝑓𝑡 (A10)
To examine how for instance firm size affects the evolution of productivity, three calculations are made for each firm size
category. These are: created average value added per employee (VC) from equation (A8), destroyed average value added per
employee (VD) from equation (A9), and average net change in value added per employee, i.e. average productivity change,
from equation (A10).