Embed Size (px)
Citation preview

THE TRUE COSTS OF HAIS
REDUCE CROSS CONTAMINATION AND HAIS
5.12.15

INTRODUCTION

Lynn White, M.D.
About the Presenter
• Attending Anesthesiologist at Physician Anesthesia
Services, P.C., in Golden, CO
• Specializes in Cardiac and Pediatric Anesthesiology
• Founder and inventor of SuctionShield
• President of Patient Shield Concepts, LLC
• Board Certified in Anesthesiology and Pediatrics
• Member of Colorado and American Societies of
Anesthesiology
Lynn White, M.D.
About the Presenter
Formerly in Chicago, IL
• Staff Anesthesiologist, Clinical Faculty at Rush
Presbyterian St. Luke’s Medical Center
• Associate Director of the Pediatric Emergency
Department at Michael Reese Hospital and Clinics
• Associate Professor of Pediatrics at University of Illinois
College of Medicine
SELF ASSESSMENT
U.S. Situation
Self Assessment
(CA)UTI, SSI, BSI and pneumonia.
These four HAIs account for what percent of HAIs in acute
care settings?
a) 90%
b) 10%
c) 75%
d) none of the above
U.S. Situation
Self Assessment
HAIs rank _____ among most common medical errors?
a) 4th
b) 1st
c) 5th
d) 2nd
e) none of the above
U.S. Situation
Self Assessment
HAIs rank ______ with respect to annual cost of medical
errors?
a) 4th
b) 1st
c) 2nd
d) 3rd
e) none of the above
U.S. Situation
Self Assessment
Which HAI class occurs most frequently in hospitals?
a) SSI
b) (CA)UTI
c) (CLA)BSI
d) VAP
e) C. difficile
U.S. Situation
Self Assessment
Which category of HAI incurs the most direct costs per
case?
a) (CA)UTI
b) (CLA)BSI
c) C. difficile
d) SSI
e) VAP

FULL SCOPE OF THE PROBLEM

U.S. Situation
Centers for Disease Control & Prevention
1.7 million HAIs annually in acute care hospitals
• Incidence of 1:20 patients admitted
• Resulting in 99,000 patient deaths per year
Excludes 26,000 U.S. facilities, such as:
• ASCs
• SNFs
• LTACs
• Hospice
• Dialysis Centers

U.S. Situation
CMS Report 2012
Physicians are underreporting
• HAI appears after discharge
• HAC readmission rate underestimated
Patients with CABG
• 1:34 ratio of mediastinitis reported in hospital vs. after
discharge
DIRECT MEDICAL COSTS
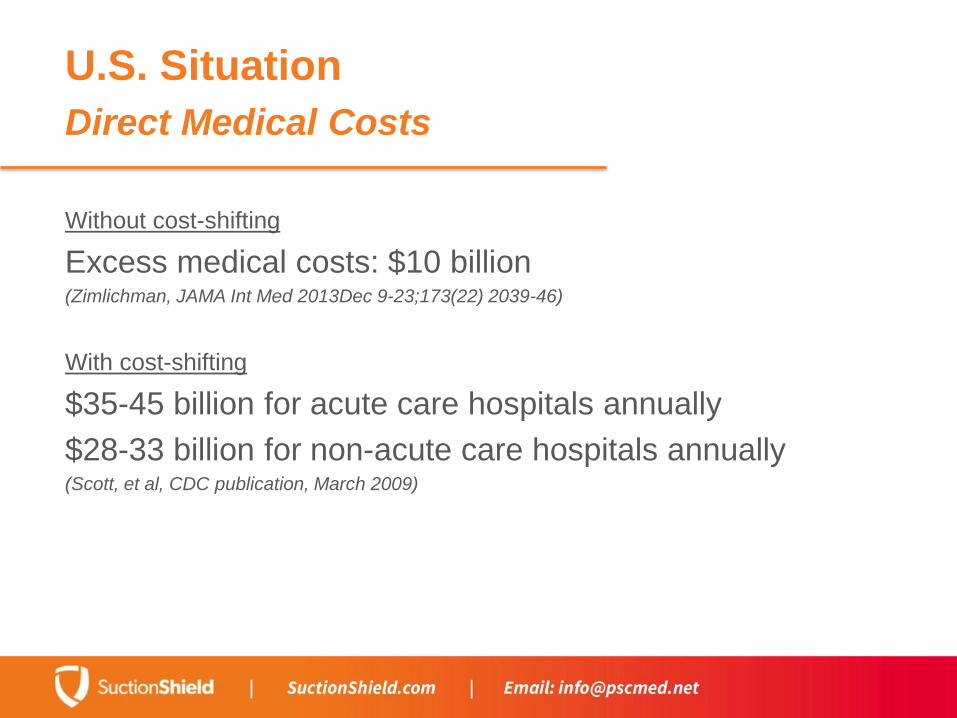
U.S. Situation
Direct Medical Costs
Without cost-shifting
Excess medical costs: $10 billion (Zimlichman, JAMA Int Med 2013Dec 9-23;173(22) 2039-46)
With cost-shifting
$35-45 billion for acute care hospitals annually
$28-33 billion for non-acute care hospitals annually(Scott, et al, CDC publication, March 2009)
U.S. Situation
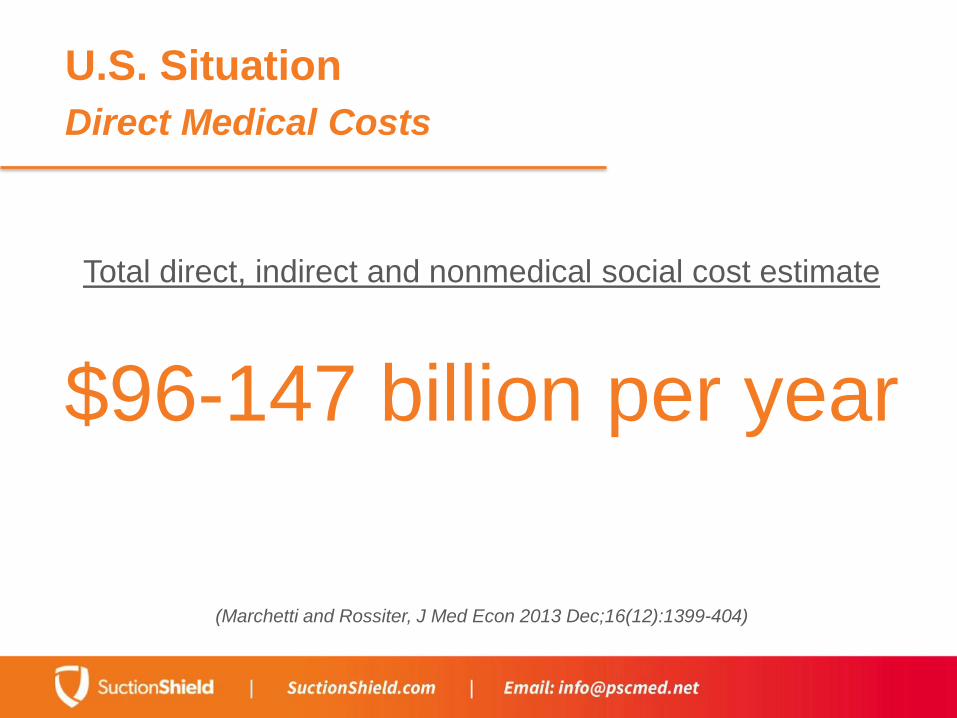
Direct Medical Costs
Total direct, indirect and nonmedical social cost estimate
$96-147 billion per year
(Marchetti and Rossiter, J Med Econ 2013 Dec;16(12):1399-404)
COMPONENTS OF DIRECT MEDICAL COSTS
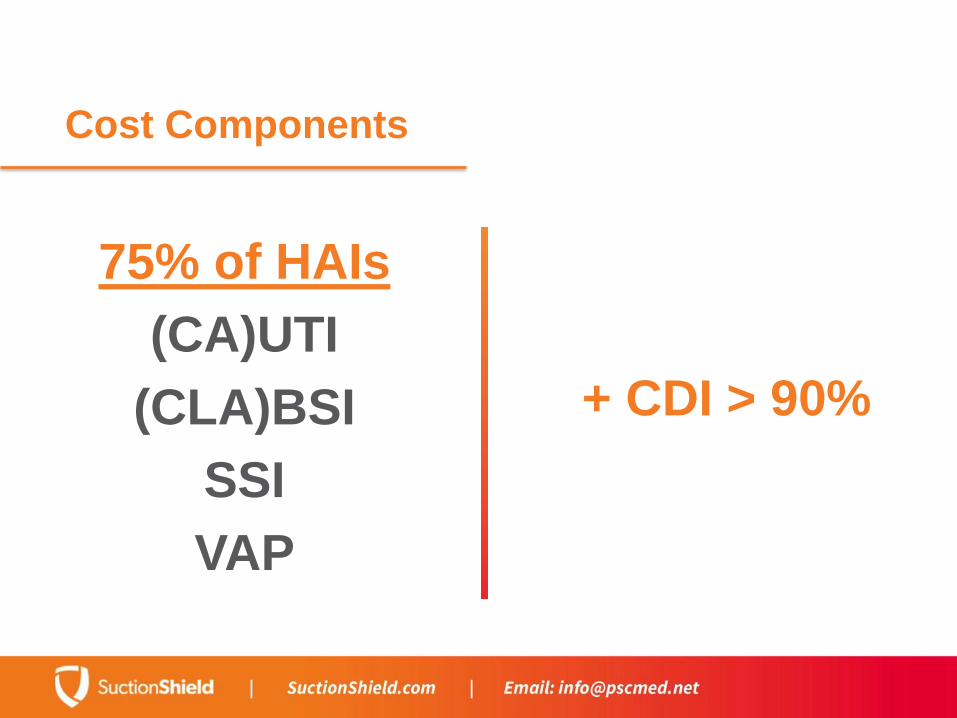
Cost Components
+ CDI > 90%
75% of HAIs
(CA)UTI
(CLA)BSI
SSI
VAP
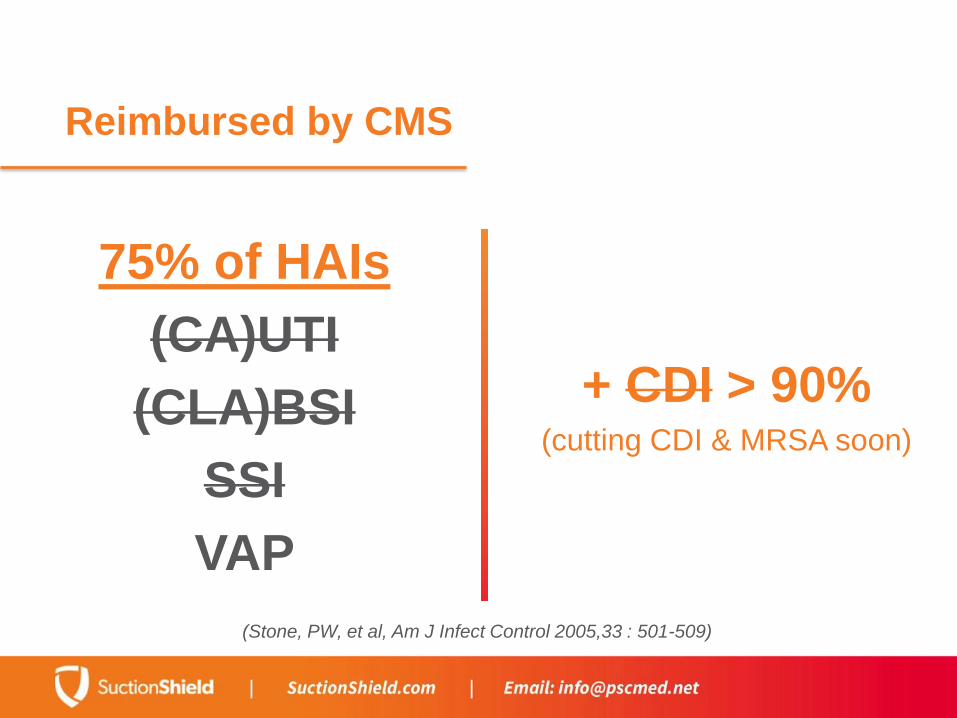
Reimbursed by CMS
+ CDI > 90%(cutting CDI & MRSA soon)
75% of HAIs
(CA)UTI
(CLA)BSI
SSI
VAP
(Stone, PW, et al, Am J Infect Control 2005,33 : 501-509)
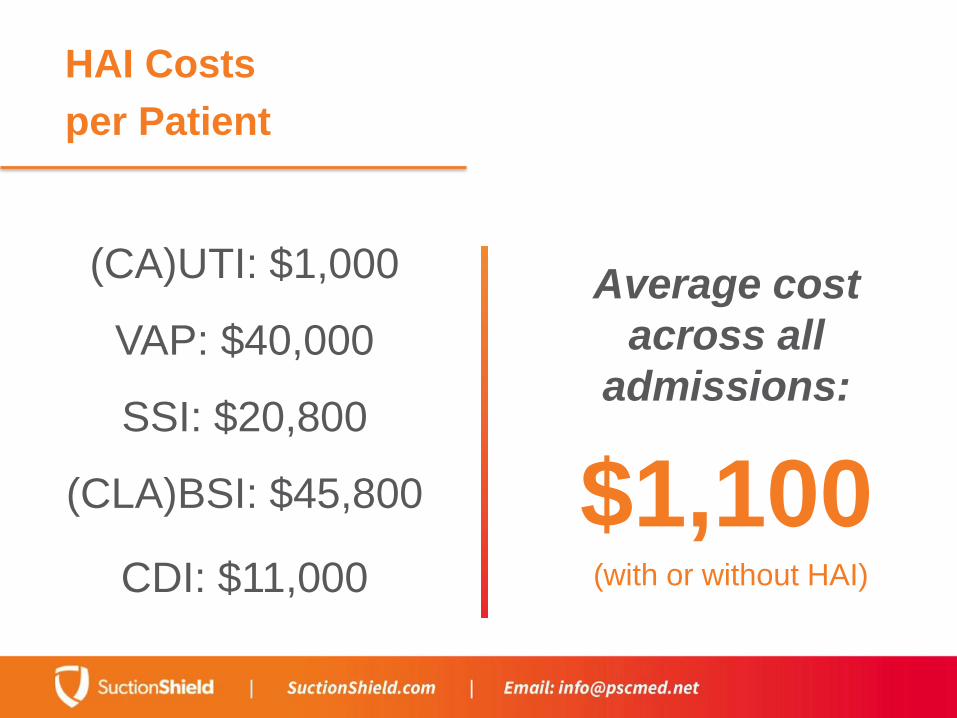
HAI Costs
per Patient
Average cost
across all
admissions:
$1,100(with or without HAI)
(CA)UTI: $1,000
VAP: $40,000
SSI: $20,800
(CLA)BSI: $45,800
CDI: $11,000

HAI Costs
per Patient with HAI
Reduction in overall net profit
margins:
$5,018
(Murphy,et al APIC Briefing, Feb, 2007)
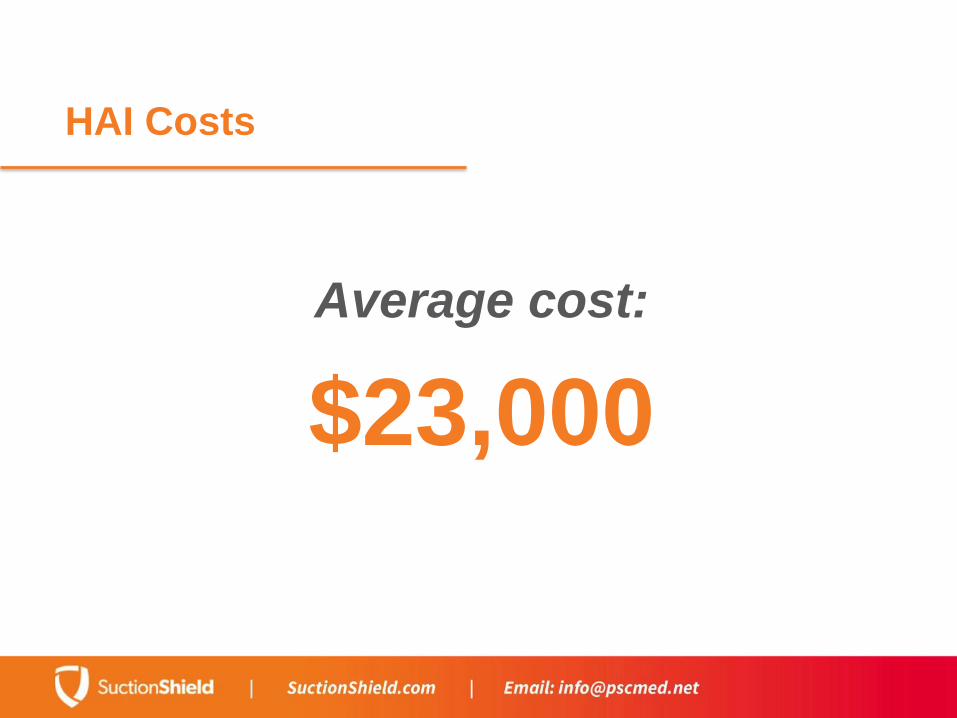
HAI Costs
Average cost:
$23,000
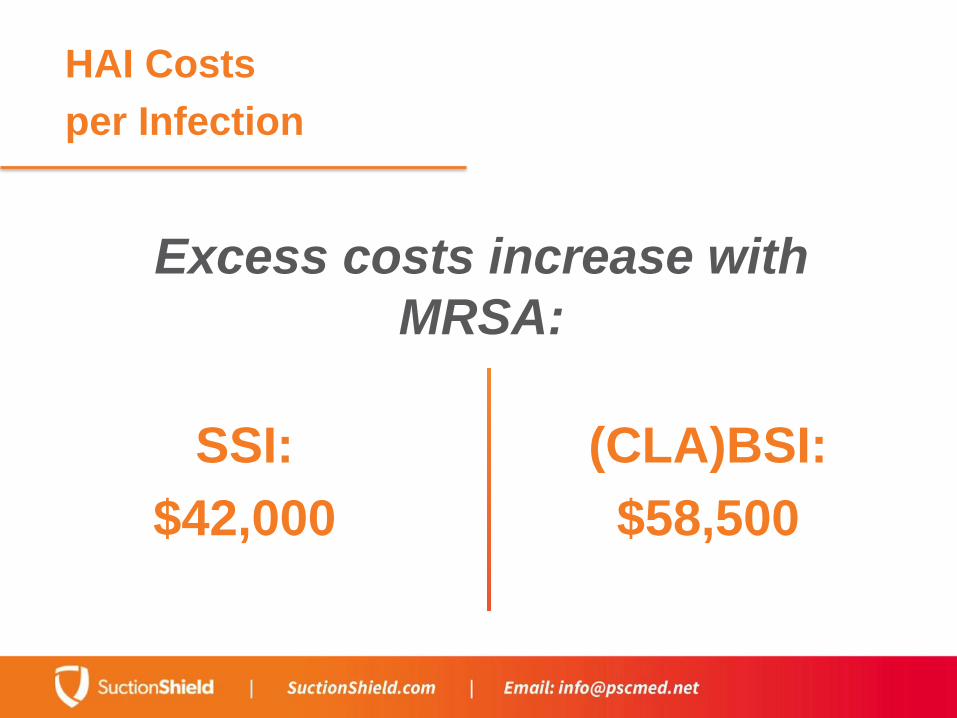
HAI Costs
per Infection
Excess costs increase with
MRSA:
SSI:
$42,000
(CLA)BSI:
$58,500

HAI Costs
Increased Length of Stay:
Without HAI
5 days
With HAI
22 days
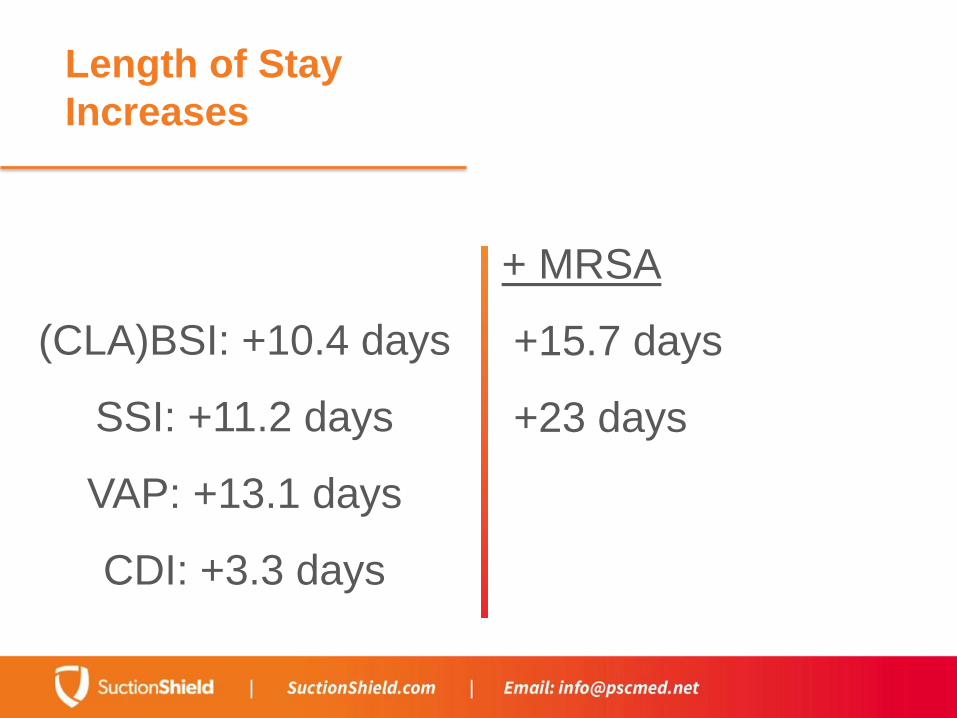
Length of Stay
Increases
(CLA)BSI: +10.4 days
SSI: +11.2 days
VAP: +13.1 days
CDI: +3.3 days
+ MRSA
+15.7 days
+23 days
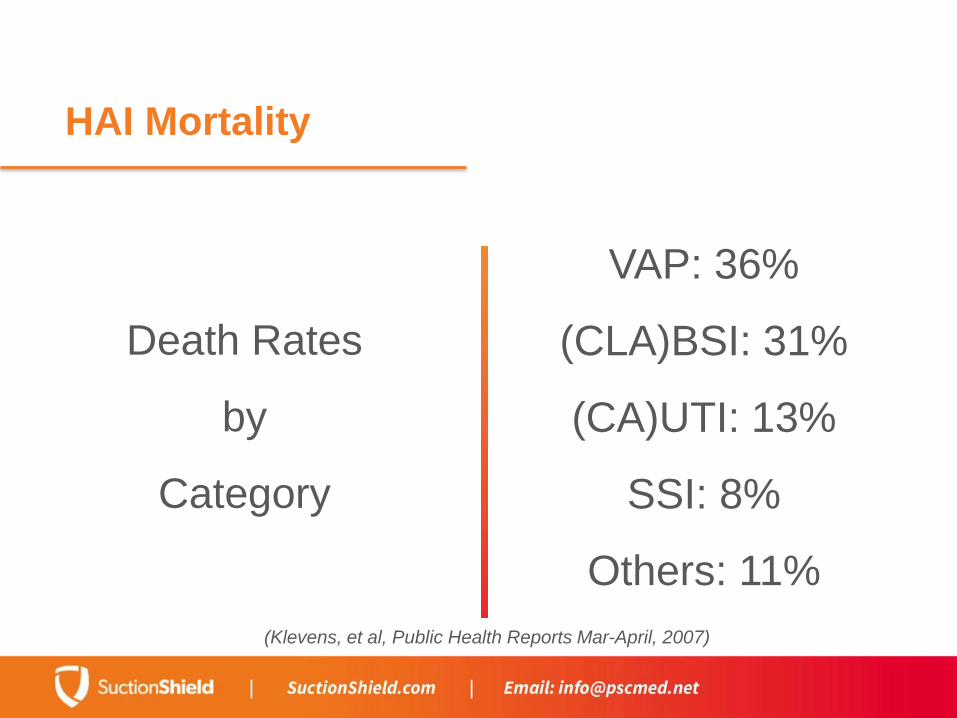
HAI Mortality
Death Rates
by
Category
VAP: 36%
(CLA)BSI: 31%
(CA)UTI: 13%
SSI: 8%
Others: 11%
(Klevens, et al, Public Health Reports Mar-April, 2007)
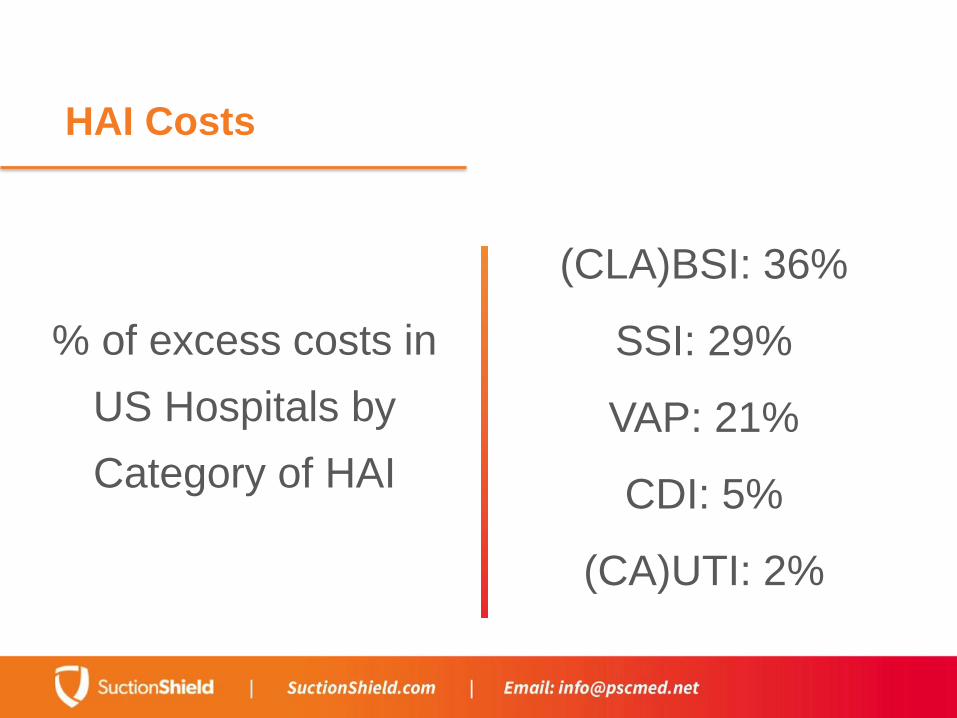
HAI Costs
% of excess costs in
US Hospitals by
Category of HAI
(CLA)BSI: 36%
SSI: 29%
VAP: 21%
CDI: 5%
(CA)UTI: 2%
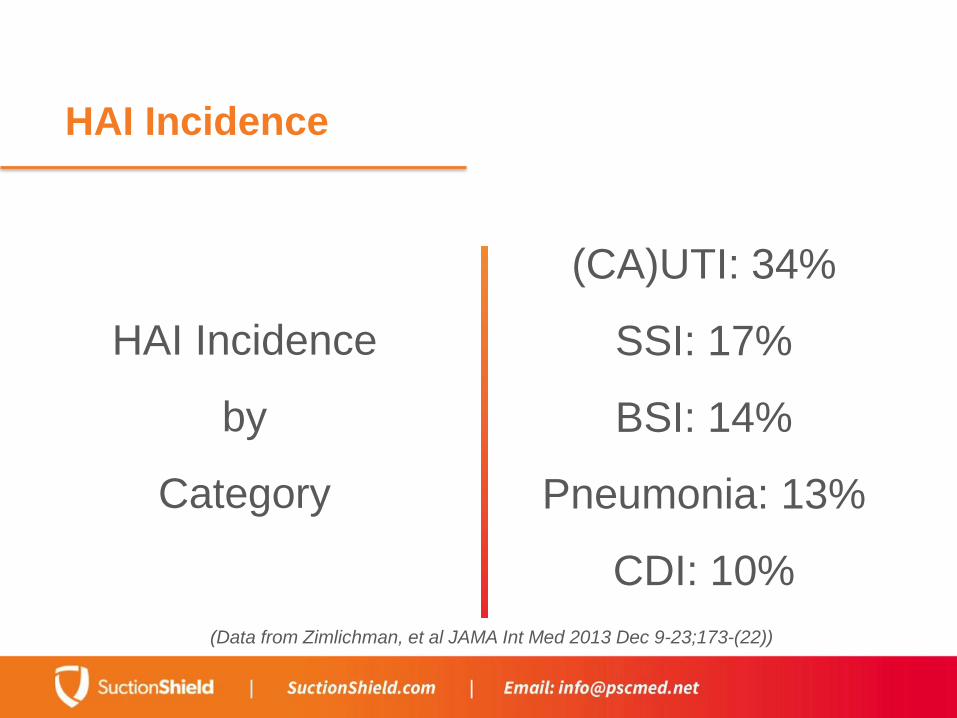
HAI Incidence
HAI Incidence
by
Category
(CA)UTI: 34%
SSI: 17%
BSI: 14%
Pneumonia: 13%
CDI: 10%
(Data from Zimlichman, et al JAMA Int Med 2013 Dec 9-23;173-(22))
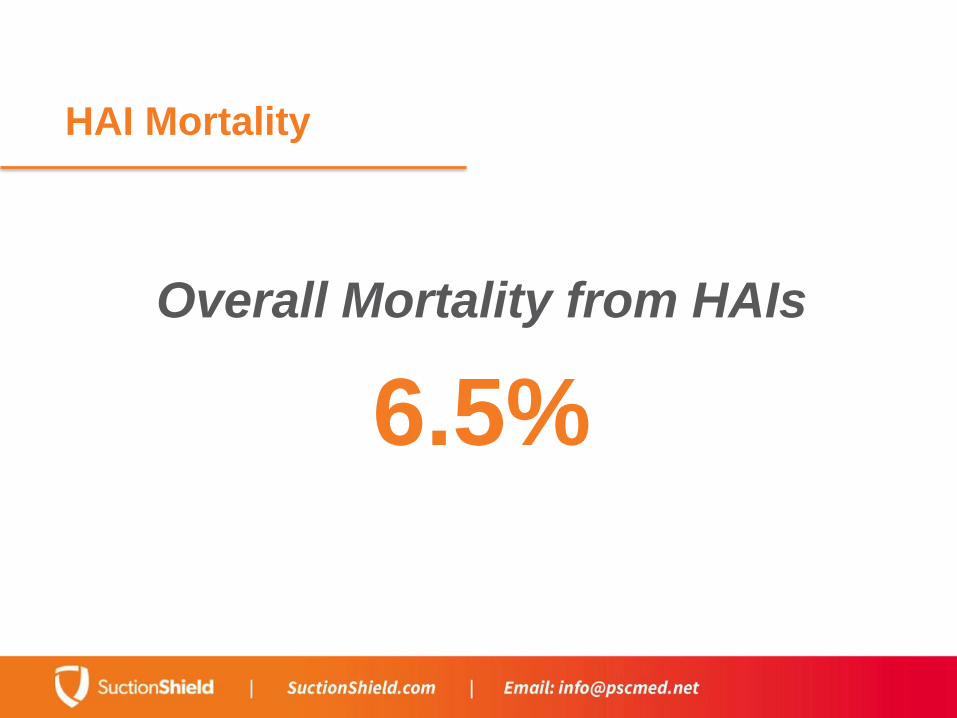
HAI Mortality
Overall Mortality from HAIs
6.5%
HAI Mortality
Increase in Mortality from HAIs
1.5 - 2x
HAIs in the ICU
5x - 10x more likelyto acquire an HAI than non-ICU patients

HAIs in the ICU
50-70% with antimicrobial-resistant strains
Leading Cause of
Death in ICU
Pneumonia

Leading Cause of
Death in ICU
Most Deadly
Pneumonia
Sepsis
Most Expensive
Pneumonia
Sepsis
(AJIC:43(2015) 4-9.)
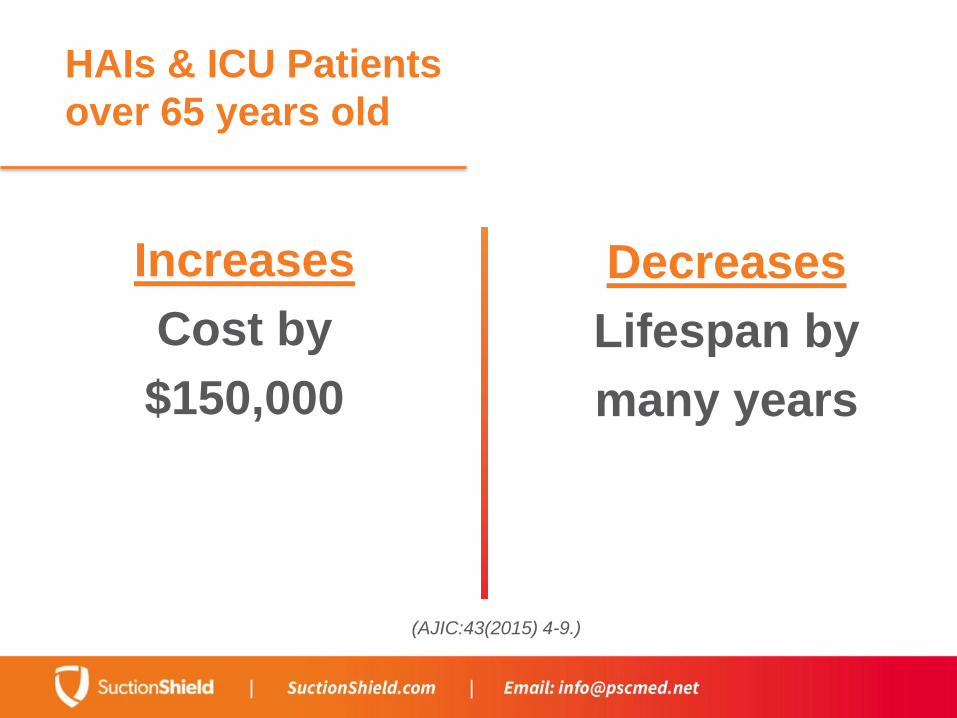
HAIs & ICU Patients
over 65 years old
Decreases
Lifespan by
many years
Increases
Cost by
$150,000
(AJIC:43(2015) 4-9.)

Patients Undergoing
Invasive Surgery
19.5%
mortality= Sepsis+ $33,000
each
(AJIC:43(2015) 4-9.)

Patients Undergoing
Invasive Surgery
11.4%
mortality= Pneumonia+ $46,400
each
(AJIC:43(2015) 4-9.)
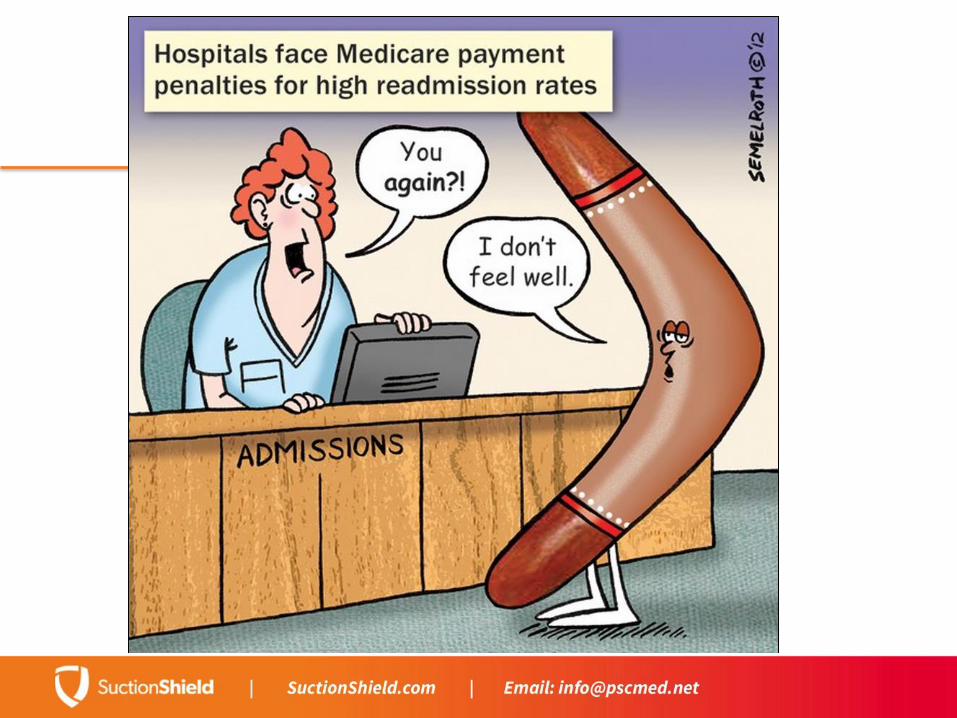
CMS Penalties for
Underperforming Hospitals
• Steady decrement in Medicare reimbursements each
year, progressing from -1% to -2%
• Hospitals with high readmission rates losing 3%
• Additional penalties for improper or non-reporting to IQR

Readmission Rates
within 30 days
Without HAI
6%
With HAI
30%
(Savage, et al. White Paper: The Cost of Healthcare Associated Infections. GE Healthcare IT)

Average Chance of
Readmission within a year
MRSA
positive culture
40%
VRE
positive culture
67%
(Emerson, et al, Inf Control & Hosp Epidemiol 2012 June;33(6)539-44)

Average Readmission Time
from Hospital Discharge
27 daysfor a culture positive patient
(Emerson, et al, Inf Control & Hosp Epidemiol 2012 June;33(6)539-44)
INDIRECT COSTS OF HAIS
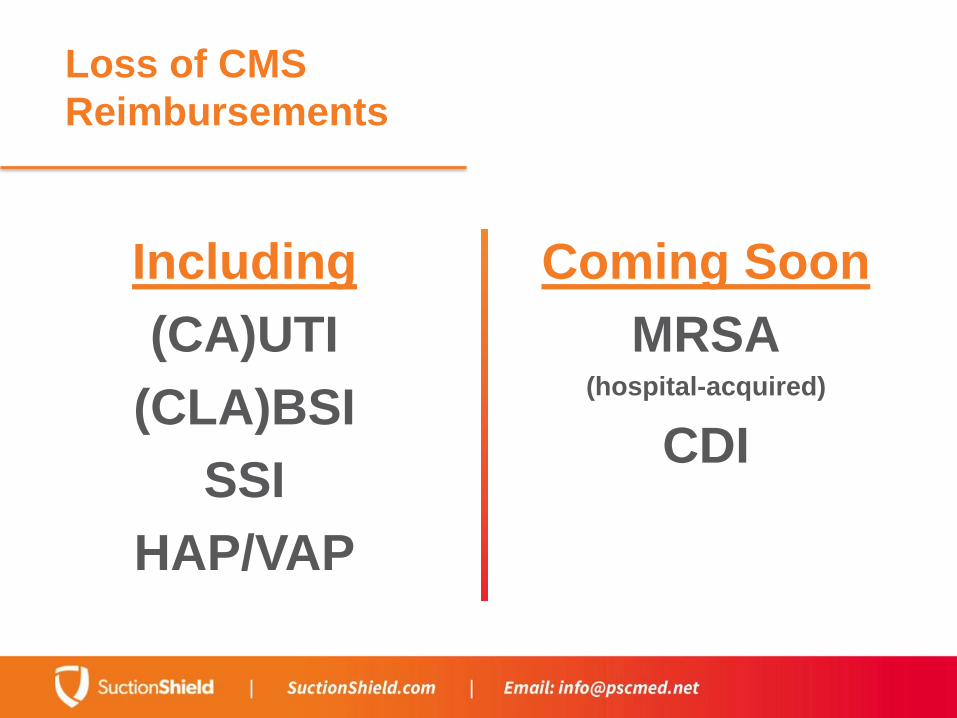
Loss of CMS
Reimbursements
Including
(CA)UTI
(CLA)BSI
SSI
HAP/VAP
Coming Soon
MRSA(hospital-acquired)
CDI
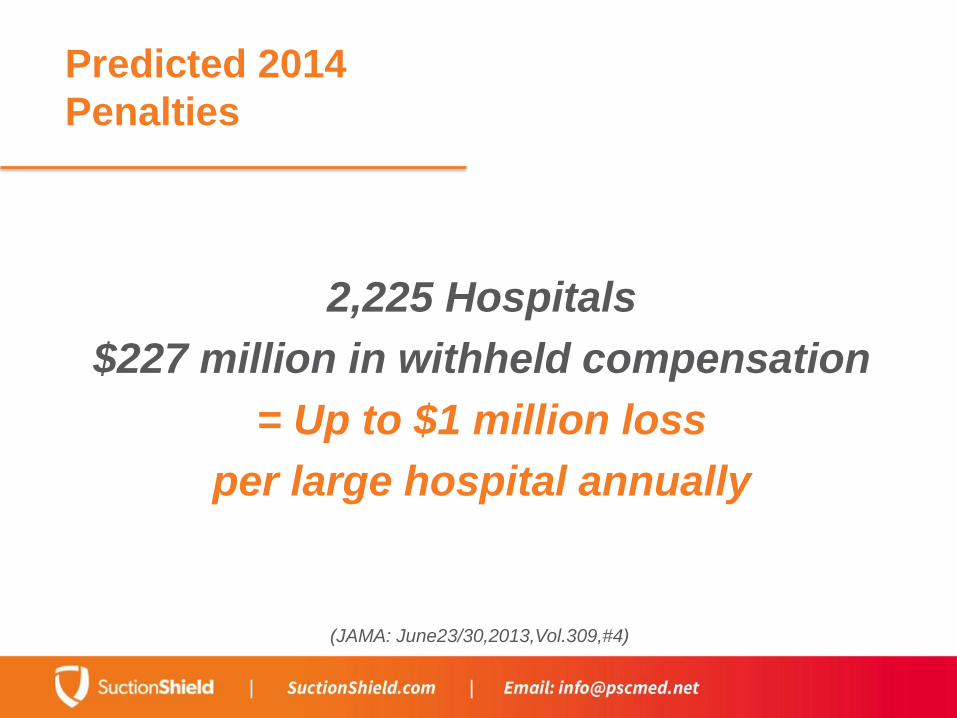
Predicted 2014
Penalties
2,225 Hospitals
$227 million in withheld compensation
= Up to $1 million loss
per large hospital annually
(JAMA: June23/30,2013,Vol.309,#4)
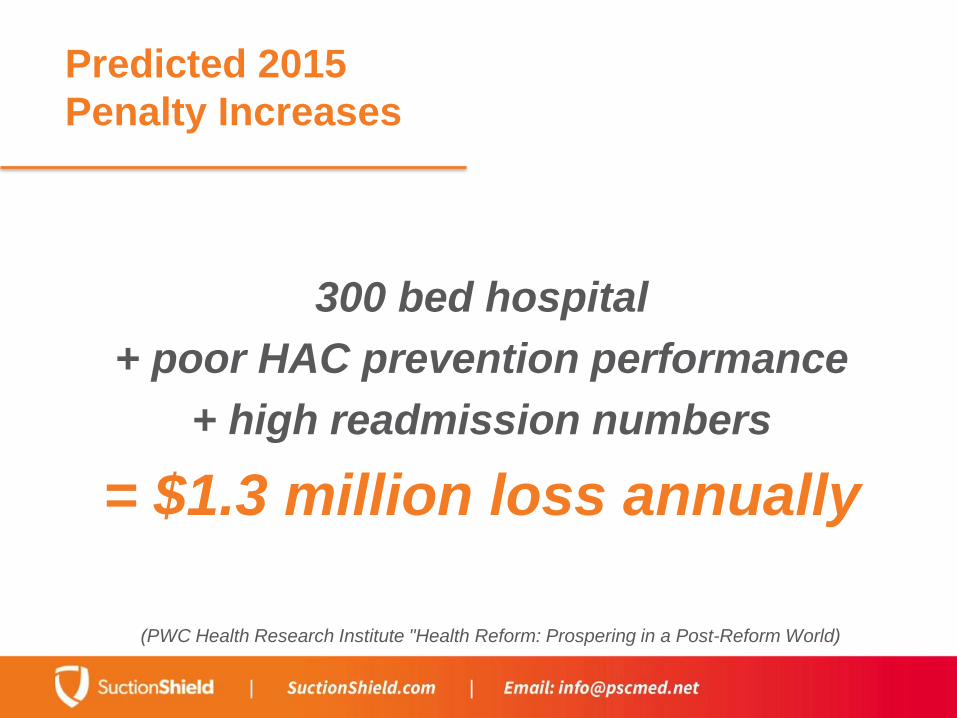
Predicted 2015
Penalty Increases
300 bed hospital
+ poor HAC prevention performance
+ high readmission numbers
= $1.3 million loss annually
(PWC Health Research Institute "Health Reform: Prospering in a Post-Reform World)

Predicted 2014
Penalties
= up to $1 million per hospital annually
Large Hospitals
40%
Small Hospitals
28%
(JAMA: June23/30,2013,Vol.309,#4)
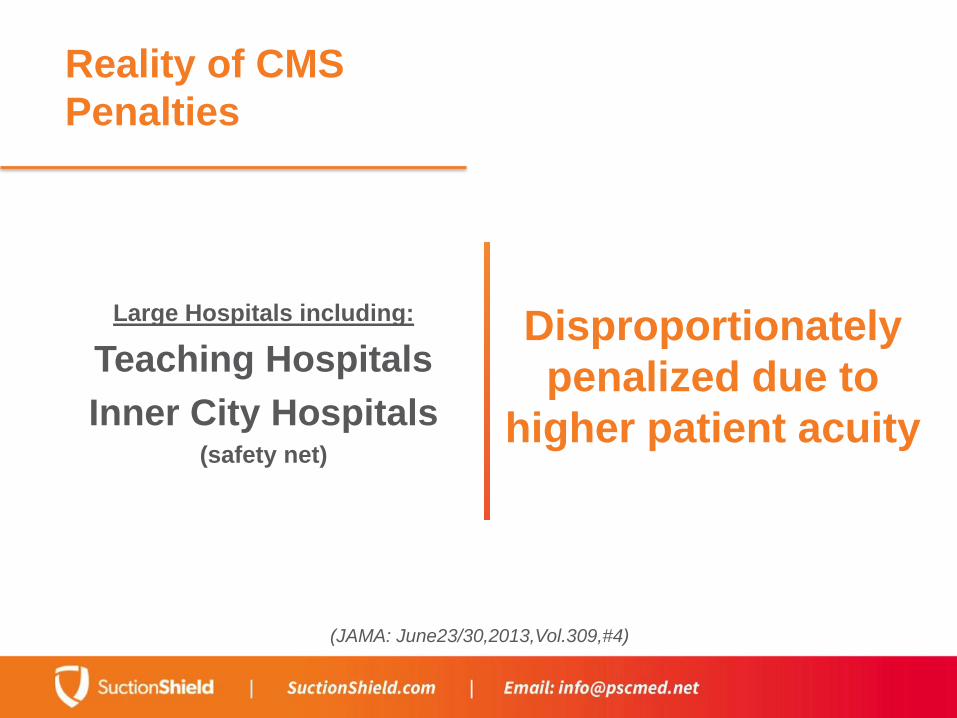
Reality of CMS
Penalties
Large Hospitals including:
Teaching Hospitals
Inner City Hospitals(safety net)
Disproportionately
penalized due to
higher patient acuity
(JAMA: June23/30,2013,Vol.309,#4)
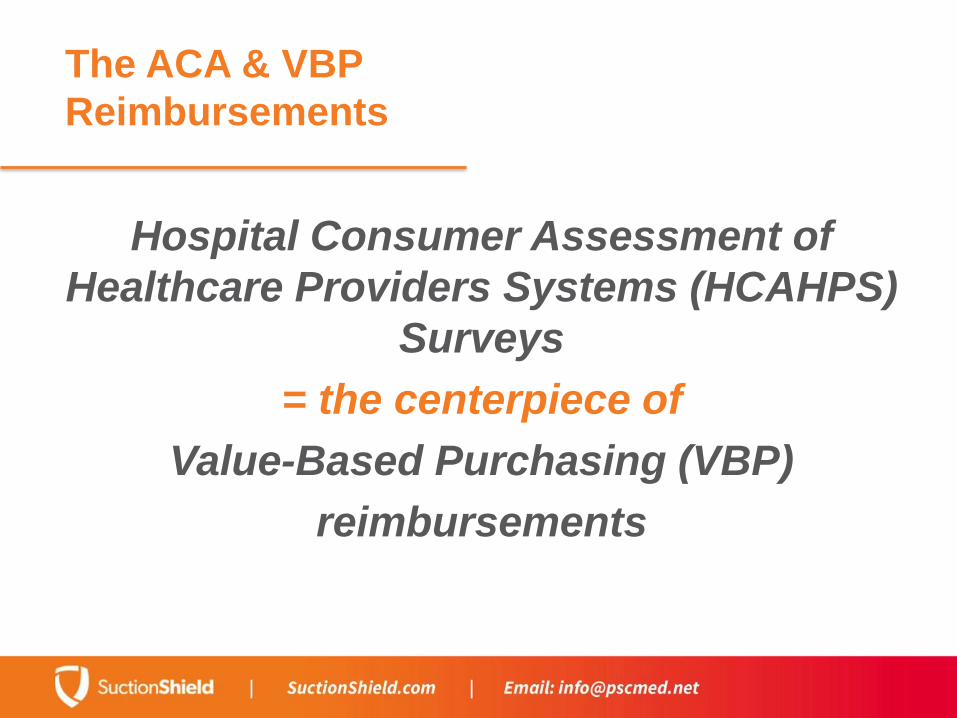
The ACA & VBP
Reimbursements
Hospital Consumer Assessment of
Healthcare Providers Systems (HCAHPS)
Surveys
= the centerpiece of
Value-Based Purchasing (VBP)
reimbursements
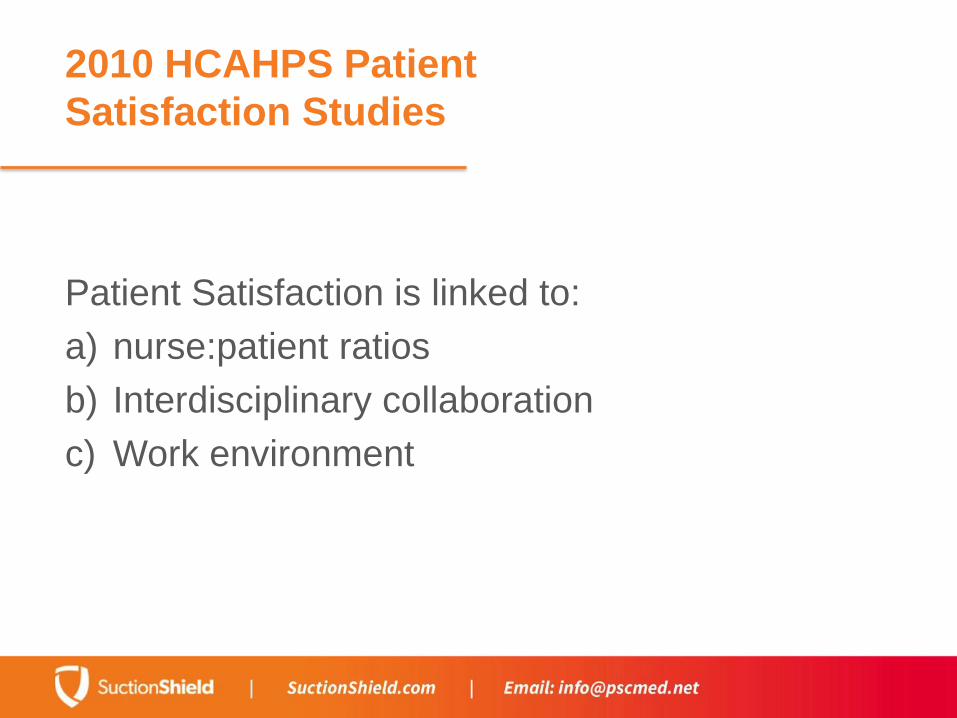
2010 HCAHPS Patient
Satisfaction Studies
Patient Satisfaction is linked to:
a) nurse:patient ratios
b) Interdisciplinary collaboration
c) Work environment
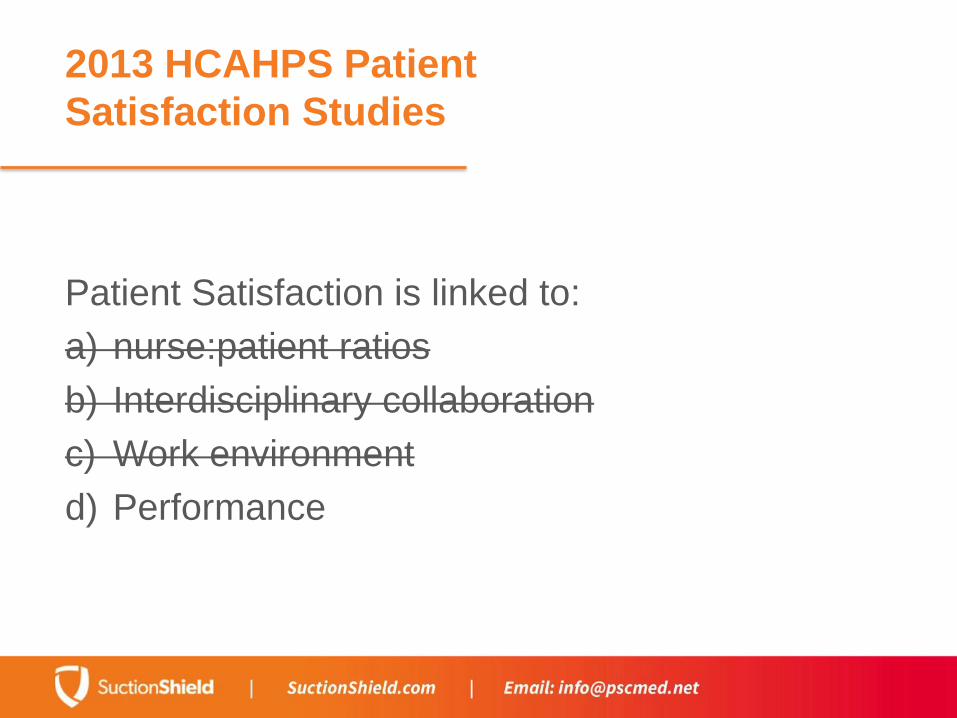
2013 HCAHPS Patient
Satisfaction Studies
Patient Satisfaction is linked to:
a) nurse:patient ratios
b) Interdisciplinary collaboration
c) Work environment
d) Performance

HCAHPS Patient
Satisfaction Studies
Patient Satisfaction is now linked to:
• 30% patient experience of care
• 70% Clinical Process of Care (HACs, etc.)
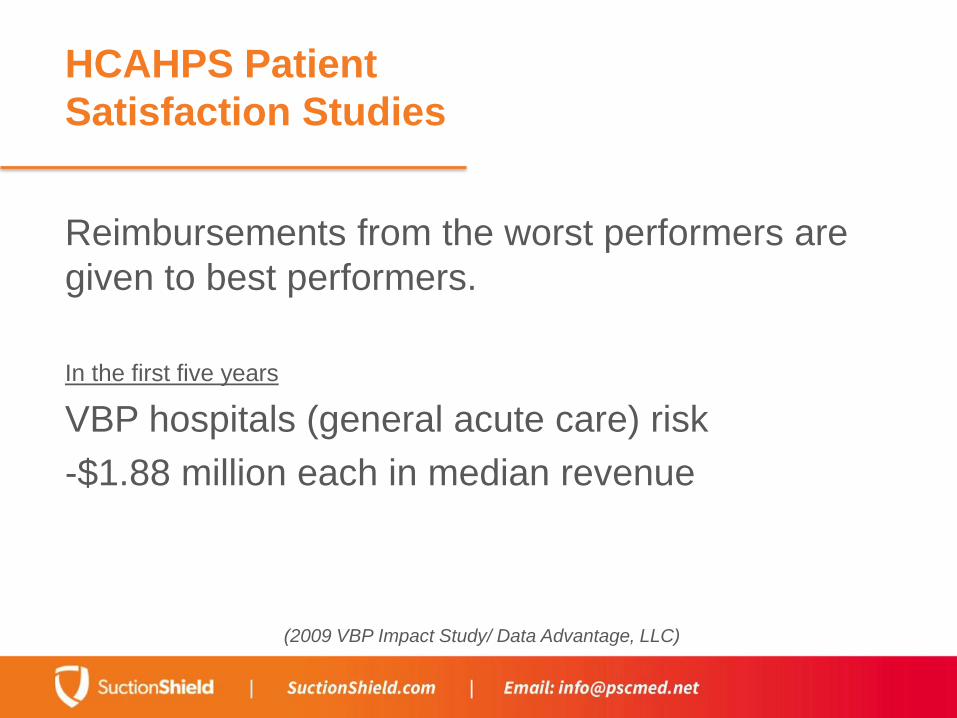
HCAHPS Patient
Satisfaction Studies
Reimbursements from the worst performers are
given to best performers.
In the first five years
VBP hospitals (general acute care) risk
-$1.88 million each in median revenue
(2009 VBP Impact Study/ Data Advantage, LLC)
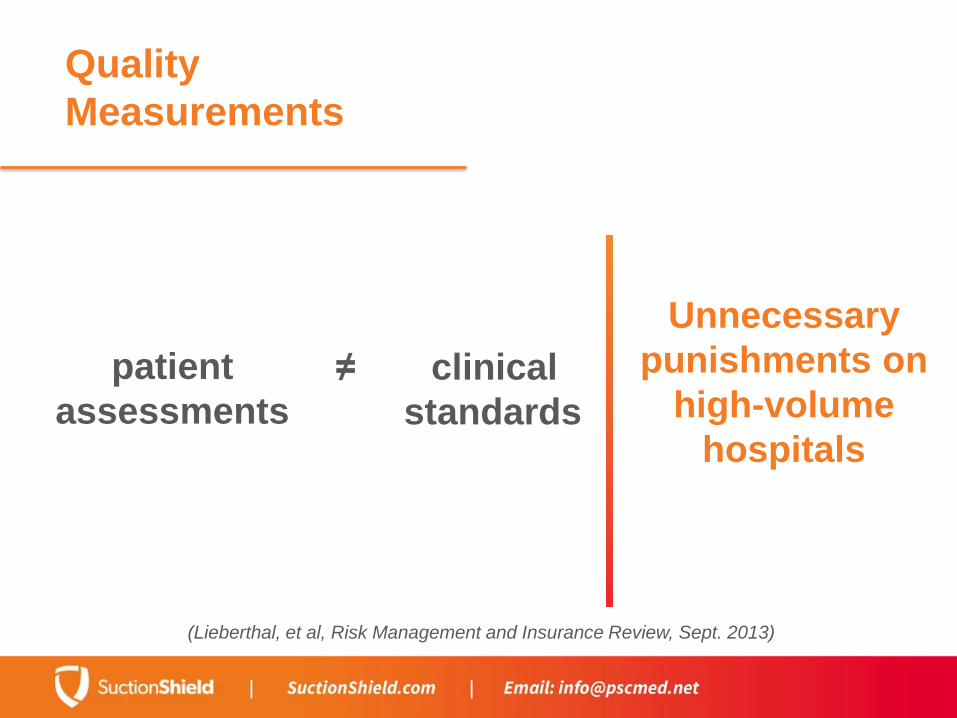
Quality
Measurements
patient
assessments
Unnecessary
punishments on
high-volume
hospitals
≠ clinical
standards
(Lieberthal, et al, Risk Management and Insurance Review, Sept. 2013)
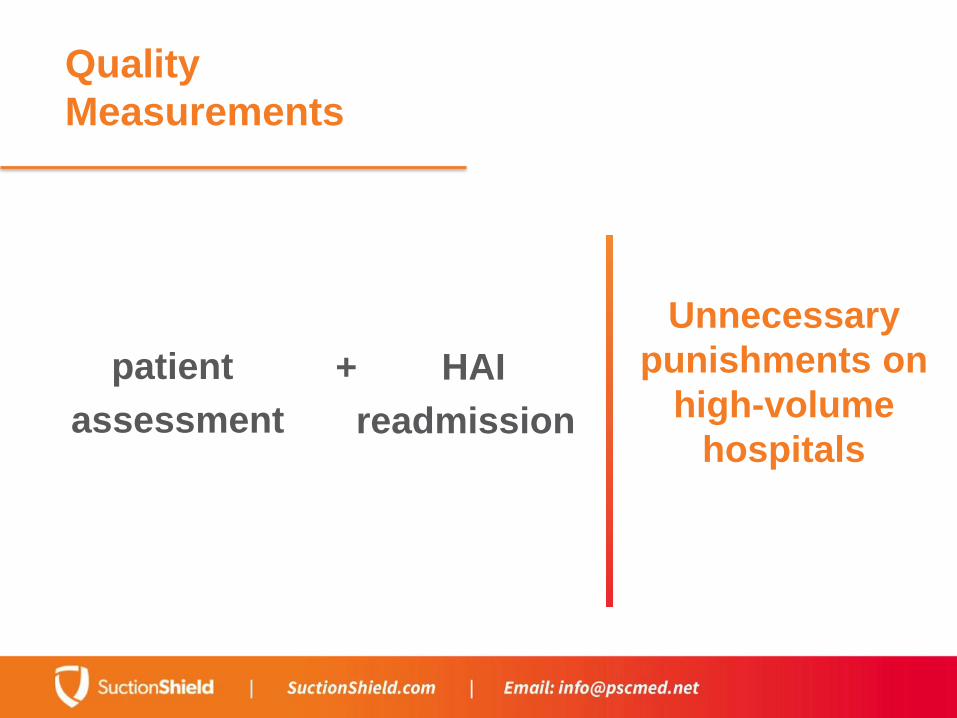
Quality
Measurements
patient
assessment
Unnecessary
punishments on
high-volume
hospitals
+ HAI
readmission

The Reality of a
Discharge with HAI
Many patients who are discharged with an HAI:
a) Are admitted to LTACs or SNFs
b) Require home health care
c) Need long-term rehab and pain treatments
d) Experience altered quality of life

Financial Impact on
Families
prolonged
hospitalization
Financial hardships:
62% of personal
bankruptcies due
to healthcare
issues
+ post
discharge
disability
(Am J Med. June 2009)
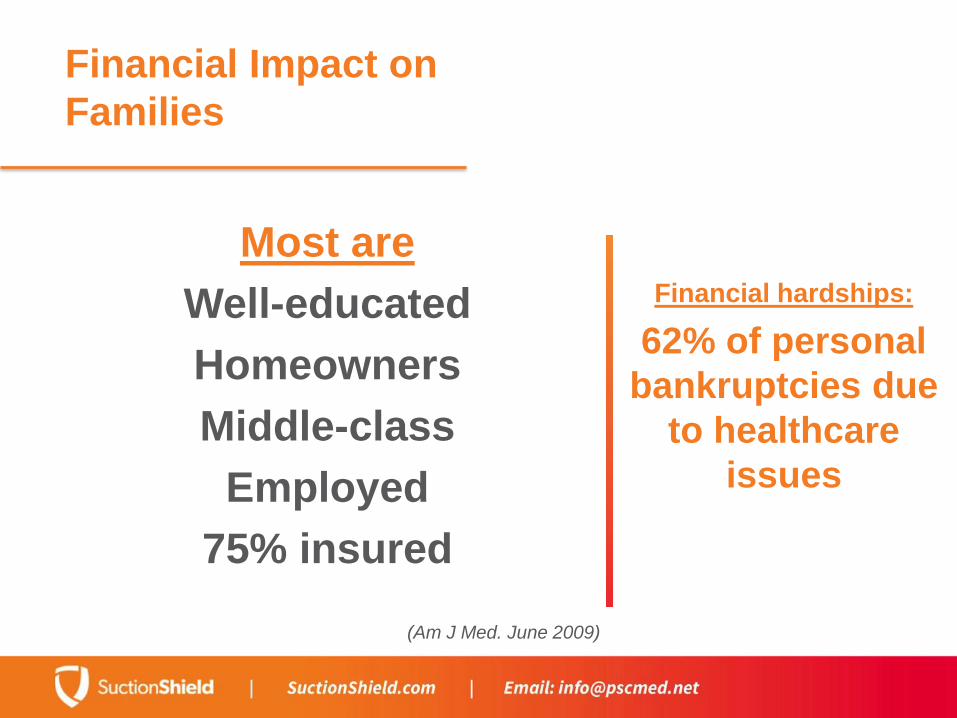
Financial Impact on
Families
Financial hardships:
62% of personal
bankruptcies due
to healthcare
issues
(Am J Med. June 2009)
Most are
Well-educated
Homeowners
Middle-class
Employed
75% insured
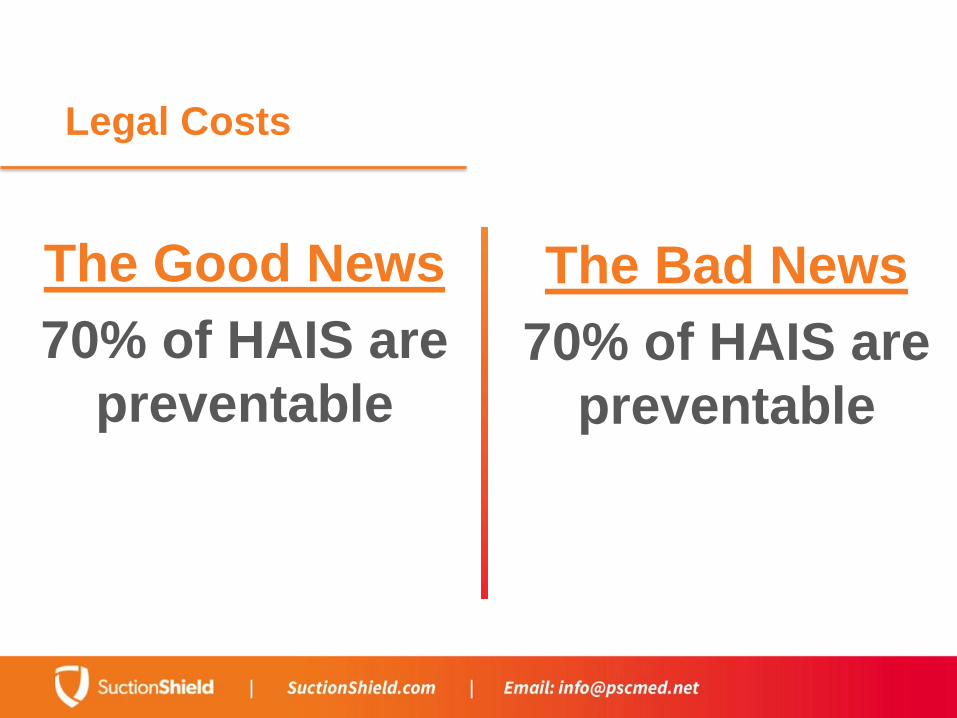
Legal Costs
The Bad News
70% of HAIS are
preventable
The Good News
70% of HAIS are
preventable
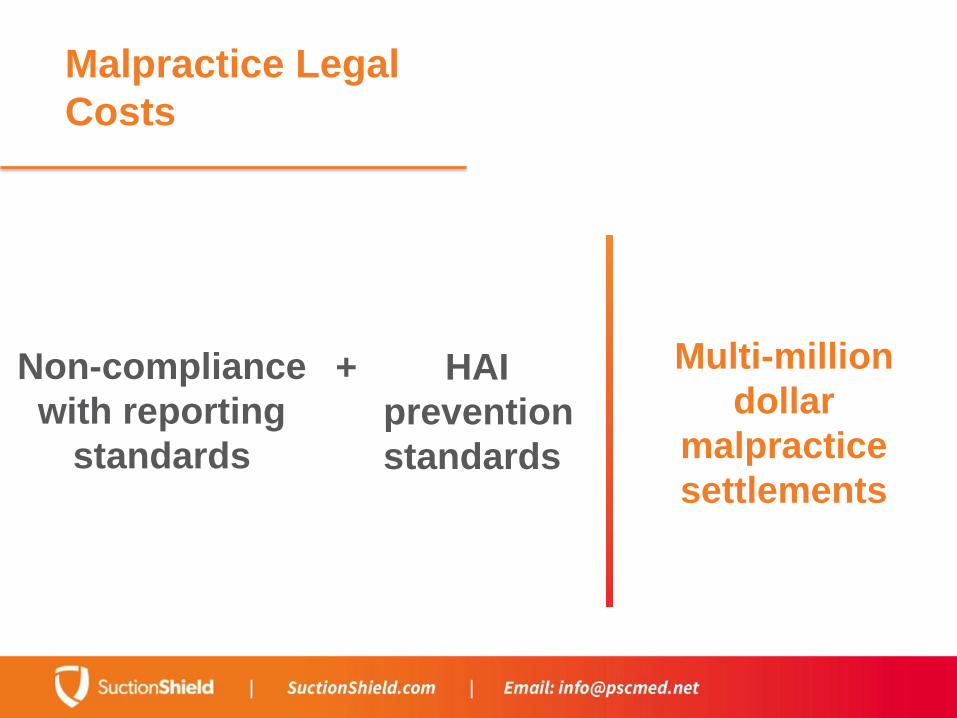
Malpractice Legal
Costs
Non-compliance
with reporting
standards
Multi-million
dollar
malpractice
settlements
+ HAI
prevention
standards
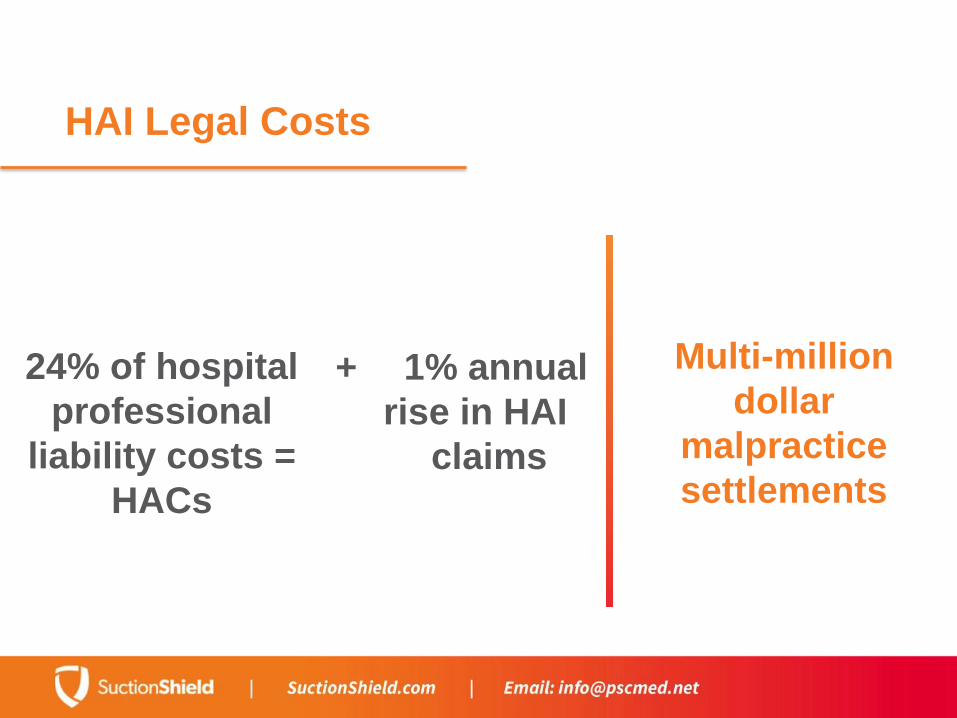
HAI Legal Costs
24% of hospital
professional
liability costs =
HACs
Multi-million
dollar
malpractice
settlements
+ 1% annual
rise in HAI
claims

HAI Malpractice Cases
Guilty
until proven
innocent
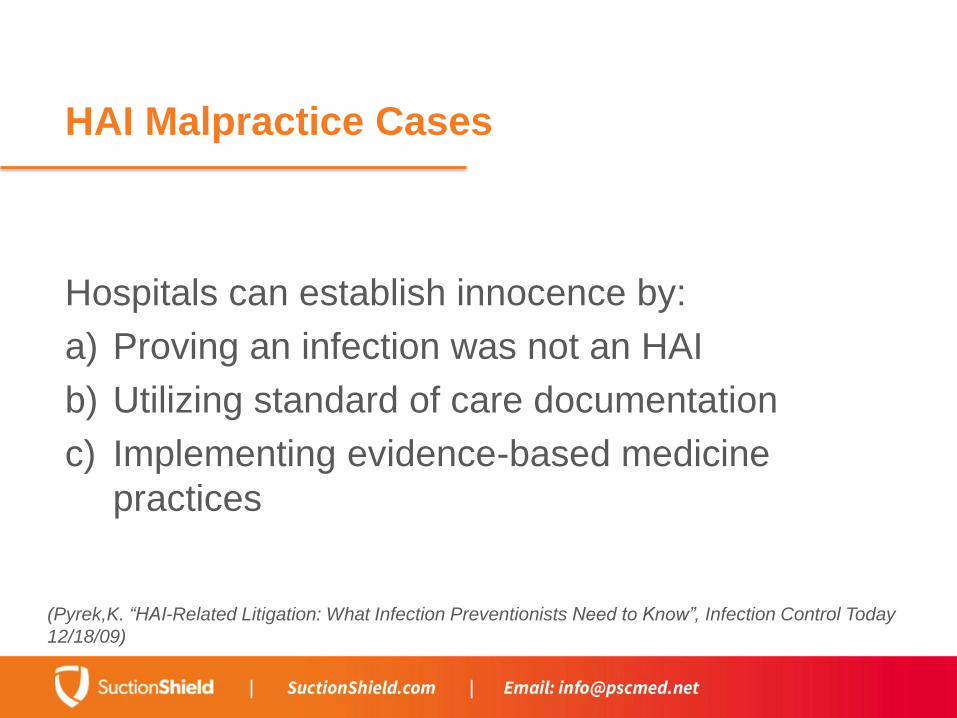
HAI Malpractice Cases
Hospitals can establish innocence by:
a) Proving an infection was not an HAI
b) Utilizing standard of care documentation
c) Implementing evidence-based medicine
practices
(Pyrek,K. “HAI-Related Litigation: What Infection Preventionists Need to Know”, Infection Control Today
12/18/09)

UNINTENDED CONSEQUENCES
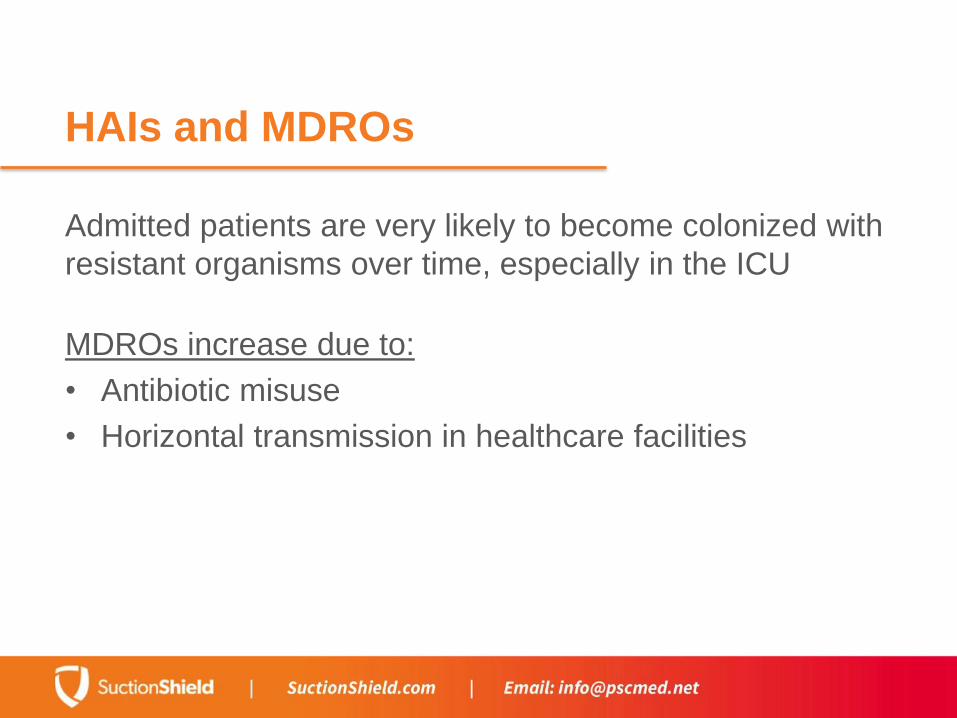
HAIs and MDROs
Admitted patients are very likely to become colonized with
resistant organisms over time, especially in the ICU
MDROs increase due to:
• Antibiotic misuse
• Horizontal transmission in healthcare facilities
MDROs Increase
Mortality
Responsible for higher death rates than
infections with susceptible organisms
MRSA vs MSSA
> 2
LOS
much greater
MDROs Increase
Mortality
CDI
14,000 die annually
CDI
250,000 hospitalized annually in
the U.S.
HAIs and MDROs
This leads to:
• Infections that are not reimbursable are not a priority
• Unnecessary tests on newly admitted patients
• Inappropriate antibiotic treatments
• Increases in CDI rates
HAI Containment Initiatives
• National Healthcare Safety Network Mandatory
Reporting
• Partnership for Patients Campaign
• Hand hygiene measures
HAI Containment Progress
• 1/3 of US hospitals in full compliance with guidelines
• BUT:
• < 50% of healthcare providers follow basic hand hygiene
measures
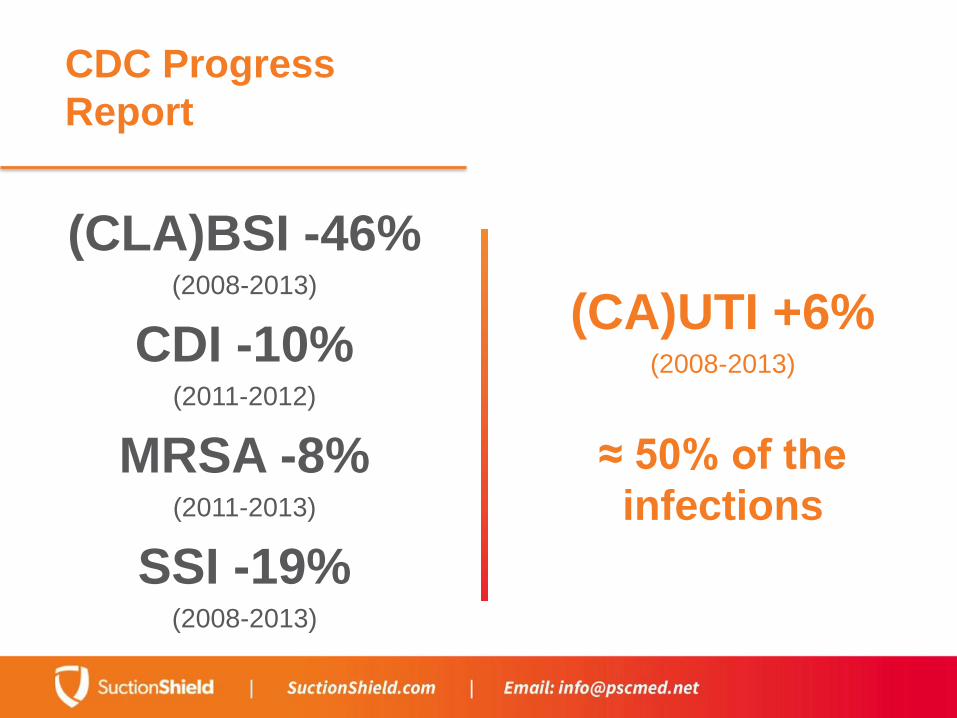
CDC Progress
Report
(CA)UTI +6%(2008-2013)
≈ 50% of the
infections
(CLA)BSI -46%(2008-2013)
CDI -10%(2011-2012)
MRSA -8%(2011-2013)
SSI -19%(2008-2013)
HAI PREVENTION
HAI Prevention Works
• Central venous catheter insertion protocols
• Sterile OR settings for urinary catheter insertion
• Oral care protocols prevent VAP and decrease infected
biofilms
• MRSA and VRE patient isolation precautions and
barriers
• Hospital Infection Preventionists
Transmission Prevention
Keys to Prevent MDRO Spread
• Hand hygiene monitoring programs
• Isolation precautions
• Environmental hygiene
• Active surveillance programs
• Decontamination
• Vaccination programs (pneumococcal vaccines)
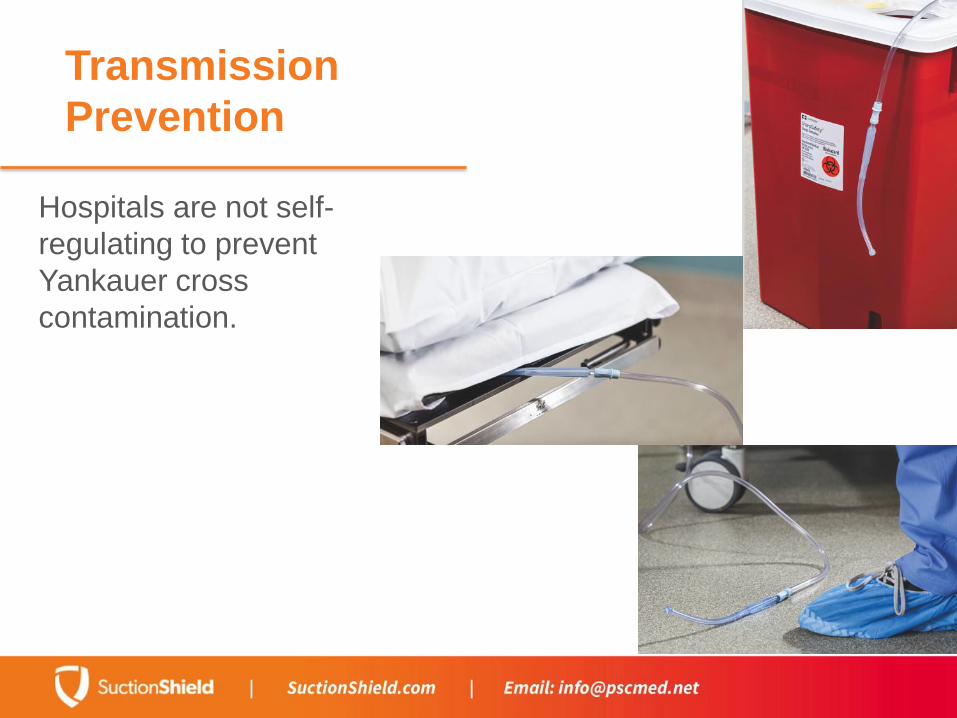
Transmission
Prevention
Hospitals are not self-
regulating to prevent
Yankauer cross
contamination.
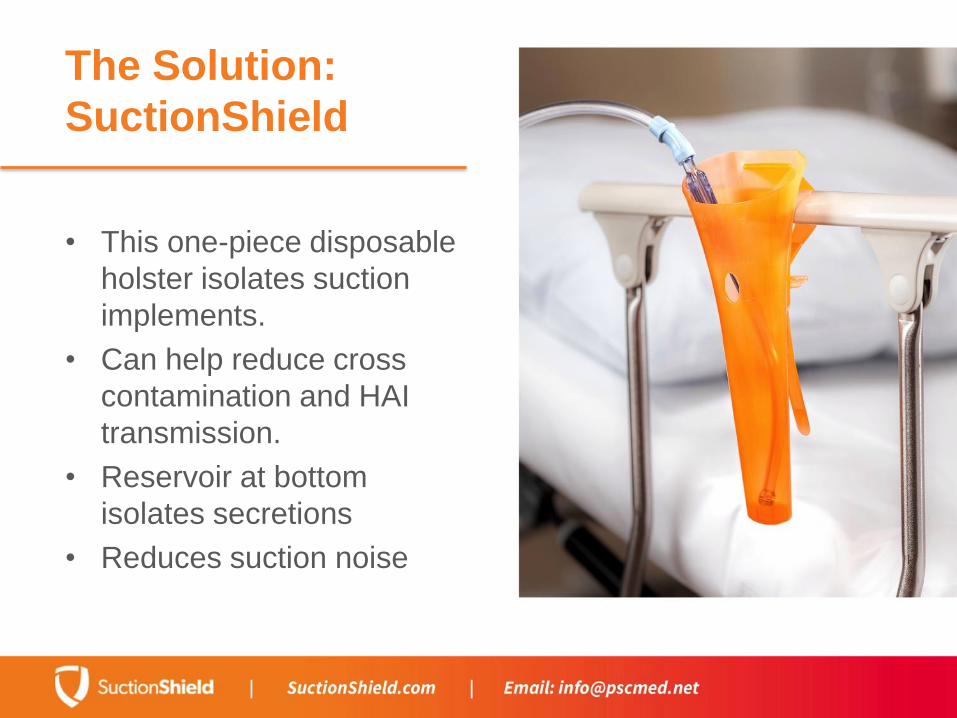
The Solution:
SuctionShield
• This one-piece disposable
holster isolates suction
implements.
• Can help reduce cross
contamination and HAI
transmission.
• Reservoir at bottom
isolates secretions
• Reduces suction noise

Q & A