Embed Size (px)
Citation preview
A Forrester Total Economic
Impact™ Study
Commissioned By
Smartsheet
Project Director:
Liz Witherspoon
February 2015
The Total Economic
Impact™ Of Smartsheet Cost Savings And Business Benefits Enabled By The Smartsheet Work Management Tool
Table Of Contents
Executive Summary .................................................................................... 3
Disclosures .................................................................................................. 8
TEI Framework And Methodology ............................................................ 9
Analysis ...................................................................................................... 10
Financial Summary ................................................................................... 24
Smartsheet: Overview .............................................................................. 26
Appendix A: Composite Organization Description .............................. 27
Appendix B: Total Economic Impact™ Overview ................................. 29
Appendix C: Glossary ............................................................................... 30
ABOUT FORRESTER CONSULTING
Forrester Consulting provides independent and objective research-based
consulting to help leaders succeed in their organizations. Ranging in scope from a
short strategy session to custom projects, Forrester’s Consulting services connect
you directly with research analysts who apply expert insight to your specific
business challenges. For more information, visit forrester.com/consulting.
© 2014, Forrester Research, Inc. All rights reserved. Unauthorized reproduction is strictly prohibited.
Information is based on best available resources. Opinions reflect judgment at the time and are subject to
change. Forrester®, Technographics
®, Forrester Wave, RoleView, TechRadar, and Total Economic Impact
are trademarks of Forrester Research, Inc. All other trademarks are the property of their respective
companies. For additional information, go to www.forrester.com.
3
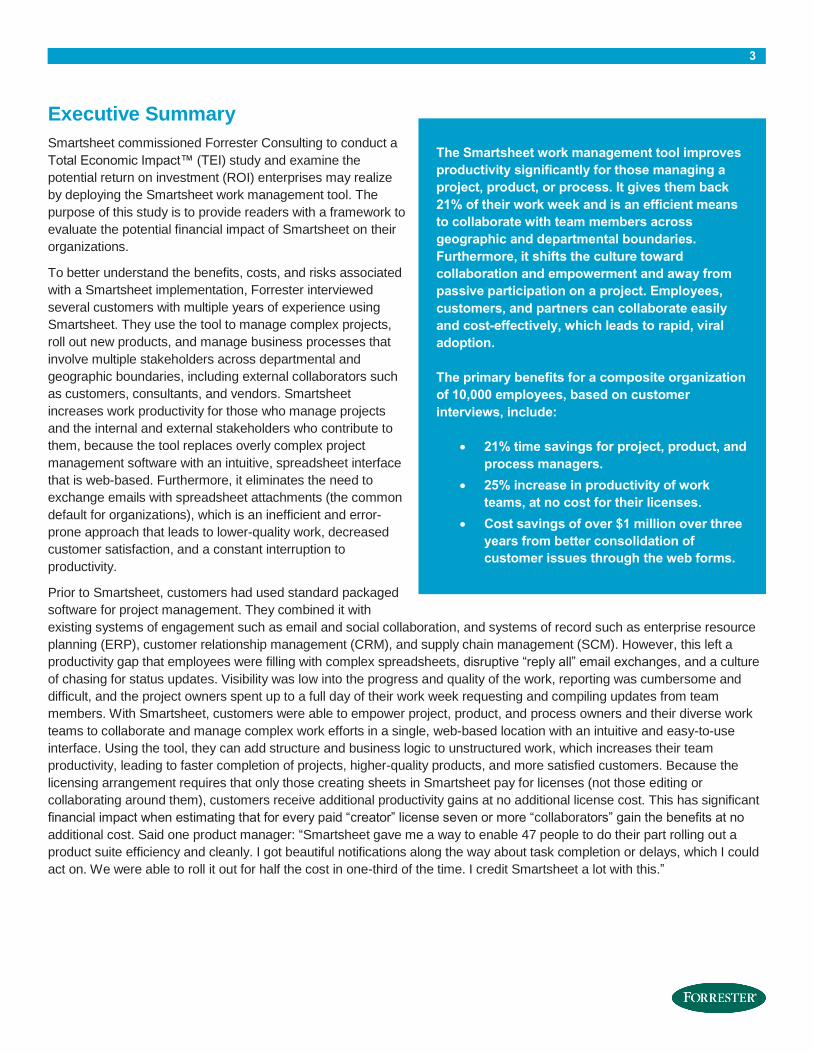
Executive Summary
Smartsheet commissioned Forrester Consulting to conduct a
Total Economic Impact™ (TEI) study and examine the
potential return on investment (ROI) enterprises may realize
by deploying the Smartsheet work management tool. The
purpose of this study is to provide readers with a framework to
evaluate the potential financial impact of Smartsheet on their
organizations.
To better understand the benefits, costs, and risks associated
with a Smartsheet implementation, Forrester interviewed
several customers with multiple years of experience using
Smartsheet. They use the tool to manage complex projects,
roll out new products, and manage business processes that
involve multiple stakeholders across departmental and
geographic boundaries, including external collaborators such
as customers, consultants, and vendors. Smartsheet
increases work productivity for those who manage projects
and the internal and external stakeholders who contribute to
them, because the tool replaces overly complex project
management software with an intuitive, spreadsheet interface
that is web-based. Furthermore, it eliminates the need to
exchange emails with spreadsheet attachments (the common
default for organizations), which is an inefficient and error-
prone approach that leads to lower-quality work, decreased
customer satisfaction, and a constant interruption to
productivity.
Prior to Smartsheet, customers had used standard packaged
software for project management. They combined it with
existing systems of engagement such as email and social collaboration, and systems of record such as enterprise resource
planning (ERP), customer relationship management (CRM), and supply chain management (SCM). However, this left a
productivity gap that employees were filling with complex spreadsheets, disruptive “reply all” email exchanges, and a culture
of chasing for status updates. Visibility was low into the progress and quality of the work, reporting was cumbersome and
difficult, and the project owners spent up to a full day of their work week requesting and compiling updates from team
members. With Smartsheet, customers were able to empower project, product, and process owners and their diverse work
teams to collaborate and manage complex work efforts in a single, web-based location with an intuitive and easy-to-use
interface. Using the tool, they can add structure and business logic to unstructured work, which increases their team
productivity, leading to faster completion of projects, higher-quality products, and more satisfied customers. Because the
licensing arrangement requires that only those creating sheets in Smartsheet pay for licenses (not those editing or
collaborating around them), customers receive additional productivity gains at no additional license cost. This has significant
financial impact when estimating that for every paid “creator” license seven or more “collaborators” gain the benefits at no
additional cost. Said one product manager: “Smartsheet gave me a way to enable 47 people to do their part rolling out a
product suite efficiency and cleanly. I got beautiful notifications along the way about task completion or delays, which I could
act on. We were able to roll it out for half the cost in one-third of the time. I credit Smartsheet a lot with this.”
The Smartsheet work management tool improves
productivity significantly for those managing a
project, product, or process. It gives them back
21% of their work week and is an efficient means
to collaborate with team members across
geographic and departmental boundaries.
Furthermore, it shifts the culture toward
collaboration and empowerment and away from
passive participation on a project. Employees,
customers, and partners can collaborate easily
and cost-effectively, which leads to rapid, viral
adoption.
The primary benefits for a composite organization
of 10,000 employees, based on customer
interviews, include:
21% time savings for project, product, and
process managers.
25% increase in productivity of work
teams, at no cost for their licenses.
Cost savings of over $1 million over three
years from better consolidation of
customer issues through the web forms.
4
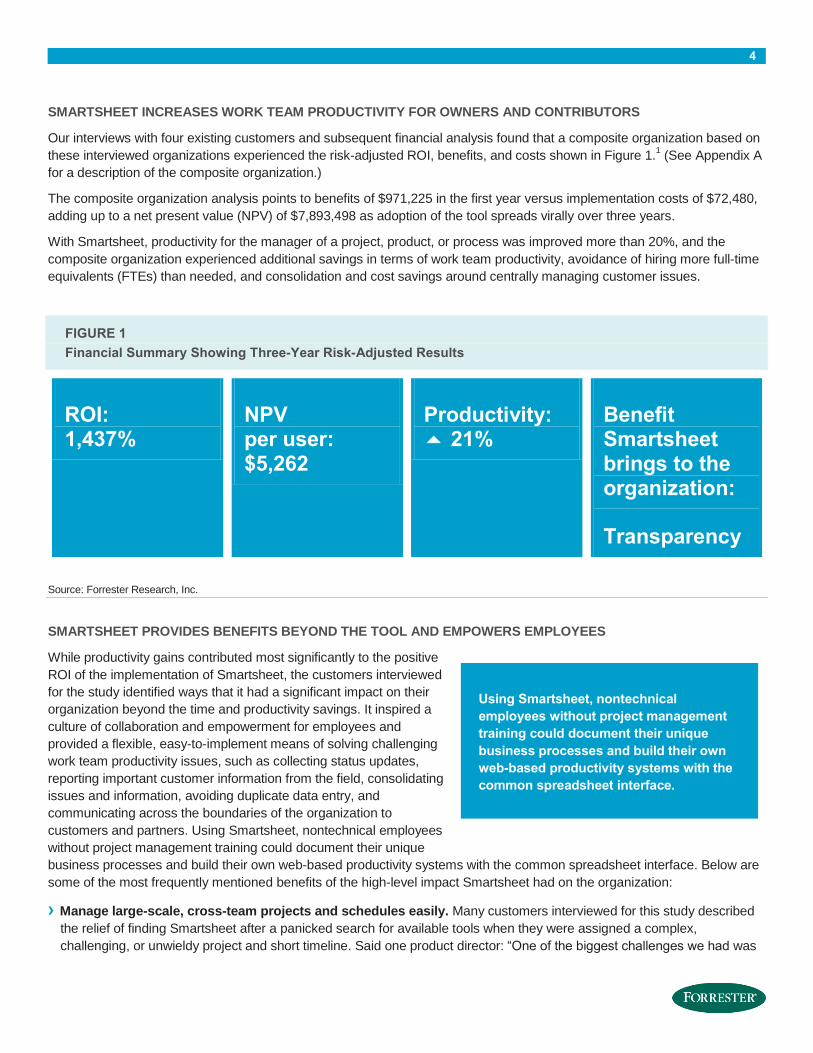
SMARTSHEET INCREASES WORK TEAM PRODUCTIVITY FOR OWNERS AND CONTRIBUTORS
Our interviews with four existing customers and subsequent financial analysis found that a composite organization based on
these interviewed organizations experienced the risk-adjusted ROI, benefits, and costs shown in Figure 1.1 (See Appendix A
for a description of the composite organization.)
The composite organization analysis points to benefits of $971,225 in the first year versus implementation costs of $72,480,
adding up to a net present value (NPV) of $7,893,498 as adoption of the tool spreads virally over three years.
With Smartsheet, productivity for the manager of a project, product, or process was improved more than 20%, and the
composite organization experienced additional savings in terms of work team productivity, avoidance of hiring more full-time
equivalents (FTEs) than needed, and consolidation and cost savings around centrally managing customer issues.
FIGURE 1
Financial Summary Showing Three-Year Risk-Adjusted Results
ROI: 1,437%
NPV per user: $5,262
Productivity: 21%
Benefit Smartsheet brings to the organization:
Transparency
Source: Forrester Research, Inc.
SMARTSHEET PROVIDES BENEFITS BEYOND THE TOOL AND EMPOWERS EMPLOYEES
While productivity gains contributed most significantly to the positive
ROI of the implementation of Smartsheet, the customers interviewed
for the study identified ways that it had a significant impact on their
organization beyond the time and productivity savings. It inspired a
culture of collaboration and empowerment for employees and
provided a flexible, easy-to-implement means of solving challenging
work team productivity issues, such as collecting status updates,
reporting important customer information from the field, consolidating
issues and information, avoiding duplicate data entry, and
communicating across the boundaries of the organization to
customers and partners. Using Smartsheet, nontechnical employees
without project management training could document their unique
business processes and build their own web-based productivity systems with the common spreadsheet interface. Below are
some of the most frequently mentioned benefits of the high-level impact Smartsheet had on the organization:
› Manage large-scale, cross-team projects and schedules easily. Many customers interviewed for this study described
the relief of finding Smartsheet after a panicked search for available tools when they were assigned a complex,
challenging, or unwieldy project and short timeline. Said one product director: “One of the biggest challenges we had was
Using Smartsheet, nontechnical
employees without project management
training could document their unique
business processes and build their own
web-based productivity systems with the
common spreadsheet interface.
5
that everyone was distributed and it was difficult to manage complex, large, dynamic projects with Excel, Word, and
emails. We were chomping at the bit for a new tool.” Regardless of industry, the customers interviewed described the
challenge of coordinating dozens of people inside and outside of the organization on the completion of work. They
struggled to get diverse team members, often including those who didn’t report to them, to update their work status
proactively. This led to project delays, anxiety-fraught meetings and emails, and lower-quality work. With Smartsheet,
these common issues were solved by the web-based interface, easy administration, and ability to invite resources to
participate securely for their specific contributions. The interviewees credited Smartsheet, in part, with completing projects
with greater accuracy and higher quality. The feature cited most often for improving productivity was “request an update”
— the trigger that Smartsheet enables to ask for project contributors to make updates to the rows that represent their
unique contribution to the project. Another valued, time-saving feature is the “reverse Gantt chart” that provides a project
timeline based on an end date.
› Unify the organization, creating a culture of collaboration. The enterprise-sized organizations interviewed for this
study estimated that at any given time, they had hundreds of employees managing team-based work efforts — whether
projects, products, or processes — that involved multiple stakeholders, a timeline, action items, dependencies, and
constantly moving parts and pieces. Because the majority are not traditional project managers by title, they lacked the
discipline and tool set (and often training) to work with the inflexible and overly complex project management tools
available to them. With the flexibility and ease of use of Smartsheet,
these work managers can now communicate and manage their
projects more effectively without having to train on a difficult tool set.
Adoption is high, and usage spreads virally because employees,
from the most tech-averse to the Millennials, enjoy using it and ramp
up quickly. Said one product manager: “Until Smartsheet, 10
different people would tell me they were using 10 different tools and
didn’t like any of them. It’s about unification instead of stratification.
The more unification behind the tool and templates, [the more] it
becomes a runaway train of success with the thousands of projects
happening in our organization.” A CIO said that upon the release of
Smartsheet, “The adoption was phenomenal. We had 200 users
immediately. It absolutely took off within our organization and we
haven’t turned back.” She credits Smartsheet with creating a culture
of collaboration and project management discipline, even when the
majority who use it are not technically titled “project managers.”
› Have visibility. . . . but at the right level. One of the most common
words used to describe the benefits of Smartsheet was
“transparency” into a work product, project, or process. At the team
level, team members can see how their individual contributions link
to others within the project. External customers and partners can
see only the information that pertains to them and are not
overwhelmed by the information they see, nor do they get access to
what they should not see. Accounting and finance can better
understand how resources are deployed and managed on
repeatable projects or processes. Perhaps most importantly, the
project, product, or process owner and the management team
members who need to analyze the progress of the work get easy,
regular access to reports that don’t require hours to create. Said one
power user and team coordinator: “I can export out the data and
“Until Smartsheet, 10 different
people would tell me they were
using 10 different tools and
didn’t like any of them — it’s
about unification instead of
stratification. The more
unification behind the tool and
templates, [the more] it
becomes a runaway train of
success with the thousands of
projects happening in our
organization.”
~Product manager, high-tech industry
6
analyze it immediately. I don’t have to ask John for one piece of information and Emily another. I have the confidence that
it’s accurate when pulling reports.” The team coordinator estimated that prior to Smartsheet, she spent two days doing
what she can now do in minutes.
› It is an IT-friendly tool that meets the toughest scrutiny around security and single sign-on. The customers
interviewed for the study converted to enterprise plans, typically after individual users found Smartsheet and purchased
individual licenses. This “shadow IT” is nothing new to CIOs, and the ones who seek to partner with the business want to
bring the tool to the forefront and apply appropriate security and administrative controls to mitigate risk to the company.
That risk could include losing valuable information if an employee leaves, exposing the company to security threats
because the tool is not integrated with existing security protocols, and paying for duplicate or redundant licenses at a high
cost. Unlike many similar software-as-a-service (SaaS) companies that start as a “consumer tool” that gains popularity
within a business, Smartsheet was designed to meet enterprise IT requirements. With capabilities such as single sign-on
and integration with back-end systems, IT leaders can be enablers, rather than enforcers, of the use of Smartsheet.
Furthermore, they mentioned that the agreements they have with Smartsheet meet the scrutiny and customization they
required. Said one technology strategist: “Lots of people have deadlines, find a tool, and simply sign up, but they are
working on public terms and conditions. I’ve approached many companies about using those tools in a structured,
sanctioned way so that valuable and sensitive corporate information doesn’t get lost or mishandled. So few companies are
set up to deal with that, and that’s where Smartsheet really scored.”
› Level the playing field for the ability to design and implement a productivity system. The ease of use and flexibility
of Smartsheet means that it can be adapted to reflect the hundreds of processes and projects that exist in an enterprise.
But rather than relying on an IT administrator, business analyst, or PM-certified resource to create templates and sheets,
the Smartsheet tool makes it possible for any employee to customize it for their use. The creative applications mentioned
in interviews included customer issue management systems, vendor management systems, product portfolio rollouts,
account management, marketing campaign management, content and technology asset management, and survey capture
and analysis, among many others. Most significant, however, was that the people who created these sheets and templates
ranged from office coordinator to middle manager to senior product leader. With the use of the online video tutorials
provided at no cost to the customer, the person with the idea and the determination could create a work system that was
more effective than many paid systems of record. In one example, a midsized organization made attempts to track IT
assets as they moved around the organization through a variety of software tools, but the most effective solution came
from a Smartsheet web form that the organization integrated with the corporate Intranet. Said one evangelist of
Smartsheet: “Smartsheet lets me have control and customize how I need it. It isn’t a set form. It’s flexible.”
› Speed the completion of projects with fewer errors. The customers interviewed for this study use Smartsheet
extensively across the organization for projects that generate revenue, such as new product development, sales and
account management, and supply chain management, along with projects that save costs, such as client issue resolution,
supplier management, and internal resource planning. They reported a decrease in time-to-completion for their projects.
The value of that project — whether it is revenue-generating or cost-saving — varies by company and industry, but its
potential is significant. In one example, a product manager of a high-tech industry cited being about to get a portfolio of
products out for half the cost and in one-third of the time, generating $12 million in three months compared with the $2
million the same portfolio previously generated in the entire year. Another power user cited the fact that his team could
generate proposals more quickly using Smartsheet, which led to more submissions and more wins. Furthermore, the
transparency the tool provides for potential project delays enables faster error resolution and more “catches” of errors
before they affect the project. One customer cited a 30% reduction in errors, which saved the project an estimated
$200,000. Another customer reported that Smartsheet’s mobile phone integration reduced their error rate for linking
properties to pictures. Previously, property managers spent up to a full day every month downloading pictures and
matching them to the right property, with a high rate of errors because of the volume of properties and the similarity of their
images. Now, they snap a photo on-site with their mobile phones and upload them immediately to the Smartsheet cell that
matches the property.
7
› Benefits. The composite organization experienced the following risk-adjusted benefits that represent those experienced by
the interviewed companies:
• A 21% productivity improvement to manage a project, product, or process, leading to $5,890,500 in savings
over three years. The average time a project, product, or process manager had to spend managing the status of a
project and gathering updates from stakeholders was reduced significantly after implementing Smartsheet. This not
only increased productivity of the manager of the work, but it also shifted the spirit of the effort. Previously, work
team members reacted to “hounding” from project managers; now they are proactive participants in the successful
completion of the project. One head of project management of a publishing company commented: “I just can’t tell
you how much time the Update Requests feature has saved me. Not just the time, but the nagging feeling in the
back of your mind. It’s peace of mind, and [because] it’s set to be a recurring task, I can move on to something else.
It’s almost like delegating a task to another person.” The time savings of 160 hours every quarter could enable that
project manager to take on more projects per year, leading to more revenue or cost savings for the company.
• A 25% productivity gain for work teams over three years, leading to $3,609,375 in savings over three years.
Not only do the managers of work benefit from the use of Smartsheet, but the teams that surround each project,
product, or process also gain productive time back in their day by using the tool. Examples of how this benefit is
realized include being able to update customer records while in the field on a smartphone instead of waiting to come
back to the office and transfer notes, receiving automated reminders to update the work status on a project, and also
having fewer interruptions per day with emails around a team work effort.
• A reduced cost of $835,200 over three years to consolidate customer issues, increasing the responsiveness
of sales and service engineers. Field employees such as service technicians and field sales engineers were able
to report customer issues or provide real-time updates to customer data more quickly with Smartsheet. They
reported saving a minimum of an hour per week of administrative work that was previously required to capture and
consolidate customer issues and updates. Furthermore, Smartsheet removed the communication layer of email and
phone that delayed those updates. The web forms tool enabled quick and easy capture of issues and changes
through iPads, iPhones, and Android devices, enabling faster customer service.
• Improved resourcing around projects, resulting in a cost avoidance of $450,000 over three years. The
customers interviewed reported that they could save money on hiring a full-time equivalent because they had better
visibility into the staffing of a project. This is due to the increased transparency of the workloads among workers
within an organization, better reporting tools, and the ability to hire strategically for the right level of resource. After
analyzing resources in Smartsheet, the organization was able to determine when a particular project could be
staffed with a support person instead of a full-time, higher-cost replacement.
› Costs. The composite organization experienced the following risk-adjusted costs:
• Software licensing fees of $19 per user per month (dropping to $15 per month for over 1,000 users). These
are monthly recurring one-time license fees paid to Smartsheet for access to the full tool. After the enterprise
reaches 1,000 users, the price per user drops to $15 per user per month. Note that the user licenses are
distinguished between “creator” licenses for users who can create sheets and “collaborator” licenses for those users
who edit but do not create sheets. The software licensing fee includes an unlimited number of collaborators at no
cost to the company. The average ratio within an enterprise is roughly 1 to 7, or seven collaborators for every one
creator.
• Implementation costs of $211,200 over three years to create and customize templates. These are internal
costs reported by the customers interviewed for the study. They described the time that they spend with the tool
setting up alerts, building business logic, and customizing the template to their specific use. This time investment
may not have been needed in a traditional tool but yields the productivity gains captured in the Benefits section.
• Internal training costs of $57,600 over three years for creators to be proficient. This is a one-time cost to train
the “creators” on the tool so that they can fully integrate it into their workflow and project tool set. Although
8
Smartsheet offers on-site training, most of the customers opted to create their own classes and integrate them with
training that had already been planned. Furthermore, they referenced the free video tutorials provided by
Smartsheet on its website as important resources for learning how to use individual features, such as reporting and
alerts.
Disclosures
The reader should be aware of the following:
› The study is commissioned by Smartsheet and delivered by Forrester Consulting. It is not meant to be used as a
competitive analysis.
› Forrester makes no assumptions as to the potential ROI that other organizations will receive. Forrester strongly advises
that readers use their own estimates within the framework provided in the report to determine the appropriateness of an
investment in Smartsheet.
› Smartsheet reviewed and provided feedback to Forrester, but Forrester maintains editorial control over the study and its
findings and does not accept changes to the study that contradict Forrester's findings or obscure the meaning of the study.
› Smartsheet provided the customer names for the interviews but did not participate in the interviews.
9
TEI Framework And Methodology
INTRODUCTION
From the information provided in the interviews, Forrester has constructed a Total Economic Impact (TEI) framework for
those organizations considering implementing the Smartsheet work management tool. The objective of the framework is to
identify the cost, benefit, flexibility, and risk factors that affect the investment decision.
APPROACH AND METHODOLOGY
Forrester took a multistep approach to evaluate the impact that Smartsheet can have on an organization (see Figure 2).
Specifically, we:
› Interviewed Smartsheet marketing, sales, and/or consulting personnel, along with Forrester analysts, to gather data
relative to the work management tool and the marketplace for Smartsheet.
› Interviewed four organizations currently using Smartsheet to obtain data with respect to costs, benefits, and risks.
› Designed a composite organization based on characteristics of the interviewed organizations (see Appendix A).
› Constructed a financial model representative of the interviews using the TEI methodology. The financial model is
populated with the cost and benefit data obtained from the interviews as applied to the composite organization.
› Risk-adjusted the financial model based on issues and concerns the interviewed organizations highlighted in interviews.
Risk adjustment is a key part of the TEI methodology. While interviewed organizations provided cost and benefit
estimates, some categories included a broad range of responses or had a number of outside forces that might have
affected the results. For that reason, some cost and benefit totals have been risk-adjusted and are detailed in each
relevant section.
Forrester employed four fundamental elements of TEI in modeling Smartsheet’s service: benefits, costs, flexibility, and risks.
Given the increasing sophistication that enterprises have regarding ROI analyses related to IT investments, Forrester’s TEI
methodology serves to provide a complete picture of the total economic impact of purchase decisions. Please see Appendix
B for additional information on the TEI methodology.
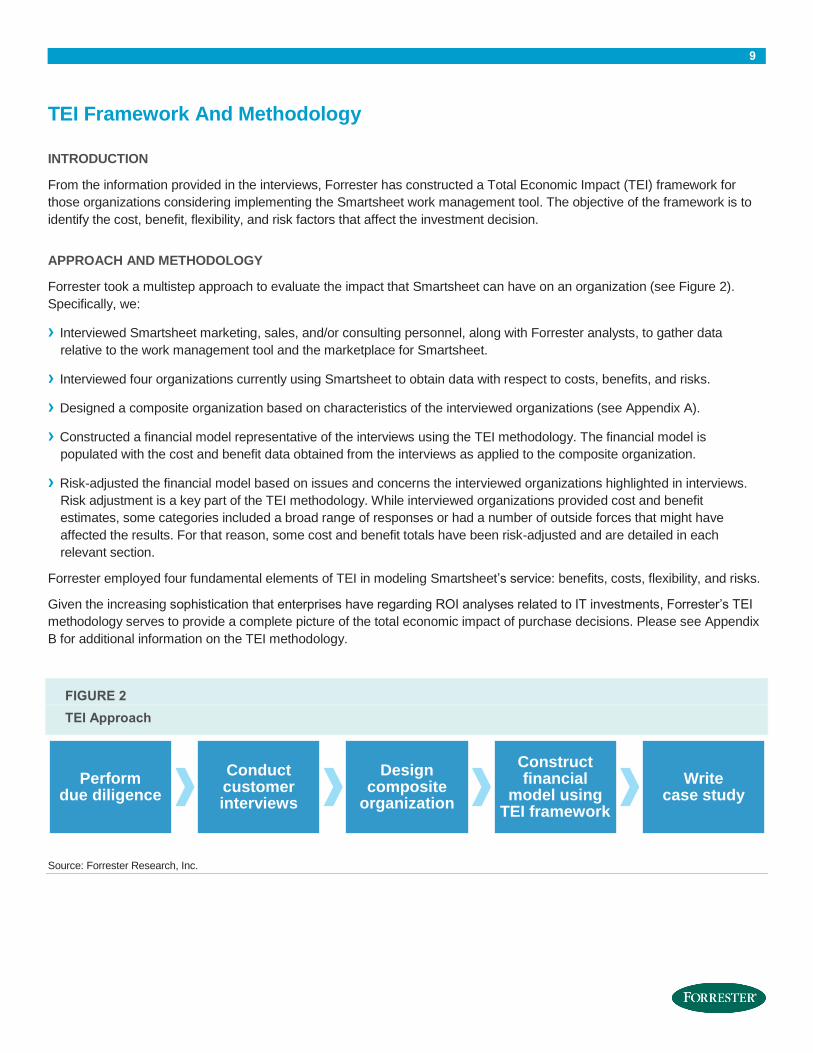
FIGURE 2
TEI Approach
Source: Forrester Research, Inc.
Perform due diligence
Conduct customer interviews
Design composite
organization
Construct financial
model using TEI framework
Write case study
10
Analysis
COMPOSITE ORGANIZATION
For this study, Forrester conducted a total of four interviews with representatives from the following companies, which are
Smartsheet customers based in the US and England:
› A multinational education company and the largest book publisher in the world, with $8.3 billion in annual revenue.
› A leader in global real estate, offering comprehensive services to investors, property owners, tenants, and developers, with
annual revenue of $2.3 billion.
› A nonprofit research and development agency headquartered in California and working at the national, state, and local
levels, with $140 million in annual revenue.
› A multinational technology corporation with $47 billion in annual
revenue.
Based on the interviews, Forrester constructed a TEI framework, a
composite company, and an associated ROI analysis that
illustrates the areas financially affected. The composite
organization that Forrester synthesized from these results
represents an organization with the following characteristics:
› A US-based global organization.
› 10,000 employees globally.
› 200 creator licenses and 1,000 collaborators in the first year of
implementation.
› Work teams of about 10 people collaborating on a project,
product, or process throughout the organization.
The composite organization first identified the tool through
individual evangelists who began using it on their own to solve a
problem with a process or project. Those evangelists had
purchased creator licenses directly from Smartsheet and invited
others on their work team as collaborators. Within those “under the
radar” or “shadow IT” implementations, the people who were invited
to collaborate on the project quickly adopted the tool and realized more uses for it to solve different productivity challenges.
Thus, viral adoption took hold and one or two licenses quickly ballooned to dozens. After analyzing the viral adoption of the
tool within the organization, the composite organization chose to implement Smartsheet at the enterprise level:
› First, the IT and business organizations analyzed their use of it in the organization and decided to pilot the tool with specific
projects.
› Once convinced that the tool met the technical, security, and business requirements, the organization purchased an
enterprisewide license.
› The organization then did a soft launch with some publicity and posts, followed by a “beat the drum” launch later with more
extensive training.
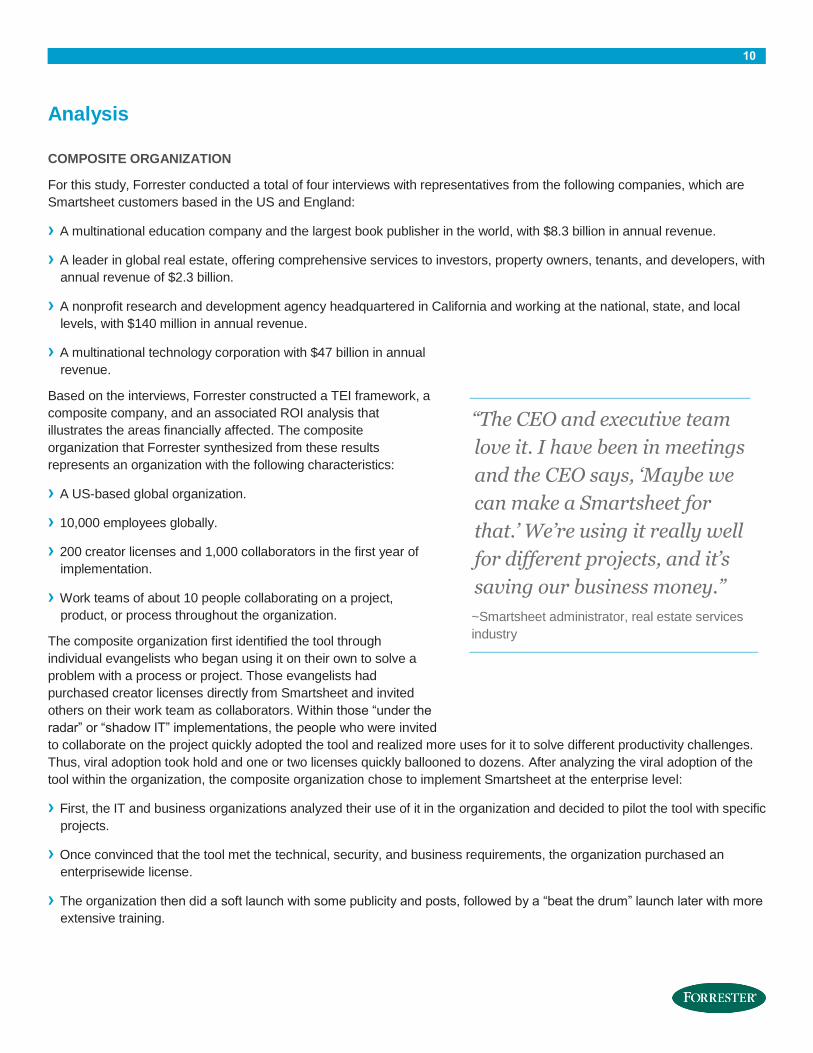
“The CEO and executive team
love it. I have been in meetings
and the CEO says, ‘Maybe we
can make a Smartsheet for
that.’ We’re using it really well
for different projects, and it’s
saving our business money.”
~Smartsheet administrator, real estate services
industry
11
› It plans to steadily add users every year, more than doubling the number of licenses in Year 2 and tripling them in Year 3.
A corresponding increase in collaborators is expected for this organization as the tool’s use spreads through the
organization and expands to include external customers and partners. One Smartsheet evangelist interviewed for this
study reported, “With the rate of adoption that we’ve already had, we’ll quickly hit a point where half of our 72,000
employees worldwide will be using Smartsheet.” It’s important to note that the tool provides that productivity reach without
the per-user license cost. On average, there will be seven free collaborator licenses used for each paid creator license.
INTERVIEW HIGHLIGHTS
Situation
The representative organization on which this study was based is enterprise-sized with geographically dispersed employees.
The organization has countless cross-departmental, ongoing work efforts that span the realm of project management,
product management, and process management. Many of the use cases for the tool have a direct impact on external
customers in terms of the products rolled out to them or the management and ongoing service to their accounts. The work
teams for these efforts rely on individual contributors, often outside of their direct teams and often beyond the organizational
structure, to update their individual pieces of the project. While not necessarily considering itself a project-management-
focused organization, it relies on repeatable processes and templates to complete work. The completion of that work
improves client satisfaction, reduces risk in project delivery, streamlines workflows, and leads to bottom-line savings.
While scrutinizing the range of work productivity tools available to the organization, the key stakeholders decided that:
› The tool needed to satisfy a diverse range of skillsets and needs. It had to both provide sophisticated project management
tools and reporting features (like Gantt charts with dependencies and business-logic-based alerts) to project managers,
without intimidating work team members. It was essential to have an intuitive user interface that less technical contributors
and outside partners and customers could use easily.
› The tool needed to be web-based so that it could be available
anytime, anywhere, and users could collaborate in real time in
one location. However, it needed to meet enterprise security
requirements and support single sign-on. And because an
estimated 30% of collaborators are external to the company, the
tool needed to provide different views into the data depending
on role and level of access.
› The tool needed to be ready for enterprise-level integration with
many existing tools such as Salesforce, Okta, Evernote,
Marketo, Google Drive, and Box. This was a requirement so that
the tool could work with existing technology investments and
systems of record, exchanging data when necessary.
› The workforce is often in the field and needs access to the tool
from their mobile devices. The experience needed to be
seamless when users moved between devices and reflect the
way that business is done.
› The tool needed to be implemented quickly and require little training for the average user. It needed to well-liked and make
employees feel empowered, rather than stressed, when opening it (e.g., no coding or IT requests to fit specific needs).
› Rather than the organization fitting the process or project to fit the tool, the tool needed to be flexible and easily adapted to
reflect the different capabilities within the organization for which it is used.
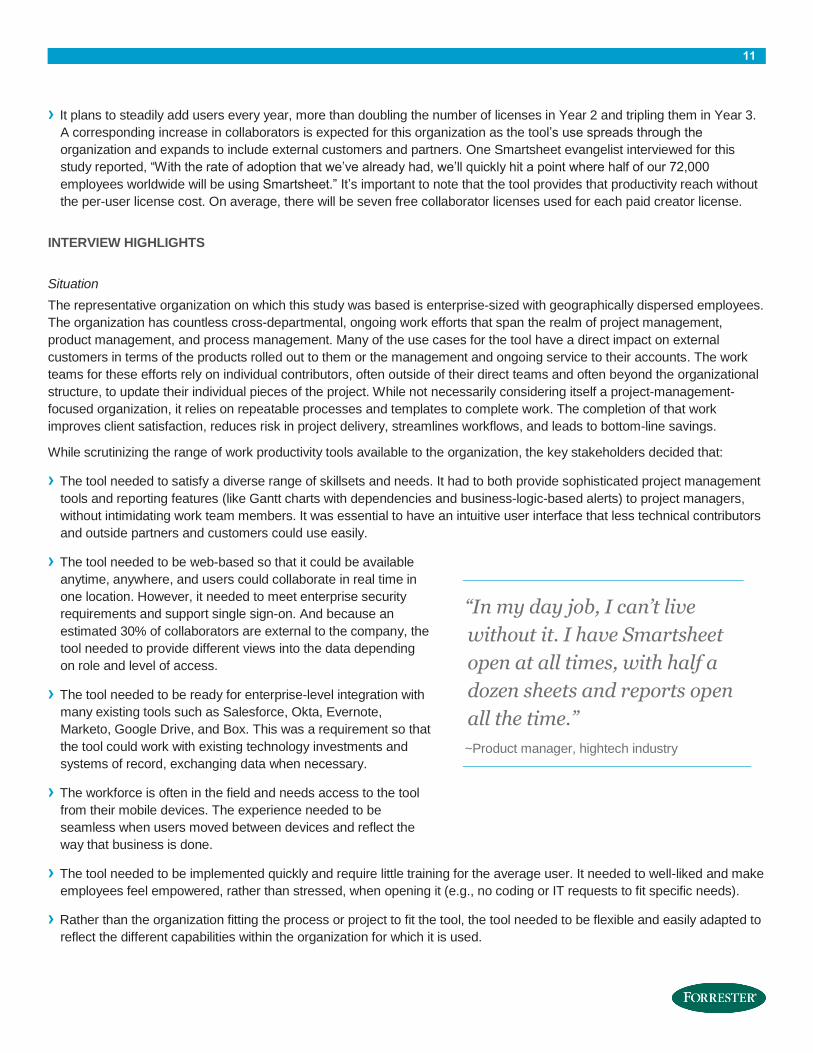
“In my day job, I can’t live
without it. I have Smartsheet
open at all times, with half a
dozen sheets and reports open
all the time.”
~Product manager, hightech industry
12
Solution
The composite organization selected Smartsheet because it could serve a multitude of use cases within the organization,
satisfying the needs of dozens of teams and hundreds of creators and collaborators, without requiring a significant
investment in licenses, technology labor, or infrastructure. The tool satisfies both “consumer” expectations in use and
flexibility and enterprise security requirements to pass muster with the CIO. Furthermore, it is easy and intuitive to use, so it
could be rolled out quickly. Creators have paid licenses, but “collaborators” can be internal or external colleagues,
customers, or partners who can work within the Smartsheet tool without having to pay for a license.
Results
The interview revealed that:
› There were productivity improvements for the managers and collaborators of projects, products, and processes.
The most significant benefits experienced were from time saved by having a web-based, unified source of truth for all
information related to a project, product, or process that could be updated in real time. For project managers, this meant a
reduction in time chasing team members for status updates through email and phone and consolidating multiple
spreadsheets. For collaborators, this meant fewer interruptions
to their work and a simplified means of updating their status
using a range of devices.
› Quality of work improved for customers through better
collaboration. The composite organization was able to improve
the quality of its work because all work team members could
see and understand their contribution to the finished product.
Project managers could see potential issues and delays
occurring and correct course before they became a hindrance to
the project rollout. Higher-level stakeholders could get ongoing
reports about work progress, allowing them to strategize around
resources and product strategy.
› The tool enabled a culture of collaboration. The composite
organization described Smartsheet as an important catalyst to
promoting collaboration — and even more importantly,
ownership — of a work effort. Many described the tool as
“enjoyable to use” and inspiring more curiosity and loyalty than
the derisiveness and skepticism that can often accompany a
new tool’s rollout. The advanced features and flexibility had
nontechnical employees trying new uses across functional areas. There are as many uses for the tool as there are roles
within an organization. One product manager recalled how he described Smartsheet to his work team members at the
start of a particularly challenging effort: “I sat in the room with 74 people and said, ‘The days of project managers scribing
and bugging you with face-to-face meetings, conference calls, email requests, and IMs to get your status ends right here,
right now. The days of you being responsible and empowered to report [in] real time where you are starts now. We’re
going to be a runaway success if everyone does their part.”
“Collaboration is the entire
point of Smartsheet. We have
teams that never set foot in the
office — they are constantly
using the tool on their mobile
device and tablets.”
~ Smartsheet administrator, real estate services
industry
13
BENEFITS
The composite organization experienced a number of quantified benefits in this case study:
› Increased project, product, or process management productivity.
› Increased work team productivity around a project, product, or process.
› Reduced costs due to consolidating customer issues or vendor information.
› Improved resourcing around projects, leading to cost savings.
Another important benefit mentioned by the composite organization was increased visibility into a project or process, which
led to earlier error detection and resolution. This decreased costs and improved the time-to-market for projects and products.
Also not captured in the financial model but mentioned frequently was how using Smartsheet with external customers
provided a competitive advantage to the organization. External customers, often collaborators, were so impressed with the
use of the tool as it applied to them, that they were more likely to be repeat customers.
Increased Project, Product, Or Process Management Productivity
The composite organization indicated that a key benefit from the Smartsheet implementation was increased project, product,
or process management productivity. Prior to Smartsheet, the composite organization’s project, product, or process
managers had to rely on email, spreadsheets, and phone calls to track down updates on the project from stakeholders and
project contributors. They estimated that they spent 21% of their work weeks requesting updates, consolidating multiple
versions of spreadsheets, and creating reports on the status of the project. With Smartsheet, their use of the Update
Requests feature, built-in business logic, and one central location for managing the project has cut hours off of their
workload. Furthermore, they have an easier way to start a project and deploy resources more quickly by using Smartsheet
templates. The productivity gains they realized with Smartsheet not only changed the amount and focus of their work but
also changed the behavior of their work teams by empowering them to own their individual contribution to a project.
14
FIGURE 1
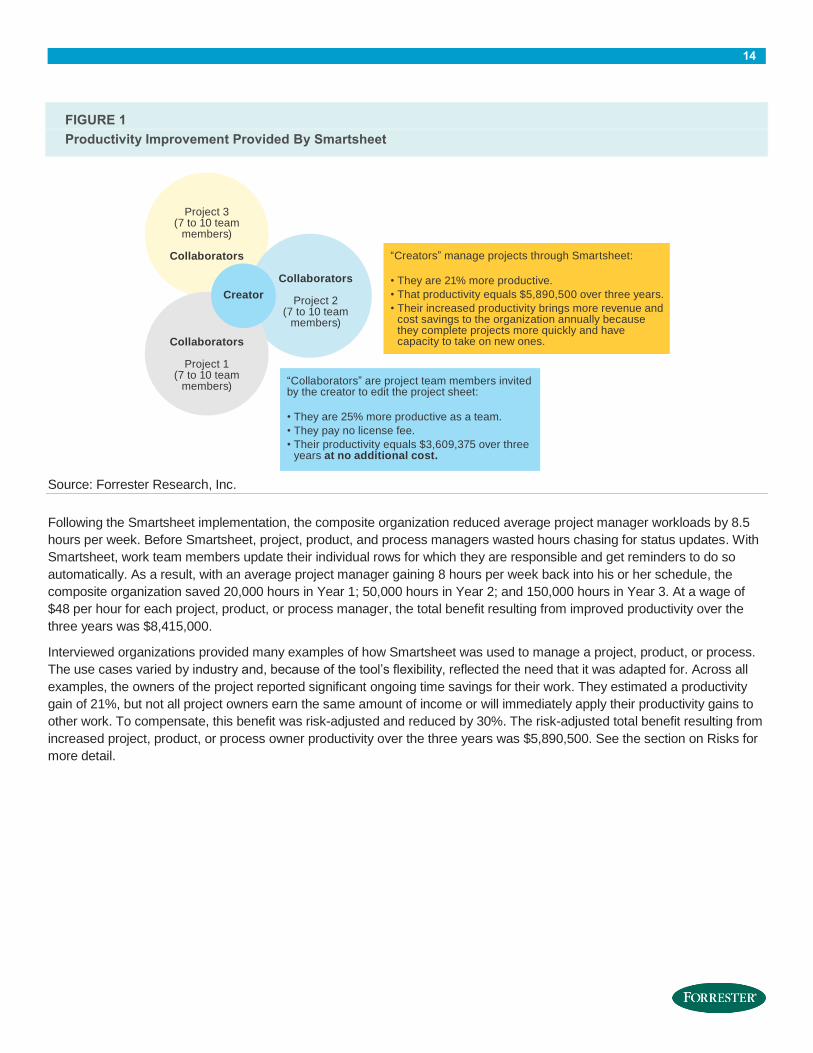
Productivity Improvement Provided By Smartsheet
Source: Forrester Research, Inc.
Following the Smartsheet implementation, the composite organization reduced average project manager workloads by 8.5
hours per week. Before Smartsheet, project, product, and process managers wasted hours chasing for status updates. With
Smartsheet, work team members update their individual rows for which they are responsible and get reminders to do so
automatically. As a result, with an average project manager gaining 8 hours per week back into his or her schedule, the
composite organization saved 20,000 hours in Year 1; 50,000 hours in Year 2; and 150,000 hours in Year 3. At a wage of
$48 per hour for each project, product, or process manager, the total benefit resulting from improved productivity over the
three years was $8,415,000.
Interviewed organizations provided many examples of how Smartsheet was used to manage a project, product, or process.
The use cases varied by industry and, because of the tool’s flexibility, reflected the need that it was adapted for. Across all
examples, the owners of the project reported significant ongoing time savings for their work. They estimated a productivity
gain of 21%, but not all project owners earn the same amount of income or will immediately apply their productivity gains to
other work. To compensate, this benefit was risk-adjusted and reduced by 30%. The risk-adjusted total benefit resulting from
increased project, product, or process owner productivity over the three years was $5,890,500. See the section on Risks for
more detail.
“Collaborators” are project team members invitedby the creator to edit the project sheet:
• They are 25% more productive as a team.
• They pay no license fee.
• Their productivity equals $3,609,375 over threeyears at no additional cost.
“Creators” manage projects through Smartsheet:
• They are 21% more productive.
• That productivity equals $5,890,500 over three years.
• Their increased productivity brings more revenue andcost savings to the organization annually becausethey complete projects more quickly and havecapacity to take on new ones.
Project 3(7 to 10 team
members)
Collaborators
Collaborators
Project 2(7 to 10 team
members)
Collaborators
Project 1(7 to 10 team
members)
Creator
15
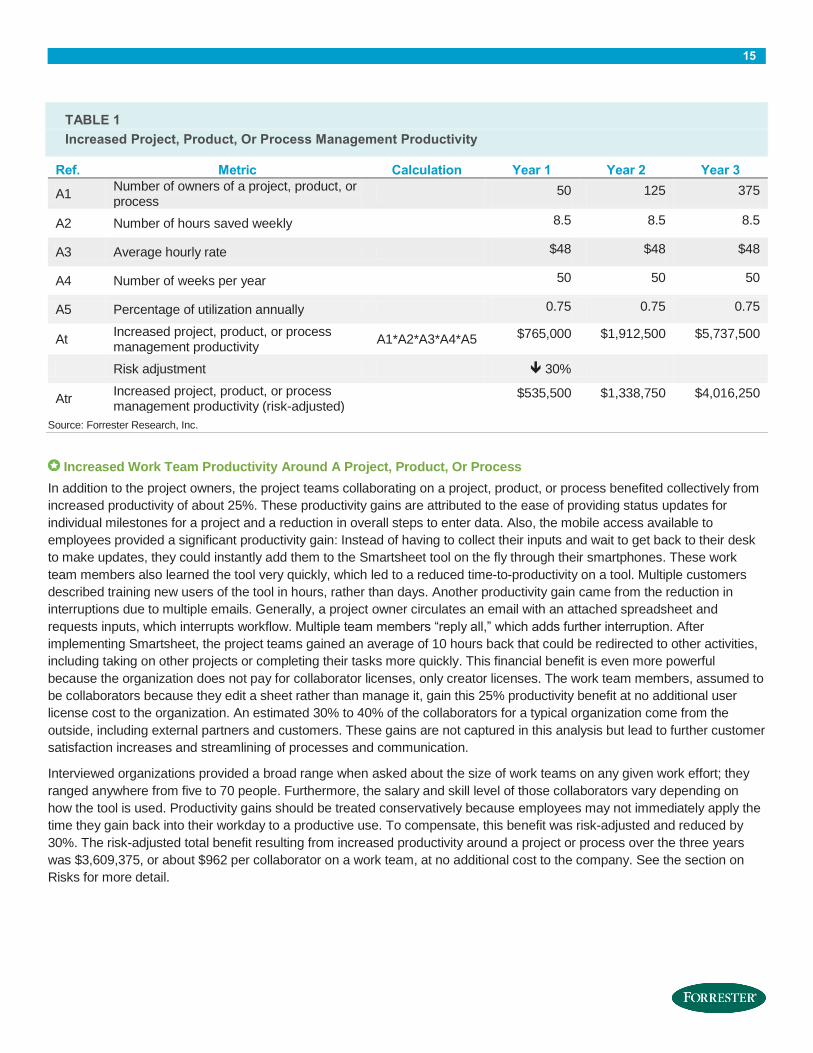
TABLE 1
Increased Project, Product, Or Process Management Productivity
Ref. Metric Calculation Year 1 Year 2 Year 3
A1 Number of owners of a project, product, or process
50 125 375
A2 Number of hours saved weekly 8.5 8.5 8.5
A3 Average hourly rate $48 $48 $48
A4 Number of weeks per year 50 50 50
A5 Percentage of utilization annually 0.75 0.75 0.75
At Increased project, product, or process management productivity
A1*A2*A3*A4*A5 $765,000 $1,912,500 $5,737,500
Risk adjustment 30%
Atr Increased project, product, or process management productivity (risk-adjusted)
$535,500 $1,338,750 $4,016,250
Source: Forrester Research, Inc.
Increased Work Team Productivity Around A Project, Product, Or Process
In addition to the project owners, the project teams collaborating on a project, product, or process benefited collectively from
increased productivity of about 25%. These productivity gains are attributed to the ease of providing status updates for
individual milestones for a project and a reduction in overall steps to enter data. Also, the mobile access available to
employees provided a significant productivity gain: Instead of having to collect their inputs and wait to get back to their desk
to make updates, they could instantly add them to the Smartsheet tool on the fly through their smartphones. These work
team members also learned the tool very quickly, which led to a reduced time-to-productivity on a tool. Multiple customers
described training new users of the tool in hours, rather than days. Another productivity gain came from the reduction in
interruptions due to multiple emails. Generally, a project owner circulates an email with an attached spreadsheet and
requests inputs, which interrupts workflow. Multiple team members “reply all,” which adds further interruption. After
implementing Smartsheet, the project teams gained an average of 10 hours back that could be redirected to other activities,
including taking on other projects or completing their tasks more quickly. This financial benefit is even more powerful
because the organization does not pay for collaborator licenses, only creator licenses. The work team members, assumed to
be collaborators because they edit a sheet rather than manage it, gain this 25% productivity benefit at no additional user
license cost to the organization. An estimated 30% to 40% of the collaborators for a typical organization come from the
outside, including external partners and customers. These gains are not captured in this analysis but lead to further customer
satisfaction increases and streamlining of processes and communication.
Interviewed organizations provided a broad range when asked about the size of work teams on any given work effort; they
ranged anywhere from five to 70 people. Furthermore, the salary and skill level of those collaborators vary depending on
how the tool is used. Productivity gains should be treated conservatively because employees may not immediately apply the
time they gain back into their workday to a productive use. To compensate, this benefit was risk-adjusted and reduced by
30%. The risk-adjusted total benefit resulting from increased productivity around a project or process over the three years
was $3,609,375, or about $962 per collaborator on a work team, at no additional cost to the company. See the section on
Risks for more detail.
16
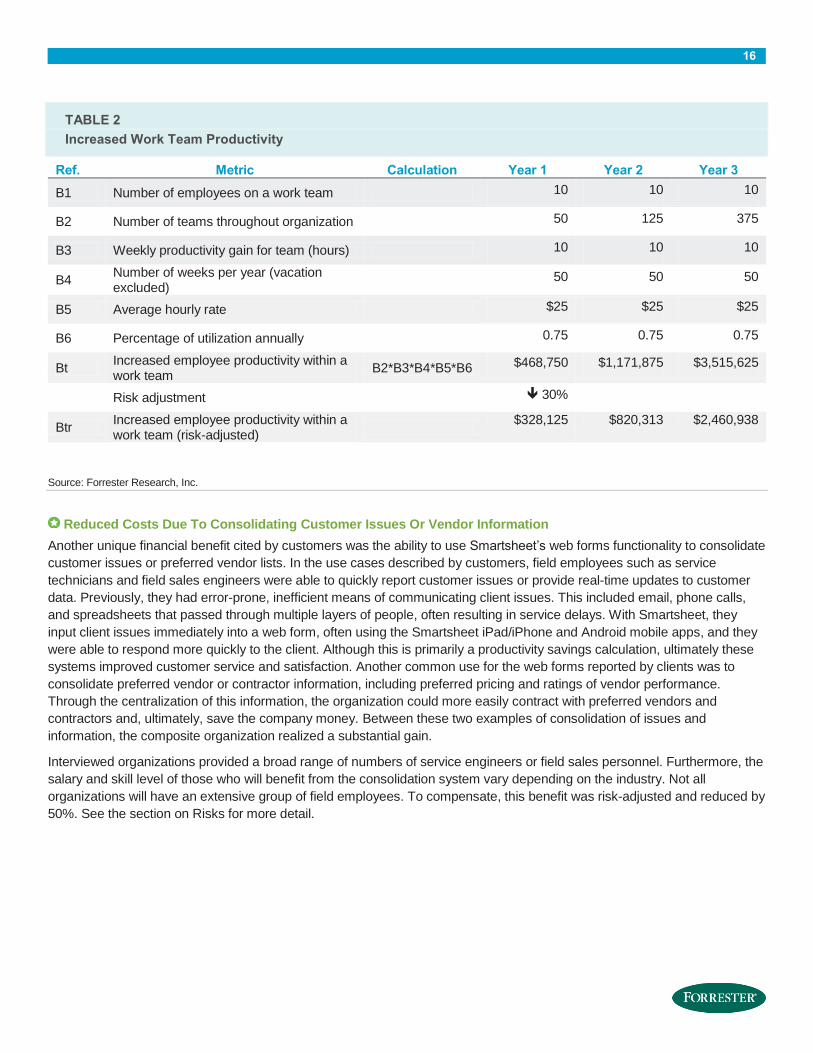
TABLE 2
Increased Work Team Productivity
Ref. Metric Calculation Year 1 Year 2 Year 3
B1 Number of employees on a work team 10 10 10
B2 Number of teams throughout organization 50 125 375
B3 Weekly productivity gain for team (hours) 10 10 10
B4 Number of weeks per year (vacation excluded)
50 50 50
B5 Average hourly rate $25 $25 $25
B6 Percentage of utilization annually 0.75 0.75 0.75
Bt Increased employee productivity within a work team
B2*B3*B4*B5*B6 $468,750 $1,171,875 $3,515,625
Risk adjustment 30%
Btr Increased employee productivity within a work team (risk-adjusted)
$328,125 $820,313 $2,460,938
Source: Forrester Research, Inc.
Reduced Costs Due To Consolidating Customer Issues Or Vendor Information
Another unique financial benefit cited by customers was the ability to use Smartsheet’s web forms functionality to consolidate
customer issues or preferred vendor lists. In the use cases described by customers, field employees such as service
technicians and field sales engineers were able to quickly report customer issues or provide real-time updates to customer
data. Previously, they had error-prone, inefficient means of communicating client issues. This included email, phone calls,
and spreadsheets that passed through multiple layers of people, often resulting in service delays. With Smartsheet, they
input client issues immediately into a web form, often using the Smartsheet iPad/iPhone and Android mobile apps, and they
were able to respond more quickly to the client. Although this is primarily a productivity savings calculation, ultimately these
systems improved customer service and satisfaction. Another common use for the web forms reported by clients was to
consolidate preferred vendor or contractor information, including preferred pricing and ratings of vendor performance.
Through the centralization of this information, the organization could more easily contract with preferred vendors and
contractors and, ultimately, save the company money. Between these two examples of consolidation of issues and
information, the composite organization realized a substantial gain.
Interviewed organizations provided a broad range of numbers of service engineers or field sales personnel. Furthermore, the
salary and skill level of those who will benefit from the consolidation system vary depending on the industry. Not all
organizations will have an extensive group of field employees. To compensate, this benefit was risk-adjusted and reduced by
50%. See the section on Risks for more detail.
17
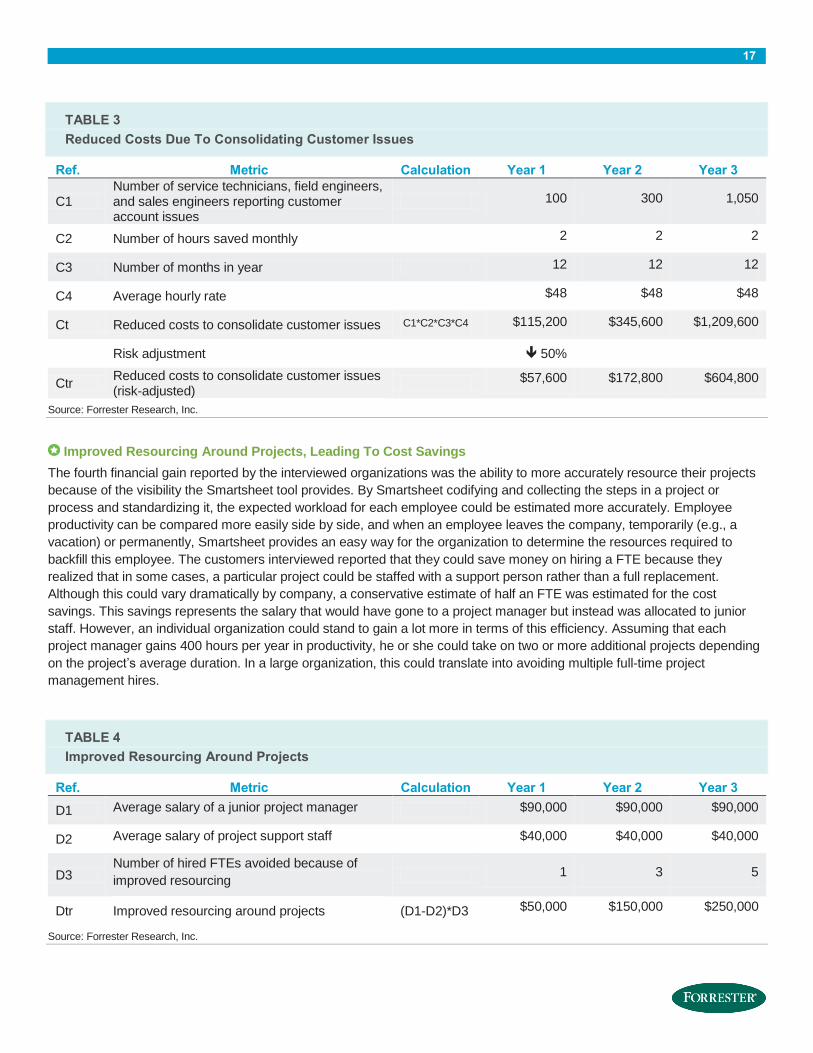
TABLE 3
Reduced Costs Due To Consolidating Customer Issues
Ref. Metric Calculation Year 1 Year 2 Year 3
C1 Number of service technicians, field engineers, and sales engineers reporting customer account issues
100 300 1,050
C2 Number of hours saved monthly 2 2 2
C3 Number of months in year 12 12 12
C4 Average hourly rate $48 $48 $48
Ct Reduced costs to consolidate customer issues C1*C2*C3*C4 $115,200 $345,600 $1,209,600
Risk adjustment 50%
Ctr Reduced costs to consolidate customer issues (risk-adjusted)
$57,600 $172,800 $604,800
Source: Forrester Research, Inc.
Improved Resourcing Around Projects, Leading To Cost Savings
The fourth financial gain reported by the interviewed organizations was the ability to more accurately resource their projects
because of the visibility the Smartsheet tool provides. By Smartsheet codifying and collecting the steps in a project or
process and standardizing it, the expected workload for each employee could be estimated more accurately. Employee
productivity can be compared more easily side by side, and when an employee leaves the company, temporarily (e.g., a
vacation) or permanently, Smartsheet provides an easy way for the organization to determine the resources required to
backfill this employee. The customers interviewed reported that they could save money on hiring a FTE because they
realized that in some cases, a particular project could be staffed with a support person rather than a full replacement.
Although this could vary dramatically by company, a conservative estimate of half an FTE was estimated for the cost
savings. This savings represents the salary that would have gone to a project manager but instead was allocated to junior
staff. However, an individual organization could stand to gain a lot more in terms of this efficiency. Assuming that each
project manager gains 400 hours per year in productivity, he or she could take on two or more additional projects depending
on the project’s average duration. In a large organization, this could translate into avoiding multiple full-time project
management hires.
TABLE 4
Improved Resourcing Around Projects
Ref. Metric Calculation Year 1 Year 2 Year 3
D1 Average salary of a junior project manager $90,000 $90,000 $90,000
D2 Average salary of project support staff $40,000 $40,000 $40,000
D3 Number of hired FTEs avoided because of
improved resourcing 1 3 5
Dtr Improved resourcing around projects (D1-D2)*D3 $50,000 $150,000 $250,000
Source: Forrester Research, Inc.
18
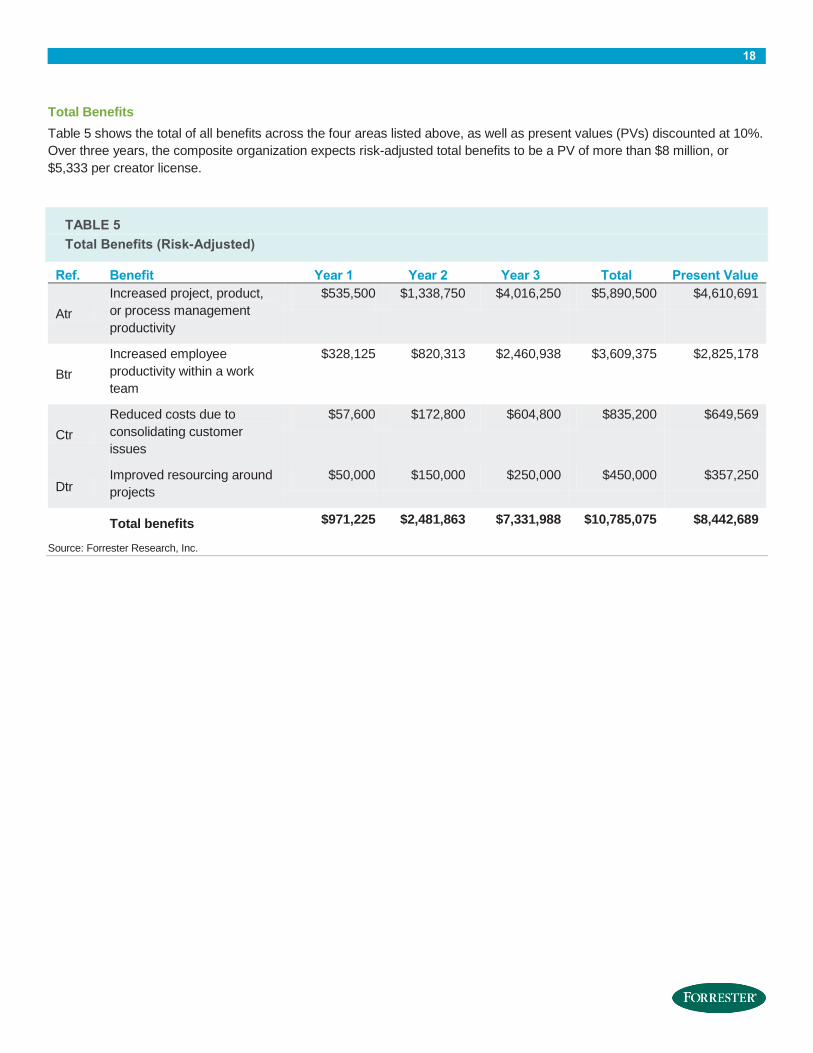
Total Benefits
Table 5 shows the total of all benefits across the four areas listed above, as well as present values (PVs) discounted at 10%.
Over three years, the composite organization expects risk-adjusted total benefits to be a PV of more than $8 million, or
$5,333 per creator license.
TABLE 5
Total Benefits (Risk-Adjusted)
Ref. Benefit Year 1 Year 2 Year 3 Total Present Value
Atr
Increased project, product,
or process management
productivity
$535,500 $1,338,750 $4,016,250 $5,890,500 $4,610,691
Btr
Increased employee
productivity within a work
team
$328,125 $820,313 $2,460,938 $3,609,375 $2,825,178
Ctr
Reduced costs due to
consolidating customer
issues
$57,600 $172,800 $604,800 $835,200 $649,569
Dtr Improved resourcing around
projects
$50,000 $150,000 $250,000 $450,000 $357,250
Total benefits $971,225 $2,481,863 $7,331,988 $10,785,075 $8,442,689
Source: Forrester Research, Inc.
19
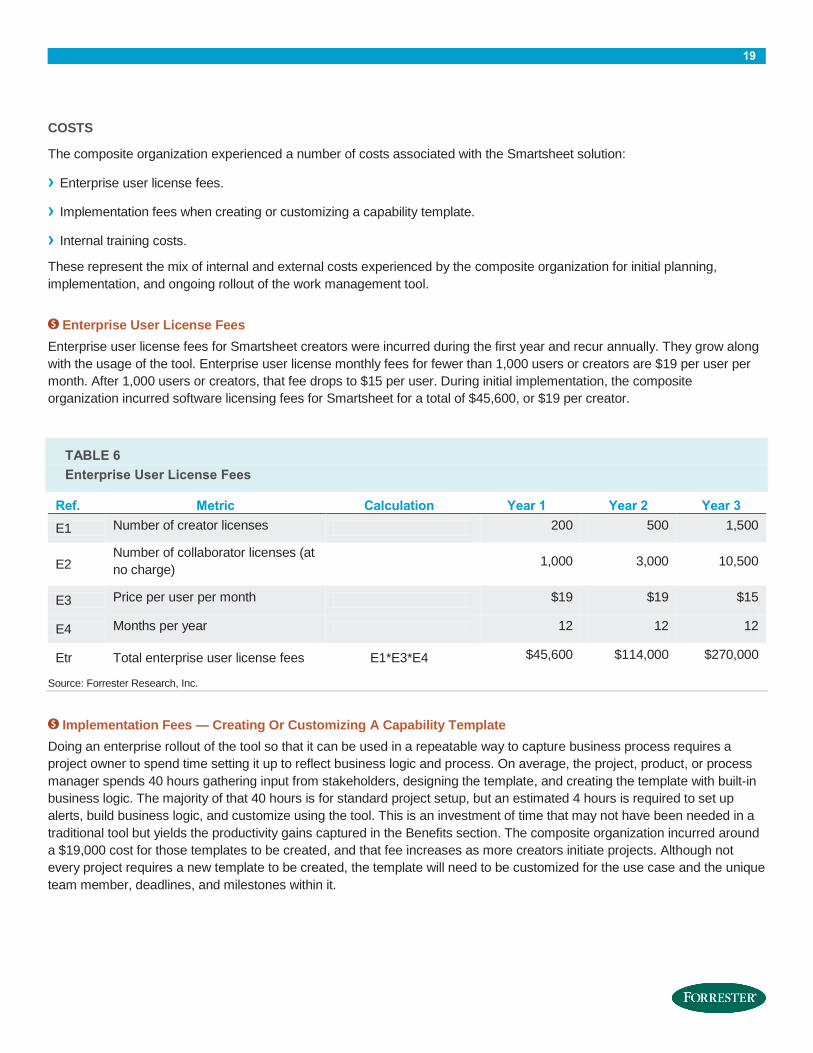
COSTS
The composite organization experienced a number of costs associated with the Smartsheet solution:
› Enterprise user license fees.
› Implementation fees when creating or customizing a capability template.
› Internal training costs.
These represent the mix of internal and external costs experienced by the composite organization for initial planning,
implementation, and ongoing rollout of the work management tool.
Enterprise User License Fees
Enterprise user license fees for Smartsheet creators were incurred during the first year and recur annually. They grow along
with the usage of the tool. Enterprise user license monthly fees for fewer than 1,000 users or creators are $19 per user per
month. After 1,000 users or creators, that fee drops to $15 per user. During initial implementation, the composite
organization incurred software licensing fees for Smartsheet for a total of $45,600, or $19 per creator.
TABLE 6
Enterprise User License Fees
Ref. Metric Calculation Year 1 Year 2 Year 3
E1 Number of creator licenses 200 500 1,500
E2 Number of collaborator licenses (at
no charge) 1,000 3,000 10,500
E3 Price per user per month $19 $19 $15
E4 Months per year 12 12 12
Etr Total enterprise user license fees E1*E3*E4 $45,600 $114,000 $270,000
Source: Forrester Research, Inc.
Implementation Fees — Creating Or Customizing A Capability Template
Doing an enterprise rollout of the tool so that it can be used in a repeatable way to capture business process requires a
project owner to spend time setting it up to reflect business logic and process. On average, the project, product, or process
manager spends 40 hours gathering input from stakeholders, designing the template, and creating the template with built-in
business logic. The majority of that 40 hours is for standard project setup, but an estimated 4 hours is required to set up
alerts, build business logic, and customize using the tool. This is an investment of time that may not have been needed in a
traditional tool but yields the productivity gains captured in the Benefits section. The composite organization incurred around
a $19,000 cost for those templates to be created, and that fee increases as more creators initiate projects. Although not
every project requires a new template to be created, the template will need to be customized for the use case and the unique
team member, deadlines, and milestones within it.
20
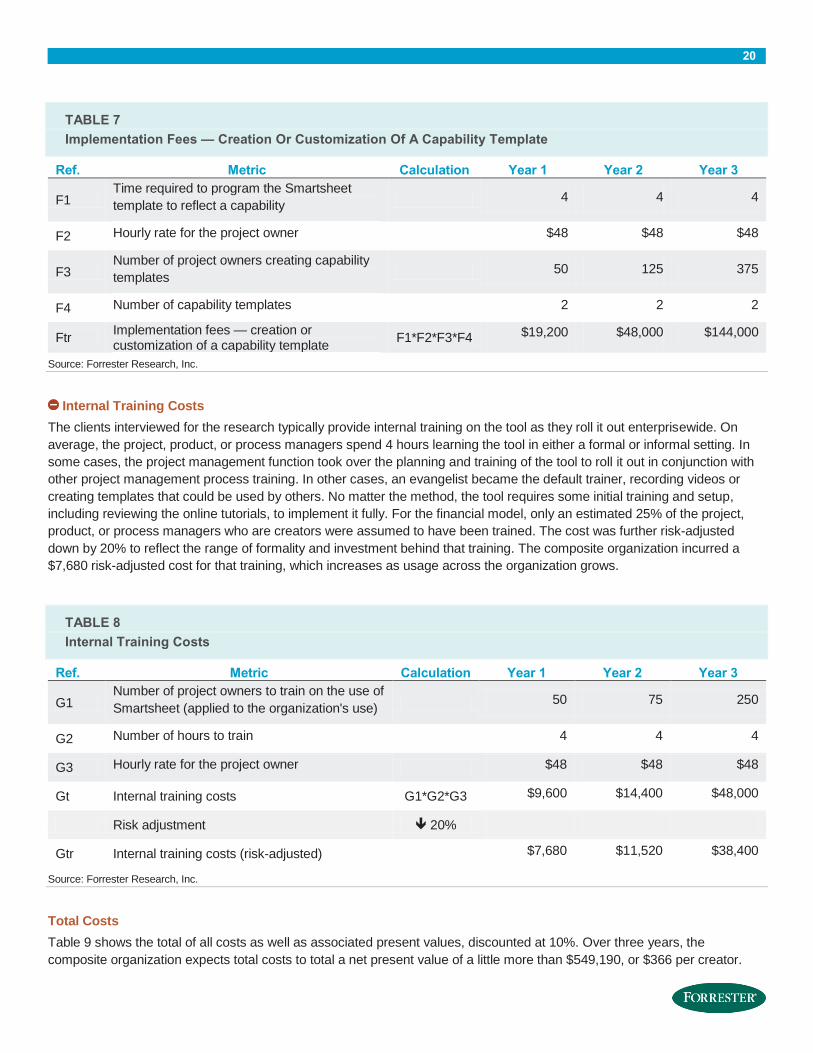
TABLE 7
Implementation Fees — Creation Or Customization Of A Capability Template
Ref. Metric Calculation Year 1 Year 2 Year 3
F1 Time required to program the Smartsheet
template to reflect a capability 4 4 4
F2 Hourly rate for the project owner $48 $48 $48
F3 Number of project owners creating capability
templates 50 125 375
F4 Number of capability templates 2 2 2
Ftr Implementation fees — creation or customization of a capability template
F1*F2*F3*F4 $19,200 $48,000 $144,000
Source: Forrester Research, Inc.
Internal Training Costs
The clients interviewed for the research typically provide internal training on the tool as they roll it out enterprisewide. On
average, the project, product, or process managers spend 4 hours learning the tool in either a formal or informal setting. In
some cases, the project management function took over the planning and training of the tool to roll it out in conjunction with
other project management process training. In other cases, an evangelist became the default trainer, recording videos or
creating templates that could be used by others. No matter the method, the tool requires some initial training and setup,
including reviewing the online tutorials, to implement it fully. For the financial model, only an estimated 25% of the project,
product, or process managers who are creators were assumed to have been trained. The cost was further risk-adjusted
down by 20% to reflect the range of formality and investment behind that training. The composite organization incurred a
$7,680 risk-adjusted cost for that training, which increases as usage across the organization grows.
TABLE 8
Internal Training Costs
Ref. Metric Calculation Year 1 Year 2 Year 3
G1 Number of project owners to train on the use of
Smartsheet (applied to the organization's use) 50 75 250
G2 Number of hours to train 4 4 4
G3 Hourly rate for the project owner $48 $48 $48
Gt Internal training costs G1*G2*G3 $9,600 $14,400 $48,000
Risk adjustment 20%
Gtr Internal training costs (risk-adjusted) $7,680 $11,520 $38,400
Source: Forrester Research, Inc.
Total Costs
Table 9 shows the total of all costs as well as associated present values, discounted at 10%. Over three years, the
composite organization expects total costs to total a net present value of a little more than $549,190, or $366 per creator.
21
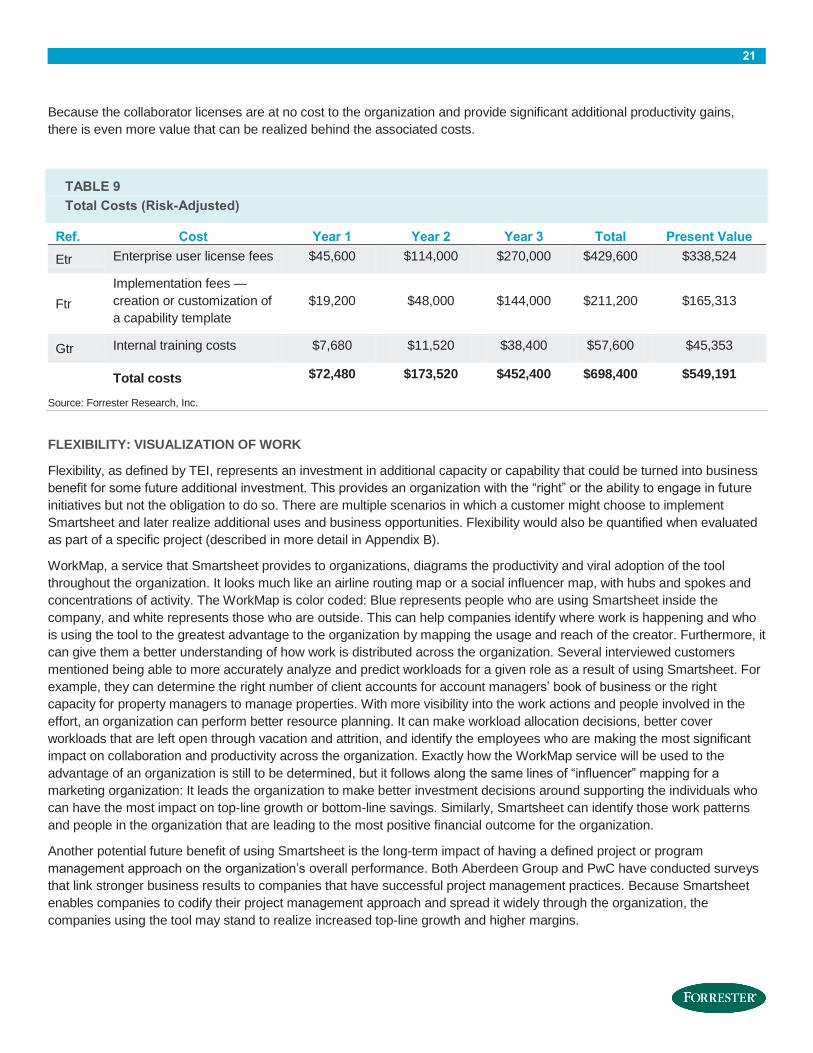
Because the collaborator licenses are at no cost to the organization and provide significant additional productivity gains,
there is even more value that can be realized behind the associated costs.
TABLE 9
Total Costs (Risk-Adjusted)
Ref. Cost Year 1 Year 2 Year 3 Total Present Value
Etr Enterprise user license fees $45,600 $114,000 $270,000 $429,600 $338,524
Ftr
Implementation fees —
creation or customization of
a capability template
$19,200 $48,000 $144,000 $211,200 $165,313
Gtr Internal training costs $7,680 $11,520 $38,400 $57,600 $45,353
Total costs $72,480 $173,520 $452,400 $698,400 $549,191
Source: Forrester Research, Inc.
FLEXIBILITY: VISUALIZATION OF WORK
Flexibility, as defined by TEI, represents an investment in additional capacity or capability that could be turned into business
benefit for some future additional investment. This provides an organization with the “right” or the ability to engage in future
initiatives but not the obligation to do so. There are multiple scenarios in which a customer might choose to implement
Smartsheet and later realize additional uses and business opportunities. Flexibility would also be quantified when evaluated
as part of a specific project (described in more detail in Appendix B).
WorkMap, a service that Smartsheet provides to organizations, diagrams the productivity and viral adoption of the tool
throughout the organization. It looks much like an airline routing map or a social influencer map, with hubs and spokes and
concentrations of activity. The WorkMap is color coded: Blue represents people who are using Smartsheet inside the
company, and white represents those who are outside. This can help companies identify where work is happening and who
is using the tool to the greatest advantage to the organization by mapping the usage and reach of the creator. Furthermore, it
can give them a better understanding of how work is distributed across the organization. Several interviewed customers
mentioned being able to more accurately analyze and predict workloads for a given role as a result of using Smartsheet. For
example, they can determine the right number of client accounts for account managers’ book of business or the right
capacity for property managers to manage properties. With more visibility into the work actions and people involved in the
effort, an organization can perform better resource planning. It can make workload allocation decisions, better cover
workloads that are left open through vacation and attrition, and identify the employees who are making the most significant
impact on collaboration and productivity across the organization. Exactly how the WorkMap service will be used to the
advantage of an organization is still to be determined, but it follows along the same lines of “influencer” mapping for a
marketing organization: It leads the organization to make better investment decisions around supporting the individuals who
can have the most impact on top-line growth or bottom-line savings. Similarly, Smartsheet can identify those work patterns
and people in the organization that are leading to the most positive financial outcome for the organization.
Another potential future benefit of using Smartsheet is the long-term impact of having a defined project or program
management approach on the organization’s overall performance. Both Aberdeen Group and PwC have conducted surveys
that link stronger business results to companies that have successful project management practices. Because Smartsheet
enables companies to codify their project management approach and spread it widely through the organization, the
companies using the tool may stand to realize increased top-line growth and higher margins.
22
RISKS
Forrester defines two types of risk associated with this analysis: “implementation risk” and “impact risk.” Implementation risk
is the risk that a proposed investment in Smartsheet may deviate from the original or expected requirements, resulting in
higher costs than anticipated. Impact risk refers to the risk that the business or technology needs of the organization may not
be met by the investment in Smartsheet, resulting in lower overall total benefits. The greater the uncertainty, the wider the
potential range of outcomes for cost and benefit estimates.
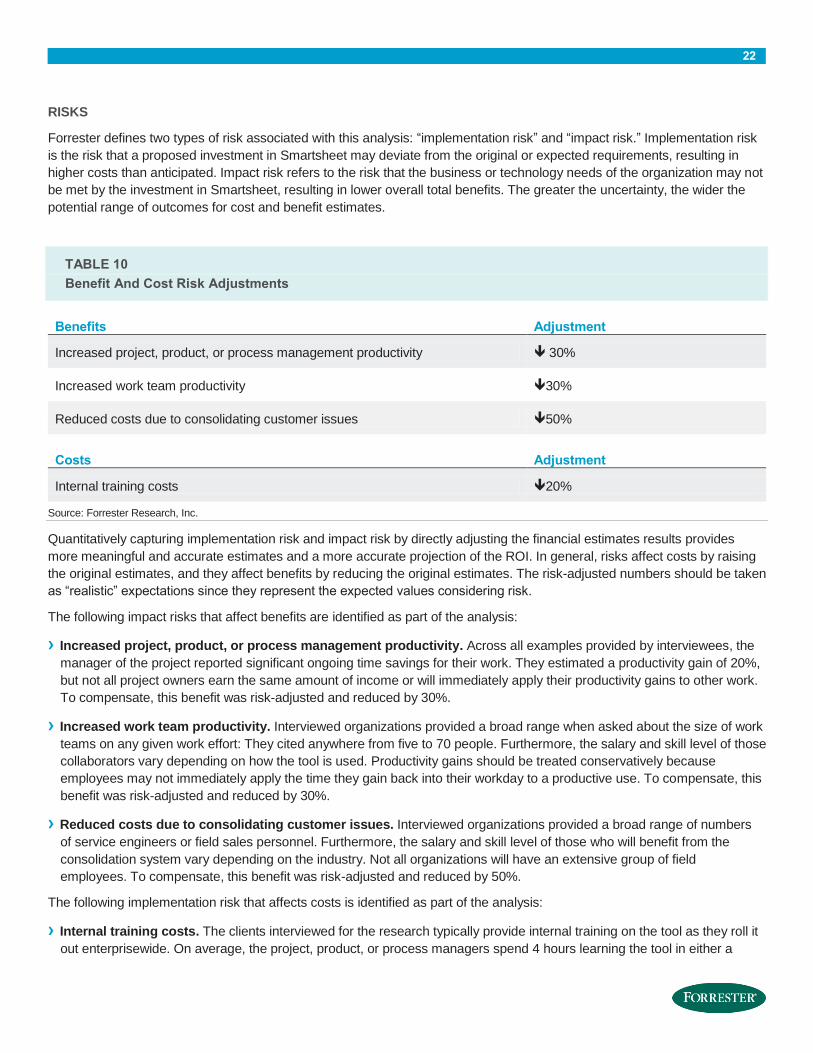
TABLE 10
Benefit And Cost Risk Adjustments
Benefits Adjustment
Increased project, product, or process management productivity 30%
Increased work team productivity 30%
Reduced costs due to consolidating customer issues 50%
Costs Adjustment
Internal training costs 20%
Source: Forrester Research, Inc.
Quantitatively capturing implementation risk and impact risk by directly adjusting the financial estimates results provides
more meaningful and accurate estimates and a more accurate projection of the ROI. In general, risks affect costs by raising
the original estimates, and they affect benefits by reducing the original estimates. The risk-adjusted numbers should be taken
as “realistic” expectations since they represent the expected values considering risk.
The following impact risks that affect benefits are identified as part of the analysis:
› Increased project, product, or process management productivity. Across all examples provided by interviewees, the
manager of the project reported significant ongoing time savings for their work. They estimated a productivity gain of 20%,
but not all project owners earn the same amount of income or will immediately apply their productivity gains to other work.
To compensate, this benefit was risk-adjusted and reduced by 30%.
› Increased work team productivity. Interviewed organizations provided a broad range when asked about the size of work
teams on any given work effort: They cited anywhere from five to 70 people. Furthermore, the salary and skill level of those
collaborators vary depending on how the tool is used. Productivity gains should be treated conservatively because
employees may not immediately apply the time they gain back into their workday to a productive use. To compensate, this
benefit was risk-adjusted and reduced by 30%.
› Reduced costs due to consolidating customer issues. Interviewed organizations provided a broad range of numbers
of service engineers or field sales personnel. Furthermore, the salary and skill level of those who will benefit from the
consolidation system vary depending on the industry. Not all organizations will have an extensive group of field
employees. To compensate, this benefit was risk-adjusted and reduced by 50%.
The following implementation risk that affects costs is identified as part of the analysis:
› Internal training costs. The clients interviewed for the research typically provide internal training on the tool as they roll it
out enterprisewide. On average, the project, product, or process managers spend 4 hours learning the tool in either a

23
formal or informal setting. In some cases, the project management function took over the planning and training of the tool
to roll it out in conjunction with other project management process training. In other cases, an evangelist became the
default trainer, recording videos or creating templates that could be used by others. The cost was risk-adjusted down by
20% to reflect the range of formality and investment behind that training.
Table 10 shows the values used to adjust for risk and uncertainty in the cost and benefit estimates for the composite
organization. Readers are urged to apply their own risk ranges based on their own degree of confidence in the cost and
benefit estimates.
24
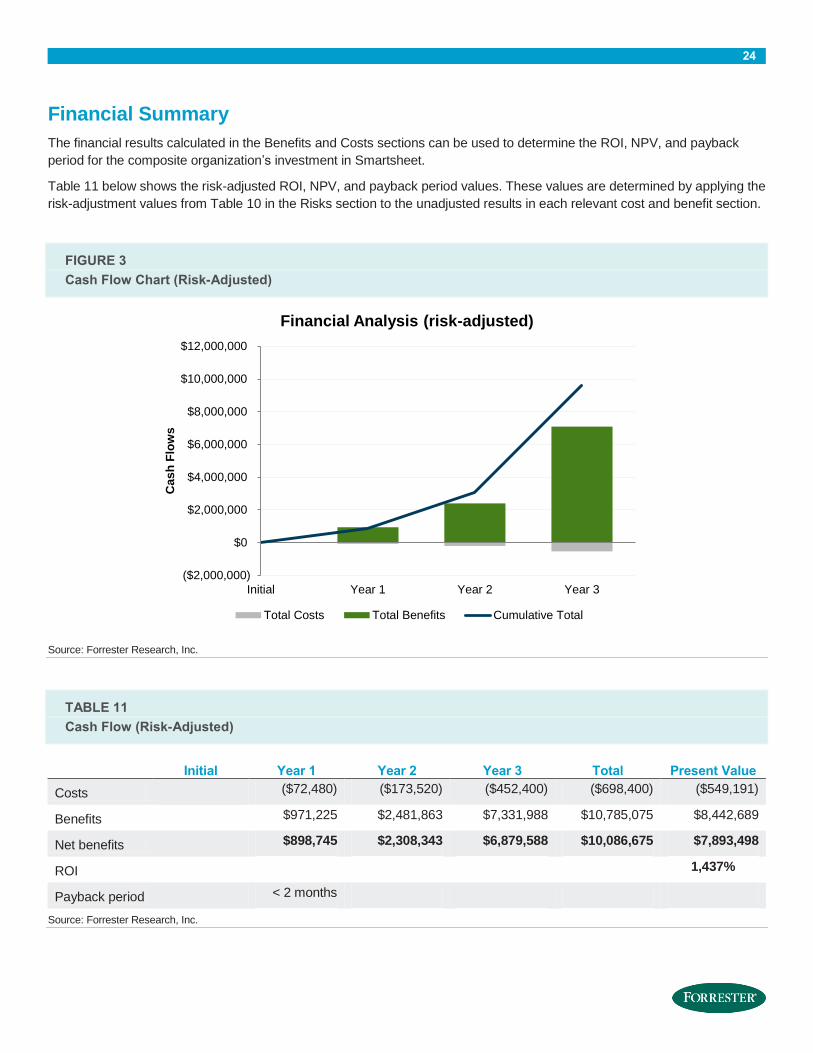
Financial Summary
The financial results calculated in the Benefits and Costs sections can be used to determine the ROI, NPV, and payback
period for the composite organization’s investment in Smartsheet.
Table 11 below shows the risk-adjusted ROI, NPV, and payback period values. These values are determined by applying the
risk-adjustment values from Table 10 in the Risks section to the unadjusted results in each relevant cost and benefit section.
FIGURE 3
Cash Flow Chart (Risk-Adjusted)
Source: Forrester Research, Inc.
TABLE 11
Cash Flow (Risk-Adjusted)
Initial Year 1 Year 2 Year 3 Total Present Value
Costs
($72,480) ($173,520) ($452,400) ($698,400) ($549,191)
Benefits
$971,225 $2,481,863 $7,331,988 $10,785,075 $8,442,689
Net benefits
$898,745 $2,308,343 $6,879,588 $10,086,675 $7,893,498
ROI
1,437%
Payback period
< 2 months
Source: Forrester Research, Inc.
($2,000,000)
$0
$2,000,000
$4,000,000
$6,000,000
$8,000,000
$10,000,000
$12,000,000
Initial Year 1 Year 2 Year 3
Cas
h F
low
s
Financial Analysis (risk-adjusted)
Total Costs Total Benefits Cumulative Total
25
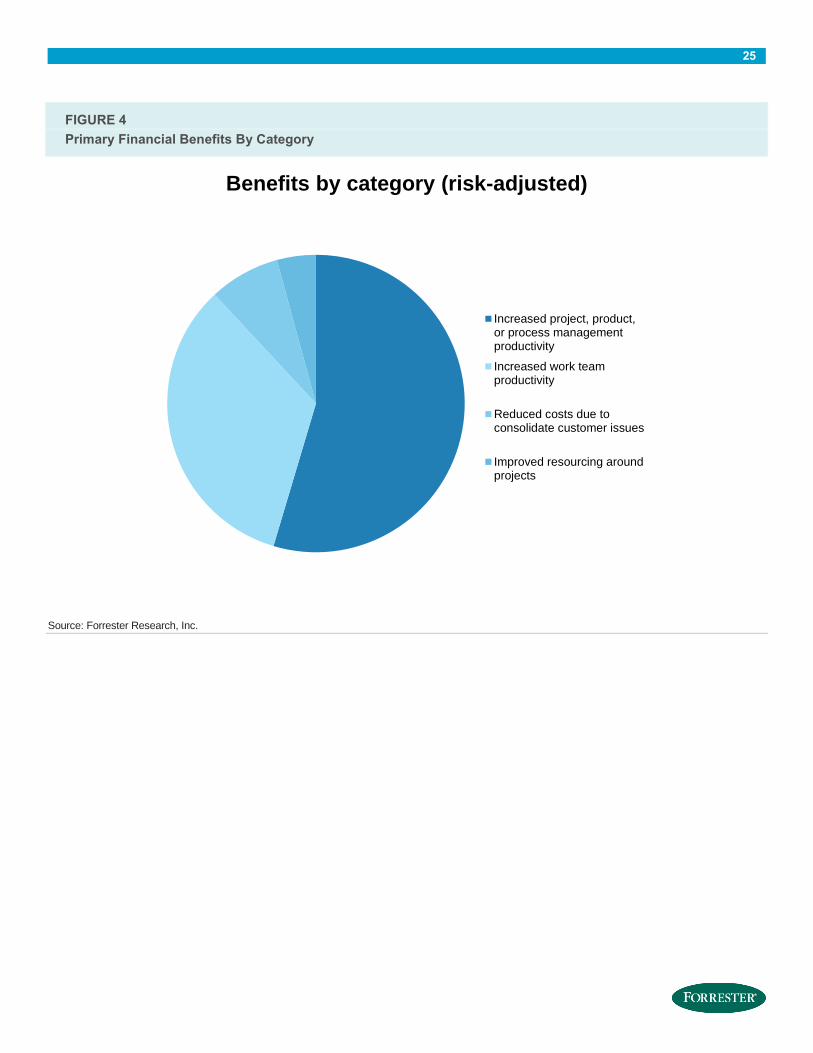
FIGURE 4
Primary Financial Benefits By Category
Source: Forrester Research, Inc.
Benefits by category (risk-adjusted)
Increased project, product,or process managementproductivity
Increased work teamproductivity
Reduced costs due toconsolidate customer issues
Improved resourcing aroundprojects
26
Smartsheet: Overview
The following information is provided by Smartsheet. Forrester has not validated any claims and does not endorse
Smartsheet or its offerings.
Smartsheet, a leading SaaS company, offers an enterprise-ready cloud app for work management and collaboration. More than 55,000 businesses and millions of users in over 170 countries rely on the award-winning tool. The Smartsheet work productivity tool is a web-based tool that combines the familiar interface of a spreadsheet and useful project management tools such as Gantt charts, calendaring, web forms, file sharing, and alerts and reminders. The flexible tool is used for a variety of use cases across all departments of the organization to manage projects, products, and processes, including marketing campaigns, product launches, business operations, manufacturing processes, strategic planning, and HR initiatives. Through built-in collaboration capabilities, teams and their external customers and partners share sheets associated with projects and processes along with the notes, discussions, files, and other information in a centralized, always-available location. They collaborate and communicate in real time and access the sheets from any browser, device, or operating system. Adoption across organizations grows quickly as users share sheets to collaborate with others. Additionally, Smartsheet meets companies’ staunch requirements for enterprise-level security, mobile capabilities, administrative controls, and integration with cloud tools and core systems. With the combination of “consumer-easy” and “enterprise-ready” capabilities, the number of people using Smartsheet in enterprise accounts quadruples on average in the first year. Smartsheet is deployed in a broad range of customer environments, including many of the world’s industry-leading organizations such as Google, Netflix, Cisco, Bayer, GSA, Groupon, Pearson, HomeAway, McGraw-Hill Education, DHL, ESPN, Sony Music, and MetLife. Customers include construction companies, consulting firms, schools and universities, utility firms, government entities, healthcare organizations, high-tech firms, nonprofits, and manufacturing and law firms, among others. Additionally, Smartsheet offers mobile apps, prebuilt templates, and integrations with leading cloud apps such as Box, Dropbox, Evernote, Salesforce, and Google Drive to ensure users are up and running quickly. The company’s headquarters are located in Bellevue, Wash. Investors include Sutter Hill Ventures, Insight Venture Partners, and Madrona Venture Group.
27
Appendix A: Composite Organization Description
For this TEI study, Forrester has created a composite organization to illustrate the quantifiable benefits and costs of
implementing Smartsheet. The composite company is intended to represent an enterprise-sized organization with 10,000
employees and is based on characteristics of the interviewed customers.
The composite company has10,000 employees globally and is headquartered in the United States.
In purchasing Smartsheet, the composite company has the following objectives:
› Provide a work productivity tool that is popular among its users and easy to learn but meets enterprise requirements
around single-sign on and security protocols.
› Bring more discipline and a better tool set to support the execution of myriad project, product, and process management
initiatives in the organization.
› Reduce the frequent ongoing exchange of spreadsheets through email, which was a highly fragmented means of
communicating and collaborating around projects, products, and processes.
› Roll out a tool that would be adopted quickly and require little training and IT investment or ongoing management.
For the purpose of the analysis, Forrester assumes that the organization has hundreds of employees and work teams
collaborating to complete work throughout the organization. The assumption is that if the time-consuming and ineffective
means of collecting status updates and communicating around project expectations is eliminated, work products can be
created more quickly and with higher quality. Furthermore, having a work team aligned around one tool in support of the
delivery of client projects can lead to a better customer experience.
FRAMEWORK ASSUMPTIONS
Table 12 provides the model assumptions that Forrester used in this analysis.
The discount rate used in the PV and NPV calculations is 10%, and the time horizon used for the financial modeling is three
years. Organizations typically use discount rates between 8% and 16% based on their current environment. Readers are
urged to consult with their respective company’s finance department to determine the most appropriate discount rate to use
within their own organizations.
28
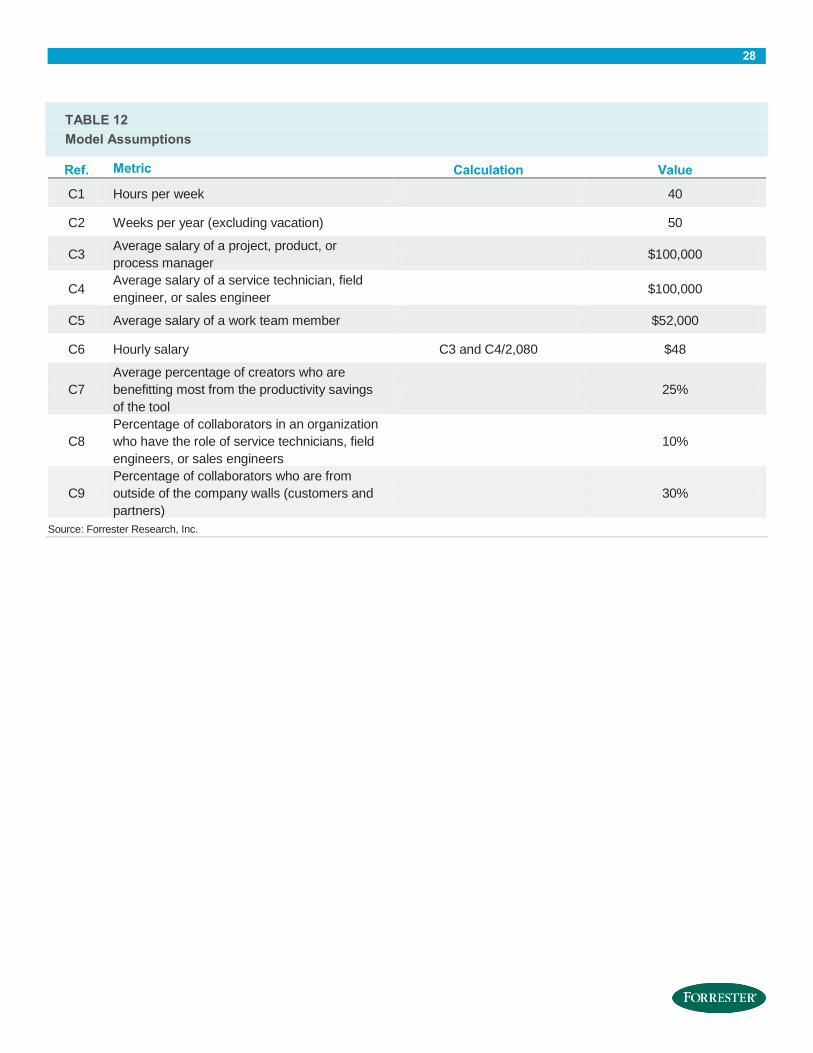
TABLE 12
Model Assumptions
Ref. Metric Calculation Value
C1 Hours per week 40
C2 Weeks per year (excluding vacation) 50
C3 Average salary of a project, product, or
process manager $100,000
C4 Average salary of a service technician, field
engineer, or sales engineer $100,000
C5 Average salary of a work team member $52,000
C6 Hourly salary C3 and C4/2,080 $48
C7
Average percentage of creators who are
benefitting most from the productivity savings
of the tool
25%
C8
Percentage of collaborators in an organization
who have the role of service technicians, field
engineers, or sales engineers
10%
C9
Percentage of collaborators who are from
outside of the company walls (customers and
partners)
30%
Source: Forrester Research, Inc.
29
Appendix B: Total Economic Impact™ Overview
Total Economic Impact is a methodology developed by Forrester Research that enhances a company’s technology decision-
making processes and assists vendors in communicating the value proposition of their products and services to clients. The
TEI methodology helps companies demonstrate, justify, and realize the tangible value of IT initiatives to both senior
management and other key business stakeholders.
The TEI methodology consists of four components to evaluate investment value: benefits, costs, flexibility, and risks.
BENEFITS
Benefits represent the value delivered to the user organization — IT and/or business units — by the proposed product or
project. Often, product or project justification exercises focus just on IT cost and cost reduction, leaving little room to analyze
the effect of the technology on the entire organization. The TEI methodology and the resulting financial model place equal
weight on the measure of benefits and the measure of costs, allowing for a full examination of the effect of the technology on
the entire organization. Calculation of benefit estimates involves a clear dialogue with the user organization to understand
the specific value that is created. In addition, Forrester also requires that there be a clear line of accountability established
between the measurement and justification of benefit estimates after the project has been completed. This ensures that
benefit estimates tie back directly to the bottom line.
COSTS
Costs represent the investment necessary to capture the value, or benefits, of the proposed project. IT or the business units
may incur costs in the form of fully burdened labor, subcontractors, or materials. Costs consider all the investments and
expenses necessary to deliver the proposed value. In addition, the cost category within TEI captures any incremental costs
over the existing environment for ongoing costs associated with the solution. All costs must be tied to the benefits that are
created.
FLEXIBILITY
Within the TEI methodology, direct benefits represent one part of the investment value. While direct benefits can typically be
the primary way to justify a project, Forrester believes that organizations should be able to measure the strategic value of an
investment. Flexibility represents the value that can be obtained for some future additional investment building on top of the
initial investment already made. For instance, an investment in an enterprisewide upgrade of an office productivity suite can
potentially increase standardization (to increase efficiency) and reduce licensing costs. However, an embedded collaboration
feature may translate to greater worker productivity if activated. The collaboration can only be used with additional
investment in training at some future point. However, having the ability to capture that benefit has a PV that can be
estimated. The flexibility component of TEI captures that value.
RISKS
Risks measure the uncertainty of benefit and cost estimates contained within the investment. Uncertainty is measured in two
ways: 1) the likelihood that the cost and benefit estimates will meet the original projections and 2) the likelihood that the
estimates will be measured and tracked over time. TEI risk factors are based on a probability density function known as
“triangular distribution” to the values entered. At a minimum, three values are calculated to estimate the risk factor around
each cost and benefit.
30
Appendix C: Glossary
Discount rate: The interest rate used in cash flow analysis to take into account the time value of money. Companies set
their own discount rate based on their business and investment environment. Forrester assumes a yearly discount rate of
10% for this analysis. Organizations typically use discount rates between 8% and 16% based on their current environment.
Readers are urged to consult their respective organizations to determine the most appropriate discount rate to use in their
own environment.
Net present value (NPV): The present or current value of (discounted) future net cash flows given an interest rate (the
discount rate). A positive project NPV normally indicates that the investment should be made, unless other projects have
higher NPVs.
Present value (PV): The present or current value of (discounted) cost and benefit estimates given at an interest rate (the
discount rate). The PV of costs and benefits feed into the total NPV of cash flows.
Payback period: The breakeven point for an investment. This is the point in time at which net benefits (benefits minus costs)
equal initial investment or cost.
Return on investment (ROI): A measure of a project’s expected return in percentage terms. ROI is calculated by dividing
net benefits (benefits minus costs) by costs.
A NOTE ON CASH FLOW TABLES
The following is a note on the cash flow tables used in this study (see the example table below). The initial investment
column contains costs incurred at “time 0” or at the beginning of Year 1. Those costs are not discounted. All other cash flows
in years 1 through 3 are discounted using the discount rate (shown in the Framework Assumptions section) at the end of the
year. PV calculations are calculated for each total cost and benefit estimate. NPV calculations are not calculated until the
summary tables are the sum of the initial investment and the discounted cash flows in each year.
Sums and present value calculations of the Total Benefits, Total Costs, and Cash Flow tables may not exactly add up, as
some rounding may occur.
TABLE [EXAMPLE]
Example Table
Ref. Metric Calculation Year 1 Year 2 Year 3
Source: Forrester Research, Inc.