Embed Size (px)
Citation preview

THE TIR CONSULTING GROUP LLC
The Third Industrial Revolution Roadmap Next Economy for The Metropolitan Region of Rotterdam and The Hague
--- Final TIR Roadmap Next Economy ---
4 November, 2016
4520 East West Highway, Suite 600, Bethesda, MD, USA – +1 301 656 6272
Third Industrial Revolution Consulting Group
2
The document contains the combined and integrated narrative and proposals from both the Metropolitan Region of Rotterdam and The Hague Working Groups and the TIR Consulting Group
LLC to form a single collaborative report

Third Industrial Revolution Consulting Group
3
Contents
PREFACE ...................................................................................................................................................................... 5
THE THIRD INDUSTRIAL REVOLUTION: THE DIGITAL INTERNET OF THINGS (IOT) PLATFORM AND THE PARADIGM SHIFT TO A SMART MRDH ................................................................ 8
DIGITAL GATEWAY TO EUROPE .................................................................................................................... 16 THE COMMUNICATIONS INTERNET ........................................................................................................................ 16
1.1.0 NEW BUSINESS MODELS AND VALUE CHAINS .................................................................................. 32 1.1.1 TECHNICAL ......................................................................................................................................................... 33 1.1.2 REGULATORY .................................................................................................................................................... 37 1.1.3 POLICY .................................................................................................................................................................. 39 1.1.4 EDUCATION ........................................................................................................................................................ 40 1.1.5 FINANCIAL .......................................................................................................................................................... 41 1.1.6 R&D ........................................................................................................................................................................ 43
THE MOBILITY & LOGISTICS INTERNET ................................................................................................................ 44 1.2.0 NEW BUSINESS MODELS AND VALUE CHAINS .................................................................................. 66 1.2.1 TECHNICAL ......................................................................................................................................................... 81 1.2.2 REGULATORY .................................................................................................................................................... 93 1.2.3 POLICY .................................................................................................................................................................. 94 1.2.4 EDUCATION ........................................................................................................................................................ 95 1.2.5 FINANCIAL .......................................................................................................................................................... 97 1.2.6 R&D ..................................................................................................................................................................... 100
SMART ENERGY DELTA ................................................................................................................................... 108 THE RENEWABLE ENERGY INTERNET ................................................................................................................ 108
2.1.0 NEW BUSINESS MODELS AND VALUE CHAINS ....................................................................................... 174 2.1.1 TECHNICAL ...................................................................................................................................................... 191 2.1.2 REGULATORY ................................................................................................................................................. 202 2.1.3 POLICY ............................................................................................................................................................... 203 2.1.4 EDUCATION ..................................................................................................................................................... 204 2.1.5 FINANCIAL ....................................................................................................................................................... 206 2.1.6 R&D ..................................................................................................................................................................... 209 2.1.7 RESILIENCY PROPOSALS ........................................................................................................................... 213
BUILDINGS AS NODES..................................................................................................................................................... 224 2.2.0 NEW BUSINESS MODELS AND VALUE CHAINS ............................................................................... 239 2.2.1 TECHNICAL ...................................................................................................................................................... 240 2.2.2 REGULATORY ................................................................................................................................................. 241 2.2.3 POLICY ............................................................................................................................................................... 242 2.2.4 EDUCATION ....................................................................................................................................................... 244 2.2.5 FINANCIAL ......................................................................................................................................................... 248 2.2.6 R&D ...................................................................................................................................................................... 250

Third Industrial Revolution Consulting Group
4
CIRCULAR ECONOMY ....................................................................................................................................... 252 3.0 NEW BUSINESS MODELS AND VALUE CHAINS ................................................................................... 262 3. 1 TECHNICAL ........................................................................................................................................................ 2713.2 REGULATORY ..................................................................................................................................................... 272 3.3 POLICY................................................................................................................................................................... 272 3.4 EDUCATION ........................................................................................................................................................ 276 3.5 FINANCIAL .......................................................................................................................................................... 284 3.6 R&D......................................................................................................................................................................... 285
ENTREPRENEURIAL REGION ........................................................................................................................ 290 4.0 NEW BUSINESS MODELS AND VALUE CHAINS .......................................................................................... 338 4.1 TECHNICAL ......................................................................................................................................................... 353 4.2 REGULATORY ........................................................................................................................................................ 354 4.3 POLICY .................................................................................................................................................................... 355 4.4 EDUCATION ........................................................................................................................................................... 358 4.5 FINANCIAL ............................................................................................................................................................. 362 4.6 R&D ......................................................................................................................................................................... 362
NEXT SOCIETY .................................................................................................................................................... 365 5.0 NEW BUSINESS MODELS AND VALUE CHAINS .......................................................................................... 386 5.1 TECHNICAL ............................................................................................................................................................ 388 5.2 REGULATORY ..................................................................................................................................................... 389 5.3 POLICY................................................................................................................................................................... 390 5.4 EDUCATION ........................................................................................................................................................... 392 5.5 FINANCIAL ............................................................................................................................................................. 398 5.6 R&D ......................................................................................................................................................................... 398
THE FINANCIAL UNDERPINNINGS OF A MORE PRODUCTIVE MRDH ECONOMY ........................ 401 A SUSTAINABLE ENERGY FINANCE (SEF) STRATEGY: IMPLEMENTATION AND DEPLOYMENT .......................................... 410 BLOCKCHAINS: CONCEPTION AND EXECUTION ............................................................................................................ 450
EXPLORING THE POTENTIAL ECONOMIC BENEFITS OF THE TIR ROADMAP NEXT ECONOMY INNOVATION SCENARIOS [Reproduced Here]......................................................................................... 477
TIR CONSULTING GROUP LLC BIOGRAPHIES .......................................................................................... 512

Third Industrial Revolution Consulting Group
5
PREFACE The Metropolitan Region of Rotterdam and The Hague (MRDH), which comprises 23
municipalities with a combined population of 2.3 million, has been working with TIR Consulting
Group LLC over the past year in a joint project to craft an economic vision and development
plan to transform this large swath of the Netherlands into a Third Industrial Revolution. This
collaborative effort has resulted in a 152,000 word Roadmap Next Economy report to make this
extended metropolitan region a pioneer in the build out of a smart Digital Europe.
The Netherlands has a long tradition of collaboration between government, businesses, the
academic community, and nonprofit organizations in the pursuit of economic, social, and
cultural goals. The Metropolitan Region of Rotterdam and The Hague has deepened and
expanded on this tradition by bringing together more than 300 representatives from across
various industries, professional associations, research institutes, civil society organizations, and
other competencies in a multi-perspective endeavor in partnership with TIR Consulting Group
LLC.
The joint initiative has transformed the governance model in the metropolitan region to reflect
the nature of the new Third Industrial Revolution infrastructure being readied for deployment.
The coming together of the Communication Internet, the Renewable Energy Internet, and the
automated Mobility Internet, atop an Internet of Things platform, not only changes the way the
MRDH manages, powers, and moves economic activity, but also the very nature of social
engagement among the principal sectors of society. The near zero marginal cost of
collaboration across vast digital networks is best advanced in a distributed, collaborative, open,
and laterally-scaled fashion, changing the very nature of governance. Recognizing the new
opportunities and challenges brought on by this new technological revolution, the 23
municipalities of the Metropolitan Region transformed their traditional role as a centralized
overseer and planner to that of a lateral facilitator of a regional network of engaged
stakeholders working together as equal partners to advance a new economic, social, and
political vision that can take the region into the smart digital era.
The MRDH Roadmap Next Economy represents a real-world manifestation of one of the central
tenants of the Maastricht Treaty – the subsidiarity principle. That principle requires that all
political decision-making begins at the most local level and radiates out to broader domains
stretching from localities to regions to nation-states, and finally to the continental European

Third Industrial Revolution Consulting Group
6
Union and the global economy. The subsidiarity principle is quickly gaining prominence in cities
and regions across every continent as the digital revolution crosses political boundaries,
connecting communities in a smart planetary digital space. While the First and Second
Industrial Revolution spawned a more top-down vertically integrated form of globalization, the
Third Industrial Revolution takes the human family into a more laterally networked
“glocalization” – with cities, regions, nation states, and continental unions collaborating side-
by-side in vast global networks to create a more ecologically sustainable and equitable quality
of life. The MRDH Roadmap Next Economy, with its emphasis on broad stakeholder
participation in the deliberation and execution of a new technological infrastructure and
accompanying economic narrative and game plan, exemplifies the deployment of the
subsidiarity principle, and the shift from globalization to glocalization, providing a precedent for
similar local and laterally designed governance models in urban metropolitan areas and regions
across the 28 Member States of the EU and around the world.
Aware that digital interconnectivity breaks down traditional boundaries and borders and favors
distributed and open flows in collaborative networks, MRDH and TIR Consulting Group LLC
redefined the nature of participation in the establishment of the Working Groups responsible
for preparing the Roadmap Next Economy, eliminating conventional sector divisions in favor of
the pursuit of competencies. In the emerging Third Industrial Revolution era, industrial sectors
become less important, while cross-discipline expertise becomes more relevant in defining
relationships across the economic value chains. To this end, the Roadmap Next Economy is
divided into five Transition Pathways, each reflecting a combination of competencies: Digital
Gateway to Europe; Smart Energy Delta; Circular Economy; Entrepreneurial Region; and Next
Society.
The Third Industrial Revolution Roadmap Next Economy breaks additional ground by applying
this cross-disciplinary approach to the future development of the Metropolitan Region of
Rotterdam and The Hague, combining social, cultural, and environmental narratives and
economic theory and business practices, with the objective of reconceiving economic
development within a larger frame of “quality of life.” While the advent of the digital Third
Industrial Revolution in the United States focused largely on new technologies, products, and
services – the Silicon Valley model –, MRDH has taken a more inclusive and globalizing
approach by framing the relevance of the new products, technologies, and services to the
emerging global interconnectivity and accompanying planetary stewardship of the Earth’s
ecosystems – the Biosphere Valley model. In the Biosphere Era, MRDH and every other political

Third Industrial Revolution Consulting Group
7
jurisdiction becomes responsible for its 19 kilometers of the biosphere stretching from the
stratosphere to the sea, which makes up the life force of the planet and constitutes the
indivisible community to which we are all beholden and whose well-being determines our own
quality of life. Biosphere stewardship becomes the essential mission of each region and locality
in reducing ecological footprint and addressing climate change in the coming era.
The Third Industrial Revolution narrative proposed in the Roadmap Next Economy introduces
an innovative approach to biosphere stewardship based on ushering in digital ecosystems that
mirror the dynamics of natural ecosystems, with the intention of pursuing a seamless symbiotic
relationship between the circular flows of nature and the economic activities of Dutch society.
With this in mind, the Roadmap Next Economy continually hones in on critical ecosystem
features including self-organization, mutualism, co-evolution, diversity, emergence, resiliency,
and adaptation in modelling the metropolitan region’s new digital ecosystems and
accompanying business practices and regulatory regime.
The Roadmap Next Economy gives the Metropolitan Region of Rotterdam and The Hague a
blueprint for transitioning its 23 municipalities into a fully operational Third Industrial
Revolution paradigm. The 40 year build out and scale up of the new digital infrastructure will
transform the nature of business, require a range of new talents and skills, employ thousands
of new workers, and give rise to a hybrid economic system comprised of the traditional
capitalist market and the emerging Sharing Economy.
The Roadmap Next Economy positions the Metropolitan Region of Rotterdam and The Hague as
an early adopter and role model for the thousands of other municipalities and metropolitan
areas in the 28 Member States and adjoining partnership regions that are about to embark on a
similar transition into smart regions in the Third Industrial Revolution era.
Jeremy Rifkin, President, TIR Consulting Group LLC

Third Industrial Revolution Consulting Group
477
EXPLORING THE POTENTIAL ECONOMIC BENEFITS OF THE TIR ROADMAP NEXT ECONOMY
INNOVATION SCENARIOS
OVERVIEW
On any given day, a helmsman will steer a large
container ship into and out of the Port of Rotterdam,
or a software engineer in The Hague might
“telecommute” from home rather than travel to the
office. At the same time, a greenhouse technician
may power up various equipment to harvest, label, and transport trees, shrubs, flowers, and
other plants to provide numerous products to consumers while a truck driver may be on the
way to deliver a replacement part that will allow a manufacturer to resume production. These
separate work events all share three critical elements.
The first element is that someone undertakes an activity to get the job done. This is typically
referred to as the labor component of economic activity, or perhaps skilled employment. The
second is the use of machinery or some type of equipment that facilitates the production of
goods and services. This item is the result of annual investments made each and every year in
that equipment, or perhaps in the supporting infrastructure that enables all other equipment to
be used. Buildings, roads, bridges, pipelines, power plants, and new installations of renewable
energy technologies are all examples of supporting infrastructure.
The combined investments in all of the appliances, equipment, and infrastructure together, as
they accumulate over time, are often referred to as capital. The third element in the production
process is the high-quality flow of energy – electricity, natural gas, diesel fuel or gasoline,
whether they are provided by conventional energy supplies or by renewable energy resources.
It is energy in the form of food that animates labor and energy in the form of electricity or
natural gas that enables capital to carry out the desired set of tasks. Depending on the mix and
the productive uses of all resources that are put to work, the Dutch economy is able to deliver
an assortment of goods and services to meet the needs of not only regional businesses and the
local residents, but also many other nations throughout the world. This so-called work is
typically measured as personal income or gross domestic product (GDP).
John “Skip” Laitner (Economic and Human Dimensions Research Associates), TIR Consulting Group LLC

Third Industrial Revolution Consulting Group
478
In most economic development assessments, labor and capital are often thought to be the main
elements that drive economic activity. Yet, it is energy—the third, and the most often
overlooked component of the economic process—that may prove to be the more critical driver
of economic and social well-being. To extend our example above, a software engineer cannot
develop code without electricity to power the computer. The helmsman cannot effectively steer
a ship without electricity to power navigation tools or diesel fuel to propel the ship. When
optimally sourced and efficiently used, energy can amplify local economic development and
foster a more robust and resilient economy. But equally true, the wrong mix of those resources,
and especially the inefficient use of those resources, can appreciably constrain the larger vitality
of a local or national economy.
In 2014, the Metropolitan Region of Rotterdam and The Hague, whether its workers, consumers,
and businesses, or a variety of government operations at work in the region, together spent an
estimated €6 billion to meet their combined energy needs. The many payments made each day
or each month enable them to cool and light their homes, drive to work, listen to music or
watch TV, and power the region’s many commercial enterprises. Electricity purchases enable
access to the Internet, as well as the filtration and purification of the water that is delivered to
local homes, schools, and businesses every day.
Although inhabitants of MRDH derive many important benefits as they pay their energy bills,
there may also be a significant opportunity to save money. As we shall see later in this section,
those energy bill savings – perhaps an average of €700 million per year – will also reduce the
massive amounts of greenhouse gases and other pollutants that are released into the air. By one
estimate, if MRDH were to go 100 percent renewable energy by 2050, the avoided air quality health
effects might be on the order of €7.5 billion per year. Moreover, the avoided 2050 global climate-
change costs from converting to 100 percent renewable energy is on the order of €8.0 billion per
year.327
There is no question that the production and use of energy is critical to the social and economic
well-being of the Netherlands. But as the International Energy Agency (IEA) underscores, there
is also a critical need for greater emphasis on the more efficient use of energy and a more
327 Mark Z. Jacobson, Mark A. Delucchi, et al. (April 2016). 100% Clean and Renewable Wind, Water, and Sunlight (WWS)
All-Sector Energy Roadmaps for 139 Countries of the World. Department of Civil and Environmental Engineering,
Stanford University. https://web.stanford.edu/group/efmh/jacobson/Articles/I/CountriesWWS.pdf. Note that the
original values reported here were originally expressed in 2013 US dollars. Those values were converted to Euros using a
2013 exchange rate of 1.328 USD per Euro. The values cited here are based on the population of MRDH compared to
the results for the larger Netherlands economy.
Third Industrial Revolution Consulting Group
479
diversified energy portfolio. The IEA further noted that the inefficient conversion of energy can
create a large array of problems which can weaken or constrain the development of a more
robust economy.328 German physicist Reiner Kümmel and his colleagues studied the economic
process and noted that the economic weight of energy is significantly larger than its cost
share.329 Research by economist Robert Ayres and his colleague Benjamin Warr documented
that improvements in both the quality and efficiency of delivered energy services may be the
critical factor in the growth of an economy. Indeed, they suggested that a greater level of energy
efficiency is one of the primary drivers that support meaningful technological progress, and that
sustained technological progress may come only with extensive upgrades in a nation’s or region’s
overall energy and other resource efficiency. A recent study of the EU-15, with analytical results
also specific to the Netherlands, amplified these insights. It concluded that the transition to a
low-carbon and more robust economy should be done in a way that ensures both the higher
accumulation of productive capital and the more productive use of energy.330 Both principles
are wholly consistent with the pillars of the Third Industrial Revolution and the MRDH
development of a Roadmap Next Economy.
For these very reasons, the MRDH economy may be at a critical intersection. According to a
recent study published by the American Council for an Energy-Efficient Economy (ACEEE), the
U.S. economy is only 14 percent energy-efficient. That is to say, of all the energy consumed
within the economic process, 86 percent of it is wasted—released as heat, greenhouse gases
and other pollutants.331 While noted elsewhere in the Roadmap Next Economy, indexing data for
the Netherlands suggests that the Dutch economy is more energy-efficient than the U.S. economy.
Yet that comparison also indicates a less energy-efficient economy for the Metropolitan Region of
328 Nancy Campbell, Lisa Ryan, et al. (2014). Capturing the Multiple Benefits of Energy Efficiency. Paris, France, International Energy Agency. http://www.iea.org/publications/freepublications/publication/Captur_the_MultiplBenef_ofEnergyEficiency.pdf 329 Reiner Kümmel (2011). The Second Law of Economics: Energy, Entropy, and the Origins of Wealth. New York, NY, Springer. See also, R. Kummel (2013). "Why energy’s economic weight is much larger than its cost share." Environmental Innovation and Societal Transitions, (9): 33-37. 330 See, Vlasios Voudouris, Robert Ayres, Andre Cabrera Serrenho, and Daniil Kiose. 2015. The economic growth enigma revisited: The EU-15 since the 1970s. Energy Policy 86 (2015), pages 812–832. 331 For more background and a deeper discussion on the critical link between the productive conversion of high quality energy and a robust economy, see Robert U. Ayres and Benjamin Warr (2009), The Economic Growth Engine: How Energy and Work Drive Material Prosperity. Northampton, MA, Edward Elgar Publishing, Inc. Also see John A. “Skip” Laitner (2015), “Linking energy efficiency to economic productivity: recommendations for improving the robustness of the U.S. economy.” WIREs Energy Environ, 4:235–252. doi: 10.1002/wene.135. For a European application of these perspectives, read Jeremy Rifkin, Benoit Lebot, J. A. S. Laitner, Solenne Bastie, Francis Hinterman and Shawn Moorhead (2013). Third Industrial Revolution Master Plan Nord-Pas de Calais, France. Bethesda, MD, TIR Consulting.

Third Industrial Revolution Consulting Group
480
Rotterdam and The Hague compared to the Netherlands as a whole, and to many other developed
nations. In reality, the MRDH economy appears to waste the same 86 percent of its high quality
energy resources as the United States. With that magnitude of ongoing energy losses each day,
and an over-reliance on fossil fuel resources more broadly, MRDH may face serious economic
and competitive challenges should it continue with its current pattern of energy production and
consumption.
As suggested in this assessment, systematic upgrades in the use of much more energy-efficient
technologies and productive investments in renewable energy systems can provide all of the
MRDH energy needs by 2050. As also indicated, it is both technically and economically feasible to
encourage such a transition.332 In summary, a significant portion of the billions of Euro already
spent each year for energy consumption can be used in other ways to more productively
strengthen the country’s larger economy—provided local business leaders and local policy
makers choose to encourage and enable those smarter and more productive investments to be
made.
This contribution to the Roadmap Next Economy explores future economic development
opportunities available to the Metropolitan Region of Rotterdam and The Hague. More
specifically, the analysis examines the prospective economic benefits within the regional
economy if households and businesses were to shift away from current investment patterns to
pursue a more productive and cleaner energy future. The analysis investigates the benefits that
energy efficiency and renewable energy resources can deliver to the regional economy as the
basis for a revitalized economic development. It also examines the scale of investment that will
be necessary to drive those improvements. Lastly, the report determines how a shift in
spending toward practical clean energy resources could strengthen the region’s ability to support
more incomes and jobs.
With that backdrop, the next section of this assessment provides the overall framework that
reinforces the analysis found in this report. A subsequent section then explores the current
patterns of economic activity and energy consumption—especially as the investigation points to
332 In aninterview, San Diego Gas & Electric Senior Vice-President of Power Supply, James Avery highlighted
emerging problems associated with the rapid adoption of photovoltaic energy systems. He noted: we haven’t begun
“to think of the technologies that will evolve” out of the digitalization of the grid. He said, the “wealth of
opportunities far exceeds the programs and applications that exist today.” See,
http://www.utilitydive.com/news/sdge-if-youre-not-prepared-for-the-change-its-too-late/366979/. For MRDH,
these opportunities might include both domestically-produced resources as well as cost-effective imported energy
services that depend on an array of renewable energy technologies–with all resources used more efficiently.

Third Industrial Revolution Consulting Group
481
evidence of previous inquiries and surveys that inform a productive path forward based on the
idea of the Third Industrial Revolution. It also explores the scale of purposeful effort and
investments that can enable both the Netherlands and MRDH to build up those future
opportunities. The last major section includes an overview of the methodology used to estimate
the net jobs and other economic impacts of the greater diversity in the use of energy resources
and, in particular, the greater level of renewable energy and energy efficiency improvements. It
then summarizes the major economic impacts of this specific inquiry and highlights the next
three critical steps that can ensure a more robust, resilient, and sustainable economy within the
country. The first step includes an immediate implementation of “first energy efficiency
projects” to document the scale of positive outcomes that will emerge from these initial
ventures. The second step is to lay out a set of useful metrics that can assist in the evaluation of
the benefits which follow from these and future projects. The last effort, logically building on
the two previous steps, is to develop a policy-relevant database that can both track the major
projects and policy initiatives and inform the nation about all of the net positive outcomes
beyond an energy-led investment strategy. In addition, a short narrative offers further details
about the economic model used to complete this assessment for the MRDH economy.
FRAMEWORK OF THE ECONOMIC ASSESSMENT
The appropriate assessment of the economic impacts of different policy opportunities for
MRDH—what we call in this document a Third Industrial Revolution Roadmap Next Economy
Innovation Scenario—is a function of perspective, data, and logic.333 The perspective is an
understanding of how an economy can become much more productive and robust in the use of
capital, materials, and especially energy. The data reflect both the economic underpinnings of
MRDH and the specific costs and benefits associated with the development and deployment of
new technologies, systems, and infrastructure. The logic of any assessment is driven by
knowledge of how jobs and incomes are supported by a transition to a lower-cost economy
despite initial upfront costs. It still takes money to make money, and in this special case of the
Roadmap Next Economy, it takes knowledge and purposeful effort, together with a new pattern
333 As described throughout the other parts of the Master Plan, the RNE Innovation Scenario brings together the Communication Internet, the Renewable Energy Internet, and the automated GPS-driverless road, rail, water and air Mobility Internet on top of the Internet of Things platform. It is this Third Industrial Revolution digitalized infrastructure to manage, power, and move economic activity that allows MRDH to dramatically improve its aggregate efficiency and productivity as well as reduce it ecological footprint and the larger set of marginal costs.

Third Industrial Revolution Consulting Group
482
of investments to enable MRDH to build a more resilient and higher quality of economic activity
over the next three or four decades.
Rethinking the Underpinnings of the MRDH Economy
MRDH sits at a moment in history in which doing nothing is not an option. The regional
economy shows a lagging growth in performance. Over the period 1995-2008, for example, the
volume of Gross Domestic Product (GDP) per inhabitant within the region—a useful proxy of
economy-wide productivity—grew at a reasonable rate of 2.3 percent per year. With a
population growth of about 0.4 percent, that meant the economy as a whole grew, on average,
by nearly 2.7 percent per year over that 13-year period. Over the next 7-year period through
2015, however, the economy-wide activity was essentially flat, indeed a bit smaller in 2015
compared to 2008. This is also a weaker level of economic activity when compared to the
collective performance of the more than 30 countries of the Organization of Economic
Cooperation and Development (OECD), which taken as a whole expanded by only 1.1 percent
annually over that same period.334
While many standard economic projections suggest a continuing 3.0 percent annual growth
through 2050 (the last year explored in the RNE Innovation Scenario time horizon), there are
other forecasts and indications which suggest the possibility of a weaker and less robust level of
economic activity—perhaps lowering the Netherlands’ GDP to 2.0 percent or lower. In fact, this
appears to be the case for the OECD region as a whole (OECD Long-Term Projections 2014).
This last projection is consistent with other indicators, all of which point to a lagging rate in the
more productive use of capital, energy, and other resources. If we also fold in the many steps
that need to be taken to address climate change and other environmental concerns, failure to
explore these very possible outcomes, may leave MRDH, the Netherlands, the OECD as a whole,
and all developing nations at risk. In this context, the Third Industrial Revolution Roadmap Next
Economy can be thought of in two different ways. First, “RNE-like thinking” can become an
insurance plan which can enable MRDH to maintain a healthy economy; and second, the RNE
334 There is a tendency among many policy analysts to assume a reasonable and smooth projection of recent
historical trends and assume such patterns will continue into the mid- to long-term term projections. At the same
time, however, there is a worrisome trend that suggests a significant weakening of future GDP. See, for example,
OECD (2016), GDP long-term forecast (indicator). doi: 10.1787/d927bc18-en (Accessed on 30 July 2016). This latest
data set suggests less than 2 percent growth over the period 2015 through 2060. Such projections greatly
underscore the need to encourage a more productive investment in RNE-related infrastructure as well as both
social and economic capital.

Third Industrial Revolution Consulting Group
483
Innovation Scenario can provide insights into the kind of economic platform that can safeguard
both a resilient and sustainable economy over a longer period of time.
Notwithstanding some early warning signs of a weaker Second Industrial Revolution economy,
MRDH has a number of promising opportunities that can point the way to the more productive
use of its many resources; and to do so in ways that build a more robust, resilient, and
sustainable Third Industrial Revolution economy. These many transition pathways are
described elsewhere in the RNE Master Plan. But we might ask how these options generate a
net positive return compared to the standard business-as-usual or reference case assumptions.
The table below highlights at least seven key drivers that can support a more robust economy
as a result of any given RNE Innovation Scenario and resulting Master Plan. The individual
effects and each of their primary impacts are described next.
Table 1. The Seven Major Drivers of Employment and Economic Benefits
Source: As described and discussed in the text of the manuscript.
The Catalysts to a More Robust Regional Economy
The first key driver is referred to as the intensity shift. Just as some energy resources are more
carbon-intensive than others—for example, natural gas produces less carbon-dioxide per
megajoule of energy than does coal, while renewable energy resources produce no direct
emissions compared to any form of fossil fuels—, different sectors of the MRDH economy have
different income and employment intensities. In other words, different sectors support either
more or fewer jobs incomes per unit of economic activity than other sectors to which they
might be compared. We can follow this logic as shown in Figure 1 on the following page.
Immediate improvements in energy efficiency across all of the sectors that make up the MRDH
economy will have a significant impact on new employment opportunities. Based on 2016 data

Third Industrial Revolution Consulting Group
484
from the Netherlands Economic Observatory (which, in turn, draws on public data made
available through a variety of agencies and institutions), energy services supported 4.0 jobs per
million Euro of value-added, compared to 8.3 jobs in information and communication services
as well as manufacturing, and 15.4 in construction and 11.1 on average throughout the
economy (NEO 2016).335 Hence, for every one million Euro of value-added services generated
through greater cost-effective energy efficiency improvements across the economy, MRDH will
gain a net increase of 7.1 new jobs. Instead of supporting 4 jobs for energy purchases, the
economy will support an average of 11.1 jobs as the energy bill savings are re-spent for other
goods and services in the regional economy. This is a net gain of 7.1 jobs economy-wide for
each million Euros of a cost-effective transition away from the use of conventional energy
purchases.
Figure 1. MRDH Job Intensities for Key Economic Sectors
Source: Data provided by the Netherlands Economic Observatory (2016)
A second category of prospective benefits results from the build-up of regional production of
goods and service. While MRDH boasts a large export market, it also imports an estimated 60
to 65 percent of its supply chain of goods and services. Moreover, it appears that MRDH only
335 This information has been generally provided on an ongoing basis in collaboration with MRDH and the
Netherlands Economic Observatory over the past 9 months.
Third Industrial Revolution Consulting Group
485
extracts 40 percent of value-added from its total economic output. By comparison, the United
States pulls about 58 percent value from its total output. To the extent that the RNE master
plan increases local production capacity for goods and services, this will increase both the
resilience and vitality of the national economy.336
A third area of opportunity is the likely positive impacts of greater resource and energy
efficiencies on both energy and non-energy costs. Even as MRDH will benefit from cost-
effective reductions in energy and other resources, the remaining resource requirements will
more than likely benefit from lower total costs. This is because reduced demand allows less
costly resources to be deployed, and it tends to place an otherwise downward pressure on
other remaining costs.
A related fourth area of benefit is the prospect of greater productivity which can expand
economic opportunity—especially with the lower level of resource consumption. For example,
the region’s GDP in 2014 was an estimated €98.9 billion. Had the larger productivity of the
nation’s economy been just 0.5 percent higher over the period 2000 through 2014, the regional
GDP would have been €7 billion larger. Again checking Figure 1 on the jobs per million Euro, a
€7 billion gain from that higher productivity would have led to higher employment of about
77,700 jobs (all else being equal). In effect, €7 billion is 7,000 million times 11 jobs per million
Euro which equals 77,700 more jobs.
A fifth and sixth set of impacts include managing the disruption in the availability of energy and
other resources while also minimizing the unexpected effects of price volatilities. As the
demand for goods and services is reduced in the Metropolitan Region, the EU-28 and the global
market more generally, and especially as the need for imported resources is reduced, the
MRDH markets will enjoy a reduced exposure and therefore a greater certainty in the
availability of those resources. That is clearly a positive benefit.
Finally, the seventh major driver of greater employment and economic benefits that are likely
to follow from the RNE Innovation Scenario is the continuous learning and encouragement
336 As a thought experiment we can imagine how building up greater local capacity and supply can increase the
robustness of the MRDH economy. For example, as the region now provides an initial 35% of its resources through
local purchases, we can use a multiplier formula of [1 / (1 – 0.35)] to suggest a base economic multiplier of 1.54 for
each dollar spent by businesses and consumers. But if the RNE master plan moves the local purchase coefficient
from 35% to 45%, then the base multiplier increases to 1.82. In other words, instead of a €100 consumer purchase
that might support €154, under the RNE master plan it would support more like €182, without any other additional
cost to the economy.

Third Industrial Revolution Consulting Group
486
which will catalyze greater innovations, whether the development and deployment of new
general purpose technologies, or the innovative changes in business models that can satisfy
social, economic, and environmental needs within the region’s economy.
Figure 2, on the following page, provides a conceptual framework that helps pull the RNE
Master Plan and the RNE Innovation Scenario into a useful perspective. While we cannot know
at this time the scale of the eventual stimulus, the productive impact of the many positive
collaborations that will be necessary, or the precise outcomes that might result from such
innovations, we can offer a positive general explanation of how multiple benefits are likely to
emerge through the RNE master plan.
The assumption might be made that the Dutch economy is already on what is called a
production frontier at point “a” in the Figure 2 diagram above. Given the current market
structures, technologies and social needs, any change to satisfy a demand for greater
efficiencies, or for the reduction in greenhouse gas emissions, must likely result in a downward
shift to the right on this graphic illustration. MRDH might achieve some mix of isolated
productivity improvements, and there might be some reduction in greenhouse gas emissions,
but it must surely come at the cost of a reduction in incomes and GDP. While the RNE
Innovation Scenario envisions a set of programs, policies, and incentives that may initially shift
the economy to point “b,” such a shift may also create a productive transition that lifts the
economy to point “c.” The result is an improvement in energy efficiencies (as well as the more
productive use of resources) even as the economy remains at a relatively stable level of GDP.

Third Industrial Revolution Consulting Group
487
Figure 2. Conceptual Framework for Evaluating RNE Innovation Scenarios
Source: John A. “Skip” Laitner (July 2016).
At some point, however, the various energy and non-energy benefits that result from an array
of incentives and policy initiatives can boost the performance of the economy to a higher than
expected level of performance. Although not drawn to scale in Figure 2, the migration from
point “a” to the eventual point “d” might represent a 30 percent reduction in energy
requirements per unit of GDP together. The net energy savings, together with a transition to a
100 percent renewable energy system might, in turn, stimulate a significant boost in net gains
in jobs and GDP (as we shall see when we turn our attention to Tables 6 and 7 later in this
section of the master plan). Equally critical, the RNE Innovation Scenario can become a way to
catalyze the seventh benefit of such master plans—an enhanced push of the production
frontier so that future technologies and markets are encouraged, developed, and implemented
to the long-term benefit of the economy.337
337 It is true that a three or four percent absolute improvement over any long-term forecast may seem a very small
benefit. In that regard, the roughly €4 billion net gain in GDP suggested in this assessment, compared to a
reference case projection of more than €160 billion, may seem less than appealing. Yet, equally important is
Third Industrial Revolution Consulting Group
488
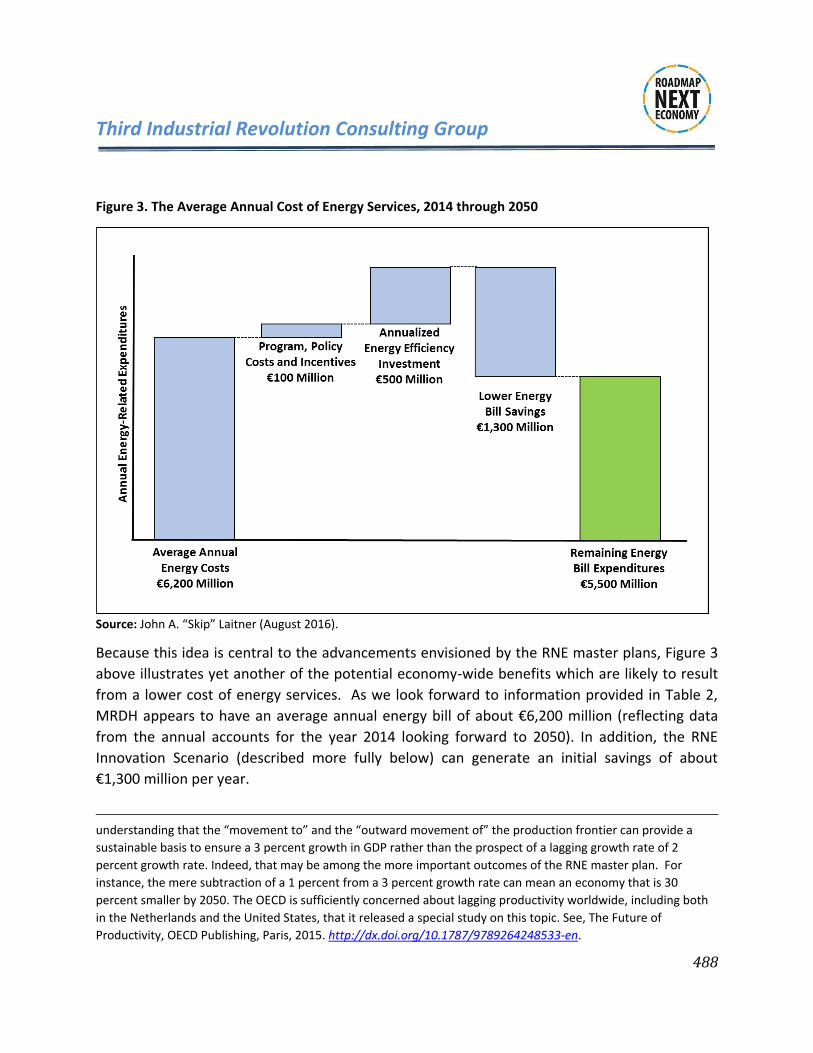
Figure 3. The Average Annual Cost of Energy Services, 2014 through 2050
Source: John A. “Skip” Laitner (August 2016).
Because this idea is central to the advancements envisioned by the RNE master plans, Figure 3
above illustrates yet another of the potential economy-wide benefits which are likely to result
from a lower cost of energy services. As we look forward to information provided in Table 2,
MRDH appears to have an average annual energy bill of about €6,200 million (reflecting data
from the annual accounts for the year 2014 looking forward to 2050). In addition, the RNE
Innovation Scenario (described more fully below) can generate an initial savings of about
€1,300 million per year.
understanding that the “movement to” and the “outward movement of” the production frontier can provide a
sustainable basis to ensure a 3 percent growth in GDP rather than the prospect of a lagging growth rate of 2
percent growth rate. Indeed, that may be among the more important outcomes of the RNE master plan. For
instance, the mere subtraction of a 1 percent from a 3 percent growth rate can mean an economy that is 30
percent smaller by 2050. The OECD is sufficiently concerned about lagging productivity worldwide, including both
in the Netherlands and the United States, that it released a special study on this topic. See, The Future of
Productivity, OECD Publishing, Paris, 2015. http://dx.doi.org/10.1787/9789264248533-en.

Third Industrial Revolution Consulting Group
489
At the same time, to enable such a substantial level of savings requires MRDH to create a series
of programs, policies, and incentives averaging about €100 million per year.338 It is these
initiatives which, in turn, will drive the requisite large-scale of investments as they are
amortized over time, much like a family might pay for a new home or building. Since the
renewable technology costs are part of the average annual energy supply expenditures, it is
only the energy efficiency investments that further bump up the cost to an estimated €500
million (also reflecting average annual payments for those relevant investments over time). All
of this means that, although total savings might be €1,300 million each year on average, paying
for the investments, programs, and policies reduces the gross savings of €1,300 million to a net
savings of €700 million. The first result in exploring the costs of energy services is a lower
average energy expenditure of €5,500 million per year.
As good as that outcome appears to be, it is merely the benefit from the lower total cost of
energy-related resources. We can also account for other social, economic, health, and
environmental costs that will impact both MRDH and the Netherlands. Recalling the country-
specific impacts from the Stanford University study noted earlier,339 if MRDH were to go to a
100 percent renewable energy economy, the combined avoided air quality health effects and
global climate-change might approach €16 billion in further savings by 2050. This does not include
potentially sizable GDP and employment gains that are likely to accrue from the more productive
pattern of infrastructure investments, energy efficiency upgrades, as well as the deployment of
large-scale renewable energy systems.
The systemic build out, scale up, and convergence of the Digital Communications Internet,
Renewable Energy Internet, and Automated Transport and Logistics Internet, atop an Internet
of Things platform, will position MRDH with a high-tech digital infrastructure. This digital
infrastructure will enable MRDH, in turn, to achieve dramatic gains in aggregate efficiency and
productivity and the equally dramatic reduction in marginal costs and ecological footprint, and
will provide the new business models that accompany the RNE economy. It is this new high-
tech infrastructure that affords the opportunity for more productive investments to reduce the
total cost of energy services so that any remaining net costs become substantially smaller. The
important element in all of this is that if MRDH is to maintain a robust economy, there will need
to be a convergence of new resource efficiencies and new energy resources that reduce the
338 This figure reflects expenditures within the public, private, and non-profit sectors to educate, train, market, promote and evaluate the relevant programs and policies which will be necessary to elevate the larger performance of the MRDH economy. 339 Referencing Jacobson, Delucchi et al. (2016)

Third Industrial Revolution Consulting Group
490
real cost of energy services in each successive year, from today through the year 2050. Figure 4
provides a further graphical illustration of such possibilities.
Figure 4. Exploring the RNE Energy Productivity Link to Increasing Per Capita GDP
Source: John A. “Skip” Laitner for the TIR RNE Core Team Using IEA Data (June 2016).
In Figure 4, the blue dots represent actual data published by the International Energy Agency
(IEA) for the Netherlands over the period 1980 through 2014. The smaller set of blue dots
highlight the curve of a fitted trend of the IEA data. The statistics show a reasonably tight link
between energy productivity (in effect, the level of GDP supported by each metric ton, or
tonne, of oil equivalent consumed within the Netherlands) as it compares to per capita GDP. In
the lower left, for example, an energy productivity of €7,000 per tonne of oil consumed within
the nation’s economy supported a per capita GDP of €30,000 in about 1980. In a fairly tight
pattern, rising energy productivity can be seen to catalyze an increase in GDP per inhabitant.
The end result is that by 2014, an energy productivity of around €11,600 supported a GDP per
capita of about €50,000.
At the same time, however, an astute observer might note a flattening of the blue curve. In
effect, this is the set of diminishing returns we might observe from the current Second

Third Industrial Revolution Consulting Group
491
Industrial Revolution technologies and infrastructure. It is getting harder to generate economic
and social well-being from the existing array of technologies and productivity benefits. Hence,
the need to turn to what is shown in Figure 4 as the “RNE Industrial Infrastructure.” By
redirecting both purposeful effort and new investments, consistent with the Third Industrial
Revolution Roadmap Next Economy, we can imagine the possibility of lifting the performance
of the MRDH economy to higher levels by increasing overall energy productivity and, therefore,
economic productivity, as captured by the set of green dots and curves as shown in Figure 4.
How might we understand this opportunity for the MRDH economy?
There have been five major published studies in the past few years by the American Council for
an Energy-Efficient Economy (ACEEE), Cisco, General Electric, McKinsey, and AT Kearney, which
in various ways speak to the enormous potential in terms of increased efficiencies productivity,
new business models, and employment opportunities brought on by the shift to an Internet of
Things smart economy. The 2014 assessment by ACEEE concluded that accelerated investments
in ICT-enabled networks could lead to productivity benefits that would create a $79 billion
energy bill savings in the United States, even as the economy expanded by as much as $600
billion.340 Cisco systems forecasts that by 2022, the Internet of Everything will generate $14.4
trillion in cost savings and revenue.341 A 2015 McKinsey report entitled, "The Internet of
Things: Mapping the Value Beyond the Hype," suggests that the build out and scale up of an
Internet of Things infrastructure will have a 'value potential' of between $3.9 trillion to $11.1
trillion per year by 2025.342 A General Electric study concludes that the efficiency gains and
productivity advances made possible by a smart industrial Internet could resound across
virtually every economic sector by 2025, impacting “approximately one half of the global
economy.”343 A 2016 AT Kearney study entitled, "The Internet of Things: A New Path to
European Prosperity," says that "over the next 10 years, the market for IoT solutions will be
340 John A. “Skip” Laitner Matthew T. McDonnell Karen Ehrhardt-Martinez. 2012. The Energy Efficiency and Productivity Benefits of Smart Appliances and ICT-Enabled Networks: An Initial Assessment. Washington, DC: American Council for an Energy-Efficient Economy. http://aceee.org/blog/2014/11/internet-everything-could-be-huge-boo. 341 Shane Mitchell, Nicola Villa, Martin Stewart-Weeks, and Anne Lange. 2013. The Internet of Everything for Cities: Connecting People, Process, Data, and Things to Improve the ‘Livability’ of Cities and Communities. Cisco. http://www.cisco.com/c/dam/en_us/solutions/industries/docs/gov/everything-for-cities.pdf 342 James Manyika, Michael Chui, Peter Bisson, Jonathan Woetzel, Richard Dobbs, Jacques Bughin, and Dan Aharon. 2015. The Internet of Things: Mapping the Value Beyond the Hype. McKinsey Global Institute. http://sensorcommtech.com/the-internet-of-things-mapping-the-value-beyond-the-hype-mckinsey-global-institute/ 343 Peter C. Evans and Marco Annunziata. 2012. Industrial Internet: Pushing the Boundaries of Minds and
Machines. General Electric. https://www.ge.com/docs/chapters/Industrial_Internet.pdf

Third Industrial Revolution Consulting Group
492
worth €80 billion, and the potential value for the EU28 economy could reach €1 trillion." The
report goes on to say that the increase in productivity alone could exceed €430 billion in the
EU.344 Based on a per capita allocation, that could mean a €2 billion boost in productivity for the
MRDH economy. However, AT Kearney is quick to add that the increased capabilities brought
on by the digitalization of the infrastructure will "increase exponentially when connected
objects are coordinated."
What is common to all of these reports, as well as our own assessment here for MRDH, is that
these "potential scenarios” can become more quantifiable when applying a new set of metrics
tailored to the build-out and scale-up of the interoperable Third Industrial Revolution general
purpose technology platform. As the ACEEE study commented, “the data now generally
collected do not track either energy efficiency or productivity improvements driven specifically
by the Internet or by smart appliances and ICT-enabled networks.” Hence the importance of
developing new metrics and new analytical techniques to evaluate and highlight future
opportunities.
The moment the digital infrastructure evolves, real-time data, based on the metrics employed,
will begin to provide a valuable dataset on the gain in aggregate efficiencies and productivity
and the reduction in ecological footprint and marginal cost that can guide future investment
decisions. As the infrastructure becomes increasingly interoperative, creating a multitude of
cross-sector synergies—just as was the case during the First and Second Industrial Revolution—
the dataset will become increasingly robust and provide increasingly accurate information from
which to make future decisions on the continued build out and scale up of the digital
ecosystem.
COMPARING THE REFERENCE CASE AND THE RNE INNOVATION SCENARIOS
Beginning in the late 1960s and early 1970s, Royal Dutch/Shell developed a technique known as
‘‘scenario planning.’’ Rather than attempting to forecast a precise estimate of the global
business environment, the intent was to create a series of narratives—the so-called Rivers of Oil
scenarios—to help Shell’s management anticipate the eventuality (if not the timing) of future
344 Thomas Kratzert, Michael Broquist, Hervé Collignon, and Julian Vincent. 2016. The Internet of Things: A New Prosperity to European Prosperity. ATKearney. https://www.atkearney.com/documents/10192/7125406/The+Internet+of+Things-A+New+Path+to+European+Prosperity.pdf/e5ad6a65-84e5-4c92-b468-200fa4e0b7bc

Third Industrial Revolution Consulting Group
493
oil crises. The scenario building activity proved to be an effective tool. Armed with foresight,
and with an agility and internal capacity to respond to the 1981 oil glut, Shell sold off its excess
before the glut became a reality and prices collapsed.345
The critical question is how the RNE Innovation Scenario might compare with a typical or
standard projection of the region’s population and GDP, as well as anticipated energy
consumption patterns. Table 2 summarizes key energy and economic variables over the period
2015 through 2050 for five benchmark years, 2014, 2020, 2030, 2040 and 2050.
Table 2. MRDH Reference Case Projection for Key Energy and Economic Variables
Source: Netherlands Economic Observatory (July 2016).
According to 2016 statistics available from MRDH by the Netherlands Economic Observatory
(NEO), the Metropolitan Region of Rotterdam and The Hague had an estimated 2.3 million
inhabitants. Current projections show a population growth rate of 0.27 percent per year. This
means that the population will reach just over 2.5 million persons by 2050. That small increase
in the number of inhabitants, and especially a weak 1.1 percent increase in per capita GDP, is
expected to drive total GDP further, from just under €100 billion in 2014 to a somewhat larger
economy of €162 billion by 2050, an annual growth rate of 1.4 percent over that time horizon
(with both values expressed in real rather than nominal terms). At the same time, building on
energy consumption patterns provided by NEO, total energy consumption is estimated to be
355 petajoules (PJ) in 2014.346 Because of various energy policies and programs now in place,
together with expected market trends,347 the overall energy efficiency of the MRDH economy is
also expected to approach 2.1 percent per year which will offset any energy growth in
economic activity. This is a significant rate of improvement, compared to the suggested 1.4
345 The development of the Shell scenarios was led by Pierre Wack, an economist, who was the head of the business environment division of the Royal Dutch/Shell Group planning department from 1971 to 1981. For a deeper review of these early successful efforts in scenario planning, see: Wack, Pierre. 1985. Scenarios: Uncharted Waters Ahead. Harvard Business Review. No. 85516. September-October, pages 72-89. 346 One petajoules is the amount of energy contained in 6.825 million gallons of diesel fuel. A total of 335 petajoules, therefore, is about 2.4 billion gallons of diesel fuel; or in the case of MRDH, about 1,050 gallons per inhabitant. 347 For example, see the discussion of Energy Efficiency Trends and Policies in Netherlands (September 2015), at http://www.odyssee-mure.eu/publications/national-reports/energy-efficiency-netherlands.pdf
Economic Impact Metric 2014 2020 2030 2040 2050Population Growth Million Inhabitants 2.28 2.32 2.39 2.45 2.52GDP Million Real Euros2014 98,890 100,261 123,264 141,462 162,347
Total Energy Demand Reference Case Petajoules 355 352 315 292 271Reference Case Energy Expenditures Million Real Euros2014 5,796 5,820 6,188 6,446 6,715

Third Industrial Revolution Consulting Group
494
percent annual rate of growth in GDP over the next 34 years. The end result is that region’s
total energy demands in 2050 are anticipated to be about 24 percent less, at about 271 PJ. As
prices increase slightly (in real terms) through 2050, the reference case projection suggests that
total energy expenditures will increase from just about €5.8 billion in 2014 to just over €6.7
billion by 2050.
There are several questions that can be raised, including: 1) how many more energy efficiency
improvements are possible; 2) how much of the remaining energy demands can be met by an
array of renewable energy technologies (whether wind, solar photovoltaics, solar heating, and
biomass resources); and 3) how much might all of this cost? In such a case it is often helpful to
begin with a thought experiment to provide a working estimate of magnitudes to place these
questions in context.
Following the RNE Executive Seminar convened in Rotterdam and The Hague in June 2016, five
different transition pathways were explored to enable MRDH to reach a more resilient, robust,
and sustainable economy. Preliminary estimates indicated that to move MRDH into a higher
level of economic performance, the region would need to invest about one year of GDP to
upgrade the combination of existing energy technologies and local infrastructure between now
and 2050.348 Other working calculations suggested that it would make economic sense to
reduce overall energy demand from the projected demand of 271 PJ in 2050 (shown in Table 2)
down to 207 PJ—a further one-fourth reduction compared to the 2014 base year value. As
shown in Table 3, an additional energy efficiency savings of 64 PJ, with the remaining 207 PJ
energy needs to be provided through some mix of renewable energy technologies. The
question remains, however, how much of an investment might we imagine will be required to
achieve the energy efficiency and the renewable energy targets? And will they be cost-
effective?
348 In a presentation given by Jan Rotmans, the first working estimate was €80 billion for improvements to the infrastructure, with €30 billion that might support social and educational innovation efforts.

Third Industrial Revolution Consulting Group
495
Table 3. Suggested Investment Scale for the RNE Innovation Scenario
Source: A thought experiment drawn from various sources as described in the text.
Turning again to Table 3, there are two working estimates of investment per gigajoule (GJ) that
can provide an initial calculation in this regard. The first suggests an average energy efficiency
cost of €200/GJ over the 36-year time horizon from 2014 to 2050. If, for example, we assume a
3 percent interest payment over a 20-year period, that would suggest an average annual cost of
5 € cents (€ct) per kilowatt-hour (kWh). By comparison, industry paid about 8 €ct/kWh for the
electricity that it used in 2014, while households paid about twice that much. On the other
hand, the cost of photovoltaic energy systems—used here as a proxy for the full array of
potentially available renewable energy technologies—might be about 75 percent more, or
€350/GJ. Following the previous logic for energy efficiency, plus the need for additional
operating and other system expenditures, the amortized cost might run about 12 €ct/kWh.
These investment estimates are in general agreement with the published literature, and in
consultation with members of the TIR Consulting Group.
Multiplying the two cost estimates by the benchmark energy savings or production by 2050
indicates a preliminary investment requirement on the order of €85.3 billion over the 36-year
period of analysis. This is very close to the first estimate of €80 billion. The actual modelling
results suggest an energy-related investment on the order of €63 billion rather than either €80
or €85.3 billion. The reason is the modelling exercise anticipates a conservative but also a
reasonable improvement in technology cost and performance over time. The data and
experience points to a substantially lower cost by 2050 compared to the suggested costs that
might be anticipated in today’s market environment.
PJ Demand
Assumed
Investment
€/GJ
Total Investment
Billion €
Starting Energy Demand 2050 271.3 -
Suggested Efficiency Gains by 2050 64.5 200 12.9
Renewable Energy Technologies by 2050 206.9 350 72.4
Total Energy-Related Capital Costs - - 85.3

Third Industrial Revolution Consulting Group
496
We can now begin to compare the working example in Table 3 with published statistics made
available through the Fraunhofer Institute’s KomMod modelling system as shown in Table 4.
This is in addition to other published estimates provided by the TIR Consulting Group.349
Table 4. Technology Cost Assumptions for RNE Innovation Scenario
Source: Fraunhofer Institute ISE (2016). Items with asterisks are costs per kWh.350
Table 4 highlights 15 different technologies that can be used to provide a secure and reliable
energy source for a variety of home and business needs. Rooftop solar suggests a 2015
investment cost of €1,330 per kilowatt of photovoltaic capacity in 2015. With anticipated
improvements in materials and design, Fraunhofer suggests costs will decline to about
€600/kilowatt by 2050. This change over time may be sufficient to reduce delivered costs of
electricity from about €ct 12/kWh today to perhaps €ct 7/kWh by 2050.351 These costs also
349 See, for example, the extended discussion of energy resource costs in the section of the master plan entitled, Smart Energy, and also the investment costs and returns from the Sustainable Energy Finance Model, also found in this Master Plan. See also the extended discussion of energy resource costs in the Energy section of the Master Plan and also the investment costs and returns from the MRDH Sustainable Energy Finance Program, also found in this Master Plan. 350 While Fraunhofer references these costs in Euros per kilowatt (€/kW), these values can be converted into other units including €/GJ. Photovoltaics, for instance, has an initial capital cost of €1330/kW which would have an approximate value of €355/GJ. 351 It is worth noting that photovoltaics, as suggested elsewhere, may already be approaching 55 US cents per watt by 2017, or about €492 per kilowatt (at current rates of currency conversion). The results reported here are, therefore, likely conservative. That is, the costs are higher than what we might expect from the future market. Hence, the net economic benefits reported here may be understated.
2015 2030 2050
wood boilder 20 510 533 565
solid biomass chp plant 30 1,428 1,493 1,583
biogas chp plant 12.5 421 440 466
liquid biofuels chp plant 12.5 421 440 467
rooftop photovoltaics 25 1,330 921 660
free field photovoltaics 25 1,209 837 600
solar heat 25 1,286 777 396
wind power plant 20 999 1,044 1,107
heat pump air-water 20 1,243 1,243 1,243
heat pump brine-water 20 1,492 1,492 1,492
heatpump geothermal probe 20 1,467 1,467 1,467
hydro station 60 3,300 3,452 3,505
power to heat 20 238 238 238
Li-Ion battery* 15 1,558 1,006 666
thermal storage* 20 102 106 113
Investment Cost (€2015/kW)
Technology
Lifetime
(Years)

Third Industrial Revolution Consulting Group
497
include annual operating and maintenance systems necessary to maintain a reliable and safe
operation. How all of the changes in demand and supply add up over time, together with their
associated costs to deliver the necessary energy services are summarized in Table 5.352
Drawing from the energy modeling results, Table 5 shows several key variables for two different
scenarios. First, it highlights the average cost of all energy resources (€/ GJ) and the total cost of
energy (€ Million per year) for what is labeled the Reference Case 2050, or the base case
assumptions out to the year 2050. Table 5 then shows four primary indicator variables for what
is labeled RNE 2050, or the results for Roadmap Next Economy Innovation Scenario, also in the
year 2050. These last four data points are: (1) the levelized cost of energy (LCOE) in € per GJ for
both energy efficiency and renewable energy; (2) the average cost of all energy supplies in € per
GJ which can be compared to the Reference Case; (3); and finally, the total RNE energy cost in
the year 2050 expressed in € Million per year. All costs reflect constant €2014 values. Again, the
total scenario costs can be compared for the year 2050.
Table 5. Unit and Annual Cost Assumptions for RNE Innovation Scenario
Source: DEEPER Modeling System (2016).
Three things stand out from the information provided in Table 5. First, the average cost of
energy is somewhat more expensive in the RNE 2050 Innovation Scenario compared to the
Reference Case 2050 Scenario. Second, from the standpoint of the larger demand for energy
services, however, this is still a positive result. The reason is that total energy costs in RNE 2050
are significantly lower compared to the Reference Case of Business-As-Usual 2050 outcomes.
The fortunate result is, of course, made possible by the savings from the other investments in
generating a more energy efficient economy. The total energy costs in the 2050 Reference Case
are listed as €6,715 million in Table 5, so that even with the higher unit supply costs (that is, the
higher € per Gigajoule), the total energy costs of the RNE Innovation Scenario are significantly
less at €5,251 million.
352 It is perhaps worth noting that these cost reductions are comparable to the costs characterized in the Smart Energy Delta of this master plan.
Resource Cost Unit Ref Case 2050 RNE 2050
Energy Efficiency €2014/GJ n/a 9.87
Renewable Energy €2014/GJ n/a 24.18
Average Cost of Energy €2014/GJ 24.75 25.38
Total Annual Costs €2014 Mio/year 6,715 5,251

Third Industrial Revolution Consulting Group
498
Table 6 provides a more complete “scenario context” by moving away from the assumed unit
energy costs and underscoring the larger macroeconomic metrics associated with the
difference between the Reference Case and the RNE Innovation Scenario. For convenience, the
key reference case indicators in Table 2 are repeated while adding more of the details that
underpin the RNE Innovation Scenario.
Table 6. Illustrative Financial Outcomes for the MRDH RNE Innovation Scenario
Source: Netherlands Economic Observatory (2016), OECD data / projections and DEEPER Model Simulations.
First, note the row that is labeled RNE Innovation Scenario Energy Demand, and especially note
the initial energy demand of 355 Petajoules (PJ) listed in the year 2014. This is also referenced
two rows down under the listing of Existing Energy Supply. Then, as both the energy efficiency
investments kick in beginning in 2017 (not shown here), and the “Increments of New
Renewable Energy Supply” technologies begin to penetrate the market (effectively, the array of
renewable energy technologies listed in Table 4), Existing Energy Supply slowly drops to 0 GJ by
2050. The drop to zero GJ of conventional resources leads to the positive outcome of zero
energy-related carbon emissions by 2050.353 This result is driven by the scaled-up set of
investments in energy efficiency and renewable energy technologies, growing to an initial
deployment of an estimated €2,139 million by 2030, and then declining somewhat to €1,612
million by 2050. The reason for the small reduction in total investments is because the less
costly energy efficiency improvements begin to pick up more market share and penetration in
353 Although not emphasized as part of this assessment, by focusing on the economic perspective to generate
significant cost-effective investments in both energy efficiency and renewable energy technologies, the economy
clearly benefits from lower overall costs. At the same time, as the mix of clean energy technologies penetrates the
market, the need for fossil-fuel resources slowly (and cost-effectively) declines to zero. This means that the MRDH
economy will have zero energy-related carbon emissions by 2050. Hence, the more productive pattern of energy
efficiency and other clean energy investments produces a significant benefit for global climate change that should
exceed the anticipated target of the December 2015 Paris accord.
Economic Impact Metric 2014 2020 2030 2040 2050Population Growth Million Inhabitants 2.28 2.32 2.39 2.45 2.52GDP Million Real Euros2014 98,890 100,261 123,264 141,462 162,347
Total Energy Demand Reference Case Petajoules 355 352 315 292 271Reference Case Energy Expenditures Million Real Euros2014 5,796 5,820 6,188 6,446 6,715
RNE Innovation Scenario Energy Demand Petajoules 355 329 282 241 207 Energy Efficiency Gain Petajoules 0 11 33 51 64 Existing Energy Supply Petajoules 355 319 208 100 0 Increments of New Renewable Energy Supply Petajoules 0 10 74 141 207RNE Innovation Investments in Clean Energy Million Real Euros2014 0 1,563 2,139 1,858 1,612RNE Energy Innovation Energy Expenditures Million Real Euros2014 5,796 5,486 5,601 5,537 5,251

Third Industrial Revolution Consulting Group
499
2030. This requires a smaller contribution from the slightly more-expensive investments in the
renewable energy resources.
Also embedded in Table 6 are data that show a significant reduction in the MRDH overall cost of
energy services. Rather than a suggested 2050 annual cost of €6,715 million in the Reference
Case, the RNE Innovation Scenario shows a much smaller energy bill of €5,251 million—an
annual savings of €1,464 million by 2050. There is one minor caution in that this represents
what might be termed gross energy savings. A more useful metric (not explicitly shown) is the
net energy bill savings in that year. This mirrors the costs of related programs and policies, as
well as the amortized payments made for the energy efficiency upgrades which will reduce
gross savings in 2050 on the order of €330 million in that year. This point is very similar to the
discussion surrounding Figure 3 in which the average annual energy savings of €1,300 million
over the period 2014 through 2050 is actually closer to €700 million when the added program
costs together with the amortized energy efficiency upgrades are also included. At the same
time, however, there are large costs of externalities that will further extend the benefits of the
RNE Innovation Scenario. While referenced also as part of the Figure 3 discussion, these
elements are discussed in greater detail immediately below.
REVIEWING THE ECONOMIC IMPACTS OF THE RNE INNOVATION SCENARIO
The foundation for the overall economic assessment that has been completed as part of the
MRDH Roadmap Next Economy master planning process is the proprietary modeling system
known as the Dynamic Energy Efficiency Policy Evaluation Routine (DEEPER). The model,
developed by John A. “Skip” Laitner, is a compact 15-sector dynamic input-output model of a
given regional or national economy.354 The model is essentially a recipe that shows how
different sectors of the economy are expected to buy and sell to each other, and how they
might, in turn, be affected by changed investment and spending patterns. Setting up that recipe
is a first step in exploring the future job creation opportunities and other macroeconomic
354 There is nothing particularly special about this number of sectors. The problem is to provide sufficient detail to
show key negative and positive impacts while maintaining a model of manageable size. Expanding or reducing the
number of sectors will require some minor programming changes and adjustments to handle the larger matrix.

Third Industrial Revolution Consulting Group
500
impacts as the MRDH economy shifts from the Second Industrial Revolution to the higher level
of performance that is likely to be associated with the Third Industrial Revolution RNE.
Although it has only recently been updated to reflect the economic dynamics specific to MRDH,
the DEEPER model has a 26-year history of development and application. The model has been
utilized to assess the net employment impacts of proposed automobile fuel economy standards
within the United States.355 More often, it is typically employed to evaluate the macroeconomic
impacts of a variety of energy efficiency, renewable energy, and climate policies at the regional,
state, and national level. As a recent illustration, it was used in 2013 to assess the potential
outcomes and economic benefits of the Third Industrial Revolution in Nord-Pas de Calais, an
industrial region of four million people in northern France.356
The timeframe of the model for evaluating energy efficiency and renewable energy technology
policies and investments is 1990 through 2050. The period 1990 (or earlier as needed) through
2014 provides a useful historical perspective. The years 2014 and 2015 provide a period of
calibrating the model to the regional economy while the period 2016 through 2050 provides an
assessment of future trends. As it was implemented for this analysis, the model maps in the
changed spending and investment patterns based on the RNE Innovation Scenario for the
Master Plan over the period 2017 through 2050. It then compared that changed spending
pattern to the employment and value-added impacts assumed within the 2050 Reference Case.
Figure 5 below provides a diagrammatic view of the DEEPER Modeling System as it was
reflected within the dynamics of the MRDH regional economy.
355 Gearing Up: Smart Standards Create Good Jobs Building Cleaner Cars, by Chris Busch, John Laitner, Rob McCulloch, and Ivana Stosic, Washington, DC: BlueGreen Alliance, 2012. Based on this analysis and other evidence, American President Barack Obama signed into effect the proposed 54.5 mile-per-gallon fuel economy standards in August 2012. 356 Nord-Pas de Calais Third Industrial Revolution Master Plan – 2013, by Jeremy Rifkin, Benoit Prunel, Solenne Bastie, Francis Hinterman, John Laitner and Shawn Moorhead. Bethesda, MD: TIR Consulting Group LLC. 2013. Note that since the release of this master plan, and the development of hundreds of projects based on that plan Nord-Pas de Calais recently merged with the region of Picardy to form a new region of some 6 million inhabitants now referred to as Hauts-de-France.
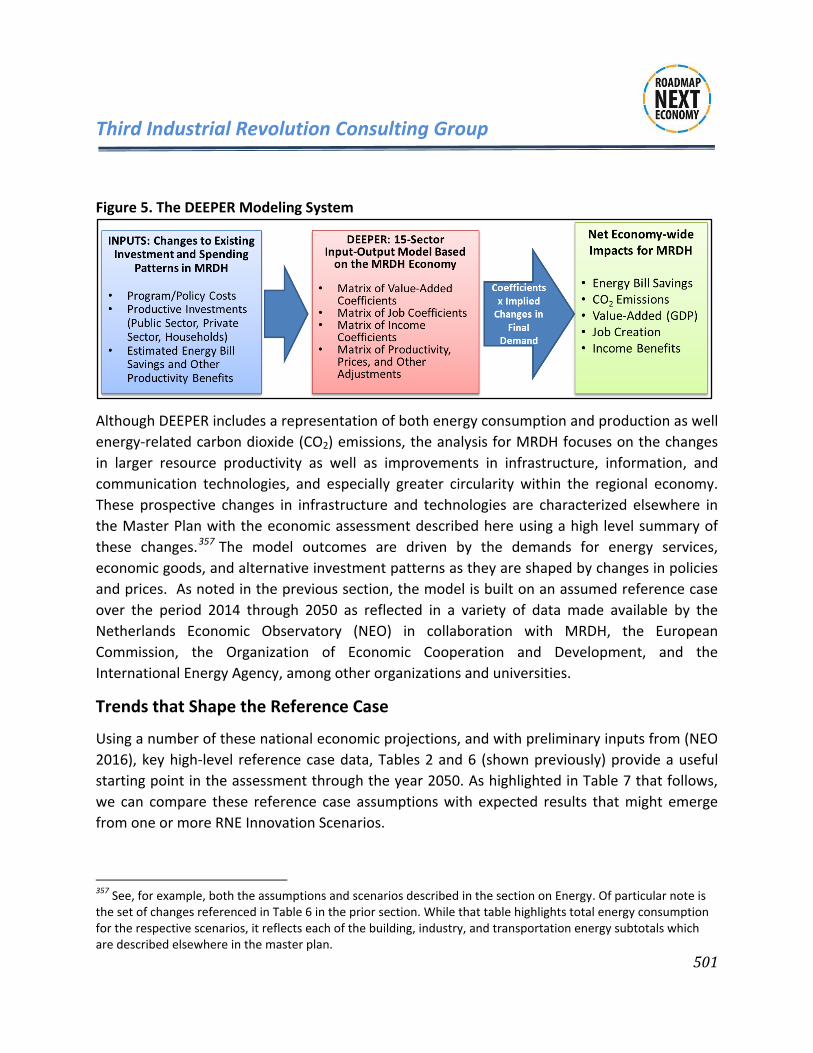
Third Industrial Revolution Consulting Group
501
Figure 5. The DEEPER Modeling System
Although DEEPER includes a representation of both energy consumption and production as well
energy-related carbon dioxide (CO2) emissions, the analysis for MRDH focuses on the changes
in larger resource productivity as well as improvements in infrastructure, information, and
communication technologies, and especially greater circularity within the regional economy.
These prospective changes in infrastructure and technologies are characterized elsewhere in
the Master Plan with the economic assessment described here using a high level summary of
these changes.357 The model outcomes are driven by the demands for energy services,
economic goods, and alternative investment patterns as they are shaped by changes in policies
and prices. As noted in the previous section, the model is built on an assumed reference case
over the period 2014 through 2050 as reflected in a variety of data made available by the
Netherlands Economic Observatory (NEO) in collaboration with MRDH, the European
Commission, the Organization of Economic Cooperation and Development, and the
International Energy Agency, among other organizations and universities.
Trends that Shape the Reference Case
Using a number of these national economic projections, and with preliminary inputs from (NEO
2016), key high-level reference case data, Tables 2 and 6 (shown previously) provide a useful
starting point in the assessment through the year 2050. As highlighted in Table 7 that follows,
we can compare these reference case assumptions with expected results that might emerge
from one or more RNE Innovation Scenarios.
357 See, for example, both the assumptions and scenarios described in the section on Energy. Of particular note is the set of changes referenced in Table 6 in the prior section. While that table highlights total energy consumption for the respective scenarios, it reflects each of the building, industry, and transportation energy subtotals which are described elsewhere in the master plan.
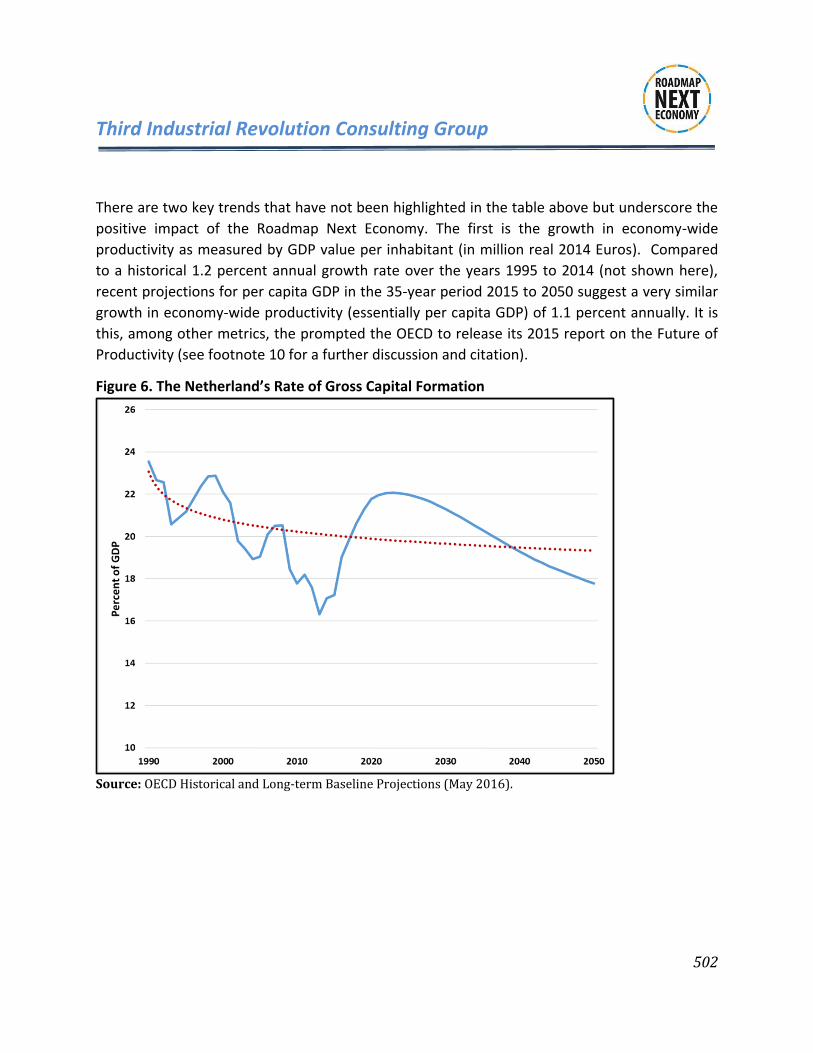
Third Industrial Revolution Consulting Group
502
There are two key trends that have not been highlighted in the table above but underscore the
positive impact of the Roadmap Next Economy. The first is the growth in economy-wide
productivity as measured by GDP value per inhabitant (in million real 2014 Euros). Compared
to a historical 1.2 percent annual growth rate over the years 1995 to 2014 (not shown here),
recent projections for per capita GDP in the 35-year period 2015 to 2050 suggest a very similar
growth in economy-wide productivity (essentially per capita GDP) of 1.1 percent annually. It is
this, among other metrics, the prompted the OECD to release its 2015 report on the Future of
Productivity (see footnote 10 for a further discussion and citation).
Figure 6. The Netherland’s Rate of Gross Capital Formation
Source: OECD Historical and Long-term Baseline Projections (May 2016).

Third Industrial Revolution Consulting Group
503
Figure 7. Netherland’s Growth in Per Capita GDP
Source: OECD Historical and Long-term Baseline Projections (May 2016).
There is a second trend that hints at a less resilient future economy, in this case because of a
declining rate of investment. Recent projections indicate that the rate of Gross Fixed Capital
Formation—in effect the growth of annual investments in the Netherlands’ total fixed assets—
is also decreasing compared to historical performance.358 Data from the OECD show that, over
the same 20-year period from 1990 to 2010, it averaged 20.9 percent of GDP (not shown here).
As suggested in the table above, the annual rate is projected to actually decrease each year,
dropping to a low of 17.8 percent by 2050. Both Figures 6 and 7 above provide a more detailed
look at these key trends.
Given this backdrop, an important question to be explored within the Third Industrial
Revolution planning process is whether the MRDH economy can remain both vigorous and
358 Fixed assets include land improvements (fences, ditches, drains, and so on); plant, machinery, and equipment
purchases; and the construction of roads, railways, and the like, including schools, offices, hospitals, private
residential dwellings, and commercial and industrial buildings. Inventories are stocks of goods held by firms to
meet temporary or unexpected fluctuations in production or sales, and "work in progress."

Third Industrial Revolution Consulting Group
504
sustainable as per capita GDP remains somewhat flat and the rate of Gross Capital Formation is
shown to possibly decrease. The question that might be helpful to pose is what mix of
purposeful effort and more productive investments might ensure the development of a more
robust economy? Part of the answer has been already provided in the discussion surrounding
Table 6.
A Side Note on the Job Creation Potential in MRDH
Table 1 in this section offered a useful context to understand the seven different
economic and employment drivers that underpin the transition to a higher economic
performance envisioned by the Roadmap Next Economy. At this point, however, it is
useful to draw on other segments in the master plan to offer concrete examples of how
RNE-related investments might positively impact future employment gains. For
example, Germany’s vast experience in retrofitting buildings provides a useful insight
for the job creating potential in MRDH as it embarks on its own regional retrofitting
projects. To date, as reported in the Buildings as Nodes section of the master plan,
342,000 apartments have been retrofitted, creating or saving more than 141,000 jobs
in Germany.
Looking across more of the European economy, a 2011 analysis by the Buildings
Performance Institute Europe (BPIE) suggested a potential energy savings in EU
buildings ranging from 32 to 68 percent by 2050, depending on the scope and scale of
upgrade investments. The investment cost might range from €343 to €937 billion, with
a net consumer bill savings from €160 to €381 billion over the period 2012 through
2050. The combination of investments and net energy bill savings might drive a net
annual employment gain of 500,000 to 1.1 million jobs.
The Stanford study by Jacobson et al., referenced elsewhere in this assessment, noted
that the Netherlands could meet 100 percent of its energy needs by renewable
energies alone. The investment to drive that transition would lead to roughly 199,500
net jobs to build capacity, and also to operate and maintain the entire energy system in
the Netherlands. Although not specifically examined, the lower costs of energy
associated with a more productive clean energy future would further drive future
employment opportunities. This is consistent with Figure 1 discussion documenting the
greater labor intensities associated with almost all other sectors of the economy
compared to the jobs supported by conventional energy expenditures.
A McKinsey study projects that savings in materials, recycling, and restoration, will
likely exceed $1 trillion by 2025 in the global economy while increasing productivity,
reducing fixed and marginal costs. This, in turn, will lead to the creation of new jobs as
well as lowering the ecological footprint for MRDH.

Third Industrial Revolution Consulting Group
505
Understanding the RNE Innovation Scenario
A working analysis based on data published by the International Energy Agency (IEA) suggests
that the Netherlands converts only 18 percent of the available energy into useful work.359
Within the Dutch economy, however, MRDH may be underperforming at an efficiency that is on
par for the world as a whole, about 13.5 percent. This is less than for the United States (14.4
percent) and for OECD nations more broadly (16.2 percent). As already reported, that means
the MRDH economy wastes more than 86 percent of the energy consumed in the economic
process. The silver lining in the Table 2 data previously referenced, however, is that the energy
intensity within MRDH is projected to decline at about 2.1 percent per year through 2050. The
question will again be posed as to what mix of investments might accelerate the rate of energy
efficiency improvements as well as the movement toward an energy production system that is
anchored by an array of renewable energy technologies. If done properly, a higher level of
energy efficiency, together with the development of cost-effective renewable energy systems,
is likely to result in a downward pressure on the price of remaining uses of energy which would
provide further net benefits to the larger economy.
Table 7 integrates the scenario cost data found in Table 6 and elsewhere. It then lays out the
larger economic benefits that might be expected to emerge with the RNE Innovation Scenario,
especially as interactive discussion helps shape a greater understanding of what initiatives may
contribute to a more productive Master Plan.
Table 7. Energy Costs and Impacts from the RNE Innovation Scenario
Source: Output from the DEEPER Modeling Systems as described in text manuscript that follows.
Two things might be noticed immediately in Table 7. First, the rate of energy efficiency
accelerates to reduce consumption by 23.8 percent in the period 2016 through 2050. This is in
359 Here useful work refers to the use of energy to transform materials and other resources into the desired mix of
goods and services within the local economy.
Economic Impact Metric 2016 2020 2030 2040 2050Average
2016-2050Efficiency Gain Savings from Ref 0.0% 3.1% 10.6% 17.4% 23.8% 13.7%
Program Cost Million Real Euros 5 115 137 104 78 111Technology Investments Million Real Euros 0 1,563 2,139 1,858 1,612 1,863Net Energy Bill Savings Million Real Euros 0 454 587 909 1,464 769
Energy Bill Savings Employment Net Jobs 0 28,600 33,400 28,500 26,400 29,100Productivity Employment Net Jobs 0 -14,300 10,500 54,000 105,600 31,800Total Employment Gains Net Jobs 0 14,300 43,900 82,500 132,000 60,900Net GDP Impacts Million Real Euros 0 904 2,785 5,229 8,365 3,862

Third Industrial Revolution Consulting Group
506
addition to a comparable reduction in the already energy-efficient Reference Case scenario (as
shown in Table 6, moving from 355 PJ in 2014 to 271 PJ by 2050). Although not shown here or
in Table 6, the presumed investment and more productive build-out of the MRDH economy will
clearly increase estimates of gross capital fixed formation. Because of the greater level of cost
savings in the RNE Innovation Scenario (in effect, the added 23.8 percent savings), this will
stimulate both a more vigorous level of GDP per job as well as a greater number of jobs.
Consistent with the discussion surrounding Figure 2, the greater increase in energy productivity
by 2050 lifts the MRDH economy to a higher level of performance so that it is about 5 percent
bigger than otherwise anticipated in the Reference Case. There is also a net gain of
employment—an estimated 26,400 net jobs per year by 2050 resulting from the upgrade of the
nation’s energy infrastructure. These jobs are complemented by another 105,600 net jobs
made possible by further non-energy and larger productivity benefits that will be stimulated by
the RNE Innovation Scenario. The “average annual net gain” in jobs over the analytical time
horizon is 60,900.360 Another way to look at these job estimates is to imagine what might
happen if the MRDH scenario scaled to an equivalent success within the entirety of the
European community. In that case, a five percent average increase in current employment
would imply a net gain of about 9 million jobs within the EU as a whole (including the 60,900
jobs within MRDH).
While not a primary focus of this economic assessment, it is worth integrating a short overview
of the complementary relationship between changes in energy consumption patterns that
might also bring about an array of social, economic, health, and climate benefits. Here, we
again cite two key references together with the reported results from the more conventional
economic assessment of energy-related costs and benefits. The first draws on the combination
of perspectives offered by Ayres and Warr (2009) and Kümmel (2011). The second highlights
the findings in the assessment published earlier this year by Jacobsen et al. (2016), 100% Clean
and Renewable Wind, Water, and Sunlight (WWS). With several caveats, but following the logic
of net benefits that might follow from both Figure 2 and Figure 3, the table below explores this
relationship.
360 One item of note in Table 7 is both the net positive job gains from energy-related investments and savings in
the earlier years through 2020. At the same time, as the economy shifts resources from existing spending patterns
into the more efficient use of energy, there is net temporary loss of jobs in other sectors. This reflects a period of
adjustment that is overcome as both energy other resource gains result in a total net positive gain for MRDH. One
further note is that because of rounding to the nearest 100 jobs, it appears the productivity jobs are exactly one-
half of energy-related jobs. But that result is purely coincidental as will be seen for totals in other years.

Third Industrial Revolution Consulting Group
507
Table 8. The Array of Net Benefits (in Million Euros)
Source: Results as described in the text are in constant 2013 Euros.
Table 8 shows the expanded categories of three sets of benefits as they are created through
productive investment, and as those benefits are then properly discounted over time and taken
as an annual average over the years 2016 through 2050. With a net present value taken over
those 34 years at a 5 percent discount rate, the RNE Innovation Scenario might show a net
annual benefit of €302 million from reduced energy expenditures alone. That is, after
borrowing funds, and paying the finance costs over time (as estimated here), a €234 million
investment might return an energy savings of €302 million. This might result in a discounted
benefit cost ratio of 1.29. That is a positive result, but the story doesn’t necessarily end there.
Beyond energy savings, the flow of investments catalyzes a more dynamic economy so that
GDP is expanded another €1,032 million net of the energy savings. This follows from Ayres and
Warr (2009) and Kümmel (2011) as previously referenced, in that the reduced level of wasted
energy and other resources adds a greater level of economic productivity beyond the pure
energy savings alone. Finally, if we adapt the findings of Jacobsen et al. (2016), also discounted
over time and averaged over the same 34-year period, we might gauge a further annual gain of
€1,660 million. So what began as a pure energy savings might now be seen as a larger return
from a higher level of positive energy services.361
361 We note an important caveat here in that the three categories of net benefits are generated from different references that may not fully compare or complement each in either scale or scope, or in a consistent methodology. At the same time, the magnitudes in Table 8 offer insights into the extended benefits that logically follow from a more productive infrastructure. The findings are consistent with the IEA report on multiple benefits of energy efficiency improvements as suggested by Campbell et al. (2014).
Annualized Net Benefits Reference Case
Net Energy Savings 302
Productivity Benefits 1,032
Avoided Externalities 1,660

Third Industrial Revolution Consulting Group
508
Immediate Next Steps
Of particular note in Tables 7 and 8, however, is that these results are only indicative of a
potential RNE Innovation Scenario. At the same time, we have already highlighted three
additional elements which should be brought forward into any future discussion of possible
outcomes. The initial element is an immediate large-scale investment in cost-effective upgrades
of the nation’s building stock. The intent here is two-fold. The first is to send a signal about the
imperative of a more energy-efficient and a more productive economy. Building upgrades are
among the best understood of those near-term opportunities. The review of investment
opportunities in the Finance section of the RNE provides a variety of self-funding options for the
MRDH building stock, including both rooftop solar energy and energy efficiency upgrades. See,
for example, the background discussion in the Finance section of the RNE which implies a
reasonably profitable €12.6 billion investment in the regional buildings over the next ten years
or so. The immediate lessons and insights from the first wave of infrastructure upgrades will
help shape a second wave of activity around developing a more circular economy and a
digitally-driven transportation and logistics infrastructure. The second intent of this initiative is
to provide the means for collecting project data to underpin a new set of metrics. Both the data
and the resulting metrics can guide next steps and aid in the assessment of how such projects
might contribute to the larger social, economic, and environmental well-being of Rotterdam,
The Hague, and the other municipalities within MRDH—beyond the initial energy-related
investments and returns.
It is critical, then, to develop a policy database and new analytical techniques that can inform
the region about the potential for more positive outcomes beyond an energy-led investment
strategy. While standard economic models and policy assessment tools have generally been
able to track and evaluate many of the Second Industrial Revolution economic trends, they are
not equipped to fully explore the potential outcomes of RNE-like innovation scenarios.
The working groups and the TIR Consulting Group agreed that it was essential to establish a
new set of metrics to allow MRDH to begin tracking real-time data at the onset of deployment
of the RNE infrastructure. The data would provide the necessary information for documenting
immediate project returns and for assessing future aggregate efficiencies, productivity gains,
reductions in ecological footprint and marginal costs brought on by the interconnectivity of the
digital platform. These are in addition to documenting the more traditional metrics including
reductions in energy consumption and greenhouse gas emissions as well as positive changes in
jobs, investments, total factor productivity and GDP. As MRDH tracks this data in real-time, it
will be able to make critical projections on future social, economic and environmental well-

Third Industrial Revolution Consulting Group
509
being, based on the experience and insights gained at each step of the deployment. A particular
focus might be documenting the costs and benefits of an interoperational digital infrastructure.
When businesses can plug into an increasingly matured digital infrastructure comprised of the
digitalized Communication Internet, digitalized Renewable Energy Internet, and digitalized
Transportation and Logistics Internet, atop an Internet of Things platform, they will be able to
develop and use near-zero marginal cost renewable energy in every single conversion at each
stage of their value chains. This will facilitate the smart managing, powering, and moving of
economic activity. The leap in aggregate efficiency and productivity and reduction in ecological
footprint and marginal cost brought on by the increasing integration and interoperability of the
digital Third Industrial Revolution infrastructure marks both a qualitative and quantitative leap
in the economic performance of industries across MRDH.
The active tracking of Roadmap Next Economy metrics – again, including aggregate efficiency,
productivity, reductions in ecological footprint, and marginal cost – will enable MRDH to make
appropriate adjustments so that the goals are more likely achieved over the successive years.
The value of this second step can be seen by again reviewing the macroeconomic returns
highlighted in Table 7. The benefits are clearly positive but they yield on only a first indication of
the larger potential gains that might accrue to the region. Among prospective changes that are
not fully captured in this assessment are the very real emergence of new markets catalyzed by
new fintech models, new digital technologies, new smart industries, and greater circularity.
Other effects include the buildup of greater local capacity to supply more of goods and services
within MRDH. A more informative assessment can be provided by continually updating the
collected Big Data as the Roadmap Next Economy infrastructure is deployed and made
increasingly interoperable in subsequent years.
A SHORT NARRATIVE ON THE DEEPER MODELING SYSTEM AS A POLICY ASSESSMENT TOOL
Although the DEEPER Model is not a general equilibrium model, it does provide sufficient
accounting detail to match import-adjusted changes in investments and expenditures within
one sector of the economy and balance them against changes in other sectors.362 More to the
362 When both equilibrium and dynamic input-output models use the same technology, investment, and cost
assumptions, both sets of models should generate a reasonably comparable set of outcomes. For a diagnostic

Third Industrial Revolution Consulting Group
510
point of this exercise, the model can specifically explore the energy and non-energy
productivity benefits from what is now characterized as a RNE Innovation Scenario—especially
as it is transformed into a pro-active Third Industrial Revolution Roadmap Next Economy.
One critical assumption that underpins the core result of the DEEPER analysis is that any
productive investment or spending—whether in energy efficiency, renewable energy, and/or a
more dynamic infrastructure that pays for itself over a reasonably short period of time—will
generate a net reduction in the cost of energy services (as well as a lower cost of other resources
which are needed to maintain the material well-being of the MRDH regional economy). That net
reduction of energy and resource expenditures can, then, be spent for the purchase of other
goods and services. We noted in the discussion surrounding Figure 1, the redirecting of €1
million in value-added spending away from energy suggests there may be roughly a net gain of
about 7.1 jobs. Depending on the many sectoral interactions, as well as the complete
assessment of the many effects summarized and discussed in Table 1 of this assessment, the
net gain in jobs may widen or close as the changed pattern of spending works its way through
the model and as shifts in labor productivity change the number of jobs needed in each sector
over a period of time.363
Once the mix of positive and negative changes in spending and investments has been
established for the RNE Innovation Scenarios, the net spending changes in each year of the
model are converted into sector-specific changes in final demand. Then, following the pattern
highlighted in the diagram of the DEEPER Modeling System, the full array of changes will drive a
dynamic input-output analysis according to the following predictive model:
X = (I-A)-1 * Y
where:
X = total industry output by a given sector of the economy
assessment of this conclusion, see, “Tripling the Nation’s Clean Energy Technologies: A Case Study in Evaluating the
Performance of Energy Policy Models,” Donald A. Hanson and John A. “Skip” Laitner, Proceedings of the 2005
ACEEE Summer Study on Energy Efficiency in Industry, American Council for an Energy Efficient Economy,
Washington, DC, July 2005.
363 Note that unlike many policy models, DEEPER also captures trends in labor productivity. That means the
number of jobs needed per million Euros of revenue will decline over time. For example, if we assume a 1.5
percent labor productivity improvement over the 36-year period from 2014 through 2050, 15.4 construction jobs
supported by spending of 1 million Euros today may support only 9 jobs by the year 2050. The calculation is 16
/1.015(2050-2014) = 9 jobs (in rounded terms).

Third Industrial Revolution Consulting Group
511
I = an identity matrix consisting of a series of 0’s and 1’s in a row and column format for each
sector (with the 1’s organized along the diagonal of the matrix)
A = the matrix of production coefficients for each row and column within the matrix (in effect,
how each column buys products from other sectors and how each row sells products to all
other sectors)
Y = final demand, which is a column of net changes in spending by each sector as that spending
pattern is affected by the policy case assumptions (changes in energy prices, energy
consumption, investments, etc.)
This set of relationships can also be interpreted as
∆X = (I-A)-1 * ∆Y.
A change in total sector output equals the expression (I-A)-1 times a change in final demand for
each sector. 364 Employment quantities are adjusted annually according to exogenous
assumptions about labor productivity. From a more operational standpoint, the
macroeconomic module of the DEEPER Model traces how each set of changes in spending will
work or ripple its way through the regional economy in each year of the assessment period.
The end result is a net change in jobs, income, and GDP (or value-added).
For a review of how an Input--Output framework might be integrated into other kinds of
modeling activities, see Hanson and Laitner (2009). While the DEEPER Model is not an
equilibrium model, as explained previously, we borrow some key concepts of mapping
technology representation for DEEPER, and use the general scheme outlined in Hanson and
Laitner (2009). 365 Among other things, this includes an economic accounting to ensure
resources are sufficiently available to meet the expected consumer and other final demands
reflected in different policy scenarios.
364 Perhaps one way to understand the notation (I-A)-1 is to think of this as the positive or negative impact multiplier depending on whether the change in spending is positive or negative for a given sector within a given year. 365 “Input-Output Equations Embedded within Climate and Energy Policy Analysis Models,” by Donald A. Hanson and John A. “Skip” Laitner, in Sangwon Suh, Editor, Input-Output Economics for Industrial Ecology. Dordrecht, Netherlands: Springer, 2009. See also, “A Pragmatic CGE Model for Assessing the Influence of Model Structure and Assumptions in Climate Change Policy Analysis,” by Stephen Bernow, Alexandr Rudkevich, Michael Ruth, and Irene Peters. Boston, MA: Tellus Institute, 1998.