Embed Size (px)
Citation preview
Fred Phillips Consulting, LLC
Landscape Architecture Ecological Restoration Wildlife Biology Land Management
Flagstaff Office 401 South Leroux Street Flagstaff, AZ 86001 Office (928) 773-1530 Fax: (928) 774-4166
Yuma Office 180 W. 1st St., Suite E Yuma, AZ 85364 Office: (928) 783-9961 Fax: (928) 783-9962
www.fredphillipsconsulting.com

Bird and Butterfly Recovery at the Yuma East Wetlands Heidi Trathnigg FPC 2015
©Fred Phillips Consulting, LLC
Yuma East Wetlands Restoration • 936 acres
proposed
• Goal to restore wildlife habitat
• Evaluate wildlife recovery – Birds – Invertebrates – Mammals – Amphibians &
Reptiles – Fish
©Fred Phillips Consulting, LLC

Baseline Research (2007-2008) Birds • Reference sites had significantly higher richness and
abundance • No difference between immature restored and control sites
Invertebrates • Ag and reference sites had highest richness • Some butterfly species only found in reference and mature
riparian habitats • Large scope not enough detail
Herpetofauna and Mammals • Need more time to re-colonize site
©Fred Phillips Consulting, LLC

Rational and Hypothesis
• Bird Community – Quickly re-colonize restored areas
(Passell 2000, Gardali et al. 2006)
– Habitats have matured
• Butterfly Community – Quickly re-colonize restored areas – Good indicators of herbaceous
community health (Scoble 1992) – Easy to identify quickly
Hypothesis: Bird and butterfly richness and abundance will be greater in restored verses control sites.
©Fred Phillips Consulting, LLC

Bird Surveys • Intensive Area Searches (Great Basin Bird Observatory 2010
and Bart et al. 2010)
o 10 Riparian Plots o 1-3 h/plot o 6 surveys during April-
June
• Variable circular plots (Reynolds et al. 1980)
o 16 Marsh Plots o 10 m increment bands up
to 100 m o Marsh bird monitoring
protocol

Butterfly Surveys • 10 transects through
riparian plots
• Surveyed 4 times (April, May, June, & Sept.)
• Timed searches (1 min/ 20m), not including pursuit time
• Behavior was recorded
©Fred Phillips Consulting, LLC

Habitat and Nectar Resource Sampling
• Habitat Characteristics – 1 time per plot (July and September)
– 30 plots in riparian and 20 plots in wetland
– TVV and cover (3m radius circle) recorded
– Butterfly host plant frequency and abundance; bird habitat
• Nectar Resources – 4 times (after butterfly sampling)
– 3m diameter plots every 10m along transect
– Tally blooming flowers by species
– Number of inflorescence tallied
©Fred Phillips Consulting, LLC

©Fred Phillips Consulting, LLC

©Fred Phillips Consulting, LLC

Bird Results • 72 resident and migrating species detected in
riparian and wetland sites Riparian – 15 resident species in restored – 9 resident species in control Wetland – 14 species in restored – 10 species in control
©Fred Phillips Consulting, LLC

Resident Riparian Birds
©Fred Phillips Consulting, LLC
Genus species Common Name
Total Number Detected Density (#/hectare)
Restored
Riparian
Control
Riparian
Restored
Riparian
Control
Riparian
Pipilo aberti Abert's Towhee 10 0* 1.03 0.00
Calypte anna Anna's hummingbird 2 0* 0.21 0.00
Myiarchus cinerascens Ash-throated flycatcher 0* 2 0.00 0.26
Vireo bellii Bell's vireo 1 0 0.10 0.00
Polioptila melanura Black-tailed gnatcatcher 2 3 0.21 0.39
Geothlypis trichas Common yellowthroat 1 0* 0.10 0.00
Toxostoma crissale Crissal thrasher 1 0* 0.10 0.00
Callipepla gambelii Gambel's quail 9 0* 0.93 0.00
Melanerpes uropygialis Gila woodpecker 3 0* 0.31 0.00
Quiscalus mexicanus Great-tailed grackle 2 0 0.21 0.00
Carpodacus mexicanus House finch 11 2 1.14 0.26
Picoides scalaris Ladder-backed woodpecker 2 0* 0.21 0.00
Chordeiles acutipennis Lesser nighthawk 0* 2 0.00 0.26
Zenaida macroura Mourning Dove 26 6 2.69 0.78
Mimus polyglottos Northern mockingbird 3 0 0.31 0.00
Melospiza melodia Song sparrow 0* 1 0.00 0.13
Auriparus flaviceps Verdin 36 6 3.72 0.78
Tyrannus verticalis Western kingbird 0* 2 0.00 0.26
Zenaida asiatica White winged dove 4 5 0.41 0.65

Resident Riparian Birds
©Fred Phillips Consulting, LLC
t= 1.283, p=0.386
• Four times higher total resident bird density in restored vs. control, not significant
• No difference in species richness

Riparian Vegetation
• Higher species diversity in restored verses control sites
• Higher % herbaceous cover in restored verses control, not significant
• No correlations with resident riparian birds and vegetation characteristics
©Fred Phillips Consulting, LLC
Average Values Restored Control t p-
value
TVV 0.183 0.200 -0.239 0.817
Species Diversity (H') 1.383 0.658 2.822 0.022*
% Herb Cover 18 0 2.5 0.293
% Shrub Cover 14 16 12 0.744
% Mid-canopy 18 32 12 0.429

Marsh Birds
©Fred Phillips Consulting, LLC
Genus species Common Name
Total Number Detected
Restored Wetland Control
Wetland
Fulica americana American coot 6 39
Himantopus mexicanus Black-necked Stilt 4 0
Aythya valisineria Canvasback 0 1
Anas cyanoptera Cinnamon teal 12 0
Rallus longirostris Clapper rail 6 0
Gallinula chloropus Common Moorhen 0 6
Geothlypis trichas Common yellowthroat 12 8
Ardea herodias Great blue heron 1 1
Charadrius vociferus Killdeer 10 0
Ixobrychus exilis Least bittern 1 1
Cistothorus palustris Marsh wren 22 4
Podilymbus podiceps Pied-billed grebe 0 2
Agelaius phoeniceus Red-winged blackbird 1 0
Egretta thula Snowy egret 3 0
Melospiza melodia Song Sparrow 10 0
Porzana carolina Sora 1 3
Xanthocephalus xanthocephalus Yellow-headed blackbird 54 19

Marsh Birds
©Fred Phillips Consulting, LLC
T=3.073, p=0.004 T=3.496, p=0.001
• Two-fold higher total resident bird richness in restored wetlands vs. control
• Three-fold higher wetland bird abundance in restored vs. control

Marsh Vegetation • Higher % herbaceous cover in
restored verses control
• Higher % open water in control verses restored
• No correlations with marsh birds and vegetation characteristics
©Fred Phillips Consulting, LLC
Average Values Restored Control t p-value
Species Diversity (H') 1.521 1.231 1.151 0.269
% Herb Cover 28 4 4.59 0.001*
% Shrub Cover 42 60 -1.489 0.159
% Open Water 2 10 -2.292 0.038*
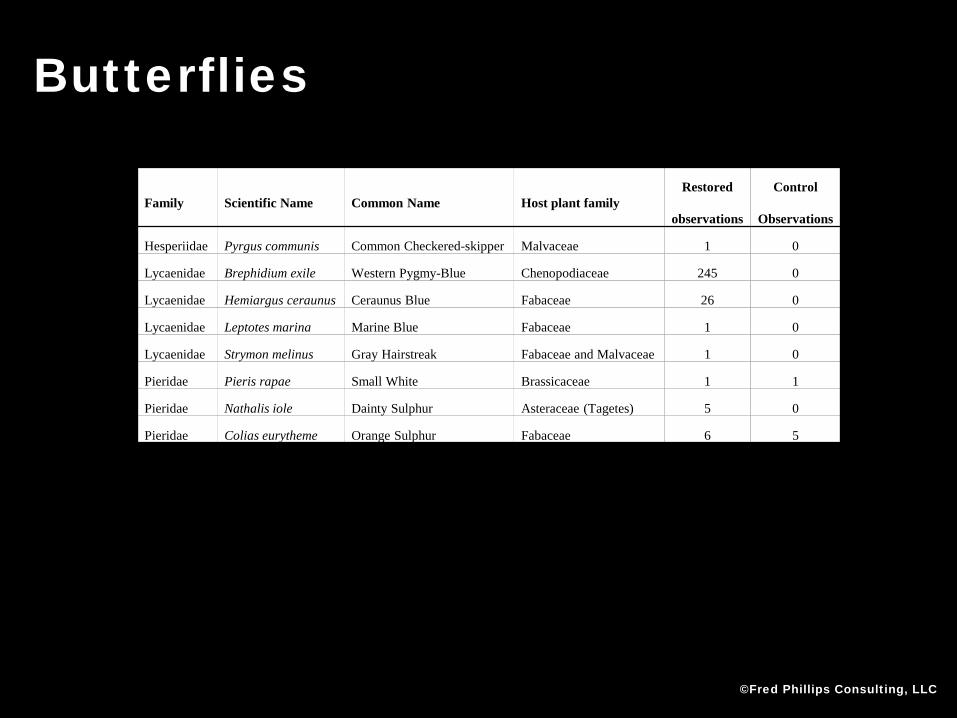
Butterflies
©Fred Phillips Consulting, LLC
Family Scientific Name Common Name Host plant family Restored
observations
Control
Observations
Hesperiidae Pyrgus communis Common Checkered-skipper Malvaceae 1 0
Lycaenidae Brephidium exile Western Pygmy-Blue Chenopodiaceae 245 0
Lycaenidae Hemiargus ceraunus Ceraunus Blue Fabaceae 26 0
Lycaenidae Leptotes marina Marine Blue Fabaceae 1 0
Lycaenidae Strymon melinus Gray Hairstreak Fabaceae and Malvaceae 1 0
Pieridae Pieris rapae Small White Brassicaceae 1 1
Pieridae Nathalis iole Dainty Sulphur Asteraceae (Tagetes) 5 0
Pieridae Colias eurytheme Orange Sulphur Fabaceae 6 5

Butterflies
©Fred Phillips Consulting, LLC
T=5.837, p<0.0001
• 48 times higher abundance in restored verses control sites • 4 times higher richness in restored vs. control

Nectar Resource
©Fred Phillips Consulting, LLC
Common Name Scientific Name Restored Riparian Control Riparian
TBPA TI TBPA TI
Desert marigold Baileya multiradiata 3 3 - -
Lambsquarters Chenopodium album 6 2 - -
Canadian horseweed Conyza canadensis 12 78 - -
Salt heliotrope Heliotropium curassavicum 160 1399 - -
White sweetclover Melilotus alba 56 464 - -
Yellow sweetclover Melilotus officinalis 19 144 - -
Mexican evening primrose Oenothera mexicana 690 1529 - -
Saltmarsh fleabane Pluchea odorata 5 120 - -
Western sea-purslane Sesuvium verrucosum 34 2710 - -
Silverleaf nightshade Solanum elaeagnifolium 1 2 - -
Common sowthistle Sonchus oleraceus 12 105 - -
Violet Viola sp. 1 7 - -
Baccharis Baccharis spp. 14 569 - -
Arrowweed Pluchea sericea 82 552 190 1972
Sandbar willow Salix exigua 101 226 - -
Saltcedar Tamarix spp. 11 834 178 13636
Honey mesquite Prosopis glandulosa 35 336 1 10
Screwbean mesquite Propsopis pubescens 44 403 5 39
Goodding willow Salix gooddingii 1 10 - -
TBPA= total blooming plant abundance TI= total inflorescence

Host Plant and Nectar Resource
• No difference in host plant abundance or frequency in restored vs control
• Host plants adjacent to riparian plots: agriculture and upland
• Four times higher flowering species richness (t=5.386, p=0.002) and abundance (t=1.334, p=0.065) in restored verses control
• 1.6 times higher number of inflorescences in control vs. restored- saltcedar
©Fred Phillips Consulting, LLC
Variable Pearson Correlation p-value
Flowering species richness 0.611 0.061
Flowering species abundance 0.639 0.047
Vegetation species diversity 0.581 0.078
% herbaceous vegetation 0.621 0.055

Discussion • Structural complexity of native riparian and wetland
communities can have positive effect on birds and butterflies
• Diverse native understory provides – Competition to invasive vegetation
– Nectar resources and host plants for butterflies
– Habitat complexity for bird and other wildlife
• Flood irrigation may help butterflies • May increase nectar production
• Host plant production
• Drinking water source
©Fred Phillips Consulting, LLC

Discussion • No riparian obligate butterfly species present (Fatal metalmark, Viceroy,
and Moarning cloak)
– Indicates need to connect source populations with habitat islands
– Potential for introduction
• Four resident riparian obligate birds present. Prefer structural complexity. – Gila woodpecker – Bell’s vireo – Abert’s towhee – Crissal thrasher
• Not all riparian obligate species present during study. Some migrants others have been detected since- blue grosbeak and yellow-billed cuckoo- sites were immature
• Endangered Yuma clapper rail, least bittern and soras resided in restored wetland
©Fred Phillips Consulting, LLC

Management Implications
• Need to plant native understory in restoration projects
• The site will support riparian obligate butterfly re-introductions
• Native understory help provide food source for birds and other wildlife
• Understory supports the largest known population of Yuma hispid cotton rat on the LCR
©Fred Phillips Consulting, LLC

QUECHAN INDIAN TRIBE CITY OF YUMA YUMA CROSSING NATIONAL HERITAGE AREA US BUREAU OF RECLAMATION ARIZONA WATER PROTECTION FUND NATIONAL PARK SERVICE NATIIONAL FISH AND WILDLIFE FOUNDATION NORTH AMERICAN WATERFOWL CONSERVATION ASSOCIATION SONORAN JOINT VENTURE ENVIRONMENTAL DEFENSE WALTON FAMILY FOUNDATION ARIZONA GAME AND FISH DEPARTMENT BUREAU OF LAND MANAGEMENT US FISH AND WILDLIFE SERVICE YUMA FARM BUREAU ARIZONA WESTERN COLLEGE CAL STATE LOS ANGELOS UNIVESRITY OF REDLANDS NORTHERN ARIZONA UNIVSERITY US BORDER PATROL JOHN MCAIN YUMA COUNTY BILL OGRAM HEADSTREAM FAMILY MCKVEY FAMILY Yuma Clean and Beautiful Commission BOY SCOUTS OF AMERICA
FRED PHILLIPS CONSULTING, LLC (Lead consultant) PG&E CONSTRUCTION TAYLORBIRD ENTERPRISES STEVENS ECOLOGICAL CONSULTING SHEPPARD WESNITZER ENGINEERING Natural Channel Design E JOE HUDSON CONSULTING ECOSYSTEMS MANAGEMENT INT. JSA Inc. REVEGETATION AND WILDLIFE MANAGEMENT CENTER SOUTHWEST RECYCLING SOUTHWEST RECYCLING DOWNRIVER PRODUCTIONS Water tech ag supply El Pato nursery Lin Piest
Project Contra
Copyright 2006 Yuma Crossing National Heritage Area Photography by Fred Phillips, Eric Krouse, Sam Walton and Matt Fahey
Power Point Design and Layout Fred Phillips Consulting LLC
Acknowledgements YUMA ROD AND GUN CLUB MATTHEW SPRIGGS KEVIN EATHERLY TINA CLARK ALI BEICHLER HERB GUENTHER THE YARD DOGS ROAD SHOW KEITH SECOLA AND THE WILD JAVALINS THUNDERBIRD VLA PROJECT 696 PROJECT DRIFTWOOD
©Fred Phillips Consulting, LLC
©Fred Phillips Consulting, LLC
fredphillipsconsultin