Embed Size (px)
Citation preview
The Time Traveller Scenarios: SOUTH AFRICA’S NEXT 10 YEARS
Produced by the

SOUTH AFRICA’S GROWTH OUTLOOK Expect low growth levels driven by hostile domestic policy and a difficult global growth environment
-2
-1
0
1
2
3
4
5
6
2000 2001 2002 2003 2004 2004 2006 2007 2008 2009 2010 2011 2012 2013 2014 2015 2016 2017 2018 2019
South Africa’s GDP growth

GLOBAL GROWTH Global growth is set to average just over 3% in 2015 driven in large part by growth in developing economies
0
1
2
3
4
5
6
2012 2013 2014 2015 2016 2017
Global economic outlook World High income Developing economies
0
10
20
30
40
50
60
Share of global PP adj GDP by region Share of global GDP (PPP)
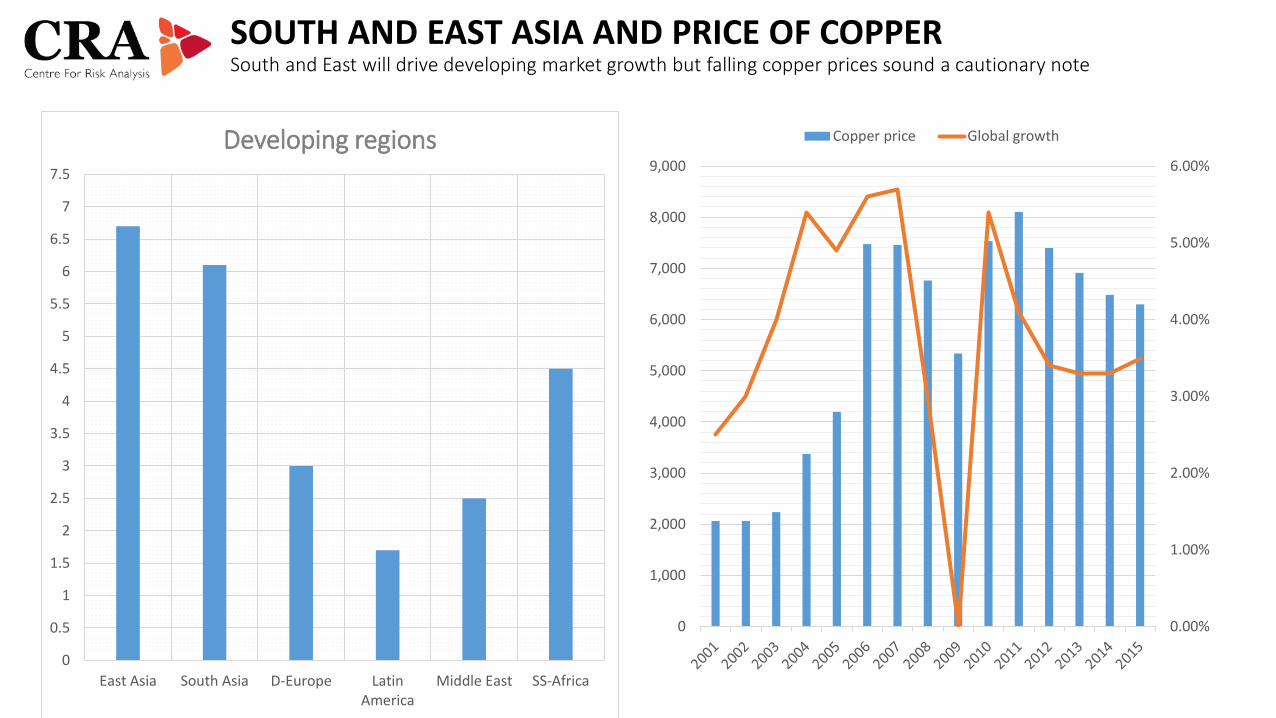
SOUTH AND EAST ASIA AND PRICE OF COPPER South and East will drive developing market growth but falling copper prices sound a cautionary note
0.00%
1.00%
2.00%
3.00%
4.00%
5.00%
6.00%
0
1,000
2,000
3,000
4,000
5,000
6,000
7,000
8,000
9,000
Copper price Global growth
0
0.5
1
1.5
2
2.5
3
3.5
4
4.5
5
5.5
6
6.5
7
7.5
East Asia South Asia D-Europe LatinAmerica
Middle East SS-Africa
Developing regions

CHINA, THE EU, AND SA’S EXPORTS World Bank forecasts anticipate China slowing with significant implications for South Africa’s exports
-2
-1
0
1
2
3
4
5
6
7
8
9
China Euro-area
Growth rates key economies
2012 2013 2014 2015
0 50 100 150 200 250
C H I N A / H K / J
E U
U S A
A F R I C A
R E S T O F T H E W O R L D
SOUTH AFRICA’S EXPORT PARTNERS (RBN)

THE RAND The outlook is for further currency weakness
1.08
3.54
6.4
6.3 6.
8 7
8.2 8.4
7.3
7.2
8.2
9.6
11.5
12.5
15
20
1 9 8 2 1 9 9 4 2 0 0 4 2 0 0 5 2 0 0 6 2 0 0 7 2 0 0 8 2 0 0 9 2 0 1 0 2 0 1 1 2 0 1 2 2 0 1 3 2 0 1 4 2 0 1 5 2 0 2 0 2 0 2 4
THE RAND
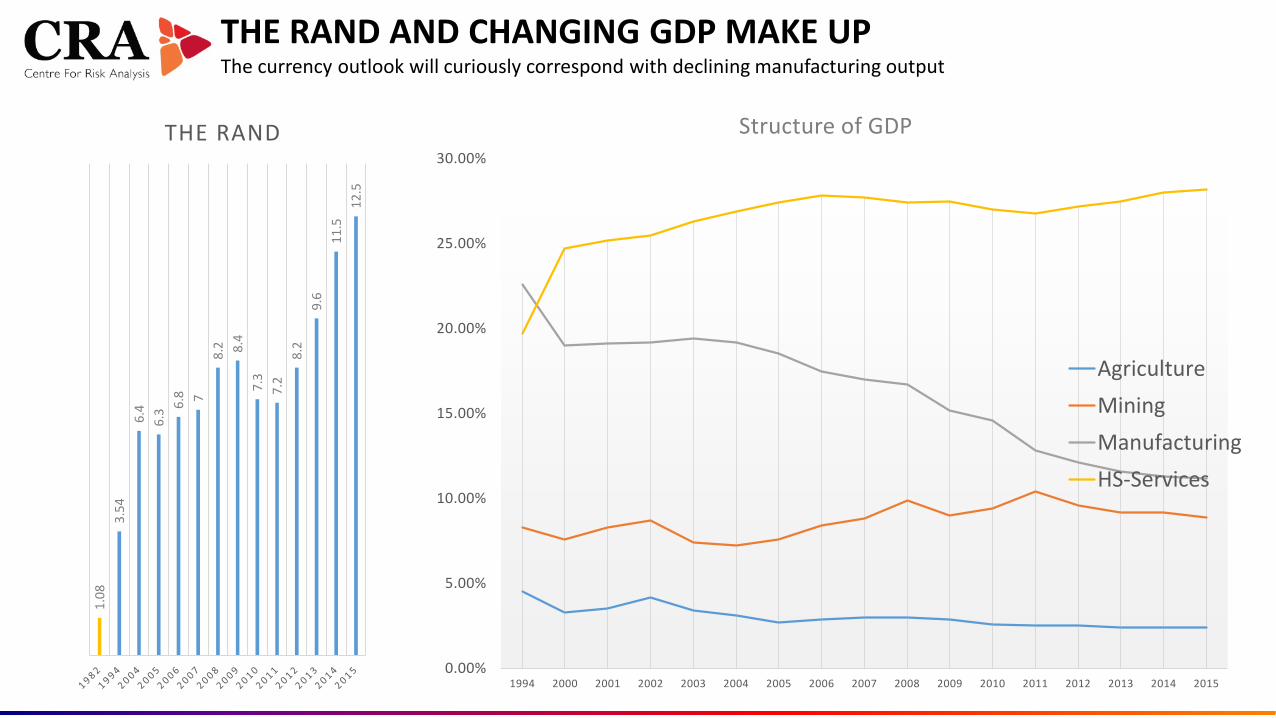
THE RAND AND CHANGING GDP MAKE UP The currency outlook will curiously correspond with declining manufacturing output
0.00%
5.00%
10.00%
15.00%
20.00%
25.00%
30.00%
1994 2000 2001 2002 2003 2004 2005 2006 2007 2008 2009 2010 2011 2012 2013 2014 2015
Structure of GDP
AgricultureMiningManufacturingHS-Services
1.08
3.
54
6.4
6.3 6.
8 7 8.
2 8.4
7.3
7.2
8.2
9.6
11.5
12
.5
THE RAND

TAXPAYERS AND GOVERNMENT FINANCES Weak economic growth will dampen tax base expansion as government finances come under further strain
0
10
20
30
40
50
60
-6
-5.5
-5
-4.5
-4
-3.5
-3
-2.5
-2
-1.5
-1
-0.5
0
0.5
1
1.5
2005 2006 2007 2008 2009 2010 2011 2012 2013 2014 2015
Budget deficit and government debt Budget deficit Debt/GDP
0
10000000
20000000
30000000
40000000
50000000
60000000
Population Adults 20+ Employed On welfare Registeredtaxpayers
Liable forreturns
Taxpayers

ELECTRICITY SUPPLY AND INFRASTRCUTURE Electricity supply constraints are placing growth estimates of over 3% of GDP in doubt
0
10000
20000
30000
40000
50000
60000 19
94
1995
19
96
1997
19
98
1999
20
00
2001
20
02
2003
20
04
2005
20
06
2007
20
08
2009
20
10
2011
20
12
2013
20
14
2015
20
16
2017
20
18
2019
20
20
2021
20
22
2023
20
24
Available capacity Installed capacity (MW) Demand at 1% growth Demand at 3% growth
and… any significant
further breakdown in existing power
infrastructure will force growth
forecasts to be revised
downwards

LABOUR MARKETS We anticipate sustained high levels of joblessness centred around young people
0 10 20 30 40 50 60
15-24
25-34
35-44
45-54
55-64
Official unemployment rate by age group
0
10000000
20000000
30000000
40000000
50000000
60000000
Population Of workingage
Employed Unemployed Not lookingfor work
Jobs and unemployment 2001 2014
0.7
1.8
GLOBAL YOUTH GLOBAL UNEMPLOYED
YOUTH
Global picture
9
8
3
1
4

JOBS AND GROWTH We expect GDP growth to remain key determinant of broader joblessness rate
-2
-1
0
1
2
3
4
5
6
0
5
10
15
20
25
30
35
40
45
1996 1997 1998 1999 2000 2001 2002 2003 2004 2005 2006 2007 2008 2009 2010 2011 2012 2013 2014
Growth and unemployment
Unemployment rate GDP growth

INCOMES, ASSETS, AND THE MIDDLE CLASS The risk is that middle class size is overstated with 12% spending over R10 000 a month
African, 12040000
White, 1380000 African, 665000 White, 859000
0
2000000
4000000
6000000
8000000
10000000
12000000
14000000
African Coloured Indian White
Household monthly expenditure
Total R0-R2499 R2500-R9999 R10000+
African, 479000 Coloured, 176000
Indian, 67000 White, 419000
0
2000000
4000000
6000000
8000000
10000000
12000000
14000000
African Coloured Indian White
Households and home loans
Homeloans Households
African R10 000
= 5.5%

SCHOOLS AND EDUCATION Despite half of children now completing their school education quality remains very poor
0
10
20
30
40
50
60
70
Grade 1 Grade 2 Grade 3 Grade 4 Grade 5 Grade 6 Grade 9 Matricmathspass at
50%
Numeracy rates and matric maths
0
100000
200000
300000
400000
500000
600000
700000
800000
900000
1955 1965 1975 1985 1995 2005 2015 Numberin 2015cohort
Black African matric passes
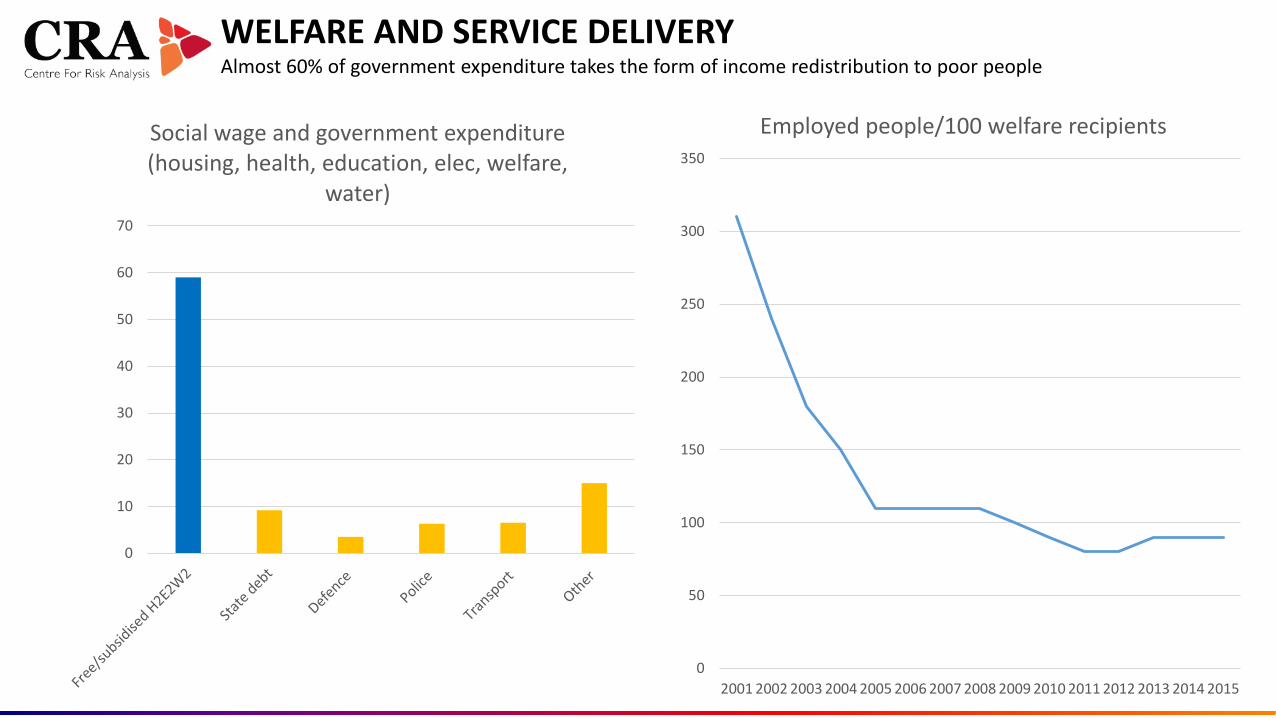
WELFARE AND SERVICE DELIVERY Almost 60% of government expenditure takes the form of income redistribution to poor people
0
50
100
150
200
250
300
350
2001 2002 2003 2004 2005 2006 2007 2008 2009 2010 2011 2012 2013 2014 2015
Employed people/100 welfare recipients
0
10
20
30
40
50
60
70
Social wage and government expenditure (housing, health, education, elec, welfare,
water)

CRIME AND SECURITY Expectation is that high violent crime levels will continue to overwhelm the justice system
250000
260000
270000
280000
290000
300000
310000
320000
330000
340000
0
5000
10000
15000
20000
25000
30000
35000
40000
2005 2006 2007 2008 2009 2010 2011 2012 2013 2014
Robbers and convicts Armed residential/business robbery All criminal convictions
0
10
20
30
40
50
60
70
80
Murder rate

POLLS AND SOCIAL ATTITUDES Anti-government sentiment is rising
Government performs well?
72% YES
2000
54% 2014
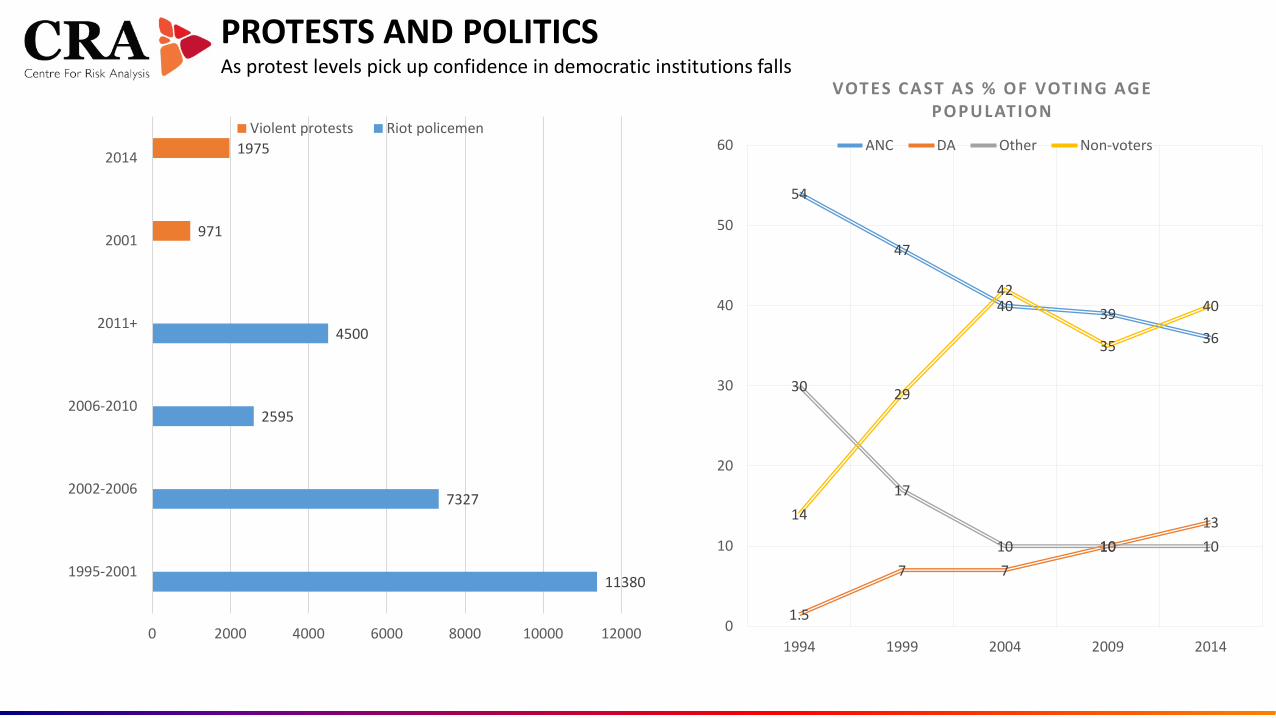
PROTESTS AND POLITICS As protest levels pick up confidence in democratic institutions falls
11380
7327
2595
4500
971
1975
0 2000 4000 6000 8000 10000 12000
1995-2001
2002-2006
2006-2010
2011+
2001
2014
Violent protests Riot policemen
54
47
40 39 36
1.5
7 7 10
13
30
17
10 10 10
14
29
42
35
40
0
10
20
30
40
50
60
1994 1999 2004 2009 2014
VOTES CAST AS % OF VOTING AG E POPULATION
ANC DA Other Non-voters

SCENARIOS AND PROBABILITIES: 2024 On current trends a Toll Road/Rocky Road hybrid is the scenario of greatest probability
NARROW ROAD forced market
friendly reforms
TOLL ROAD policy confusion amidst vibrant
institutions
ROCKY ROAD socialism amidst
crumbling democratic institutions
WIDE ROAD popular mandate for
market reforms
Market driven economic reform
Erosion of democratic institutions
Free open society under rule of law
Socialist “development state”

LEADING INDICATORS OF CHANGE The following leading indicators will cause us to consider upping to ‘most probable’ of any of the other three scenarios Economic upsurge of South Africa’s major export partners coinciding with sustained
long term uptick in global commodity demand Increases in foreign interest rates coinciding with high levels of sustained capital outflows
out of South Africa Evidence of reckless short term borrowing on the part of the South African government A period of sharp rand weakening – especially in an environment of rising oil prices Fundamental reforms on labour and then empowerment policy by the South African
government Evidence of the likely significant loss of autonomy of key democratic institutions including
the media, civil society, the judiciary and quasi-state democratic institutions such as the Public Protector and the Independent Electoral Commission
Likely successful attempts to vest property rights in the State Evidence of large scale institutional instability within the African National Congress Sustained sharp increases in violent anti-government protest actions

Frans Cronje: [email protected] Media desk: [email protected] Web: www.irr.org.za