Embed Size (px)
Citation preview

The Thailand Consumer SurveyOnwards and upwards November 2016

Foreword 03
Onwards and upwards 04
The Thailand Consumer Survey 08
1. Overall consumer sentiment 11
2. Spending patterns 12
3. Buying behaviour 15
4. Brand preferences 20
5. Communication channels 22
6. Buying channels 24
7. The rise of e-commerce 30
Looking ahead 32
Contact us 34

03
The Thailand Consumer Survey | Onwards and upwards
ForewordThailand is home to some of the more sophisticated consumers in Southeast Asia. Cautiously optimistic about the economy, Thai consumers are generally sensible spenders who consume within their means. Despite this disposition, however, their purchasing decisions do not always hinge on the issue of price.
In our first-ever consumer survey conducted in the two cities of Bangkok and Chiang Mai earlier this year, we found that the urban Thai consumer focuses on finding the right product – one that possesses the right set of product attributes to satisfy their unique needs and desires. And the higher their purchasing power, the greater their willingness to pay for these specific attributes.
But it is not just about product functionality – urban Thai consumers are a trendy crowd. This emphasis on keeping up with the latest styles is particularly pronounced in the Clothing and Footwear, and Consumer Electronics and Appliances categories. Most notably, when purchasing Clothing and Footwear items, how the item fits matters more than the comfort that it offers. Catering to such discerning consumers will require consumer products and retail companies to possess an equally astute understanding of their behaviours.
Modern Trade channels dominate the retail landscape in the major cities. Among these, Hypermarkets are the clear pack leader with their wide range of product offerings, frequent promotions and, most importantly, their ability to integrate other amenities such as banks, restaurants and other specialty stores under the same roof. Yet Traditional Trade channels still retain some of their appeal. Mom and Pop Stores are located in convenient, residential areas and are sometimes perceived to be offering lower prices – even if that may not always be the case. The viability of this channel, however, is facing challenges as consumers are increasingly drawn to the 24/7 convenience and greater product range offered by Minimarkets.
Thailand's e-commerce market is fast growing and remains a promising untapped market given Thailand’s 68 million population and high mobile, social media and Internet penetration rates. Concerns over payment security remain its main roadblock, but alternative payment methods such as cash-on-delivery have encouraged greater adoption of online channels.
If one thing is certain, it is that the promising market of Thailand is on an onwards and upwards trajectory. We hope that this report will provide you with some insight into the various considerations that will need to be made in order to effectively harness this growth.
Eugene HoSoutheast Asia Industry LeaderConsumer & Industrial Products

04
The Thailand Consumer Survey | Onwards and upwards
Onwards and upwards
Within less than a generation, Thailand has progressed from a low-income country to an upper-middle income one. Its developmental success story highlights an impressive poverty reduction from 67% in 1980 to 11% in 2014 – an achievement driven by strong economic growth averaging 7.5% during the boom time in the 1980s, and 5% during 1999-2005 after the Asian financial crisis1.
However, Thailand's economy has since slowed down, with exceptional spikes in 2010 and 2012 in an otherwise low growth environment over the past decade (see Figure 1). There could be several reasons for this, including but not limited to the end of large-scale government investment projects, natural disasters2, and domestic political instability3.
Today the economy is on the road to recovery, and is expected to show growth
of at least 3% per annum from 2016-20204. Its GDP in 2015 was USD 395 billion5 – an equivalent of GDP per capita of USD 5,8006. Private consumption is expected to increase on the back of favourable government policies and subsidies, as well as the expected growth in the tourism sector, while government spending has risen by 6% to implement the demand-side measures such as the launch of a programme to create jobs and generate sustainable incomes for farmers and other low-income consumers7. Infrastructure
Source: Asian Development Bank
Figure 1: Thailand’s GDP growth rate (2005-2017F)
4.2%5%
5.4%
1.7%
-0.7%
7.5%
0.8%
7.2%
2.7%
0.8%
2.8%3.2% 3.5%
2005 2006 2007 2008 2009 2010 2011 2012 2013 2014 2015 2016F 2017F
investment has also increased with the expedition of five mega public-private partnership projects, consisting of three sky train lines and two motorway extensions worth THB 334 billion8.
The passing of the long standing and revered King in October spurred a year-long period of mourning, scaling back on lavish spending on festivities and celebrations. However, the country’s economic fundamentals remain unchanged and the outlook remains strong.
1. “Overview – Thailand”. The World Bank. April 2016. http://www.worldbank.org/en/country/thailand/overview 2. “Thailand's economy falls into recession”. BBC News. 19 August 2013. http://www.bbc.com/news/business-237518463. “Thailand Consumer Confidence.” Trading Economics. http://www.tradingeconomics.com/thailand/consumer-confidence4. “Economic growth”. The Economist Intelligence Unit. 23 June 2016. http://country.eiu.com/article
aspx?articleid=1044338288&Country=Thailand&topic=Economy&subtopic=Forecast&subsubtopic=Economic+growth&aid=1&oid=16443181485. “GDP (current US$). The World Bank. http://data.worldbank.org/indicator/NY.GDP.MKTP.CD6. “GDP per capital (current US$)”. The World Bank. http://data.worldbank.org/indicator/NY.GDP.PCAP.CD7. Bureau of the Budget. http://www.bb.go.th 8. “First 5 mega projects to be expedited next year”. 12 November 2015. National News Bureau of Thailand. http://thainews.prd.go.th/website_en/news/news_detail/
WNECO5811120010003

05
The Thailand Consumer Survey | Onwards and upwards
4,3534,788
5,0805,435
5,825 6,068 6,230 6,287 6,465 6,3966,701 6,830
7,305 7,376 7,412 7,566 7,693 7,846 8,007 8,187 8,381
0
1,000
2,000
3,000
4,000
5,000
6,000
7,000
8,000
9,000
2000 2001 2002 2003 2004 2005 2006 2007 2008 2009 2010 2011 2012 2013 2014 2015 2016F 2017F 2018F 2019F 2020F
Real household disposableincome, THB billion
+ 3.8% p.a.
+ 2.1% p.a.
Source: The Economist Intelligence Unit (2016)
Figure 2: Real household disposable income, 2015 constant THB prices (2000 – 2020F)
Upward mobility Thailand’s rising economy, coupled with urbanisation and conducive economic policies, has resulted in a consistent growth of real household incomes that is expected to continue into the future (see Figure 2).
In 2010, middle-income households (defined as having annual household incomes of between THB 175,000 and
THB 875,000) accounted for 69% of total households. By 2015, this number had grown to 73% and is expected to increase to 75% in 2020 (see Figure 3), supporting a growing demand for luxury and non-essential products.
A certain degree of income inequality is expected to persist in the near term, with limited scope for retailers to expand
Number of households, million
0
2
4
6
8
10
12
14
16
18
20
2000
15,660
18,910 19,130 19,420 19,740
2005 2010 2015 2020F
THB 35,000-175,000
THB 175,001-350,000
THB 350,001-525,000
THB 525,001 - 875,000
More than 875,000
6%
13%
22%
40%
19%
5%
11%
20%
42%
22%
4%9%
17%
43%
28%
3%7%
15%
43%
32%
2%5%
11%
41%
41%
Figure 3: Proportion of household income segments by annual household income (2000-2020F)
Source: The Economist Intelligence Unit (2016)
outside urban areas given the large proportion of rural dwellers with low incomes. However, key cities, such as the capital of Bangkok, enjoy a thriving retail environment, and a large number of retailers – both domestic and international – are active players in the market. The mass grocery retail, department store and shopping mall segments are particularly well developed in these cities.

06
The Thailand Consumer Survey | Onwards and upwards
Tak
Sa Kaeo
Trat
Songkhla
Mukdahan
28%
2%3%3%4%5%6%6%
13%
14%
18%
Exports
Machineries and mechanicalappliances
Electrical equipments
Vehicles other than rail way
Rubber
Plastics
Precious gems and stones
Oils and fuels
Meat and seafood preparations
Medical and precision equipments
Cereals
Others27%
2%3%4%4%4%5%5%
14%
15%
19%
Imports
Electrical equipments
Oils and fuels
Machineries and mechanical appliances
Precious gems and stones
Iron and steel
Vehicles other than rail way
Plastics
Articles of iron or steel
Medical and precision equipments
Organic chemicals
Others
A logistics hub within Southeast AsiaLocated in the heart of mainland Southeast Asia, Thailand is one of the strategic transport and trade hubs of the region. The country also plays a vital geopolitical role in the region, leading the development of the ASEAN Free Trade Area9 as one of the founding ASEAN member countries.
Thailand adopts a Special Economic Zones (SEZ) policy to foster cross-border trade with neighbouring countries, namely Cambodia, Lao PDR, Malaysia and Myanmar (see Figure 4)10. The development of SEZs has accelerated the infrastructure betterment and industrialisation of rural areas, in turn enabling the economy to sustain its strong growth.
Thailand is also in discussions with China to build an 873 kilometre-long high speed railway connecting its north-east border with Lao PDR to the ports and industrial zones in the east. Construction of the first project phase is expected to start by the end of 201611.
These continual efforts to enhance transport infrastructure and customs efficiency have yielded positive results in the logistics industry. Logistics costs have dropped from 16-18% of GDP from 2001-2008, to 14-15% from 2009-201212.
Thailand is also preparing itself for the latest trends in the global production value chain. Surging costs in China and other developed Southeast Asian countries have encouraged many foreign manufacturers to relocate to countries with lower production costs in the Greater Mekong sub-region, such as Myanmar and Vietnam. Such a movement of manufacturing bases in Southeast Asia continues to put Thailand’s manufacturing facilities in a central position, while underscoring its role as a key logistics hub for the region.
Figure 4: Thailand’s Special Economic Zones and targeted sectors (2015)
9. “Investing in the Land of Smiles: Advantages of Thailand”. American Commerce In Thailand.10. “Government Accelerating Infrastructure Development in Special Economic Zones”. The Government Public Relations Department http://thailand.prd.go.th/ewt_news.
php?nid=90&filename=index11. “Thailand, China agree on $5 billion cost for rail project's first phase”. Reuters. 21 September 2016. http://www.reuters.com/article/us-thailand-china-railway-
idUSKCN11R0Q1 12. “Thailand: ASEAN’s Key Logistics Hub”. HKTDC Research. 23 April 2015. http://economists-pick-research.hktdc.com/business-news/article/Research-Articles/Thailand-
ASEAN-s-Key-Logistics-Hub/rp/en/1/1X000000/1X0A25UR.htm13. The World Bank. http://data.worldbank.org/indicator/SP.POP.TOTL?locations=TH14. “Thailand consumer trends: E-commerce ‘un-stoppable’ as 4G rollout goes rural”. Campaign Asia. 23 February 2016. http://www.campaignasia.com/article/thailand-
consumer-trends-e-commerce-unstoppable-as-4g-rollout-goes-rural/405967
• Agricultural, fishery and related industries
• Electrical appliances and electronics
• Logistics • Industrial estates/zones • Tourism related industry
• Agricultural, fishery and related industries
• Textile, garment, and leather industries
• Manufacture of furniture
• Gems and jewellery • Medical equipment • Automotive, machinery,
and parts • Electrical appliances
and electronics • Plastics • Medicine • Logistics • Industrial estates/zones • Tourism related
industry
• Agricultural, fishery and related industries
• Logistics • Industrial
estates/zones • Tourism
related industry
• Agricultural, fishery and related industries
• Textile, garment, and leather industries • Manufacture of furniture • Logistics • Industrial estates/zones • Tourism related industry
• Agricultural, fishery and related industries
• Ceramic products • Textile, garment, and
leather industries • Manufacture of furniture • Gems and jewellery • Medical equipment • Automotive, machinery,
and parts • Electrical appliances and
electronics • Plastics • Medicine • Logistics • Industrial estates/zones • Tourism related industry
Source: Ministry of Commerce, Thailand Board of Investment
The rise of e-commerce and digital economyThe penetration rates of mobile, social media and Internet in Thailand are amongst the highest in Southeast Asia (see Figure 5 to 7). This, coupled with its vast population of 68 million13, positions Thailand as one of the most attractive markets in Southeast Asia for e-commerce.
With the launch of 3G in 2013 and, subsequently, 4G in 2016, Thailand’s Internet coverage extends even to its rural areas14. About half of the population maintain social media presence through Instant Messaging applications and Facebook. Furthermore, a significant amount of time is spent on social media, with Thai urbanites interacting on social media for longer periods of time (2.9 hours per day) than the global average (1.7 hours per day).

07
The Thailand Consumer Survey | Onwards and upwards
14%14%22%24%
31%40%
47%58%59%
67%69%
MyanmarVietnamPhillippines CambodiaTimor-Leste
Brunei Lao PDRThailandSingapore IndonesiaMalaysia
MyanmarVietnamPhillippines Cambodia Timor-Leste
Brunei Lao PDRThailandSingapore IndonesiaMalaysia
1%9%14%
32%32%34%46%
54%67%
81%84%
Source: Electronic Transactions Development Agency
An increasing number of retailers are setting up online presence to advertise their products, strengthen relationships with existing customers, and offer convenient online shopping. In addition, the wider use of credit and debit cards enables online payment to increasingly become a part of daily life15.
The Thailand e-commerce market is fast growing, with the Business to Consumer (B2C) segment growing by 33.5% per annum over the past three years, as compared to the growth of in-store sales of 6%. Within Southeast Asia, Thailand ranks third after Singapore and Malaysia in terms of the value of e-commerce per capita (see Figure 8)16. However, given the size of the market, traditional brick-and-mortar stores will continue to play a significant role in growing Thailand’s retail segment in the near future.
Figure 5: Mobile penetration rates in Southeast Asia (2015)
Figure 8: The rise of e-commerce in Thailand
Source: Tech in Asia
155%
Cambodia Vietnam Thailand Singapore Malaysia Brunei Indonesia Philippines Timor-Leste
Lao PDR Myanmar
150% 149% 146%136%
126% 125%112%
71% 69%56%
Figure 6: Social media penetration rates in Southeast Asia (2015)
Figure 7: Internet penetration rates in Southeast Asia (2015)
Source: Tech in Asia
Source: Tech in Asia
15. “New trends in Thailand’ Retail Market”. HKTDC Research. 13 May 2015. http://economists-pick-research.hktdc.com/business-news/article/Research-Articles/New-Trends-in-Thailand-s-Retail-Market/rp/en/1/1X000000/1X0A2CDN.htm
16. "Value of E-Commerce Survey in Thailand 2016". Electronic Transactions Development Agency. https://www.etda.or.th
Growth of B2C e-commerce in Thailand Value of B2C e-commerce per capita in Southeast Asia (USD)
11.7
15.7
20.8
0
5
10
15
20
25
2014 2015 2016F 2015 2014
USD billion
+ 33.5% p.a.
648.6
392.3
230.9
44.4
41.4
15.5
630.8
321
172.8
32.7
23.2
10.2
Singapore
Malaysia
Thailand
Vietnam
Philippines
Indonesia
08
The Thailand Consumer Survey | Onwards and upwards
The Thailand Consumer Survey
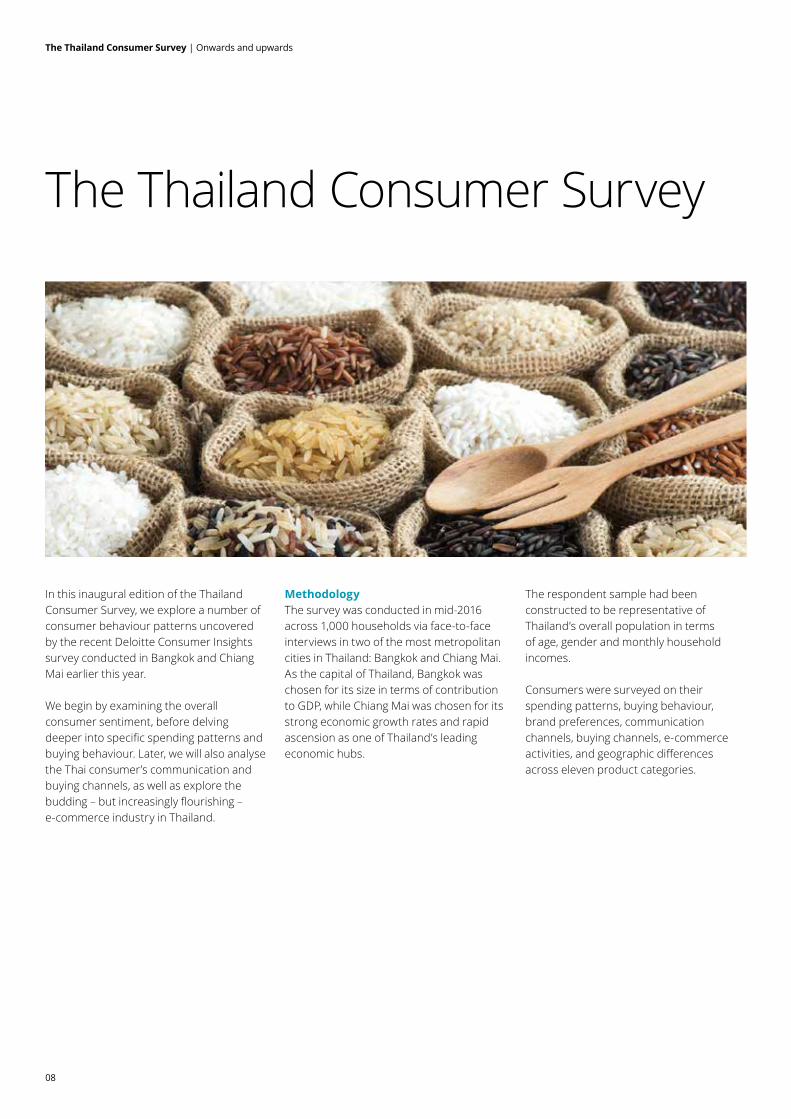
In this inaugural edition of the Thailand Consumer Survey, we explore a number of consumer behaviour patterns uncovered by the recent Deloitte Consumer Insights survey conducted in Bangkok and Chiang Mai earlier this year.
We begin by examining the overall consumer sentiment, before delving deeper into specific spending patterns and buying behaviour. Later, we will also analyse the Thai consumer’s communication and buying channels, as well as explore the budding – but increasingly flourishing – e-commerce industry in Thailand.
MethodologyThe survey was conducted in mid-2016 across 1,000 households via face-to-face interviews in two of the most metropolitan cities in Thailand: Bangkok and Chiang Mai. As the capital of Thailand, Bangkok was chosen for its size in terms of contribution to GDP, while Chiang Mai was chosen for its strong economic growth rates and rapid ascension as one of Thailand’s leading economic hubs.
The respondent sample had been constructed to be representative of Thailand’s overall population in terms of age, gender and monthly household incomes.
Consumers were surveyed on their spending patterns, buying behaviour, brand preferences, communication channels, buying channels, e-commerce activities, and geographic differences across eleven product categories.

09
The Thailand Consumer Survey | Onwards and upwards
Product category Examples of sub-categories
Confectionery • Biscuits • Bread • Chocolate • Pastries
Packaged Foods • Instant Noodles • Soup and Congee • Breakfast Cereals
Beverages • Fruit and Vegetable Juices • Ready to Drink Tea • Ready to Drink Coffee • Soft Drinks
Tobacco • Cigarettes • Cigars • Tobacco
Clothing and Footwear • Clothing • Footwear
Personal Hygiene Products • Body and Shower Products • Diapers • Hair Care Products • Sanitary Napkins • Toothpaste
Household Cleaning Products • Dishwashing Products • Laundry Products
Audio and Video Electronics Products • DVD/VCD Players • Radio • Television Sets
Digital Cameras and Other Gadgets • Digital Cameras • Mobile Phones • Tablets
Major Household Appliances • Air-Conditioners • Refrigerators • Washing Machines
Small Household Appliances • Clothes Irons • Hairdryers • Microwave Ovens • Rice Cookers • Toasters • Vacuum Cleaners

10
The Thailand Consumer Survey | Onwards and upwards
54%46%
Demographics of survey respondents
Geographical distribution of survey respondents
Age group, years
Percentage of survey respondents
18%
42%
35%
5%
50-64
35-49
25-34
15-24
Age distribution of survey respondents
Monthly household income distribution of survey respondents
In order to accurately reflect the actual demographics of the Thai consumer market, quotas were set on the survey samples to achieve the appropriate distribution of gender, age and geographical location of the respondents, and different weights were applied to adjust for minor over-representations and under-representations.
Gender distribution of survey respondents
Bangkok
Chiang Mai
30%
70%
Percentage of survey respondents
Monthly household income, THB
More than 85,000
50,001-85,000
35,001-50,000
24,001-35,000
18,000-24,000
Less than 18,000 28%
16%
18%
14%
12%
12%

11
The Thailand Consumer Survey | Onwards and upwards
Cautiously optimisticAcross all household income levels, Thailand’s consumers are generally optimistic and positive about the economy (see Figure 9).
In total, 73% of survey respondents indicated Optimistic or Moderately Optimistic sentiments. Their plans for spending, however, appear to be conservative, with only 40% of respondents expecting to increase their spending in the next five years. Of these respondents, most of them plan to increase their spending by less than 10% or from 10-25% (see Figure 10).
This cautious optimism could be due, at least in part, by the slower economic growth in the past decade. Although the average monthly wage increased at a rate of 8-10% from 2012-2014, the growth rate in 2015 was only 2%17.
Figure 9: Do you feel confident that the Thai economy will improve in the future?
Figure 10: Do you intend to spend more, less, or the same in terms of discretionary spend of your disposable income in the next five years?
26%
40%
29%
27%
38%
30%
43%
40%
46%
39%
38%
41%
31%
20%
25%
34%
24%
29%
More than 85,000
50,001-85,000
35,001-50,000
24,001-35,000
18,000-24,000
Less than 18,000
Optimistic Moderately optimistic Pessimistic
Percentage of survey respondents
Monthly household income, THB
1. Overall consumer sentiment
100%
90%
80%
70%
60%
50%
40%
30%
20%
10%
0%
100%
90%
80%
70%
60%
50%
40%
30%
20%
10%
0%
100%
90%
80%
70%
60%
50%
40%
30%
20%
10%
0%
Percentage ofsurvey respondents
Yes
No
Less than 10%
10-25%
26-50%
More than 50%
Percentage ofsurvey respondents
Percentage ofsurvey respondents
Sentiment towardseconomic climate
Plans to increasespending
Overall intendedincrease in spending
Pessimistic
Moderately optimistic
Optimistic
60%
40%
13%
16%
42%
30%
27%
41%
32%
17. “Average wage in Thailand”. Bank of Thailand. https://www.bot.or.th/English/Statistics/EconomicAndFinancial/RealSector/Pages/Index.aspx
Source: Deloitte's Thailand Consumer Survey
Source: Deloitte's Thailand Consumer Survey

12
The Thailand Consumer Survey | Onwards and upwards
2. Spending patterns
Monthly household expenditure, THB
Monthly household income, THB
72,000
37,000
26,000
22,000
17,000
12,000
More than 85,000
50,001-85,000
35,001-50,000
24,001-35,000
18,000-24,000
Less than 18,000
* This index represents the gap between average monthly household income and monthly household expenditure
Monthly household surplus/deficit index, THB*
3,000
4,000
7,500
16,500
30,500
More than 13,000
_
+
+
+
+
+
Sensible spendersThai consumers generally spend within their means. With the exception of the segment with monthly household incomes of less than THB 18,000, household incomes typically exceed household expenditures (see Figure 11).
Figure 11: Average monthly household income and expenditure
Source: Deloitte's Thailand Consumer Survey

13
The Thailand Consumer Survey | Onwards and upwards
Basic Necessities
Credit Card Instalments
Leisure and Holidays
Welfare and Savings
Housing and Utilities
Transportation
Welfare and Leisure Housing and Transportation
Beverages
Packaged Foods
23% 28% 18%
7%
11%
15%
9%
4%
6%
17%
Source: Deloitte's Thailand Consumer Survey
Moving beyond basic necessities Overall, expenditure on Basic Necessities such as Food and Beverages account for 23% of total expenditures, while spending on Housing, Utilities and Transportation accounted for 18%. What is significant, however, is that 28% of expenditure is allocated to Credit Card Instalments, Leisure and Holidays, as well as Welfare and Savings (see Figure 12).
But this tendency to allocate expenditure to non-essential items is not uniform across the board. As expected, expenditure allocated to Basic Necessities is higher for consumers with lower incomes than for those with higher incomes. Lower income households also allocate a significant proportion of expenditure to Housing and Transportation, as housing expenses can be substantially high in the major cities of Bangkok and Chiang Mai.
A point of inflection also appears to exist at the monthly household income level of THB 18,000-24,000 where households begin to accumulate surplus incomes. Consumers who have attained these level of income tend to dedicate more of their expenditure to non-essential items, due to higher income levels and increased access to financial products, such as credit cards, that can bolster spending. For consumers in the lowest income segment, Welfare and Leisure items accounted for only 16% of total expenditure. This is in stark contrast to consumers in the highest income segment, where these items accounted for 36% of total expenditure (see Figure 13).
Figure 12: Overall expenditure across the three consumer product clusters

14
The Thailand Consumer Survey | Onwards and upwards
Figure 13: Breakdown of monthly expenditures by household income level
Monthly household income, THB
Percentage of survey respondents
14%
16%
17%
18%
20%
20%
5%
4%
5%
6%
7%
6%
1%
1%
1%
1%
1%
2%
5%
7%
6%
6%
5%
7%
3%
4%
4%
4%
4%
4%
2%
2%
2%
3%
3%
3%
4%
2%
4%
4%
2%
3%
5%
6%
6%
6%
5%
7%
3%
2%
3%
4%
4%
3%
3%
1%
2%
3%
3%
2%
4%
5%
5%
5%
5%
4%
9%
10%
11%
11%
12%
15%
7%
7%
7%
6%
8%
7%
6%
3%
4%
3%
3%
2%
11%
10%
7%
7%
9%
5%
19%
19%
17%
12%
10%
9%
More than 85,000
50,001-85,000
35,001-50,000
24,001-35,000
18,000-24,000
Less than 18,000
Packaged Foods Beverages TobaccoClothing and Footwear Personal Hygiene Products Household Cleaning ProductsAudio and Video Electronics Products Digital Cameras and Other Gadgets Major Household AppliancesSmall Household Appliances Communications and Media Housing and UtilitiesTransportation Credit Card Instalments Leisure and HolidaysWelfare and Savings
Caution aheadThailand is often seen as an affordable luxury travel, shopping and business destination. In particular, its luxury market has been on an upward trajectory, growing at a rate of 8% from 2015-2016 to reach USD 1.6 billion18.
Tourism has contributed to a large proportion of this growth, supported by domestic demand from the expanding young upper-middle class segment. About 40% of this upper-middle income and high income consumers are estimated to fall within the 30-39 years age bracket19.
Central Group, Thailand’s biggest retailer, announced a 21% revenue growth forecast of THB 320 billion (USD 9.17 billion) for fiscal year 2016, with growth in sales to foreigners and tourists accounting for 15%, and growth in sales to locals accounting for another 5%.
Looking ahead, however, a more cautionary stance will need to be taken in anticipation of a slowdown in the tourism industry. With a year-long period of mourning declared following the passing of the nation’s revered, long-standing monarch in October 2016, some foreign consumer products brands are adopting a more conservative approach in the near-term, with some cancelling sales and other events scheduled to be held over the next few months.
18. “Luxury Goods in Thailand”. January 2016. Euromonitor. 19. Digital Luxury Group
Source: Deloitte's Thailand Consumer Survey

15
The Thailand Consumer Survey | Onwards and upwards
Source: Deloitte's Thailand Consumer Survey
3. Buying behaviour
Trendy consumersThais are relatively sophisticated consumers in Southeast Asia. They are typically not very price-sensitive, prioritising product attributes other than Price across most product categories (see Figure 14). For instance, Taste, Safety and Trust are the top three most important product attributes for the purchase of Packaged Foods. Price ranks at fourth place. Safety, Trust and Overall Quality, rank highly in driving buying behaviours in Personal Hygiene Products and Household Cleaning Products, as consumers become more discerning about the products that they consume on a daily basis.
Thai consumers also have a penchant for trendy products, particularly in Clothing and Footwear, as well as Consumer Electronics and Appliances. Fit and Comfort rank higher than Price when purchasing Clothing and Footwear.
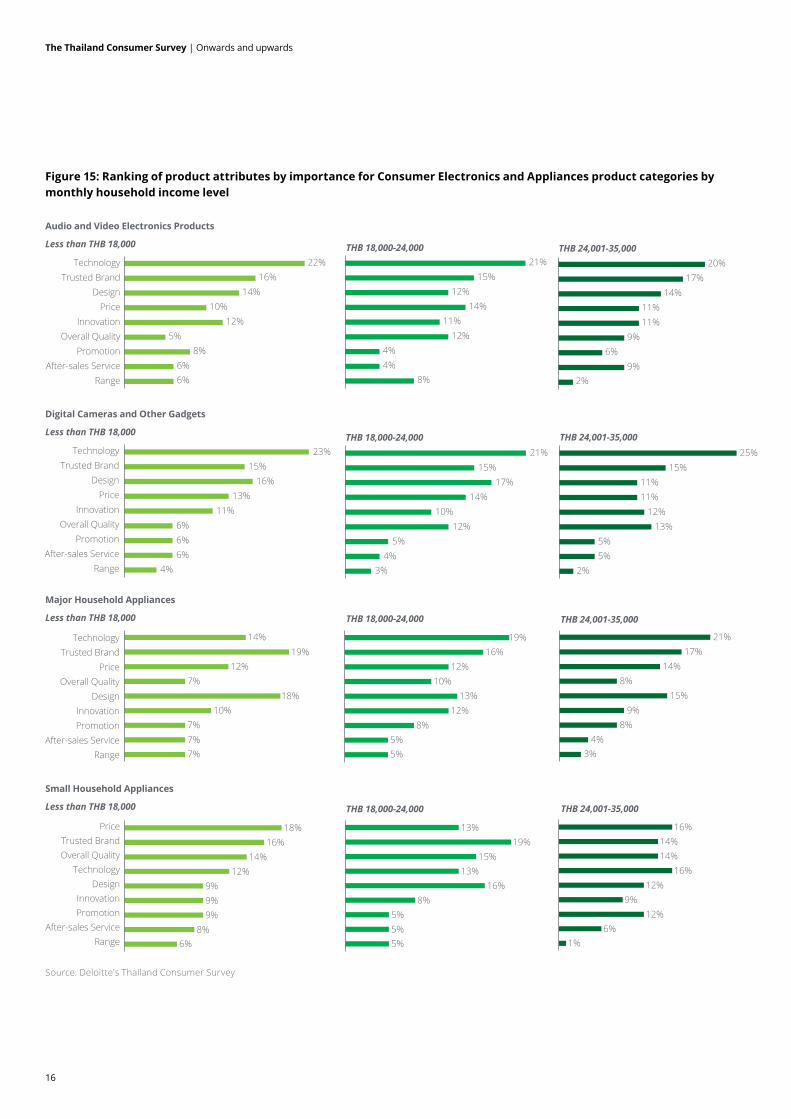
Similarly, in the Consumer Electronics and Appliances product category, Technology and being a Trusted Brand are the most important attributes. Overall Quality becomes increasingly important in purchasing decisions for the higher income segments for Household Appliances, both major and small appliances (see Figure 15). This could be attributed to consumer perception that these products are high-ticket items that need to be updated on a regular basis to keep up with the latest technology, and so getting a good price to match the overall quality is an important consideration.
Figure 14: Ranking of product attributes by importance for seven product categories
Packaged Foods Beverages
Personal Hygiene Products Household Cleaning Products
Consumer Electronics and Appliances
Clothing and Footwear
3%3%4%5%6%
11%
14%18%18%19%
RecognisabilityRange
MaterialPromotion
Overall QualityAppearance
DurabilityPrice
Comfort
Fit
2%4%4%
6%9%10%11%12%
14%27%
PackagingPromotion
RangeSmell
HealthOverall Quality
PriceTrust
SafetyTaste
3%
4%
6%
10%
11%
12%
15%
15%
21%
Packaging
Promotion
Smell
Price
Overall Quality
Trust
Health
Safety
Taste
Tobacco
2%
2%
6%
7%
10%
14%
15%
16%
25%
Promotion
Innovation
Packaging
Overall Quality
Safety
Trust
Price
Smell
Taste
2%3%
5%8%
10%12%13%13%
16%17%
InnovationPackaging
RangePromotion
PriceHealthSmell
Overall QualityTrust
Safety
2%4%4%
9%9%10%
12%14%
16%20%
InnovationRange
PackagingSmell
PromotionHealth
PriceOverall Quality
TrustSafety
3%
5%
6%
10%
12%
13%
14%
16%
20%
Range
After-salesservice
Promotion
Innovation
Design
Overall Quality
Price
Trusted Brand
Technology
16
The Thailand Consumer Survey | Onwards and upwards
Figure 15: Ranking of product attributes by importance for Consumer Electronics and Appliances product categories by monthly household income level
Audio and Video Electronics Products
Less than THB 18,000
Digital Cameras and Other Gadgets
Less than THB 18,000 THB 24,001-35,000
22%16%
14%10%
12%5%
8%6%6%
TechnologyTrusted Brand
DesignPrice
InnovationOverall Quality
PromotionAfter-sales Service
Range
TechnologyTrusted Brand
DesignPrice
InnovationOverall Quality
PromotionAfter-sales Service
Range
THB 50,001-85,000
24%15%
11%14%
11%8%8%
7%2%
More than THB 85,000
26%14%
11%12%
9%16%
5%6%
1%
THB 35,001-50,00022%
15%12%
11%17%
9%6%
4%3%
THB 24,001-35,00020%
17%14%
11%11%
9%6%
9%2%
THB 18,000-24,00021%
15%12%
14%11%
12%4%4%
8%
15%23%
16%13%
11%6%6%6%
4%
THB 18,000-24,00021%
15%17%
14%10%
12%5%
4%3%
25%15%
11%11%
12%13%
5%5%
2%
THB 35,001-50,00026%
18%13%
10%11%
9%7%
3%4%
THB 50,001-85,000
23%13%
15%15%
10%10%
8%5%
1%
More than THB 85,000
25%13%13%
11%12%
16%4%4%
2%
Major Household Appliances
Less than THB 18,000
Small Household Appliances
Less than THB 18,000
14%19%
12%7%
18%10%
7%7%7%
TechnologyTrusted Brand
PriceOverall Quality
DesignInnovationPromotion
After-sales ServiceRange
THB 18,000-24,000
19%16%
12%10%
13%12%
8%5%5%
THB 24,001-35,000
21%17%
14%8%
15%9%
8%4%
3%
THB 35,001-50,000
19%18%
15%11%
12%6%6%
8%4%
THB 50,001-85,000
13%20%
15%21%
7%6%
7%9%
2%
More than THB 85,000
18%13%
18%23%
5%8%8%
5%1%
18%16%
14%12%
9%9%9%
8%6%
THB 18,000-24,000
13%19%
15%13%
16%8%
5%5%5%
PriceTrusted BrandOverall Quality
TechnologyDesign
InnovationPromotion
After-sales ServiceRange
THB 35,001-50,000
14%19%
8%16%
14%13%
5%8%
3%
THB 50,001-85,000
19%18%
24%9%
10%5%5%
4%4%
More than THB 85,000
21%15%
21%14%
8%9%
7%2%2%
THB 24,001-35,000
16%14%14%
16%12%
9%12%
6%1%
Source: Deloitte's Thailand Consumer Survey

17
The Thailand Consumer Survey | Onwards and upwards
Audio and Video Electronics Products
Less than THB 18,000
Digital Cameras and Other Gadgets
Less than THB 18,000 THB 24,001-35,000
22%16%
14%10%
12%5%
8%6%6%
TechnologyTrusted Brand
DesignPrice
InnovationOverall Quality
PromotionAfter-sales Service
Range
TechnologyTrusted Brand
DesignPrice
InnovationOverall Quality
PromotionAfter-sales Service
Range
THB 50,001-85,000
24%15%
11%14%
11%8%8%
7%2%
More than THB 85,000
26%14%
11%12%
9%16%
5%6%
1%
THB 35,001-50,00022%
15%12%
11%17%
9%6%
4%3%
THB 24,001-35,00020%
17%14%
11%11%
9%6%
9%2%
THB 18,000-24,00021%
15%12%
14%11%
12%4%4%
8%
15%23%
16%13%
11%6%6%6%
4%
THB 18,000-24,00021%
15%17%
14%10%
12%5%
4%3%
25%15%
11%11%
12%13%
5%5%
2%
THB 35,001-50,00026%
18%13%
10%11%
9%7%
3%4%
THB 50,001-85,000
23%13%
15%15%
10%10%
8%5%
1%
More than THB 85,000
25%13%13%
11%12%
16%4%4%
2%
Major Household Appliances
Less than THB 18,000
Small Household Appliances
Less than THB 18,000
14%19%
12%7%
18%10%
7%7%7%
TechnologyTrusted Brand
PriceOverall Quality
DesignInnovationPromotion
After-sales ServiceRange
THB 18,000-24,000
19%16%
12%10%
13%12%
8%5%5%
THB 24,001-35,000
21%17%
14%8%
15%9%
8%4%
3%
THB 35,001-50,000
19%18%
15%11%
12%6%6%
8%4%
THB 50,001-85,000
13%20%
15%21%
7%6%
7%9%
2%
More than THB 85,000
18%13%
18%23%
5%8%8%
5%1%
18%16%
14%12%
9%9%9%
8%6%
THB 18,000-24,000
13%19%
15%13%
16%8%
5%5%5%
PriceTrusted BrandOverall Quality
TechnologyDesign
InnovationPromotion
After-sales ServiceRange
THB 35,001-50,000
14%19%
8%16%
14%13%
5%8%
3%
THB 50,001-85,000
19%18%
24%9%
10%5%5%
4%4%
More than THB 85,000
21%15%
21%14%
8%9%
7%2%2%
THB 24,001-35,000
16%14%14%
16%12%
9%12%
6%1%

18
The Thailand Consumer Survey | Onwards and upwards
28%
20%
17%
12%
10%
9%
56%
65%
68%
70%
71%
76%
16%
15%
15%
18%
19%
15%
More than 85,000
50,001-85,000
35,001-50,000
24,001-35,000
18,000-24,000
Less than 18,000
Percentage of survey respondents
Monthly household income, THB
Higher price Same price Lower price
Figure 16: Price choices of consumers by household income level
Higher purchasing power, lower price sensitivityConsumers in the higher income segments are generally more willing to pay for specific product attributes to satisfy their needs. When asked if they would consider purchasing a product of a higher price, only 9% of the lower income segment agreed, as compared to 28% of consumers in the highest income segment (see Figure 16). For consumer product companies, this represents opportunities to offer a wider range of product functionalities at higher price points.
These specific attributes vary by product category. For Beverages, Confectionery, Packaged Foods and Personal Hygiene Products, Overall Quality becomes a relatively more important consideration for consumers deciding whether to purchase a product of a higher price, while Comfort and Appearance are the key considerations when purchasing more expensive Clothing and Footwear. Innovative features and Technology also drive the choice for higher priced Consumer Electronics and Appliances Products (see Figure 17).
Source: Deloitte's Thailand Consumer Survey

19
The Thailand Consumer Survey | Onwards and upwards
Figure 17: Ranking of product attributes by consumers deciding between different price options
Source: Deloitte's Thailand Consumer Survey
16%11%
7%8%
21%12%
TechnologyTrusted Brand
DesignInnovation
PriceOverall Quality
Audio and Video Electronics Products
23%16%
14%11%
10%10%
25%17%
10%14%
11%10%
20%12%
9%11%
23%6%
Technology
Trusted BrandDesign
Overall QualityPrice
Innovation
Digital Cameras and Other Gadgets
24%15%15%
11%11%
10%
25%14%
16%11%
9%15%
17%14%14%
12%8%
18%
TasteSafetyHealth
TrustOverall Quality
Price
Beverages22%
15%
15%
12%
10%
9%
17%
14%
14%
17%
17%
8%
22%14%
26%12%
5%4%
FitComfort
PriceDurability
AppearanceOverall Quality
Clothing and Footwear
19%19%
17%15%
12%5%
12%21%
8%16%16%
9%
16%
16%11%
10%8%
19%
SafetyTrust
SmellHealth
Overall QualityPrice
Personal Hygiene Products
18%15%15%
13%12%
9%
13%20%
10%7%
18%10%
27%10%
6%6%
18%11%
TasteSafetyHealth
Overall QualityPriceSmell
Confectionery
28%
12%
11%
11%
10%9%
31%8%
7%12%
7%8%
Lower price Same price Higher price
23%13%
15%15%
7%8%
TasteSafetyTrustPrice
Overall QualityHealth
Packaged Foods
27%
14%11%
11%
10%
9%
26%11%
22%8%
12%5%

20
The Thailand Consumer Survey | Onwards and upwards
4. Brand preferences
61%
52%
51%
54%
41%
48%
39%
48%
49%
46%
59%
52%
7%
2%
1%
5%
3%
1%
93%
98%
99%
95%
97%
99%
17%
21%
17%
16%
19%
20%
83%
79%
83%
84%
81%
80%
60%
38%
33%
25%
32%
24%
40%
62%
67%
75%
68%
76%
Confectionery Packaged Foods Beverages Tobacco
51%
43%
43%
35%
30%
26%
49%
57%
57%
65%
70%
74%
72%
75%
74%
76%
77%
75%
28%
25%
26%
24%
23%
25%
78%
88%
89%
87%
88%
89%
22%
12%
11%
13%
12%
Clothing and FootwearHousehold Cleaning
Products Personal Hygiene
Products 11%
Monthly householdincome, THBLess than 18,000
18,000-24,000
24,001-35,000
35,001-50,000
50,001-85,000
More than 85,000
Monthly householdincome, THB
Less than 18,000
18,000-24,000
24,001-35,000
35,001-50,000
50,001-85,000
More than 85,000
Monthly householdincome, THB
Less than 18,000
18,000-24,000
24,001-35,000
35,001-50,000
50,001-85,000
More than 85,000
Foreign Local
96%
100%
98%
92%
85%
94%
4%
2%
8%
15%
6%
95%
94%
91%
86%
81%
84%
5%
6%
9%
14%
19%
16%
95%
100%
93%
88%
90%
92%
5%
7%
12%
10%
8%
81%
70%
84%
75%
72%
73%
19%
30%
16%
25%
28%
27%
Audio and VideoElectronics Products
Digital Cameras andOther Gadgets
Major HouseholdAppliances
Small HouseholdAppliances
A mixed basketThe Thai consumer consumes a mixed basket of brands, preferring Local brands in some product categories and Foreign brands in others (see Figure 18).
Figure 18: Brand preferences by household income level
Source: Deloitte's Thailand Consumer Survey
21
The Thailand Consumer Survey | Onwards and upwards
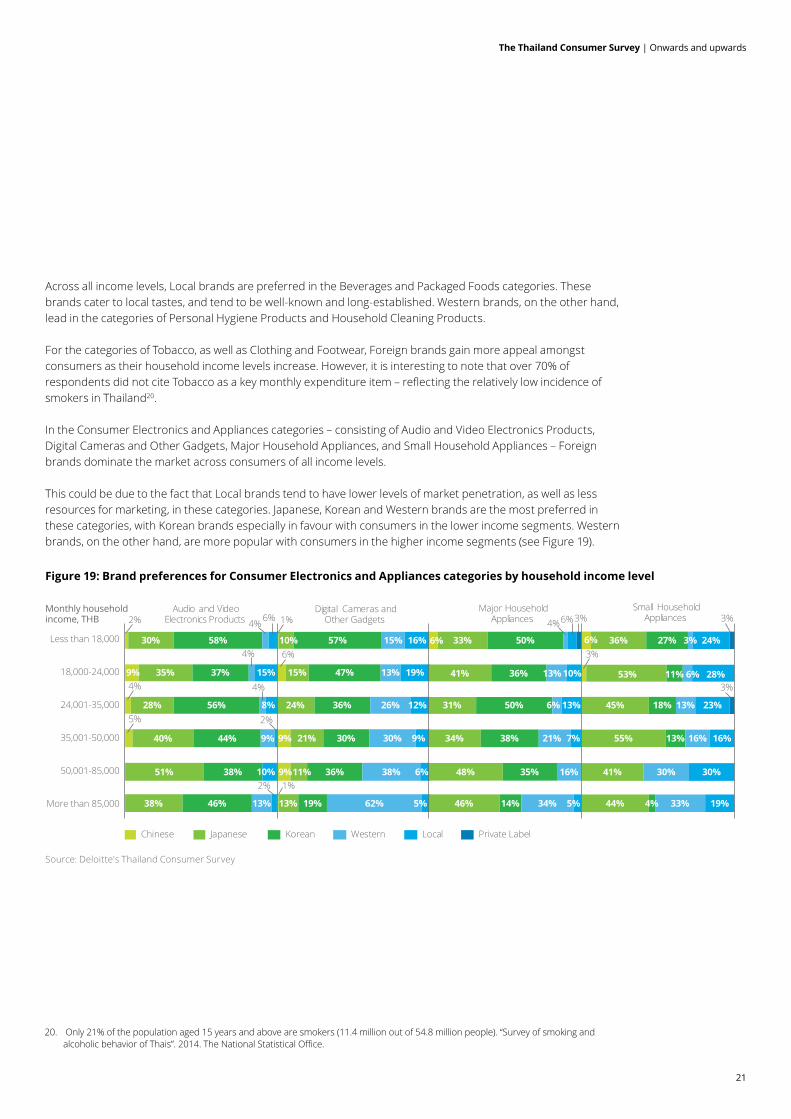
Across all income levels, Local brands are preferred in the Beverages and Packaged Foods categories. These brands cater to local tastes, and tend to be well-known and long-established. Western brands, on the other hand, lead in the categories of Personal Hygiene Products and Household Cleaning Products.
For the categories of Tobacco, as well as Clothing and Footwear, Foreign brands gain more appeal amongst consumers as their household income levels increase. However, it is interesting to note that over 70% of respondents did not cite Tobacco as a key monthly expenditure item – reflecting the relatively low incidence of smokers in Thailand20.
In the Consumer Electronics and Appliances categories – consisting of Audio and Video Electronics Products, Digital Cameras and Other Gadgets, Major Household Appliances, and Small Household Appliances – Foreign brands dominate the market across consumers of all income levels.
This could be due to the fact that Local brands tend to have lower levels of market penetration, as well as less resources for marketing, in these categories. Japanese, Korean and Western brands are the most preferred in these categories, with Korean brands especially in favour with consumers in the lower income segments. Western brands, on the other hand, are more popular with consumers in the higher income segments (see Figure 19).
Monthly householdincome, THB
9%
38%
51%
40%
28%
35%
30%
46%
38%
44%
56%
37%
58%
13%
9%
4% 1%6%
10%
8%
15%
Chinese Japanese Korean Western Local Private Label
Audio and VideoElectronics Products
Digital Cameras andOther Gadgets
Major HouseholdAppliances
Small HouseholdAppliances
9%
9%
13%
11%
21%
24%
15%
10%
19%
36%
30%
36%
47%
57%
62%
38%
30%
26%
13%
15%
5%
6%
9%
12%
19%
16% 6%
46%
48%
34%
31%
41%
33%
14%
35%
38%
50%
36%
50%
34%
16%
21%
6%
13%
5%
7%
13%
6%
44%
41%
55%
45%
53%
36%
4%
13%
18%
11%
27%
33%
30%
16%
13%
6%
3%
19%
30%
16%
23%
28%
24%
10%
2%
2%
4%
4%
4%6%3% 3%
3%
6%
1%
3%
2%
4%
5%
Less than 18,000
18,000-24,000
24,001-35,000
35,001-50,000
50,001-85,000
More than 85,000
20. Only 21% of the population aged 15 years and above are smokers (11.4 million out of 54.8 million people). “Survey of smoking and alcoholic behavior of Thais”. 2014. The National Statistical Office.
Figure 19: Brand preferences for Consumer Electronics and Appliances categories by household income level
Source: Deloitte's Thailand Consumer Survey

22
The Thailand Consumer Survey | Onwards and upwards
5. Communication channels
In-store promotions and TV dominate Thai consumers are not loyal customers, and are strongly influenced by In-store Promotions across all product categories (see Figure 20). Traditional media such as TV are still the most influential media for purchasing decisions, whilst word of mouth from Friends, Colleagues and Relatives is key for purchasing Tobacco products (see Figure 21).
Figure 20: Preferred sources of information
Digital takes offAlthough Digital Media does not feature high in the rankings, it is conceivable that it will do so in the near future: Thai consumers currently spend an average of 2.9 hours on social media daily, as compared to the 2.5 hours spent watching TV21.
There is an increasing trend of Digital Media gaining more importance as Thai consumers take to social media, blogs, apps and company websites, particularly for views before making a purchase. For categories like Consumer Electronics and Appliances, as well as Foreign branded Clothing and Footwear, Digital Media can account for almost 20% as the preferred source of information (see Figure 21).
Go digital or get left behind The digital potential of Thailand’s consumer market has not escaped the attention of many companies. In 2015, the budget allocated by businesses to digital media increased by 62%, reaching nearly THB 10,000 million or approximately 7% of the total advertising budget for
mainstream media. Top digital spenders include motor vehicle and personal care companies22.
21. "GWI Social Summary (Q4 2015)". GlobalWebIndex. 22 Digital Advertising Association (Thailand). http://www.daat.in.th/index.php/ad-spending-2015.
25%
23%
18%
14%
10%
6%
2%
1%
1%
In-store Promotions
TV
Friends and Colleagues
Relatives
Print Media
Digital Media
Outdoor Ads
Experts
Radio
Source: Deloitte's Thailand Consumer Survey

23
The Thailand Consumer Survey | Onwards and upwards
Figure 21: Preferred sources of information by brand and product category
26%
26%
28%
26%
15%
16%
15%
11%
11%
14%
2%
4%
HouseholdCleaningProducts
27%
22%
27%
23%
16%
15%
14%
15%
11%
13%
4%
9%
PersonalHygiene Products
23% 18% 15% 10% 10% 15% 5% 3%
Audio and VideoElectronicsProducts
23% 17% 15% 10% 10% 18% 4% 3%Digital Camerasand OtherGadgets
23% 17% 14% 13% 10% 15% 4% 4%Major HouseholdAppliances
25% 16% 13% 14% 10% 14% 3% 4%Small HouseholdAppliances
Foreign
Local
Foreign
Local
Foreign
Local
Foreign
Local
Foreign
Local
Foreign
Local
Foreign
Local
Foreignand
Local
Foreignand
Local
Foreignand
LocalForeign
andLocal
In-store Promotions
TV
Friends and Colleagues
Relatives
Print Ads
Digital Media
Outdoor Ads
Experts
Radio
2% 1%
2% 1%
1% 1%
1% 1%
1% 1%
1%1% 1%
1%1% 1%
1%1% 1%
1%1% 1%
1%
1%
1%
1%
1%
24%
26%
27%
26%
22%
20%
14%
14%
7%
9%
5%
1% 1%
3%
Confectionery
30%
25%
26%
27%
19%
19%
6%
14%
6%
9%
5%
3%
6% 2%PackagedFoods
23%
25%
27%
27%
18%
19%
16%
13%
7%
9%
5%
4%
3%Beverages
19%
19%
11%
18%
28%
29%
25%
22%
12%
9%
3%
2%
Tobacco
25%
28%
15%
13%
21%
23%
12%
18%
13%
9%
11%
5% 3%
Clothing andFootwear
Source: Deloitte's Thailand Consumer Survey

24
The Thailand Consumer Survey | Onwards and upwards
6. Buying channels
Modern Trade dominatesIn the major cities such as Bangkok and Chiang Mai, Modern Trade channels are the dominant and preferred buying channel for Thai consumers. Hypermarkets are the clear pack leader in these urban areas, a result of their wide variety of product offerings, ability to attract consumers with promotions and the convenience that they offer by integrating other amenities – such as banks, restaurants, and specialty stores – under the same roof (see Figure 22).
Figure 22: Popular shopping channels among survey respondents in Bangkok and Chiang Mai
This preference is consistent across both Bangkok and Chiang Mai. Tobacco, however, is the exception, with consumers still preferring to purchase these from their regular neighbourhood Mom and Pop Stores. This is especially so for consumers from the lower income segments as they prefer to buy individual packets rather than in bulk (see Figure 23).
Figure 23: Preference for Traditional Trade and Modern Trade channels by product category and city for non-electronics product categories
31%
26%
12%
10%
7%
7%
5%
2%
Hypermarkets
Minimarkets
Mom and Pop Stores
Department Stores
Supermarkets
Street Hawkers
Specialty Stores
Online Stores
78%
75%
22%
25%
Bangkok
Chiang Mai
Confectionery
80%
75%
20%
25%
Packaged Foods
79%
74%
21%
26%
Beverages
41%
32%
59%
68%
Tobacco
58%
75%
42%
25%
Clothing andFootwear
95%
88%
5%
12%
Personal HygieneProducts
Household CleaningProducts
94%
86%
6%
14%
Modern Trade Traditional Trade
Source: Deloitte's Thailand Consumer Survey
Source: Deloitte's Thailand Consumer Survey

25
The Thailand Consumer Survey | Onwards and upwards
Conversely, Modern Trade outlets such as Hypermarkets, Specialty Stores and Department Stores, are the clear channel of choice for consumers shopping for Consumer Electronics and Appliances across both cities (see Figure 24).
Figure 24: Preference for Traditional Trade and Modern Trade channels by product category and city for Consumer Electronics and Appliances categories
Consumers who prefer to shop at Traditional Trade channels also tend to shop more often (daily or weekly) and with a smaller basket size, as compared to consumers who prefer shopping at Modern Trade. This is due to the fact that these consumers, mostly from the lower income segments, have limited purchasing power and tend to visit a store only when they have a need to shop (see Figure 25 and 26).
Figure 25: Average size of shopping carts
Bangkok
Chiang Mai
Modern Trade Traditional Trade
97%
99%
3%
1%
98%
100%
2%
Digital Cameras andOther Gadgets
98%
95%
2%
5%
Major HouseholdAppliances
99%
100%
1%
Small HouseholdAppliances
Audio and VideoElectronics Products
Modern Trade Traditional Trade
Less than THB 500 THB 500-1,000 THB 1,001-5,000
2%9%
89%
6%
25%
69%
Source: Deloitte's Thailand Consumer Survey
Source: Deloitte's Thailand Consumer Survey
26
The Thailand Consumer Survey | Onwards and upwards
Differing appeals Traditional Trade channels such as Wet Markets and Mom and Pop Stores tend to be located in residential areas and their appeal lies in their convenience. Many consumers also perceive these channels to offer better prices, which is not always the case. Modern Trade channels, on the other hand, offer greater product variety and convenience, as well as more attractive in-store promotions (see Figure 27).
Figure 27: Reasons for choosing Traditional Trade and Modern Trade
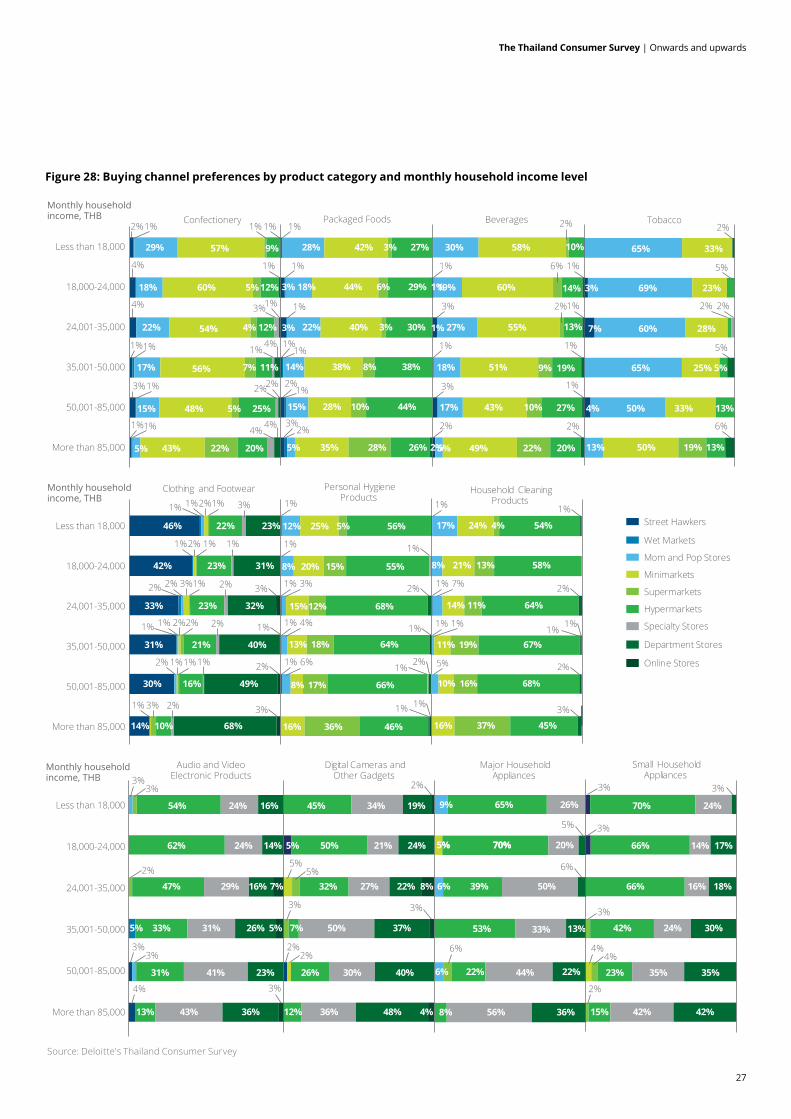
The choice of buying channels also varies with monthly household income levels. In the lower income segments, for instance, big-box Hypermarkets are the preferred choice for the purchase of Consumer Electronics and Appliances categories. However, higher income consumers prefer to shop for these products at Department Stores and Specialty Stores.
For non-electronics products, consumers in the highest household income segment frequent all Modern Trade formats, across Hypermarkets, Supermarkets and Minimarkets (see Figure 28). Minimarkets are popular formats to stock up on basic necessities such as Food and Beverages, and even Tobacco, whilst Hypermarkets and Supermarkets are visited less frequently and hence more popular for products with longer replenishment cycles such as Personal Hygiene Products and Household Cleaning Products.
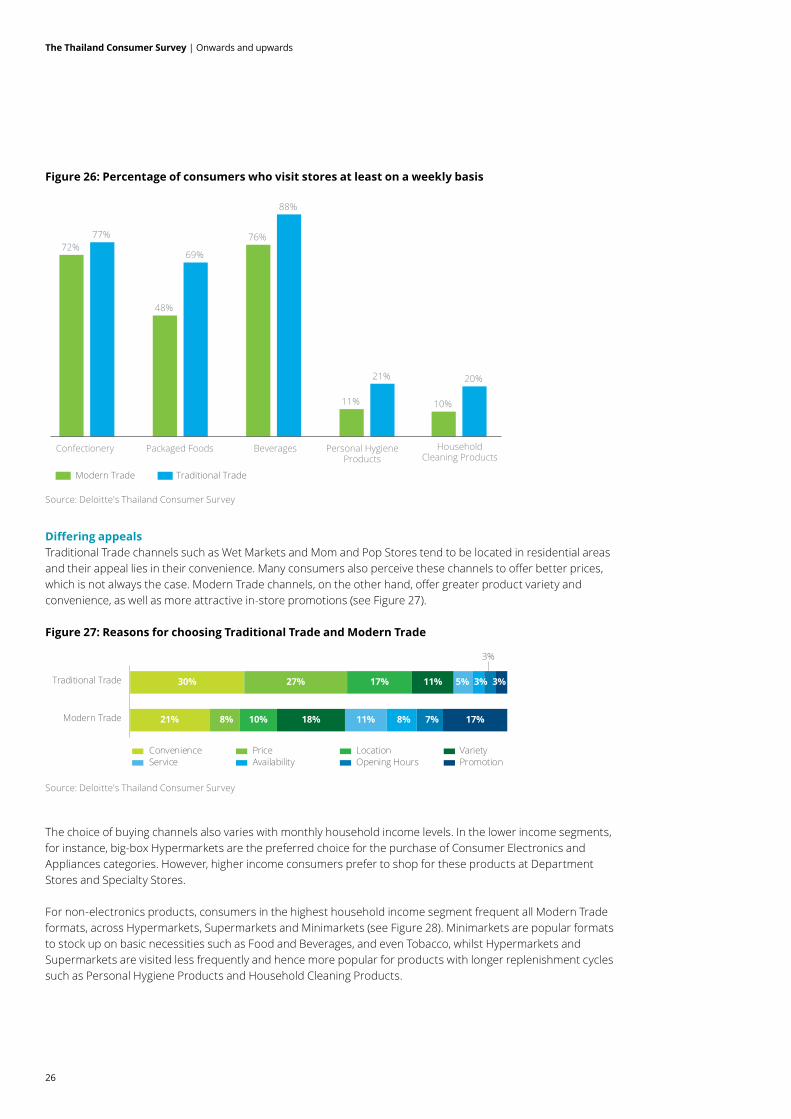
72%
48%
76%
11% 10%
77%
69%
88%
21% 20%
Confectionery Packaged Foods Beverages Personal HygieneProducts
HouseholdCleaning Products
Modern Trade Traditional Trade
Source: Deloitte's Thailand Consumer Survey
Source: Deloitte's Thailand Consumer Survey
Figure 26: Percentage of consumers who visit stores at least on a weekly basis
30%
21%
27%
8%
17%
10%
11%
18%
5%
11%
3%
8%
3%
7%
3%
17%
Traditional Trade
Modern Trade
Convenience Price Location VarietyService Availability Opening Hours Promotion
27
The Thailand Consumer Survey | Onwards and upwards
9%
6%
6%
5%
65%
70%
39%
53%
22%
8%
26%
20%
50%
33%
44%
56%
5% 70%
13%
22%
36%
17%
8%
24%
21%
14%
11%
16%
4%
13%
11%
19%
37%
54%
58%
64%
67%
45%
12%
8%
25%
20%
15%
13%
8%
16%
5%
15%
12%
18%
17%
36%
56%
55%
68%
64%
66%
46%
46%
42%
33%
31%
30%
14%
22%
23%
23%
21%
16%
10%
23%
31%
32%
40%
49%
68%
3%
7%
4%
65%
69%
60%
50%
13%
33%
23%
28%
33%
50% 19%
13%
13%
65% 25% 5%
Monthly householdincome, THB
29%
18%
22%
17%
15%
57% 9%
60%
54%
56%
48%
43%
5%12%
4% 12%
7% 11%
5% 25%
5% 22% 20%
Monthly householdincome, THB
30%
19%
27%
18%
17%
5%
58%
60%
55%
51%
43%
49%
9%
10%
22%
10%
14%
13%
19%
27%
20%
Beverages TobaccoConfectionery Packaged Foods 2%
2%
6% 1%1%
1%
1%
1%1%
1%
1%
1%2%
1%3%
3%
4%
4%
1%
2%2%
1%1%
1%1%
4%
4%4%
1%
3%
3%
2%
1% 2%
2%
2%
1%
1%
2% 6%
5%
5%
Clothing and Footwear Personal HygieneProducts
Household CleaningProducts
Street Hawkers
Wet Markets
Mom and Pop Stores
Minimarkets
Supermarkets
Hypermarkets
Specialty Stores
Department Stores
Online Stores
1%2%1%
2%
3%
6%
5%
3%
1%
1%3%2%2%
2%2%1%1%
1%1%2%
3%1%
1%2%1% 1%
2%
2%
1%
2%
3%
3%
1%
1%
1%
1%
1%
2% 2%
3%
2%
1%1%
1% 1%
2%
3%
1% 1%
1%
1% 3% 1% 7%
1% 1%
10% 16% 68%
2%5%
1% 4%
1% 6%
Digital Cameras andOther Gadgets
Audio and VideoElectronic Products
Major HouseholdAppliances
Small HouseholdAppliances
5%
45%
50%
32%
7%
26%
12%
34%
21%
27%
50%
30%
36%
19%
24%
22%
37%
40%
48%
8%
4%
70%
66%
66%
42%
23%
15%
24%
14%
16%
24%
35%
42%
17%
18%
30%
35%
42%
54%
62%
47%
33%
31%
13%
24%
24%
29%
31%
41%
43%
16%
14%
16%
26%
23%
36%
7%
5%5%
Monthly householdincome, THB
3%3%3%
3%3%
4%
5%5%
2%2%
3%
3%
3%
3%
2%
4%4%6%
2%
3%
1%
1%1%
1%2%
2%3%
3%
28%
18%
22%
14%
15%
5%
42%
44%
40%
38%
28%
35%
3%
6%
3%
8%
10%
28%
27%
29%
30%
38%
44%
26%
1%
1%
2%
Less than 18,000
18,000-24,000
24,001-35,000
35,001-50,000
50,001-85,000
More than 85,000
Less than 18,000
18,000-24,000
24,001-35,000
35,001-50,000
50,001-85,000
More than 85,000
Less than 18,000
18,000-24,000
24,001-35,000
35,001-50,000
50,001-85,000
More than 85,000
Figure 28: Buying channel preferences by product category and monthly household income level
Source: Deloitte's Thailand Consumer Survey

28
The Thailand Consumer Survey | Onwards and upwards
Variable variety A Deloitte Retail survey was conducted to shed light on the availability and variety of products across the channels.
About 100 retail outlets across the spectrum of Traditional and Modern Trade channels – Wet Markets, Mom and Pop Stores, Minimarkets, Supermarkets, Hypermarkets, Department Stores and Specialty Stores – were screened to gather information on their product availability, shelf visibility, and promotions for non-electronics and Consumer Electronics and Appliances product categories.
Traditional Trade outlets with their limited shelf space, offer fewer product options, with the obvious choice being to carry well-known high demand, high margin, and individually packaged products. Such outlets tend to be located within walking distance within residential areas and are primary sources for emergency top-up of necessities. Such outlets typically carry no more than five varieties within each product category.
More and more Minimarkets have also opened within residential areas. These outlets, approximately 80-100 square metres in size, offer greater product variety. Minimarkets typically hold 10-30 varieties of each product category. Their 24-hour operations also provide convenience for dual-income families to shop for necessities after work on weekdays.
To cater to dual-income families that are looking for freshly prepared, healthy meals, some players have begun to offer convenient and healthy ready-to-eat options. In 2015, ready-to-eat food accounted for 22% of revenue for 7-Eleven, one of the largest players in Thailand with over 9,200 outlets as of second quarter of 201623. They also provide additional convenience services to their consumers such as coffee corners, bakeries, as well as counter services offering billing payment and vehicle insurance purchase services.
Perhaps unsurprisingly, Supermarkets and Hypermarkets offer the greatest product varieties (see Figure 29). Supermarkets, however, typically try to cater to the higher income consumer segments with premium imported product offerings. This is in contrast to Hypermarkets, which concentrate on products that are well-known and manufactured locally (even if they bear a Foreign brand). Hypermarkets also typically deploy in-store promotion activities, such as pop-up booths and discounts on individual products, whereas Supermarkets usually offer loyalty cards and cash coupons instead.
In the case of Consumer Electronics and Appliances, product variety is comparable across all Modern Trade formats (see Figure 30), although Department Stores and Specialty Stores tend to offer premium and higher priced products as compared to Hypermarkets. In addition, they also tend to offer attractive payment offers such as low interest rates on credit card transactions, making such Specialty Stores popular when purchasing big-ticket Consumer Electronics and Appliances products.
Given their limited shelf space, Traditional Trade outlets typically carry only well-known products such as mass market brands with scale. New products or products focused on niche markets, on the other hand, would do better to list in Modern Trade outlets which typically offer wider product ranges to consumers.
23. "CP ALL Annual report 2015". CP All. http://www.cpall.co.th/Investor-Relations/annual-report-sec-filings/annual-report

29
The Thailand Consumer Survey | Onwards and upwards
Figure 29: Range of product variety across retail outlets screened for non-electronics product categories
Figure 30: Range of product variety across retail outlets screened for Consumer Electronics and Appliances categories
Channel Confectionery PackagedFoods
Beverages Tobacco PersonalHygiene Products
HouseholdCleaning Products
Wet Markets 3 3 3 3 3 3
Mom and Pop Stores
3 3 3 3 3 3
Minimarkets 17 11 27 8 28 12
Supermarkets 25 28 35 6 55 18
Hypermarkets 30 30 46 6 75 20
Specialty Stores
2 2 2 0 40 3
ChannelAudio and Video Electronic Products
Digital Cameras and Other Gadgets
Major Household Appliances
Small Household Appliances
Hypermarkets 18 21 14 24
Department Stores 25 28 30 38
Specialty Stores 25 35 28 19
Source: Deloitte's Thailand Consumer Survey
Source: Deloitte's Thailand Consumer Survey
30
The Thailand Consumer Survey | Onwards and upwards
7. The rise of e-commerce
Given the expected growth of the e-commerce market in Thailand – coupled with rising digital connectivity, higher Internet adoption, increasing mobile connectivity and greater acceptance of social media – Thai consumers are rapidly adopting online channels in their purchasing journeys.
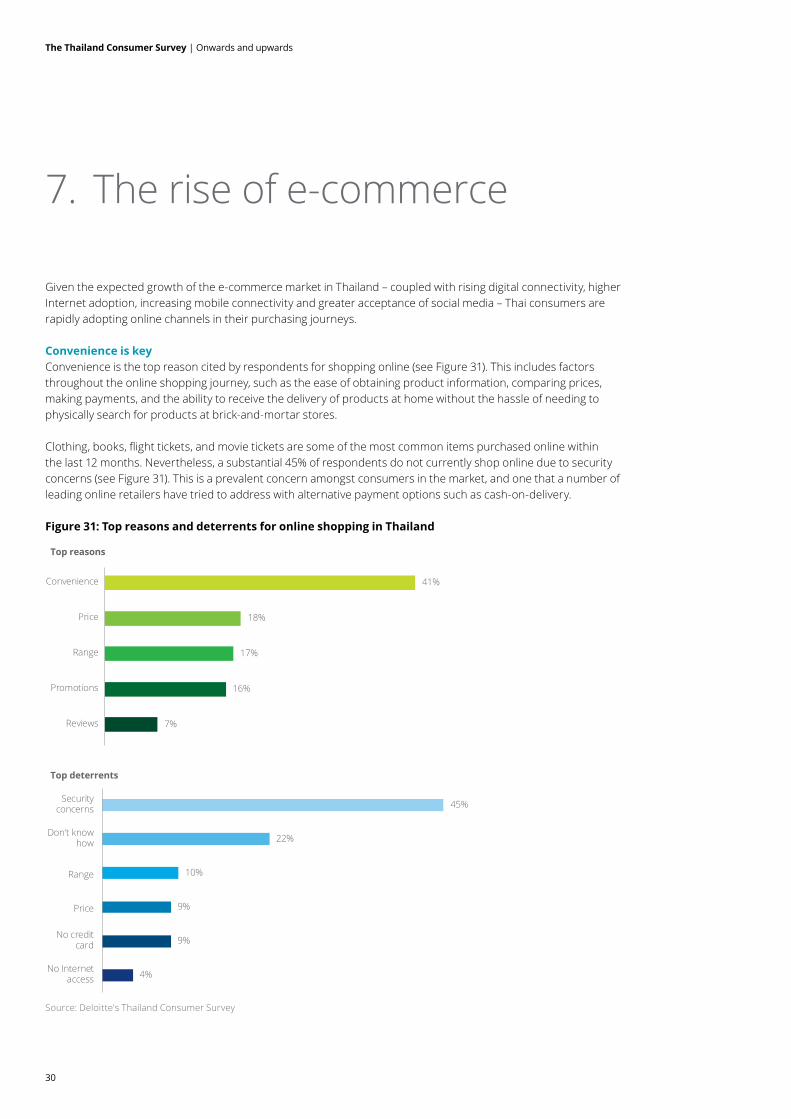
Convenience is keyConvenience is the top reason cited by respondents for shopping online (see Figure 31). This includes factors throughout the online shopping journey, such as the ease of obtaining product information, comparing prices, making payments, and the ability to receive the delivery of products at home without the hassle of needing to physically search for products at brick-and-mortar stores.
Clothing, books, flight tickets, and movie tickets are some of the most common items purchased online within the last 12 months. Nevertheless, a substantial 45% of respondents do not currently shop online due to security concerns (see Figure 31). This is a prevalent concern amongst consumers in the market, and one that a number of leading online retailers have tried to address with alternative payment options such as cash-on-delivery.
Figure 31: Top reasons and deterrents for online shopping in Thailand
41%
18%
17%
16%
7%
Convenience
Price
Range
Promotions
Reviews
45%
22%
10%
9%
9%
4%
Securityconcerns
Don't knowhow
Range
Price
No creditcard
No Internetaccess
Top reasons
Top deterrents
Source: Deloitte's Thailand Consumer Survey

31
The Thailand Consumer Survey | Onwards and upwards
Geographic differencesThe inclination towards e-commerce is not uniform across the two cities of Bangkok and Chiang Mai. Online shopping is more prevalent in Bangkok, where consumers place a greater emphasis on Convenience. In Chiang Mai, on the other hand, many consumer cite the lack of a credit card as the main reason for not shopping online. Hence, providing alternative payment methods such as cash-on-delivery in the smaller cities will be necessary to drive more online traffic (see Figure 32).
Figure 32: Online shopping behaviour by city
36%
24%
64%
76%
Bangkok
Chiang Mai
YesNo
Are you shopping online?
Percentage of survey respondents
44%
32%
18%
19%
17%
20%
15%
18%
6%
10%
Bangkok
Chiang Mai
ConveniencePriceRangePromotionsReviews
Why are you shopping online?
46%
43%
23%
19%
11%
8%
9%
11%
6%
16%
5%
3%
Bangkok
Chiang Mai
Security concerns
Don't know how
Range
Price
No credit card
No Internet access
Why are you not shopping online?
Percentage of survey respondents
Percentage of survey respondents
Source: Deloitte's Thailand Consumer Survey

32
The Thailand Consumer Survey | Onwards and upwards
Looking ahead
In this inaugural report, we explored a number of consumer behaviour patterns uncovered by the recent Deloitte Consumer Insights survey conducted in two major cities in Thailand: Bangkok and Chiang Mai.
There are four key takeaways. Firstly, Thai consumers are relatively sophisticated within Southeast Asia. They are cautiously optimistic, sensible spenders. Although they harbour positive sentiments about the economy, their plans for increased spending are conservative and they typically spend only within their means. Thai consumers are, however, generally not very price-sensitive. This might seem paradoxical at first, but only goes to show the sophistication that they display in making purchasing decisions.
Secondly, our results also revealed the Thai consumer’s behaviour towards trendy products. Specifically, attributes closely related to the concept of trendiness rank highly in terms of importance for the purchase decision of product categories such as Clothing and Footwear, and Electronics and Appliances.
Thirdly, in the major cities like Bangkok and Chiang Mai, Modern Trade channels are the dominant and preferred buying channels for the majority of consumers, with Hypermarkets taking the lead. Traditional Trade, however, continues to hold its appeal for some consumer and product segments due to being conveniently located and perception of being cheaper than modern trade outlets. However, their existence is being threatened by the insurgence of Minimarkets within residential neighbourhoods, offering convenience and 24/7 accessibility. It is worth noting that listing opportunities are higher in Modern Trade channels, and only mass market products with scale are likely to succeed in Traditional Trade channels.
Finally, Thailand’s e-commerce market is fast growing and remains a promising untapped market. Whilst concerns over payment security remains its main roadblock, alternative payment methods such as cash-on-delivery have been one way to encourage greater adoption of online channels.
Despite recent years of economic stagnation, the Thai economy looks poised for inflection towards higher growth. An embodiment of discerning taste, penchant for trendiness and a dose of sensibility, the Thai consumer is one that is moving swiftly onwards and upwards. Consumer products and retail companies who wish to keep up, too, must do the same.
33
The Thailand Consumer Survey | Onwards and upwards
Researched and written by:
Eugene HoExecutive Director, Consulting [email protected]+65 6232 7133
Kavita RekhrajExecutive Director, [email protected]+60 3 7610 9006

34
The Thailand Consumer Survey | Onwards and upwards
Contact us
Southeast Asia C&IP practice
Southeast Asia and SingaporeEugene [email protected]+65 6232 7133
BruneiPengiran [email protected]+673 222 5880
CambodiaKimleng [email protected]+855 2396 3788
GuamMike [email protected]+1 671 646 3884
IndonesiaXenia [email protected]+62 21 2992 3100
MalaysiaKavita [email protected]+60 3 7610 9006
MyanmarAye [email protected]+65 6800 2255
Lao PDRChoopong [email protected]+66 2676 5700
PhilippinesMelissa [email protected]+63 2 581 9000
ThailandManoon [email protected]+66 2676 5700
VietnamNguyen Vu [email protected]+84 4 6288 3568

35
The Thailand Consumer Survey | Onwards and upwards
Deloitte refers to one or more of Deloitte Touche Tohmatsu Limited, a UK private company limited by guarantee (“DTTL”), its network of member firms, and their related entities. DTTL and each of its member firms are legally separate and independent entities. DTTL (also referred to as “Deloitte Global”) does not provide services to clients. Please see www.deloitte.com/about to learn more about our global network of member firms.
Deloitte provides audit, consulting, financial advisory, risk advisory, tax and related services to public and private clients spanning multiple industries. Deloitte serves four out of five Fortune Global 500® companies through a globally connected network of member firms in more than 150 countries and territories bringing world-class capabilities, insights, and high-quality service to address clients’ most complex business challenges. To learn more about how Deloitte’s approximately 245,000 professionals make an impact that matters, please connect with us on Facebook, LinkedIn, or Twitter.
About Deloitte Southeast AsiaDeloitte Southeast Asia Ltd – a member firm of Deloitte Touche Tohmatsu Limited comprising Deloitte practices operating in Brunei, Cambodia, Guam, Indonesia, Lao PDR, Malaysia, Myanmar, Philippines, Singapore, Thailand and Vietnam – was established to deliver measurable value to the particular demands of increasingly intra-regional and fast growing companies and enterprises.
Comprising 290 partners and over 7,400 professionals in 25 office locations, the subsidiaries and affiliates of Deloitte Southeast Asia Ltd combine their technical expertise and deep industry knowledge to deliver consistent high quality services to companies in the region.
All services are provided through the individual country practices, their subsidiaries and affiliates which are separate and independent legal entities.
© 2016 Deloitte Southeast Asia Ltd