Embed Size (px)
Citation preview

135
THE TERM STRUCTURE OF SOVEREIGN SPREADS IN EMERGING MARKETS: A CALIBRATION APPROACH FOR STRUCTURAL MODELS
Katia Rocha Francisco A. Alcaraz Garcia
Originally published by Ipea in October 2004 as number 1048 of the series Texto para Discussão.


DISCUSSION PAPER
135B r a s í l i a , J a n u a r y 2 0 1 5
Originally published by Ipea in October 2004 as number 1048 of the series Texto para Discussão.
THE TERM STRUCTURE OF SOVEREIGN SPREADS IN EMERGING MARKETS: A CALIBRATION APPROACH FOR STRUCTURAL MODELS1
Katia Rocha2 Francisco A. Alcaraz Garcia3
1. The authors would like to thank Ajax Moreira (Ipea), Luis Martins (Fidelity) and João Carlos Scandiuzzi (Pactual) for relevant suggestions and explanations; and also Paulo Levy (Ipea) and Estêvão Kopschitz (Ipea).2. Researcher (Ipea) /Pontifical Catholic University of Rio de Janeiro — PUC-Rio. E-mail: <[email protected]>.3. Visiting Researcher (Pontifical Catholic University of Rio de Janeiro – PUC-Rio) Researcher (Turku Centre for Computer Science — TUCS) Institute for Advanced Management Systems Research – Åbo Akademi University Lemminkäainengatan 14 B.20520. Turku. Finland. E-mail: <[email protected]>.
DISCUSSION PAPER
A publication to disseminate the findings of research
directly or indirectly conducted by the Institute for
Applied Economic Research (Ipea). Due to their
relevance, they provide information to specialists and
encourage contributions.
© Institute for Applied Economic Research – ipea 2015
Discussion paper / Institute for Applied Economic
Research.- Brasília : Rio de Janeiro : Ipea, 1990-
ISSN 1415-4765
1. Brazil. 2. Economic Aspects. 3. Social Aspects.
I. Institute for Applied Economic Research.
CDD 330.908
The authors are exclusively and entirely responsible for the
opinions expressed in this volume. These do not necessarily
reflect the views of the Institute for Applied Economic
Research or of the Secretariat of Strategic Affairs of the
Presidency of the Republic.
Reproduction of this text and the data it contains is
allowed as long as the source is cited. Reproductions for
commercial purposes are prohibited.
Federal Government of Brazil
Secretariat of Strategic Affairs of the Presidency of the Republic Minister Roberto Mangabeira Unger
A public foundation affiliated to the Secretariat of Strategic Affairs of the Presidency of the Republic, Ipea provides technical and institutional support to government actions – enabling the formulation of numerous public policies and programs for Brazilian development – and makes research and studies conducted by its staff available to society.
PresidentSergei Suarez Dillon Soares
Director of Institutional DevelopmentLuiz Cezar Loureiro de Azeredo
Director of Studies and Policies of the State,Institutions and DemocracyDaniel Ricardo de Castro Cerqueira
Director of Macroeconomic Studies and PoliciesCláudio Hamilton Matos dos Santos
Director of Regional, Urban and EnvironmentalStudies and PoliciesRogério Boueri Miranda
Director of Sectoral Studies and Policies,Innovation, Regulation and InfrastructureFernanda De Negri
Director of Social Studies and Policies, DeputyCarlos Henrique Leite Corseuil
Director of International Studies, Political and Economic RelationsRenato Coelho Baumann das Neves
Chief of StaffRuy Silva Pessoa
Chief Press and Communications OfficerJoão Cláudio Garcia Rodrigues Lima
URL: http://www.ipea.gov.brOmbudsman: http://www.ipea.gov.br/ouvidoria
DISCUSSION PAPER
A publication to disseminate the findings of research
directly or indirectly conducted by the Institute for
Applied Economic Research (Ipea). Due to their
relevance, they provide information to specialists and
encourage contributions.
© Institute for Applied Economic Research – ipea 2015
Discussion paper / Institute for Applied Economic
Research.- Brasília : Rio de Janeiro : Ipea, 1990-
ISSN 1415-4765
1. Brazil. 2. Economic Aspects. 3. Social Aspects.
I. Institute for Applied Economic Research.
CDD 330.908
The authors are exclusively and entirely responsible for the
opinions expressed in this volume. These do not necessarily
reflect the views of the Institute for Applied Economic
Research or of the Secretariat of Strategic Affairs of the
Presidency of the Republic.
Reproduction of this text and the data it contains is
allowed as long as the source is cited. Reproductions for
commercial purposes are prohibited.
JEL: G13; G15; F34; G33.

SUMMARY
SINOPSE
ABSTRACT
1 INTRODUCTION 1
2 THE MODEL 3
3 THE DATA 4
4 RESULTS 6
5 SUMMARY AND CONCLUSIONS 11
APPENDIX 11
BIBLIOGRAPHY 12

SINOPSE
Este trabalho apresenta um modelo estrutural para estimar a estrutura a termo dospread soberano e a probabilidade implícita de default em um grupo de paísesemergentes que compõe mais do que 50% do índice EMBIG do JP Morgan. Adinâmica da taxa real de câmbio evolui de acordo com um processo de difusãosimples, e representa a variável indicativa do evento de default. Relaxando-se ahipótese de mercado completo, o modelo calibrado reproduz a estrutura a termo dosspreads de forma consistente com a observada no mercado, gerando desvios absolutosmenores que 30 (México, Rússia e Turquia) ou 60 (Brasil) pontos-base. O modeloproposto é robusto e, portanto, a crítica a respeito dos modelos estruturaissubestimando a magnitude dos spreads deve ser reconsiderada.
Nossos resultados revelam que o mercado está sobreestimando os spreads para oBrasil, enquanto para México, Turquia e Rússia o modelo reproduz o comporta-mento do mercado.
ABSTRACTThis paper proposes a simple structural model to estimate the term structure ofsovereign spreads and the implied default probability of a selected group of emergingcountries, which accounts for more than 50% of the J. P. Morgan EMBIG index.The real exchange rate dynamics, modeled as a pure diffusion process, are assumed totrigger default event. By relaxing the hypothesis of market completeness, thecalibrated model generates sovereign spread curves consistent with market data,giving average deviations below 30 (Mexico, Russia and Turkey) or 60 (Brazil) basispoints over time. We show the robustness of the model and argue that the criticismof structural models for underestimating the magnitude of market spreads should bereconsidered. The results suggest that the market tends to overprice the spreads forBrazil, whereas for Mexico, Russia and Turkey the model reproduces the marketbehavior.
1
1 INTRODUCTIONThe strong performance of investment returns in emerging markets during recentyears seems to have consolidated the role of emerging markets in internationalinvestment portfolios, despite of the crises occurring during the second half of the1990s. As noted in the Global Financial Stability Report published by theInternational Monetary Fund (2004), the strong risk-adjusted returns in emergingsecurities, especially in sovereign bonds, have led many institutional investors tomake strategic portfolio allocations in emerging markets.
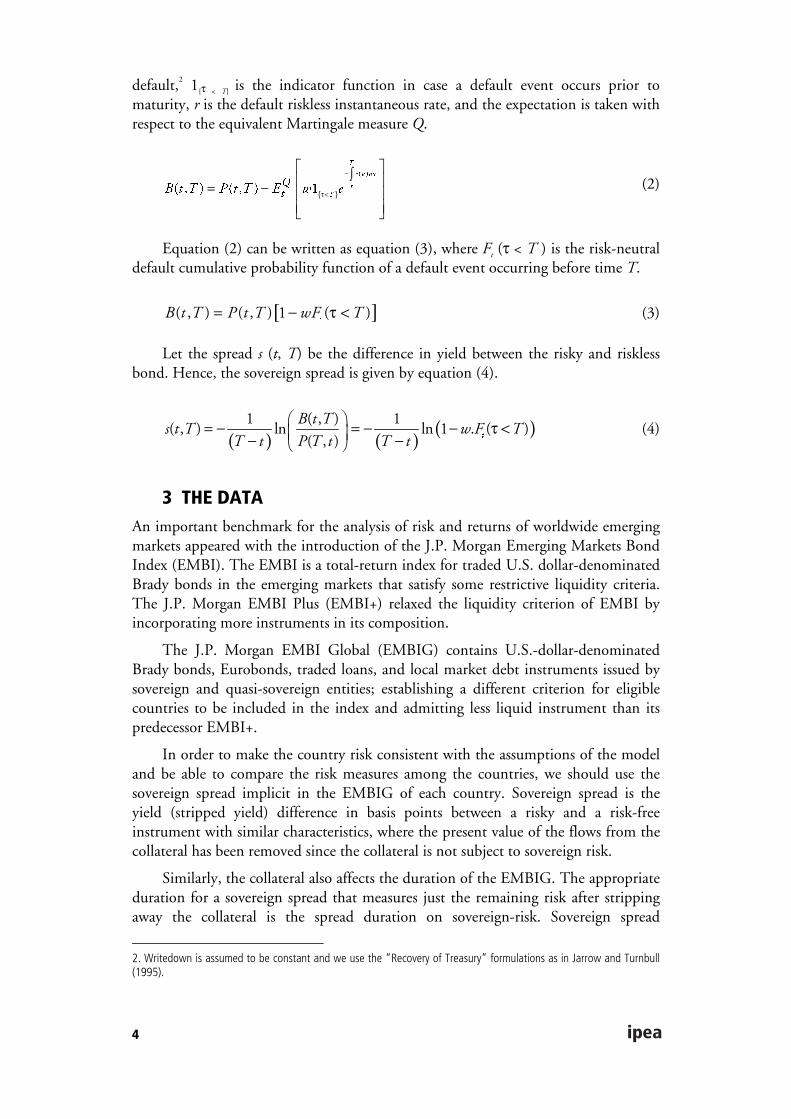
This reallocation has been further increased by the improvement in theemerging markets’ fundamentals and also by the exceptionally low short-term interestrates in the major financial centers. These facts have created a scenario of excess ofliquidity since 2001, especially in 2003, when the emerging market sovereign spreadfell from historical high levels. Figure 1 shows the total return and the annualizeddaily volatility of EMBI Global, S&P500 and GBI-US from January 1998 to July2004.
FIGURE 1INDEX PERFORMANCE
TOTAL RETURN VOLATILITY (% P.A.)
Jan98 Jan99 Jan00 Jan01 Jan02 Jan03 Jan0460
80
100
120
140
160
180
200
EMBIG
GBI-US
SP500
Jan98 Jan99 Jan00 Jan01 Jan02 Jan03 Jan040
10
20
30
40
50
60
EMBIG
GBI-US
SP500
Credit spread, defined as the yield difference between a risky and a riskless bondwith similar characteristics, is related to the implied default probability and credit riskanalysis of the issuer. Implied default probabilities are crucial for credit portfolio riskmanagement and for pricing credit derivatives such as credit default swaps (CDSs).1
There are two broad financial approaches to assess, price, and manage creditrisk: the structural and reduced-form models.
In structural models, initially proposed by Merton (1974), the option-basedapproach is adopted. The risky bond is modeled as a contingent claim over somemeasure related to the economic or financial conditions of the debtor that triggers thedefault event – defined as when such a measure crosses a critical barrier. By makingassumptions about the recovery of capital and interest rate models, the default
1. According to British Bankers’ Association — Credit Derivatives Report (2001/2002), the credit derivatives market isthe fastest-growing segment of the OTC derivatives market, especially after the Asian and Russian crises. This marketgrew from US$ 40 billion outstanding notional value in 1996 to an estimated US$ 4.8 trillion by the end of 2004. In2002, CDSs accounted for roughly 45% of the overall credit derivative market while sovereign CDSs represented around8% of the CDS market.

2
probability is derived endogenously along with the term-structure of credit spread.Relevant extensions of Merton’s model include Black and Cox (1976), Leland(1994), Longstaff and Schwartz (1995), Zhou (1997), and Saá-Requejo and Santa-Clara (1999).
In contrast, reduced-form models, presented by Duffie and Singleton (1999)among others, take the default as an unpredictable event governed by a hazard rateprocess, where the credit spread is not explicitly related to the financial state oreconomic conditions of the bond issuer.
The discussion of the appropriate model to evaluate credit spread is highlycontroversial, tending to state that structural models are better for explaining andreduced models for forecasting. Sarig and Warga (1989) empirically investigates theterm-structure of corporate credit spreads and found it appears to conform to theexisting theoretical results of Merton’s model. Collin-Dufresne, Goldstein, andMartin (2001) suggest that liquidity proxies drive credit-spread changes more thanthe structural variables. Huang and Huang (2002) show that the class of structuralmodels explains about 60-80% of the spread on corporate bonds rated by Moody’s ashigh-risk obligations (Ba), and roughly 100% for those rated as B, i.e., speculative-grade ratings. Hund (2002) points out the difficulty of reconciling the behaviorimplied by the structural models with the realities observed in the credit spreadmarket, and Delianedis and Geske (2002) attribute this empirical finding to marketincompleteness.
The literature on credit risk models applied to sovereign risk is notstraightforward. Cantor and Packer (1996) find that sovereign ratings are broadlyconsistent with macroeconomic fundamentals and spreads. Martins (1997) uses thedefault risk-premium obtained from U.S. speculative long-term corporate bonds toprice Brady bonds. Lehrbass (1999) develops a structural model based on an equityindex of the borrower country expressed in the lender’s foreign currency to analyzeDM-Eurobonds issued by emerging economies. Wiggers (2002) adopts a structuralmodel following the optimal endogenous default approach, where the domesticoutput in lender’s foreign currency represents the default index. Hui and Lo (2002)present a structural model based on foreign exchange rate to explain the sovereignspreads in South Korea and Brazil. Duffie, Pedersen, and Singleton (2002) constructa reduced-form model for pricing sovereign debt with empirical evidence for Russia.Xu and Ghezzi (2002) develop a model that relates the term structure of sovereignspreads in emerging markets to the country’s fiscal dynamics; and Moreira and Rocha(2004) introduce a two-factor structural model based on macroeconomicfundamentals and time-varying risk premiums to forecast Brazilian sovereign risk.
This paper implements a simple calibrated structural model to estimate the termstructure of sovereign spreads and implied default probabilities of a selected group ofemerging countries comprising more than 50% of the EMBIG index.
The indicator triggering default is considered to be the real exchange rate of eachsovereign with respect to the U.S. dollar. Although real exchange rate does notdirectly represent the country’s solvency or liquidity, it has the advantage of being adaily market variable promptly reflecting and capturing changes in daily market

3
spreads, unlike the lower-frequency fundamentals (monthly or even quarterly) usuallyseen in structural models.
The assumption that real exchange rate is interpreted as an indicator of defaultcan be supported by the reasoning that the depreciation in the domestic exchangerate of the sovereign issuer against the denominated sovereign bond currency (usuallyU.S. dollar) puts pressure on the ability of the sovereign issuer to pay its liabilities,increasing the country risk. Such an argument is in agreement with Reinhart’s (2002)results, where 84% of the emerging market defaults are associated with currencycrises, mainly due to the considerable dollar denominated debt in such economies.Therefore, currency devaluation may exacerbate fiscal problems when the economyhas an open capital account but a relatively small tradable sector. Moreover,according to Kaminsky, Lizondo, and Reinhart (1998), real exchange rate is oneparticularly useful indicator in anticipating currency crises.
The paper is organized as follows. The next section introduces the model,Section 3 continues with the data, Section 4 presents the results, and the last sectiondiscusses the main conclusions.
2 THE MODELLet S be the dynamics of the real exchange rate as of July 2004, in the Martingaleequivalent measure, described by the stochastic process of equation (1); where dz isthe Wiener increment, σt is the volatility parameter, and λt is the risk-neutral time-varying drift.
�
� �
���� ��
�= λ + σ (1)
In the absence of arbitrage opportunities, the complete market assumptionimplies that the risk-neutral drift of equation (1) equals the short-term interest ratedifferential between the sovereign issuer and the U.S. dollar market [see Neftci(2000)]. This relation, known as the covered interest rate parity in internationalfinance, is fairly correct for developed countries according to Frankel (1993).However, empirical evidence indicates it fails for emerging economies due to theexistence of country risk that cannot be hedged. Therefore, we assume marketincompleteness in emerging economies and estimate the risk-neutral time-varyingdrift parameter λt by calibration with market data. Bates (1991) used a similarapproach in order to explain the 1987 stock market crash.
The default event is triggered the first time the real exchange rate variable Scrosses the default barrier α, i.e., when the exchange rate reaches a value that makesthe debt’s repayment unlikely. The moment of default is uncertain and has aprobability distribution function (first hitting time) shown in Appendix.
The price of a default risky zero coupon bond B (t, T ) with a principal of $1maturing at time T is given by equation (2), where P (t, T ) is the price of a defaultriskless zero coupon bond with the same characteristics, w is the writedown in case of
4
default,2 1{τ < T} is the indicator function in case a default event occurs prior tomaturity, r is the default riskless instantaneous rate, and the expectation is taken withrespect to the equivalent Martingale measure Q.
{ }
� �
� � � � � � �
�
� � ��
�
�
��� � � � � � � � �
−
τ<
∫ = −
(2)
Equation (2) can be written as equation (3), where Ft (τ < T ) is the risk-neutraldefault cumulative probability function of a default event occurring before time T.
[ ]� � � � � � � � ��
� � � � � � � �= − τ < (3)
Let the spread s (t, T) be the difference in yield between the risky and risklessbond. Hence, the sovereign spread is given by equation (4).
( ) ( ) ( )� � � � �� � � �� �� � � � �
� � ��
� � � � � � �
� � � � � � �
= − = − − τ < − − (4)
3 THE DATAAn important benchmark for the analysis of risk and returns of worldwide emergingmarkets appeared with the introduction of the J.P. Morgan Emerging Markets BondIndex (EMBI). The EMBI is a total-return index for traded U.S. dollar-denominatedBrady bonds in the emerging markets that satisfy some restrictive liquidity criteria.The J.P. Morgan EMBI Plus (EMBI+) relaxed the liquidity criterion of EMBI byincorporating more instruments in its composition.
The J.P. Morgan EMBI Global (EMBIG) contains U.S.-dollar-denominatedBrady bonds, Eurobonds, traded loans, and local market debt instruments issued bysovereign and quasi-sovereign entities; establishing a different criterion for eligiblecountries to be included in the index and admitting less liquid instrument than itspredecessor EMBI+.
In order to make the country risk consistent with the assumptions of the modeland be able to compare the risk measures among the countries, we should use thesovereign spread implicit in the EMBIG of each country. Sovereign spread is theyield (stripped yield) difference in basis points between a risky and a risk-freeinstrument with similar characteristics, where the present value of the flows from thecollateral has been removed since the collateral is not subject to sovereign risk.
Similarly, the collateral also affects the duration of the EMBIG. The appropriateduration for a sovereign spread that measures just the remaining risk after strippingaway the collateral is the spread duration on sovereign-risk. Sovereign spread
2. Writedown is assumed to be constant and we use the “Recovery of Treasury” formulations as in Jarrow and Turnbull(1995).

5
duration is defined as the percentage price change per basis-point change in thesovereign spread, and can also be interpreted as an average maturity of the index(without collateral). Thus, we have a series of sovereign spreads for every emergingcountry and their corresponding sovereign spread durations, from which we calibratethe model.
To test the performance of our analysis, we choose the EMBIG for Brazil,Mexico, Russia, and Turkey, which correspond roughly to 58% of the EMBIGcomposite on July 15, 2004. The sovereign spreads of the selected emergingeconomies since January 2000 are shown in Figure 2, and the composition bycountry of the EMBIG as of July 15, 2004 in Figure 3.
FIGURE 2SOVEREIGN SPREADS
Jan00 Jul00 Jan01 Jul01 Jan02 Jul02 Jan03 Jul03 Jan04 Jul040
500
1000
1500
2000
2500
3000
Bas
is P
oint
s
Brazil
Mexico
Russia
Turkey
FIGURE 3EMBIG INDEX COUNTRY WEIGHTS, %
1,9
19,1
1,4 1,8 1,4
3,6
0,1 0,31,3 0,7 0,9 0,3 0,4
1,7
4,0
18,4
0,41,3
0,2
1,9 2,5
4,9
1,4
13,8
1,9
0,3 0,3
6,4
1,1 0,9
5,4
0
5
10
15
20
25
Arg
entin
a
Bul
garia
Chi
na
Cot
e d'
Ivoi
re
Ecu
ador
El S
alva
dor
Indo
nesi
a
Mal
aysi
a
Mor
occo
Pak
ista
n
Per
u
Pol
and
Sou
th A
fric
a
Tun
isia
Ukr
aine
Ven
ezue
la
The average defaulted debt recovery rate for sovereign bonds is taken fromMoody’s Special Comment (2003), giving an average value of roughly 40%. Hence,the corresponding writedown value w is 60%.

6
Nominal exchange rate data for each emerging country were converted into realexchange rate with the consumer price indices available from the IMF’s InternationalFinance Statistics. Figure 4 shows the real exchange rate of the selected countriessince January 1995, in U.S. dollars of July 2004, and the maximum rate achieved.
FIGURE 4REAL EXCHANGE RATE
Jan95 Jan96 Jan97 Jan98 Jan99 Jan00 Jan01 Jan02 Jan03 Jan040
300
600
900
1200
1500
1800
2100
2400
2700
3000
TR
L / $
(in
thou
sand
s)
2099.50↓
Turkey Brazil
Jan95 Jan96 Jan97 Jan98 Jan99 Jan00 Jan01 Jan02 Jan03 Jan040
0.6
1.2
1.8
2.4
3
3.6
4.2
4.8
5.4
6
BR
L / $
↓4.45
Jan95 Jan96 Jan97 Jan98 Jan99 Jan00 Jan01 Jan02 Jan03 Jan048
9.2
10.4
11.6
12.8
14
15.2
16.4
17.6
18.8
20
MX
N /
$
↓18.01
Mexico Russia
Jan95 Jan96 Jan97 Jan98 Jan99 Jan00 Jan01 Jan02 Jan03 Jan0420
23
26
29
32
35
38
41
44
47
50
RU
B / $
↓48.24
Figure 5 shows the historical annualized daily volatility parameter σt of equation(1), estimated in a running window of 60 days since January 2003.
FIGURE 5ANNUAL VOLATILITY
Jan03 Mar03 May03 Jul03 Sep03 Nov03 Jan04 Mar04 May04 Jul040
5
10
15
20
25
30
35
40
45
Vol
atili
ty, %
Brazil
Mexico
Russia
Turkey
4 RESULTSThe calibration process employed in this study is similar to that used by marketpractitioners. The risk-neutral time-varying drift parameter λt is calibrated with themost liquid instrument (in our case the benchmark EMBIG of each country) and

7
then used as an input for pricing the less liquid ones (the real instruments included inthe country’s EMBIG). By constantly updating the calibrated parameter, we are ableto incorporate all market information available up to date.
The period of our study starts in September 2003 up to July 2004. The timeseries of the EMBIG sovereign spread and duration are available on a daily basissince, however, the real instruments used for the estimation of the default barrier aretaken on a weekly basis due to data access limitations.
The default barrier is estimated by minimizing the mean square error betweenthe sovereign spreads generated by the model and those of the real instruments.While the estimated barrier is updated weekly and kept constant over the next week,the risk-neutral time-varying drift is calibrated with the daily EMBIG sovereignspread and duration for every country. The calibrated parameter is used as an inputto equation (4) to calculate the term structure of sovereign spreads, which iscompared to the one observed in the market.
To verify how the model fits the actual market data, Figure 6 plots the termstructure of sovereign spreads generated by the model versus that observed in themarket for the last two months of our study. The cross-marks in the graphsrepresents the country’s EMBIG used in the sovereign term structure calculation.
FIGURE 6MODEL VERSUS MARKET SPREAD
BRAZIL
1 2 3 4 5 6 7 8 9 10 11 120
100
200
300
400
500
600
700
800
900
CBr40Br27
DCB
Br09
Brazil 06/15/04
Bas
is P
oint
s
Duration in Years
modelcountry instruments
1 2 3 4 5 6 7 8 9 10 11 120
100
200
300
400
500
600
700
800
C
Br40Br27
DCBBr09
Brazil 07/15/04
Bas
is P
oint
s
Duration in Years
modelcountry instruments
TURKEY
1 2 3 4 5 6 7 8 9 10 11 120
100
200
300
400
500
600
Tr30Tr13Tr10
Tr97
/8%08
Tr09
Turkey 06/15/04
Bas
is P
oint
s
Duration in Years
modelcountry instruments
1 2 3 4 5 6 7 8 9 10 11 120
50
100
150
200
250
300
350
400
450Tr30
Tr10 Tr13
Tr97
/8%08
Tr09
Turkey 07/15/04
Bas
is P
oint
s
Duration in Years
modelcountry instruments

8
MEXICO
1 2 3 4 5 6 7 8 9 10 11 120
50
100
150
200
250
300
350
Mx31
Mx16
Mx33
Mx11
Mx19
Mexico 06/15/04
Bas
is P
oint
s
Duration in Years
modelcountry instruments
1 2 3 4 5 6 7 8 9 10 11 120
50
100
150
200
250
300
350
Mx31
Mx16
Mx33
Mx19
Mx11
Mexico 07/15/04
Bas
is P
oint
s
Duration in Years
modelcountry instruments
RUSSIA
1 2 3 4 5 6 7 8 9 10 11 120
50
100
150
200
250
300
350
Ru30MF18
MF28
MF05
Ru10
Russia 06/15/04
Bas
is P
oint
s
Duration in Years
modelcountry instruments
1 2 3 4 5 6 7 8 9 10 11 120
50
100
150
200
250
300
350
Ru30MF18
MF28
Ru10MF07
Russia 07/15/04
Bas
is P
oint
s
Duration in Years
modelcountry instruments
The term structure of the sovereign spreads obtained is in conformity toempirical findings of corporate credit spreads, suggesting a hump-shaped termstructure for speculative-grade sovereigns (Brazil and Turkey) and an upward slopingone for investment-grade sovereigns (Mexico and Russia).
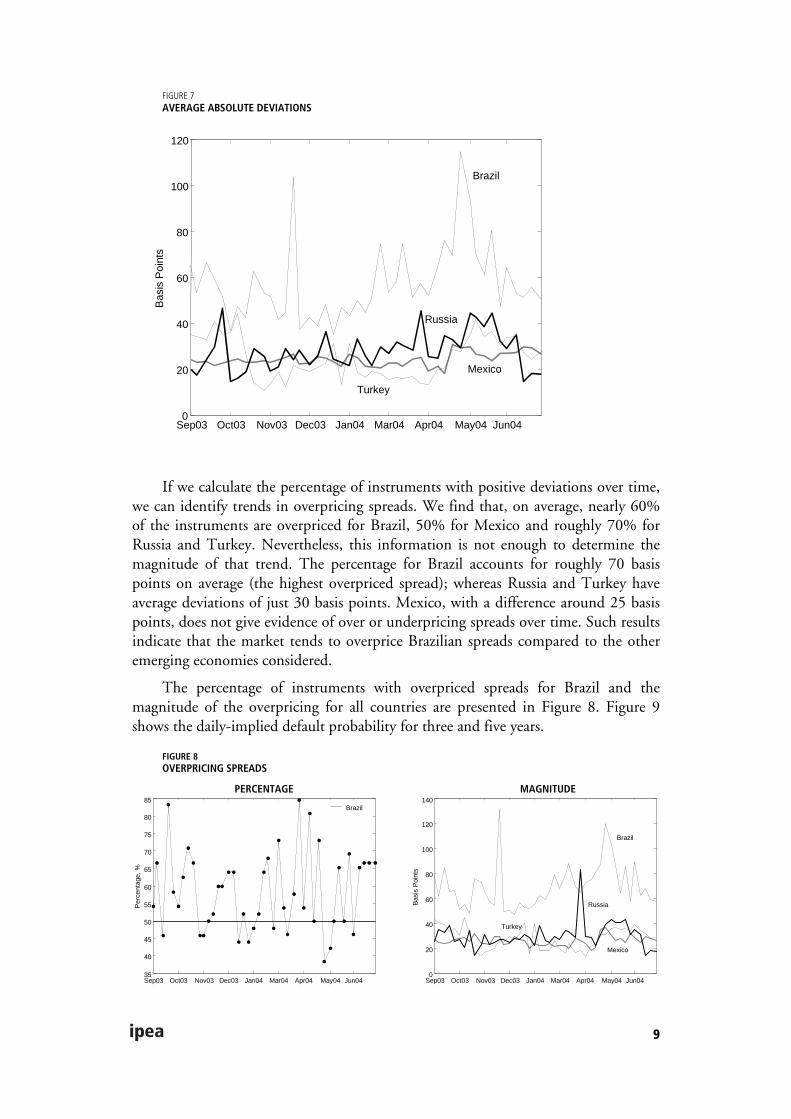
Figure 7 shows the average of absolute deviations in basis points of the modelcompared to the market data over time. This measure is quite stable during the studyperiod and indicates a more accurate fit for Mexico, Russia and Turkey than forBrazil, probably due to the higher volatility of the Brazilian currency (the Real) asshown in Figure 5. Considering the deviations for the short-, medium- and long-term sovereign spreads, set to less than three years, from three to five years, and overfive years duration respectively, we found no strong evidence of a systematicunderpricing bias in the short-term spreads generated by the model.
Deviations are on average less than 30 basis points for Mexico, Russia andTurkey, and less than 60 basis points for Brazil, thus supporting the evidence for themodel’s consistency. Moreover, we find Russia and Turkey with more than 80% onaverage of their instruments within a deviation of less than 50 basis points, Mexicowith more than 90%, while the proportion for Brazil is nearly 60%.
9
FIGURE 7AVERAGE ABSOLUTE DEVIATIONS
Sep03 Oct03 Nov03 Dec03 Jan04 Mar04 Apr04 May04 Jun040
20
40
60
80
100
120
Bas
is P
oint
s
Brazil
Mexico
Russia
Turkey
If we calculate the percentage of instruments with positive deviations over time,we can identify trends in overpricing spreads. We find that, on average, nearly 60%of the instruments are overpriced for Brazil, 50% for Mexico and roughly 70% forRussia and Turkey. Nevertheless, this information is not enough to determine themagnitude of that trend. The percentage for Brazil accounts for roughly 70 basispoints on average (the highest overpriced spread); whereas Russia and Turkey haveaverage deviations of just 30 basis points. Mexico, with a difference around 25 basispoints, does not give evidence of over or underpricing spreads over time. Such resultsindicate that the market tends to overprice Brazilian spreads compared to the otheremerging economies considered.
The percentage of instruments with overpriced spreads for Brazil and themagnitude of the overpricing for all countries are presented in Figure 8. Figure 9shows the daily-implied default probability for three and five years.
FIGURE 8OVERPRICING SPREADS
PERCENTAGE MAGNITUDE
Sep03 Oct03 Nov03 Dec03 Jan04 Mar04 Apr04 May04 Jun0435
40
45
50
55
60
65
70
75
80
85
Per
cent
age,
%
Brazil
Sep03 Oct03 Nov03 Dec03 Jan04 Mar04 Apr04 May04 Jun040
20
40
60
80
100
120
140
Bas
is P
oint
s
Brazil
Mexico
Russia
Turkey

10
FIGURE 9IMPLIED DEFAULT PROBABILITY
3 YEARS 5 YEARS
Sep03 Nov03 Jan04 Mar04 May04 Jul040
5
10
15
20
25
30
35
40
45
Pro
babi
lity,
%
Brazil
Mexico
Russia
Turkey
Sep03 Nov03 Jan04 Mar04 May04 Jul0410
15
20
25
30
35
40
45
50
55
Pro
babi
lity,
%
Brazil
Mexico
Russia
Turkey
The implied default probability distribution decreases sharply in the autumn of2003, after the turmoil of the Argentina crisis in 2002 and the Brazilian elections inOctober 2002. Such a performance was achieved via improvements in the country-specific fundamentals combined with the high global liquidity in 2003. Thisfavorable external environment changed in the beginning of 2004 with theexpectation of an increase in U.S. interest rates and rising oil prices, especially in May2004.
The table below shows the estimates of the implied (risk-neutral) cumulativedefault probability for the last day in the sample (July 15, 2004) and the issuer-weighted cumulative sovereign default rates available in Moody’s Special Comment(2003).
As expected, the implied (risk-neutral) default probabilities are higher than thehistorical ones estimated by the credit rating agency.
CUMULATIVE DEFAULT PROBABILITIES[%]
Year 1 Year 2 Year 3 Year 4 Year 5 Year 6 Year 7 Year 8 Year 9 Year 10
Implied default probabilities
Mexico Baa2 0.03 1.26 4.74 9.43 14.43 19.32 23.93 28.19 32.10 35.68
Russia Baa3 0.66 5.58 11.98 17.96 23.16 27.64 31.51 34.88 37.84 40.46
Turkey B1 0.75 6.68 14.57 21.99 28.45 34.01 38.80 42.96 46.60 49.81
Brazil B2 1.88 12.55 24.58 34.93 43.43 50.40 56.18 61.01 65.10 68.59
Moody’s data on sovereign default rate (January 1985–December 2002)
Baa 0.00 0.00 0.00 0.00 0.00 0.00 0.00 0.00 0.00 0.00
B 7.89 14.25 18.33 18.33 22.22 27.08 32.69 38.81 45.61 53.38
Investment grade 0.00 0.00 0.00 0.00 0.00 0.00 0.00 0.00 0.00 0.00
Speculative grade 3.87 7.87 10.62 14.19 16.59 19.74 23.75 28.67 35.47 45.39
11
5 SUMMARY AND CONCLUSIONSThis paper proposes a structural model for estimating the term structure of sovereignspreads and implied default probabilities in emerging countries that account for morethan 50% of the EMBIG index. The real exchange rate is assumed to trigger thedefault event, and since it is a daily market variable, it captures changes in dailyspread sooner than do low-frequency fundamentals (monthly or quarterly).
Once the model is calibrated, the results show that the term structure ofsovereign spreads agrees with empirical findings, thus supporting the structuralapproach. They suggest a hump-shaped term structure for speculative-gradesovereigns (Brazil and Turkey) and an upward sloping one for investment-gradecountries (Mexico and Russia).
The fit of the model over time indicates robustness, with greater accuracy forMexico, Russia and Turkey than for Brazil, probably due to the higher volatility ofBrazil’s currency. The small average of absolute deviations over time of less than 30basis points for Mexico, Russia and Turkey, and less than 60 basis points for Brazil,supports the evidence in favor to the model.
According to the model, the market tends to overprice the spreads for Brazil,whereas it replicates the market behavior Mexico, Russia and Turkey. As expected,implied (risk-neutral) default probabilities are higher than the historical onesavailable from Moody’s.
The use of other proxies triggering default, such as sovereign equity indices andthe application of CDS sovereign spreads instead of bonds are left for future research.
APPENDIX
FIRST HITTING TIME DISTRIBUTIONLet the following be a stochastic process with dz as a Wiener process.
dx = λt dt + σt dz (A1)
Following Karatzas and Shreve (1991), the first passage time density of xevaluated at τ > t, i.e., τ = inf {t ≥ 0 , x (t) > 0}, is given by equation (A2).
π(τ | xt, λt, σt) = �
��
� � �����
�� � �� � �
� � �
��
� � �
��
+ λ τ −− σ τ −σ π τ − (A2)
Through Ito’s Lemma, we have that if S follows equation (1), then xt = ln (St/α)follows the following stochastic differential equation:
dx = (λt – 0.5σ2) dt + σt dz (A3)

12
Hence, the first passage time density of S evaluated at τ > t, i.e., τ = inf {t ≥ 0, S(t) ≥ α} is given by equation (A4).
( )( )��
��
� � � �� � �� �� � �� � � � � � ���
� � �� � �
� � ��
� � �
��
� ���
��
α + λ − σ τ−α π τ λ σ α = − σ τ −σ π τ−
(A4)
The cumulative distribution function is given by equation (A5), where “φ(.)” isthe cumulative normal distribution function.
( )
( )
�
�
�
�
�� ���� �� �
�
� � �� ���� �� ��
�� ���� �� �
�
�
�
� �
�
�
�
��
� ��
� �
��� �
�
��
� ��
�� �
− λ − σ − α − φ +
σ − τ < = λ − σ α
σ − − λ − σ − α + φ
σ −
(A5)
BIBLIOGRAPHYBATES, D. S. The crash of ‘87, was it expected? The evidence from options markets. Journal
of Finance, v. 46, p. 1.009-1.044, 1991.
BLACK, F., COX, J. Valuing corporate securities: some effects of bond indenturesprovisions. Journal of Finance, v. 31, p. 351-367, 1976.
BRITISH BANKERS’ ASSOCIATION. Credit Derivatives Report, 2001/2002.
CANTOR, R., PACKER, F. Determinants and impact of sovereign credit ratings. FederalReserve Bank NY Economic Policy Review, p. 37-54, 1996.
COLLIN-DUFRESNE, P., GOLDSTEIN, R., MARTIN, J. The determinants of creditspread changes. Journal of Finance, v. 56, p. 2.177-2.207, 2001.
DELIANEDIS, G., GESKE, R. The components of corporate credit spreads: default, recovery,tax, jumps, liquidity, and market factors. UCLA: Anderson Graduate School ofManagement, Finance Department, 2002 (working paper).
DUFFIE, D., PEDERSEN, L., SINGLETON, K. Modeling sovereign yield spreads: a casestudy of Russian debt. Stanford University, 2001 (working paper).
DUFFIE, D., SINGLETON, K. Modeling term structures of defaultable bonds. Review ofFinancial Studies, v. 12, p. 687-720, 1999.
13
FRANKEL, J. A. Quantifying international capital mobility in the 1980s. On ExchangeRates, Cambridge: MIT Press, 1993.
HUANG, J., HUANG, M. How much of the corporate-treasury yield spread is due to creditrisk? A new calibration approach. Stanford University, 2002 (working paper).
HUND, J. Default probability dynamics in structural models. A. B. Freeman School ofBusiness, Tulane University, 2002 (working paper).
HUI, C., LO, C. F. Valuation model of defaultable bond values in emerging markets. Asia-Pacific Financial Markets, v. 9, p. 45-60, 2002.
IMF. Market developments and issues. Global Financial Stability Report, Apr. 2004.
JARROW, R., TURNBULL, S. Pricing derivatives on financial securities subject to creditrisk. Journal of Finance, v. 50, p. 53-85, 1995.
J. P. MORGAN. Introducing the J. P. Morgan emerging markets bond index global (EmbiGlobal). J. P. Morgan Securities Inc. Emerging Markets Research, 1999.
KAMINSKY, G., LIZONDO, S., REINHART, C. Leading indicators of currency crises.IMF Staff Papers, v. 5, p. 1-48, 1998.
KARATZAS, I., SHREVE, S. Brownian motion and stochastic calculus. 2nd ed. Springer-Verlag, 1991.
LEHRBASS, F. A simple approach to country risk. WestLB, Germany, 1999 (working paper).
LELAND, H. Corporate debt value, bond covenants, and optimal capital structure. Journalof Finance, v. 49, p. 1.213-1.252, 1994.
LONGSTAFF, F. A., SCHWARTZ, E. S. A simple approach to valuing risky fixed andfloating rate debt. Journal of Finance, v. 50, p. 789-819, 1995.
MARTINS, L. Market-implied, risk-averse probability of default in the Brady universe. In:LEDERMAN, J., PETTIS, M. (eds.). The new dynamics of emerging markets investment:managing sub-investment-grade sovereign risk. Euromoney, May 1997.
MERTON, R. C. On the pricing of corporate debt: the risk structure of interest rates.Journal of Finance, v. 29, p. 449-470, 1974.
MOODY’S SPECIAL COMMENT. Sovereign bonds defaults, rating transitions, andrecoveries (1985-2002). Moody’s Investor Service, Feb. 2003.
MOREIRA, A., ROCHA, K. A two-factor structural model of determinants of Braziliansovereign risk. Journal of Fixed Income, v. 14, p. 48-59, 2004.
NEFTCI, S. N. An introduction to the mathematics of financial derivatives. 2nd ed. AcademicPress, 2000.
REINHART, C. M. Default, currency crises and sovereign credit ratings. NBER, 2002(Working Paper Series, 8.738).
SAÁ-REQUEJO, J., SANTA-CLARA, P. Bond pricing with default risk. Los Angeles: TheAnderson Graduate School of Management, UCLA, 1999.
SARIG, O., WARGA, A. Some empirical estimates of the risk structure of interest rates.Journal of Finance, v. 44, p. 1.351-1.360, 1989.

14
WIGGERS, A. Default-risky sovereign debt. University of Bonn, 2002 (working paper).
XU, D., GHEZZI, P. From fundamentals to spread — a fair spread model for high yield EMsovereigns. Global Markets Research. Deutsche Bank, 2002.
ZHOU, C. A jump-diffusion approach to modeling credit risk and valuing defaultable securities.Washington, D.C.: Federal Reserve Board, 1997 (working paper).

Ipea – Institute for Applied Economic Research
PUBLISHING DEPARTMENT
CoordinationCláudio Passos de Oliveira
SupervisionEverson da Silva MouraReginaldo da Silva Domingos
TypesettingBernar José VieiraCristiano Ferreira de AraújoDaniella Silva NogueiraDanilo Leite de Macedo TavaresDiego André Souza SantosJeovah Herculano Szervinsk JuniorLeonardo Hideki Higa
Cover designLuís Cláudio Cardoso da Silva
Graphic designRenato Rodrigues Buenos
The manuscripts in languages other than Portuguese published herein have not been proofread.
Ipea Bookstore
SBS – Quadra 1 − Bloco J − Ed. BNDES, Térreo 70076-900 − Brasília – DFBrazilTel.: + 55 (61) 3315 5336E-mail: [email protected]


Composed in Adobe Garamond 11/13.2 (text)Frutiger 47 (headings, graphs and tables)
Brasília – DF – Brazil


Ipea’s missionEnhance public policies that are essential to Brazilian development by producing and disseminating knowledge and by advising the state in its strategic decisions.