Embed Size (px)
Citation preview
The TDCR method in LSC
P. Cassette
Laboratoire National Henri Becquerel
CEA/LNE, France
LIQUID SCINTILLATION USERS’ FORUM 2009
Summary
I. Some information on LSC
II. LSC in metrology: the free parameter model
III. The Triple to Double Coincidence Ratio method
IV. Uncertainty evaluation
V. Practical information

I. General information on LSC
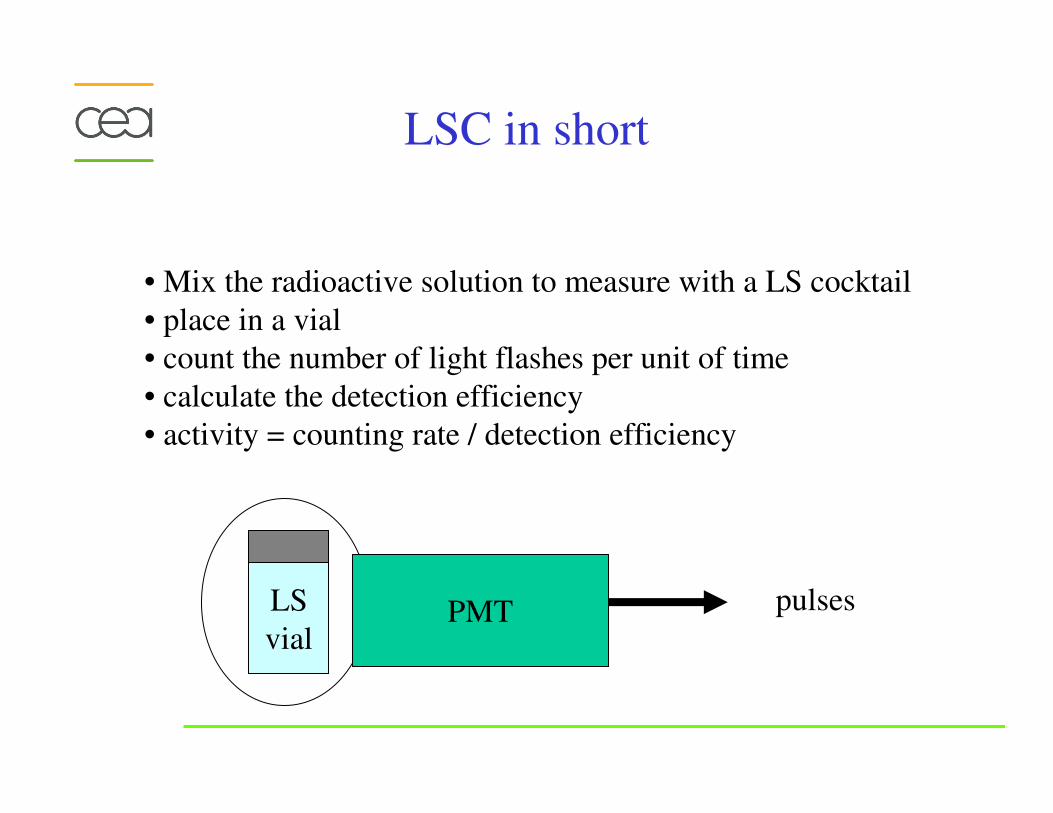
LSC in short
• Mix the radioactive solution to measure with a LS cocktail
• place in a vial
• count the number of light flashes per unit of time
• calculate the detection efficiency
• activity = counting rate / detection efficiency
LS
vial
pulsesPMT
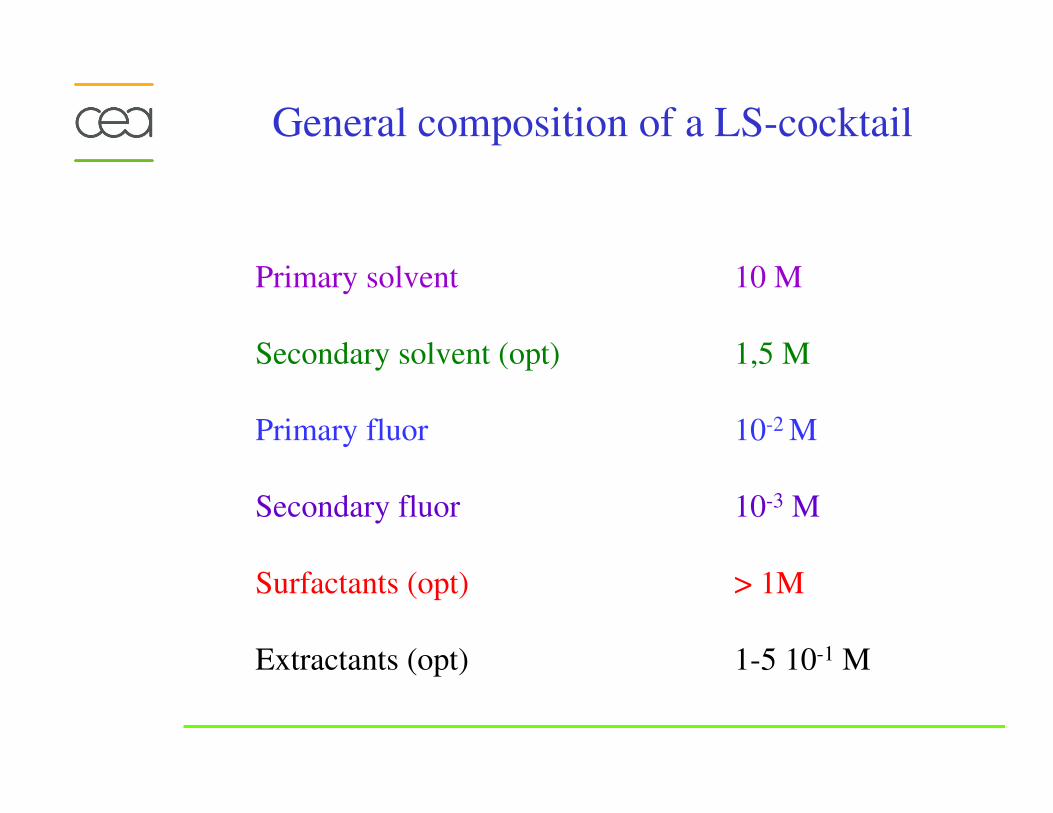
General composition of a LS-cocktail
Primary solvent 10 M
Secondary solvent (opt) 1,5 M
Primary fluor 10-2 M
Secondary fluor 10-3 M
Surfactants (opt) > 1M
Extractants (opt) 1-5 10-1 M
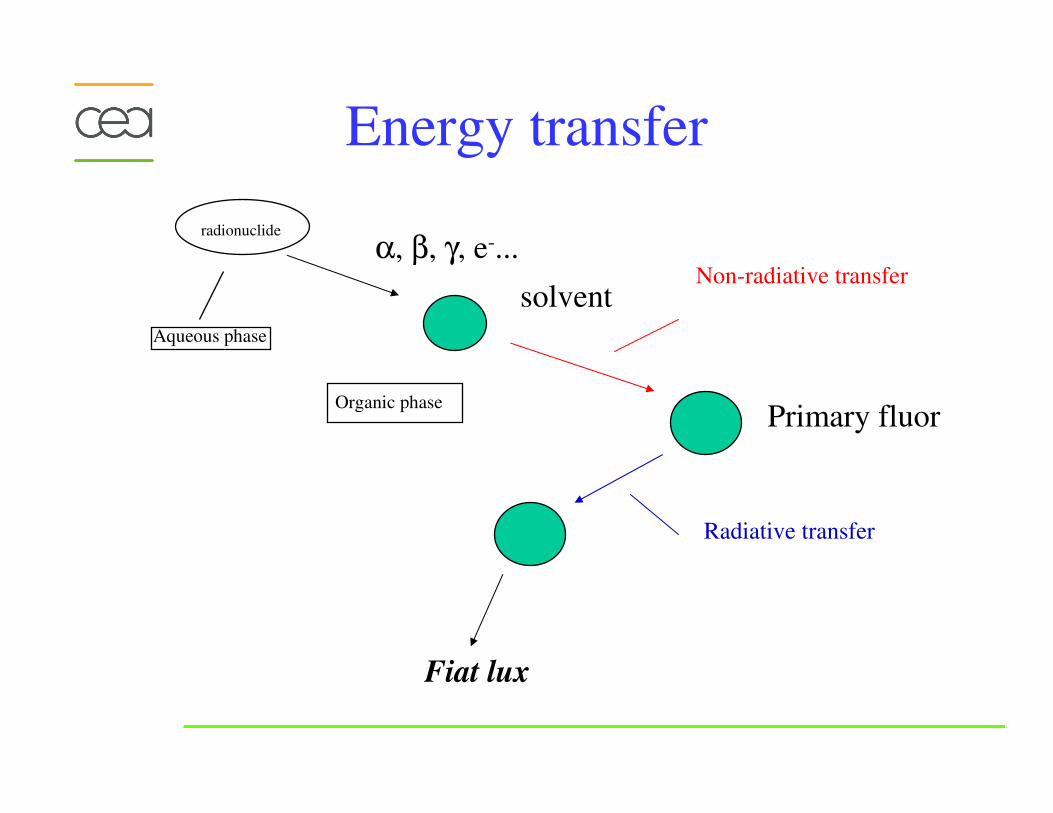
Energy transfer
radionuclide
solvent
Primary fluor
Fiat lux
α, β, γ, e-...
Organic phase
Aqueous phase
Non-radiative transfer
Radiative transfer
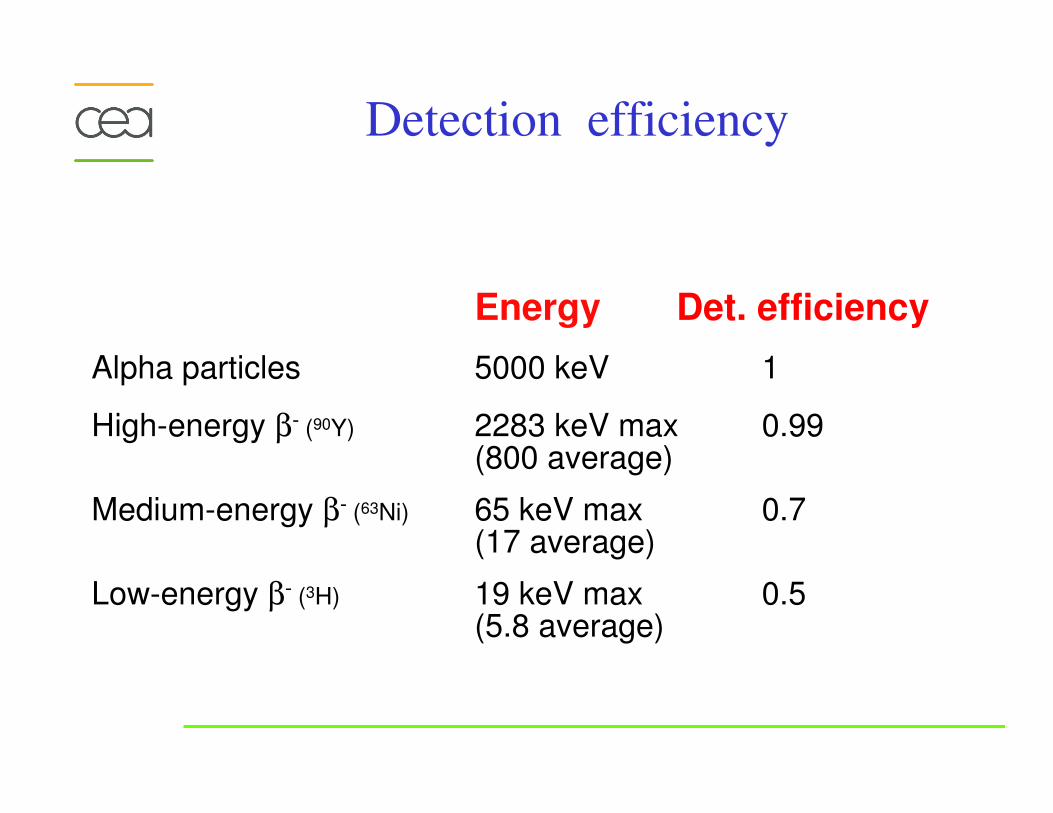
Detection efficiency
Energy Det. efficiency
Alpha particles 5000 keV 1
High-energy β- (90Y) 2283 keV max 0.99(800 average)
Medium-energy β- (63Ni) 65 keV max 0.7(17 average)
Low-energy β- (3H) 19 keV max 0.5(5.8 average)
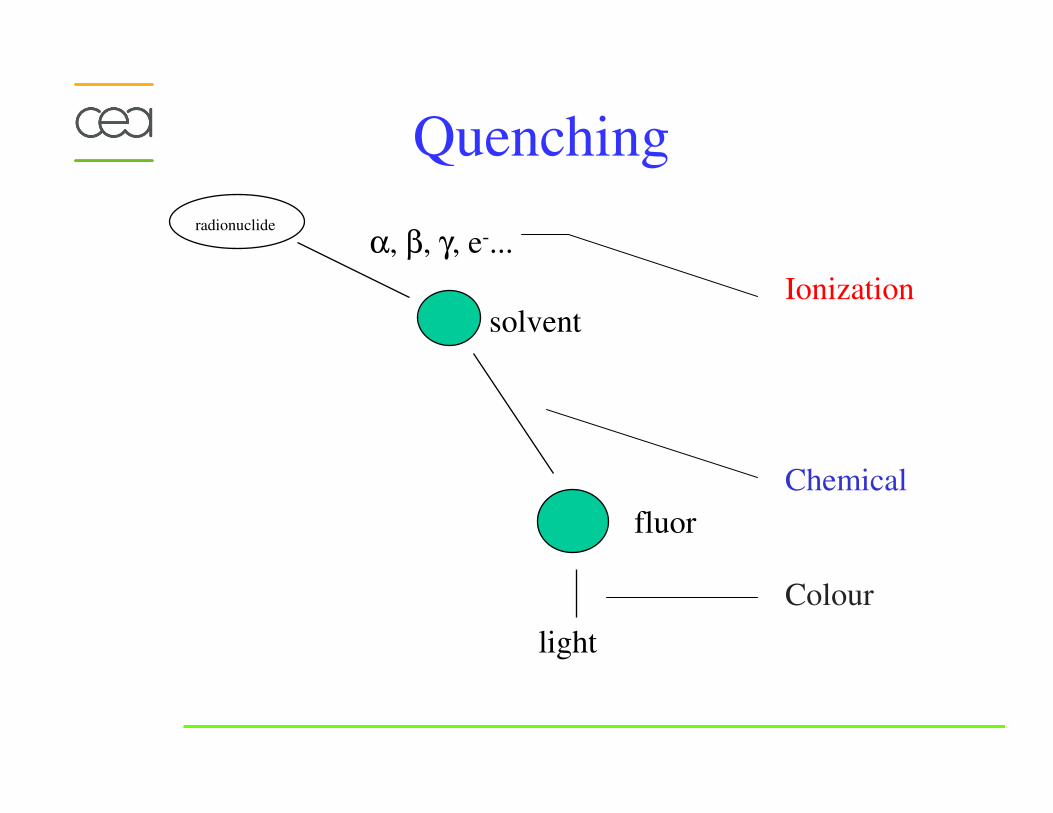
Quenching
radionuclide
solvent
fluor
light
α, β, γ, e-...
Ionization
Chemical
Colour
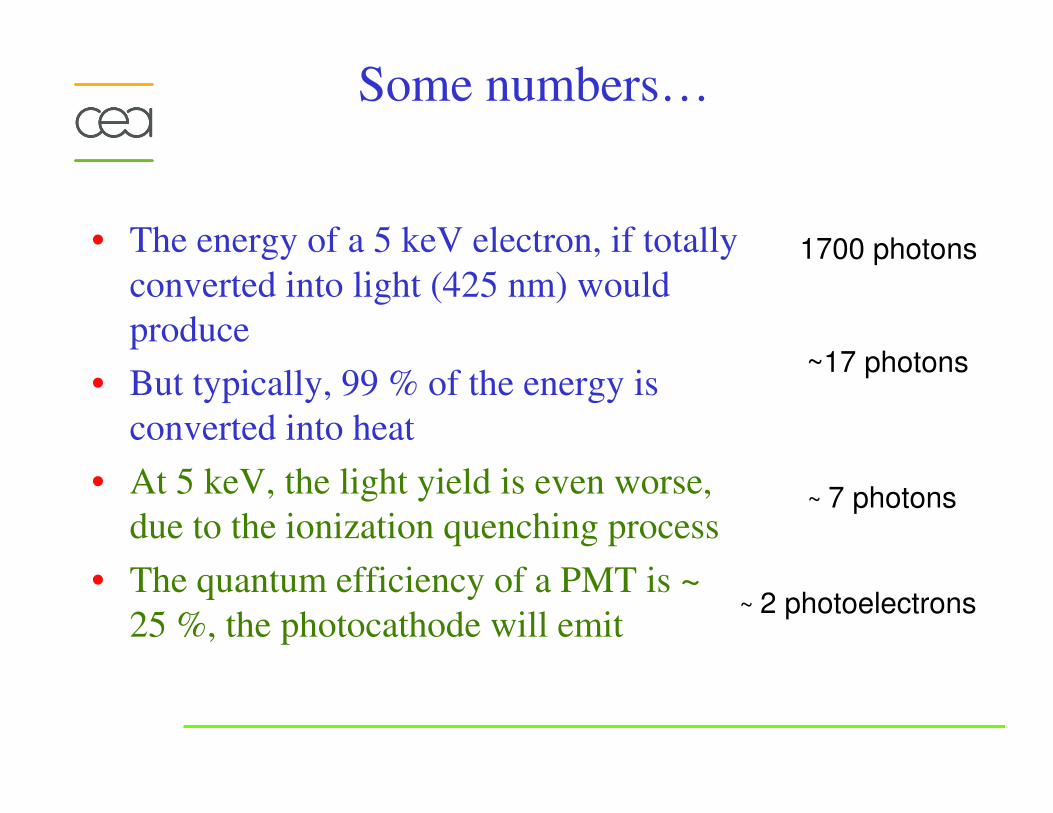
Some numbers…
• The energy of a 5 keV electron, if totally
converted into light (425 nm) would
produce
• But typically, 99 % of the energy is
converted into heat
• At 5 keV, the light yield is even worse,
due to the ionization quenching process
• The quantum efficiency of a PMT is ~
25 %, the photocathode will emit
1700 photons
~17 photons
~ 7 photons
~ 2 photoelectrons
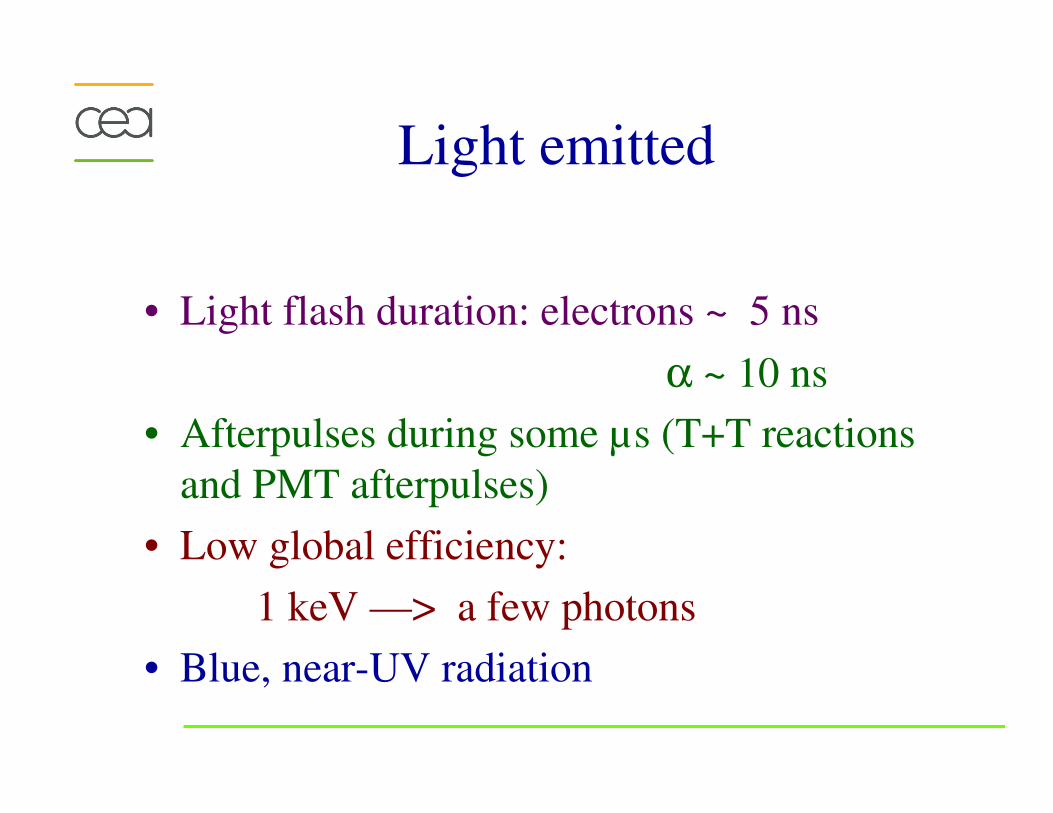
Light emitted
• Light flash duration: electrons ~ 5 ns
α ~ 10 ns
• Afterpulses during some µs (T+T reactions
and PMT afterpulses)
• Low global efficiency:
1 keV —> a few photons
• Blue, near-UV radiation
II. LSC in metrology, the free
parameter model
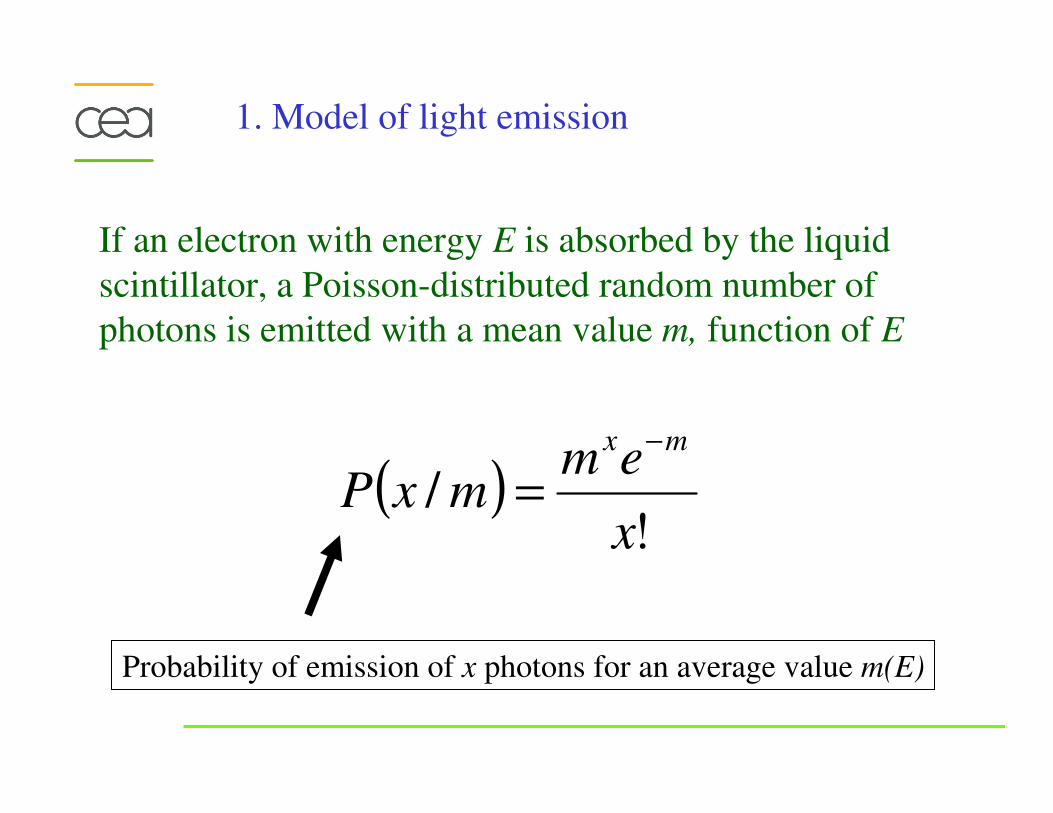
If an electron with energy E is absorbed by the liquid
scintillator, a Poisson-distributed random number of
photons is emitted with a mean value m, function of E
( )!
/x
emmxP
mx −
=
Probability of emission of x photons for an average value m(E)
1. Model of light emission
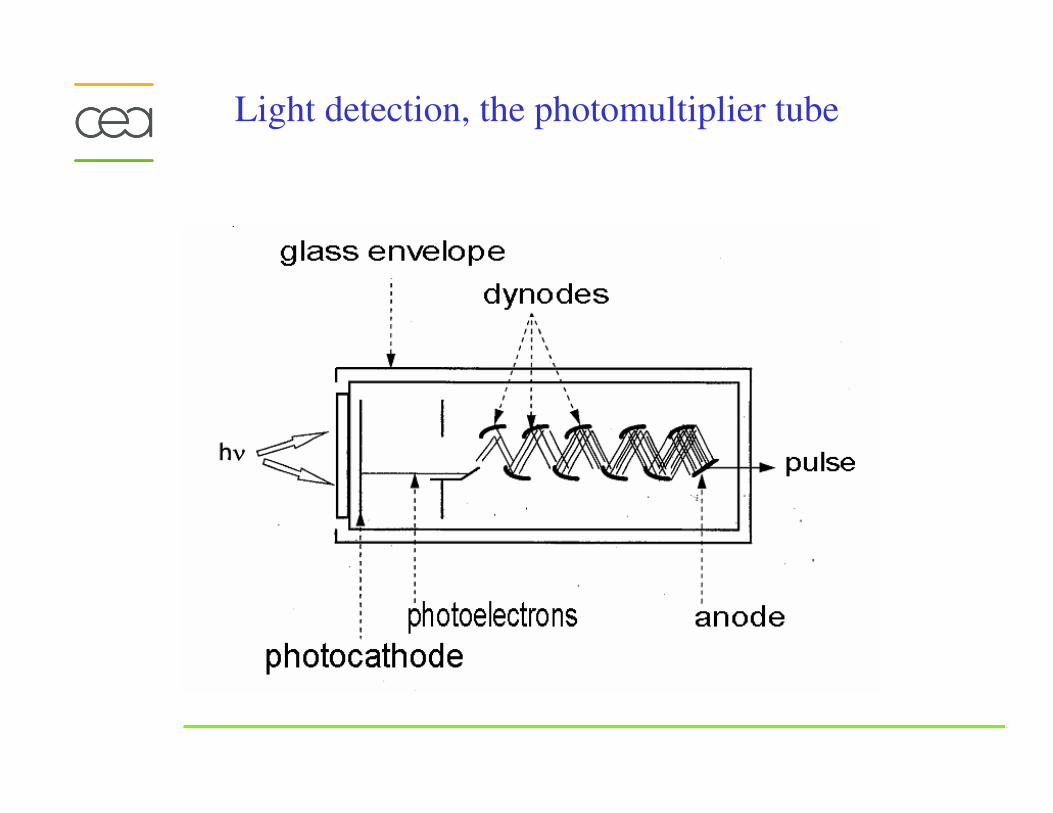
Light detection, the photomultiplier tube
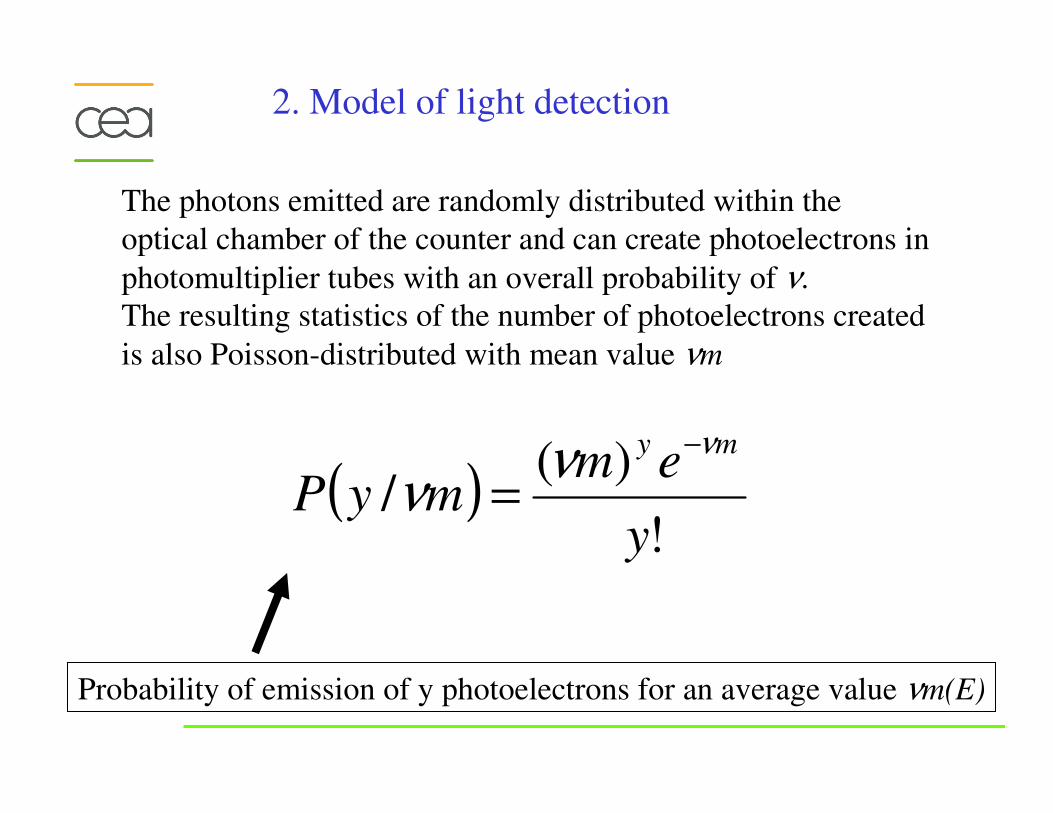
2. Model of light detection
The photons emitted are randomly distributed within the
optical chamber of the counter and can create photoelectrons in
photomultiplier tubes with an overall probability of ν.
The resulting statistics of the number of photoelectrons created
is also Poisson-distributed with mean value νm
( )!
)(/
y
emmyP
my ννν
−
=
Probability of emission of y photoelectrons for an average value νm(E)
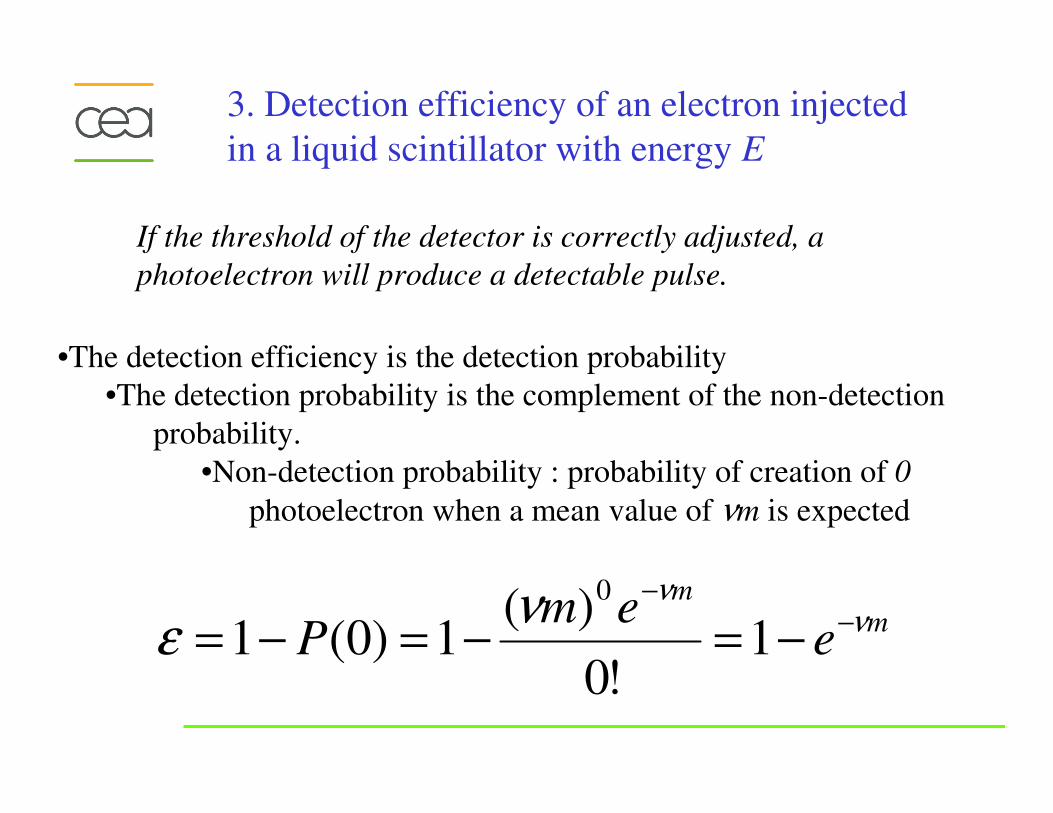
3. Detection efficiency of an electron injected
in a liquid scintillator with energy E
If the threshold of the detector is correctly adjusted, a
photoelectron will produce a detectable pulse.
•The detection efficiency is the detection probability
•The detection probability is the complement of the non-detection
probability.
•Non-detection probability : probability of creation of 0
photoelectron when a mean value of νm is expected
mm
eem
Pν
ννε −
−
−=−=−= 1!0
)(1)0(1
0
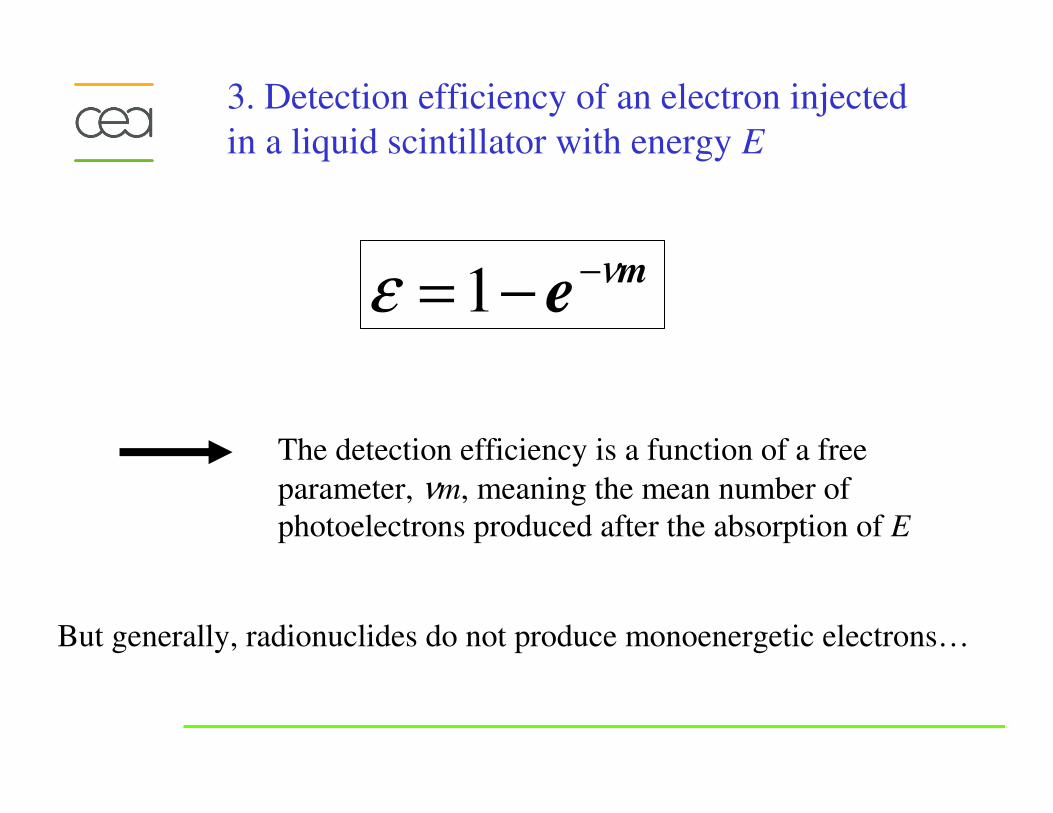
3. Detection efficiency of an electron injected
in a liquid scintillator with energy E
me
νε −−=1
The detection efficiency is a function of a free
parameter, νm, meaning the mean number of
photoelectrons produced after the absorption of E
But generally, radionuclides do not produce monoenergetic electrons…
Relation between m and E
Experimental evidence:
• The number of photons emitted is not proportional
to the energy released in the LS cocktail
• For a given energy, the number of photons emitted
by alpha particles is lower than the one emitted by
electrons
• The light emission is an inverse function of the
stopping power of the incident particle
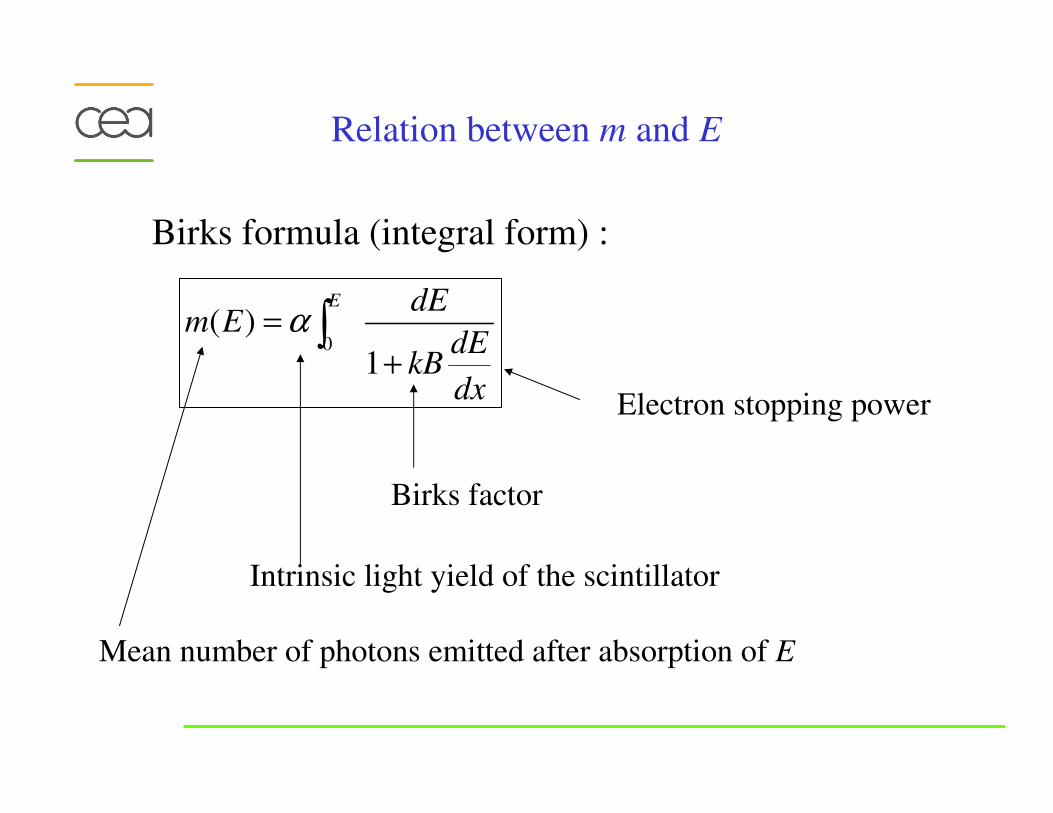
Birks formula (integral form) :
dx
dEkB
dEEm
E
+
= ∫1
)(0
α
Mean number of photons emitted after absorption of E
Intrinsic light yield of the scintillator
Birks factor
Electron stopping power
Relation between m and E
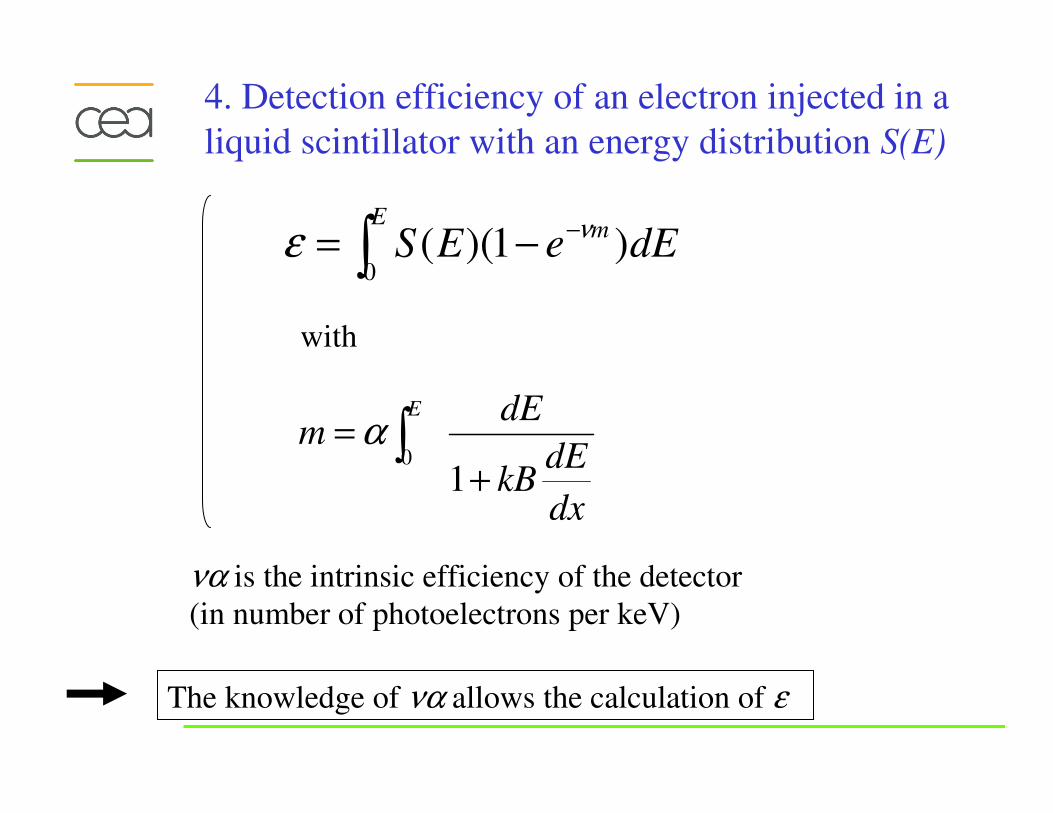
4. Detection efficiency of an electron injected in a
liquid scintillator with an energy distribution S(E)
∫−−=
Em
dEeES0
)1)(( νε
with
dx
dEkB
dEm
E
+
= ∫1
0α
να is the intrinsic efficiency of the detector
(in number of photoelectrons per keV)
The knowledge of να allows the calculation of ε
III. The TDCR method
Calculation of νm using a LS counter with 3
PMT’s
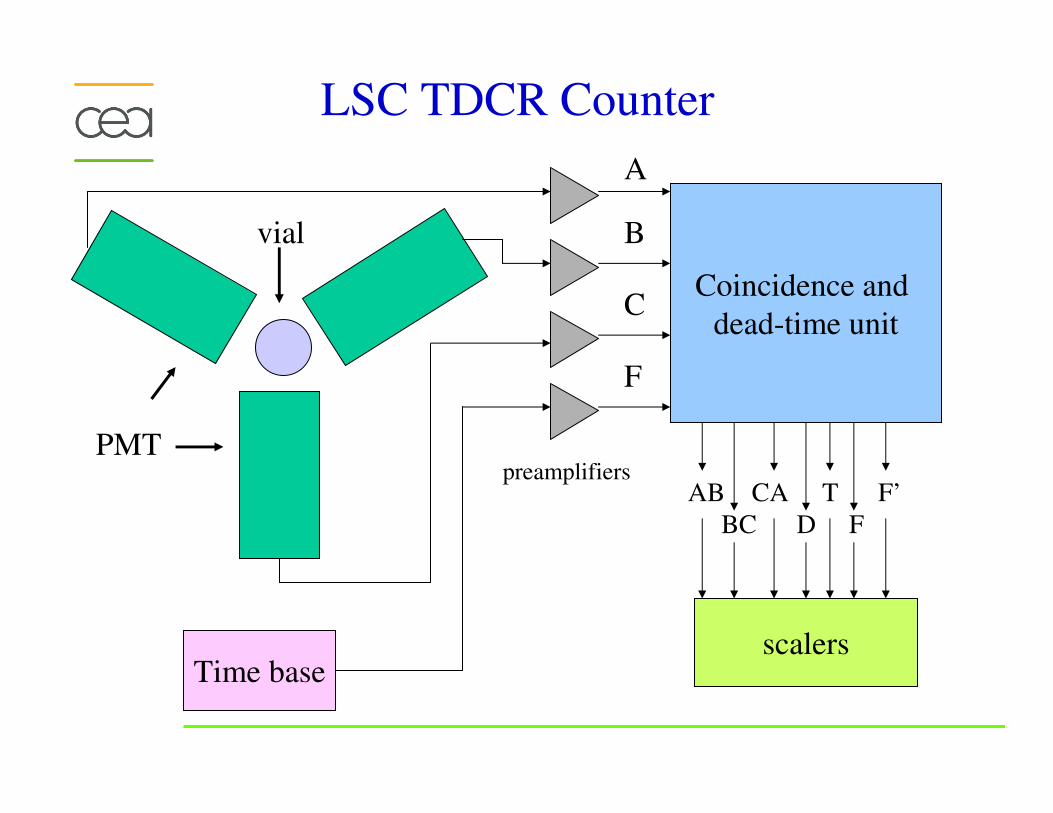
Coincidence and
dead-time unit
Time base
vial
PMTpreamplifiers
A
B
C
F
AB CA T F’
BC D F
scalers
LSC TDCR Counter
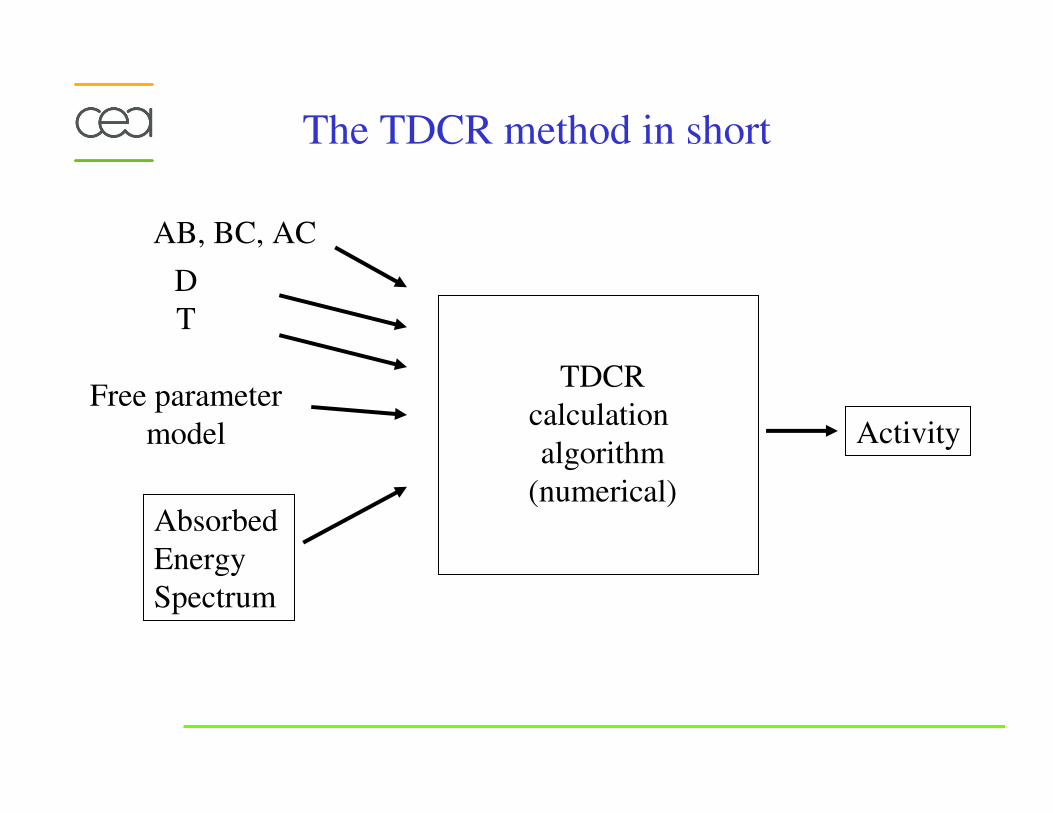
D
T
Free parameter
model
TDCR
calculation
algorithm
(numerical)
Activity
Absorbed
Energy
Spectrum
AB, BC, AC
The TDCR method in short
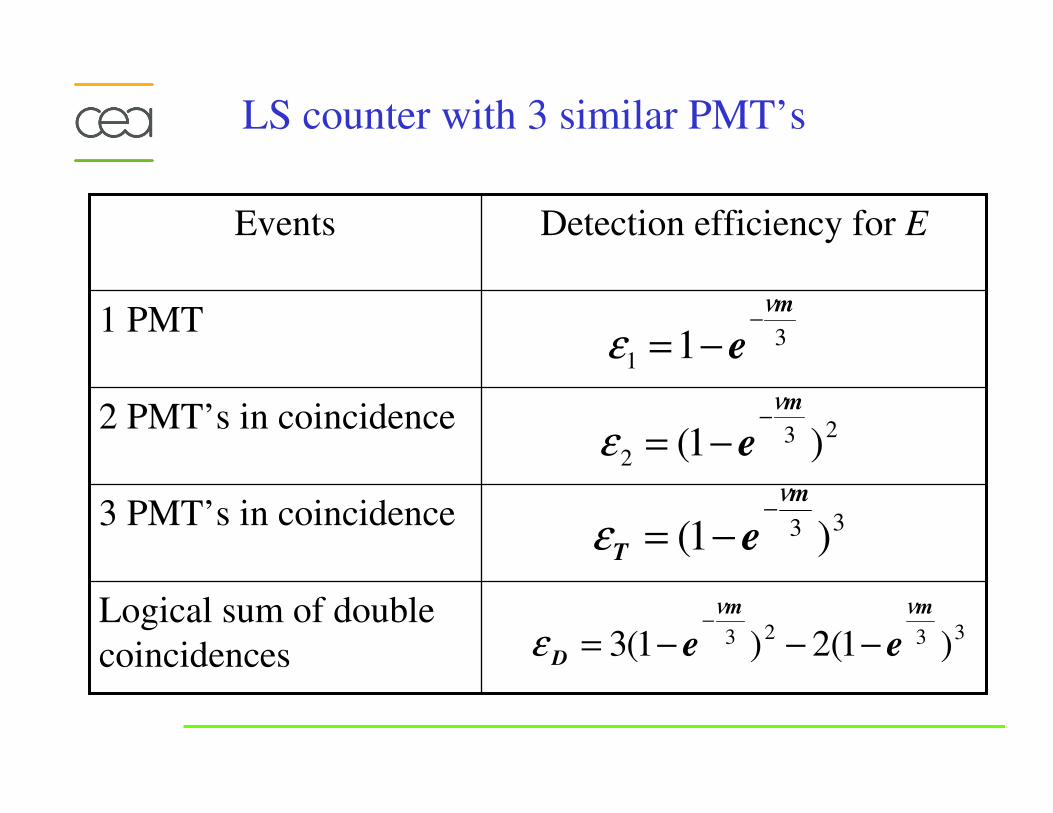
Logical sum of double
coincidences
3 PMT’s in coincidence
2 PMT’s in coincidence
1 PMT
Detection efficiency for EEvents
31 1
m
e
ν
ε−
−=
232 )1(
m
e
ν
ε−
−=
33 )1(
m
Te
ν
ε−
−=
3323 )1(2)1(3
mm
Dee
νν
ε −−−=−
LS counter with 3 similar PMT’s
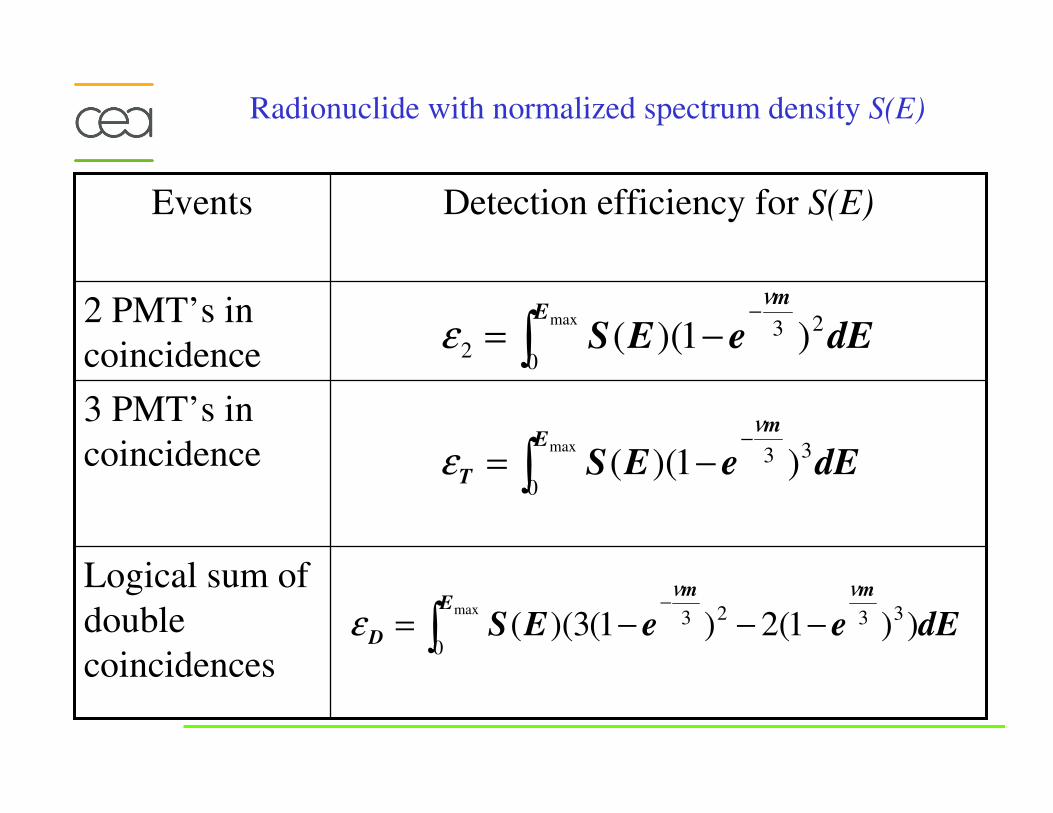
Radionuclide with normalized spectrum density S(E)
Logical sum of
double
coincidences
3 PMT’s in
coincidence
2 PMT’s in
coincidence
Detection efficiency for S(E)Events
dEeES
mE
23
02 )1()(
max
ν
ε−
−= ∫
dEeES
mE
T
33
0)1()(
max
ν
ε−
−= ∫
dEeeES
mmE
D))1(2)1(3)(( 3323
0
max
νν
ε −−−=−
∫
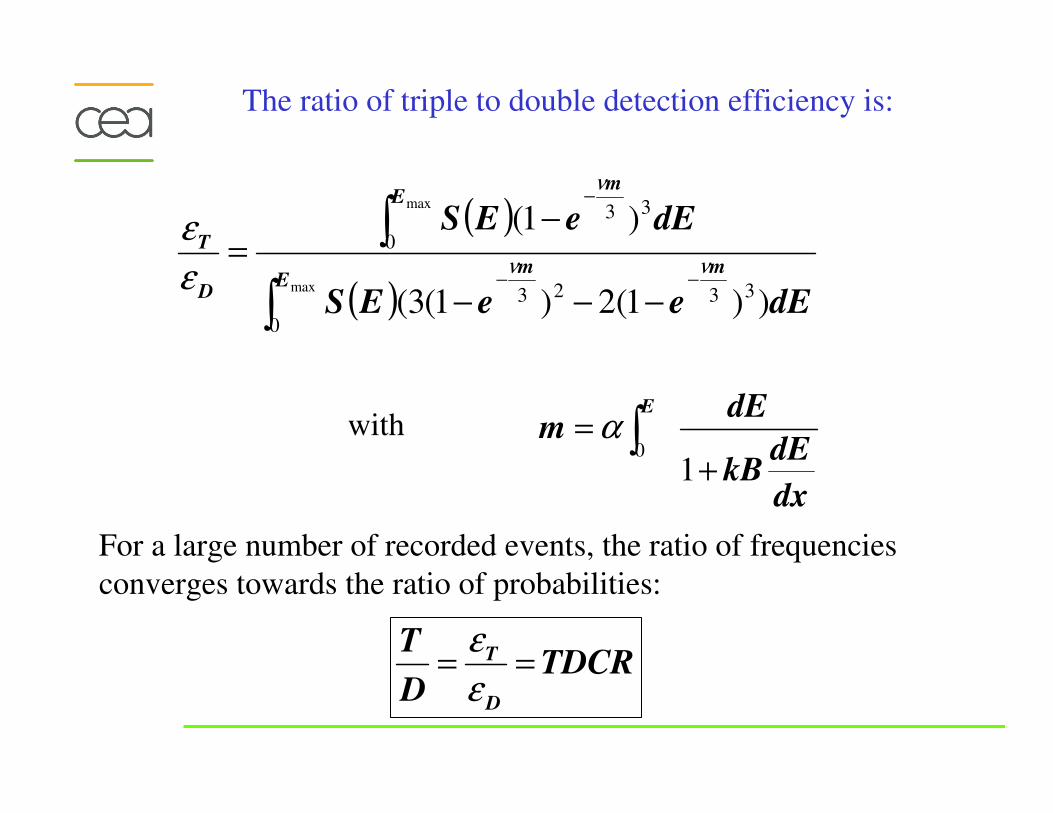
( )
( ) dEeeES
dEeES
mmE
mE
D
T
))1(2)1(3(
)1(
3323
0
33
0
max
max
νν
ν
ε
ε
−−
−
−−−
−=
∫
∫
with
The ratio of triple to double detection efficiency is:
For a large number of recorded events, the ratio of frequencies
converges towards the ratio of probabilities:
TDCRD
T
D
T ==ε
ε
dx
dEkB
dEm
E
+
= ∫1
0α
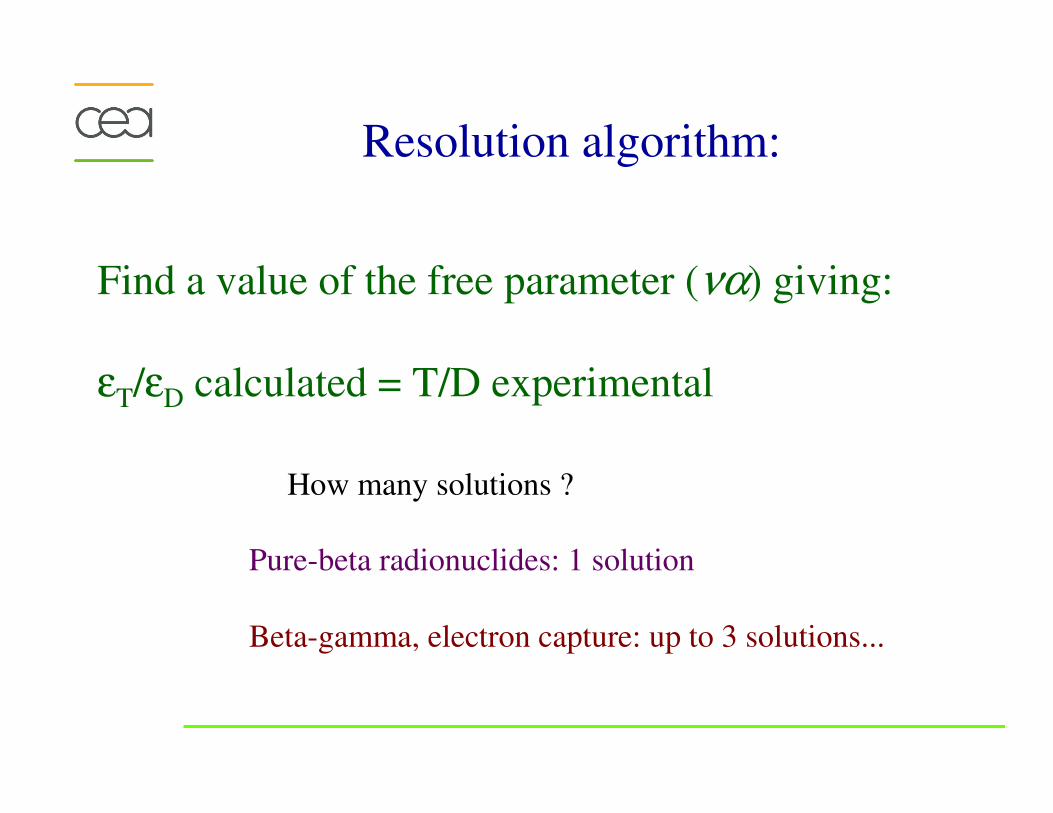
Resolution algorithm:
Find a value of the free parameter (να) giving:
εT/εD calculated = T/D experimental
Pure-beta radionuclides: 1 solution
Beta-gamma, electron capture: up to 3 solutions...
How many solutions ?
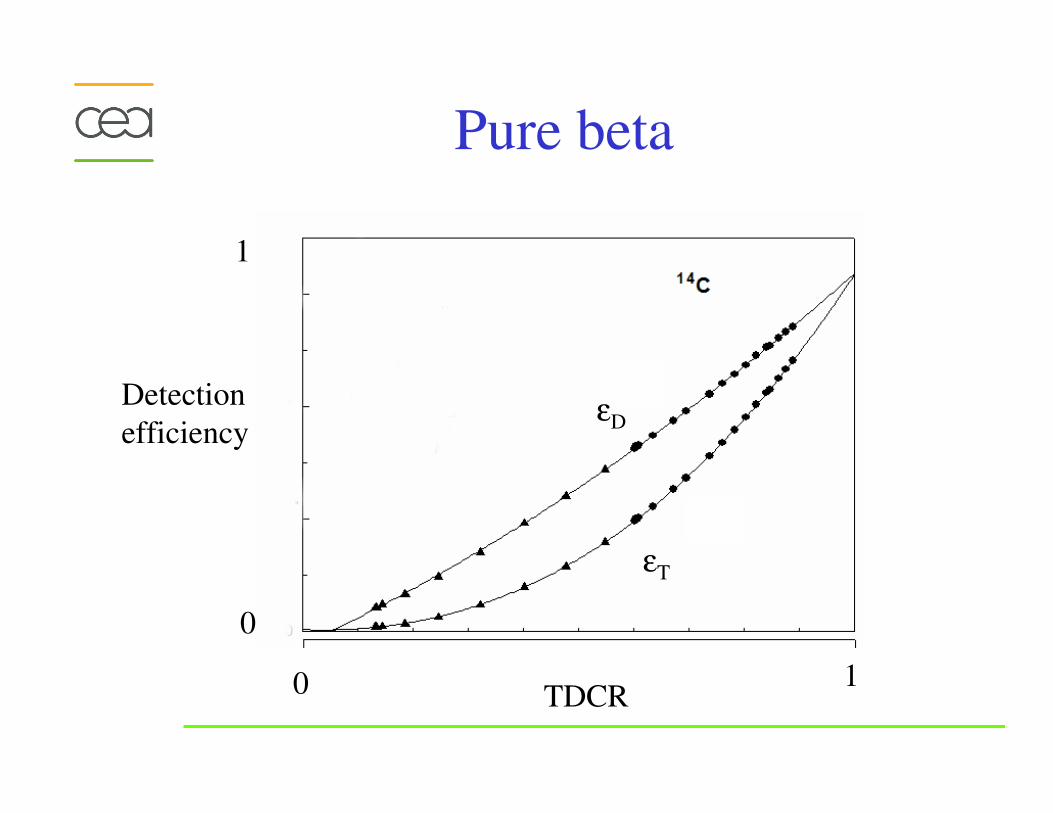
Pure beta
TDCR
Detection
efficiency
0 1
0
1
εD
εT
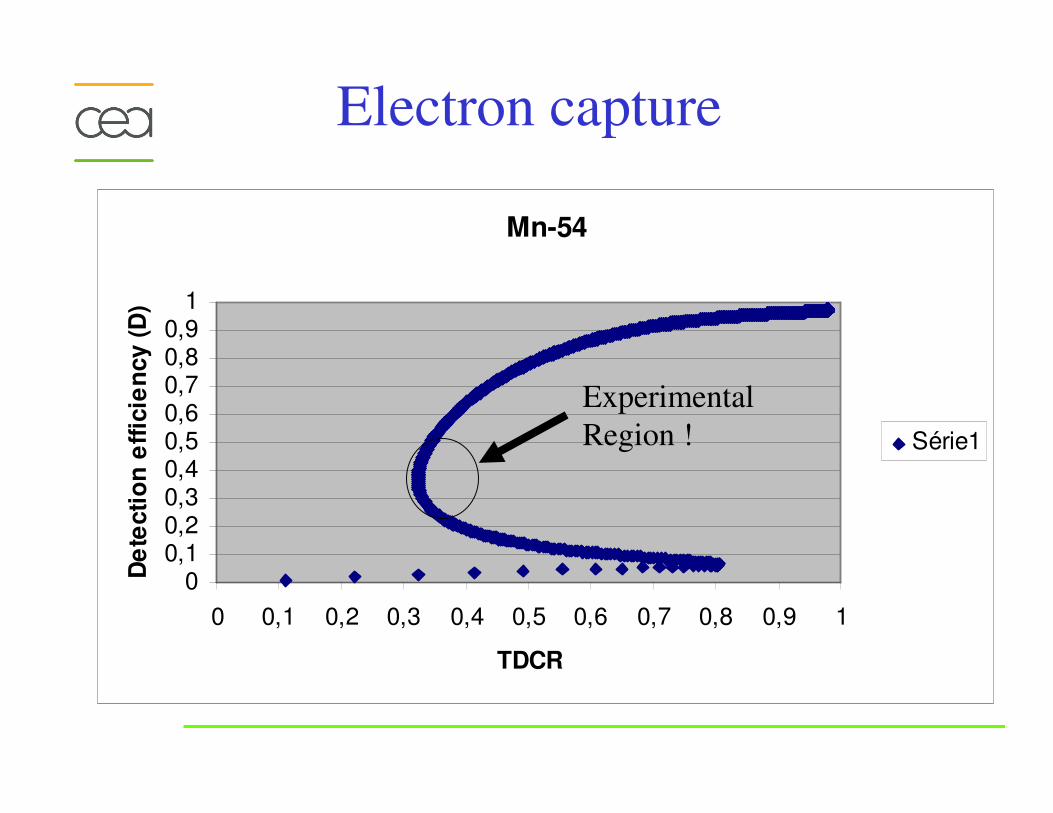
Mn-54
00,10,20,30,40,50,60,70,80,9
1
0 0,1 0,2 0,3 0,4 0,5 0,6 0,7 0,8 0,9 1
TDCR
De
tecti
on
eff
icie
ncy (
D)
Série1
Experimental
Region !
Electron capture
If the 3 PMT ’s are different
And they really are !
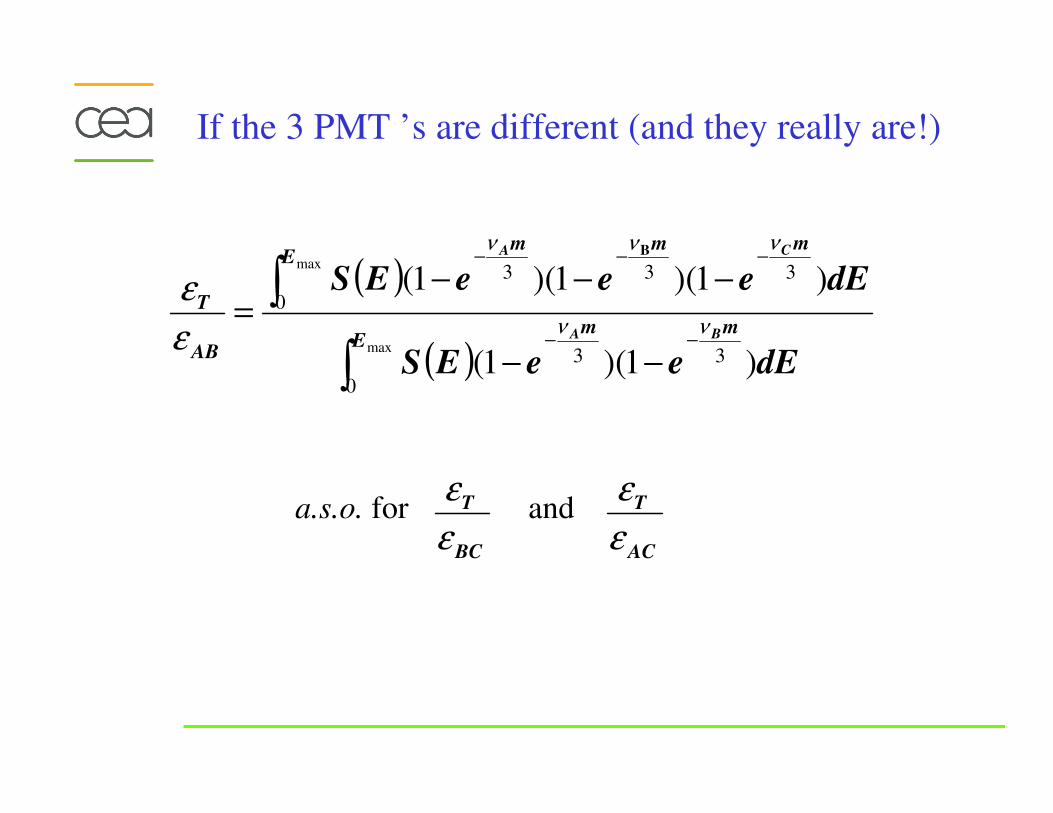
( )
( ) dEeeES
dEeeeES
mmE
mmmE
AB
T
BA
CA
)1)(1(
)1)(1)(1(
33
0
333
0
max
max
νν
ννν
ε
ε
−−
−−−
−−
−−−=
∫
∫B
a.s.o. for and
BC
T
ε
ε
AC
T
ε
ε
If the 3 PMT ’s are different (and they really are!)
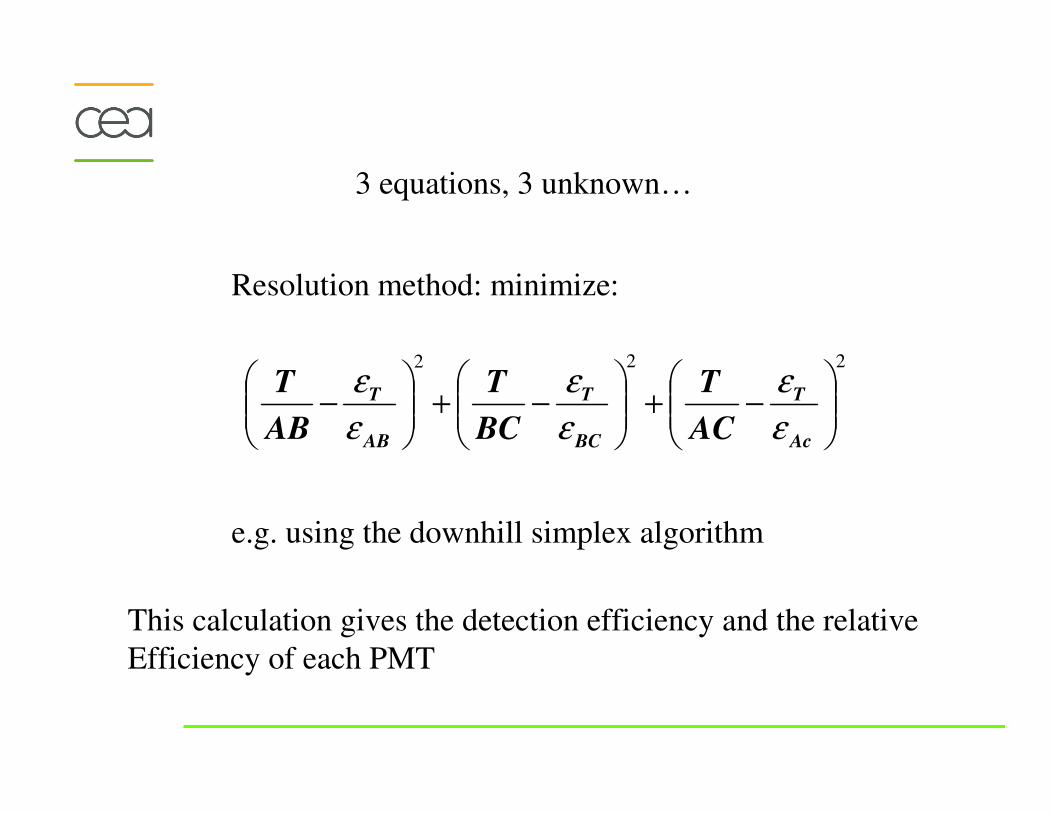
3 equations, 3 unknown…
Resolution method: minimize:
e.g. using the downhill simplex algorithm
This calculation gives the detection efficiency and the relative
Efficiency of each PMT
222
−+
−+
−
Ac
T
BC
T
AB
T
AC
T
BC
T
AB
T
ε
ε
ε
ε
ε
ε
How to choose the best kB parameter
(or any other parameter in the model)?
Change detection efficiency: if the parameters are OK, the
calculated activity must remain the same
(i.e. the calculation model must compensate any variation in
detection efficiency)
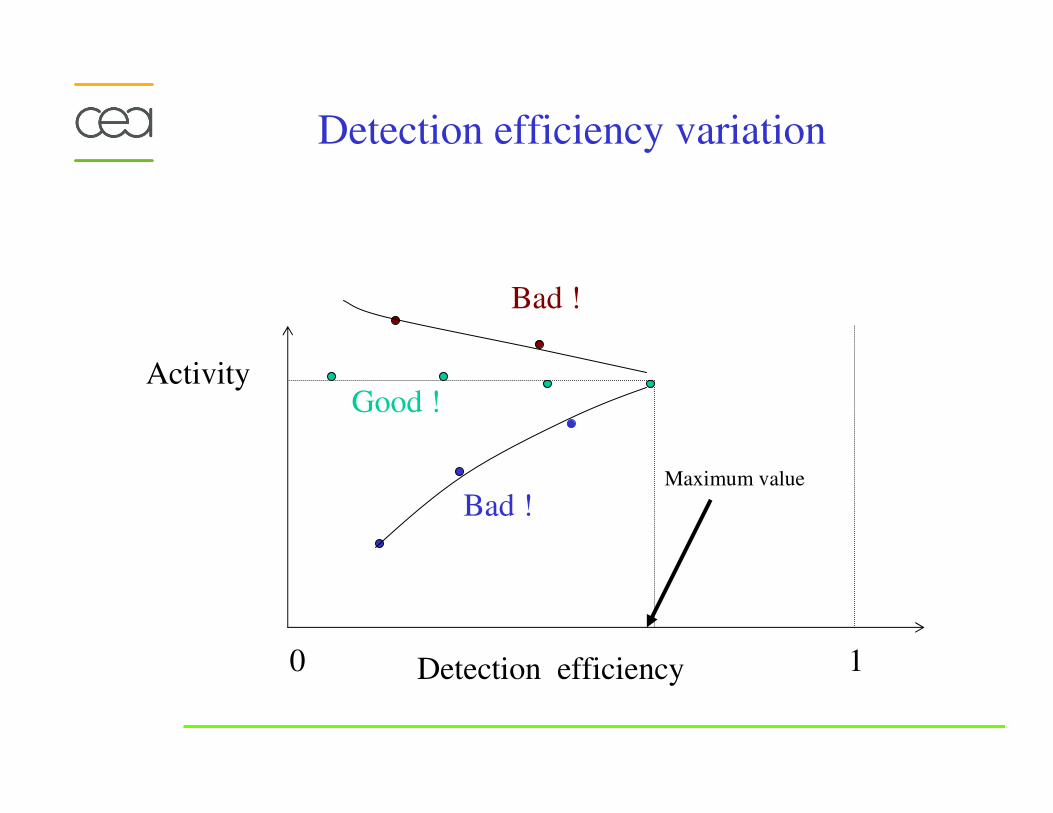
Detection efficiency variation
Activity
Detection efficiency
Maximum value
10
Good !
Bad !
Bad !
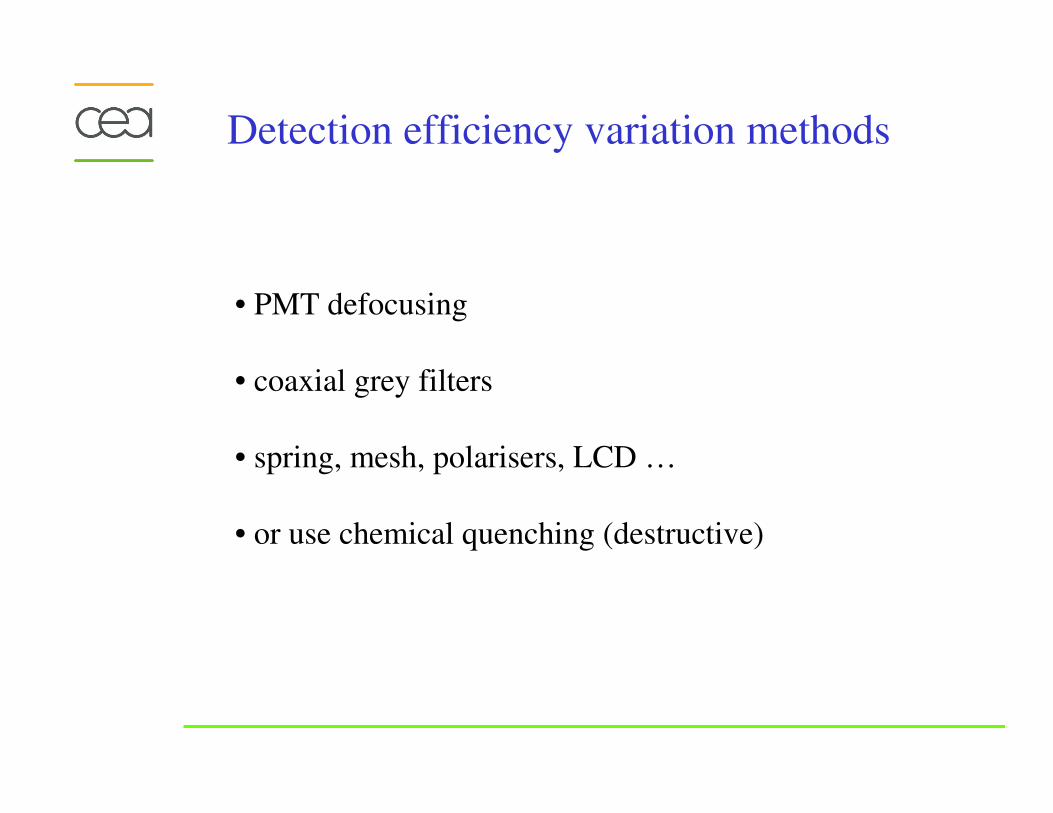
Detection efficiency variation methods
• PMT defocusing
• coaxial grey filters
• spring, mesh, polarisers, LCD …
• or use chemical quenching (destructive)
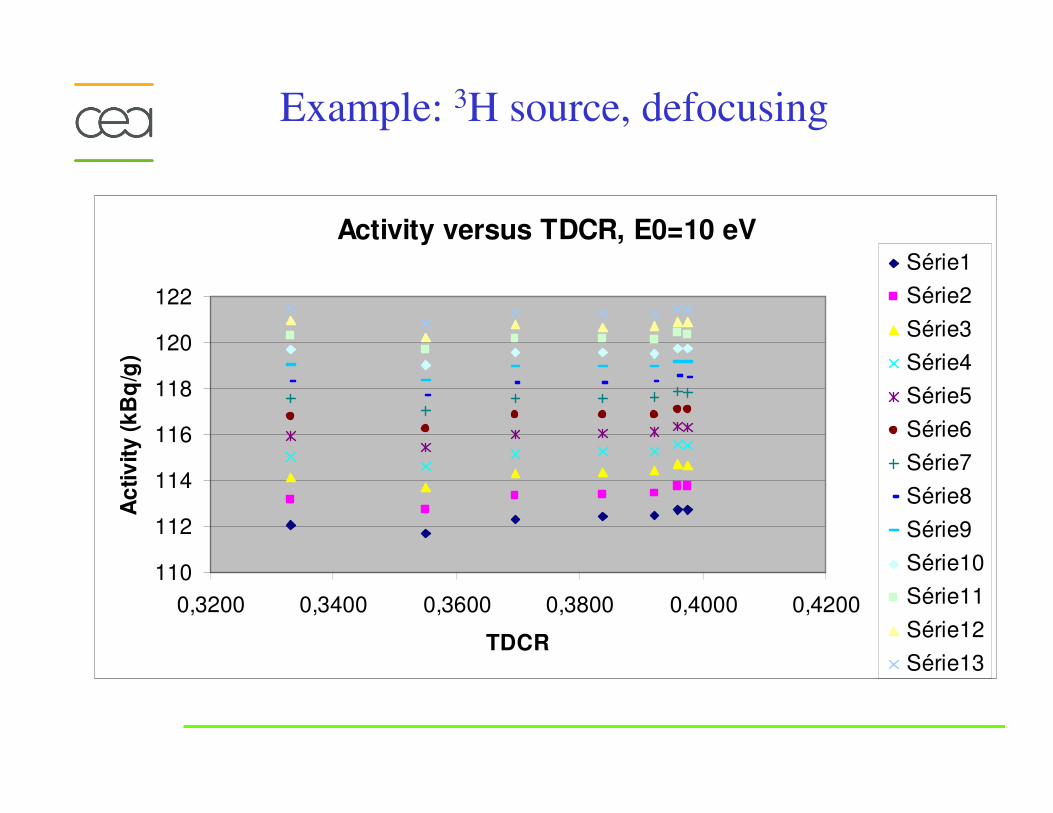
Activity versus TDCR, E0=10 eV
110
112
114
116
118
120
122
0,3200 0,3400 0,3600 0,3800 0,4000 0,4200
TDCR
Ac
tiv
ity
(k
Bq
/g)
Série1
Série2
Série3
Série4
Série5
Série6
Série7
Série8
Série9
Série10
Série11
Série12
Série13
Example: 3H source, defocusing
IV Uncertainty evaluation
“A measurement without uncertainty is not a measurement”
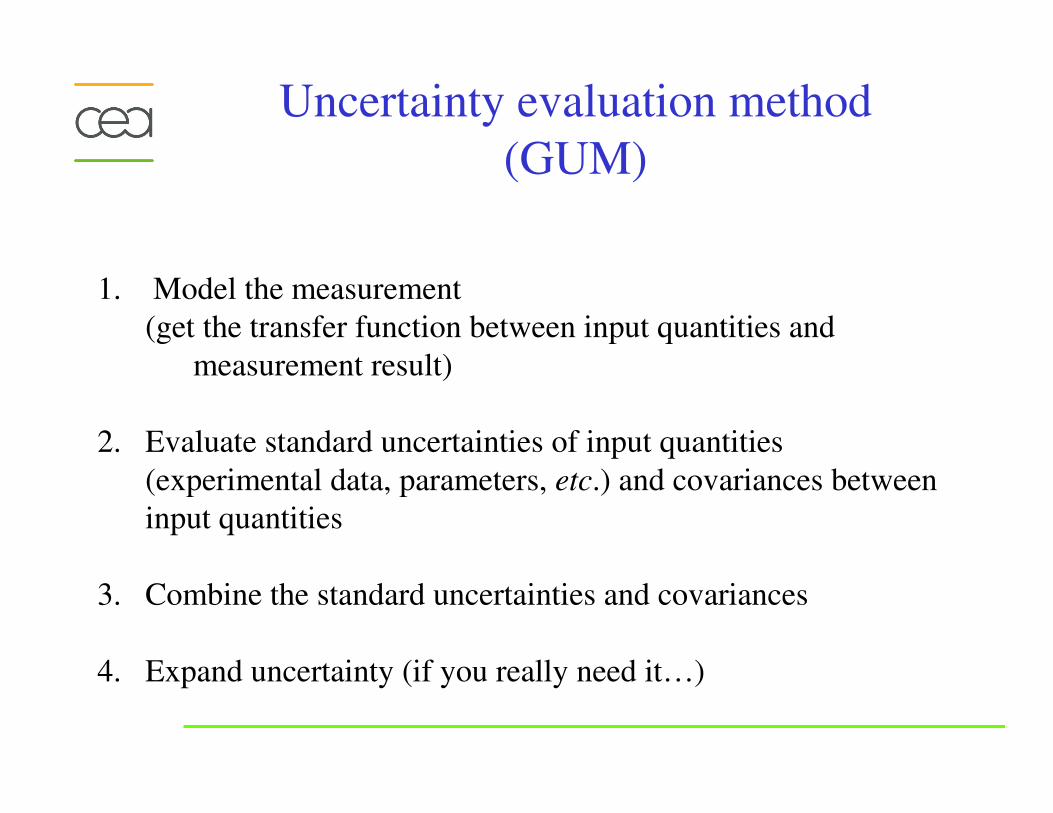
Uncertainty evaluation method
(GUM)
1. Model the measurement
(get the transfer function between input quantities and
measurement result)
2. Evaluate standard uncertainties of input quantities
(experimental data, parameters, etc.) and covariances between
input quantities
3. Combine the standard uncertainties and covariances
4. Expand uncertainty (if you really need it…)
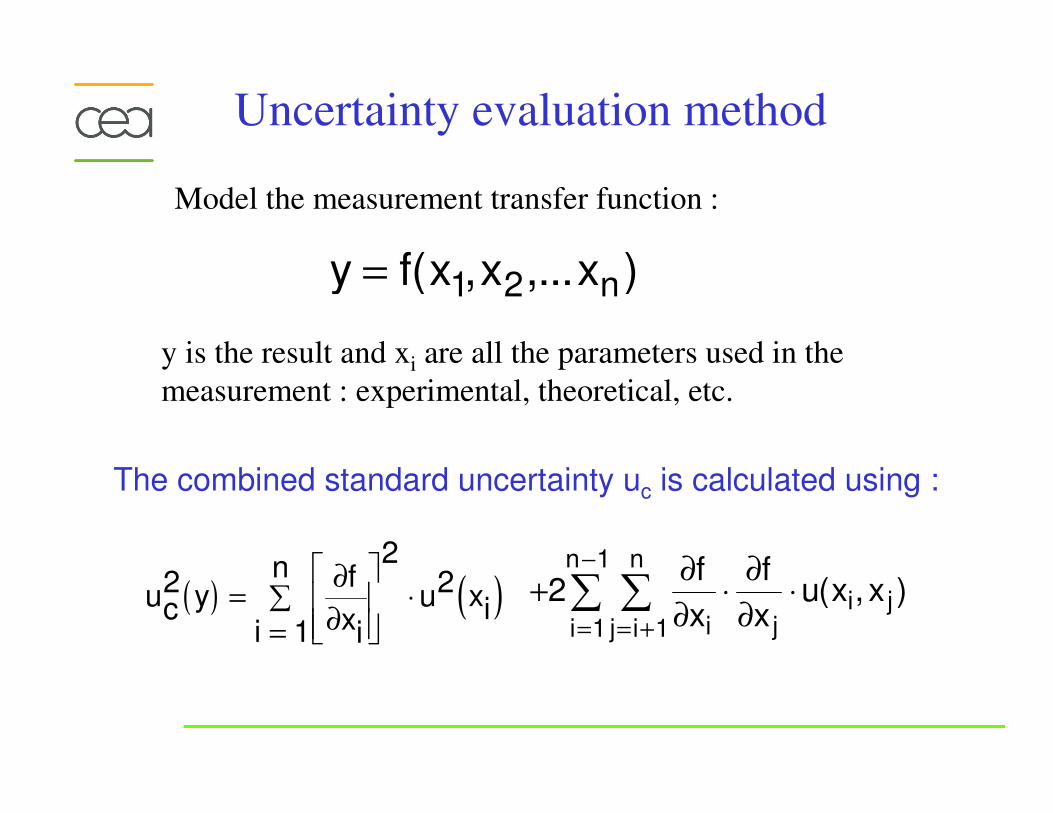
y f x x xn= ( , ,... )1 2
The combined standard uncertainty uc is calculated using :
( ) ( )uc2 y
f
xii
nu xi=
=
∑ ⋅∂
∂1
22 + ⋅ ⋅
= +=
−
∑∑211
1 ∂
∂
∂
∂
f
x
f
xu x x
ij i
n
i
n
ji j( , )
Uncertainty evaluation method
Model the measurement transfer function :
y is the result and xi are all the parameters used in the
measurement : experimental, theoretical, etc.
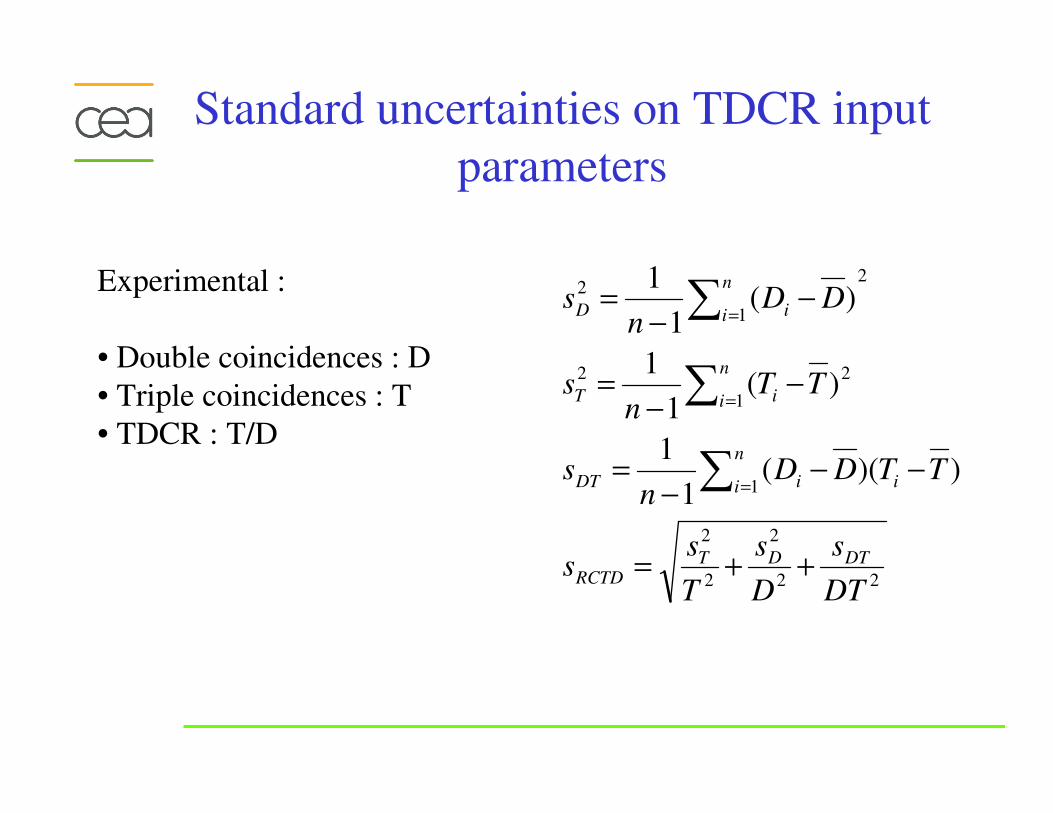
Standard uncertainties on TDCR input
parameters
Experimental :
• Double coincidences : D
• Triple coincidences : T
• TDCR : T/D
22
2
2
2
1
1
22
2
1
2
))((1
1
)(1
1
)(1
1
DT
s
D
s
T
ss
TTDDn
s
TTn
s
DDn
s
DTDTRCTD
n
i iiDT
n
i iT
n
i iD
++=
−−−
=
−−
=
−−
=
∑
∑
∑
=
=
=
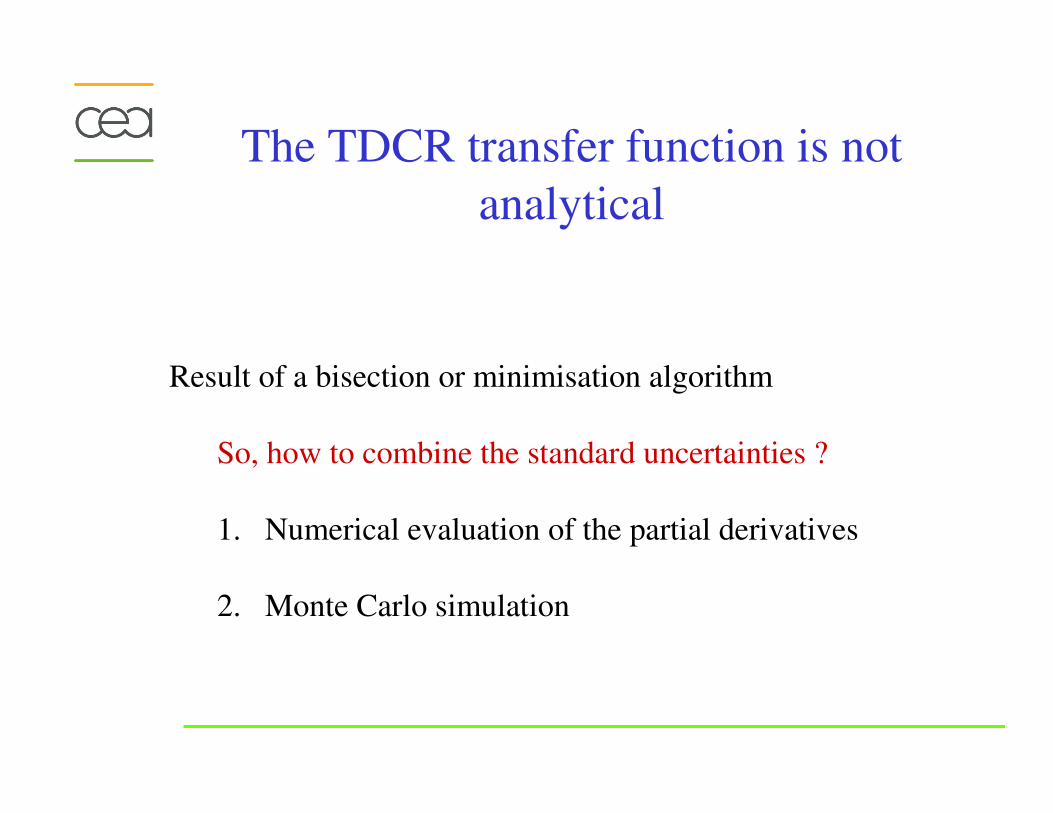
The TDCR transfer function is not
analytical
Result of a bisection or minimisation algorithm
So, how to combine the standard uncertainties ?
1. Numerical evaluation of the partial derivatives
2. Monte Carlo simulation
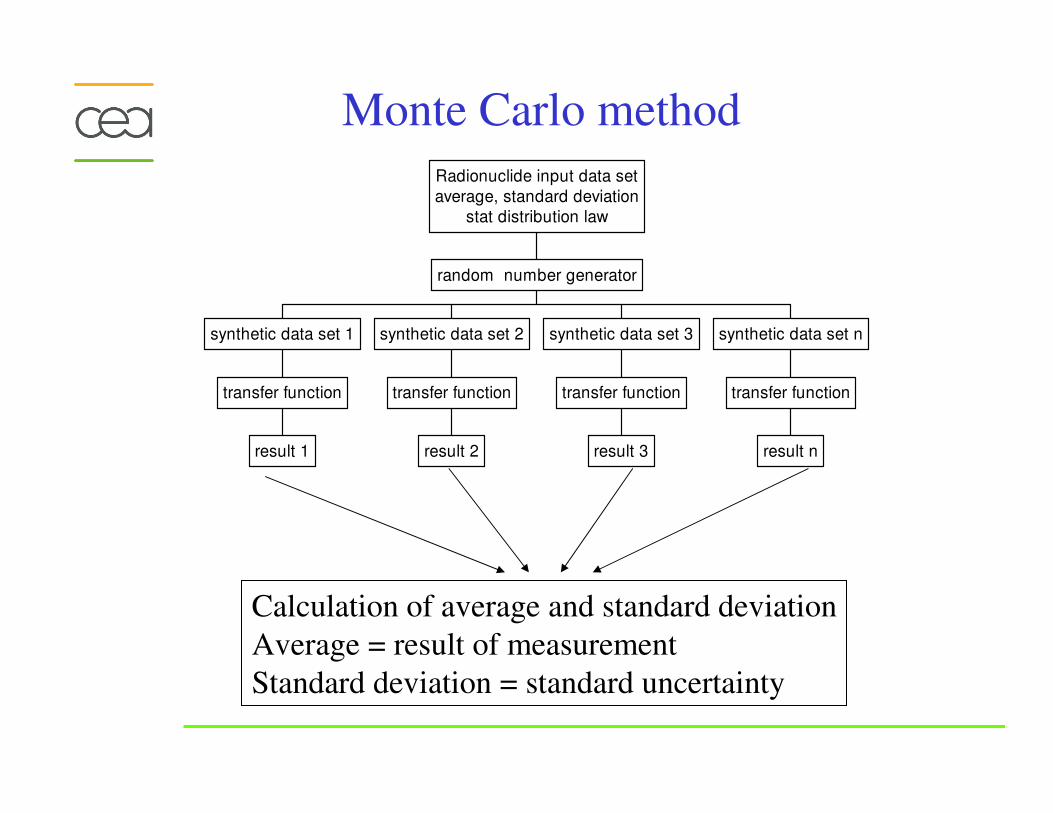
Monte Carlo method
result 1
transfer function
synthetic data set 1
result 2
transfer function
synthetic data set 2
result 3
transfer function
synthetic data set 3
result n
transfer function
synthetic data set n
random number generator
Radionuclide input data set
average, standard deviation
stat distribution law
Calculation of average and standard deviation
Average = result of measurement
Standard deviation = standard uncertainty
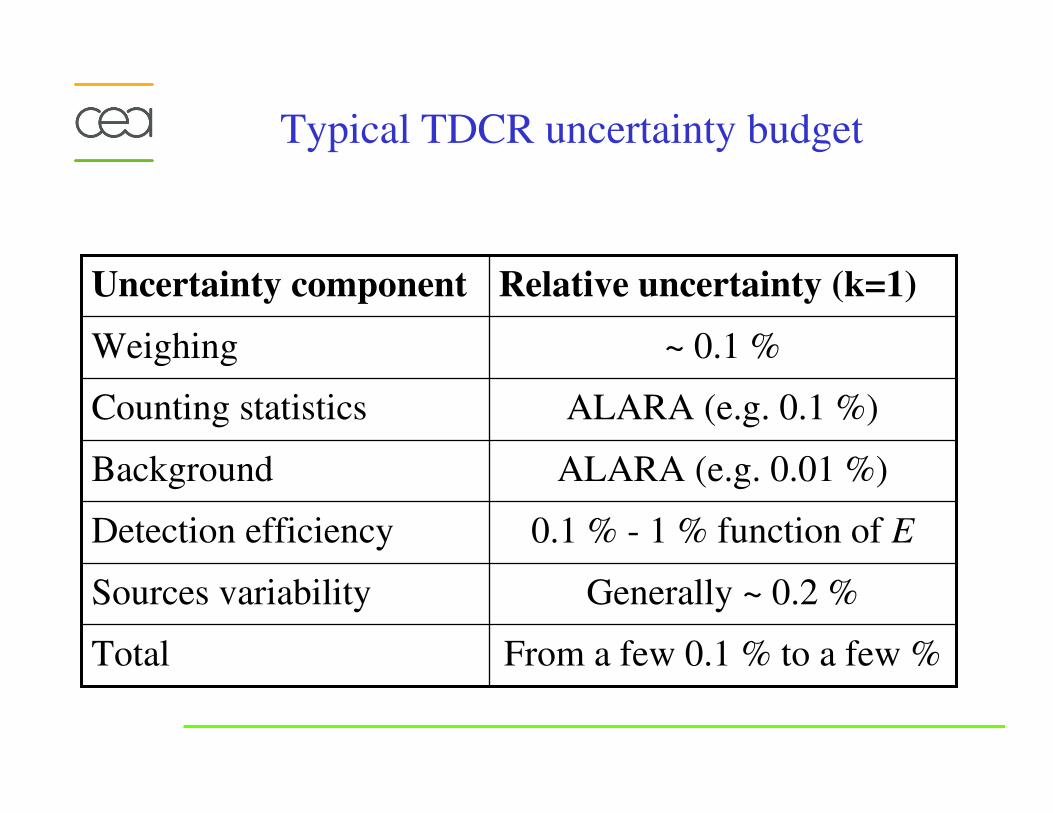
Typical TDCR uncertainty budget
From a few 0.1 % to a few %Total
Generally ~ 0.2 %Sources variability
0.1 % - 1 % function of EDetection efficiency
ALARA (e.g. 0.01 %)Background
ALARA (e.g. 0.1 %)Counting statistics
~ 0.1 %Weighing
Relative uncertainty (k=1)Uncertainty component
V. Practical information
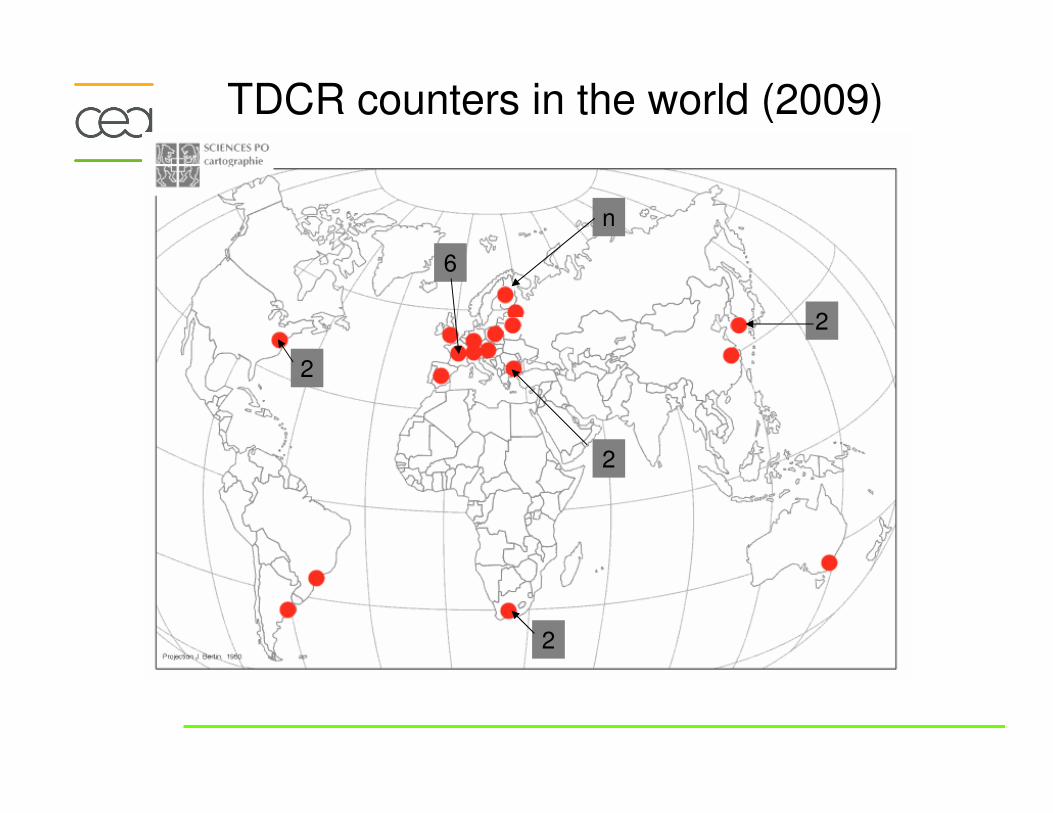
TDCR counters in the world (2009)
2
6
2
2
n
2
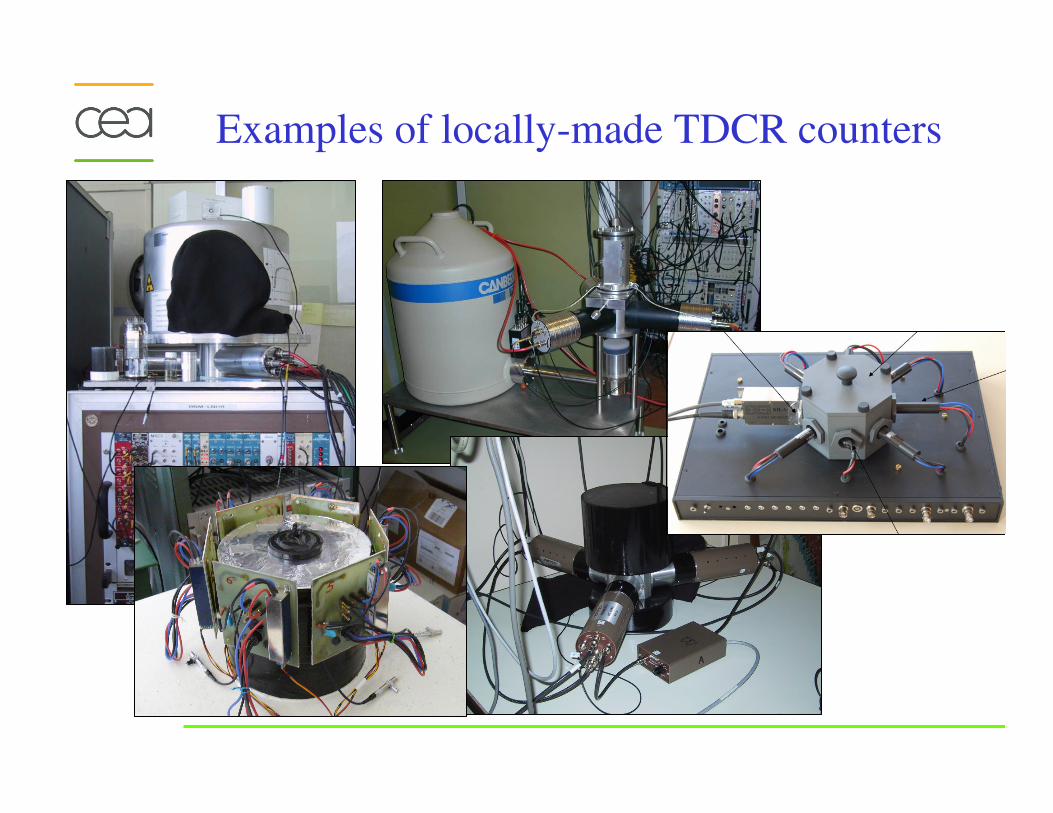
Examples of locally-made TDCR counters
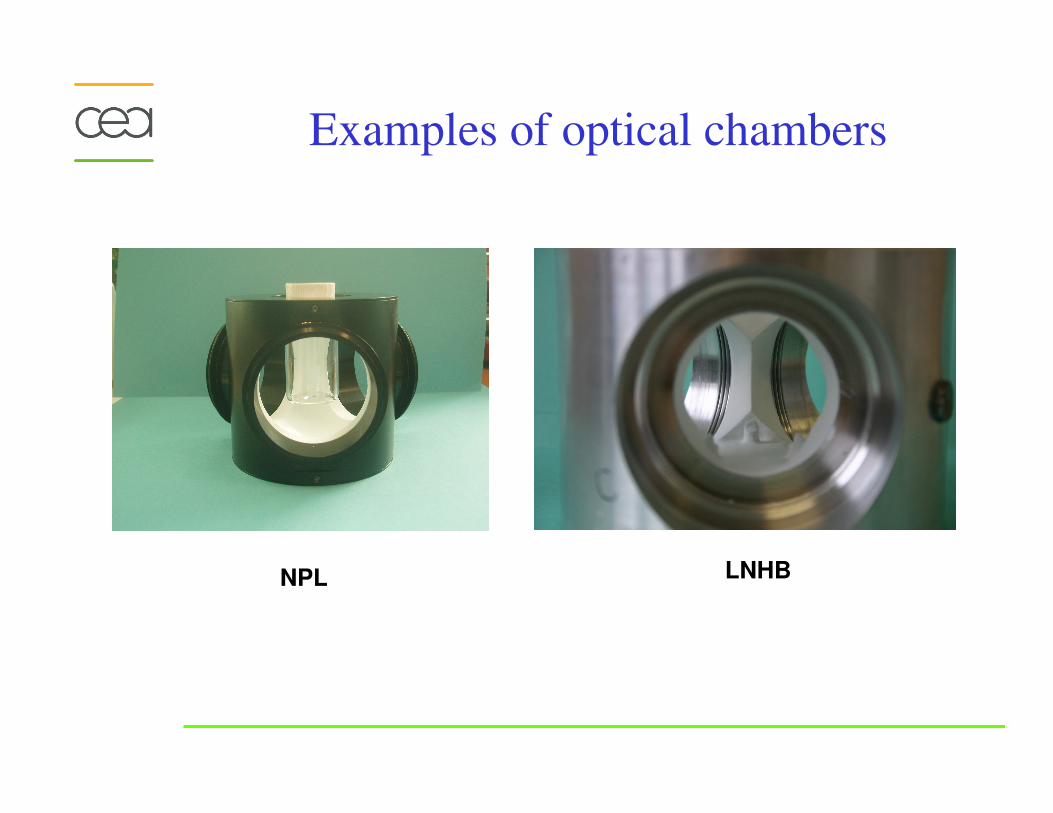
Examples of optical chambers
NPL LNHB
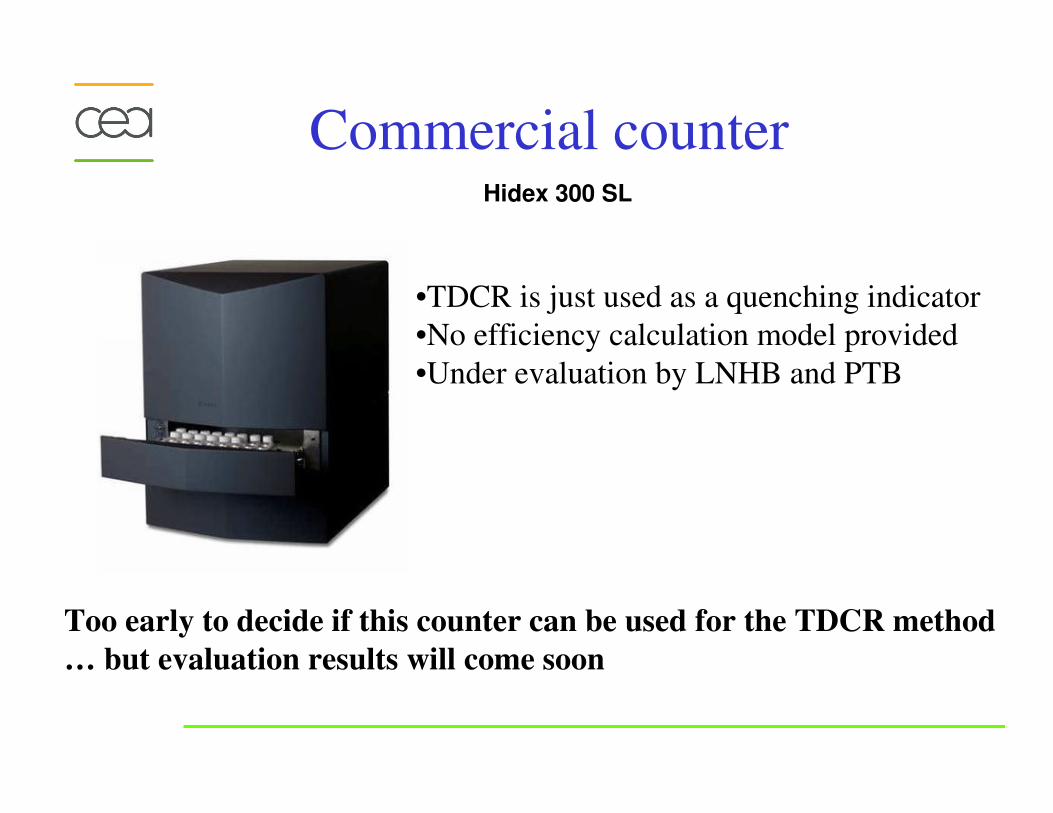
Commercial counterHidex 300 SL
•TDCR is just used as a quenching indicator
•No efficiency calculation model provided
•Under evaluation by LNHB and PTB
Too early to decide if this counter can be used for the TDCR method
… but evaluation results will come soon
Available software
Available:• TDCRB02 (POLATOM/LNHB)
http://www.nucleide.org/ICRM_LSC_WG/icrmsoftware.htm
• TDCR07 and variants (LNHB)
• EFFY5 (CIEMAT)
And,
many programs made by NIST, BIPM, PTB, NMISA,…
but probably using the same models…
Conclusions
• The TDCR method is a mature LSC standardization technique
widely used within the international radionuclide metrology
community and well suitable for the standardization of pure-beta
and some electron-capture radionuclides
• The models and programs are available
• Up to now, this technique was restricted to specific locally-
made 3 PMT’s counters… But this could change soon if
commercial counter are found to be suitable for the application of
this technique
•There is an international community (in the National Metrology
Institutes) improving models, instruments and software
More information: http://www.nucleide.org/icrm.htm