Embed Size (px)
Citation preview
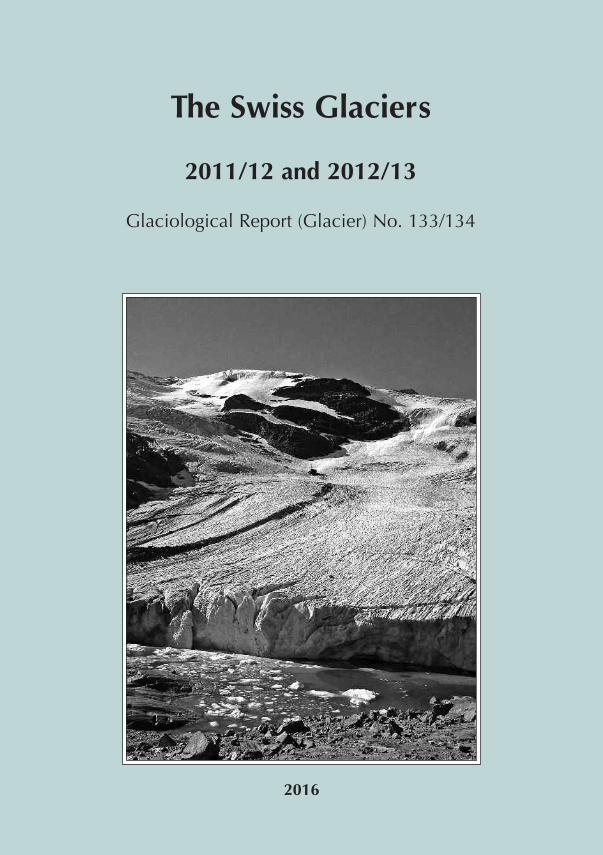
The Swiss Glaciers
2011/12 and 2012/13
Glaciological Report (Glacier) No. 133/134
2016

The Swiss Glaciers
2011/2012 and 2012/2013
Glaciological Report No. 133/134
Edited by
Andreas Bauder1
With contributions from
Andreas Bauder1, Mauro Fischer2, Martin Funk1,
Matthias Huss1,2, Giovanni Kappenberger3
1 Laboratory of Hydraulics, Hydrology and Glaciology (VAW), ETH Zurich
2 Department of Geosciences, University of Fribourg
3 6654 Cavigliano
2016
Publication of the Cryospheric Commission (EKK) of the Swiss Academy of Sciences (SCNAT)
c/o Laboratory of Hydraulics, Hydrology and Glaciology (VAW)
at the Swiss Federal Institute of Technology Zurich (ETH Zurich)
Honggerbergring 26, CH-8093 Zurich, Switzerland
http://glaciology.ethz.ch/swiss-glaciers/
c© Cryospheric Commission (EKK) 2016
DOI: http://doi.org/10.18752/glrep 133-134
ISSN 1424-2222
Imprint of author contributions:
Andreas Bauder : Chapt. 1, 2, 3, 4, 5, 6, App. A, B, C
Mauro Fischer : Chapt. 4
Martin Funk : Chapt. 1, 4
Matthias Huss : Chapt. 2, 4
Giovanni Kappenberger : Chapt. 4
Ebnoether Joos AG
print and publishing
Sihltalstrasse 82
Postfach 134
CH-8135 Langnau am Albis
Switzerland
Cover Page: Vadret da Palu (Gilbert Berchier, 25.9.2013)
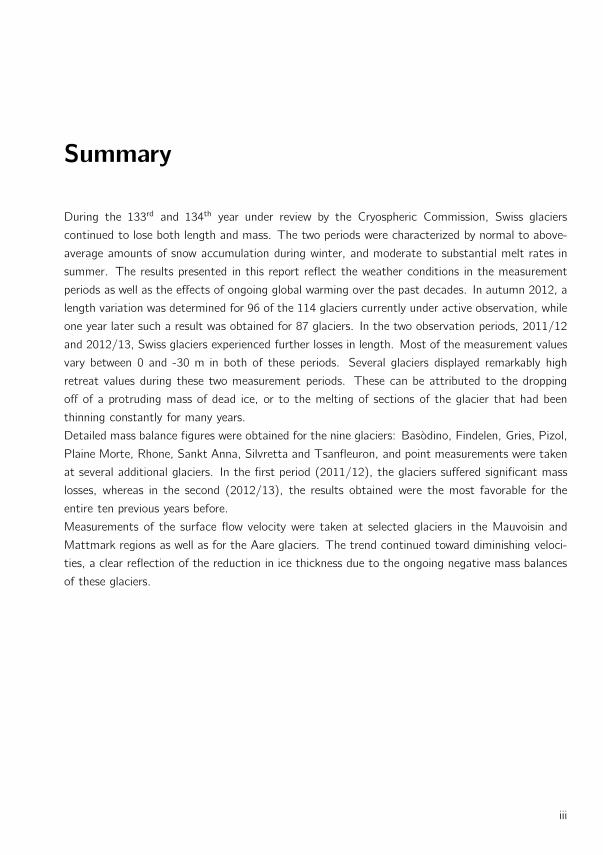
Summary
During the 133rd and 134th year under review by the Cryospheric Commission, Swiss glaciers
continued to lose both length and mass. The two periods were characterized by normal to above-
average amounts of snow accumulation during winter, and moderate to substantial melt rates in
summer. The results presented in this report reflect the weather conditions in the measurement
periods as well as the effects of ongoing global warming over the past decades. In autumn 2012, a
length variation was determined for 96 of the 114 glaciers currently under active observation, while
one year later such a result was obtained for 87 glaciers. In the two observation periods, 2011/12
and 2012/13, Swiss glaciers experienced further losses in length. Most of the measurement values
vary between 0 and -30 m in both of these periods. Several glaciers displayed remarkably high
retreat values during these two measurement periods. These can be attributed to the dropping
off of a protruding mass of dead ice, or to the melting of sections of the glacier that had been
thinning constantly for many years.
Detailed mass balance figures were obtained for the nine glaciers: Basodino, Findelen, Gries, Pizol,
Plaine Morte, Rhone, Sankt Anna, Silvretta and Tsanfleuron, and point measurements were taken
at several additional glaciers. In the first period (2011/12), the glaciers suffered significant mass
losses, whereas in the second (2012/13), the results obtained were the most favorable for the
entire ten previous years before.
Measurements of the surface flow velocity were taken at selected glaciers in the Mauvoisin and
Mattmark regions as well as for the Aare glaciers. The trend continued toward diminishing veloci-
ties, a clear reflection of the reduction in ice thickness due to the ongoing negative mass balances
of these glaciers.
iii
Published Reports
Annual reports of the Swiss glaciers started in the year of 1880 by F.A. Forel (1841-1912).
Authors of the annual reports: No. Year
F.A. Forel et L. Du Pasquier 1 - 17 1880 - 1896
F.A. Forel, M. Lugeon et E. Muret 18 - 27 1897 - 1906
F.A. Forel, E. Muret, P.L. Mercanton et E. Ar-
gand
28 1907
F.A. Forel, E. Muret et P.L. Mercanton 29 - 32 1908 - 1911
E. Muret et P.L. Mercanton 33 - 34 1912 - 1913
P.L. Mercanton 35 - 70 1914 - 1949
P.L. Mercanton et A. Renaud 71 - 75 1950 - 1954
A. Renaud 76 - 83 1955 - 1961/62
P. Kasser 84 - 91 1962/63 - 1969/70
P. Kasser und M. Aellen 92 - 104 1970/71 - 1982/83
M. Aellen 105 - 115 1983/84 - 1993/94
M. Aellen, M. Hoelzle und D. Vonder Muhll 116 1994/95
M. Hoelzle und D. Vonder Muhll 117 1995/96
M. Hoelzle, D. Vonder Muhll, A. Bauder und
G.H. Gudmundsson
118 1996/97
M. Hoelzle, D. Vonder Muhll und M. Maisch 119 1997/98
M. Hoelzle, D. Vonder Muhll, M. Schwikowski
und H.W. Gaggeler
120 1998/99
A. Bauder, A. Vieli und M. Hoelzle 121 1999/00
A. Bauder und M. Hoelzle 122 2000/01
A. Bauder, C. Schar und H. Blatter 123 - 124 2001/02 - 2002/03
A. Bauder, J. Faillettaz, M. Funk und A. Pralong 125 - 126 2003/04 - 2004/05
A. Bauder 127 - 132 2005/06 - 2010/11
Authors and editors of the glaciological two year reports:
P. Kasser, M. Aellen und H. Siegenthaler 95/96 - 99/100 1973/74 - 1978/79
M. Aellen 101/102 1979/80 - 1980/81
M. Aellen und E. Herren 103/104 - 111/112 1981/82 - 1990/91
E. Herren und M. Hoelzle 113/114 1991/92 - 1992/93
E. Herren, M. Hoelzle and M. Maisch 115/116 - 119/120 1993/94 - 1998/99
E. Herren, A. Bauder, M. Hoelzle and M. Maisch 121/122 1999/00 - 2000/01
E. Herren and A. Bauder 123/124 2001/02 - 2002/03
A. Bauder and R. Ruegg 125/126 2003/04 - 2004/05
A. Bauder and C. Ryser 127/128 2005/06 - 2006/07
A. Bauder 129/130 - 131/132 2007/08 - 2010/11
iv
Contents
Summary iii
Published Reports iv
1 Introduction 1
2 Weather and Climate 3
2.1 Weather and Climate in 2011/12 . . . . . . . . . . . . . . . . . . . . . . . . . . . 3
2.2 Weather and Climate in 2012/13 . . . . . . . . . . . . . . . . . . . . . . . . . . . 4
3 Length Variation 7
3.1 Introduction . . . . . . . . . . . . . . . . . . . . . . . . . . . . . . . . . . . . . . 7
3.2 Length Variations in 2011/12 . . . . . . . . . . . . . . . . . . . . . . . . . . . . . 7
3.3 Length Variations in 2012/13 . . . . . . . . . . . . . . . . . . . . . . . . . . . . . 8
3.4 Length Variations in 2011/12 and in 2012/13, Summary . . . . . . . . . . . . . . 9
3.5 Length Variations - Statistics for 1880-2013 . . . . . . . . . . . . . . . . . . . . . 14
4 Mass Balance 19
4.1 Introduction, cumulative mean specific mass balances . . . . . . . . . . . . . . . . 19
4.2 Mass Balance in 2011/12 . . . . . . . . . . . . . . . . . . . . . . . . . . . . . . . 21
4.3 Mass Balance in 2012/13 . . . . . . . . . . . . . . . . . . . . . . . . . . . . . . . 22
4.4 Ghiacciaio del Basodino . . . . . . . . . . . . . . . . . . . . . . . . . . . . . . . . 23
4.5 Findelengletscher . . . . . . . . . . . . . . . . . . . . . . . . . . . . . . . . . . . . 27
4.6 Griesgletscher (Aegina) . . . . . . . . . . . . . . . . . . . . . . . . . . . . . . . . 32
4.7 Pizolgletscher . . . . . . . . . . . . . . . . . . . . . . . . . . . . . . . . . . . . . 37
4.8 Glacier de la Plaine Morte . . . . . . . . . . . . . . . . . . . . . . . . . . . . . . . 40
4.9 Rhonegletscher . . . . . . . . . . . . . . . . . . . . . . . . . . . . . . . . . . . . . 43
4.10 Sankt Annafirn . . . . . . . . . . . . . . . . . . . . . . . . . . . . . . . . . . . . . 47
4.11 Silvrettagletscher . . . . . . . . . . . . . . . . . . . . . . . . . . . . . . . . . . . . 51
4.12 Glacier de Tsanfleuron . . . . . . . . . . . . . . . . . . . . . . . . . . . . . . . . . 56
4.13 Claridenfirn . . . . . . . . . . . . . . . . . . . . . . . . . . . . . . . . . . . . . . . 60
4.14 Grosser Aletsch (Jungfraufirn) . . . . . . . . . . . . . . . . . . . . . . . . . . . . 63
5 Volume Change 65
5.1 Introduction . . . . . . . . . . . . . . . . . . . . . . . . . . . . . . . . . . . . . . 65
5.2 Long-term time-series . . . . . . . . . . . . . . . . . . . . . . . . . . . . . . . . . 67
5.3 Change in ice volume and geodetic mass balance . . . . . . . . . . . . . . . . . . . 67
v
6 Velocity 73
6.1 Introduction . . . . . . . . . . . . . . . . . . . . . . . . . . . . . . . . . . . . . . 73
6.2 Glacier du Gietro . . . . . . . . . . . . . . . . . . . . . . . . . . . . . . . . . . . . 75
6.3 Glacier de Corbassiere . . . . . . . . . . . . . . . . . . . . . . . . . . . . . . . . . 78
6.4 Aaregletscher . . . . . . . . . . . . . . . . . . . . . . . . . . . . . . . . . . . . . . 81
6.5 Mattmark . . . . . . . . . . . . . . . . . . . . . . . . . . . . . . . . . . . . . . . 85
References 89
Acknowledgements 92
A Remote Sensing 93
A.1 Aerial photographs . . . . . . . . . . . . . . . . . . . . . . . . . . . . . . . . . . . 93
B Remarks on Individual Glaciers 97
C Investigators 115
C.1 Length Variation (2013) . . . . . . . . . . . . . . . . . . . . . . . . . . . . . . . . 115
C.2 Mass Balance and Velocity . . . . . . . . . . . . . . . . . . . . . . . . . . . . . . 118
vi
1 Introduction
Systematic and long-term records of glacier changes in Switzerland started in 1880 with annual
length change measurements of selected glaciers. At that time these measurements were motivated
by questions about past and future ice ages. In the meantime, the goals of the worldwide glacier
monitoring programs have evolved and multiplied. Glacier change data are primarily necessary for
investigations of the glacier-climate interactions. The data are also important for the assessment of
water resources, sea level rise and natural hazards. Finally, the broad public manifests an increasing
interest in glacier changes.
The main focus of the ongoing Swiss Glacier Monitoring Network is to collect the following data:
(1) mass balance, (2) surface flow velocity, (3) length variation, (4) glacier inventory (extent
and associated parameters) and (5) englacial temperature. The program for glacier monitoring
in Switzerland (GLAMOS) has been adopted by the Cryospheric Commission in March 2007. A
detailed description about the aims, current status and perspectives of the monitoring program
was presented in chapter 1.1 of ”The Swiss Glaciers” volume number 125/126.
The results of the Swiss glacier monitoring contribute also to the international efforts to doc-
ument glacier fluctuations as part of global environmental monitoring initiatives of the Global
Terrestrial Network for Glaciers (GTN-G) within the Global Terrestrial and Climate Observing
System (GTOS/ GCOS) and are reported to the World Glacier Monitoring Service (WGMS).
This report is the new volume No. 133/134 in the series ”The Swiss Glaciers” and presents the
results of the two observational periods 2011/12 and 2012/13. It carries on the long tradition of
yearbooks documenting monitored fluctuations of Swiss glaciers since 1880 (see page iv). Data and
digital versions of the present and earlier volumes can be found at http://glaciology.ethz.ch/swiss-
glaciers. Thanks to continuous efforts of many people, public and private organisations in Switzer-
land, long time-series of data related to glacier changes do exist.
The present data-report expands the short overview of general outcomes published annually in
German, French and Italian in the magazine ”Die Alpen - Les Alpes - Le Alpi” of the Swiss Alpine
Club with detailed facts and figures.
1

2 Weather and Climate
In this section the weather and climate conditions for the two periods under review 2011/12 and
2012/13 are described. The focus is on the variables that are most relevant for glacier mass bal-
ance, namely temperature and precipitation. In general, glacier mass balance is largely determined
by the amount of snow fall in winter and the temperature during summer. Additionally, particular
climate conditions can have an important influence. High temperatures in April, May or June
can reduce the winter snow pack rapidly and expose the much darker ice surface already in July.
During July and August solar radiation receipts are very high and melting of the unprotected ice
can reach extreme values. When these two factors occur together very negative mass balances like
in the period 2002/03 are expected. On the other hand, snow fall down to low elevations (2000
m a.s.l.) during summer protects the glacier surface from melting and will lead to less negative
mass balances. Precipitation that falls as rain influences the mass balance negatively.
We have selected the four high-elevation climate stations at Grand St-Bernard (2472 m), Jungfrau-
joch (3580 m), Santis (2502 m) and Weissfluhjoch (2690 m) to illustrate the monthly anomalies
in air temperature (Figure 2.1) and 15 stations (Airolo, Chateau-d’Oex, Disentis, Engelberg, Elm,
Grand St-Bernard, Grimsel Hospiz, Montana, Lauterbrunnen, Santis, Scuol, Sils-Maria, Weiss-
fluhjoch, Zermatt) throughout all regions of the Swiss Alps for monthly anomalies in precipitation
(Figure 2.2) in the two reporting periods. For the two parameters of annual precipitation and mean
summer temperature, the long-term record since 1880 is shown in Figures 2.3 and 2.4 as a mean
of 12 homogenized climate stations (Begert et al., 2005). All stations belong to the observa-
tional networks maintained by MeteoSwiss. The description of the weather conditions in the two
reporting periods refer to the figures and the annual and monthly reports of the meteorological
conditions by MeteoSwiss.
2.1 Weather and Climate in 2011/12
The first snowfalls occurring in early October on the north side of the Alps down to the valleys
were followed by rainfalls extending up to the elevation of the glaciers. Due to warm, dry condi-
tions in November, autumn 2011 experienced the second-warmest temperatures after 2006 since
meteorological measurements began in 1864. At the end of November, the Swiss Alps were free of
snow well up to 2500 m a.s.l. A comparable situation can be expected at intervals of approx. every
30 years, and occurred for the last time in 1953. December gave way to heavy snowstorms, with
enormous amounts of new snow falling in four main events. Two more major snowfalls in January
3
The Swiss Glaciers 2011/12 and 2012/13
Oct Nov Dec Jan Feb Mar Apr May Jun Jul Aug Sep-6
-4
-2
0
2
4
6
Tem
pera
ture
ano
mal
y (d
eg C
)
2011/122012/13
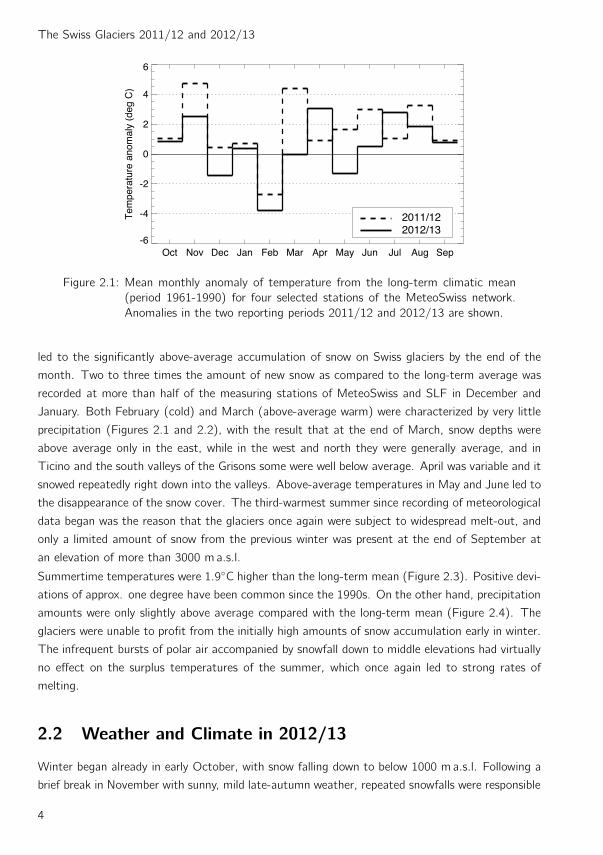
Figure 2.1: Mean monthly anomaly of temperature from the long-term climatic mean
(period 1961-1990) for four selected stations of the MeteoSwiss network.
Anomalies in the two reporting periods 2011/12 and 2012/13 are shown.
led to the significantly above-average accumulation of snow on Swiss glaciers by the end of the
month. Two to three times the amount of new snow as compared to the long-term average was
recorded at more than half of the measuring stations of MeteoSwiss and SLF in December and
January. Both February (cold) and March (above-average warm) were characterized by very little
precipitation (Figures 2.1 and 2.2), with the result that at the end of March, snow depths were
above average only in the east, while in the west and north they were generally average, and in
Ticino and the south valleys of the Grisons some were well below average. April was variable and it
snowed repeatedly right down into the valleys. Above-average temperatures in May and June led to
the disappearance of the snow cover. The third-warmest summer since recording of meteorological
data began was the reason that the glaciers once again were subject to widespread melt-out, and
only a limited amount of snow from the previous winter was present at the end of September at
an elevation of more than 3000 m a.s.l.
Summertime temperatures were 1.9◦C higher than the long-term mean (Figure 2.3). Positive devi-
ations of approx. one degree have been common since the 1990s. On the other hand, precipitation
amounts were only slightly above average compared with the long-term mean (Figure 2.4). The
glaciers were unable to profit from the initially high amounts of snow accumulation early in winter.
The infrequent bursts of polar air accompanied by snowfall down to middle elevations had virtually
no effect on the surplus temperatures of the summer, which once again led to strong rates of
melting.
2.2 Weather and Climate in 2012/13
Winter began already in early October, with snow falling down to below 1000 m a.s.l. Following a
brief break in November with sunny, mild late-autumn weather, repeated snowfalls were responsible
4
2. Weather and Climate
Oct Nov Dec Jan Feb Mar Apr May Jun Jul Aug Sep-100
-50
0
50
100
Per
cipi
tatio
n an
omal
y (%
)
2011/122012/13
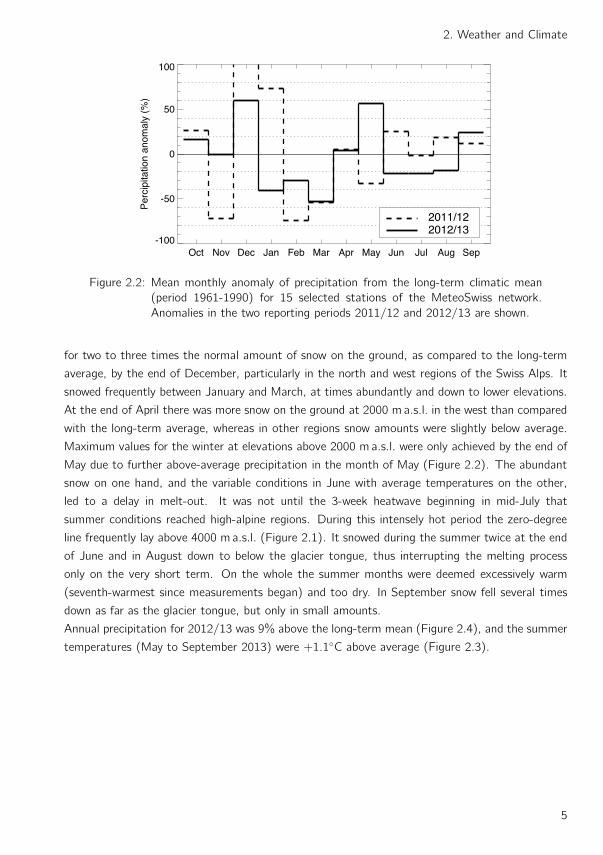
Figure 2.2: Mean monthly anomaly of precipitation from the long-term climatic mean
(period 1961-1990) for 15 selected stations of the MeteoSwiss network.
Anomalies in the two reporting periods 2011/12 and 2012/13 are shown.
for two to three times the normal amount of snow on the ground, as compared to the long-term
average, by the end of December, particularly in the north and west regions of the Swiss Alps. It
snowed frequently between January and March, at times abundantly and down to lower elevations.
At the end of April there was more snow on the ground at 2000 m a.s.l. in the west than compared
with the long-term average, whereas in other regions snow amounts were slightly below average.
Maximum values for the winter at elevations above 2000 m a.s.l. were only achieved by the end of
May due to further above-average precipitation in the month of May (Figure 2.2). The abundant
snow on one hand, and the variable conditions in June with average temperatures on the other,
led to a delay in melt-out. It was not until the 3-week heatwave beginning in mid-July that
summer conditions reached high-alpine regions. During this intensely hot period the zero-degree
line frequently lay above 4000 m a.s.l. (Figure 2.1). It snowed during the summer twice at the end
of June and in August down to below the glacier tongue, thus interrupting the melting process
only on the very short term. On the whole the summer months were deemed excessively warm
(seventh-warmest since measurements began) and too dry. In September snow fell several times
down as far as the glacier tongue, but only in small amounts.
Annual precipitation for 2012/13 was 9% above the long-term mean (Figure 2.4), and the summer
temperatures (May to September 2013) were +1.1◦C above average (Figure 2.3).
5
The Swiss Glaciers 2011/12 and 2012/13
1860 1880 1900 1920 1940 1960 1980 2000
0
1
2
3
Tem
pera
ture
ano
mal
ies
(o C
)
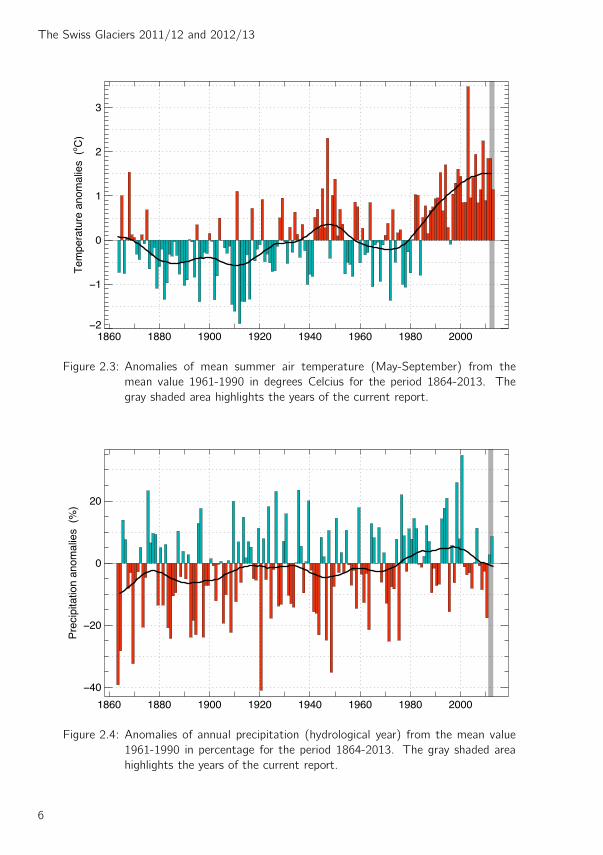
Figure 2.3: Anomalies of mean summer air temperature (May-September) from the
mean value 1961-1990 in degrees Celcius for the period 1864-2013. The
gray shaded area highlights the years of the current report.
1860 1880 1900 1920 1940 1960 1980 2000
0
20
Pre
cipi
tatio
n an
omal
ies
(%
)
Figure 2.4: Anomalies of annual precipitation (hydrological year) from the mean value
1961-1990 in percentage for the period 1864-2013. The gray shaded area
highlights the years of the current report.
6
3 Length Variation
3.1 Introduction
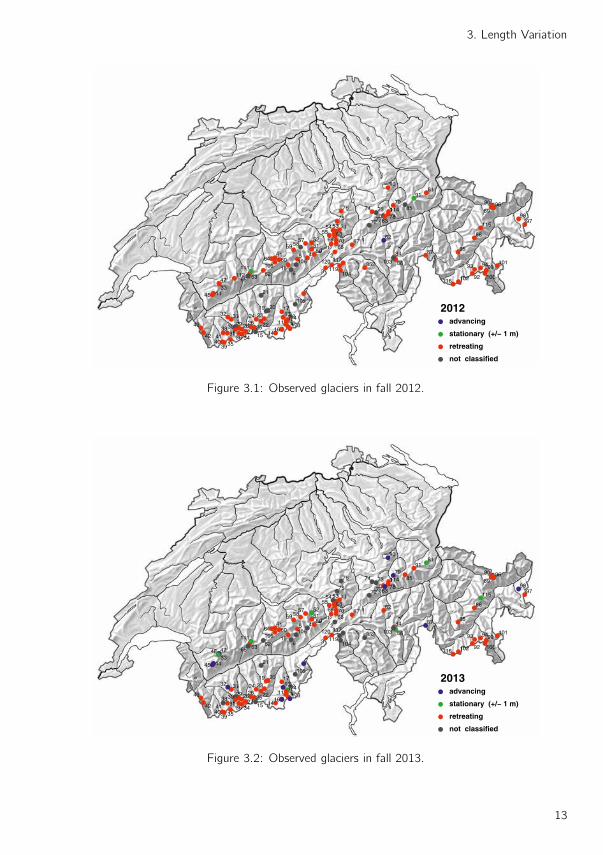
In the two periods of this report, 114 of about 125 glaciers of the observational network were
actively observed (Figures 3.1, 3.2 and Table 3.1). The other glaciers (compare Table 3.1, remark
f) have melted back drastically, and are often debris-covered, on one hand, with the result that it
is simply not possible to carry out a proper survey at yearly intervals. On the other hand, a number
of glaciers were observed only at irregular intervals, and the obtained measurement values were
rather imprecise, which does not justify preserving these figures in the charts and analyses.
During the two years under review, 2011/12 and 2012/13, Swiss glaciers suffered further losses in
length. As in previous periods, most of the measurements are within the range of 0 to -30 m for
both periods. This overall trend was overshadowed in both years by a few significantly high retreat
values, which could be traced to local influences as in previous years, or refer to larger glaciers,
and in some cases also pertain to a period of several years. They are usually also the result of a
process extending over a longer period of time and thus are not unexpected.
3.2 Length Variations in 2011/12
In autumn 2012 changes in the terminus position as compared to the previous year were determined
at 96 glaciers (Figure 3.1). Of these, 93 were found to be in recession, for two there was no change
observed, and one single glacier showed a positive value. The values ranged from a retreat of -
842m at Steinlimmigletscher to a slight advance of +2m at the margin of Glatscher da Lavaz.
Approximately two-thirds of the measurement values lay between -1 and -30m.
The massive retreat of Steinlimmigletscher is to be seen in the context of a development over the
past ten years. The glacier was being fed along its tongue by two lateral inflows. The various side
branches were thinning out gradually over the past decade and were no longer connected, with
the result that the terminus of the main branch abruptly and substantially shifted backwards. The
timing was rather arbitrary and only poorly reflects the continuous change of the glacier. Glacier
de Corbassiere also experienced a massive retreat of -146m. Its tongue appeared as a narrow,
thinned-out sheet of ice that had been melting away rapidly in the last four years.
Local changes at the terminus of the glacier were responsible for the positive values measured
at Glatscher da Lavaz. This is not an advance stemming from abundant ice flows from the firn
7
The Swiss Glaciers 2011/12 and 2012/13
area. The flow velocity of such a small glacier is small and thus the ice flow at the tongue is less
important than the snow accumulation over the winter and the melt conditions in summer. The
advance at the ice margin was possibly favored by the above-average amounts of snow in winter
and reduced melting in summer due to the debris cover.
3.3 Length Variations in 2012/13
Length variations were determined for 87 glaciers in autumn 2013 (Figure 3.2). Of these, 70
became shorter, seven did not change their position, and twelve were slightly in advance. At the
end of the summer, firn patches were left on a number of glacier tongues, particularly those in
Ticino. These hindered measurement activities, with values being provided for fewer glaciers than
usual in past years. These conditions also resulted in a greater number of stationary or slightly
advancing glacier tongues. With three exceptions, the values ranged from a recession of barely
100 meters each at Gamchigletscher and Vadret da Tschierva, to an advance of 11 meters at
Surettagletscher. Approximately half of the measurement values lay between -1 and -25 meters.
Oberer and the Unterer Grindelwaldgletscher and Triftgletscher were the three exceptions. The
high retreat values for each is linked with a process that has been underway for about the past
20 years. Due to drastic melting and the continued absence of ice flow from the firn areas, the
glaciers have become progressively thinner. During the period under review, the Triftgletscher
and the Oberer Grindelwaldgletscher broke apart in a steep section of terrain, while at the Unterer
Grindelwaldgletscher a broad section of the flat, debris-covered tongues disintegrated into individual
ice masses. At all three glaciers, the dynamic terminus shifted back abruptly and substantially.
The timing of these events were rather arbitrary and only poorly reflect the overall and continuous
change of these glaciers.
The positive measurement values stem from the specific weather conditions in the year under
review, and not from a major flow of ice from the firn area causing the glacier tongue to increase
in length due to firn deposits at the margin of the glacier and reduced melting at the terminus.
8
3. Length Variation
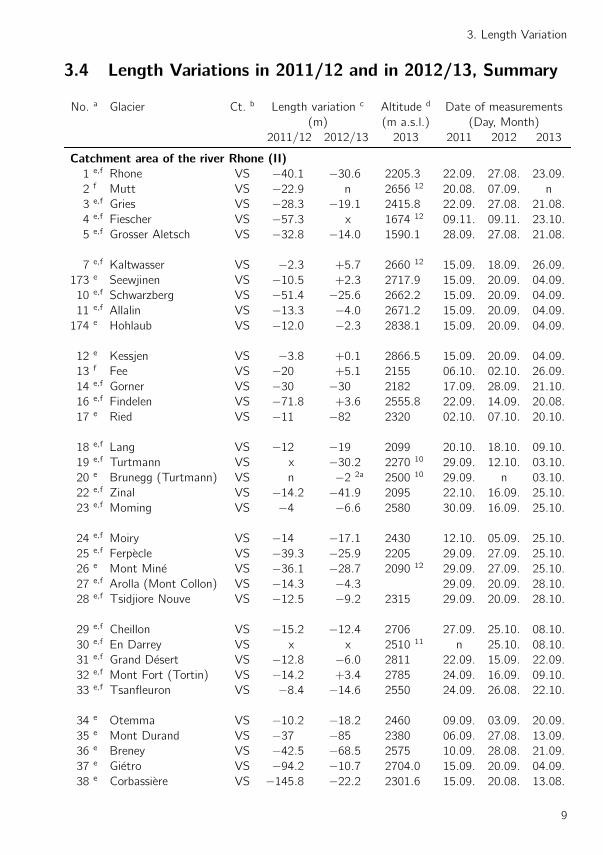
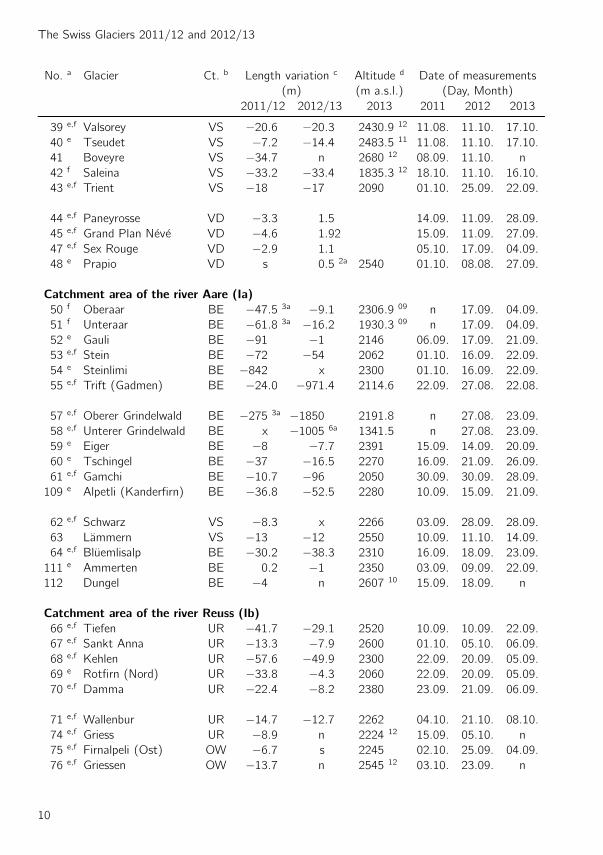
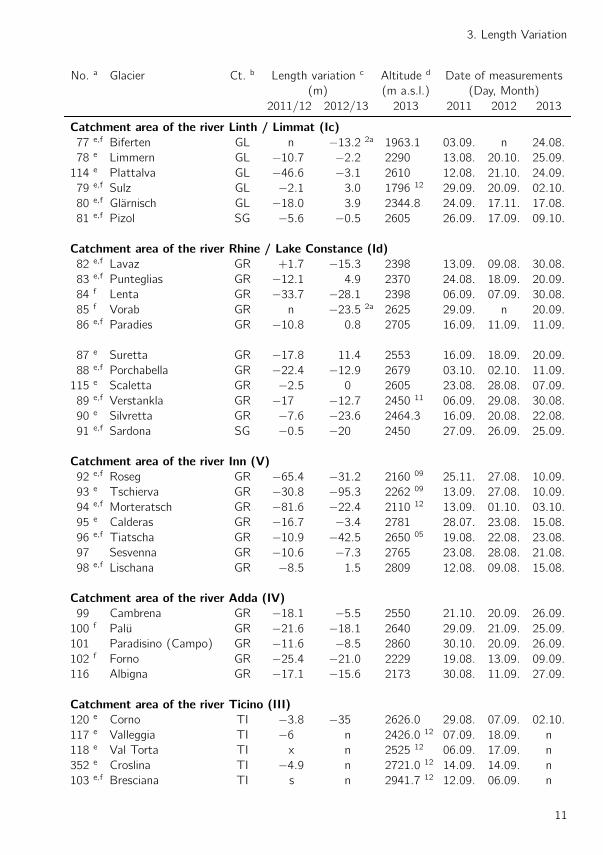
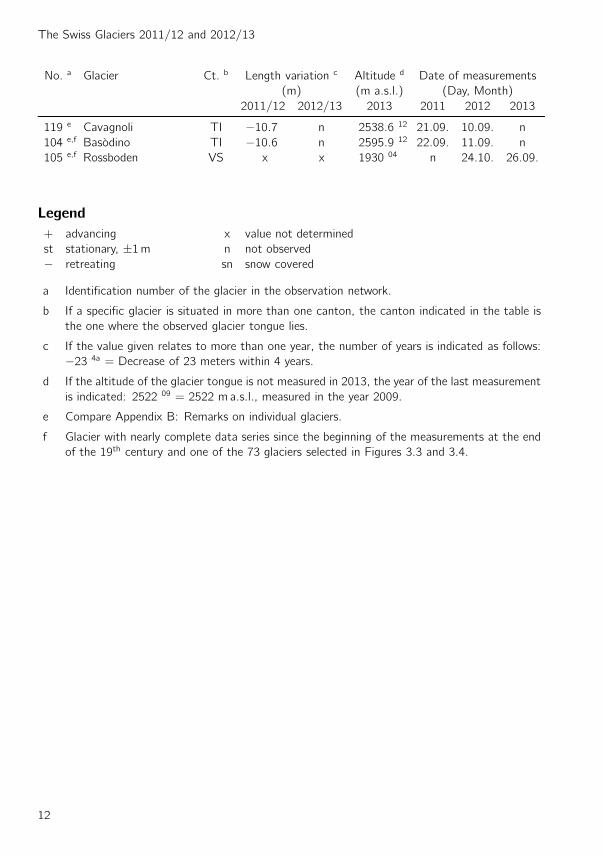
3.4 Length Variations in 2011/12 and in 2012/13, Summary
No. a Glacier Ct. b Length variation c Altitude d Date of measurements
(m) (m a.s.l.) (Day, Month)
2011/12 2012/13 2013 2011 2012 2013
Catchment area of the river Rhone (II)
1 e,f Rhone VS −40.1 −30.6 2205.3 22.09. 27.08. 23.09.
2 f Mutt VS −22.9 n 2656 12 20.08. 07.09. n
3 e,f Gries VS −28.3 −19.1 2415.8 22.09. 27.08. 21.08.
4 e,f Fiescher VS −57.3 x 1674 12 09.11. 09.11. 23.10.
5 e,f Grosser Aletsch VS −32.8 −14.0 1590.1 28.09. 27.08. 21.08.
7 e,f Kaltwasser VS −2.3 +5.7 2660 12 15.09. 18.09. 26.09.
173 e Seewjinen VS −10.5 +2.3 2717.9 15.09. 20.09. 04.09.
10 e,f Schwarzberg VS −51.4 −25.6 2662.2 15.09. 20.09. 04.09.
11 e,f Allalin VS −13.3 −4.0 2671.2 15.09. 20.09. 04.09.
174 e Hohlaub VS −12.0 −2.3 2838.1 15.09. 20.09. 04.09.
12 e Kessjen VS −3.8 +0.1 2866.5 15.09. 20.09. 04.09.
13 f Fee VS −20 +5.1 2155 06.10. 02.10. 26.09.
14 e,f Gorner VS −30 −30 2182 17.09. 28.09. 21.10.
16 e,f Findelen VS −71.8 +3.6 2555.8 22.09. 14.09. 20.08.
17 e Ried VS −11 −82 2320 02.10. 07.10. 20.10.
18 e,f Lang VS −12 −19 2099 20.10. 18.10. 09.10.
19 e,f Turtmann VS x −30.2 2270 10 29.09. 12.10. 03.10.
20 e Brunegg (Turtmann) VS n −2 2a 2500 10 29.09. n 03.10.
22 e,f Zinal VS −14.2 −41.9 2095 22.10. 16.09. 25.10.
23 e,f Moming VS −4 −6.6 2580 30.09. 16.09. 25.10.
24 e,f Moiry VS −14 −17.1 2430 12.10. 05.09. 25.10.
25 e,f Ferpecle VS −39.3 −25.9 2205 29.09. 27.09. 25.10.
26 e Mont Mine VS −36.1 −28.7 2090 12 29.09. 27.09. 25.10.
27 e,f Arolla (Mont Collon) VS −14.3 −4.3 29.09. 20.09. 28.10.
28 e,f Tsidjiore Nouve VS −12.5 −9.2 2315 29.09. 20.09. 28.10.
29 e,f Cheillon VS −15.2 −12.4 2706 27.09. 25.10. 08.10.
30 e,f En Darrey VS x x 2510 11 n 25.10. 08.10.
31 e,f Grand Desert VS −12.8 −6.0 2811 22.09. 15.09. 22.09.
32 e,f Mont Fort (Tortin) VS −14.2 +3.4 2785 24.09. 16.09. 09.10.
33 e,f Tsanfleuron VS −8.4 −14.6 2550 24.09. 26.08. 22.10.
34 e Otemma VS −10.2 −18.2 2460 09.09. 03.09. 20.09.
35 e Mont Durand VS −37 −85 2380 06.09. 27.08. 13.09.
36 e Breney VS −42.5 −68.5 2575 10.09. 28.08. 21.09.
37 e Gietro VS −94.2 −10.7 2704.0 15.09. 20.09. 04.09.
38 e Corbassiere VS −145.8 −22.2 2301.6 15.09. 20.08. 13.08.
9
The Swiss Glaciers 2011/12 and 2012/13
No. a Glacier Ct. b Length variation c Altitude d Date of measurements
(m) (m a.s.l.) (Day, Month)
2011/12 2012/13 2013 2011 2012 2013
39 e,f Valsorey VS −20.6 −20.3 2430.9 12 11.08. 11.10. 17.10.
40 e Tseudet VS −7.2 −14.4 2483.5 11 11.08. 11.10. 17.10.
41 Boveyre VS −34.7 n 2680 12 08.09. 11.10. n
42 f Saleina VS −33.2 −33.4 1835.3 12 18.10. 11.10. 16.10.
43 e,f Trient VS −18 −17 2090 01.10. 25.09. 22.09.
44 e,f Paneyrosse VD −3.3 1.5 14.09. 11.09. 28.09.
45 e,f Grand Plan Neve VD −4.6 1.92 15.09. 11.09. 27.09.
47 e,f Sex Rouge VD −2.9 1.1 05.10. 17.09. 04.09.
48 e Prapio VD s 0.5 2a 2540 01.10. 08.08. 27.09.
Catchment area of the river Aare (Ia)
50 f Oberaar BE −47.5 3a −9.1 2306.9 09 n 17.09. 04.09.
51 f Unteraar BE −61.8 3a −16.2 1930.3 09 n 17.09. 04.09.
52 e Gauli BE −91 −1 2146 06.09. 17.09. 21.09.
53 e,f Stein BE −72 −54 2062 01.10. 16.09. 22.09.
54 e Steinlimi BE −842 x 2300 01.10. 16.09. 22.09.
55 e,f Trift (Gadmen) BE −24.0 −971.4 2114.6 22.09. 27.08. 22.08.
57 e,f Oberer Grindelwald BE −275 3a −1850 2191.8 n 27.08. 23.09.
58 e,f Unterer Grindelwald BE x −1005 6a 1341.5 n 27.08. 23.09.
59 e Eiger BE −8 −7.7 2391 15.09. 14.09. 20.09.
60 e Tschingel BE −37 −16.5 2270 16.09. 21.09. 26.09.
61 e,f Gamchi BE −10.7 −96 2050 30.09. 30.09. 28.09.
109 e Alpetli (Kanderfirn) BE −36.8 −52.5 2280 10.09. 15.09. 21.09.
62 e,f Schwarz VS −8.3 x 2266 03.09. 28.09. 28.09.
63 Lammern VS −13 −12 2550 10.09. 11.10. 14.09.
64 e,f Bluemlisalp BE −30.2 −38.3 2310 16.09. 18.09. 23.09.
111 e Ammerten BE 0.2 −1 2350 03.09. 09.09. 22.09.
112 Dungel BE −4 n 2607 10 15.09. 18.09. n
Catchment area of the river Reuss (Ib)
66 e,f Tiefen UR −41.7 −29.1 2520 10.09. 10.09. 22.09.
67 e,f Sankt Anna UR −13.3 −7.9 2600 01.10. 05.10. 06.09.
68 e,f Kehlen UR −57.6 −49.9 2300 22.09. 20.09. 05.09.
69 e Rotfirn (Nord) UR −33.8 −4.3 2060 22.09. 20.09. 05.09.
70 e,f Damma UR −22.4 −8.2 2380 23.09. 21.09. 06.09.
71 e,f Wallenbur UR −14.7 −12.7 2262 04.10. 21.10. 08.10.
74 e,f Griess UR −8.9 n 2224 12 15.09. 05.10. n
75 e,f Firnalpeli (Ost) OW −6.7 s 2245 02.10. 25.09. 04.09.
76 e,f Griessen OW −13.7 n 2545 12 03.10. 23.09. n
10
3. Length Variation
No. a Glacier Ct. b Length variation c Altitude d Date of measurements
(m) (m a.s.l.) (Day, Month)
2011/12 2012/13 2013 2011 2012 2013
Catchment area of the river Linth / Limmat (Ic)
77 e,f Biferten GL n −13.2 2a 1963.1 03.09. n 24.08.
78 e Limmern GL −10.7 −2.2 2290 13.08. 20.10. 25.09.
114 e Plattalva GL −46.6 −3.1 2610 12.08. 21.10. 24.09.
79 e,f Sulz GL −2.1 3.0 1796 12 29.09. 20.09. 02.10.
80 e,f Glarnisch GL −18.0 3.9 2344.8 24.09. 17.11. 17.08.
81 e,f Pizol SG −5.6 −0.5 2605 26.09. 17.09. 09.10.
Catchment area of the river Rhine / Lake Constance (Id)
82 e,f Lavaz GR +1.7 −15.3 2398 13.09. 09.08. 30.08.
83 e,f Punteglias GR −12.1 4.9 2370 24.08. 18.09. 20.09.
84 f Lenta GR −33.7 −28.1 2398 06.09. 07.09. 30.08.
85 f Vorab GR n −23.5 2a 2625 29.09. n 20.09.
86 e,f Paradies GR −10.8 0.8 2705 16.09. 11.09. 11.09.
87 e Suretta GR −17.8 11.4 2553 16.09. 18.09. 20.09.
88 e,f Porchabella GR −22.4 −12.9 2679 03.10. 02.10. 11.09.
115 e Scaletta GR −2.5 0 2605 23.08. 28.08. 07.09.
89 e,f Verstankla GR −17 −12.7 2450 11 06.09. 29.08. 30.08.
90 e Silvretta GR −7.6 −23.6 2464.3 16.09. 20.08. 22.08.
91 e,f Sardona SG −0.5 −20 2450 27.09. 26.09. 25.09.
Catchment area of the river Inn (V)
92 e,f Roseg GR −65.4 −31.2 2160 09 25.11. 27.08. 10.09.
93 e Tschierva GR −30.8 −95.3 2262 09 13.09. 27.08. 10.09.
94 e,f Morteratsch GR −81.6 −22.4 2110 12 13.09. 01.10. 03.10.
95 e Calderas GR −16.7 −3.4 2781 28.07. 23.08. 15.08.
96 e,f Tiatscha GR −10.9 −42.5 2650 05 19.08. 22.08. 23.08.
97 Sesvenna GR −10.6 −7.3 2765 23.08. 28.08. 21.08.
98 e,f Lischana GR −8.5 1.5 2809 12.08. 09.08. 15.08.
Catchment area of the river Adda (IV)
99 Cambrena GR −18.1 −5.5 2550 21.10. 20.09. 26.09.
100 f Palu GR −21.6 −18.1 2640 29.09. 21.09. 25.09.
101 Paradisino (Campo) GR −11.6 −8.5 2860 30.10. 20.09. 26.09.
102 f Forno GR −25.4 −21.0 2229 19.08. 13.09. 09.09.
116 Albigna GR −17.1 −15.6 2173 30.08. 11.09. 27.09.
Catchment area of the river Ticino (III)
120 e Corno TI −3.8 −35 2626.0 29.08. 07.09. 02.10.
117 e Valleggia TI −6 n 2426.0 12 07.09. 18.09. n
118 e Val Torta TI x n 2525 12 06.09. 17.09. n
352 e Croslina TI −4.9 n 2721.0 12 14.09. 14.09. n
103 e,f Bresciana TI s n 2941.7 12 12.09. 06.09. n
11
The Swiss Glaciers 2011/12 and 2012/13
No. a Glacier Ct. b Length variation c Altitude d Date of measurements
(m) (m a.s.l.) (Day, Month)
2011/12 2012/13 2013 2011 2012 2013
119 e Cavagnoli TI −10.7 n 2538.6 12 21.09. 10.09. n
104 e,f Basodino TI −10.6 n 2595.9 12 22.09. 11.09. n
105 e,f Rossboden VS x x 1930 04 n 24.10. 26.09.
Legend
+ advancing x value not determined
st stationary, ±1m n not observed
− retreating sn snow covered
a Identification number of the glacier in the observation network.
b If a specific glacier is situated in more than one canton, the canton indicated in the table is
the one where the observed glacier tongue lies.
c If the value given relates to more than one year, the number of years is indicated as follows:
−23 4a = Decrease of 23 meters within 4 years.
d If the altitude of the glacier tongue is not measured in 2013, the year of the last measurement
is indicated: 2522 09 = 2522 m a.s.l., measured in the year 2009.
e Compare Appendix B: Remarks on individual glaciers.
f Glacier with nearly complete data series since the beginning of the measurements at the end
of the 19th century and one of the 73 glaciers selected in Figures 3.3 and 3.4.
12
3. Length Variation
12
3
45
6
7
10111213
141516
17
18
19 20
21
22
2324
2526
27282930
3132
33
3435
3637
38
39404142
43
4445
47
505152
535455
575859
6061
6263
64
65
6667
6869 70
7172
7374
75
76
77 78
79
8081
82
83
84
85
86
87
88
89
9091
92
93 94
95
96
9798
99
100
101
102
103
104
105
106109111
112
114
115
116
117
119120
173174
352
2012advancing
stationary (+/− 1 m)
retreating
not classified
Figure 3.1: Observed glaciers in fall 2012.
12
3
45
6
7
10111213
141516
17
18
19 20
21
22
2324
2526
27282930
3132
33
3435
3637
38
39404142
43
4445
4748
505152
535455
575859
6061
6263
64
65
6667
6869 70
7172
7374
75
76
77 78
79
8081
82
83
84
85
86
87
88
89
9091
92
93 94
95
96
9798
99
100
101
102
103
104
105
106109111
114
115
116
117
119120
173174
352
2013advancing
stationary (+/− 1 m)
retreating
not classified
Figure 3.2: Observed glaciers in fall 2013.
13
The Swiss Glaciers 2011/12 and 2012/13
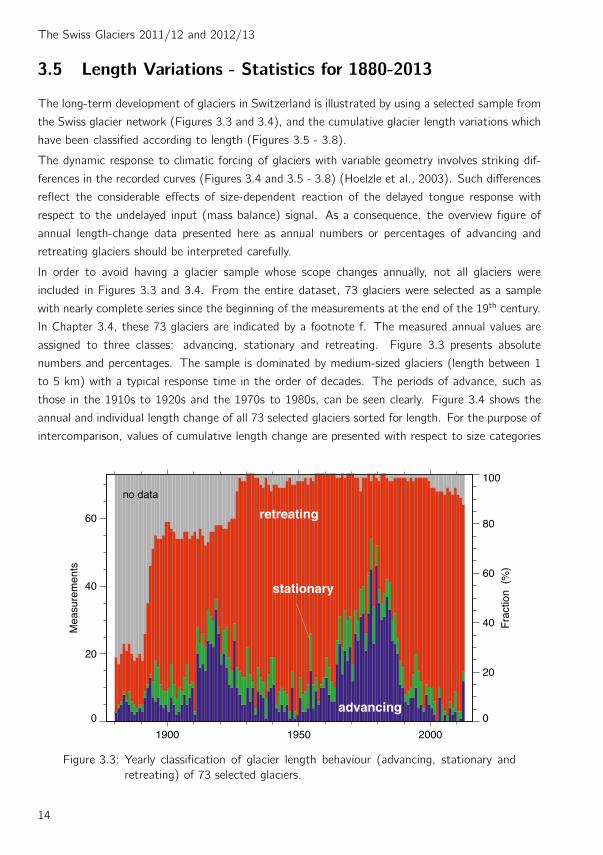
3.5 Length Variations - Statistics for 1880-2013
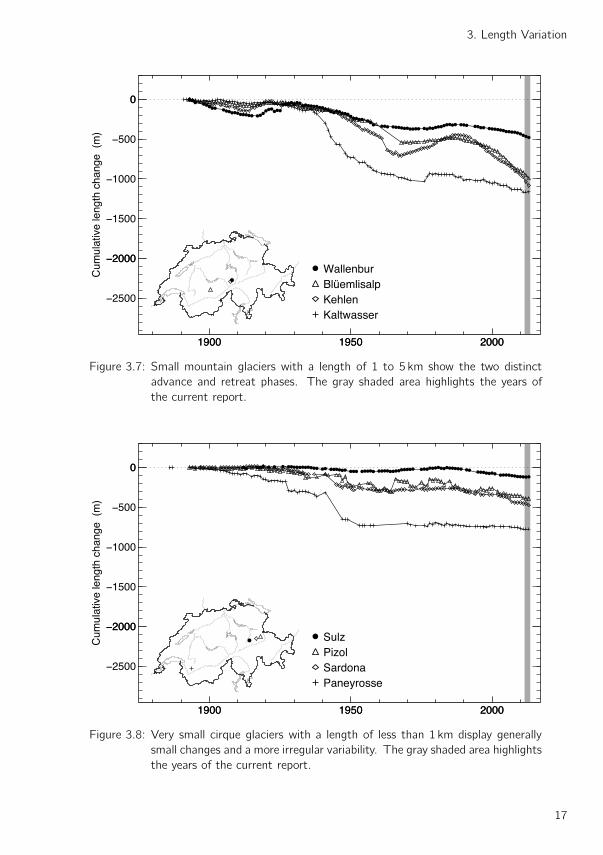
The long-term development of glaciers in Switzerland is illustrated by using a selected sample from
the Swiss glacier network (Figures 3.3 and 3.4), and the cumulative glacier length variations which
have been classified according to length (Figures 3.5 - 3.8).
The dynamic response to climatic forcing of glaciers with variable geometry involves striking dif-
ferences in the recorded curves (Figures 3.4 and 3.5 - 3.8) (Hoelzle et al., 2003). Such differences
reflect the considerable effects of size-dependent reaction of the delayed tongue response with
respect to the undelayed input (mass balance) signal. As a consequence, the overview figure of
annual length-change data presented here as annual numbers or percentages of advancing and
retreating glaciers should be interpreted carefully.
In order to avoid having a glacier sample whose scope changes annually, not all glaciers were
included in Figures 3.3 and 3.4. From the entire dataset, 73 glaciers were selected as a sample
with nearly complete series since the beginning of the measurements at the end of the 19th century.
In Chapter 3.4, these 73 glaciers are indicated by a footnote f. The measured annual values are
assigned to three classes: advancing, stationary and retreating. Figure 3.3 presents absolute
numbers and percentages. The sample is dominated by medium-sized glaciers (length between 1
to 5 km) with a typical response time in the order of decades. The periods of advance, such as
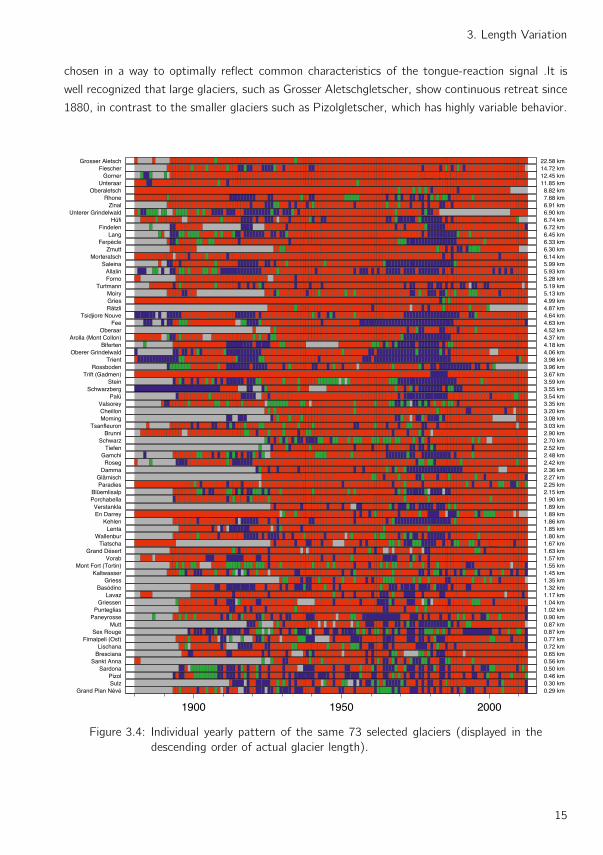
those in the 1910s to 1920s and the 1970s to 1980s, can be seen clearly. Figure 3.4 shows the
annual and individual length change of all 73 selected glaciers sorted for length. For the purpose of
intercomparison, values of cumulative length change are presented with respect to size categories
1900 1950 2000
0
20
40
60
Mea
sure
men
ts
no data
retreating
stationary
advancing0
20
40
60
80
100
Fra
ctio
n (
%)
Figure 3.3: Yearly classification of glacier length behaviour (advancing, stationary and
retreating) of 73 selected glaciers.
14
3. Length Variation
chosen in a way to optimally reflect common characteristics of the tongue-reaction signal .It is
well recognized that large glaciers, such as Grosser Aletschgletscher, show continuous retreat since
1880, in contrast to the smaller glaciers such as Pizolgletscher, which has highly variable behavior.
1900 1950 2000
Grand Plan Névé 0.29 kmSulz 0.30 kmPizol 0.46 km
Sardona 0.50 kmSankt Anna 0.56 km
Bresciana 0.65 kmLischana 0.72 km
Firnalpeli (Ost) 0.77 kmSex Rouge 0.87 km
Mutt 0.87 kmPaneyrosse 0.90 km
Punteglias 1.02 kmGriessen 1.04 km
Lavaz 1.17 kmBasòdino 1.32 km
Griess 1.35 kmKaltwasser 1.45 km
Mont Fort (Tortin) 1.55 kmVorab 1.57 km
Grand Désert 1.63 kmTiatscha 1.67 km
Wallenbur 1.80 kmLenta 1.85 km
Kehlen 1.86 kmEn Darrey 1.89 kmVerstankla 1.89 km
Porchabella 1.90 kmBlüemlisalp 2.15 km
Paradies 2.25 kmGlärnisch 2.27 km
Damma 2.36 kmRoseg 2.42 km
Gamchi 2.48 kmTiefen 2.52 km
Schwarz 2.70 kmBrunni 2.90 km
Tsanfleuron 3.03 kmMoming 3.08 kmCheillon 3.20 km
Valsorey 3.35 kmPalü 3.54 km
Schwarzberg 3.55 kmStein 3.59 km
Trift (Gadmen) 3.67 kmRossboden 3.96 km
Trient 3.98 kmOberer Grindelwald 4.06 km
Biferten 4.18 kmArolla (Mont Collon) 4.37 km
Oberaar 4.52 kmFee 4.63 km
Tsidjiore Nouve 4.64 kmRätzli 4.87 kmGries 4.99 kmMoiry 5.13 km
Turtmann 5.19 kmForno 5.28 kmAllalin 5.93 km
Saleina 5.99 kmMorteratsch 6.14 km
Zmutt 6.30 kmFerpècle 6.33 km
Lang 6.45 kmFindelen 6.72 km
Hüfi 6.74 kmUnterer Grindelwald 6.90 km
Zinal 6.91 kmRhone 7.68 km
Oberaletsch 8.82 kmUnteraar 11.85 km
Gorner 12.45 kmFiescher 14.72 km
Grosser Aletsch 22.58 km
Figure 3.4: Individual yearly pattern of the same 73 selected glaciers (displayed in the
descending order of actual glacier length).
15
The Swiss Glaciers 2011/12 and 2012/13
1900 1950 2000
0
Cum
ulat
ive
leng
th c
hang
e (
m)
1900 1950 2000
0
Grosser AletschFiescherGornerUnteraar
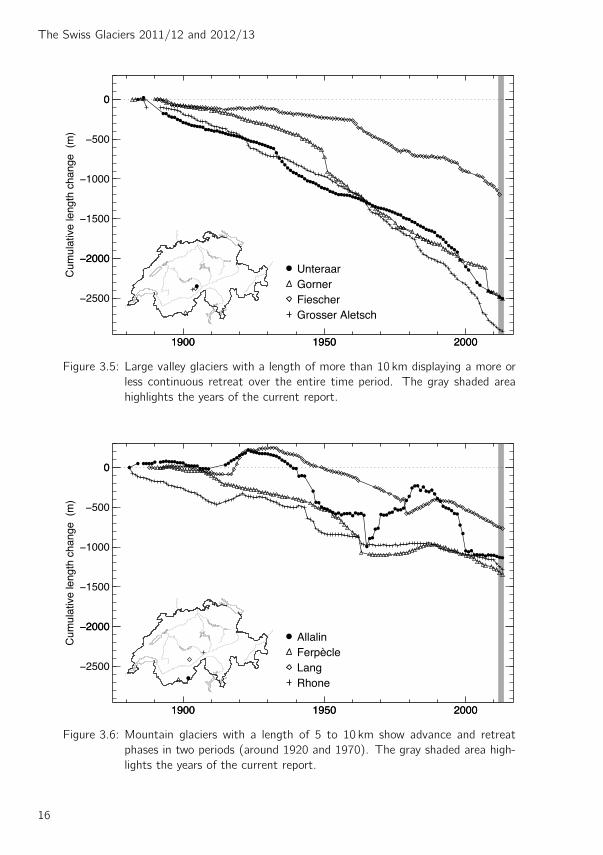
Figure 3.5: Large valley glaciers with a length of more than 10 km displaying a more or
less continuous retreat over the entire time period. The gray shaded area
highlights the years of the current report.
1900 1950 2000
0
Cum
ulat
ive
leng
th c
hang
e (
m)
1900 1950 2000
0
RhoneLangFerpècleAllalin
Figure 3.6: Mountain glaciers with a length of 5 to 10 km show advance and retreat
phases in two periods (around 1920 and 1970). The gray shaded area high-
lights the years of the current report.
16
3. Length Variation
1900 1950 2000
0C
umul
ativ
e le
ngth
cha
nge
(m
)
1900 1950 2000
0
KaltwasserKehlenBlüemlisalpWallenbur
Figure 3.7: Small mountain glaciers with a length of 1 to 5 km show the two distinct
advance and retreat phases. The gray shaded area highlights the years of
the current report.
1900 1950 2000
0
Cum
ulat
ive
leng
th c
hang
e (
m)
1900 1950 2000
0
PaneyrosseSardonaPizolSulz
Figure 3.8: Very small cirque glaciers with a length of less than 1 km display generally
small changes and a more irregular variability. The gray shaded area highlights
the years of the current report.
17
The Swiss Glaciers 2011/12 and 2012/13
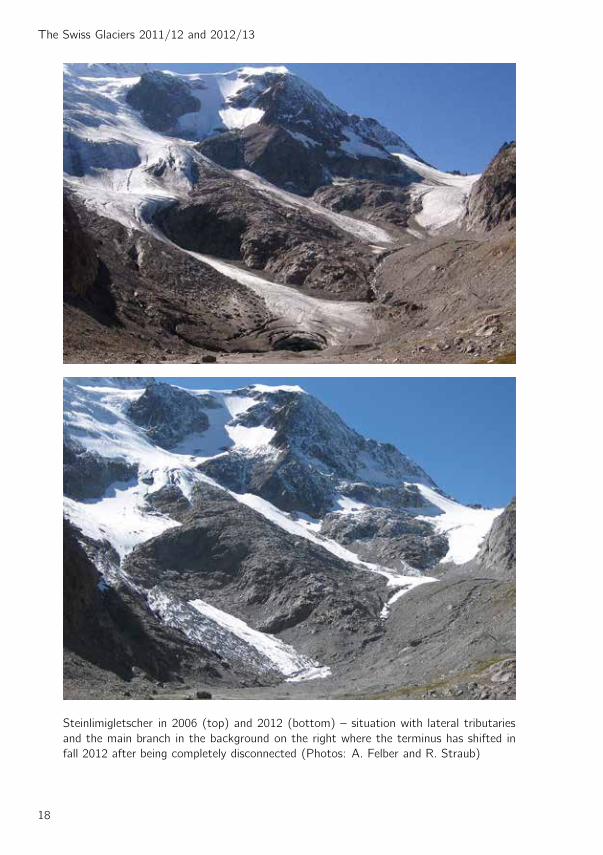
Steinlimigletscher in 2006 (top) and 2012 (bottom) – situation with lateral tributaries
and the main branch in the background on the right where the terminus has shifted in
fall 2012 after being completely disconnected (Photos: A. Felber and R. Straub)
18
4 Mass Balance
4.1 Introduction, cumulative mean specific mass balances
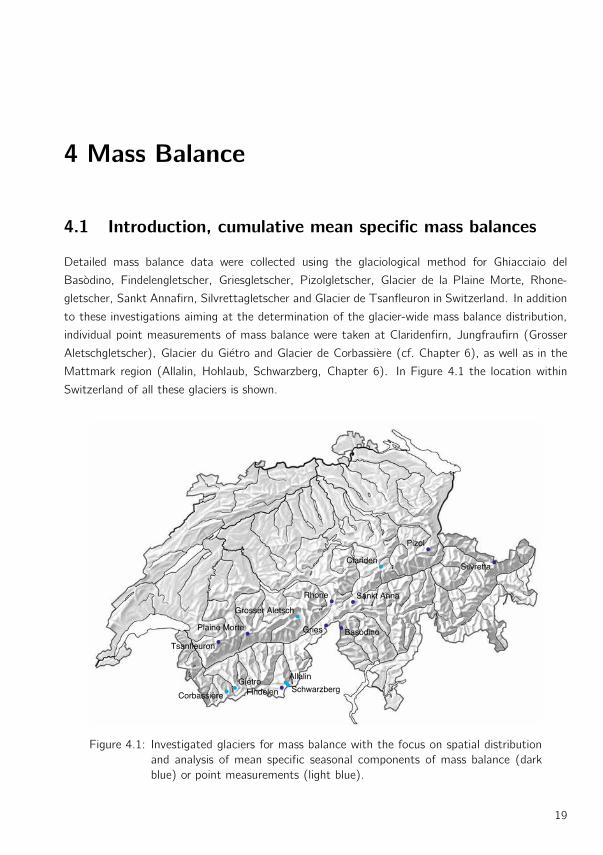
Detailed mass balance data were collected using the glaciological method for Ghiacciaio del
Basodino, Findelengletscher, Griesgletscher, Pizolgletscher, Glacier de la Plaine Morte, Rhone-
gletscher, Sankt Annafirn, Silvrettagletscher and Glacier de Tsanfleuron in Switzerland. In addition
to these investigations aiming at the determination of the glacier-wide mass balance distribution,
individual point measurements of mass balance were taken at Claridenfirn, Jungfraufirn (Grosser
Aletschgletscher), Glacier du Gietro and Glacier de Corbassiere (cf. Chapter 6), as well as in the
Mattmark region (Allalin, Hohlaub, Schwarzberg, Chapter 6). In Figure 4.1 the location within
Switzerland of all these glaciers is shown.
Basòdino
Findelen
Gries
Pizol
Sankt Anna
Silvretta
Rhone
Tsanfleuron
Plaine Morte
Clariden
Grosser Aletsch
Allalin
SchwarzbergCorbassière
Giétro
Figure 4.1: Investigated glaciers for mass balance with the focus on spatial distribution
and analysis of mean specific seasonal components of mass balance (dark
blue) or point measurements (light blue).
19
The Swiss Glaciers 2011/12 and 2012/13
1960 1980 2000
0C
umul
ativ
e m
ass
bala
nce
(m
w.e
.)
1960 1980 2000
0
Basòdino
Findelen
Gries
Pizol
Rhone
Silvretta
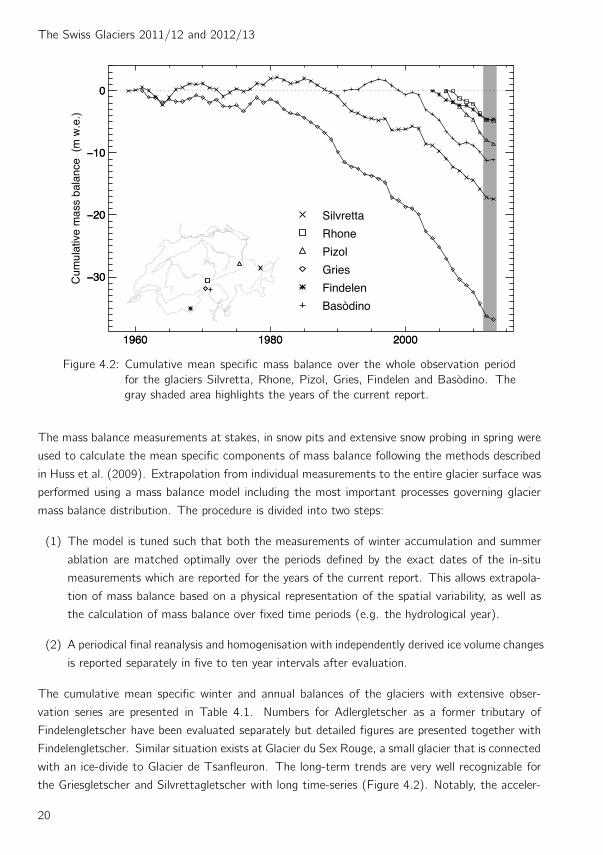
Figure 4.2: Cumulative mean specific mass balance over the whole observation period
for the glaciers Silvretta, Rhone, Pizol, Gries, Findelen and Basodino. The
gray shaded area highlights the years of the current report.
The mass balance measurements at stakes, in snow pits and extensive snow probing in spring were
used to calculate the mean specific components of mass balance following the methods described
in Huss et al. (2009). Extrapolation from individual measurements to the entire glacier surface was
performed using a mass balance model including the most important processes governing glacier
mass balance distribution. The procedure is divided into two steps:
(1) The model is tuned such that both the measurements of winter accumulation and summer
ablation are matched optimally over the periods defined by the exact dates of the in-situ
measurements which are reported for the years of the current report. This allows extrapola-
tion of mass balance based on a physical representation of the spatial variability, as well as
the calculation of mass balance over fixed time periods (e.g. the hydrological year).
(2) A periodical final reanalysis and homogenisation with independently derived ice volume changes
is reported separately in five to ten year intervals after evaluation.
The cumulative mean specific winter and annual balances of the glaciers with extensive obser-
vation series are presented in Table 4.1. Numbers for Adlergletscher as a former tributary of
Findelengletscher have been evaluated separately but detailed figures are presented together with
Findelengletscher. Similar situation exists at Glacier du Sex Rouge, a small glacier that is connected
with an ice-divide to Glacier de Tsanfleuron. The long-term trends are very well recognizable for
the Griesgletscher and Silvrettagletscher with long time-series (Figure 4.2). Notably, the acceler-
20
4. Mass Balance
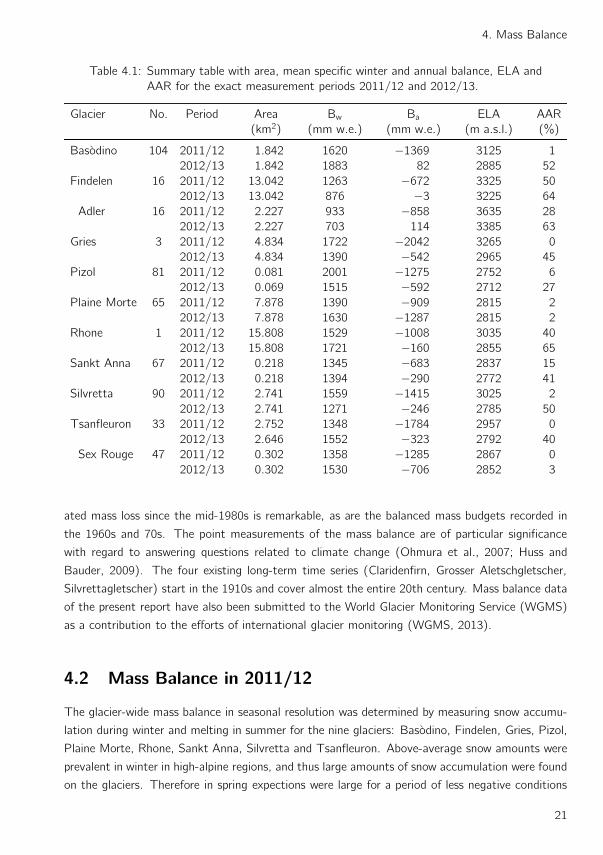
Table 4.1: Summary table with area, mean specific winter and annual balance, ELA and
AAR for the exact measurement periods 2011/12 and 2012/13.
Glacier No. Period Area Bw Ba ELA AAR
(km2) (mm w.e.) (mm w.e.) (m a.s.l.) (%)
Basodino 104 2011/12 1.842 1620 −1369 3125 1
2012/13 1.842 1883 82 2885 52
Findelen 16 2011/12 13.042 1263 −672 3325 50
2012/13 13.042 876 −3 3225 64
Adler 16 2011/12 2.227 933 −858 3635 28
2012/13 2.227 703 114 3385 63
Gries 3 2011/12 4.834 1722 −2042 3265 0
2012/13 4.834 1390 −542 2965 45
Pizol 81 2011/12 0.081 2001 −1275 2752 6
2012/13 0.069 1515 −592 2712 27
Plaine Morte 65 2011/12 7.878 1390 −909 2815 2
2012/13 7.878 1630 −1287 2815 2
Rhone 1 2011/12 15.808 1529 −1008 3035 40
2012/13 15.808 1721 −160 2855 65
Sankt Anna 67 2011/12 0.218 1345 −683 2837 15
2012/13 0.218 1394 −290 2772 41
Silvretta 90 2011/12 2.741 1559 −1415 3025 2
2012/13 2.741 1271 −246 2785 50
Tsanfleuron 33 2011/12 2.752 1348 −1784 2957 0
2012/13 2.646 1552 −323 2792 40
Sex Rouge 47 2011/12 0.302 1358 −1285 2867 0
2012/13 0.302 1530 −706 2852 3
ated mass loss since the mid-1980s is remarkable, as are the balanced mass budgets recorded in
the 1960s and 70s. The point measurements of the mass balance are of particular significance
with regard to answering questions related to climate change (Ohmura et al., 2007; Huss and
Bauder, 2009). The four existing long-term time series (Claridenfirn, Grosser Aletschgletscher,
Silvrettagletscher) start in the 1910s and cover almost the entire 20th century. Mass balance data
of the present report have also been submitted to the World Glacier Monitoring Service (WGMS)
as a contribution to the efforts of international glacier monitoring (WGMS, 2013).
4.2 Mass Balance in 2011/12
The glacier-wide mass balance in seasonal resolution was determined by measuring snow accumu-
lation during winter and melting in summer for the nine glaciers: Basodino, Findelen, Gries, Pizol,
Plaine Morte, Rhone, Sankt Anna, Silvretta and Tsanfleuron. Above-average snow amounts were
prevalent in winter in high-alpine regions, and thus large amounts of snow accumulation were found
on the glaciers. Therefore in spring expections were large for a period of less negative conditions
21
The Swiss Glaciers 2011/12 and 2012/13
for the glaciers. However, the months of June and July right at the start of summer were warm,
causing the snow cover to melt away quickly, and by the end of the season most of the glaciers
had melted out to a large extent. Thus, the mass balance for the 2011/12 measurement period
finished on the same level as the previous period 2010/11 and ranked third or fourth behind the
extremely negative periods of 2002/03 and 2005/06.
As in previous years with extremely negative mass balances, the result can be traced to the summer
which caused very strong melting. The values fluctuated from one glacier to another and no re-
gional pattern was discernible. The area averaged specific mass loss at Griesgletscher amounted to
over two meters, while the values at Findelengletscher and Sankt Annafirn were barely 0.7 meters.
Similar inter-annual fluctuations have been observed by point measurements at the Claridenfirn, the
Jungfraufirn of the Grosser Aletschgletscher and on the glaciers in the Mattmark and Mauvoisin
regions investigated for ice flow velocity (cf. Chapter 6).
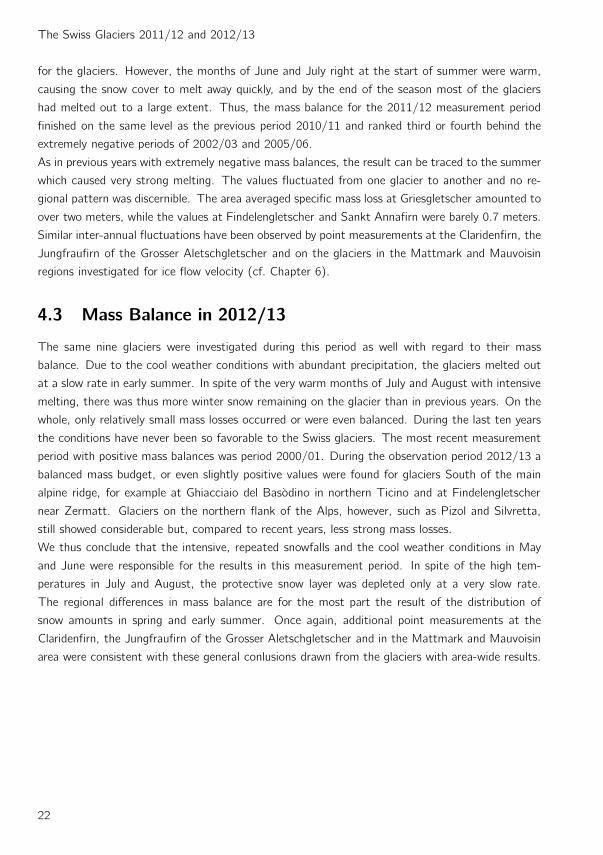
4.3 Mass Balance in 2012/13
The same nine glaciers were investigated during this period as well with regard to their mass
balance. Due to the cool weather conditions with abundant precipitation, the glaciers melted out
at a slow rate in early summer. In spite of the very warm months of July and August with intensive
melting, there was thus more winter snow remaining on the glacier than in previous years. On the
whole, only relatively small mass losses occurred or were even balanced. During the last ten years
the conditions have never been so favorable to the Swiss glaciers. The most recent measurement
period with positive mass balances was period 2000/01. During the observation period 2012/13 a
balanced mass budget, or even slightly positive values were found for glaciers South of the main
alpine ridge, for example at Ghiacciaio del Basodino in northern Ticino and at Findelengletscher
near Zermatt. Glaciers on the northern flank of the Alps, however, such as Pizol and Silvretta,
still showed considerable but, compared to recent years, less strong mass losses.
We thus conclude that the intensive, repeated snowfalls and the cool weather conditions in May
and June were responsible for the results in this measurement period. In spite of the high tem-
peratures in July and August, the protective snow layer was depleted only at a very slow rate.
The regional differences in mass balance are for the most part the result of the distribution of
snow amounts in spring and early summer. Once again, additional point measurements at the
Claridenfirn, the Jungfraufirn of the Grosser Aletschgletscher and in the Mattmark and Mauvoisin
area were consistent with these general conlusions drawn from the glaciers with area-wide results.
22
4. Mass Balance
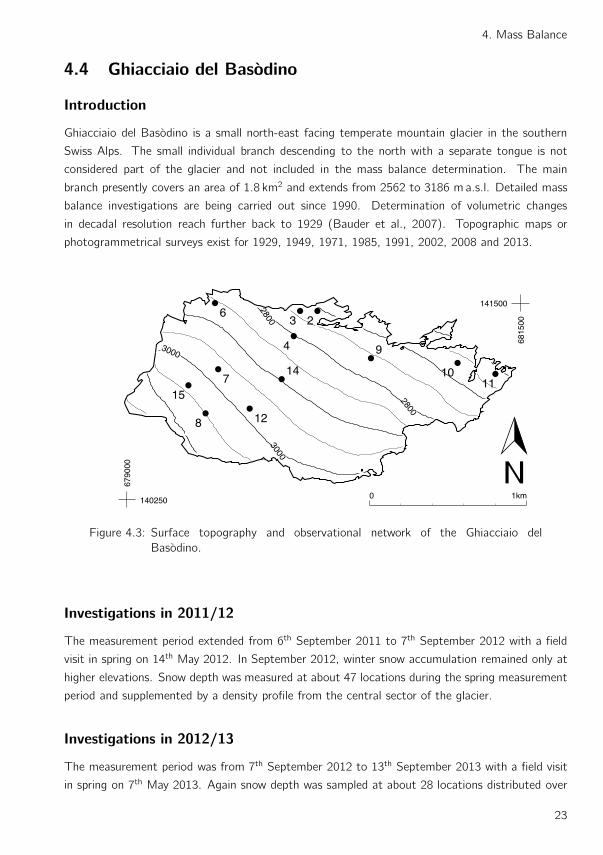
4.4 Ghiacciaio del Basodino
Introduction
Ghiacciaio del Basodino is a small north-east facing temperate mountain glacier in the southern
Swiss Alps. The small individual branch descending to the north with a separate tongue is not
considered part of the glacier and not included in the mass balance determination. The main
branch presently covers an area of 1.8 km2 and extends from 2562 to 3186 m a.s.l. Detailed mass
balance investigations are being carried out since 1990. Determination of volumetric changes
in decadal resolution reach further back to 1929 (Bauder et al., 2007). Topographic maps or
photogrammetrical surveys exist for 1929, 1949, 1971, 1985, 1991, 2002, 2008 and 2013.
3000
3000
2800
2800
23
4
6
7
8
9
1011
12
14
15
6790
00
140250
6815
00
141500
0 1km
Figure 4.3: Surface topography and observational network of the Ghiacciaio del
Basodino.
Investigations in 2011/12
The measurement period extended from 6th September 2011 to 7th September 2012 with a field
visit in spring on 14th May 2012. In September 2012, winter snow accumulation remained only at
higher elevations. Snow depth was measured at about 47 locations during the spring measurement
period and supplemented by a density profile from the central sector of the glacier.
Investigations in 2012/13
The measurement period was from 7th September 2012 to 13th September 2013 with a field visit
in spring on 7th May 2013. Again snow depth was sampled at about 28 locations distributed over
23
The Swiss Glaciers 2011/12 and 2012/13
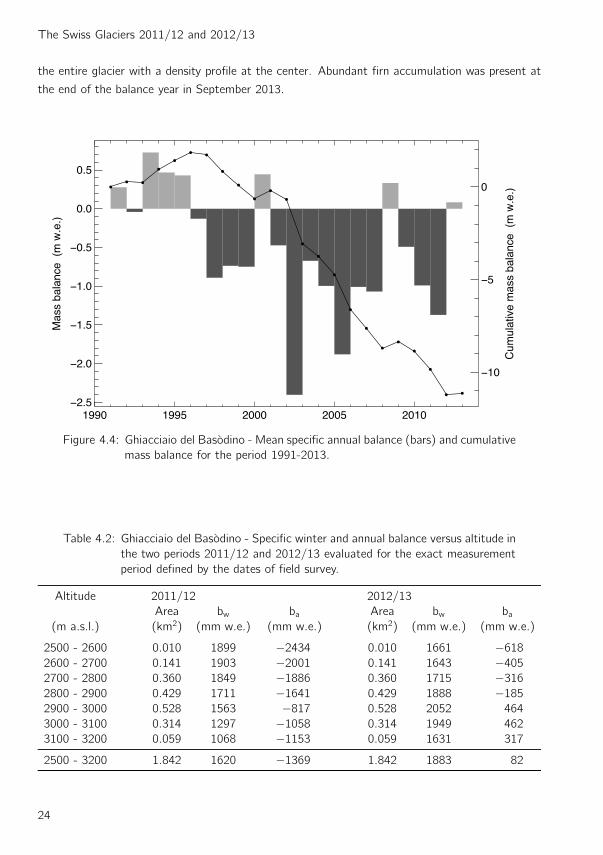
the entire glacier with a density profile at the center. Abundant firn accumulation was present at
the end of the balance year in September 2013.
1990 1995 2000 2005 2010
0.0
0.5
Mas
s ba
lanc
e (
m w
.e.)
0
Cum
ulat
ive
mas
s ba
lanc
e (
m w
.e.)
Figure 4.4: Ghiacciaio del Basodino - Mean specific annual balance (bars) and cumulative
mass balance for the period 1991-2013.
Table 4.2: Ghiacciaio del Basodino - Specific winter and annual balance versus altitude in
the two periods 2011/12 and 2012/13 evaluated for the exact measurement
period defined by the dates of field survey.
Altitude 2011/12 2012/13
Area bw ba Area bw ba(m a.s.l.) (km2) (mm w.e.) (mm w.e.) (km2) (mm w.e.) (mm w.e.)
2500 - 2600 0.010 1899 −2434 0.010 1661 −618
2600 - 2700 0.141 1903 −2001 0.141 1643 −405
2700 - 2800 0.360 1849 −1886 0.360 1715 −316
2800 - 2900 0.429 1711 −1641 0.429 1888 −185
2900 - 3000 0.528 1563 −817 0.528 2052 464
3000 - 3100 0.314 1297 −1058 0.314 1949 462
3100 - 3200 0.059 1068 −1153 0.059 1631 317
2500 - 3200 1.842 1620 −1369 1.842 1883 82
24
4. Mass Balance
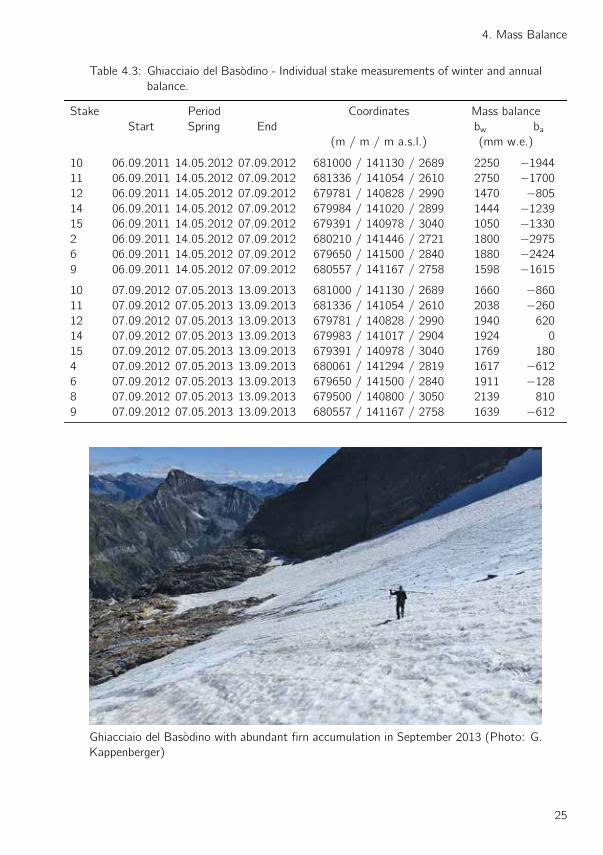
Table 4.3: Ghiacciaio del Basodino - Individual stake measurements of winter and annual
balance.
Stake Period Coordinates Mass balance
Start Spring End bw ba(m / m / m a.s.l.) (mm w.e.)
10 06.09.2011 14.05.2012 07.09.2012 681000 / 141130 / 2689 2250 −1944
11 06.09.2011 14.05.2012 07.09.2012 681336 / 141054 / 2610 2750 −1700
12 06.09.2011 14.05.2012 07.09.2012 679781 / 140828 / 2990 1470 −805
14 06.09.2011 14.05.2012 07.09.2012 679984 / 141020 / 2899 1444 −1239
15 06.09.2011 14.05.2012 07.09.2012 679391 / 140978 / 3040 1050 −1330
2 06.09.2011 14.05.2012 07.09.2012 680210 / 141446 / 2721 1800 −2975
6 06.09.2011 14.05.2012 07.09.2012 679650 / 141500 / 2840 1880 −2424
9 06.09.2011 14.05.2012 07.09.2012 680557 / 141167 / 2758 1598 −1615
10 07.09.2012 07.05.2013 13.09.2013 681000 / 141130 / 2689 1660 −860
11 07.09.2012 07.05.2013 13.09.2013 681336 / 141054 / 2610 2038 −260
12 07.09.2012 07.05.2013 13.09.2013 679781 / 140828 / 2990 1940 620
14 07.09.2012 07.05.2013 13.09.2013 679983 / 141017 / 2904 1924 0
15 07.09.2012 07.05.2013 13.09.2013 679391 / 140978 / 3040 1769 180
4 07.09.2012 07.05.2013 13.09.2013 680061 / 141294 / 2819 1617 −612
6 07.09.2012 07.05.2013 13.09.2013 679650 / 141500 / 2840 1911 −128
8 07.09.2012 07.05.2013 13.09.2013 679500 / 140800 / 3050 2139 810
9 07.09.2012 07.05.2013 13.09.2013 680557 / 141167 / 2758 1639 −612
Ghiacciaio del Basodino with abundant firn accumulation in September 2013 (Photo: G.
Kappenberger)
25
The Swiss Glaciers 2011/12 and 2012/13
0 2Specific balance (m w.e.)
2600
2800
3000
3200
Alti
tude
(m
a.s
.l.)
2011/12
0.0 0.5 1.0 1.5Volumetric balance (106 m3 w.e.)
0 2Specific balance (m w.e.)
2600
2800
3000
3200
Alti
tude
(m
a.s
.l.)
2012/13
0.0 0.5 1.0 1.5Volumetric balance (106 m3 w.e.)
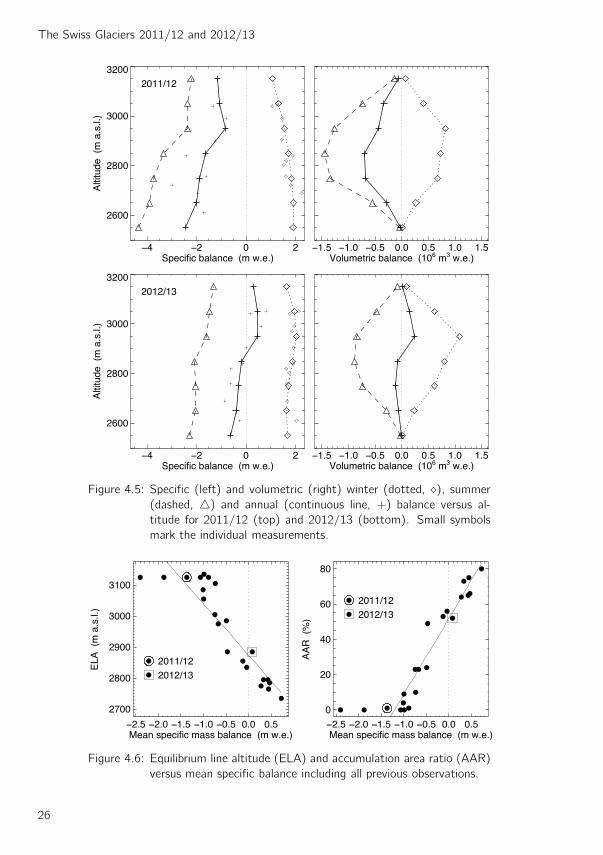
Figure 4.5: Specific (left) and volumetric (right) winter (dotted, ⋄), summer
(dashed, △) and annual (continuous line, +) balance versus al-
titude for 2011/12 (top) and 2012/13 (bottom). Small symbols
mark the individual measurements.
0.0 0.5Mean specific mass balance (m w.e.)
2700
2800
2900
3000
3100
ELA
(m
a.s
.l.)
2011/122012/13
0.0 0.5Mean specific mass balance (m w.e.)
0
20
40
60
80
AA
R (
%)
2011/122012/13
Figure 4.6: Equilibrium line altitude (ELA) and accumulation area ratio (AAR)
versus mean specific balance including all previous observations.
26
4. Mass Balance
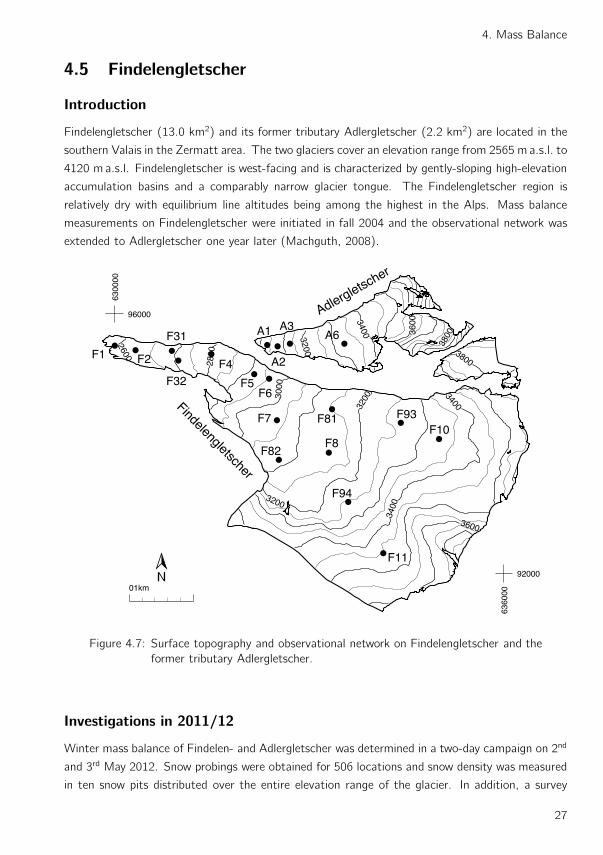
4.5 Findelengletscher
Introduction
Findelengletscher (13.0 km2) and its former tributary Adlergletscher (2.2 km2) are located in the
southern Valais in the Zermatt area. The two glaciers cover an elevation range from 2565 m a.s.l. to
4120 m a.s.l. Findelengletscher is west-facing and is characterized by gently-sloping high-elevation
accumulation basins and a comparably narrow glacier tongue. The Findelengletscher region is
relatively dry with equilibrium line altitudes being among the highest in the Alps. Mass balance
measurements on Findelengletscher were initiated in fall 2004 and the observational network was
extended to Adlergletscher one year later (Machguth, 2008).
3400
3400
3600
3200
3200
3800
380036
0034003200
2800
2600
3000
F1 F2
F31
F32F4
F5F6
F7
F8
F81
F82
F93
F94
F10
F11
A1
A2
A3A6
6300
00
96000
6360
00
92000
01km
Adlergletscher
Findelengletscher
Figure 4.7: Surface topography and observational network on Findelengletscher and the
former tributary Adlergletscher.
Investigations in 2011/12
Winter mass balance of Findelen- and Adlergletscher was determined in a two-day campaign on 2nd
and 3rd May 2012. Snow probings were obtained for 506 locations and snow density was measured
in ten snow pits distributed over the entire elevation range of the glacier. In addition, a survey
27
The Swiss Glaciers 2011/12 and 2012/13
with a helicopter-borne ground penetrating radar system to record snow depth distribution was
performed covering both Findelen- and Adlergletscher on a 500m grid. The profiles had a total
length of 49 km (Sold et al., 2015). Three firn cores to a depth of about 10-12m were acquired by
the Paul Scherrer Institute for investigating firn layer characteristics (Sold et al., 2015). All mass
balance stakes were visited and re-installed on 2nd October 2012. The annual mass balance was
determined for 15 locations on Findelen-, and four on Adlergletscher. Snow density was measured
in two snow pits. The equilibrium line was at about 3300 m a.s.l. on Findelen-, and 3450 m a.s.l. on
Adlergletscher.
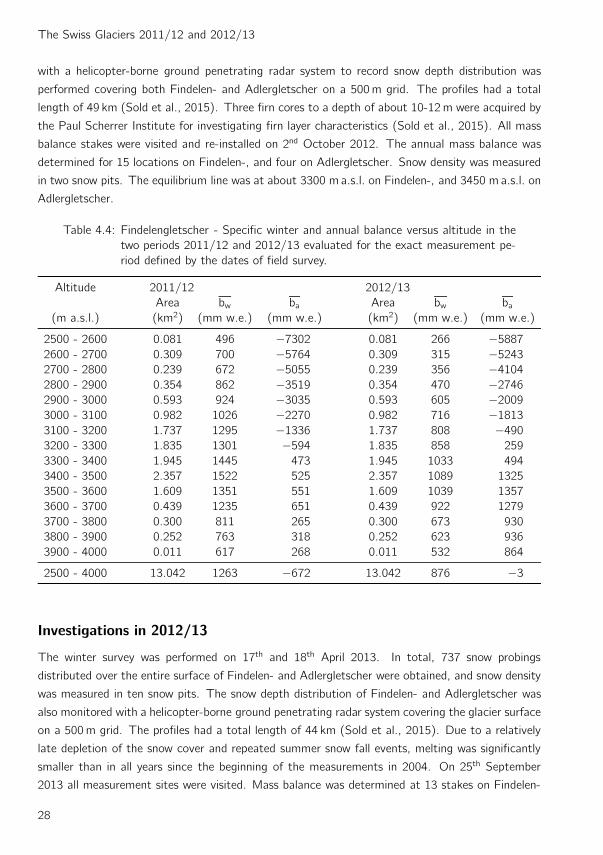
Table 4.4: Findelengletscher - Specific winter and annual balance versus altitude in the
two periods 2011/12 and 2012/13 evaluated for the exact measurement pe-
riod defined by the dates of field survey.
Altitude 2011/12 2012/13
Area bw ba Area bw ba(m a.s.l.) (km2) (mm w.e.) (mm w.e.) (km2) (mm w.e.) (mm w.e.)
2500 - 2600 0.081 496 −7302 0.081 266 −5887
2600 - 2700 0.309 700 −5764 0.309 315 −5243
2700 - 2800 0.239 672 −5055 0.239 356 −4104
2800 - 2900 0.354 862 −3519 0.354 470 −2746
2900 - 3000 0.593 924 −3035 0.593 605 −2009
3000 - 3100 0.982 1026 −2270 0.982 716 −1813
3100 - 3200 1.737 1295 −1336 1.737 808 −490
3200 - 3300 1.835 1301 −594 1.835 858 259
3300 - 3400 1.945 1445 473 1.945 1033 494
3400 - 3500 2.357 1522 525 2.357 1089 1325
3500 - 3600 1.609 1351 551 1.609 1039 1357
3600 - 3700 0.439 1235 651 0.439 922 1279
3700 - 3800 0.300 811 265 0.300 673 930
3800 - 3900 0.252 763 318 0.252 623 936
3900 - 4000 0.011 617 268 0.011 532 864
2500 - 4000 13.042 1263 −672 13.042 876 −3
Investigations in 2012/13
The winter survey was performed on 17th and 18th April 2013. In total, 737 snow probings
distributed over the entire surface of Findelen- and Adlergletscher were obtained, and snow density
was measured in ten snow pits. The snow depth distribution of Findelen- and Adlergletscher was
also monitored with a helicopter-borne ground penetrating radar system covering the glacier surface
on a 500m grid. The profiles had a total length of 44 km (Sold et al., 2015). Due to a relatively
late depletion of the snow cover and repeated summer snow fall events, melting was significantly
smaller than in all years since the beginning of the measurements in 2004. On 25th September
2013 all measurement sites were visited. Mass balance was determined at 13 stakes on Findelen-
28
4. Mass Balance
and at four stakes on Adlergletscher. Firn density was measured in one snow pit. Due to more than
four meters of winter snow remaining at the end of the ablation season, the second accumulation
stake could not be re-located.
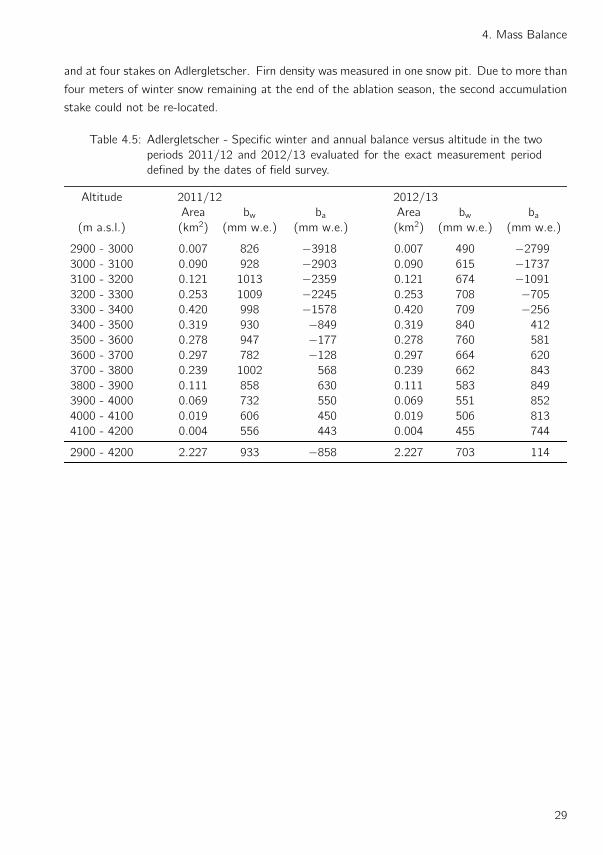
Table 4.5: Adlergletscher - Specific winter and annual balance versus altitude in the two
periods 2011/12 and 2012/13 evaluated for the exact measurement period
defined by the dates of field survey.
Altitude 2011/12 2012/13
Area bw ba Area bw ba(m a.s.l.) (km2) (mm w.e.) (mm w.e.) (km2) (mm w.e.) (mm w.e.)
2900 - 3000 0.007 826 −3918 0.007 490 −2799
3000 - 3100 0.090 928 −2903 0.090 615 −1737
3100 - 3200 0.121 1013 −2359 0.121 674 −1091
3200 - 3300 0.253 1009 −2245 0.253 708 −705
3300 - 3400 0.420 998 −1578 0.420 709 −256
3400 - 3500 0.319 930 −849 0.319 840 412
3500 - 3600 0.278 947 −177 0.278 760 581
3600 - 3700 0.297 782 −128 0.297 664 620
3700 - 3800 0.239 1002 568 0.239 662 843
3800 - 3900 0.111 858 630 0.111 583 849
3900 - 4000 0.069 732 550 0.069 551 852
4000 - 4100 0.019 606 450 0.019 506 813
4100 - 4200 0.004 556 443 0.004 455 744
2900 - 4200 2.227 933 −858 2.227 703 114
29
The Swiss Glaciers 2011/12 and 2012/13
0Specific balance (m w.e.)
2500
3000
3500
4000
Alti
tude
(m
a.s
.l.)
2011/12
0 2 4Volumetric balance (106 m3 w.e.)
0Specific balance (m w.e.)
2500
3000
3500
4000
Alti
tude
(m
a.s
.l.)
2012/13
0 2 4Volumetric balance (106 m3 w.e.)
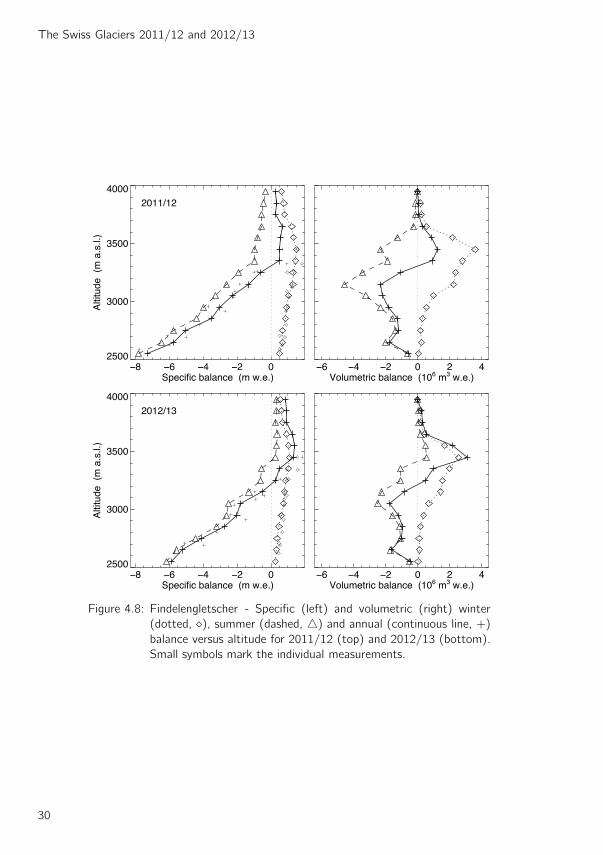
Figure 4.8: Findelengletscher - Specific (left) and volumetric (right) winter
(dotted, ⋄), summer (dashed, △) and annual (continuous line, +)
balance versus altitude for 2011/12 (top) and 2012/13 (bottom).
Small symbols mark the individual measurements.
30
4. Mass Balance
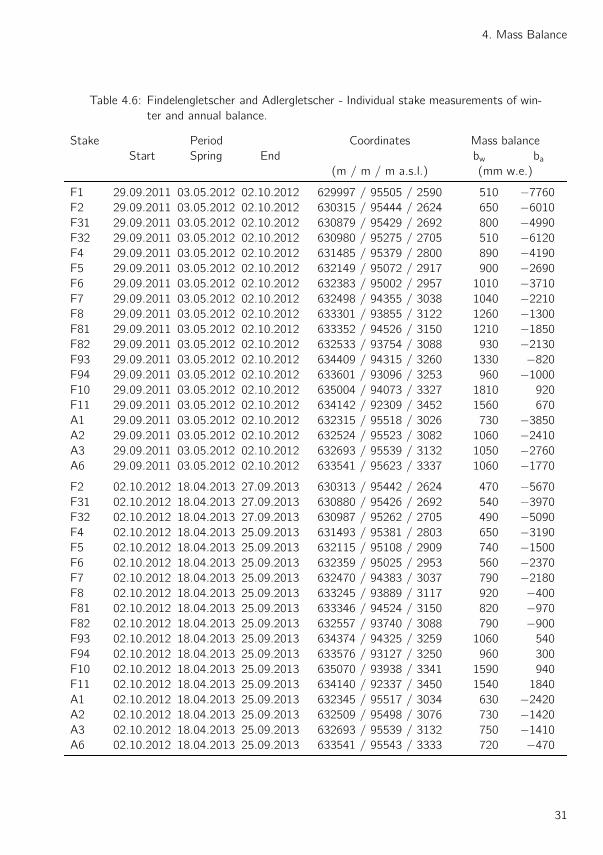
Table 4.6: Findelengletscher and Adlergletscher - Individual stake measurements of win-
ter and annual balance.
Stake Period Coordinates Mass balance
Start Spring End bw ba(m / m / m a.s.l.) (mm w.e.)
F1 29.09.2011 03.05.2012 02.10.2012 629997 / 95505 / 2590 510 −7760
F2 29.09.2011 03.05.2012 02.10.2012 630315 / 95444 / 2624 650 −6010
F31 29.09.2011 03.05.2012 02.10.2012 630879 / 95429 / 2692 800 −4990
F32 29.09.2011 03.05.2012 02.10.2012 630980 / 95275 / 2705 510 −6120
F4 29.09.2011 03.05.2012 02.10.2012 631485 / 95379 / 2800 890 −4190
F5 29.09.2011 03.05.2012 02.10.2012 632149 / 95072 / 2917 900 −2690
F6 29.09.2011 03.05.2012 02.10.2012 632383 / 95002 / 2957 1010 −3710
F7 29.09.2011 03.05.2012 02.10.2012 632498 / 94355 / 3038 1040 −2210
F8 29.09.2011 03.05.2012 02.10.2012 633301 / 93855 / 3122 1260 −1300
F81 29.09.2011 03.05.2012 02.10.2012 633352 / 94526 / 3150 1210 −1850
F82 29.09.2011 03.05.2012 02.10.2012 632533 / 93754 / 3088 930 −2130
F93 29.09.2011 03.05.2012 02.10.2012 634409 / 94315 / 3260 1330 −820
F94 29.09.2011 03.05.2012 02.10.2012 633601 / 93096 / 3253 960 −1000
F10 29.09.2011 03.05.2012 02.10.2012 635004 / 94073 / 3327 1810 920
F11 29.09.2011 03.05.2012 02.10.2012 634142 / 92309 / 3452 1560 670
A1 29.09.2011 03.05.2012 02.10.2012 632315 / 95518 / 3026 730 −3850
A2 29.09.2011 03.05.2012 02.10.2012 632524 / 95523 / 3082 1060 −2410
A3 29.09.2011 03.05.2012 02.10.2012 632693 / 95539 / 3132 1050 −2760
A6 29.09.2011 03.05.2012 02.10.2012 633541 / 95623 / 3337 1060 −1770
F2 02.10.2012 18.04.2013 27.09.2013 630313 / 95442 / 2624 470 −5670
F31 02.10.2012 18.04.2013 27.09.2013 630880 / 95426 / 2692 540 −3970
F32 02.10.2012 18.04.2013 27.09.2013 630987 / 95262 / 2705 490 −5090
F4 02.10.2012 18.04.2013 25.09.2013 631493 / 95381 / 2803 650 −3190
F5 02.10.2012 18.04.2013 25.09.2013 632115 / 95108 / 2909 740 −1500
F6 02.10.2012 18.04.2013 25.09.2013 632359 / 95025 / 2953 560 −2370
F7 02.10.2012 18.04.2013 25.09.2013 632470 / 94383 / 3037 790 −2180
F8 02.10.2012 18.04.2013 25.09.2013 633245 / 93889 / 3117 920 −400
F81 02.10.2012 18.04.2013 25.09.2013 633346 / 94524 / 3150 820 −970
F82 02.10.2012 18.04.2013 25.09.2013 632557 / 93740 / 3088 790 −900
F93 02.10.2012 18.04.2013 25.09.2013 634374 / 94325 / 3259 1060 540
F94 02.10.2012 18.04.2013 25.09.2013 633576 / 93127 / 3250 960 300
F10 02.10.2012 18.04.2013 25.09.2013 635070 / 93938 / 3341 1590 940
F11 02.10.2012 18.04.2013 25.09.2013 634140 / 92337 / 3450 1540 1840
A1 02.10.2012 18.04.2013 25.09.2013 632345 / 95517 / 3034 630 −2420
A2 02.10.2012 18.04.2013 25.09.2013 632509 / 95498 / 3076 730 −1420
A3 02.10.2012 18.04.2013 25.09.2013 632693 / 95539 / 3132 750 −1410
A6 02.10.2012 18.04.2013 25.09.2013 633541 / 95543 / 3333 720 −470
31
The Swiss Glaciers 2011/12 and 2012/13
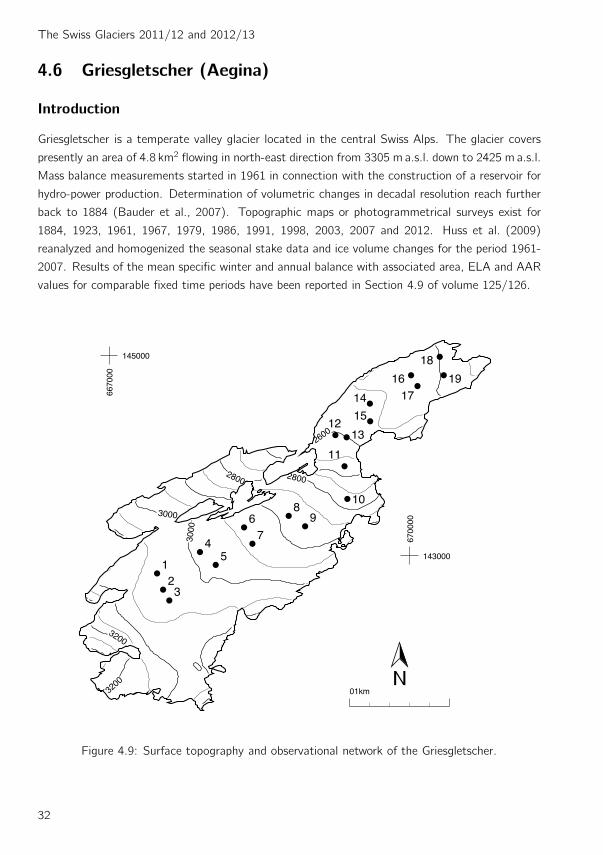
4.6 Griesgletscher (Aegina)
Introduction
Griesgletscher is a temperate valley glacier located in the central Swiss Alps. The glacier covers
presently an area of 4.8 km2 flowing in north-east direction from 3305 m a.s.l. down to 2425 m a.s.l.
Mass balance measurements started in 1961 in connection with the construction of a reservoir for
hydro-power production. Determination of volumetric changes in decadal resolution reach further
back to 1884 (Bauder et al., 2007). Topographic maps or photogrammetrical surveys exist for
1884, 1923, 1961, 1967, 1979, 1986, 1991, 1998, 2003, 2007 and 2012. Huss et al. (2009)
reanalyzed and homogenized the seasonal stake data and ice volume changes for the period 1961-
2007. Results of the mean specific winter and annual balance with associated area, ELA and AAR
values for comparable fixed time periods have been reported in Section 4.9 of volume 125/126.
3200
3200
2800
3000
3000
2800
2600
123
45
67
89
10
11
1213
14
15
1617
18
19
6670
00
145000
6700
00
143000
01km
Figure 4.9: Surface topography and observational network of the Griesgletscher.
32
4. Mass Balance
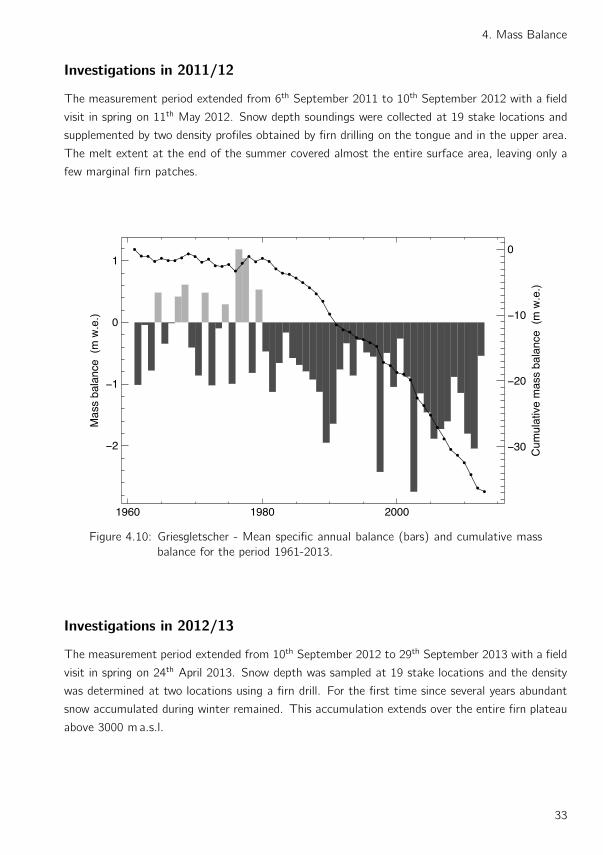
Investigations in 2011/12
The measurement period extended from 6th September 2011 to 10th September 2012 with a field
visit in spring on 11th May 2012. Snow depth soundings were collected at 19 stake locations and
supplemented by two density profiles obtained by firn drilling on the tongue and in the upper area.
The melt extent at the end of the summer covered almost the entire surface area, leaving only a
few marginal firn patches.
1960 1980 2000
0
1
Mas
s ba
lanc
e (
m w
.e.)
0
Cum
ulat
ive
mas
s ba
lanc
e (
m w
.e.)
Figure 4.10: Griesgletscher - Mean specific annual balance (bars) and cumulative mass
balance for the period 1961-2013.
Investigations in 2012/13
The measurement period extended from 10th September 2012 to 29th September 2013 with a field
visit in spring on 24th April 2013. Snow depth was sampled at 19 stake locations and the density
was determined at two locations using a firn drill. For the first time since several years abundant
snow accumulated during winter remained. This accumulation extends over the entire firn plateau
above 3000 m a.s.l.
33
The Swiss Glaciers 2011/12 and 2012/13
Table 4.7: Griesgletscher - Specific winter and annual balance versus altitude in the two
periods 2011/12 and 2012/13 evaluated for the exact measurement period
defined by the dates of field survey.
Altitude 2011/12 2012/13
Area bw ba Area bw ba(m a.s.l.) (km2) (mm w.e.) (mm w.e.) (km2) (mm w.e.) (mm w.e.)
2400 - 2500 0.164 1259 −4403 0.164 918 −3446
2500 - 2600 0.731 1256 −3788 0.731 947 −2776
2600 - 2700 0.237 1534 −2832 0.237 1233 −1626
2700 - 2800 0.363 1733 −1983 0.363 1332 −776
2800 - 2900 0.636 1820 −1778 0.636 1406 −487
2900 - 3000 1.005 1819 −1853 1.005 1491 −82
3000 - 3100 1.421 1917 −1294 1.421 1607 524
3100 - 3200 0.206 1950 −491 0.206 1656 1113
3200 - 3300 0.071 1355 −809 0.071 1172 754
3300 - 3400 0.001 871 −700 0.001 754 523
2400 - 3400 4.834 1722 −2042 4.834 1390 −542
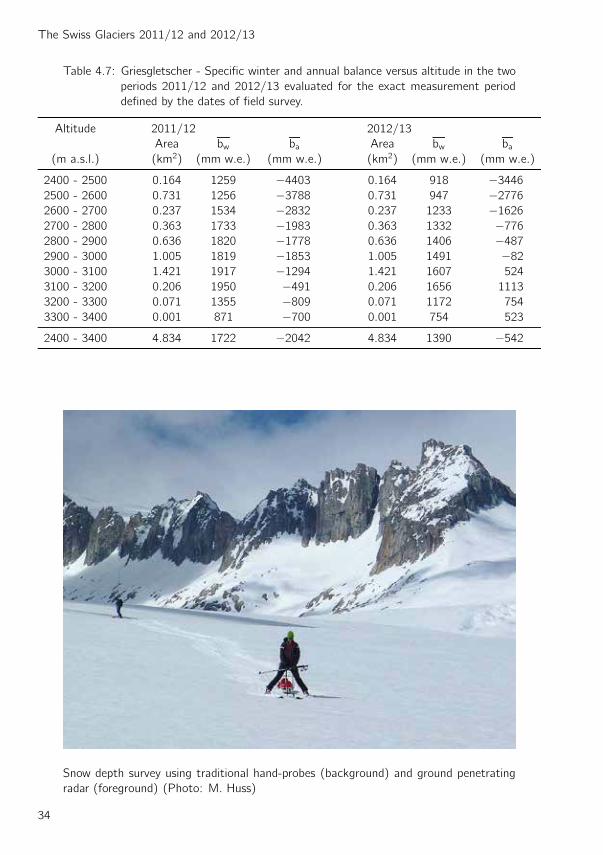
Snow depth survey using traditional hand-probes (background) and ground penetrating
radar (foreground) (Photo: M. Huss)
34
4. Mass Balance
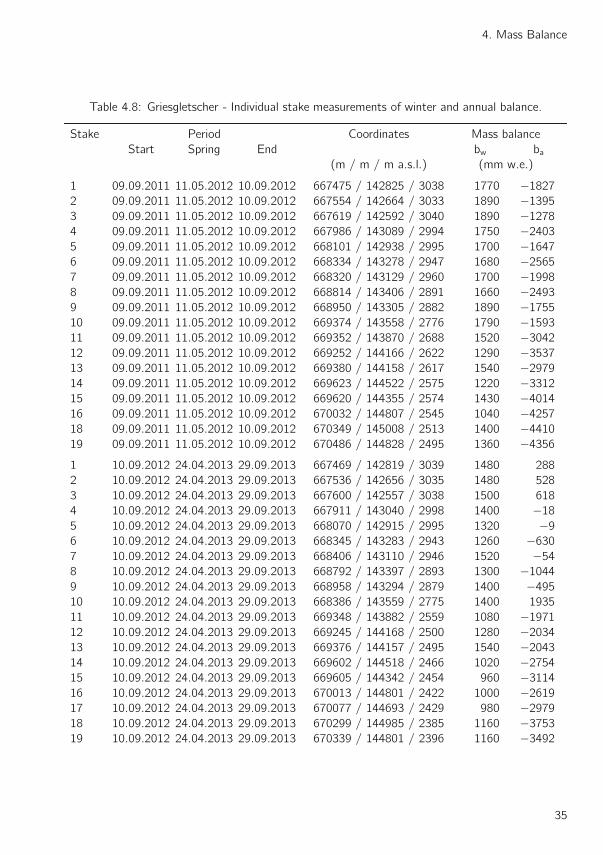
Table 4.8: Griesgletscher - Individual stake measurements of winter and annual balance.
Stake Period Coordinates Mass balance
Start Spring End bw ba(m / m / m a.s.l.) (mm w.e.)
1 09.09.2011 11.05.2012 10.09.2012 667475 / 142825 / 3038 1770 −1827
2 09.09.2011 11.05.2012 10.09.2012 667554 / 142664 / 3033 1890 −1395
3 09.09.2011 11.05.2012 10.09.2012 667619 / 142592 / 3040 1890 −1278
4 09.09.2011 11.05.2012 10.09.2012 667986 / 143089 / 2994 1750 −2403
5 09.09.2011 11.05.2012 10.09.2012 668101 / 142938 / 2995 1700 −1647
6 09.09.2011 11.05.2012 10.09.2012 668334 / 143278 / 2947 1680 −2565
7 09.09.2011 11.05.2012 10.09.2012 668320 / 143129 / 2960 1700 −1998
8 09.09.2011 11.05.2012 10.09.2012 668814 / 143406 / 2891 1660 −2493
9 09.09.2011 11.05.2012 10.09.2012 668950 / 143305 / 2882 1890 −1755
10 09.09.2011 11.05.2012 10.09.2012 669374 / 143558 / 2776 1790 −1593
11 09.09.2011 11.05.2012 10.09.2012 669352 / 143870 / 2688 1520 −3042
12 09.09.2011 11.05.2012 10.09.2012 669252 / 144166 / 2622 1290 −3537
13 09.09.2011 11.05.2012 10.09.2012 669380 / 144158 / 2617 1540 −2979
14 09.09.2011 11.05.2012 10.09.2012 669623 / 144522 / 2575 1220 −3312
15 09.09.2011 11.05.2012 10.09.2012 669620 / 144355 / 2574 1430 −4014
16 09.09.2011 11.05.2012 10.09.2012 670032 / 144807 / 2545 1040 −4257
18 09.09.2011 11.05.2012 10.09.2012 670349 / 145008 / 2513 1400 −4410
19 09.09.2011 11.05.2012 10.09.2012 670486 / 144828 / 2495 1360 −4356
1 10.09.2012 24.04.2013 29.09.2013 667469 / 142819 / 3039 1480 288
2 10.09.2012 24.04.2013 29.09.2013 667536 / 142656 / 3035 1480 528
3 10.09.2012 24.04.2013 29.09.2013 667600 / 142557 / 3038 1500 618
4 10.09.2012 24.04.2013 29.09.2013 667911 / 143040 / 2998 1400 −18
5 10.09.2012 24.04.2013 29.09.2013 668070 / 142915 / 2995 1320 −9
6 10.09.2012 24.04.2013 29.09.2013 668345 / 143283 / 2943 1260 −630
7 10.09.2012 24.04.2013 29.09.2013 668406 / 143110 / 2946 1520 −54
8 10.09.2012 24.04.2013 29.09.2013 668792 / 143397 / 2893 1300 −1044
9 10.09.2012 24.04.2013 29.09.2013 668958 / 143294 / 2879 1400 −495
10 10.09.2012 24.04.2013 29.09.2013 668386 / 143559 / 2775 1400 1935
11 10.09.2012 24.04.2013 29.09.2013 669348 / 143882 / 2559 1080 −1971
12 10.09.2012 24.04.2013 29.09.2013 669245 / 144168 / 2500 1280 −2034
13 10.09.2012 24.04.2013 29.09.2013 669376 / 144157 / 2495 1540 −2043
14 10.09.2012 24.04.2013 29.09.2013 669602 / 144518 / 2466 1020 −2754
15 10.09.2012 24.04.2013 29.09.2013 669605 / 144342 / 2454 960 −3114
16 10.09.2012 24.04.2013 29.09.2013 670013 / 144801 / 2422 1000 −2619
17 10.09.2012 24.04.2013 29.09.2013 670077 / 144693 / 2429 980 −2979
18 10.09.2012 24.04.2013 29.09.2013 670299 / 144985 / 2385 1160 −3753
19 10.09.2012 24.04.2013 29.09.2013 670339 / 144801 / 2396 1160 −3492
35
The Swiss Glaciers 2011/12 and 2012/13
0 2Specific balance (m w.e.)
2400
2600
2800
3000
3200
3400
Alti
tude
(m
a.s
.l.)
2011/12
0 2 4Volumetric balance (106 m3 w.e.)
0 2Specific balance (m w.e.)
2400
2600
2800
3000
3200
3400
Alti
tude
(m
a.s
.l.)
2012/13
0 2 4Volumetric balance (106 m3 w.e.)
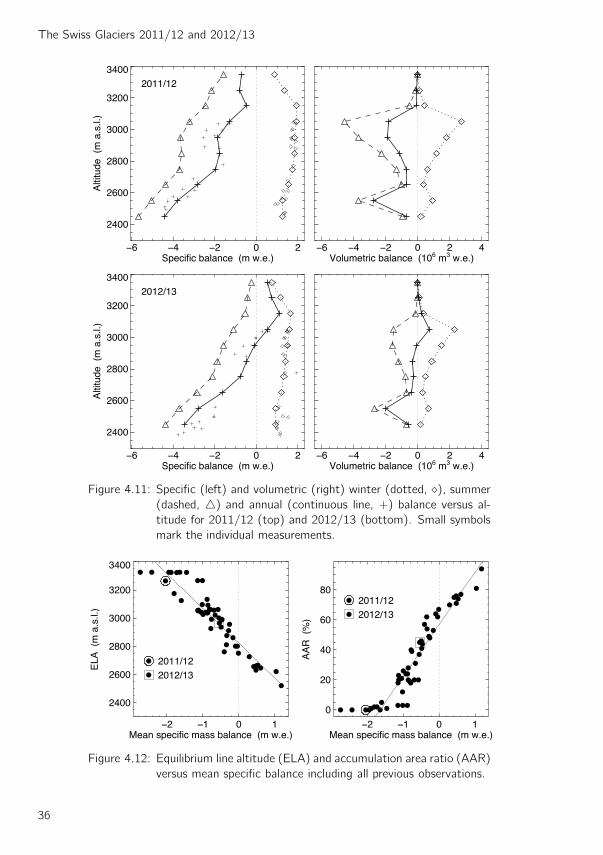
Figure 4.11: Specific (left) and volumetric (right) winter (dotted, ⋄), summer
(dashed, △) and annual (continuous line, +) balance versus al-
titude for 2011/12 (top) and 2012/13 (bottom). Small symbols
mark the individual measurements.
0 1Mean specific mass balance (m w.e.)
2400
2600
2800
3000
3200
3400
ELA
(m
a.s
.l.)
2011/122012/13
0 1Mean specific mass balance (m w.e.)
0
20
40
60
80
AA
R (
%)
2011/122012/13
Figure 4.12: Equilibrium line altitude (ELA) and accumulation area ratio (AAR)
versus mean specific balance including all previous observations.
36
4. Mass Balance
4.7 Pizolgletscher
Introduction
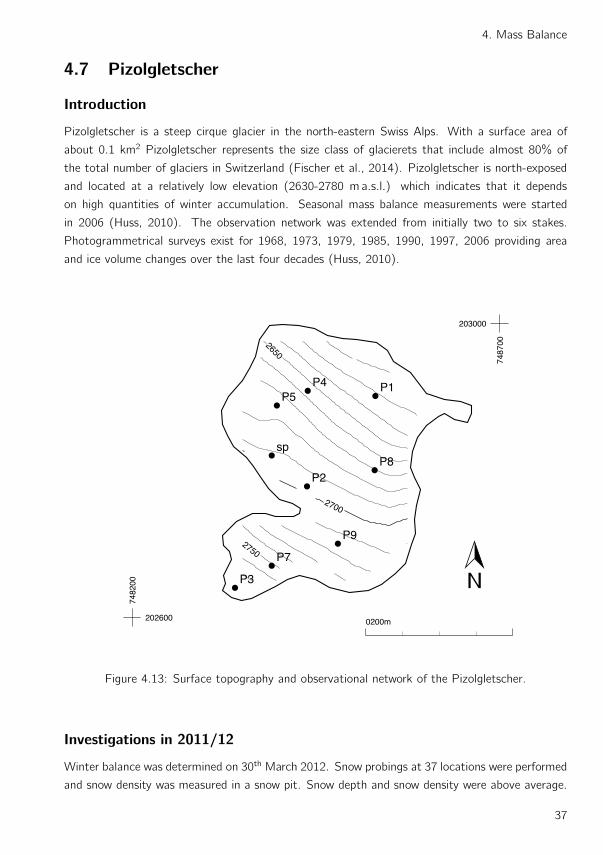
Pizolgletscher is a steep cirque glacier in the north-eastern Swiss Alps. With a surface area of
about 0.1 km2 Pizolgletscher represents the size class of glacierets that include almost 80% of
the total number of glaciers in Switzerland (Fischer et al., 2014). Pizolgletscher is north-exposed
and located at a relatively low elevation (2630-2780 m a.s.l.) which indicates that it depends
on high quantities of winter accumulation. Seasonal mass balance measurements were started
in 2006 (Huss, 2010). The observation network was extended from initially two to six stakes.
Photogrammetrical surveys exist for 1968, 1973, 1979, 1985, 1990, 1997, 2006 providing area
and ice volume changes over the last four decades (Huss, 2010).
2750
2700
2650
P1
P2
P3
P4P5
P7
P8
P9
sp
7482
00
202600
7487
00
203000
0200m
Figure 4.13: Surface topography and observational network of the Pizolgletscher.
Investigations in 2011/12
Winter balance was determined on 30th March 2012. Snow probings at 37 locations were performed
and snow density was measured in a snow pit. Snow depth and snow density were above average.
37
The Swiss Glaciers 2011/12 and 2012/13
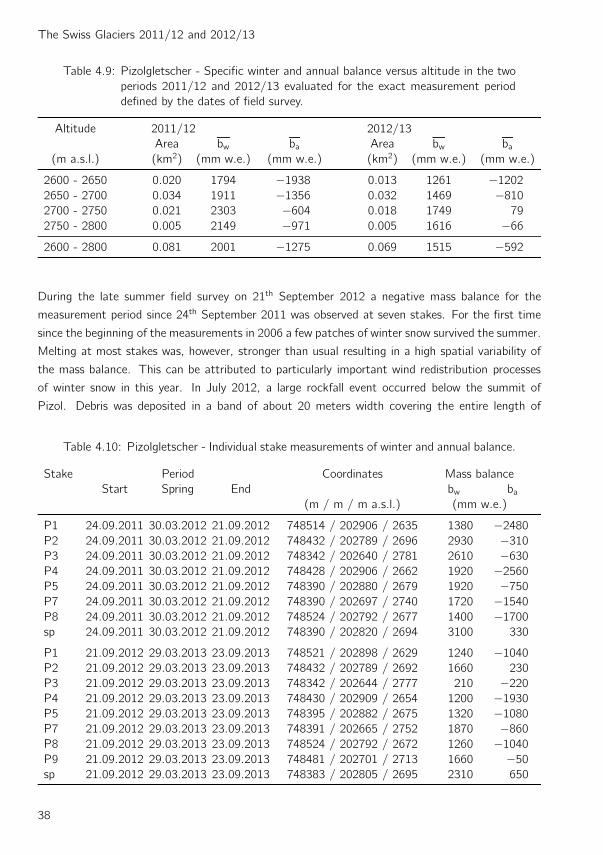
Table 4.9: Pizolgletscher - Specific winter and annual balance versus altitude in the two
periods 2011/12 and 2012/13 evaluated for the exact measurement period
defined by the dates of field survey.
Altitude 2011/12 2012/13
Area bw ba Area bw ba(m a.s.l.) (km2) (mm w.e.) (mm w.e.) (km2) (mm w.e.) (mm w.e.)
2600 - 2650 0.020 1794 −1938 0.013 1261 −1202
2650 - 2700 0.034 1911 −1356 0.032 1469 −810
2700 - 2750 0.021 2303 −604 0.018 1749 79
2750 - 2800 0.005 2149 −971 0.005 1616 −66
2600 - 2800 0.081 2001 −1275 0.069 1515 −592
During the late summer field survey on 21th September 2012 a negative mass balance for the
measurement period since 24th September 2011 was observed at seven stakes. For the first time
since the beginning of the measurements in 2006 a few patches of winter snow survived the summer.
Melting at most stakes was, however, stronger than usual resulting in a high spatial variability of
the mass balance. This can be attributed to particularly important wind redistribution processes
of winter snow in this year. In July 2012, a large rockfall event occurred below the summit of
Pizol. Debris was deposited in a band of about 20 meters width covering the entire length of
Table 4.10: Pizolgletscher - Individual stake measurements of winter and annual balance.
Stake Period Coordinates Mass balance
Start Spring End bw ba(m / m / m a.s.l.) (mm w.e.)
P1 24.09.2011 30.03.2012 21.09.2012 748514 / 202906 / 2635 1380 −2480
P2 24.09.2011 30.03.2012 21.09.2012 748432 / 202789 / 2696 2930 −310
P3 24.09.2011 30.03.2012 21.09.2012 748342 / 202640 / 2781 2610 −630
P4 24.09.2011 30.03.2012 21.09.2012 748428 / 202906 / 2662 1920 −2560
P5 24.09.2011 30.03.2012 21.09.2012 748390 / 202880 / 2679 1920 −750
P7 24.09.2011 30.03.2012 21.09.2012 748390 / 202697 / 2740 1720 −1540
P8 24.09.2011 30.03.2012 21.09.2012 748524 / 202792 / 2677 1400 −1700
sp 24.09.2011 30.03.2012 21.09.2012 748390 / 202820 / 2694 3100 330
P1 21.09.2012 29.03.2013 23.09.2013 748521 / 202898 / 2629 1240 −1040
P2 21.09.2012 29.03.2013 23.09.2013 748432 / 202789 / 2692 1660 230
P3 21.09.2012 29.03.2013 23.09.2013 748342 / 202644 / 2777 210 −220
P4 21.09.2012 29.03.2013 23.09.2013 748430 / 202909 / 2654 1200 −1930
P5 21.09.2012 29.03.2013 23.09.2013 748395 / 202882 / 2675 1320 −1080
P7 21.09.2012 29.03.2013 23.09.2013 748391 / 202665 / 2752 1870 −860
P8 21.09.2012 29.03.2013 23.09.2013 748524 / 202792 / 2672 1260 −1040
P9 21.09.2012 29.03.2013 23.09.2013 748481 / 202701 / 2713 1660 −50
sp 21.09.2012 29.03.2013 23.09.2013 748383 / 202805 / 2695 2310 650
38
4. Mass Balance
Pizolgletscher, locally affecting mass balance.
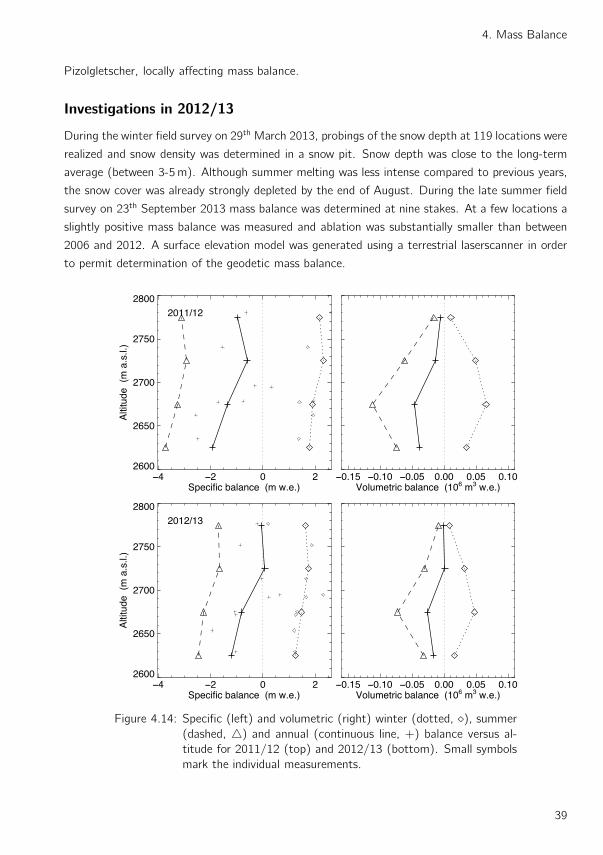
Investigations in 2012/13
During the winter field survey on 29th March 2013, probings of the snow depth at 119 locations were
realized and snow density was determined in a snow pit. Snow depth was close to the long-term
average (between 3-5m). Although summer melting was less intense compared to previous years,
the snow cover was already strongly depleted by the end of August. During the late summer field
survey on 23th September 2013 mass balance was determined at nine stakes. At a few locations a
slightly positive mass balance was measured and ablation was substantially smaller than between
2006 and 2012. A surface elevation model was generated using a terrestrial laserscanner in order
to permit determination of the geodetic mass balance.
0 2Specific balance (m w.e.)
2600
2650
2700
2750
2800
Alti
tude
(m
a.s
.l.)
2011/12
0.00 0.05 0.10Volumetric balance (106 m3 w.e.)
0 2Specific balance (m w.e.)
2600
2650
2700
2750
2800
Alti
tude
(m
a.s
.l.)
2012/13
0.00 0.05 0.10Volumetric balance (106 m3 w.e.)
Figure 4.14: Specific (left) and volumetric (right) winter (dotted, ⋄), summer
(dashed, △) and annual (continuous line, +) balance versus al-
titude for 2011/12 (top) and 2012/13 (bottom). Small symbols
mark the individual measurements.
39
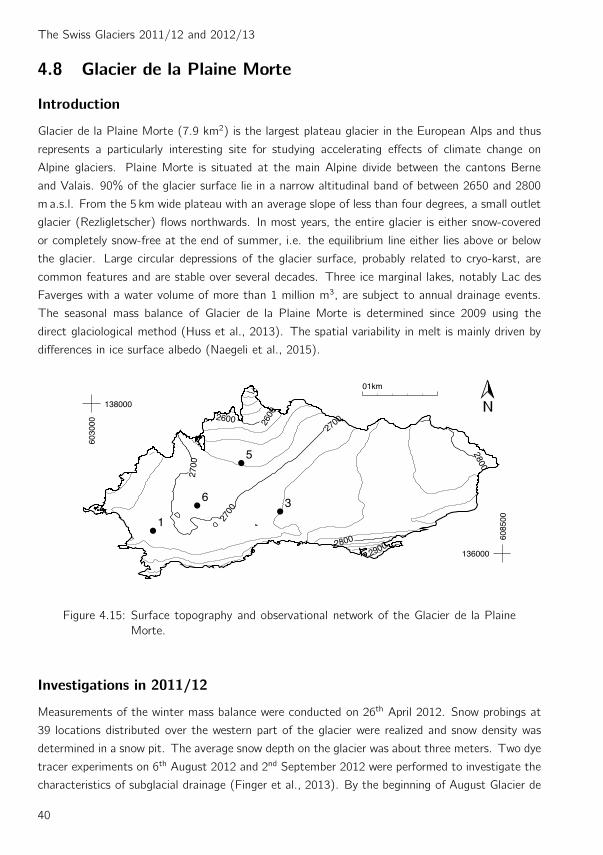
The Swiss Glaciers 2011/12 and 2012/13
4.8 Glacier de la Plaine Morte
Introduction
Glacier de la Plaine Morte (7.9 km2) is the largest plateau glacier in the European Alps and thus
represents a particularly interesting site for studying accelerating effects of climate change on
Alpine glaciers. Plaine Morte is situated at the main Alpine divide between the cantons Berne
and Valais. 90% of the glacier surface lie in a narrow altitudinal band of between 2650 and 2800
m a.s.l. From the 5 km wide plateau with an average slope of less than four degrees, a small outlet
glacier (Rezligletscher) flows northwards. In most years, the entire glacier is either snow-covered
or completely snow-free at the end of summer, i.e. the equilibrium line either lies above or below
the glacier. Large circular depressions of the glacier surface, probably related to cryo-karst, are
common features and are stable over several decades. Three ice marginal lakes, notably Lac des
Faverges with a water volume of more than 1 million m3, are subject to annual drainage events.
The seasonal mass balance of Glacier de la Plaine Morte is determined since 2009 using the
direct glaciological method (Huss et al., 2013). The spatial variability in melt is mainly driven by
differences in ice surface albedo (Naegeli et al., 2015).
2700
2700
2700
26002600
2800
29002800
1
3
5
6
6030
00
138000
6085
00
136000
01km
Figure 4.15: Surface topography and observational network of the Glacier de la Plaine
Morte.
Investigations in 2011/12
Measurements of the winter mass balance were conducted on 26th April 2012. Snow probings at
39 locations distributed over the western part of the glacier were realized and snow density was
determined in a snow pit. The average snow depth on the glacier was about three meters. Two dye
tracer experiments on 6th August 2012 and 2nd September 2012 were performed to investigate the
characteristics of subglacial drainage (Finger et al., 2013). By the beginning of August Glacier de
40
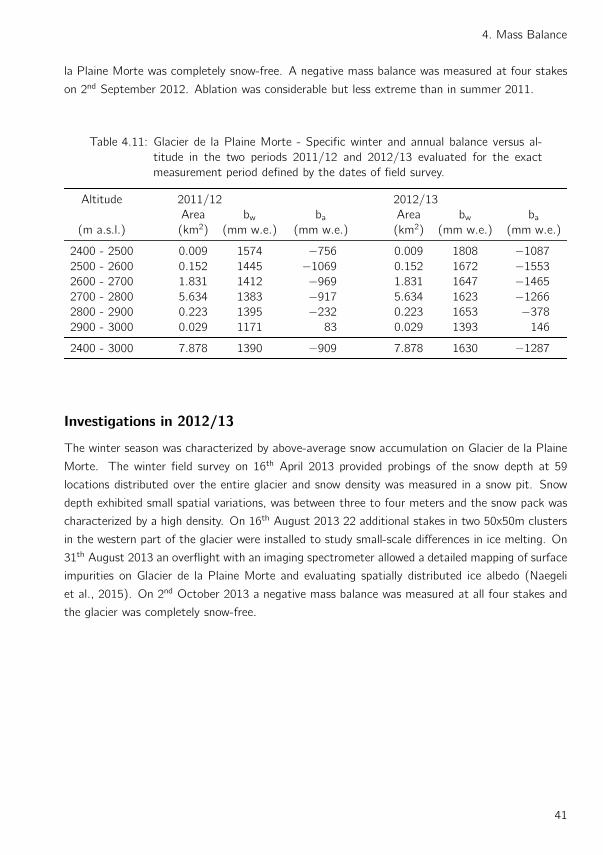
4. Mass Balance
la Plaine Morte was completely snow-free. A negative mass balance was measured at four stakes
on 2nd September 2012. Ablation was considerable but less extreme than in summer 2011.
Table 4.11: Glacier de la Plaine Morte - Specific winter and annual balance versus al-
titude in the two periods 2011/12 and 2012/13 evaluated for the exact
measurement period defined by the dates of field survey.
Altitude 2011/12 2012/13
Area bw ba Area bw ba(m a.s.l.) (km2) (mm w.e.) (mm w.e.) (km2) (mm w.e.) (mm w.e.)
2400 - 2500 0.009 1574 −756 0.009 1808 −1087
2500 - 2600 0.152 1445 −1069 0.152 1672 −1553
2600 - 2700 1.831 1412 −969 1.831 1647 −1465
2700 - 2800 5.634 1383 −917 5.634 1623 −1266
2800 - 2900 0.223 1395 −232 0.223 1653 −378
2900 - 3000 0.029 1171 83 0.029 1393 146
2400 - 3000 7.878 1390 −909 7.878 1630 −1287
Investigations in 2012/13
The winter season was characterized by above-average snow accumulation on Glacier de la Plaine
Morte. The winter field survey on 16th April 2013 provided probings of the snow depth at 59
locations distributed over the entire glacier and snow density was measured in a snow pit. Snow
depth exhibited small spatial variations, was between three to four meters and the snow pack was
characterized by a high density. On 16th August 2013 22 additional stakes in two 50x50m clusters
in the western part of the glacier were installed to study small-scale differences in ice melting. On
31th August 2013 an overflight with an imaging spectrometer allowed a detailed mapping of surface
impurities on Glacier de la Plaine Morte and evaluating spatially distributed ice albedo (Naegeli
et al., 2015). On 2nd October 2013 a negative mass balance was measured at all four stakes and
the glacier was completely snow-free.
41
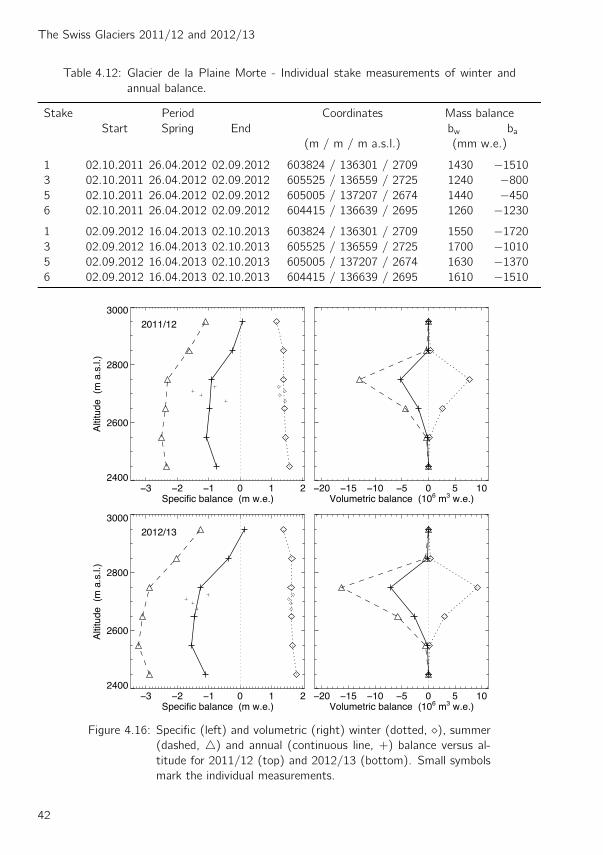
The Swiss Glaciers 2011/12 and 2012/13
Table 4.12: Glacier de la Plaine Morte - Individual stake measurements of winter and
annual balance.
Stake Period Coordinates Mass balance
Start Spring End bw ba(m / m / m a.s.l.) (mm w.e.)
1 02.10.2011 26.04.2012 02.09.2012 603824 / 136301 / 2709 1430 −1510
3 02.10.2011 26.04.2012 02.09.2012 605525 / 136559 / 2725 1240 −800
5 02.10.2011 26.04.2012 02.09.2012 605005 / 137207 / 2674 1440 −450
6 02.10.2011 26.04.2012 02.09.2012 604415 / 136639 / 2695 1260 −1230
1 02.09.2012 16.04.2013 02.10.2013 603824 / 136301 / 2709 1550 −1720
3 02.09.2012 16.04.2013 02.10.2013 605525 / 136559 / 2725 1700 −1010
5 02.09.2012 16.04.2013 02.10.2013 605005 / 137207 / 2674 1630 −1370
6 02.09.2012 16.04.2013 02.10.2013 604415 / 136639 / 2695 1610 −1510
0 1 2Specific balance (m w.e.)
2400
2600
2800
3000
Alti
tude
(m
a.s
.l.)
2011/12
0 5 10Volumetric balance (106 m3 w.e.)
0 1 2Specific balance (m w.e.)
2400
2600
2800
3000
Alti
tude
(m
a.s
.l.)
2012/13
0 5 10Volumetric balance (106 m3 w.e.)
Figure 4.16: Specific (left) and volumetric (right) winter (dotted, ⋄), summer
(dashed, △) and annual (continuous line, +) balance versus al-
titude for 2011/12 (top) and 2012/13 (bottom). Small symbols
mark the individual measurements.
42
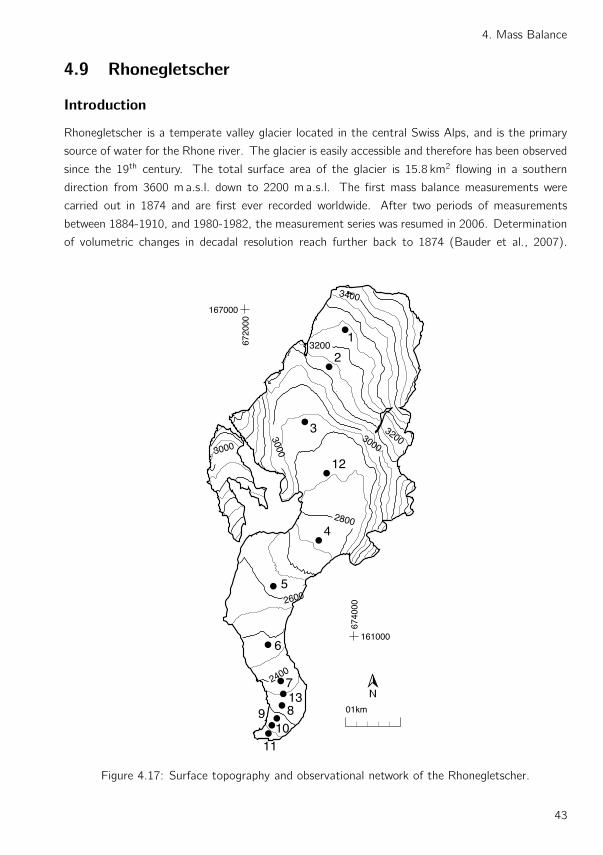
4. Mass Balance
4.9 Rhonegletscher
Introduction
Rhonegletscher is a temperate valley glacier located in the central Swiss Alps, and is the primary
source of water for the Rhone river. The glacier is easily accessible and therefore has been observed
since the 19th century. The total surface area of the glacier is 15.8 km2 flowing in a southern
direction from 3600 m a.s.l. down to 2200 m a.s.l. The first mass balance measurements were
carried out in 1874 and are first ever recorded worldwide. After two periods of measurements
between 1884-1910, and 1980-1982, the measurement series was resumed in 2006. Determination
of volumetric changes in decadal resolution reach further back to 1874 (Bauder et al., 2007).
2400
2600
30003000
3000
2800
3200
3400
32001
2
3
4
5
6
7
8910
11
12
13
6720
00
167000
6740
00
161000
01km
Figure 4.17: Surface topography and observational network of the Rhonegletscher.
43
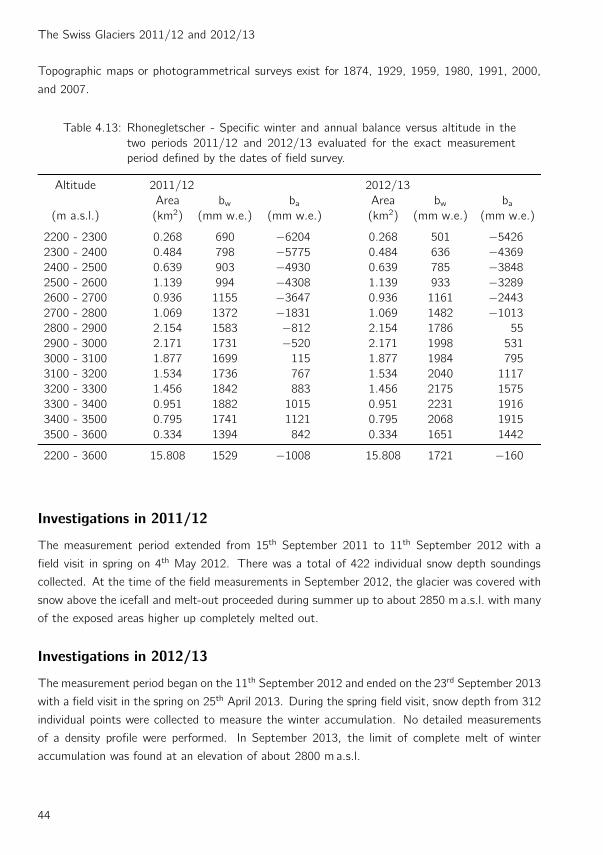
The Swiss Glaciers 2011/12 and 2012/13
Topographic maps or photogrammetrical surveys exist for 1874, 1929, 1959, 1980, 1991, 2000,
and 2007.
Table 4.13: Rhonegletscher - Specific winter and annual balance versus altitude in the
two periods 2011/12 and 2012/13 evaluated for the exact measurement
period defined by the dates of field survey.
Altitude 2011/12 2012/13
Area bw ba Area bw ba(m a.s.l.) (km2) (mm w.e.) (mm w.e.) (km2) (mm w.e.) (mm w.e.)
2200 - 2300 0.268 690 −6204 0.268 501 −5426
2300 - 2400 0.484 798 −5775 0.484 636 −4369
2400 - 2500 0.639 903 −4930 0.639 785 −3848
2500 - 2600 1.139 994 −4308 1.139 933 −3289
2600 - 2700 0.936 1155 −3647 0.936 1161 −2443
2700 - 2800 1.069 1372 −1831 1.069 1482 −1013
2800 - 2900 2.154 1583 −812 2.154 1786 55
2900 - 3000 2.171 1731 −520 2.171 1998 531
3000 - 3100 1.877 1699 115 1.877 1984 795
3100 - 3200 1.534 1736 767 1.534 2040 1117
3200 - 3300 1.456 1842 883 1.456 2175 1575
3300 - 3400 0.951 1882 1015 0.951 2231 1916
3400 - 3500 0.795 1741 1121 0.795 2068 1915
3500 - 3600 0.334 1394 842 0.334 1651 1442
2200 - 3600 15.808 1529 −1008 15.808 1721 −160
Investigations in 2011/12
The measurement period extended from 15th September 2011 to 11th September 2012 with a
field visit in spring on 4th May 2012. There was a total of 422 individual snow depth soundings
collected. At the time of the field measurements in September 2012, the glacier was covered with
snow above the icefall and melt-out proceeded during summer up to about 2850 m a.s.l. with many
of the exposed areas higher up completely melted out.
Investigations in 2012/13
The measurement period began on the 11th September 2012 and ended on the 23rd September 2013
with a field visit in the spring on 25th April 2013. During the spring field visit, snow depth from 312
individual points were collected to measure the winter accumulation. No detailed measurements
of a density profile were performed. In September 2013, the limit of complete melt of winter
accumulation was found at an elevation of about 2800 m a.s.l.
44
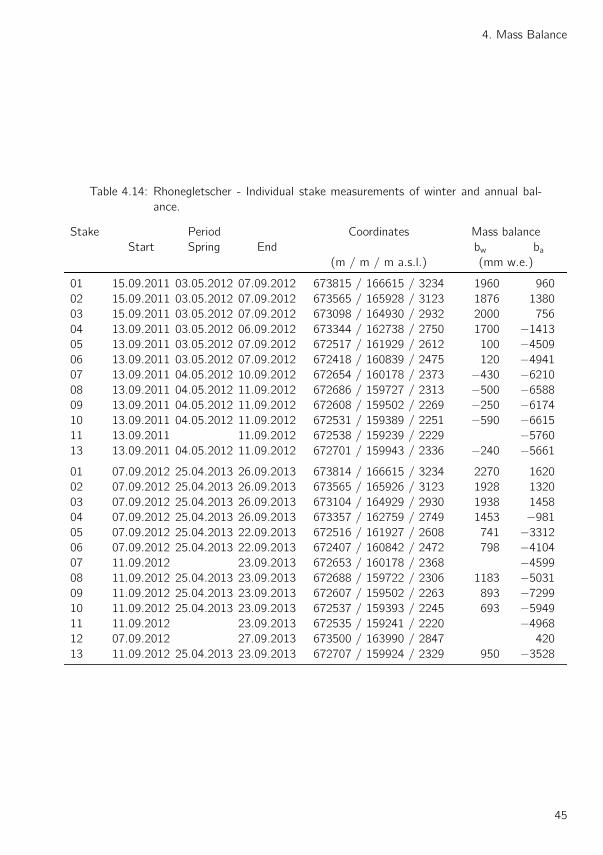
4. Mass Balance
Table 4.14: Rhonegletscher - Individual stake measurements of winter and annual bal-
ance.
Stake Period Coordinates Mass balance
Start Spring End bw ba(m / m / m a.s.l.) (mm w.e.)
01 15.09.2011 03.05.2012 07.09.2012 673815 / 166615 / 3234 1960 960
02 15.09.2011 03.05.2012 07.09.2012 673565 / 165928 / 3123 1876 1380
03 15.09.2011 03.05.2012 07.09.2012 673098 / 164930 / 2932 2000 756
04 13.09.2011 03.05.2012 06.09.2012 673344 / 162738 / 2750 1700 −1413
05 13.09.2011 03.05.2012 07.09.2012 672517 / 161929 / 2612 100 −4509
06 13.09.2011 03.05.2012 07.09.2012 672418 / 160839 / 2475 120 −4941
07 13.09.2011 04.05.2012 10.09.2012 672654 / 160178 / 2373 −430 −6210
08 13.09.2011 04.05.2012 11.09.2012 672686 / 159727 / 2313 −500 −6588
09 13.09.2011 04.05.2012 11.09.2012 672608 / 159502 / 2269 −250 −6174
10 13.09.2011 04.05.2012 11.09.2012 672531 / 159389 / 2251 −590 −6615
11 13.09.2011 11.09.2012 672538 / 159239 / 2229 −5760
13 13.09.2011 04.05.2012 11.09.2012 672701 / 159943 / 2336 −240 −5661
01 07.09.2012 25.04.2013 26.09.2013 673814 / 166615 / 3234 2270 1620
02 07.09.2012 25.04.2013 26.09.2013 673565 / 165926 / 3123 1928 1320
03 07.09.2012 25.04.2013 26.09.2013 673104 / 164929 / 2930 1938 1458
04 07.09.2012 25.04.2013 26.09.2013 673357 / 162759 / 2749 1453 −981
05 07.09.2012 25.04.2013 22.09.2013 672516 / 161927 / 2608 741 −3312
06 07.09.2012 25.04.2013 22.09.2013 672407 / 160842 / 2472 798 −4104
07 11.09.2012 23.09.2013 672653 / 160178 / 2368 −4599
08 11.09.2012 25.04.2013 23.09.2013 672688 / 159722 / 2306 1183 −5031
09 11.09.2012 25.04.2013 23.09.2013 672607 / 159502 / 2263 893 −7299
10 11.09.2012 25.04.2013 23.09.2013 672537 / 159393 / 2245 693 −5949
11 11.09.2012 23.09.2013 672535 / 159241 / 2220 −4968
12 07.09.2012 27.09.2013 673500 / 163990 / 2847 420
13 11.09.2012 25.04.2013 23.09.2013 672707 / 159924 / 2329 950 −3528
45
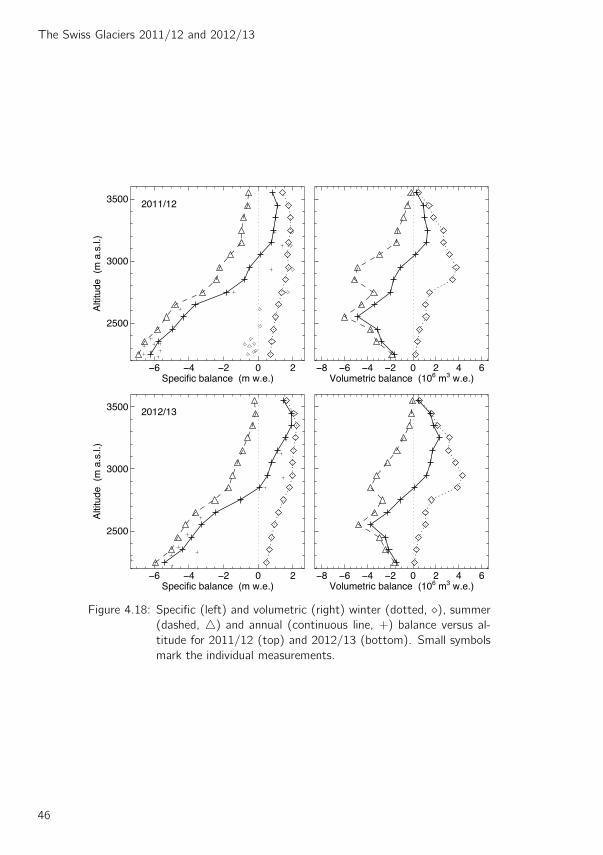
The Swiss Glaciers 2011/12 and 2012/13
0 2Specific balance (m w.e.)
2500
3000
3500
Alti
tude
(m
a.s
.l.)
2011/12
0 2 4 6Volumetric balance (106 m3 w.e.)
0 2Specific balance (m w.e.)
2500
3000
3500
Alti
tude
(m
a.s
.l.)
2012/13
0 2 4 6Volumetric balance (106 m3 w.e.)
Figure 4.18: Specific (left) and volumetric (right) winter (dotted, ⋄), summer
(dashed, △) and annual (continuous line, +) balance versus al-
titude for 2011/12 (top) and 2012/13 (bottom). Small symbols
mark the individual measurements.
46
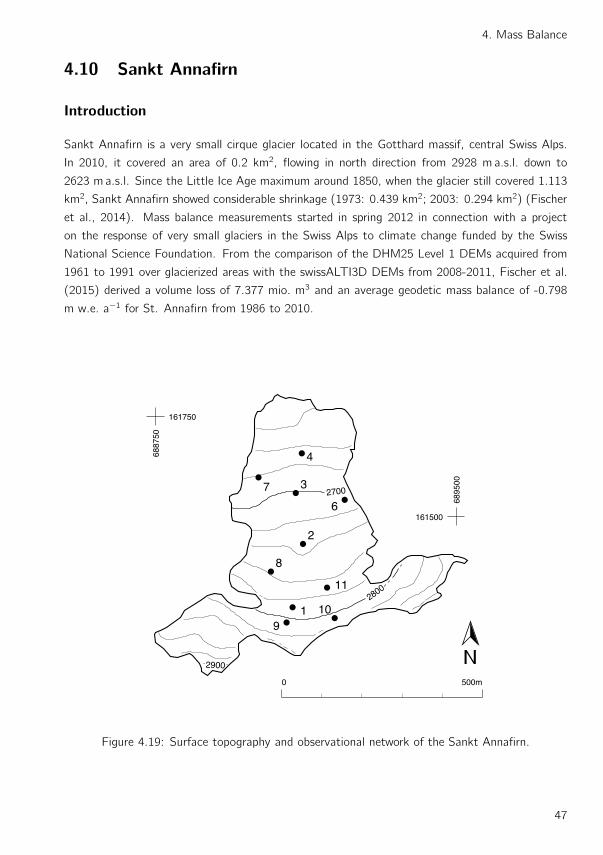
4. Mass Balance
4.10 Sankt Annafirn
Introduction
Sankt Annafirn is a very small cirque glacier located in the Gotthard massif, central Swiss Alps.
In 2010, it covered an area of 0.2 km2, flowing in north direction from 2928 m a.s.l. down to
2623 m a.s.l. Since the Little Ice Age maximum around 1850, when the glacier still covered 1.113
km2, Sankt Annafirn showed considerable shrinkage (1973: 0.439 km2; 2003: 0.294 km2) (Fischer
et al., 2014). Mass balance measurements started in spring 2012 in connection with a project
on the response of very small glaciers in the Swiss Alps to climate change funded by the Swiss
National Science Foundation. From the comparison of the DHM25 Level 1 DEMs acquired from
1961 to 1991 over glacierized areas with the swissALTI3D DEMs from 2008-2011, Fischer et al.
(2015) derived a volume loss of 7.377 mio. m3 and an average geodetic mass balance of -0.798
m w.e. a−1 for St. Annafirn from 1986 to 2010.
2900
2800
2700
1
2
3
4
6
7
8
910
11
6887
50
161750
6895
00
161500
0 500m
Figure 4.19: Surface topography and observational network of the Sankt Annafirn.
47
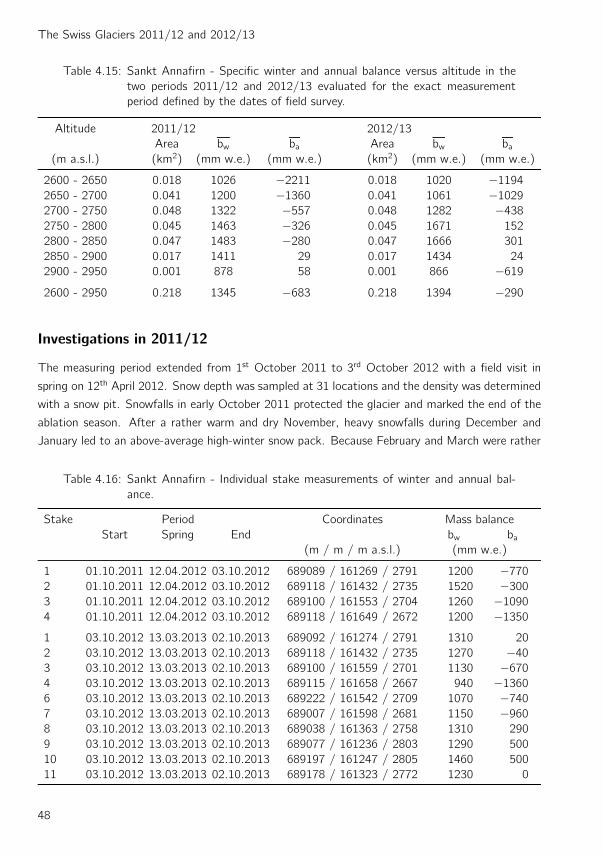
The Swiss Glaciers 2011/12 and 2012/13
Table 4.15: Sankt Annafirn - Specific winter and annual balance versus altitude in the
two periods 2011/12 and 2012/13 evaluated for the exact measurement
period defined by the dates of field survey.
Altitude 2011/12 2012/13
Area bw ba Area bw ba(m a.s.l.) (km2) (mm w.e.) (mm w.e.) (km2) (mm w.e.) (mm w.e.)
2600 - 2650 0.018 1026 −2211 0.018 1020 −1194
2650 - 2700 0.041 1200 −1360 0.041 1061 −1029
2700 - 2750 0.048 1322 −557 0.048 1282 −438
2750 - 2800 0.045 1463 −326 0.045 1671 152
2800 - 2850 0.047 1483 −280 0.047 1666 301
2850 - 2900 0.017 1411 29 0.017 1434 24
2900 - 2950 0.001 878 58 0.001 866 −619
2600 - 2950 0.218 1345 −683 0.218 1394 −290
Investigations in 2011/12
The measuring period extended from 1st October 2011 to 3rd October 2012 with a field visit in
spring on 12th April 2012. Snow depth was sampled at 31 locations and the density was determined
with a snow pit. Snowfalls in early October 2011 protected the glacier and marked the end of the
ablation season. After a rather warm and dry November, heavy snowfalls during December and
January led to an above-average high-winter snow pack. Because February and March were rather
Table 4.16: Sankt Annafirn - Individual stake measurements of winter and annual bal-
ance.
Stake Period Coordinates Mass balance
Start Spring End bw ba(m / m / m a.s.l.) (mm w.e.)
1 01.10.2011 12.04.2012 03.10.2012 689089 / 161269 / 2791 1200 −770
2 01.10.2011 12.04.2012 03.10.2012 689118 / 161432 / 2735 1520 −300
3 01.10.2011 12.04.2012 03.10.2012 689100 / 161553 / 2704 1260 −1090
4 01.10.2011 12.04.2012 03.10.2012 689118 / 161649 / 2672 1200 −1350
1 03.10.2012 13.03.2013 02.10.2013 689092 / 161274 / 2791 1310 20
2 03.10.2012 13.03.2013 02.10.2013 689118 / 161432 / 2735 1270 −40
3 03.10.2012 13.03.2013 02.10.2013 689100 / 161559 / 2701 1130 −670
4 03.10.2012 13.03.2013 02.10.2013 689115 / 161658 / 2667 940 −1360
6 03.10.2012 13.03.2013 02.10.2013 689222 / 161542 / 2709 1070 −740
7 03.10.2012 13.03.2013 02.10.2013 689007 / 161598 / 2681 1150 −960
8 03.10.2012 13.03.2013 02.10.2013 689038 / 161363 / 2758 1310 290
9 03.10.2012 13.03.2013 02.10.2013 689077 / 161236 / 2803 1290 500
10 03.10.2012 13.03.2013 02.10.2013 689197 / 161247 / 2805 1460 500
11 03.10.2012 13.03.2013 02.10.2013 689178 / 161323 / 2772 1230 0
48
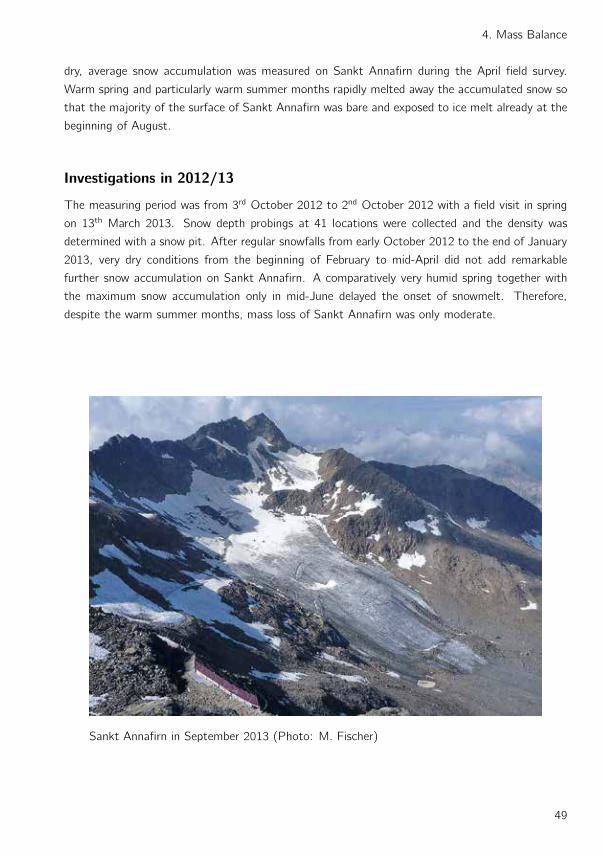
4. Mass Balance
dry, average snow accumulation was measured on Sankt Annafirn during the April field survey.
Warm spring and particularly warm summer months rapidly melted away the accumulated snow so
that the majority of the surface of Sankt Annafirn was bare and exposed to ice melt already at the
beginning of August.
Investigations in 2012/13
The measuring period was from 3rd October 2012 to 2nd October 2012 with a field visit in spring
on 13th March 2013. Snow depth probings at 41 locations were collected and the density was
determined with a snow pit. After regular snowfalls from early October 2012 to the end of January
2013, very dry conditions from the beginning of February to mid-April did not add remarkable
further snow accumulation on Sankt Annafirn. A comparatively very humid spring together with
the maximum snow accumulation only in mid-June delayed the onset of snowmelt. Therefore,
despite the warm summer months, mass loss of Sankt Annafirn was only moderate.
Sankt Annafirn in September 2013 (Photo: M. Fischer)
49

The Swiss Glaciers 2011/12 and 2012/13
0 1Specific balance (m w.e.)
2600
2800
Alti
tude
(m
a.s
.l.)
2011/12
0.00 0.05 0.10Volumetric balance (106 m3 w.e.)
0 1Specific balance (m w.e.)
2600
2800
Alti
tude
(m
a.s
.l.)
2012/13
0.00 0.05 0.10Volumetric balance (106 m3 w.e.)
Figure 4.20: Specific (left) and volumetric (right) winter (dotted, ⋄), summer
(dashed, △) and annual (continuous line, +) balance versus al-
titude for 2011/12 (top) and 2012/13 (bottom). Small symbols
mark the individual measurements.
50
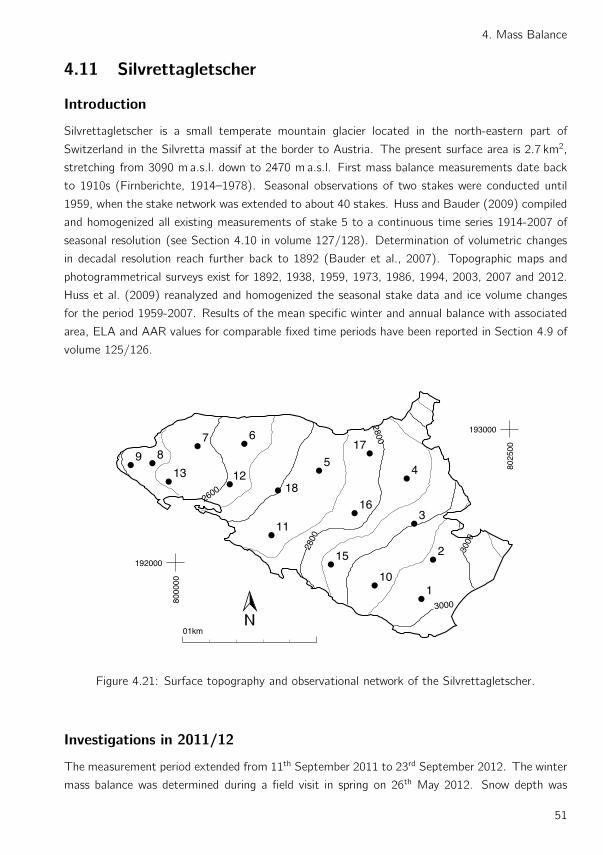
4. Mass Balance
4.11 Silvrettagletscher
Introduction
Silvrettagletscher is a small temperate mountain glacier located in the north-eastern part of
Switzerland in the Silvretta massif at the border to Austria. The present surface area is 2.7 km2,
stretching from 3090 m a.s.l. down to 2470 m a.s.l. First mass balance measurements date back
to 1910s (Firnberichte, 1914–1978). Seasonal observations of two stakes were conducted until
1959, when the stake network was extended to about 40 stakes. Huss and Bauder (2009) compiled
and homogenized all existing measurements of stake 5 to a continuous time series 1914-2007 of
seasonal resolution (see Section 4.10 in volume 127/128). Determination of volumetric changes
in decadal resolution reach further back to 1892 (Bauder et al., 2007). Topographic maps and
photogrammetrical surveys exist for 1892, 1938, 1959, 1973, 1986, 1994, 2003, 2007 and 2012.
Huss et al. (2009) reanalyzed and homogenized the seasonal stake data and ice volume changes
for the period 1959-2007. Results of the mean specific winter and annual balance with associated
area, ELA and AAR values for comparable fixed time periods have been reported in Section 4.9 of
volume 125/126.
2600
2800
2800
3000
3000
1
2
3
45
6789
10
11
1213
15
16
17
18
8000
00
192000
8025
00
193000
01km
Figure 4.21: Surface topography and observational network of the Silvrettagletscher.
Investigations in 2011/12
The measurement period extended from 11th September 2011 to 23rd September 2012. The winter
mass balance was determined during a field visit in spring on 26th May 2012. Snow depth was
51
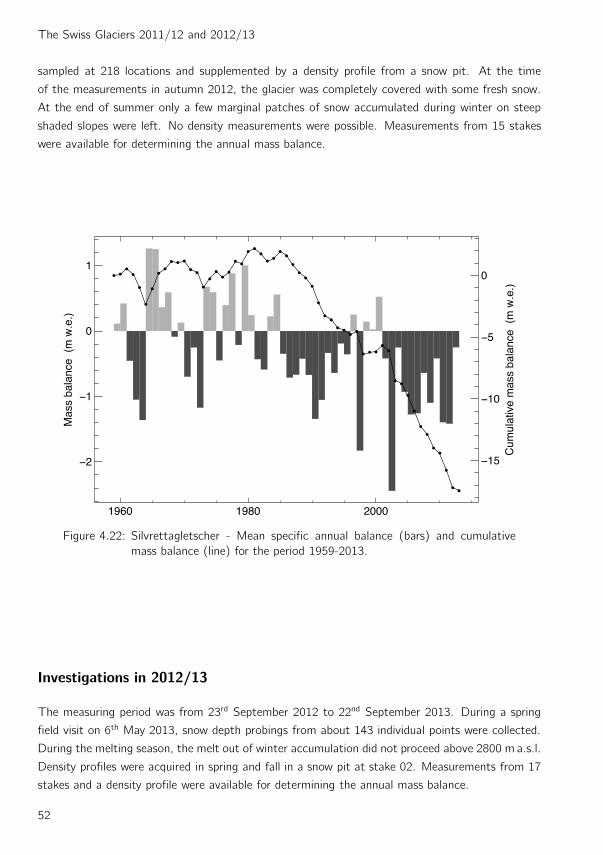
The Swiss Glaciers 2011/12 and 2012/13
sampled at 218 locations and supplemented by a density profile from a snow pit. At the time
of the measurements in autumn 2012, the glacier was completely covered with some fresh snow.
At the end of summer only a few marginal patches of snow accumulated during winter on steep
shaded slopes were left. No density measurements were possible. Measurements from 15 stakes
were available for determining the annual mass balance.
1960 1980 2000
0
1
Mas
s ba
lanc
e (
m w
.e.)
0
Cum
ulat
ive
mas
s ba
lanc
e (
m w
.e.)
Figure 4.22: Silvrettagletscher - Mean specific annual balance (bars) and cumulative
mass balance (line) for the period 1959-2013.
Investigations in 2012/13
The measuring period was from 23rd September 2012 to 22nd September 2013. During a spring
field visit on 6th May 2013, snow depth probings from about 143 individual points were collected.
During the melting season, the melt out of winter accumulation did not proceed above 2800 m a.s.l.
Density profiles were acquired in spring and fall in a snow pit at stake 02. Measurements from 17
stakes and a density profile were available for determining the annual mass balance.
52
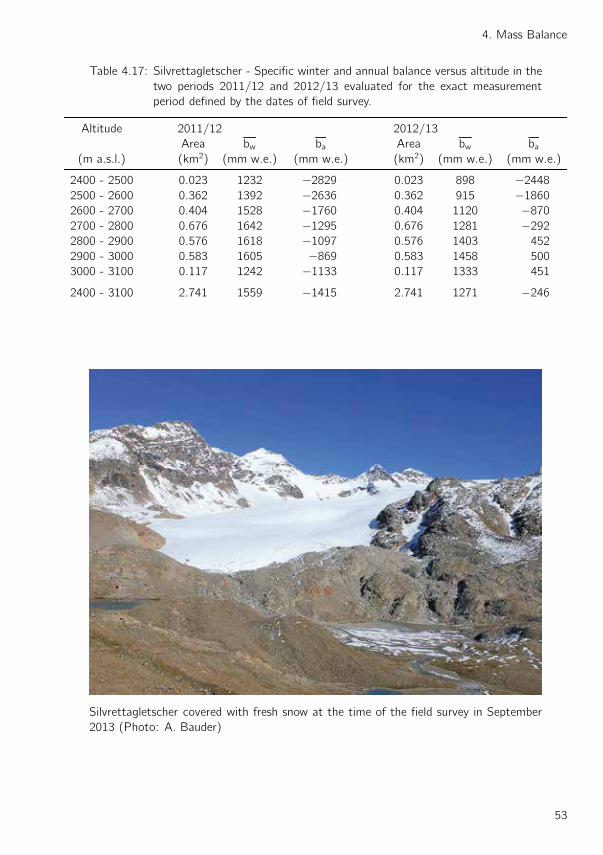
4. Mass Balance
Table 4.17: Silvrettagletscher - Specific winter and annual balance versus altitude in the
two periods 2011/12 and 2012/13 evaluated for the exact measurement
period defined by the dates of field survey.
Altitude 2011/12 2012/13
Area bw ba Area bw ba(m a.s.l.) (km2) (mm w.e.) (mm w.e.) (km2) (mm w.e.) (mm w.e.)
2400 - 2500 0.023 1232 −2829 0.023 898 −2448
2500 - 2600 0.362 1392 −2636 0.362 915 −1860
2600 - 2700 0.404 1528 −1760 0.404 1120 −870
2700 - 2800 0.676 1642 −1295 0.676 1281 −292
2800 - 2900 0.576 1618 −1097 0.576 1403 452
2900 - 3000 0.583 1605 −869 0.583 1458 500
3000 - 3100 0.117 1242 −1133 0.117 1333 451
2400 - 3100 2.741 1559 −1415 2.741 1271 −246
Silvrettagletscher covered with fresh snow at the time of the field survey in September
2013 (Photo: A. Bauder)
53
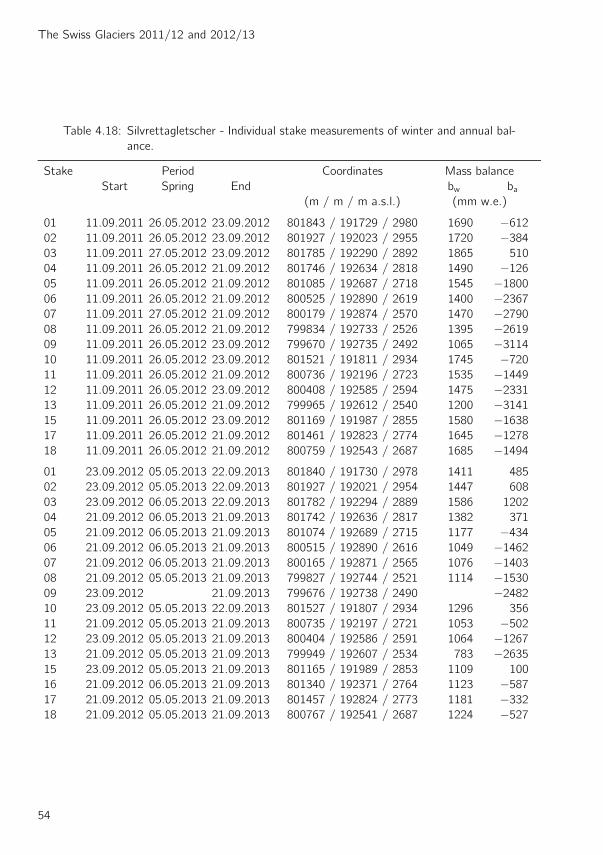
The Swiss Glaciers 2011/12 and 2012/13
Table 4.18: Silvrettagletscher - Individual stake measurements of winter and annual bal-
ance.
Stake Period Coordinates Mass balance
Start Spring End bw ba(m / m / m a.s.l.) (mm w.e.)
01 11.09.2011 26.05.2012 23.09.2012 801843 / 191729 / 2980 1690 −612
02 11.09.2011 26.05.2012 23.09.2012 801927 / 192023 / 2955 1720 −384
03 11.09.2011 27.05.2012 23.09.2012 801785 / 192290 / 2892 1865 510
04 11.09.2011 26.05.2012 21.09.2012 801746 / 192634 / 2818 1490 −126
05 11.09.2011 26.05.2012 21.09.2012 801085 / 192687 / 2718 1545 −1800
06 11.09.2011 26.05.2012 21.09.2012 800525 / 192890 / 2619 1400 −2367
07 11.09.2011 27.05.2012 21.09.2012 800179 / 192874 / 2570 1470 −2790
08 11.09.2011 26.05.2012 21.09.2012 799834 / 192733 / 2526 1395 −2619
09 11.09.2011 26.05.2012 23.09.2012 799670 / 192735 / 2492 1065 −3114
10 11.09.2011 26.05.2012 23.09.2012 801521 / 191811 / 2934 1745 −720
11 11.09.2011 26.05.2012 21.09.2012 800736 / 192196 / 2723 1535 −1449
12 11.09.2011 26.05.2012 23.09.2012 800408 / 192585 / 2594 1475 −2331
13 11.09.2011 26.05.2012 21.09.2012 799965 / 192612 / 2540 1200 −3141
15 11.09.2011 26.05.2012 23.09.2012 801169 / 191987 / 2855 1580 −1638
17 11.09.2011 26.05.2012 21.09.2012 801461 / 192823 / 2774 1645 −1278
18 11.09.2011 26.05.2012 21.09.2012 800759 / 192543 / 2687 1685 −1494
01 23.09.2012 05.05.2013 22.09.2013 801840 / 191730 / 2978 1411 485
02 23.09.2012 05.05.2013 22.09.2013 801927 / 192021 / 2954 1447 608
03 23.09.2012 06.05.2013 22.09.2013 801782 / 192294 / 2889 1586 1202
04 21.09.2012 06.05.2013 21.09.2013 801742 / 192636 / 2817 1382 371
05 21.09.2012 06.05.2013 21.09.2013 801074 / 192689 / 2715 1177 −434
06 21.09.2012 06.05.2013 21.09.2013 800515 / 192890 / 2616 1049 −1462
07 21.09.2012 06.05.2013 21.09.2013 800165 / 192871 / 2565 1076 −1403
08 21.09.2012 05.05.2013 21.09.2013 799827 / 192744 / 2521 1114 −1530
09 23.09.2012 21.09.2013 799676 / 192738 / 2490 −2482
10 23.09.2012 05.05.2013 22.09.2013 801527 / 191807 / 2934 1296 356
11 21.09.2012 05.05.2013 21.09.2013 800735 / 192197 / 2721 1053 −502
12 23.09.2012 05.05.2013 21.09.2013 800404 / 192586 / 2591 1064 −1267
13 21.09.2012 05.05.2013 21.09.2013 799949 / 192607 / 2534 783 −2635
15 23.09.2012 05.05.2013 21.09.2013 801165 / 191989 / 2853 1109 100
16 21.09.2012 06.05.2013 21.09.2013 801340 / 192371 / 2764 1123 −587
17 21.09.2012 05.05.2013 21.09.2013 801457 / 192824 / 2773 1181 −332
18 21.09.2012 05.05.2013 21.09.2013 800767 / 192541 / 2687 1224 −527
54
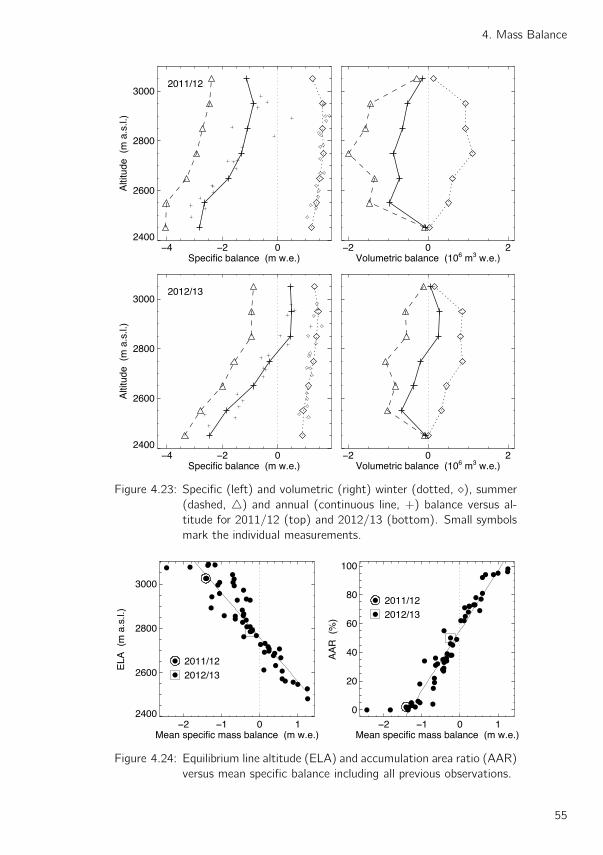
4. Mass Balance
0Specific balance (m w.e.)
2400
2600
2800
3000
Alti
tude
(m
a.s
.l.)
2011/12
0 2Volumetric balance (106 m3 w.e.)
0Specific balance (m w.e.)
2400
2600
2800
3000
Alti
tude
(m
a.s
.l.)
2012/13
0 2Volumetric balance (106 m3 w.e.)
Figure 4.23: Specific (left) and volumetric (right) winter (dotted, ⋄), summer
(dashed, △) and annual (continuous line, +) balance versus al-
titude for 2011/12 (top) and 2012/13 (bottom). Small symbols
mark the individual measurements.
0 1Mean specific mass balance (m w.e.)
2400
2600
2800
3000
ELA
(m
a.s
.l.)
2011/122012/13
0 1Mean specific mass balance (m w.e.)
0
20
40
60
80
100
AA
R (
%)
2011/122012/13
Figure 4.24: Equilibrium line altitude (ELA) and accumulation area ratio (AAR)
versus mean specific balance including all previous observations.
55
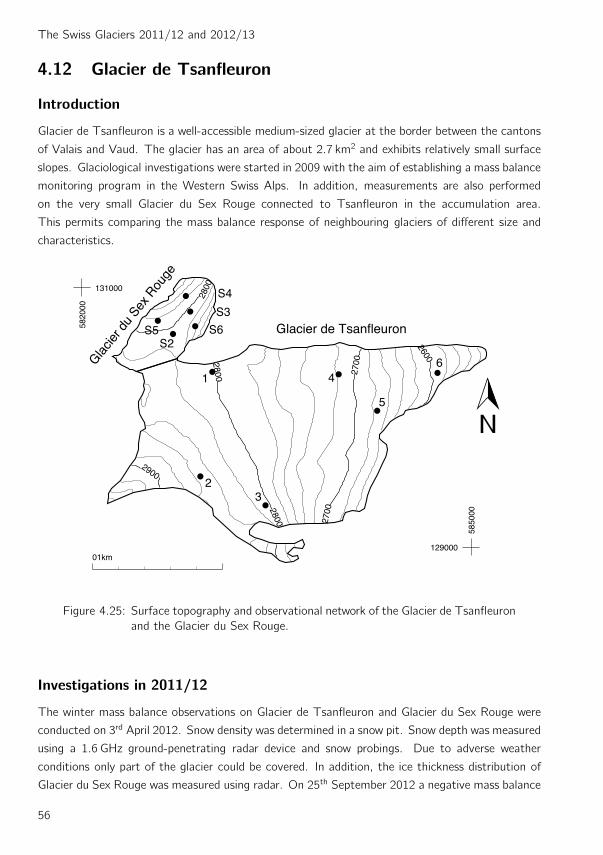
The Swiss Glaciers 2011/12 and 2012/13
4.12 Glacier de Tsanfleuron
Introduction
Glacier de Tsanfleuron is a well-accessible medium-sized glacier at the border between the cantons
of Valais and Vaud. The glacier has an area of about 2.7 km2 and exhibits relatively small surface
slopes. Glaciological investigations were started in 2009 with the aim of establishing a mass balance
monitoring program in the Western Swiss Alps. In addition, measurements are also performed
on the very small Glacier du Sex Rouge connected to Tsanfleuron in the accumulation area.
This permits comparing the mass balance response of neighbouring glaciers of different size and
characteristics.
2900
2800
2800
2800 2700
2700
2600
23
4
5
61
S2
S3
S4
S5 S65820
00
131000
5850
00
12900001km
Glacier
du
Sex R
ouge
Glacier de Tsanfleuron
Figure 4.25: Surface topography and observational network of the Glacier de Tsanfleuron
and the Glacier du Sex Rouge.
Investigations in 2011/12
The winter mass balance observations on Glacier de Tsanfleuron and Glacier du Sex Rouge were
conducted on 3rd April 2012. Snow density was determined in a snow pit. Snow depth was measured
using a 1.6 GHz ground-penetrating radar device and snow probings. Due to adverse weather
conditions only part of the glacier could be covered. In addition, the ice thickness distribution of
Glacier du Sex Rouge was measured using radar. On 25th September 2012 a negative mass balance
56

4. Mass Balance
Table 4.19: Glacier de Tsanfleuron - Specific winter and annual balance versus altitude in
the two periods 2011/12 and 2012/13 evaluated for the exact measurement
period defined by the dates of field survey.
Altitude 2011/12 2012/13
Area bw ba Area bw ba(m a.s.l.) (km2) (mm w.e.) (mm w.e.) (km2) (mm w.e.) (mm w.e.)
2500 - 2600 0.098 1168 −2624 0.073 1413 −1587
2600 - 2700 0.497 1297 −2175 0.510 1475 −1183
2700 - 2800 1.143 1399 −1761 1.143 1568 −243
2800 - 2900 0.964 1339 −1552 0.863 1588 133
2900 - 3000 0.050 1192 −1237 0.058 1552 475
2500 - 3000 2.752 1348 −1784 2.646 1552 −323
for the measurement period was found at all five measurement sites on Glacier de Tsanfleuron, and
for one on Glacier du Sex Rouge. At the end of the ablation season both glaciers were completely
snow-free and mass loss was considerable. A network of six ablation stakes was installed on Glacier
du Sex Rouge related to a project focusing on the mass balance of very small glaciers (Fischer
et al., 2013).
Investigations in 2012/13
During the winter field survey on 23rd April 2013 probings of the snow depth at 118 locations on
Glacier du Tsanfleuron, and at 138 locations on Glacier du Sex Rouge were realized and snow
density was determined in a snow pit. With roughly four meters, snow depth was above the long-
term average. On 13th September 2013, a negative mass balance was measured at four stakes on
Glacier du Tsanfleuron, with values being considerably less negative than in previous years. About
30% of the glacier surface were still covered by winter snow by mid-September 2013. Firn density
was measured in a snow pit. On Glacier du Sex Rouge mass balance could be measured at three
Table 4.20: Glacier du Sex Rouge - Specific winter and annual balance versus altitude in
the two periods 2011/12 and 2012/13 evaluated for the exact measurement
period defined by the dates of field survey.
Altitude 2011/12 2012/13
Area bw ba Area bw ba(m a.s.l.) (km2) (mm w.e.) (mm w.e.) (km2) (mm w.e.) (mm w.e.)
2700 - 2750 0.006 1109 −1766 0.006 1436 −725
2750 - 2800 0.086 1282 −1432 0.086 1383 −859
2800 - 2850 0.165 1401 −1272 0.165 1584 −674
2850 - 2900 0.011 1556 −168 0.011 2000 88
2700 - 2900 0.302 1358 −1285 0.302 1530 −706
57
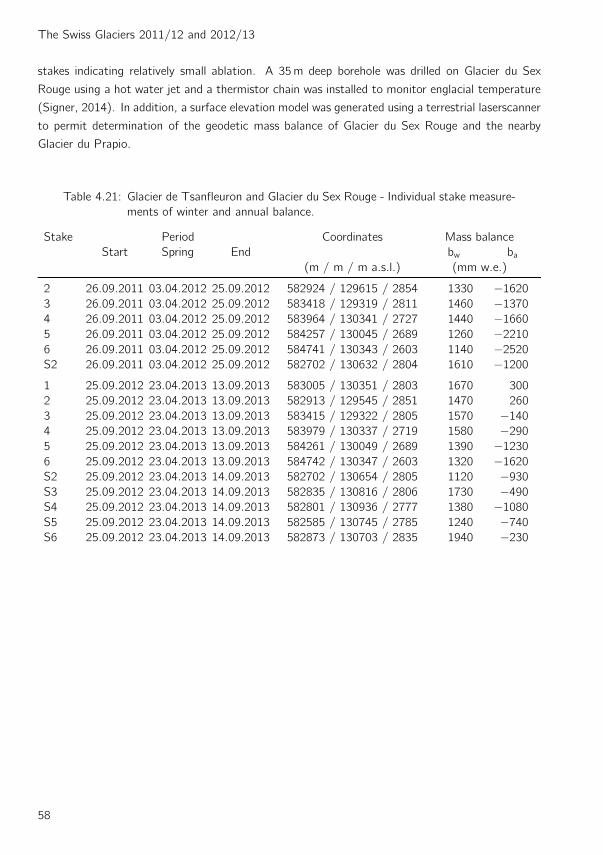
The Swiss Glaciers 2011/12 and 2012/13
stakes indicating relatively small ablation. A 35m deep borehole was drilled on Glacier du Sex
Rouge using a hot water jet and a thermistor chain was installed to monitor englacial temperature
(Signer, 2014). In addition, a surface elevation model was generated using a terrestrial laserscanner
to permit determination of the geodetic mass balance of Glacier du Sex Rouge and the nearby
Glacier du Prapio.
Table 4.21: Glacier de Tsanfleuron and Glacier du Sex Rouge - Individual stake measure-
ments of winter and annual balance.
Stake Period Coordinates Mass balance
Start Spring End bw ba(m / m / m a.s.l.) (mm w.e.)
2 26.09.2011 03.04.2012 25.09.2012 582924 / 129615 / 2854 1330 −1620
3 26.09.2011 03.04.2012 25.09.2012 583418 / 129319 / 2811 1460 −1370
4 26.09.2011 03.04.2012 25.09.2012 583964 / 130341 / 2727 1440 −1660
5 26.09.2011 03.04.2012 25.09.2012 584257 / 130045 / 2689 1260 −2210
6 26.09.2011 03.04.2012 25.09.2012 584741 / 130343 / 2603 1140 −2520
S2 26.09.2011 03.04.2012 25.09.2012 582702 / 130632 / 2804 1610 −1200
1 25.09.2012 23.04.2013 13.09.2013 583005 / 130351 / 2803 1670 300
2 25.09.2012 23.04.2013 13.09.2013 582913 / 129545 / 2851 1470 260
3 25.09.2012 23.04.2013 13.09.2013 583415 / 129322 / 2805 1570 −140
4 25.09.2012 23.04.2013 13.09.2013 583979 / 130337 / 2719 1580 −290
5 25.09.2012 23.04.2013 13.09.2013 584261 / 130049 / 2689 1390 −1230
6 25.09.2012 23.04.2013 13.09.2013 584742 / 130347 / 2603 1320 −1620
S2 25.09.2012 23.04.2013 14.09.2013 582702 / 130654 / 2805 1120 −930
S3 25.09.2012 23.04.2013 14.09.2013 582835 / 130816 / 2806 1730 −490
S4 25.09.2012 23.04.2013 14.09.2013 582801 / 130936 / 2777 1380 −1080
S5 25.09.2012 23.04.2013 14.09.2013 582585 / 130745 / 2785 1240 −740
S6 25.09.2012 23.04.2013 14.09.2013 582873 / 130703 / 2835 1940 −230
58
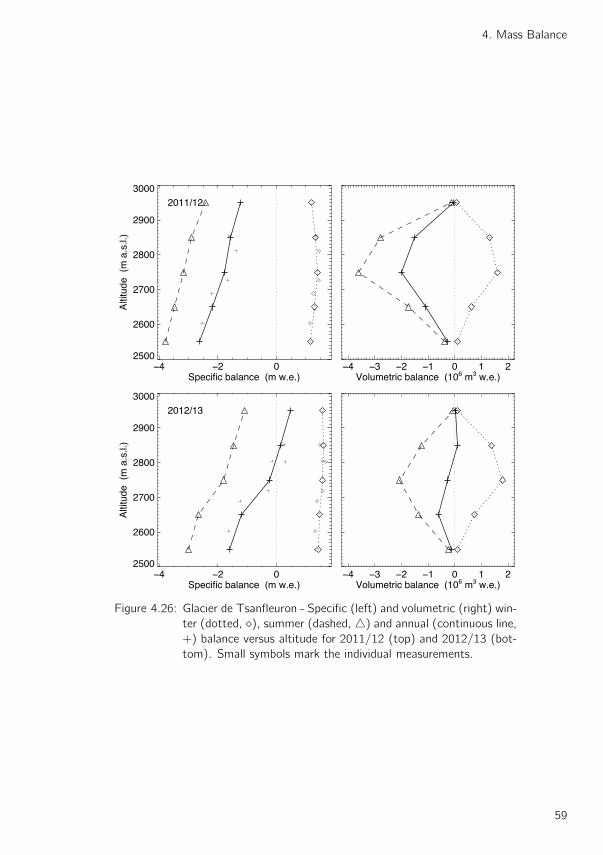
4. Mass Balance
0Specific balance (m w.e.)
2500
2600
2700
2800
2900
3000
Alti
tude
(m
a.s
.l.)
2011/12
0 1 2Volumetric balance (106 m3 w.e.)
0Specific balance (m w.e.)
2500
2600
2700
2800
2900
3000
Alti
tude
(m
a.s
.l.)
2012/13
0 1 2Volumetric balance (106 m3 w.e.)
Figure 4.26: Glacier de Tsanfleuron - Specific (left) and volumetric (right) win-
ter (dotted, ⋄), summer (dashed, △) and annual (continuous line,
+) balance versus altitude for 2011/12 (top) and 2012/13 (bot-
tom). Small symbols mark the individual measurements.
59
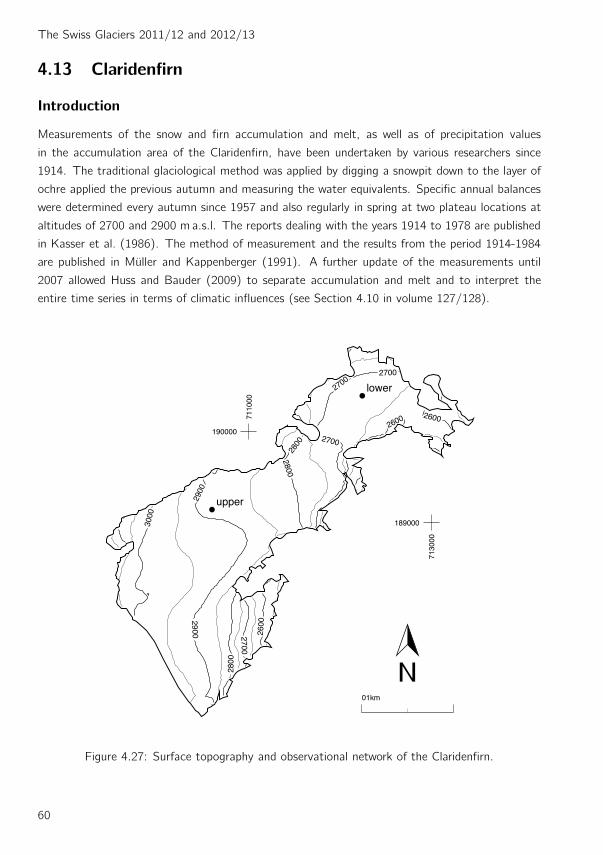
The Swiss Glaciers 2011/12 and 2012/13
4.13 Claridenfirn
Introduction
Measurements of the snow and firn accumulation and melt, as well as of precipitation values
in the accumulation area of the Claridenfirn, have been undertaken by various researchers since
1914. The traditional glaciological method was applied by digging a snowpit down to the layer of
ochre applied the previous autumn and measuring the water equivalents. Specific annual balances
were determined every autumn since 1957 and also regularly in spring at two plateau locations at
altitudes of 2700 and 2900 m a.s.l. The reports dealing with the years 1914 to 1978 are published
in Kasser et al. (1986). The method of measurement and the results from the period 1914-1984
are published in Muller and Kappenberger (1991). A further update of the measurements until
2007 allowed Huss and Bauder (2009) to separate accumulation and melt and to interpret the
entire time series in terms of climatic influences (see Section 4.10 in volume 127/128).
2900
2900
2800
2700
2600
2800
2800
2700
2700
2700
26002600
3000
lower
upper
190000
7110
00
189000
7130
00
01km
Figure 4.27: Surface topography and observational network of the Claridenfirn.
60
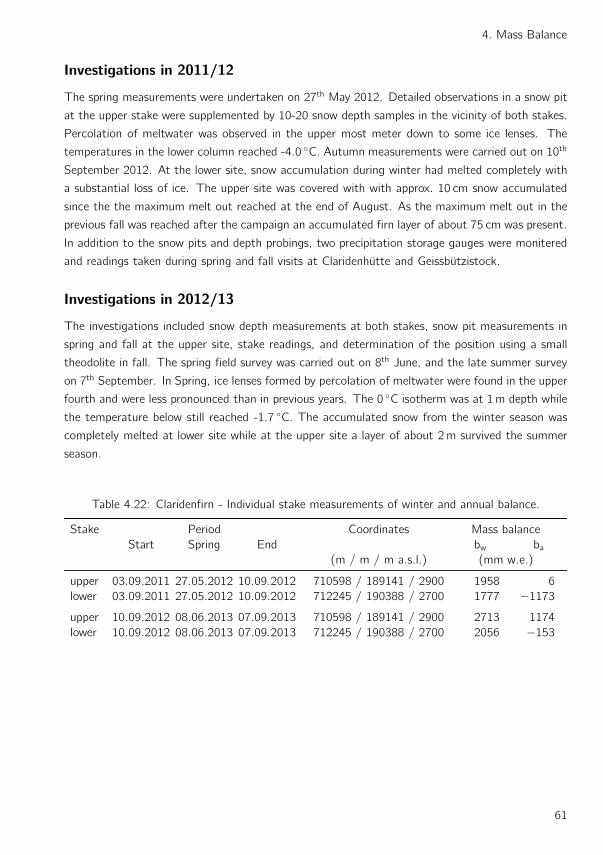
4. Mass Balance
Investigations in 2011/12
The spring measurements were undertaken on 27th May 2012. Detailed observations in a snow pit
at the upper stake were supplemented by 10-20 snow depth samples in the vicinity of both stakes.
Percolation of meltwater was observed in the upper most meter down to some ice lenses. The
temperatures in the lower column reached -4.0 ◦C. Autumn measurements were carried out on 10th
September 2012. At the lower site, snow accumulation during winter had melted completely with
a substantial loss of ice. The upper site was covered with with approx. 10 cm snow accumulated
since the the maximum melt out reached at the end of August. As the maximum melt out in the
previous fall was reached after the campaign an accumulated firn layer of about 75 cm was present.
In addition to the snow pits and depth probings, two precipitation storage gauges were monitered
and readings taken during spring and fall visits at Claridenhutte and Geissbutzistock.
Investigations in 2012/13
The investigations included snow depth measurements at both stakes, snow pit measurements in
spring and fall at the upper site, stake readings, and determination of the position using a small
theodolite in fall. The spring field survey was carried out on 8th June, and the late summer survey
on 7th September. In Spring, ice lenses formed by percolation of meltwater were found in the upper
fourth and were less pronounced than in previous years. The 0 ◦C isotherm was at 1m depth while
the temperature below still reached -1.7 ◦C. The accumulated snow from the winter season was
completely melted at lower site while at the upper site a layer of about 2m survived the summer
season.
Table 4.22: Claridenfirn - Individual stake measurements of winter and annual balance.
Stake Period Coordinates Mass balance
Start Spring End bw ba(m / m / m a.s.l.) (mm w.e.)
upper 03.09.2011 27.05.2012 10.09.2012 710598 / 189141 / 2900 1958 6
lower 03.09.2011 27.05.2012 10.09.2012 712245 / 190388 / 2700 1777 −1173
upper 10.09.2012 08.06.2013 07.09.2013 710598 / 189141 / 2900 2713 1174
lower 10.09.2012 08.06.2013 07.09.2013 712245 / 190388 / 2700 2056 −153
61
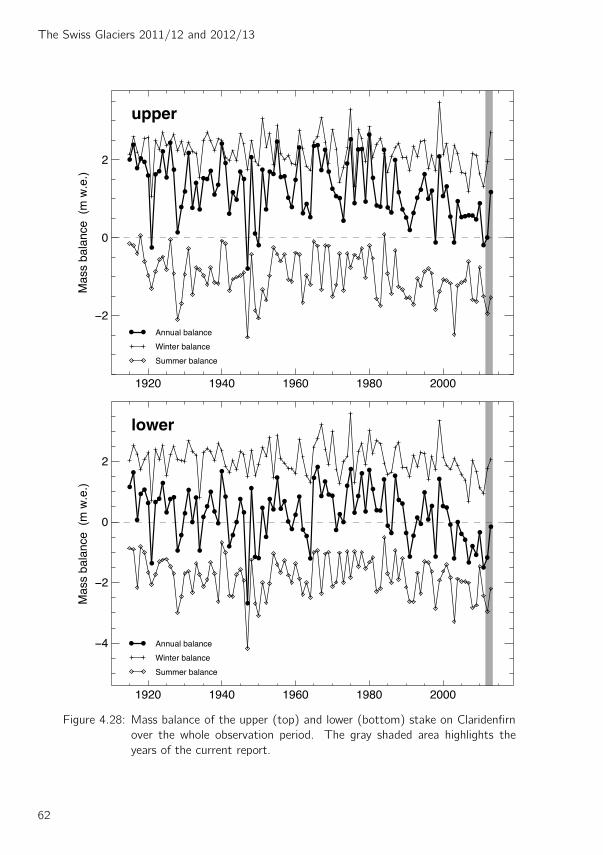
The Swiss Glaciers 2011/12 and 2012/13
1920 1940 1960 1980 2000
0
2
Mas
s ba
lanc
e (
m w
.e.)
Annual balance
Winter balance
Summer balance
upper
1920 1940 1960 1980 2000
0
2
Mas
s ba
lanc
e (
m w
.e.)
Annual balance
Winter balance
Summer balance
lower
Figure 4.28: Mass balance of the upper (top) and lower (bottom) stake on Claridenfirn
over the whole observation period. The gray shaded area highlights the
years of the current report.
62
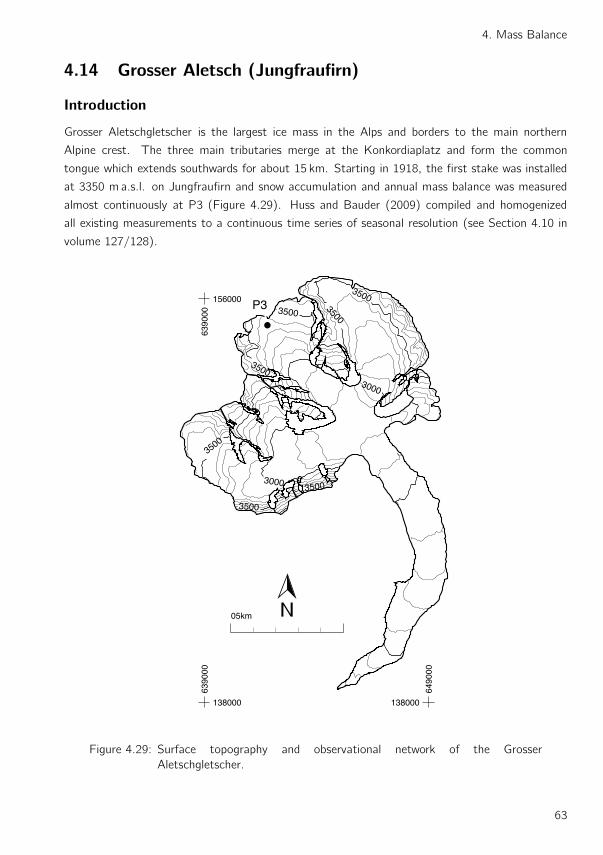
4. Mass Balance
4.14 Grosser Aletsch (Jungfraufirn)
Introduction
Grosser Aletschgletscher is the largest ice mass in the Alps and borders to the main northern
Alpine crest. The three main tributaries merge at the Konkordiaplatz and form the common
tongue which extends southwards for about 15 km. Starting in 1918, the first stake was installed
at 3350 m a.s.l. on Jungfraufirn and snow accumulation and annual mass balance was measured
almost continuously at P3 (Figure 4.29). Huss and Bauder (2009) compiled and homogenized
all existing measurements to a continuous time series of seasonal resolution (see Section 4.10 in
volume 127/128).
3000
3500
3500
3500
3500
3500
35003000
3500P3
6390
00
156000
6390
00
138000
6490
00
138000
05km
Figure 4.29: Surface topography and observational network of the Grosser
Aletschgletscher.
63
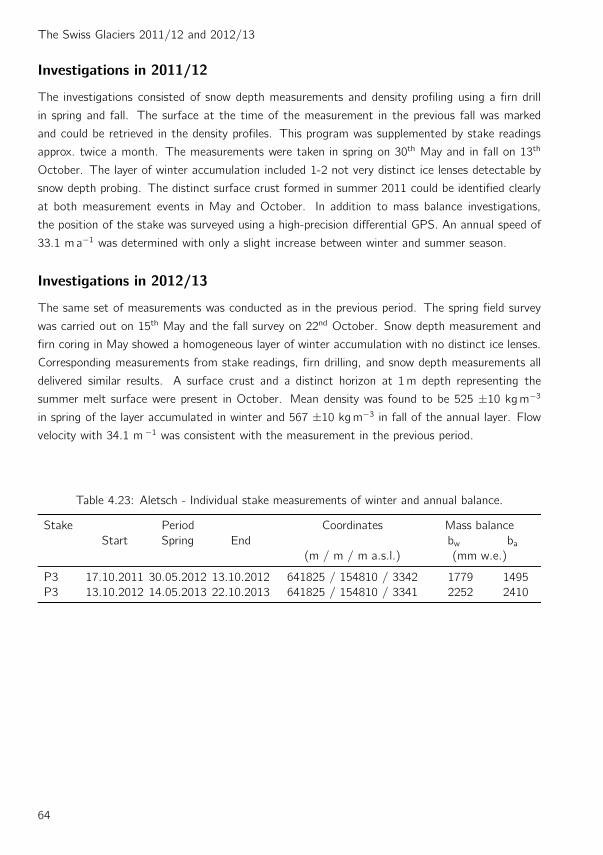
The Swiss Glaciers 2011/12 and 2012/13
Investigations in 2011/12
The investigations consisted of snow depth measurements and density profiling using a firn drill
in spring and fall. The surface at the time of the measurement in the previous fall was marked
and could be retrieved in the density profiles. This program was supplemented by stake readings
approx. twice a month. The measurements were taken in spring on 30th May and in fall on 13th
October. The layer of winter accumulation included 1-2 not very distinct ice lenses detectable by
snow depth probing. The distinct surface crust formed in summer 2011 could be identified clearly
at both measurement events in May and October. In addition to mass balance investigations,
the position of the stake was surveyed using a high-precision differential GPS. An annual speed of
33.1 ma−1 was determined with only a slight increase between winter and summer season.
Investigations in 2012/13
The same set of measurements was conducted as in the previous period. The spring field survey
was carried out on 15th May and the fall survey on 22nd October. Snow depth measurement and
firn coring in May showed a homogeneous layer of winter accumulation with no distinct ice lenses.
Corresponding measurements from stake readings, firn drilling, and snow depth measurements all
delivered similar results. A surface crust and a distinct horizon at 1m depth representing the
summer melt surface were present in October. Mean density was found to be 525 ±10 kgm−3
in spring of the layer accumulated in winter and 567 ±10 kgm−3 in fall of the annual layer. Flow
velocity with 34.1 m −1 was consistent with the measurement in the previous period.
Table 4.23: Aletsch - Individual stake measurements of winter and annual balance.
Stake Period Coordinates Mass balance
Start Spring End bw ba(m / m / m a.s.l.) (mm w.e.)
P3 17.10.2011 30.05.2012 13.10.2012 641825 / 154810 / 3342 1779 1495
P3 13.10.2012 14.05.2013 22.10.2013 641825 / 154810 / 3341 2252 2410
64
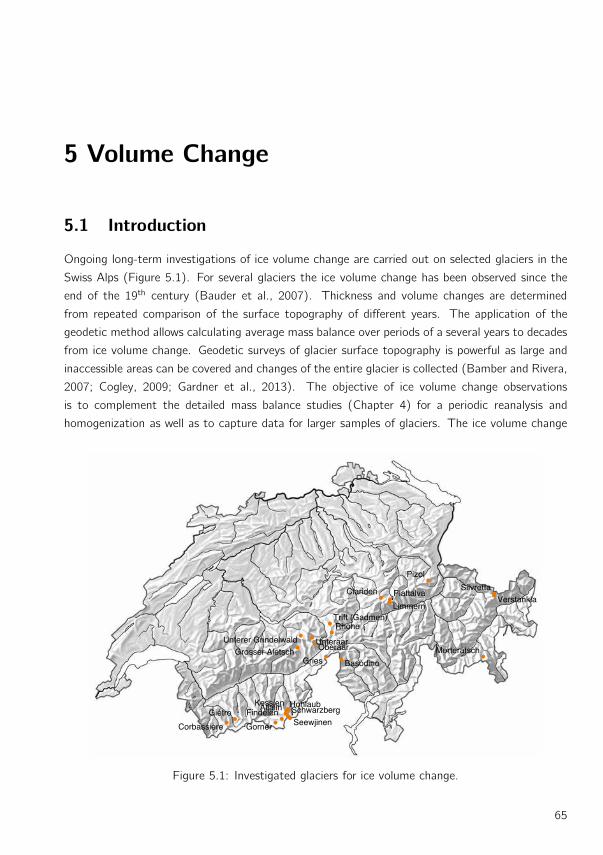
5 Volume Change
5.1 Introduction
Ongoing long-term investigations of ice volume change are carried out on selected glaciers in the
Swiss Alps (Figure 5.1). For several glaciers the ice volume change has been observed since the
end of the 19th century (Bauder et al., 2007). Thickness and volume changes are determined
from repeated comparison of the surface topography of different years. The application of the
geodetic method allows calculating average mass balance over periods of a several years to decades
from ice volume change. Geodetic surveys of glacier surface topography is powerful as large and
inaccessible areas can be covered and changes of the entire glacier is collected (Bamber and Rivera,
2007; Cogley, 2009; Gardner et al., 2013). The objective of ice volume change observations
is to complement the detailed mass balance studies (Chapter 4) for a periodic reanalysis and
homogenization as well as to capture data for larger samples of glaciers. The ice volume change
Allalin
Basòdino
Clariden
Corbassière
FindelenGiétro
Gorner
GriesGrosser Aletsch
HohlaubKessjen
Limmern
MorteratschOberaar
Pizol
Plattalva
Rhone
SchwarzbergSeewjinen
Silvretta
Trift (Gadmen)
UnteraarUnterer Grindelwald
Verstankla
Figure 5.1: Investigated glaciers for ice volume change.
65
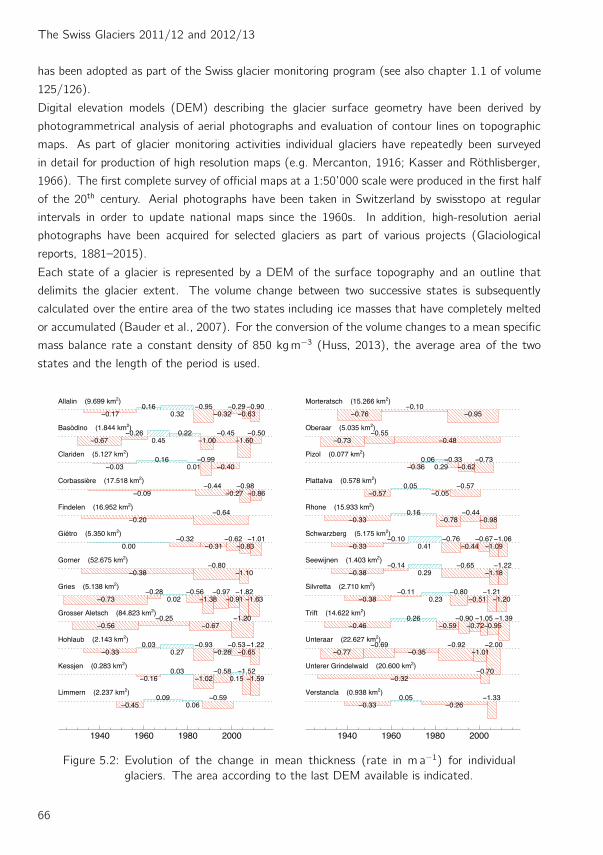
The Swiss Glaciers 2011/12 and 2012/13
has been adopted as part of the Swiss glacier monitoring program (see also chapter 1.1 of volume
125/126).
Digital elevation models (DEM) describing the glacier surface geometry have been derived by
photogrammetrical analysis of aerial photographs and evaluation of contour lines on topographic
maps. As part of glacier monitoring activities individual glaciers have repeatedly been surveyed
in detail for production of high resolution maps (e.g. Mercanton, 1916; Kasser and Rothlisberger,
1966). The first complete survey of official maps at a 1:50’000 scale were produced in the first half
of the 20th century. Aerial photographs have been taken in Switzerland by swisstopo at regular
intervals in order to update national maps since the 1960s. In addition, high-resolution aerial
photographs have been acquired for selected glaciers as part of various projects (Glaciological
reports, 1881–2015).
Each state of a glacier is represented by a DEM of the surface topography and an outline that
delimits the glacier extent. The volume change between two successive states is subsequently
calculated over the entire area of the two states including ice masses that have completely melted
or accumulated (Bauder et al., 2007). For the conversion of the volume changes to a mean specific
mass balance rate a constant density of 850 kgm−3 (Huss, 2013), the average area of the two
states and the length of the period is used.
1940 1960 1980 2000
Allalin (9.699 km2)0.16
0.32
Basòdino (1.844 km2)
0.450.22
Clariden (5.127 km2)0.16
0.01
Corbassière (17.518 km2)
Findelen (16.952 km2)
Giétro (5.350 km2)
0.00
Gorner (52.675 km2)
Gries (5.138 km2)
0.02
Grosser Aletsch (84.823 km2)
Hohlaub (2.143 km2)0.03
0.27
Kessjen (0.283 km2)0.03
0.15
Limmern (2.237 km2)0.09
0.06
1940 1960 1980 2000
Morteratsch (15.266 km2)
Oberaar (5.035 km2)
Pizol (0.077 km2)0.06
0.29
Plattalva (0.578 km2)0.05
Rhone (15.933 km2)0.16
Schwarzberg (5.175 km2)
0.41
Seewijnen (1.403 km2)
0.29
Silvretta (2.710 km2)
0.23
Trift (14.622 km2)0.26
Unteraar (22.627 km2)
Unterer Grindelwald (20.600 km2)
Verstancla (0.938 km2)0.05
Figure 5.2: Evolution of the change in mean thickness (rate in m a−1) for individual
glaciers. The area according to the last DEM available is indicated.
66
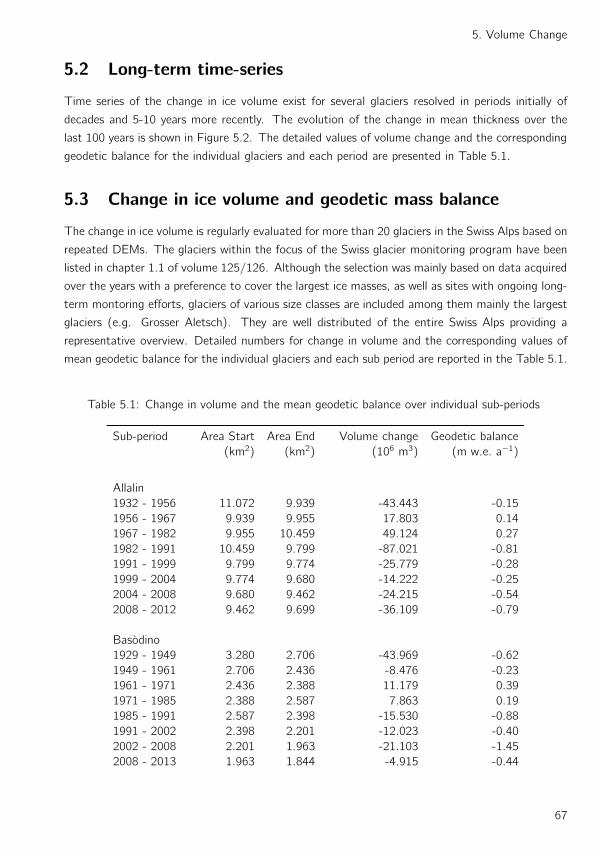
5. Volume Change
5.2 Long-term time-series
Time series of the change in ice volume exist for several glaciers resolved in periods initially of
decades and 5-10 years more recently. The evolution of the change in mean thickness over the
last 100 years is shown in Figure 5.2. The detailed values of volume change and the corresponding
geodetic balance for the individual glaciers and each period are presented in Table 5.1.
5.3 Change in ice volume and geodetic mass balance
The change in ice volume is regularly evaluated for more than 20 glaciers in the Swiss Alps based on
repeated DEMs. The glaciers within the focus of the Swiss glacier monitoring program have been
listed in chapter 1.1 of volume 125/126. Although the selection was mainly based on data acquired
over the years with a preference to cover the largest ice masses, as well as sites with ongoing long-
term montoring efforts, glaciers of various size classes are included among them mainly the largest
glaciers (e.g. Grosser Aletsch). They are well distributed of the entire Swiss Alps providing a
representative overview. Detailed numbers for change in volume and the corresponding values of
mean geodetic balance for the individual glaciers and each sub period are reported in the Table 5.1.
Table 5.1: Change in volume and the mean geodetic balance over individual sub-periods
Sub-period Area Start Area End Volume change Geodetic balance
(km2) (km2) (106 m3) (m w.e. a−1)
Allalin
1932 - 1956 11.072 9.939 -43.443 -0.15
1956 - 1967 9.939 9.955 17.803 0.14
1967 - 1982 9.955 10.459 49.124 0.27
1982 - 1991 10.459 9.799 -87.021 -0.81
1991 - 1999 9.799 9.774 -25.779 -0.28
1999 - 2004 9.774 9.680 -14.222 -0.25
2004 - 2008 9.680 9.462 -24.215 -0.54
2008 - 2012 9.462 9.699 -36.109 -0.79
Basodino
1929 - 1949 3.280 2.706 -43.969 -0.62
1949 - 1961 2.706 2.436 -8.476 -0.23
1961 - 1971 2.436 2.388 11.179 0.39
1971 - 1985 2.388 2.587 7.863 0.19
1985 - 1991 2.587 2.398 -15.530 -0.88
1991 - 2002 2.398 2.201 -12.023 -0.40
2002 - 2008 2.201 1.963 -21.103 -1.45
2008 - 2013 1.963 1.844 -4.915 -0.44
67
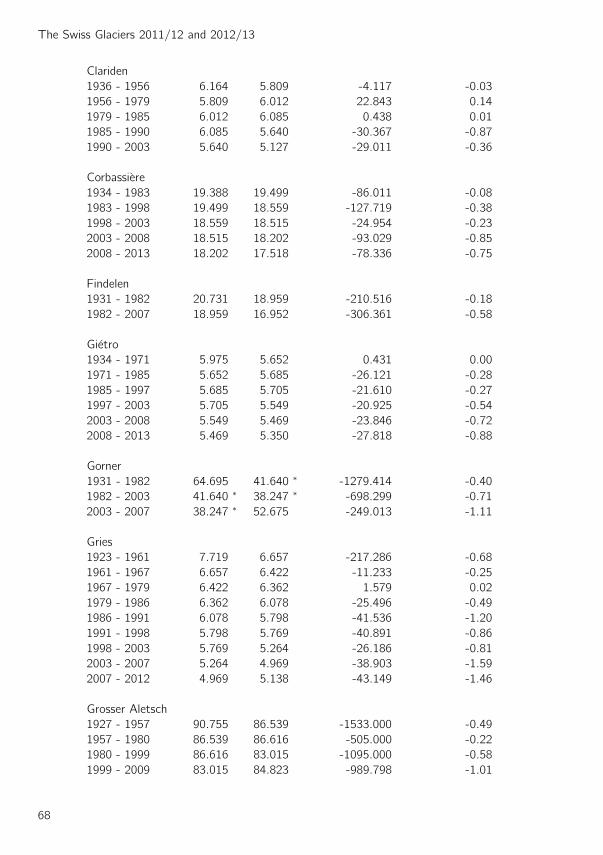
The Swiss Glaciers 2011/12 and 2012/13
Clariden
1936 - 1956 6.164 5.809 -4.117 -0.03
1956 - 1979 5.809 6.012 22.843 0.14
1979 - 1985 6.012 6.085 0.438 0.01
1985 - 1990 6.085 5.640 -30.367 -0.87
1990 - 2003 5.640 5.127 -29.011 -0.36
Corbassiere
1934 - 1983 19.388 19.499 -86.011 -0.08
1983 - 1998 19.499 18.559 -127.719 -0.38
1998 - 2003 18.559 18.515 -24.954 -0.23
2003 - 2008 18.515 18.202 -93.029 -0.85
2008 - 2013 18.202 17.518 -78.336 -0.75
Findelen
1931 - 1982 20.731 18.959 -210.516 -0.18
1982 - 2007 18.959 16.952 -306.361 -0.58
Gietro
1934 - 1971 5.975 5.652 0.431 0.00
1971 - 1985 5.652 5.685 -26.121 -0.28
1985 - 1997 5.685 5.705 -21.610 -0.27
1997 - 2003 5.705 5.549 -20.925 -0.54
2003 - 2008 5.549 5.469 -23.846 -0.72
2008 - 2013 5.469 5.350 -27.818 -0.88
Gorner
1931 - 1982 64.695 41.640 ∗ -1279.414 -0.40
1982 - 2003 41.640 ∗ 38.247 ∗ -698.299 -0.71
2003 - 2007 38.247 ∗ 52.675 -249.013 -1.11
Gries
1923 - 1961 7.719 6.657 -217.286 -0.68
1961 - 1967 6.657 6.422 -11.233 -0.25
1967 - 1979 6.422 6.362 1.579 0.02
1979 - 1986 6.362 6.078 -25.496 -0.49
1986 - 1991 6.078 5.798 -41.536 -1.20
1991 - 1998 5.798 5.769 -40.891 -0.86
1998 - 2003 5.769 5.264 -26.186 -0.81
2003 - 2007 5.264 4.969 -38.903 -1.59
2007 - 2012 4.969 5.138 -43.149 -1.46
Grosser Aletsch
1927 - 1957 90.755 86.539 -1533.000 -0.49
1957 - 1980 86.539 86.616 -505.000 -0.22
1980 - 1999 86.616 83.015 -1095.000 -0.58
1999 - 2009 83.015 84.823 -989.798 -1.01
68
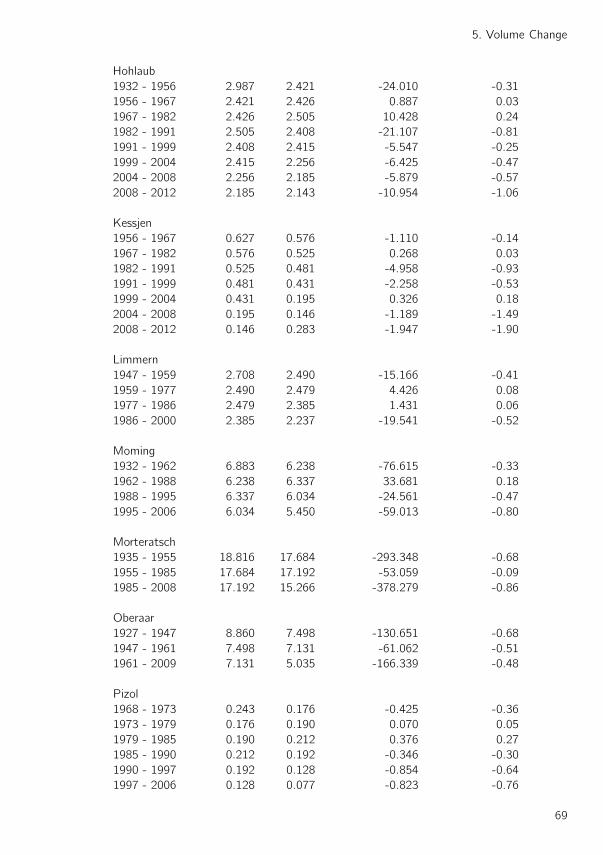
5. Volume Change
Hohlaub
1932 - 1956 2.987 2.421 -24.010 -0.31
1956 - 1967 2.421 2.426 0.887 0.03
1967 - 1982 2.426 2.505 10.428 0.24
1982 - 1991 2.505 2.408 -21.107 -0.81
1991 - 1999 2.408 2.415 -5.547 -0.25
1999 - 2004 2.415 2.256 -6.425 -0.47
2004 - 2008 2.256 2.185 -5.879 -0.57
2008 - 2012 2.185 2.143 -10.954 -1.06
Kessjen
1956 - 1967 0.627 0.576 -1.110 -0.14
1967 - 1982 0.576 0.525 0.268 0.03
1982 - 1991 0.525 0.481 -4.958 -0.93
1991 - 1999 0.481 0.431 -2.258 -0.53
1999 - 2004 0.431 0.195 0.326 0.18
2004 - 2008 0.195 0.146 -1.189 -1.49
2008 - 2012 0.146 0.283 -1.947 -1.90
Limmern
1947 - 1959 2.708 2.490 -15.166 -0.41
1959 - 1977 2.490 2.479 4.426 0.08
1977 - 1986 2.479 2.385 1.431 0.06
1986 - 2000 2.385 2.237 -19.541 -0.52
Moming
1932 - 1962 6.883 6.238 -76.615 -0.33
1962 - 1988 6.238 6.337 33.681 0.18
1988 - 1995 6.337 6.034 -24.561 -0.47
1995 - 2006 6.034 5.450 -59.013 -0.80
Morteratsch
1935 - 1955 18.816 17.684 -293.348 -0.68
1955 - 1985 17.684 17.192 -53.059 -0.09
1985 - 2008 17.192 15.266 -378.279 -0.86
Oberaar
1927 - 1947 8.860 7.498 -130.651 -0.68
1947 - 1961 7.498 7.131 -61.062 -0.51
1961 - 2009 7.131 5.035 -166.339 -0.48
Pizol
1968 - 1973 0.243 0.176 -0.425 -0.36
1973 - 1979 0.176 0.190 0.070 0.05
1979 - 1985 0.190 0.212 0.376 0.27
1985 - 1990 0.212 0.192 -0.346 -0.30
1990 - 1997 0.192 0.128 -0.854 -0.64
1997 - 2006 0.128 0.077 -0.823 -0.76
69
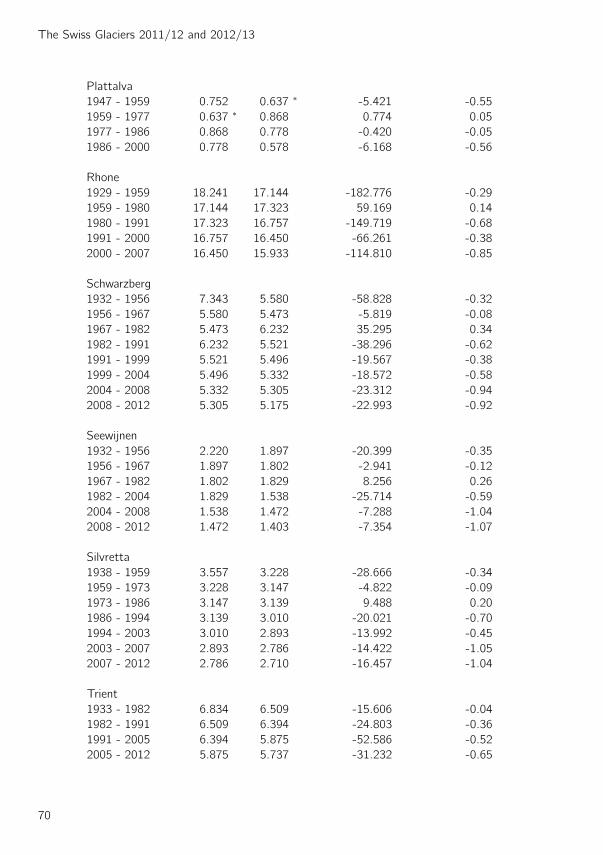
The Swiss Glaciers 2011/12 and 2012/13
Plattalva
1947 - 1959 0.752 0.637 ∗ -5.421 -0.55
1959 - 1977 0.637 ∗ 0.868 0.774 0.05
1977 - 1986 0.868 0.778 -0.420 -0.05
1986 - 2000 0.778 0.578 -6.168 -0.56
Rhone
1929 - 1959 18.241 17.144 -182.776 -0.29
1959 - 1980 17.144 17.323 59.169 0.14
1980 - 1991 17.323 16.757 -149.719 -0.68
1991 - 2000 16.757 16.450 -66.261 -0.38
2000 - 2007 16.450 15.933 -114.810 -0.85
Schwarzberg
1932 - 1956 7.343 5.580 -58.828 -0.32
1956 - 1967 5.580 5.473 -5.819 -0.08
1967 - 1982 5.473 6.232 35.295 0.34
1982 - 1991 6.232 5.521 -38.296 -0.62
1991 - 1999 5.521 5.496 -19.567 -0.38
1999 - 2004 5.496 5.332 -18.572 -0.58
2004 - 2008 5.332 5.305 -23.312 -0.94
2008 - 2012 5.305 5.175 -22.993 -0.92
Seewijnen
1932 - 1956 2.220 1.897 -20.399 -0.35
1956 - 1967 1.897 1.802 -2.941 -0.12
1967 - 1982 1.802 1.829 8.256 0.26
1982 - 2004 1.829 1.538 -25.714 -0.59
2004 - 2008 1.538 1.472 -7.288 -1.04
2008 - 2012 1.472 1.403 -7.354 -1.07
Silvretta
1938 - 1959 3.557 3.228 -28.666 -0.34
1959 - 1973 3.228 3.147 -4.822 -0.09
1973 - 1986 3.147 3.139 9.488 0.20
1986 - 1994 3.139 3.010 -20.021 -0.70
1994 - 2003 3.010 2.893 -13.992 -0.45
2003 - 2007 2.893 2.786 -14.422 -1.05
2007 - 2012 2.786 2.710 -16.457 -1.04
Trient
1933 - 1982 6.834 6.509 -15.606 -0.04
1982 - 1991 6.509 6.394 -24.803 -0.36
1991 - 2005 6.394 5.875 -52.586 -0.52
2005 - 2012 5.875 5.737 -31.232 -0.65
70
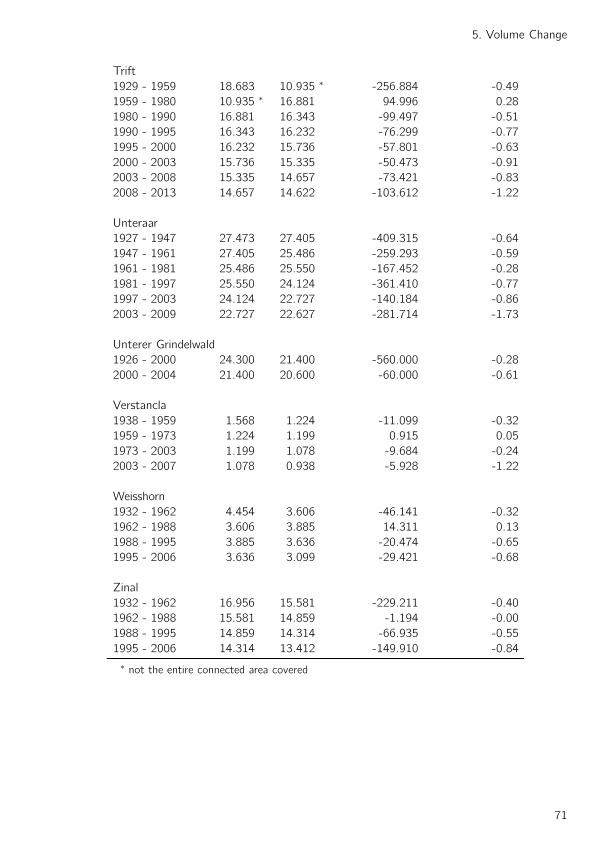
5. Volume Change
Trift
1929 - 1959 18.683 10.935 ∗ -256.884 -0.49
1959 - 1980 10.935 ∗ 16.881 94.996 0.28
1980 - 1990 16.881 16.343 -99.497 -0.51
1990 - 1995 16.343 16.232 -76.299 -0.77
1995 - 2000 16.232 15.736 -57.801 -0.63
2000 - 2003 15.736 15.335 -50.473 -0.91
2003 - 2008 15.335 14.657 -73.421 -0.83
2008 - 2013 14.657 14.622 -103.612 -1.22
Unteraar
1927 - 1947 27.473 27.405 -409.315 -0.64
1947 - 1961 27.405 25.486 -259.293 -0.59
1961 - 1981 25.486 25.550 -167.452 -0.28
1981 - 1997 25.550 24.124 -361.410 -0.77
1997 - 2003 24.124 22.727 -140.184 -0.86
2003 - 2009 22.727 22.627 -281.714 -1.73
Unterer Grindelwald
1926 - 2000 24.300 21.400 -560.000 -0.28
2000 - 2004 21.400 20.600 -60.000 -0.61
Verstancla
1938 - 1959 1.568 1.224 -11.099 -0.32
1959 - 1973 1.224 1.199 0.915 0.05
1973 - 2003 1.199 1.078 -9.684 -0.24
2003 - 2007 1.078 0.938 -5.928 -1.22
Weisshorn
1932 - 1962 4.454 3.606 -46.141 -0.32
1962 - 1988 3.606 3.885 14.311 0.13
1988 - 1995 3.885 3.636 -20.474 -0.65
1995 - 2006 3.636 3.099 -29.421 -0.68
Zinal
1932 - 1962 16.956 15.581 -229.211 -0.40
1962 - 1988 15.581 14.859 -1.194 -0.00
1988 - 1995 14.859 14.314 -66.935 -0.55
1995 - 2006 14.314 13.412 -149.910 -0.84
∗ not the entire connected area covered
71
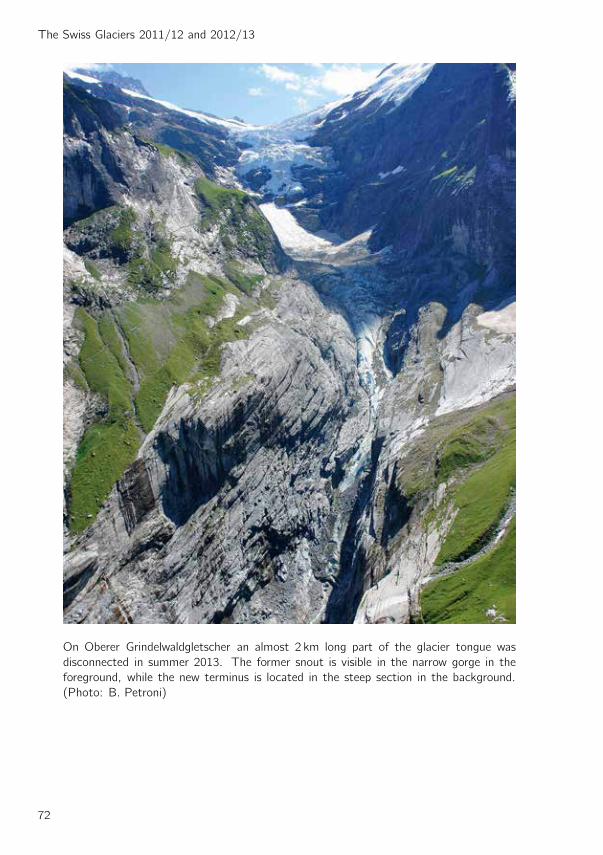
The Swiss Glaciers 2011/12 and 2012/13
On Oberer Grindelwaldgletscher an almost 2 km long part of the glacier tongue was
disconnected in summer 2013. The former snout is visible in the narrow gorge in the
foreground, while the new terminus is located in the steep section in the background.
(Photo: B. Petroni)
72
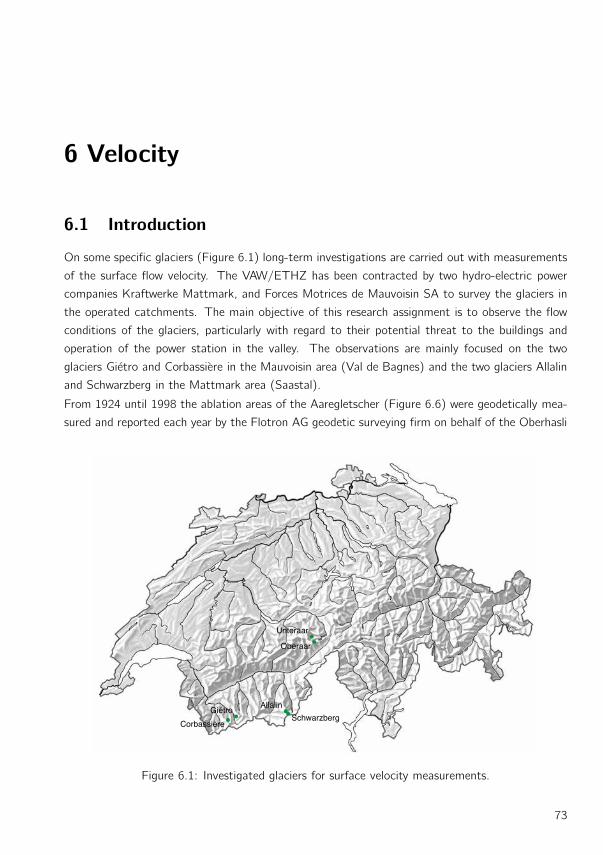
6 Velocity
6.1 Introduction
On some specific glaciers (Figure 6.1) long-term investigations are carried out with measurements
of the surface flow velocity. The VAW/ETHZ has been contracted by two hydro-electric power
companies Kraftwerke Mattmark, and Forces Motrices de Mauvoisin SA to survey the glaciers in
the operated catchments. The main objective of this research assignment is to observe the flow
conditions of the glaciers, particularly with regard to their potential threat to the buildings and
operation of the power station in the valley. The observations are mainly focused on the two
glaciers Gietro and Corbassiere in the Mauvoisin area (Val de Bagnes) and the two glaciers Allalin
and Schwarzberg in the Mattmark area (Saastal).
From 1924 until 1998 the ablation areas of the Aaregletscher (Figure 6.6) were geodetically mea-
sured and reported each year by the Flotron AG geodetic surveying firm on behalf of the Oberhasli
Allalin
SchwarzbergCorbassière
Giétro
Unteraar
Oberaar
Figure 6.1: Investigated glaciers for surface velocity measurements.
73
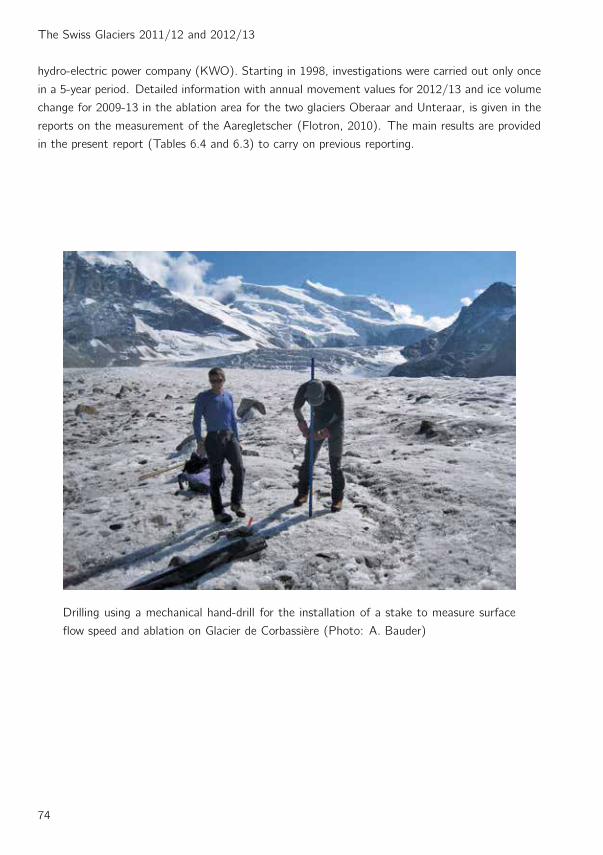
The Swiss Glaciers 2011/12 and 2012/13
hydro-electric power company (KWO). Starting in 1998, investigations were carried out only once
in a 5-year period. Detailed information with annual movement values for 2012/13 and ice volume
change for 2009-13 in the ablation area for the two glaciers Oberaar and Unteraar, is given in the
reports on the measurement of the Aaregletscher (Flotron, 2010). The main results are provided
in the present report (Tables 6.4 and 6.3) to carry on previous reporting.
Drilling using a mechanical hand-drill for the installation of a stake to measure surface
flow speed and ablation on Glacier de Corbassiere (Photo: A. Bauder)
74
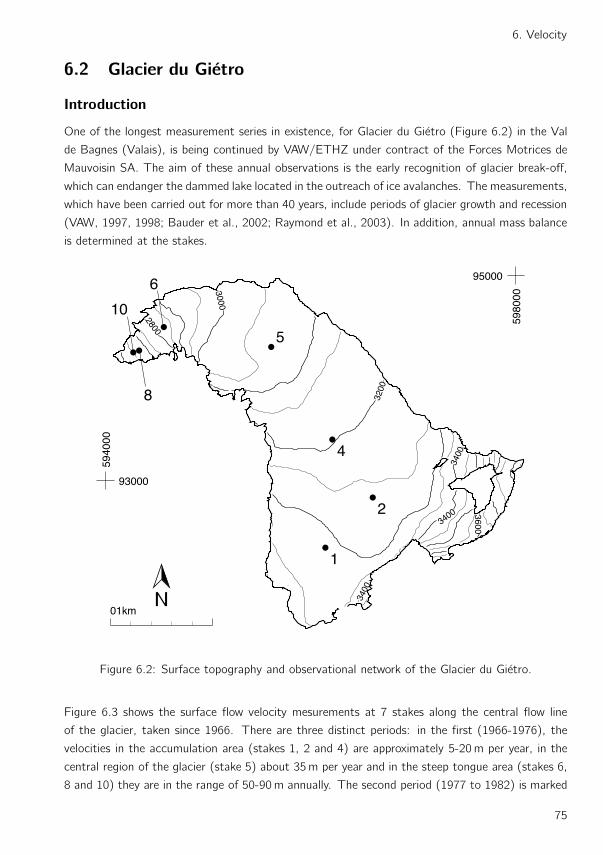
6. Velocity
6.2 Glacier du Gietro
Introduction
One of the longest measurement series in existence, for Glacier du Gietro (Figure 6.2) in the Val
de Bagnes (Valais), is being continued by VAW/ETHZ under contract of the Forces Motrices de
Mauvoisin SA. The aim of these annual observations is the early recognition of glacier break-off,
which can endanger the dammed lake located in the outreach of ice avalanches. The measurements,
which have been carried out for more than 40 years, include periods of glacier growth and recession
(VAW, 1997, 1998; Bauder et al., 2002; Raymond et al., 2003). In addition, annual mass balance
is determined at the stakes.
3400
3400
3400 3600
3200
3000
2800
1
2
4
5
6
8
10
5980
00
95000
5940
00
93000
01km
Figure 6.2: Surface topography and observational network of the Glacier du Gietro.
Figure 6.3 shows the surface flow velocity mesurements at 7 stakes along the central flow line
of the glacier, taken since 1966. There are three distinct periods: in the first (1966-1976), the
velocities in the accumulation area (stakes 1, 2 and 4) are approximately 5-20m per year, in the
central region of the glacier (stake 5) about 35m per year and in the steep tongue area (stakes 6,
8 and 10) they are in the range of 50-90m annually. The second period (1977 to 1982) is marked
75
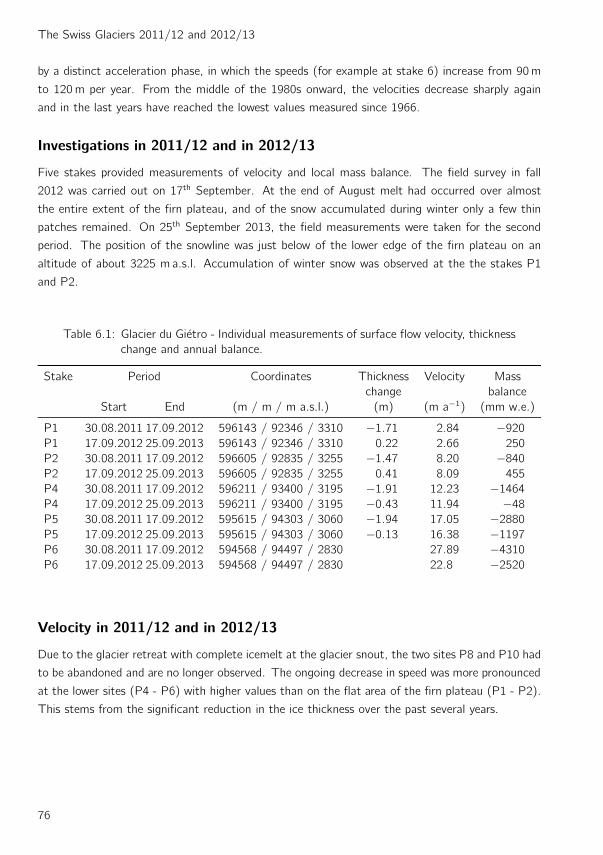
The Swiss Glaciers 2011/12 and 2012/13
by a distinct acceleration phase, in which the speeds (for example at stake 6) increase from 90m
to 120m per year. From the middle of the 1980s onward, the velocities decrease sharply again
and in the last years have reached the lowest values measured since 1966.
Investigations in 2011/12 and in 2012/13
Five stakes provided measurements of velocity and local mass balance. The field survey in fall
2012 was carried out on 17th September. At the end of August melt had occurred over almost
the entire extent of the firn plateau, and of the snow accumulated during winter only a few thin
patches remained. On 25th September 2013, the field measurements were taken for the second
period. The position of the snowline was just below of the lower edge of the firn plateau on an
altitude of about 3225 m a.s.l. Accumulation of winter snow was observed at the the stakes P1
and P2.
Table 6.1: Glacier du Gietro - Individual measurements of surface flow velocity, thickness
change and annual balance.
Stake Period Coordinates Thickness Velocity Mass
change balance
Start End (m / m / m a.s.l.) (m) (m a−1) (mm w.e.)
P1 30.08.2011 17.09.2012 596143 / 92346 / 3310 −1.71 2.84 −920
P1 17.09.2012 25.09.2013 596143 / 92346 / 3310 0.22 2.66 250
P2 30.08.2011 17.09.2012 596605 / 92835 / 3255 −1.47 8.20 −840
P2 17.09.2012 25.09.2013 596605 / 92835 / 3255 0.41 8.09 455
P4 30.08.2011 17.09.2012 596211 / 93400 / 3195 −1.91 12.23 −1464
P4 17.09.2012 25.09.2013 596211 / 93400 / 3195 −0.43 11.94 −48
P5 30.08.2011 17.09.2012 595615 / 94303 / 3060 −1.94 17.05 −2880
P5 17.09.2012 25.09.2013 595615 / 94303 / 3060 −0.13 16.38 −1197
P6 30.08.2011 17.09.2012 594568 / 94497 / 2830 27.89 −4310
P6 17.09.2012 25.09.2013 594568 / 94497 / 2830 22.8 −2520
Velocity in 2011/12 and in 2012/13
Due to the glacier retreat with complete icemelt at the glacier snout, the two sites P8 and P10 had
to be abandoned and are no longer observed. The ongoing decrease in speed was more pronounced
at the lower sites (P4 - P6) with higher values than on the flat area of the firn plateau (P1 - P2).
This stems from the significant reduction in the ice thickness over the past several years.
76
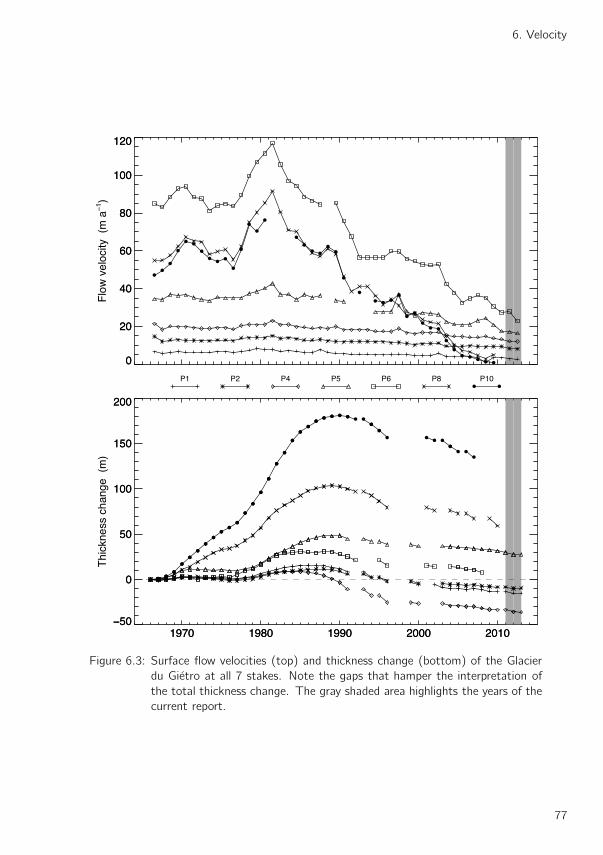
6. Velocity
0
20
40
60
80
100
120
Flo
w v
eloc
ity (
m a
)
0
20
40
60
80
100
120
P1 P2 P4 P5 P6 P8 P10
1970 1980 1990 2000 2010
0
50
100
150
200
Thi
ckne
ss c
hang
e (
m)
1970 1980 1990 2000 2010
0
50
100
150
200
Figure 6.3: Surface flow velocities (top) and thickness change (bottom) of the Glacier
du Gietro at all 7 stakes. Note the gaps that hamper the interpretation of
the total thickness change. The gray shaded area highlights the years of the
current report.
77
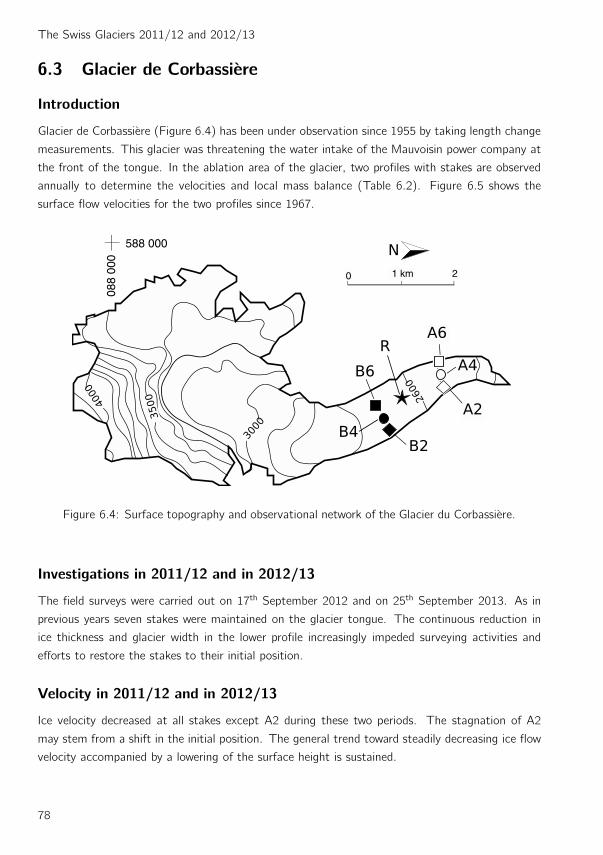
The Swiss Glaciers 2011/12 and 2012/13
6.3 Glacier de Corbassiere
Introduction
Glacier de Corbassiere (Figure 6.4) has been under observation since 1955 by taking length change
measurements. This glacier was threatening the water intake of the Mauvoisin power company at
the front of the tongue. In the ablation area of the glacier, two profiles with stakes are observed
annually to determine the velocities and local mass balance (Table 6.2). Figure 6.5 shows the
surface flow velocities for the two profiles since 1967.
Figure 6.4: Surface topography and observational network of the Glacier du Corbassiere.
Investigations in 2011/12 and in 2012/13
The field surveys were carried out on 17th September 2012 and on 25th September 2013. As in
previous years seven stakes were maintained on the glacier tongue. The continuous reduction in
ice thickness and glacier width in the lower profile increasingly impeded surveying activities and
efforts to restore the stakes to their initial position.
Velocity in 2011/12 and in 2012/13
Ice velocity decreased at all stakes except A2 during these two periods. The stagnation of A2
may stem from a shift in the initial position. The general trend toward steadily decreasing ice flow
velocity accompanied by a lowering of the surface height is sustained.
78
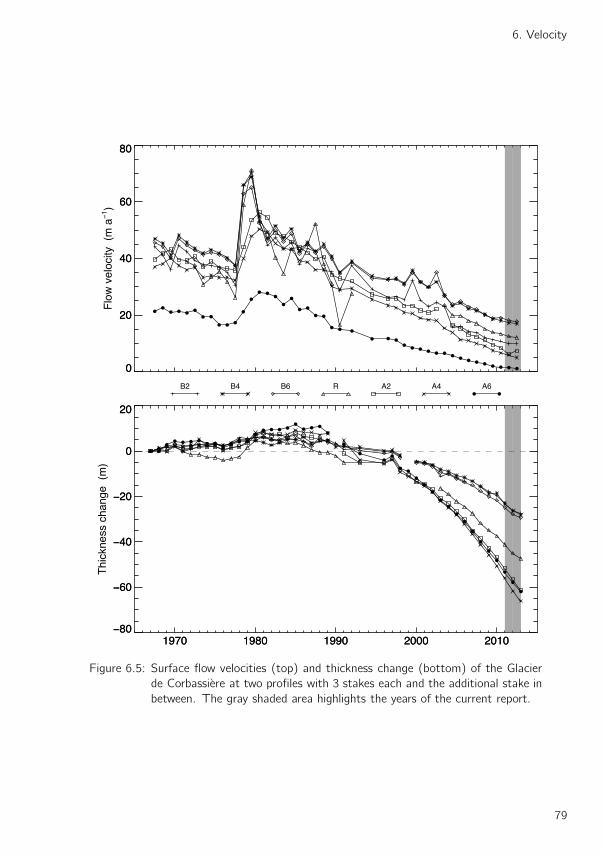
6. Velocity
0
20
40
60
80
Flo
w v
eloc
ity (
m a
)
0
20
40
60
80
B2 B4 B6 R A2 A4 A6
1970 1980 1990 2000 2010
0
20
Thi
ckne
ss c
hang
e (
m)
1970 1980 1990 2000 2010
0
20
Figure 6.5: Surface flow velocities (top) and thickness change (bottom) of the Glacier
de Corbassiere at two profiles with 3 stakes each and the additional stake in
between. The gray shaded area highlights the years of the current report.
79
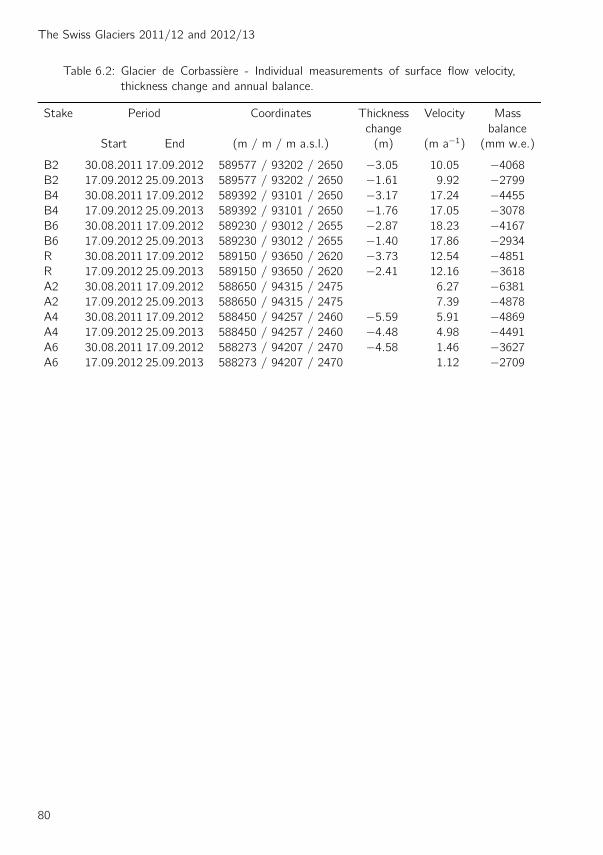
The Swiss Glaciers 2011/12 and 2012/13
Table 6.2: Glacier de Corbassiere - Individual measurements of surface flow velocity,
thickness change and annual balance.
Stake Period Coordinates Thickness Velocity Mass
change balance
Start End (m / m / m a.s.l.) (m) (m a−1) (mm w.e.)
B2 30.08.2011 17.09.2012 589577 / 93202 / 2650 −3.05 10.05 −4068
B2 17.09.2012 25.09.2013 589577 / 93202 / 2650 −1.61 9.92 −2799
B4 30.08.2011 17.09.2012 589392 / 93101 / 2650 −3.17 17.24 −4455
B4 17.09.2012 25.09.2013 589392 / 93101 / 2650 −1.76 17.05 −3078
B6 30.08.2011 17.09.2012 589230 / 93012 / 2655 −2.87 18.23 −4167
B6 17.09.2012 25.09.2013 589230 / 93012 / 2655 −1.40 17.86 −2934
R 30.08.2011 17.09.2012 589150 / 93650 / 2620 −3.73 12.54 −4851
R 17.09.2012 25.09.2013 589150 / 93650 / 2620 −2.41 12.16 −3618
A2 30.08.2011 17.09.2012 588650 / 94315 / 2475 6.27 −6381
A2 17.09.2012 25.09.2013 588650 / 94315 / 2475 7.39 −4878
A4 30.08.2011 17.09.2012 588450 / 94257 / 2460 −5.59 5.91 −4869
A4 17.09.2012 25.09.2013 588450 / 94257 / 2460 −4.48 4.98 −4491
A6 30.08.2011 17.09.2012 588273 / 94207 / 2470 −4.58 1.46 −3627
A6 17.09.2012 25.09.2013 588273 / 94207 / 2470 1.12 −2709
80

6. Velocity
6.4 Aaregletscher
Introduction
Ice flow velocity and thickness change has been systematically observed along transverse profiles
since the 1920s on the Unteraargletscher, and later on an extended network on Oberaargletscher
(Figure 6.6).
Starting in 1996, aerial photographs of the two glaciers were processed using digital photogram-
metric analysis tools. Generation of an orthophoto mosaic and a digital elevation model (DEM) of
the glacier surface are standard products, opening up new possibilities for the evaluation of glacier
movements. Digital elevation models have been further refined since 1997, allowing even more
detailed representations of local ablation and accumulation to be made.
The use of digital photogrammetry has made it possible to improve the spatial resolution of the
DEM drastically. The grid size of the measured points is 3m enhanced by additional break-lines
(terrain edges). Using the method of simultaneous mono-plotting (Flotron, 1979; Kaab, 1996),
horizontal displacement is determined with an estimated accuracy of 0.3m along the 17 profiles
(Figure 6.7).
6520
00
152500
6630
00
162000
03km
1234
56
7
8
9
10
1112
13
1415
1617
obere BrandlammPavillon Dollfus
Miselenegg
Wildläger
Grunerhorn
Finster
aar
LauteraarStrahlegg Unteraar
Oberaar
Figure 6.6: Outline and observational network of the Aaregletscher.
81
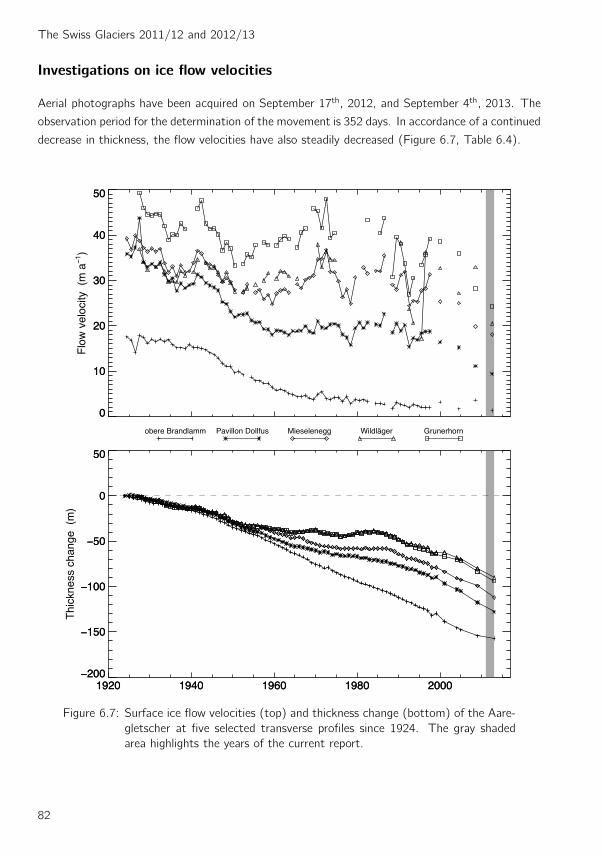
The Swiss Glaciers 2011/12 and 2012/13
Investigations on ice flow velocities
Aerial photographs have been acquired on September 17th, 2012, and September 4th, 2013. The
observation period for the determination of the movement is 352 days. In accordance of a continued
decrease in thickness, the flow velocities have also steadily decreased (Figure 6.7, Table 6.4).
0
10
20
30
40
50
Flo
w v
eloc
ity (
m a
)
0
10
20
30
40
50
obere Brandlamm Pavillon Dollfus Mieselenegg Wildläger Grunerhorn
1920 1940 1960 1980 2000
0
50
Thi
ckne
ss c
hang
e (
m)
1920 1940 1960 1980 2000
0
50
Figure 6.7: Surface ice flow velocities (top) and thickness change (bottom) of the Aare-
gletscher at five selected transverse profiles since 1924. The gray shaded
area highlights the years of the current report.
82
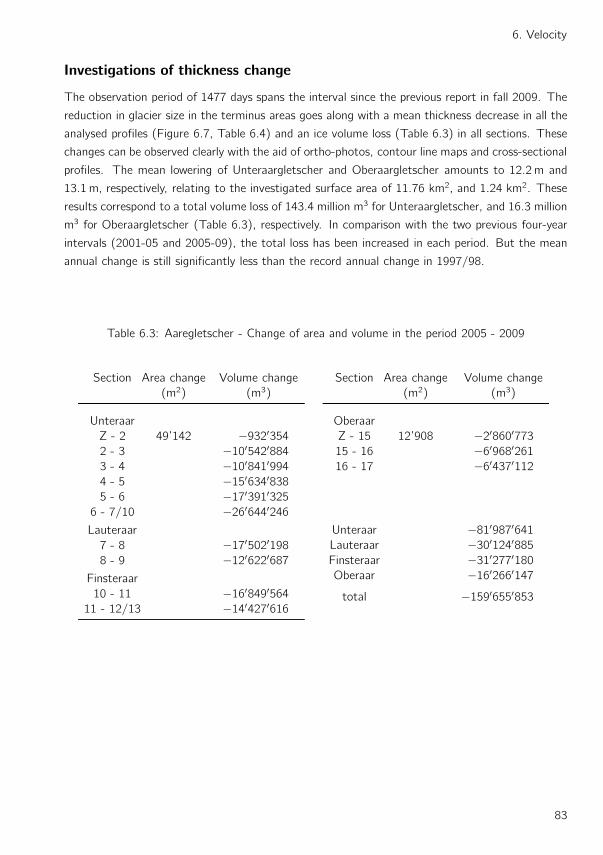
6. Velocity
Investigations of thickness change
The observation period of 1477 days spans the interval since the previous report in fall 2009. The
reduction in glacier size in the terminus areas goes along with a mean thickness decrease in all the
analysed profiles (Figure 6.7, Table 6.4) and an ice volume loss (Table 6.3) in all sections. These
changes can be observed clearly with the aid of ortho-photos, contour line maps and cross-sectional
profiles. The mean lowering of Unteraargletscher and Oberaargletscher amounts to 12.2m and
13.1m, respectively, relating to the investigated surface area of 11.76 km2, and 1.24 km2. These
results correspond to a total volume loss of 143.4 million m3 for Unteraargletscher, and 16.3 million
m3 for Oberaargletscher (Table 6.3), respectively. In comparison with the two previous four-year
intervals (2001-05 and 2005-09), the total loss has been increased in each period. But the mean
annual change is still significantly less than the record annual change in 1997/98.
Table 6.3: Aaregletscher - Change of area and volume in the period 2005 - 2009
Section Area change Volume change
(m2) (m3)
Unteraar
Z - 2 49’142 −932′354
2 - 3 −10′542′884
3 - 4 −10′841′994
4 - 5 −15′634′838
5 - 6 −17′391′325
6 - 7/10 −26′644′246
Lauteraar
7 - 8 −17′502′198
8 - 9 −12′622′687
Finsteraar
10 - 11 −16′849′564
11 - 12/13 −14′427′616
Section Area change Volume change
(m2) (m3)
Oberaar
Z - 15 12’908 −2′860′773
15 - 16 −6′968′261
16 - 17 −6′437′112
Unteraar −81′987′641
Lauteraar −30′124′885
Finsteraar −31′277′180
Oberaar −16′266′147
total −159′655′853
83
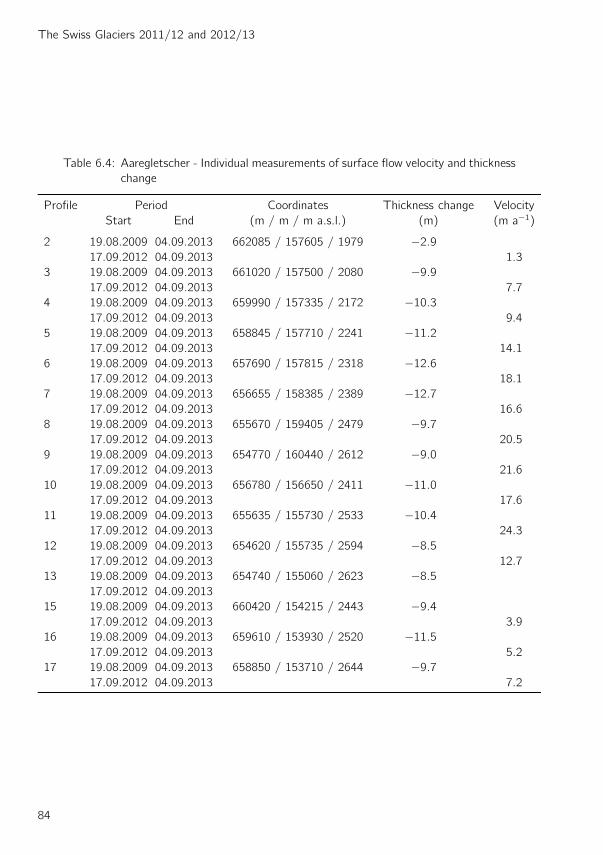
The Swiss Glaciers 2011/12 and 2012/13
Table 6.4: Aaregletscher - Individual measurements of surface flow velocity and thickness
change
Profile Period Coordinates Thickness change Velocity
Start End (m / m / m a.s.l.) (m) (m a−1)
2 19.08.2009 04.09.2013 662085 / 157605 / 1979 −2.9
17.09.2012 04.09.2013 1.3
3 19.08.2009 04.09.2013 661020 / 157500 / 2080 −9.9
17.09.2012 04.09.2013 7.7
4 19.08.2009 04.09.2013 659990 / 157335 / 2172 −10.3
17.09.2012 04.09.2013 9.4
5 19.08.2009 04.09.2013 658845 / 157710 / 2241 −11.2
17.09.2012 04.09.2013 14.1
6 19.08.2009 04.09.2013 657690 / 157815 / 2318 −12.6
17.09.2012 04.09.2013 18.1
7 19.08.2009 04.09.2013 656655 / 158385 / 2389 −12.7
17.09.2012 04.09.2013 16.6
8 19.08.2009 04.09.2013 655670 / 159405 / 2479 −9.7
17.09.2012 04.09.2013 20.5
9 19.08.2009 04.09.2013 654770 / 160440 / 2612 −9.0
17.09.2012 04.09.2013 21.6
10 19.08.2009 04.09.2013 656780 / 156650 / 2411 −11.0
17.09.2012 04.09.2013 17.6
11 19.08.2009 04.09.2013 655635 / 155730 / 2533 −10.4
17.09.2012 04.09.2013 24.3
12 19.08.2009 04.09.2013 654620 / 155735 / 2594 −8.5
17.09.2012 04.09.2013 12.7
13 19.08.2009 04.09.2013 654740 / 155060 / 2623 −8.5
17.09.2012 04.09.2013
15 19.08.2009 04.09.2013 660420 / 154215 / 2443 −9.4
17.09.2012 04.09.2013 3.9
16 19.08.2009 04.09.2013 659610 / 153930 / 2520 −11.5
17.09.2012 04.09.2013 5.2
17 19.08.2009 04.09.2013 658850 / 153710 / 2644 −9.7
17.09.2012 04.09.2013 7.2
84

6. Velocity
6.5 Mattmark
Introduction
The first ice flow velocity and mass balance measurements in the Mattmark area date back to 1955
(VAW, 1999; Antoni, 2005). Investigations were carried out with a network of up to 22 stakes on
the glaciers Allalin, Hohlaub, Kessjen, Schwarzberg and Talliboden. Currently, measurements are
continued on 11 selected stakes as part of the investigations by VAW/ETHZ for the Mattmark
hydro-power company (Figure 6.8). Figure 6.9 shows surface flow velocities on Allalingletscher.
4000
3800
3800
360036003600
34003400
3600
38003600
3400
3200
3200
3200
3000
2800
3200
3200
3400
3000
100
101103
105
106
110
120
123
124
6350
00
101000
6390
0098000
6350
00
95000
01km
Figure 6.8: Surface topography and observational network of the Mattmark glaciers.
Investigations in 2011/12
The measurement period at the stakes on Schwarzberggletscher, Hohlaub as well as those on Al-
lalingletscher began on 6th September 2011 and ended on 5th October 2012. Results for horizontal
85
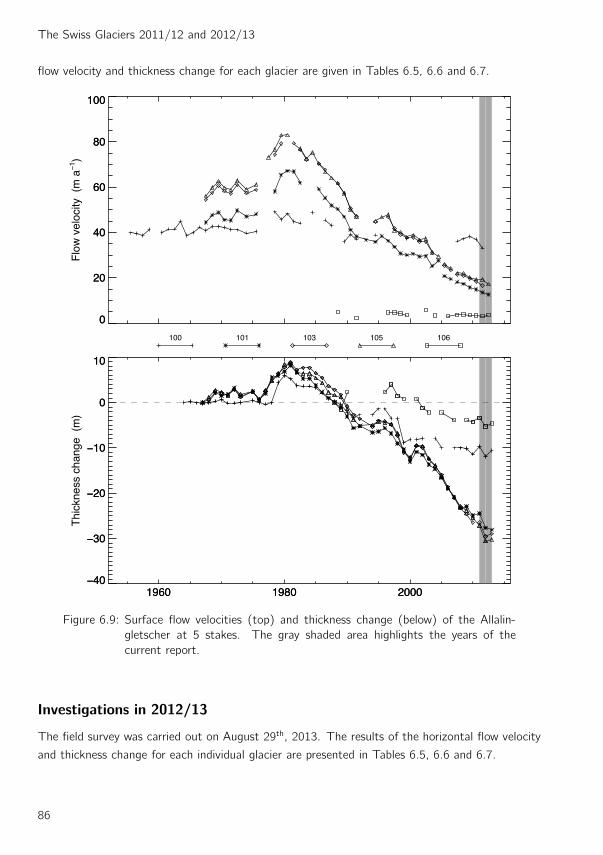
The Swiss Glaciers 2011/12 and 2012/13
flow velocity and thickness change for each glacier are given in Tables 6.5, 6.6 and 6.7.
0
20
40
60
80
100
Flo
w v
eloc
ity (
m a
)
0
20
40
60
80
100
100 101 103 105 106
1960 1980 2000
0
10
Thi
ckne
ss c
hang
e (
m)
1960 1980 2000
0
10
Figure 6.9: Surface flow velocities (top) and thickness change (below) of the Allalin-
gletscher at 5 stakes. The gray shaded area highlights the years of the
current report.
Investigations in 2012/13
The field survey was carried out on August 29th, 2013. The results of the horizontal flow velocity
and thickness change for each individual glacier are presented in Tables 6.5, 6.6 and 6.7.
86
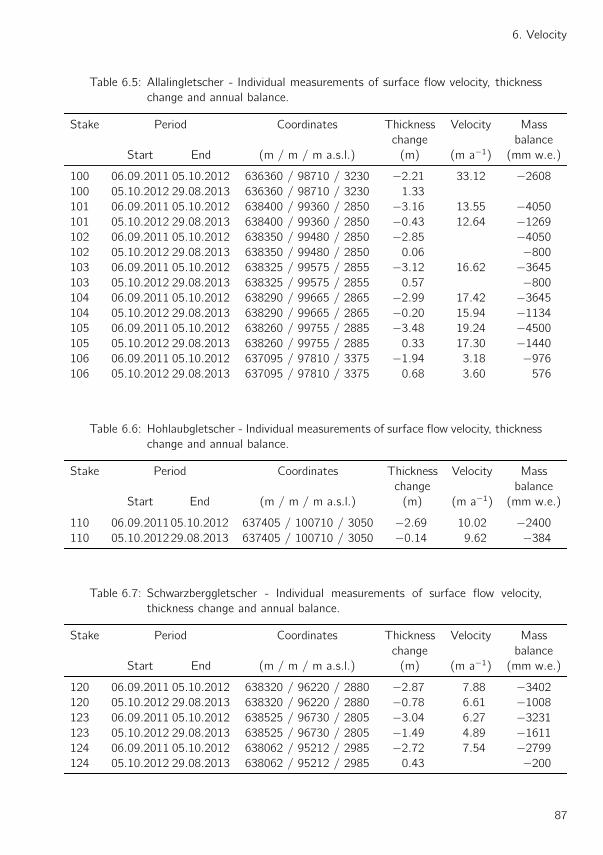
6. Velocity
Table 6.5: Allalingletscher - Individual measurements of surface flow velocity, thickness
change and annual balance.
Stake Period Coordinates Thickness Velocity Mass
change balance
Start End (m / m / m a.s.l.) (m) (m a−1) (mm w.e.)
100 06.09.2011 05.10.2012 636360 / 98710 / 3230 −2.21 33.12 −2608
100 05.10.2012 29.08.2013 636360 / 98710 / 3230 1.33
101 06.09.2011 05.10.2012 638400 / 99360 / 2850 −3.16 13.55 −4050
101 05.10.2012 29.08.2013 638400 / 99360 / 2850 −0.43 12.64 −1269
102 06.09.2011 05.10.2012 638350 / 99480 / 2850 −2.85 −4050
102 05.10.2012 29.08.2013 638350 / 99480 / 2850 0.06 −800
103 06.09.2011 05.10.2012 638325 / 99575 / 2855 −3.12 16.62 −3645
103 05.10.2012 29.08.2013 638325 / 99575 / 2855 0.57 −800
104 06.09.2011 05.10.2012 638290 / 99665 / 2865 −2.99 17.42 −3645
104 05.10.2012 29.08.2013 638290 / 99665 / 2865 −0.20 15.94 −1134
105 06.09.2011 05.10.2012 638260 / 99755 / 2885 −3.48 19.24 −4500
105 05.10.2012 29.08.2013 638260 / 99755 / 2885 0.33 17.30 −1440
106 06.09.2011 05.10.2012 637095 / 97810 / 3375 −1.94 3.18 −976
106 05.10.2012 29.08.2013 637095 / 97810 / 3375 0.68 3.60 576
Table 6.6: Hohlaubgletscher - Individual measurements of surface flow velocity, thickness
change and annual balance.
Stake Period Coordinates Thickness Velocity Mass
change balance
Start End (m / m / m a.s.l.) (m) (m a−1) (mm w.e.)
110 06.09.201105.10.2012 637405 / 100710 / 3050 −2.69 10.02 −2400
110 05.10.201229.08.2013 637405 / 100710 / 3050 −0.14 9.62 −384
Table 6.7: Schwarzberggletscher - Individual measurements of surface flow velocity,
thickness change and annual balance.
Stake Period Coordinates Thickness Velocity Mass
change balance
Start End (m / m / m a.s.l.) (m) (m a−1) (mm w.e.)
120 06.09.2011 05.10.2012 638320 / 96220 / 2880 −2.87 7.88 −3402
120 05.10.2012 29.08.2013 638320 / 96220 / 2880 −0.78 6.61 −1008
123 06.09.2011 05.10.2012 638525 / 96730 / 2805 −3.04 6.27 −3231
123 05.10.2012 29.08.2013 638525 / 96730 / 2805 −1.49 4.89 −1611
124 06.09.2011 05.10.2012 638062 / 95212 / 2985 −2.72 7.54 −2799
124 05.10.2012 29.08.2013 638062 / 95212 / 2985 0.43 −200
87
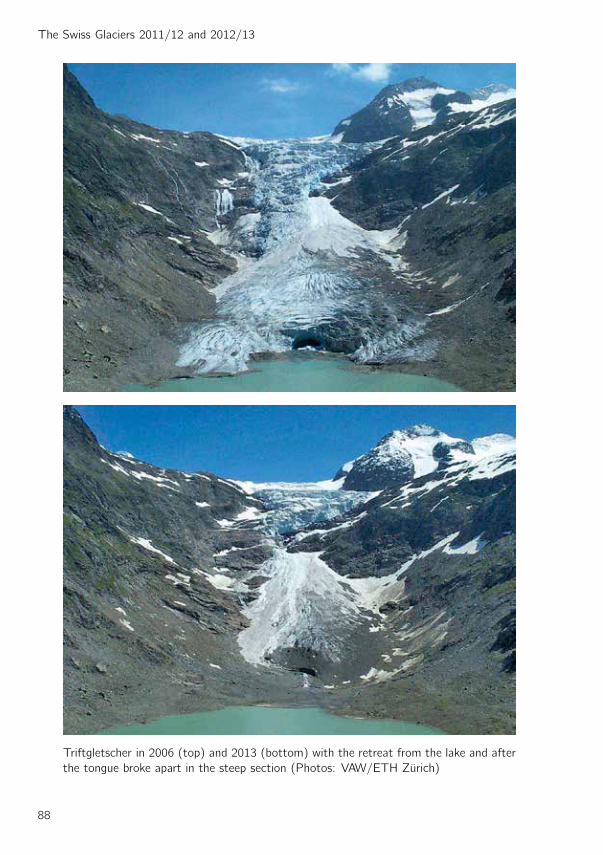
The Swiss Glaciers 2011/12 and 2012/13
Triftgletscher in 2006 (top) and 2013 (bottom) with the retreat from the lake and after
the tongue broke apart in the steep section (Photos: VAW/ETH Zurich)
88
References
Antoni, C. (2005). Langjahrige Messreihen in den Schweizer Alpen. Praktikumsararbeit ausgefuhrt
an der VAW, ETH Zurich, unter Anleitung von A. Bauder (unveroffentlicht).
Bamber, J. L. and Rivera, A. (2007). A review of remote sensing methods for glacier mass balance
determination. Global and Planetary Change, 55(1-4):138–148.
Bauder, A., Funk, M., and Bosch, H. (2002). Glaziologische Untersuchungen am Glacier de
Gietro im Zusammenhang mit der Sicherheit der Stauanlage Mauvoisin. In Moderne Methoden
und Konzepte im Wasserbau, volume 175, (Band 2), pages 419–431. Mitteilung der Versuch-
sanstalt fur Wasserbau, Hydrologie und Glaziologie, ETH Zurich. Internationales Symposium
7.-9. Oktober 2002 in Zurich.
Bauder, A., Funk, M., and Huss, M. (2007). Ice volume changes of selected glaciers in the Swiss
Alps since the end of the 19th century. Annals of Glaciology, 46:145–149.
Begert, M., Schlegel, T., and Kirchhofer, W. (2005). Homogeneous temperature and precipitation
series of switzerland from 1864 to 2000. International Journal of Climatology, 25(1):65–80.
Cogley, J. G. (2009). Geodetic and direct mass balance measurements: comparison and joint
analysis. Annals of Glaciology, 50(50):96–100.
Finger, D., Hugentobler, A., Huss, M., Voinesco, A., Wernli, H., Fischer, D., Weber, E., Jeannin,
P.-Y., Kauzlaric, M., Wirz, A., Vennemann, T., Husler, F., Schadler, B., and Weingartner, R.
(2013). Identification of glacial melt water runoff in a karstic environment and its implication for
present and future water availability. Hydrology and Earth System Sciences, 17(8):3261–3277.
Firnberichte (1914–1978). Der Firnzuwachs 1913/14–1976/77 in einigen schweizerischen Firnge-
bieten, number 1-64 in Vierteljahrsschrift der Naturforschenden Gesellschaft in Zurich. Jahres-
berichte herausgegeben von der Gletscher-Kommission der Physikalischen Gesellschaft Zurich,
spater Schweizerische Meteorologische Zentralanstalt und ab 1973 durch A. Lemans.
Fischer, M., Huss, M., Barboux, C., and Hoelzle, M. (2014). The new swiss glacier inventory
SGI2010: Relevance of using high-resolution source data in areas dominated by very small
glaciers. Arctic, Antarctic, and Alpine Research, 46(4):933–945.
Fischer, M., Huss, M., and Hoelzle, M. (2013). Recent changes of very small glaciers in the swiss
alps. Geophysical Research Abstracts, 15:EGU2013–149. EGU General Assembly 2013.
Fischer, M., Huss, M., and Hoelzle, M. (2015). Surface elevation and mass changes of all Swiss
glaciers 1980–2010. The Cryosphere, 9(2):525–540.
Flotron (1924–2010). Vermessung der Aaregletscher. Jahrliche Berichte im Auftrag der Kraftwerke
Oberhasli AG (unveroffentlicht).
89
The Swiss Glaciers 2011/12 and 2012/13
Flotron, A. (1979). Verschiebungsmessungen aus Luftbildern. In Festschrift Peter Kasser, vol-
ume 41, pages 39–44. Mitteilungen der Versuchsanstalt fur Wasserbau, Hydrologie und Glazi-
ologie, Gloriastrasse 37-39, CH-8092 Zurich.
Gardner, A. S., Moholdt, G., Cogley, J. G., Wouters, B., Arendt, A. A., Wahr, J., Berthier, E.,
Hock, R., Pfeffer, W. T., Kaser, G., Ligtenberg, S. R. M., Bolch, T., Sharp, M. J., Hagen, J. O.,
van den Broeke, M. R., and Paul, F. (2013). A reconciled estimate of glacier contributions to
sea level rise: 2003 to 2009. Science, 340(6134):852–857.
Glaciological reports (1881–2015). The Swiss Glaciers, 1880–2010/11. Yearbooks 1-
132, Cryospheric Commission of the Swiss Academy of Sciences (SCNAT). published
since 1964 by Laboratory of Hydraulics, Hydrology and Glaciology (VAW) of ETH Zurich,
http://glaciology.ethz.ch/swiss-glaciers/.
Hoelzle, M., Haeberli, W., Dischl, M., and Peschke, W. (2003). Secular glacier mass balances
derived from cumulative glacier length changes. Global and Planetary Change, 36(4):295–306.
Huss, M. (2010). Mass balance of Pizolgletscher. Geographica Helvetica, 65(2):80–91.
Huss, M. (2013). Density assumptions for converting geodetic glacier volume change to mass
change. The Cryosphere, 7(3):877–887.
Huss, M. and Bauder, A. (2009). 20th-century climate change inferred from four long-term point
observations of seasonal mass balance. Annals of Glaciology, 50(50):207–214.
Huss, M., Bauder, A., and Funk, M. (2009). Homogenization of long-term mass-balance time
series. Annals of Glaciology, 50(50):198–206.
Huss, M., Sold, L., Hoelzle, M., Stokvis, M., Salzmann, N., Farinotti, D., and Zemp, M.
(2013). Towards remote monitoring of sub-seasonal glacier mass balance. Annals of Glaciology,
54(63):75–83.
Kaab, A. (1996). Photogrammetrische Analyse zur Fruherkennung gletscher- und permafrostbe-
dingter Naturgefahren im Hochgebirge. Mitteilungen 145, Versuchsanstalt fur Wasserbau, Hy-
drologie und Glaziologie der ETH Zurich, Gloriastrasse 37-39, CH-8092 Zurich. pp. 182.
Kasser, P., Aellen, M., and Siegenthaler, H. (1986). Clariden. In Die Gletscher der Schweizer
Alpen, 1977/78 und 1978/79, volume 99/100 of Glaziologisches Jahrbuch der Gletscherkom-
mission SNG, pages 142–148. Versuchsanstalt fur Wasserbau, Hydrologie und Glaziologie der
ETH Zurich.
Kasser, P. and Rothlisberger, H. (1966). Some problems of glacier mapping experienced with the
1:10’000 map of the Aletsch Glacier. Canadian Journal of Earth Sciences, 3(6):799–809.
Machguth, H. (2008). On the Use of RCM Data and Gridded Climatologies for Regional Scale
Glacier Mass Balance Modeling in High Mountain Topography; The Example of the Swiss Alps.
PhD thesis, University of Zurich. 196 pp.
Mercanton, P. L. (1916). Vermessungen am Rhonegletscher, Mensurations au Glacier du Rhone,
1874–1915. Neue Denkschriften der Schweizerischen Naturforschenden Gesellschaft, 52.
Muller, H. and Kappenberger, G. (1991). Claridenfirn-Messungen 1914-1984. Technical Report 40,
Zurcher Geographische Schriften, Geographisches Institut der ETH Zurich. pp. 79.
90
6. REFERENCES
Naegeli, K., Damm, A., Huss, M., Schaepman, M., and Hoelzle, M. (2015). Imaging spectroscopy
to assess the composition of ice surface materials and their impact on glacier mass balance.
Remote Sensing of Environment, 168:388–402.
Ohmura, A., Bauder, A., Muller, H., and Kappenberger, G. (2007). Long-term change of mass
balance and the role of radiation. Annals of Glaciology, 46:367–374.
Raymond, M., Wegmann, M., and Funk, M. (2003). Inventar gefahrlicher Gletscher in der Schweiz.
Mitteilungen 182, Versuchsanstalt fur Wasserbau, Hydrologie und Glaziologie der ETH Zurich,
Gloriastrasse 37-39, CH-8092 Zurich. pp. 368.
Signer, N. (2014). Analysis of ice temperatures of four selected very small glaciers in the Swiss Alps
by means of modelling and ground penetrating radar. MSc thesis (unpublished), Department of
Geography, Universitat Zurich.
Sold, L., Huss, M., Eichler, A., Schwikowski, M., and Hoelzle, M. (2015). Unlocking annual firn
layer water equivalents from ground-penetrating radar data on an Alpine glacier. The Cryosphere,
9(3):1075–1087.
VAW (1997). Gletscherveranderungen im Val de Bagnes 1966 – 1996. Untersuchungen im
Zusammenhang mit den Anlagen der Kraftwerke Mauvoisin AG. Zusammenfassend dargestellte
Hauptergebnisse der jahrlichen Messungen. Bericht Nr. 7903.55.04 (M. Aellen, unveroffentlicht).
Im Auftrag der Kraftwerke Mauvoisin AG.
VAW (1998). Mauvoisin – Gietrogletscher – Corbassieregletscher. Glaziologische Studien im
Zusammenhang mit den Stauanlagen Mauvoisin. Bericht Nr. 55.05.7903 (M. Funk, un-
veroffentlicht). Im Auftrag der Elektrizitatsgesellschaft Lauffenburg AG.
VAW (1999). Mattmark – Zusammenfassender Bericht uber die hydrologischen und glaziologis-
chen Messungen im Mattmarkgebiet. Bericht Nr. 7902.52.45 (H. Bosch und M. Funk, un-
veroffentlicht), Versuchsanstalt fur Wasserbau, Hydrologie und Glaziologie der ETH Zurich. Im
Auftrag der Kraftwerke Mattmark AG.
WGMS (2013). Glacier Mass Balance Bulletin No. 12, (2010–2011). ICSU(FAGS)–IUGG(IACS)–
UNEP–UNESCO–WMO, World Glacier Monitoring Service, Zurich.
91
Acknowledgements
The Cryospheric Commission again received solid support in this 133rd/134th measuring period
from its reliable team of observers. Sincere thanks for their cooperation are extended to: the
forestry services from the cantons of Berne, Glarus, Grisons, Obwalden, St. Gallen, Uri, Ticino,
Vaud and Wallis, the staff of the hydro-power stations Aegina, Mattmark and, Mauvoisin, all the
individual helpers, the Aerial Photography Flying and Coordination Service (CCAP) of the Swiss
Federal Office of Topography swisstopo and Flotron AG (Gumligen). The Laboratory of Hydraulics,
Hydrology and Glaciology (VAW) of the ETH Zurich, colleagues from the national weather service
MeteoSwiss, the Geographical Institutes of the University of Fribourg and Zurich provided valuable
contributions to the publication of this glaciological report. A special vote of thanks goes to Susan
Braun-Clarke for translating and proof-reading the report.
92
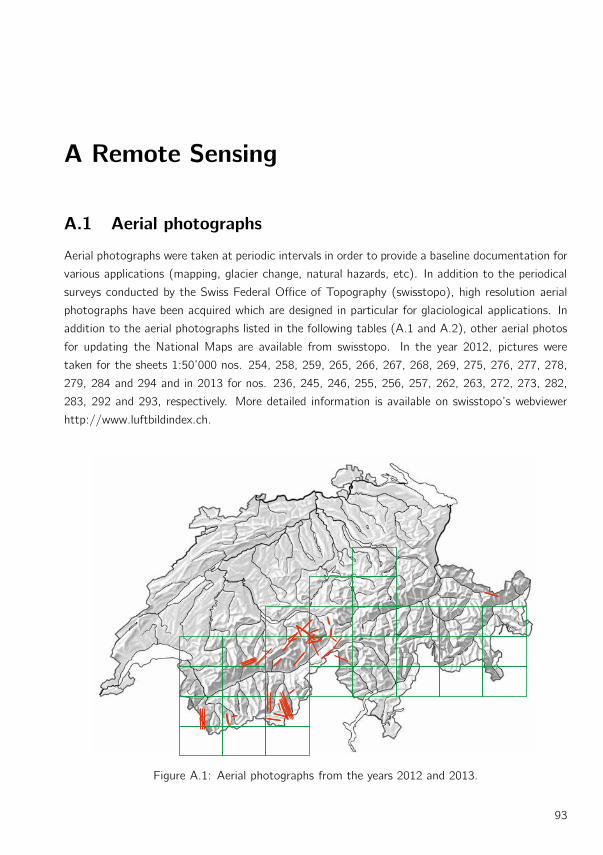
A Remote Sensing
A.1 Aerial photographs
Aerial photographs were taken at periodic intervals in order to provide a baseline documentation for
various applications (mapping, glacier change, natural hazards, etc). In addition to the periodical
surveys conducted by the Swiss Federal Office of Topography (swisstopo), high resolution aerial
photographs have been acquired which are designed in particular for glaciological applications. In
addition to the aerial photographs listed in the following tables (A.1 and A.2), other aerial photos
for updating the National Maps are available from swisstopo. In the year 2012, pictures were
taken for the sheets 1:50’000 nos. 254, 258, 259, 265, 266, 267, 268, 269, 275, 276, 277, 278,
279, 284 and 294 and in 2013 for nos. 236, 245, 246, 255, 256, 257, 262, 263, 272, 273, 282,
283, 292 and 293, respectively. More detailed information is available on swisstopo’s webviewer
http://www.luftbildindex.ch.
Figure A.1: Aerial photographs from the years 2012 and 2013.
93
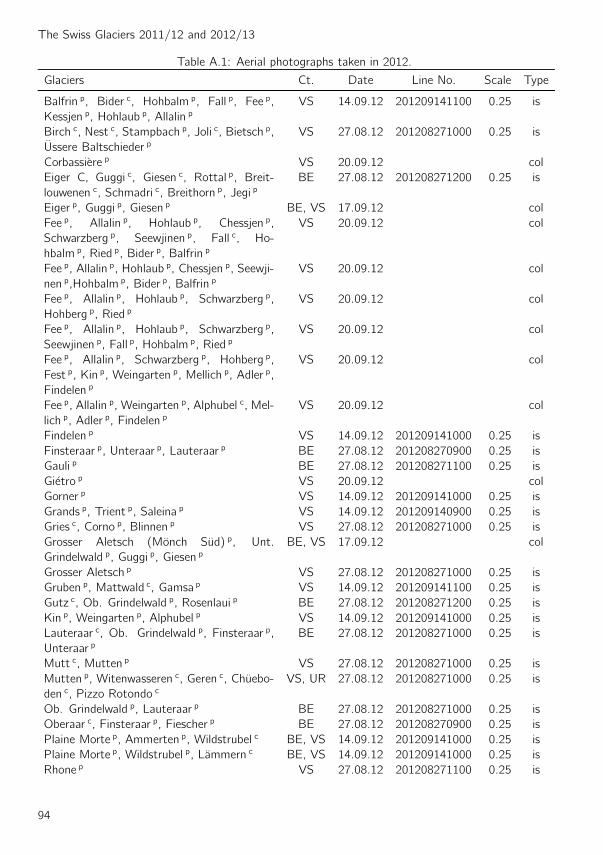
The Swiss Glaciers 2011/12 and 2012/13
Table A.1: Aerial photographs taken in 2012.
Glaciers Ct. Date Line No. Scale Type
Balfrin p, Bider c, Hohbalm p, Fall p, Fee p,
Kessjen p, Hohlaub p, Allalin pVS 14.09.12 201209141100 0.25 is
Birch c, Nest c, Stampbach p, Joli c, Bietsch p,
Ussere Baltschieder pVS 27.08.12 201208271000 0.25 is
Corbassiere p VS 20.09.12 col
Eiger C, Guggi c, Giesen c, Rottal p, Breit-
louwenen c, Schmadri c, Breithorn p, Jegi pBE 27.08.12 201208271200 0.25 is
Eiger p, Guggi p, Giesen p BE, VS 17.09.12 col
Fee p, Allalin p, Hohlaub p, Chessjen p,
Schwarzberg p, Seewjinen p, Fall c, Ho-
hbalm p, Ried p, Bider p, Balfrin p
VS 20.09.12 col
Fee p, Allalin p, Hohlaub p, Chessjen p, Seewji-
nen p,Hohbalm p, Bider p, Balfrin pVS 20.09.12 col
Fee p, Allalin p, Hohlaub p, Schwarzberg p,
Hohberg p, Ried pVS 20.09.12 col
Fee p, Allalin p, Hohlaub p, Schwarzberg p,
Seewjinen p, Fall p, Hohbalm p, Ried pVS 20.09.12 col
Fee p, Allalin p, Schwarzberg p, Hohberg p,
Fest p, Kin p, Weingarten p, Mellich p, Adler p,
Findelen p
VS 20.09.12 col
Fee p, Allalin p, Weingarten p, Alphubel c, Mel-
lich p, Adler p, Findelen pVS 20.09.12 col
Findelen p VS 14.09.12 201209141000 0.25 is
Finsteraar p, Unteraar p, Lauteraar p BE 27.08.12 201208270900 0.25 is
Gauli p BE 27.08.12 201208271100 0.25 is
Gietro p VS 20.09.12 col
Gorner p VS 14.09.12 201209141000 0.25 is
Grands p, Trient p, Saleina p VS 14.09.12 201209140900 0.25 is
Gries c, Corno p, Blinnen p VS 27.08.12 201208271000 0.25 is
Grosser Aletsch (Monch Sud) p, Unt.
Grindelwald p, Guggi p, Giesen pBE, VS 17.09.12 col
Grosser Aletsch p VS 27.08.12 201208271000 0.25 is
Gruben p, Mattwald c, Gamsa p VS 14.09.12 201209141100 0.25 is
Gutz c, Ob. Grindelwald p, Rosenlaui p BE 27.08.12 201208271200 0.25 is
Kin p, Weingarten p, Alphubel p VS 14.09.12 201209141000 0.25 is
Lauteraar c, Ob. Grindelwald p, Finsteraar p,
Unteraar pBE 27.08.12 201208271000 0.25 is
Mutt c, Mutten p VS 27.08.12 201208271000 0.25 is
Mutten p, Witenwasseren c, Geren c, Chuebo-
den c, Pizzo Rotondo cVS, UR 27.08.12 201208271000 0.25 is
Ob. Grindelwald p, Lauteraar p BE 27.08.12 201208271000 0.25 is
Oberaar c, Finsteraar p, Fiescher p BE 27.08.12 201208270900 0.25 is
Plaine Morte p, Ammerten p, Wildstrubel c BE, VS 14.09.12 201209141000 0.25 is
Plaine Morte p, Wildstrubel p, Lammern c BE, VS 14.09.12 201209141000 0.25 is
Rhone p VS 27.08.12 201208271100 0.25 is
94
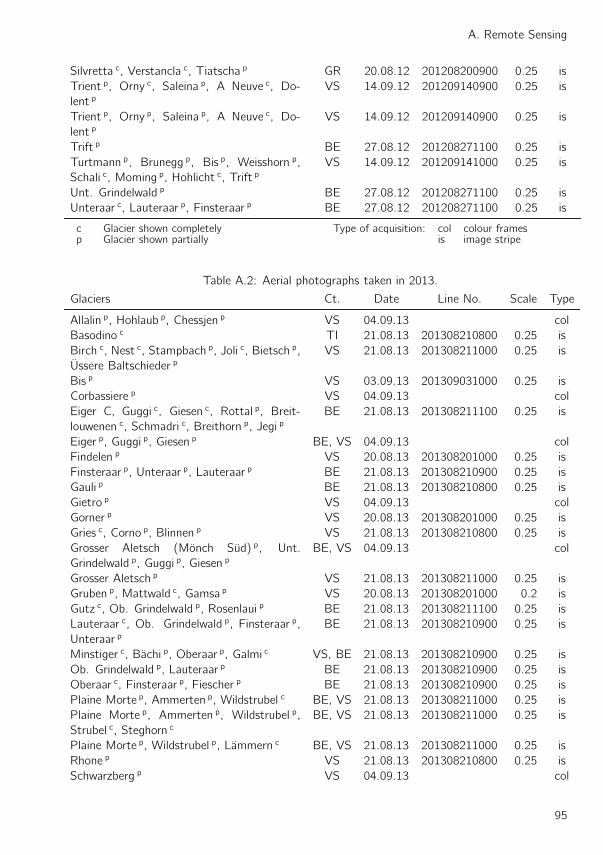
A. Remote Sensing
Silvretta c, Verstancla c, Tiatscha p GR 20.08.12 201208200900 0.25 is
Trient p, Orny c, Saleina p, A Neuve c, Do-
lent pVS 14.09.12 201209140900 0.25 is
Trient p, Orny p, Saleina p, A Neuve c, Do-
lent pVS 14.09.12 201209140900 0.25 is
Trift p BE 27.08.12 201208271100 0.25 is
Turtmann p, Brunegg p, Bis p, Weisshorn p,
Schali c, Moming p, Hohlicht c, Trift pVS 14.09.12 201209141000 0.25 is
Unt. Grindelwald p BE 27.08.12 201208271100 0.25 is
Unteraar c, Lauteraar p, Finsteraar p BE 27.08.12 201208271100 0.25 is
c Glacier shown completely Type of acquisition: col colour framesp Glacier shown partially is image stripe
Table A.2: Aerial photographs taken in 2013.
Glaciers Ct. Date Line No. Scale Type
Allalin p, Hohlaub p, Chessjen p VS 04.09.13 col
Basodino c TI 21.08.13 201308210800 0.25 is
Birch c, Nest c, Stampbach p, Joli c, Bietsch p,
Ussere Baltschieder pVS 21.08.13 201308211000 0.25 is
Bis p VS 03.09.13 201309031000 0.25 is
Corbassiere p VS 04.09.13 col
Eiger C, Guggi c, Giesen c, Rottal p, Breit-
louwenen c, Schmadri c, Breithorn p, Jegi pBE 21.08.13 201308211100 0.25 is
Eiger p, Guggi p, Giesen p BE, VS 04.09.13 col
Findelen p VS 20.08.13 201308201000 0.25 is
Finsteraar p, Unteraar p, Lauteraar p BE 21.08.13 201308210900 0.25 is
Gauli p BE 21.08.13 201308210800 0.25 is
Gietro p VS 04.09.13 col
Gorner p VS 20.08.13 201308201000 0.25 is
Gries c, Corno p, Blinnen p VS 21.08.13 201308210800 0.25 is
Grosser Aletsch (Monch Sud) p, Unt.
Grindelwald p, Guggi p, Giesen pBE, VS 04.09.13 col
Grosser Aletsch p VS 21.08.13 201308211000 0.25 is
Gruben p, Mattwald c, Gamsa p VS 20.08.13 201308201000 0.2 is
Gutz c, Ob. Grindelwald p, Rosenlaui p BE 21.08.13 201308211100 0.25 is
Lauteraar c, Ob. Grindelwald p, Finsteraar p,
Unteraar pBE 21.08.13 201308210900 0.25 is
Minstiger c, Bachi p, Oberaar p, Galmi c VS, BE 21.08.13 201308210900 0.25 is
Ob. Grindelwald p, Lauteraar p BE 21.08.13 201308210900 0.25 is
Oberaar c, Finsteraar p, Fiescher p BE 21.08.13 201308210900 0.25 is
Plaine Morte p, Ammerten p, Wildstrubel c BE, VS 21.08.13 201308211000 0.25 is
Plaine Morte p, Ammerten p, Wildstrubel p,
Strubel c, Steghorn cBE, VS 21.08.13 201308211000 0.25 is
Plaine Morte p, Wildstrubel p, Lammern c BE, VS 21.08.13 201308211000 0.25 is
Rhone p VS 21.08.13 201308210800 0.25 is
Schwarzberg p VS 04.09.13 col
95
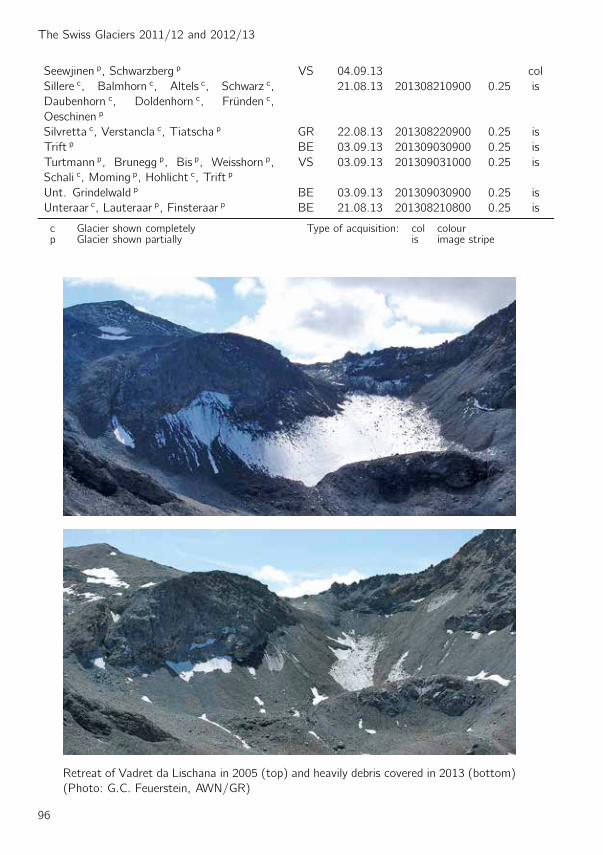
The Swiss Glaciers 2011/12 and 2012/13
Seewjinen p, Schwarzberg p VS 04.09.13 col
Sillere c, Balmhorn c, Altels c, Schwarz c,
Daubenhorn c, Doldenhorn c, Frunden c,
Oeschinen p
21.08.13 201308210900 0.25 is
Silvretta c, Verstancla c, Tiatscha p GR 22.08.13 201308220900 0.25 is
Trift p BE 03.09.13 201309030900 0.25 is
Turtmann p, Brunegg p, Bis p, Weisshorn p,
Schali c, Moming p, Hohlicht c, Trift pVS 03.09.13 201309031000 0.25 is
Unt. Grindelwald p BE 03.09.13 201309030900 0.25 is
Unteraar c, Lauteraar p, Finsteraar p BE 21.08.13 201308210800 0.25 is
c Glacier shown completely Type of acquisition: col colourp Glacier shown partially is image stripe
Retreat of Vadret da Lischana in 2005 (top) and heavily debris covered in 2013 (bottom)
(Photo: G.C. Feuerstein, AWN/GR)
96
B Remarks on Individual Glaciers
1 Rhone
2012: Luftbildaufnahmen am 27.8.2012, photogrammetrische Auswertung durch VAW/ETHZ.
(VAW/ETHZ – A. Bauder)
2013: Luftbildaufnahmen am 23.9.2013, photogrammetrische Auswertung durch VAW/ETHZ.
(VAW/ETHZ – A. Bauder)
3 Gries
2012: Luftbildaufnahmen am 27.8.2012, photogrammetrische Auswertung durch VAW/ETHZ.
(VAW/ETHZ – A. Bauder)
2013: Luftbildaufnahmen am 21.8.2013, photogrammetrische Auswertung durch VAW/ETHZ.
(VAW/ETHZ – A. Bauder)
4 Fiescher
2012: Der Gletscher ist im mittleren Bereich stark zuruckgegangen. (P. Aschilier)
2013: Distanzen ausserhalb Messbereich des verwendeten elektronischen Distanzmessers.
Keine Messung moglich. (P. Aschilier)
5 Grosser Aletsch
2012: Luftbildaufnahmen am 27.8.2012, photogrammetrische Auswertung durch VAW/ETHZ.
(VAW/ETHZ – A. Bauder)
2013: Luftbildaufnahmen am 21.8.2013, photogrammetrische Auswertung durch VAW/ETHZ.
(VAW/ETHZ – A. Bauder)
7 Kaltwasser
2012: Kleiner Ruckgang gegenuber 2011 (M. Schmidhalter)
10 Schwarzberg
2012: Luftbildaufnahmen am 20.9.2012, photogrammetrische Auswertung durch VAW/ETHZ
im Auftrag der Kraftwerke Mattmark AG. (VAW/ETHZ – A. Bauder)
2013: Luftbildaufnahmen am 4.9.2013, photogrammetrische Auswertung durch VAW/ETHZ
im Auftrag der Kraftwerke Mattmark AG. (VAW/ETHZ – A. Bauder)
97
The Swiss Glaciers 2011/12 and 2012/13
11 Allalin
2012: Luftbildaufnahmen am 20.9.2012, photogrammetrische Auswertung durch VAW/ETHZ
im Auftrag der Kraftwerke Mattmark AG. (VAW/ETHZ – A. Bauder)
2013: Luftbildaufnahmen am 4.9.2013, photogrammetrische Auswertung durch VAW/ETHZ
im Auftrag der Kraftwerke Mattmark AG. (VAW/ETHZ – A. Bauder)
12 Chessjen
2012: Luftbildaufnahmen am 20.9.2012, photogrammetrische Auswertung durch VAW/ETHZ
im Auftrag der Kraftwerke Mattmark AG. (VAW/ETHZ – A. Bauder)
2013: Luftbildaufnahmen am 4.9.2013, photogrammetrische Auswertung durch VAW/ETHZ
im Auftrag der Kraftwerke Mattmark AG. (VAW/ETHZ – A. Bauder)
14 Gorner
2012: Hinter dem Gletschertor gibt es wieder ein Loch von ca. 150x25m. (S. Walther)
16 Findelen
2012: Luftbildaufnahmen am 14.9.2012, photogrammetrische Auswertung durch VAW/ETHZ.
(VAW/ETHZ – A. Bauder)
2013: Luftbildaufnahmen am 13.8.2013, photogrammetrische Auswertung durch VAW/ETHZ.
(VAW/ETHZ – A. Bauder)
17 Ried
2013: Gletscherende nur noch knapp einsehbar vom Fixpunkt aus. (P. Rovina)
18 Lang
2013: Einsturz des Gletschertors im Sommer 2013. (H. Henzen)
19 Turtmann
2012: Grosser Ruckzug, an Gletscherrand ist noch eine schmale Zunge vorhanden. (A. Brig-
ger)
2013: Unterer Teil des Gletschers wird in wenigen Jahren vom Eiskorper oberhalb des Fels-
bandes abgetrennt sein. (A. Brigger)
20 Brunegg
2013: Toteis gemass Messung 2011 im Vorfeld der Gletscherzunge ist vollstandig verschwun-
den. (A.Brigger)
22 Zinal
2012: Changement de methode de mesure (GPS) et des points de reference. Le recul est
calcule depuis 2010. (P. Stoebener)
98
B. Remarks on Individual Glaciers
23 Moming
2012: Recul mesure sur la moyenne de 2 mesures depuis cette annee. (P. Stoebener)
24 Moiry
2012: Changement de methode de mesure et des points de reference. Le recul est calcule
depuis 2010. (P. Stoebener)
25 Ferpecle
2012: Depuis cette annee le recul est calcule sur la moyenne de 2 mesures. (F. Pralong)
26 Mont-Mine
2012: Depuis cette annee le recul est calcule sur la moyenne de 2 mesures. (F. Pralong)
27 Arolla
2012: Changement de l’axe de mesure, l’ancien n’etant plus representatif. (F. Pralong)
28 Tsijdere Nouve
2012: Le recul a ete mesure sur une moyenne de 3 points. Jusqu’a present il n’etait mesure
que sur le point 2. (F. Pralong)
29 Cheillon
2012: Le petit lac s’agrandit (O. Bourdin)
2013: Grosse fonte de glace face au point 1, due a la reverberation de l’affleurement rocheux.
(O. Bourdin)
30 En Darrey
2012: Les 2 parties du glacier sont completement autonomes. (O. Bourdin)
2013: Les 2 parties du glacier sont autonomes. (O. Bourdin)
31 Grand Desert
2013: Entre les points B et 3, on constate une caverne dans la langue glaciaire. (F. Vouilla-
moz)
32 Mont-Fort/Tortin
2013: Proglazialer See hat sich weiter ausgedehnt. (A.Bauder)
33 Tsanfleuron
2012: Depuis cette annee moyenne sur 2 mesures (P. Stoebener)
34 Otemma
2012: Grosse crue, plus un seul repere proche, donc reneir a mon vieux Pt 15/95 a 800m
en aval du glacier pour etablir le Pt 18/12 sur le bedrock apparut devant le front. Le portail
99
The Swiss Glaciers 2011/12 and 2012/13
gauche a pratiquement disparu et la langue du glacier est toujours plus mince, par contre
sous la caillasse et les blocs de rocher des 2 rives direction aval, la glace est encore bien la.
(J.-J. Chabloz)
2013: Tres forte diminution de la glace sous les moraines laterales, le socle rocheux est bien
visible rive droite (nouveau Pt 19/13). Le front du glacier est toujours plus mince et le portail
gauche est pratiquement inexistant. (J.-J. Chabloz)
35 Mont Durand
2012: Le trou au-dessus du front se creuse tellement qu’il va faire seffondrer la voute du
portail, a moins que? Plus haut le bedrock apparaıt toujours plus et le torrent fait une belle
cascade avant de s’engouffrer sous la partie inferieure du glacier. (J.-J. Chabloz)
2013: La voute du portail s’est effondree avec une partie du glacier. Le front se trouve a la
jonction de l’amas rocheux au centre du glacier voir pratiquement au niveau de la base du
ressaut central et d’ici peu le glacier sera separe en deux bras, visee bloquee contre le bedrock.
Crue tres importante, beaucoup de rochers sur la glace. Rive droite sous le premier plateau
bedrock bien degage maintenant entre le torrent et la langue du glacier. (J.-J. Chabloz)
36 Brenay
2012: Les 2 rives du glacier sont couvertes de caillasse et de blocs. La langue centrale denudee
s’aplatit toujours plus et recule. (J.-J. Chabloz)
2013: Tres forte diminution de la glace sous les moraines laterales et recul tres marque du
front. La langue est completement amincie et pratiquement libre de blocs de rochers qui
jonchent maintenant le plateau a l’aval du glacier. Plus en amont au niveau des seracs du
Brenay ainsi que la rive droite sous la Serpentine, le bedrock est bien visible. (J.-J. Chabloz)
37 Gietro
2012: Luftbildaufnahmen am 20.9.2012, photogrammetrische Auswertung durch Flotron AG
im Auftrag der Forces Motrices de Mauvoisin SA. Bestimmung der Langenanderung durch
die VAW/ETHZ. (VAW/ETHZ – A. Bauder)
2013: Luftbildaufnahmen am 4.9.2013, photogrammetrische Auswertung durch Flotron AG
im Auftrag der Forces Motrices de Mauvoisin SA. Bestimmung der Langenanderung durch
die VAW/ETHZ. (VAW/ETHZ – A. Bauder)
38 Corbassiere
2012: Luftbildaufnahmen am 20.9.2012, photogrammetrische Auswertung durch VAW/ETHZ
im Auftrag der Forces Motrices de Mauvoisin SA. (VAW/ETHZ – A. Bauder)
2013: Luftbildaufnahmen am 13.8.2013, photogrammetrische Auswertung durch VAW/ETHZ
im Auftrag der Forces Motrices de Mauvoisin SA. (VAW/ETHZ – A. Bauder)
39 Valsorey
2012: La largeur de la langue frontale est de 12m, elle se prolonge sous les eboulis en rive
droite probablement d’une dizaine de metres. L’epaisseur de la langue est de 0.6m. L’angle
de la langue est de 32◦. (J. Medico)
100
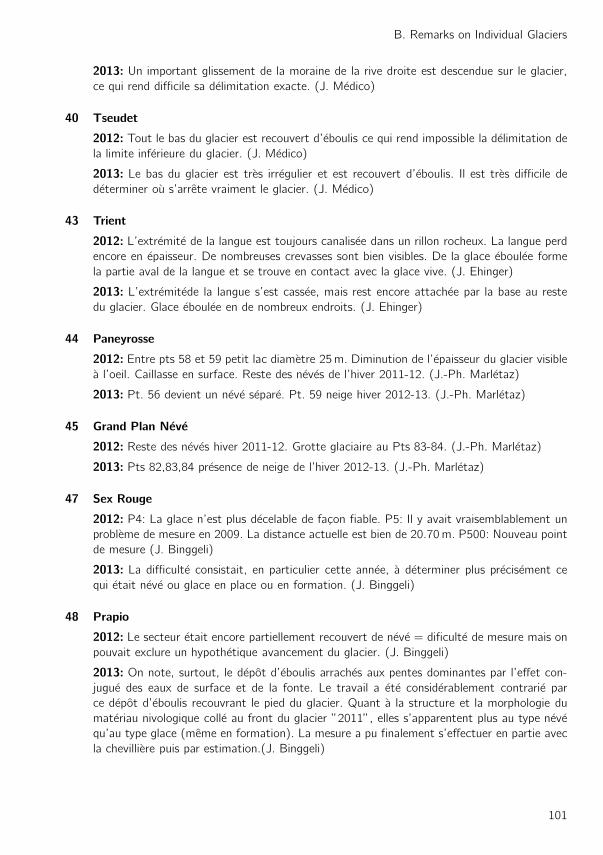
B. Remarks on Individual Glaciers
2013: Un important glissement de la moraine de la rive droite est descendue sur le glacier,
ce qui rend difficile sa delimitation exacte. (J. Medico)
40 Tseudet
2012: Tout le bas du glacier est recouvert d’eboulis ce qui rend impossible la delimitation de
la limite inferieure du glacier. (J. Medico)
2013: Le bas du glacier est tres irregulier et est recouvert d’eboulis. Il est tres difficile de
determiner ou s’arrete vraiment le glacier. (J. Medico)
43 Trient
2012: L’extremite de la langue est toujours canalisee dans un rillon rocheux. La langue perd
encore en epaisseur. De nombreuses crevasses sont bien visibles. De la glace eboulee forme
la partie aval de la langue et se trouve en contact avec la glace vive. (J. Ehinger)
2013: L’extremitede la langue s’est cassee, mais rest encore attachee par la base au reste
du glacier. Glace eboulee en de nombreux endroits. (J. Ehinger)
44 Paneyrosse
2012: Entre pts 58 et 59 petit lac diametre 25m. Diminution de l’epaisseur du glacier visible
a l’oeil. Caillasse en surface. Reste des neves de l’hiver 2011-12. (J.-Ph. Marletaz)
2013: Pt. 56 devient un neve separe. Pt. 59 neige hiver 2012-13. (J.-Ph. Marletaz)
45 Grand Plan Neve
2012: Reste des neves hiver 2011-12. Grotte glaciaire au Pts 83-84. (J.-Ph. Marletaz)
2013: Pts 82,83,84 presence de neige de l’hiver 2012-13. (J.-Ph. Marletaz)
47 Sex Rouge
2012: P4: La glace n’est plus decelable de facon fiable. P5: Il y avait vraisemblablement un
probleme de mesure en 2009. La distance actuelle est bien de 20.70m. P500: Nouveau point
de mesure (J. Binggeli)
2013: La difficulte consistait, en particulier cette annee, a determiner plus precisement ce
qui etait neve ou glace en place ou en formation. (J. Binggeli)
48 Prapio
2012: Le secteur etait encore partiellement recouvert de neve = dificulte de mesure mais on
pouvait exclure un hypothetique avancement du glacier. (J. Binggeli)
2013: On note, surtout, le depot d’eboulis arraches aux pentes dominantes par l’effet con-
jugue des eaux de surface et de la fonte. Le travail a ete considerablement contrarie par
ce depot d’eboulis recouvrant le pied du glacier. Quant a la structure et la morphologie du
materiau nivologique colle au front du glacier ”2011”, elles s’apparentent plus au type neve
qu’au type glace (meme en formation). La mesure a pu finalement s’effectuer en partie avec
la chevilliere puis par estimation.(J. Binggeli)
101
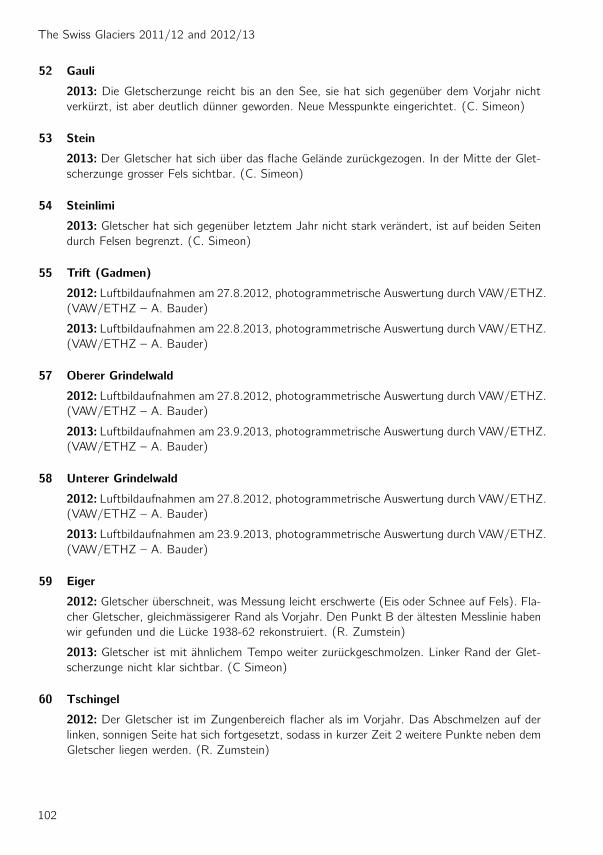
The Swiss Glaciers 2011/12 and 2012/13
52 Gauli
2013: Die Gletscherzunge reicht bis an den See, sie hat sich gegenuber dem Vorjahr nicht
verkurzt, ist aber deutlich dunner geworden. Neue Messpunkte eingerichtet. (C. Simeon)
53 Stein
2013: Der Gletscher hat sich uber das flache Gelande zuruckgezogen. In der Mitte der Glet-
scherzunge grosser Fels sichtbar. (C. Simeon)
54 Steinlimi
2013: Gletscher hat sich gegenuber letztem Jahr nicht stark verandert, ist auf beiden Seiten
durch Felsen begrenzt. (C. Simeon)
55 Trift (Gadmen)
2012: Luftbildaufnahmen am 27.8.2012, photogrammetrische Auswertung durch VAW/ETHZ.
(VAW/ETHZ – A. Bauder)
2013: Luftbildaufnahmen am 22.8.2013, photogrammetrische Auswertung durch VAW/ETHZ.
(VAW/ETHZ – A. Bauder)
57 Oberer Grindelwald
2012: Luftbildaufnahmen am 27.8.2012, photogrammetrische Auswertung durch VAW/ETHZ.
(VAW/ETHZ – A. Bauder)
2013: Luftbildaufnahmen am 23.9.2013, photogrammetrische Auswertung durch VAW/ETHZ.
(VAW/ETHZ – A. Bauder)
58 Unterer Grindelwald
2012: Luftbildaufnahmen am 27.8.2012, photogrammetrische Auswertung durch VAW/ETHZ.
(VAW/ETHZ – A. Bauder)
2013: Luftbildaufnahmen am 23.9.2013, photogrammetrische Auswertung durch VAW/ETHZ.
(VAW/ETHZ – A. Bauder)
59 Eiger
2012: Gletscher uberschneit, was Messung leicht erschwerte (Eis oder Schnee auf Fels). Fla-
cher Gletscher, gleichmassigerer Rand als Vorjahr. Den Punkt B der altesten Messlinie haben
wir gefunden und die Lucke 1938-62 rekonstruiert. (R. Zumstein)
2013: Gletscher ist mit ahnlichem Tempo weiter zuruckgeschmolzen. Linker Rand der Glet-
scherzunge nicht klar sichtbar. (C Simeon)
60 Tschingel
2012: Der Gletscher ist im Zungenbereich flacher als im Vorjahr. Das Abschmelzen auf der
linken, sonnigen Seite hat sich fortgesetzt, sodass in kurzer Zeit 2 weitere Punkte neben dem
Gletscher liegen werden. (R. Zumstein)
102
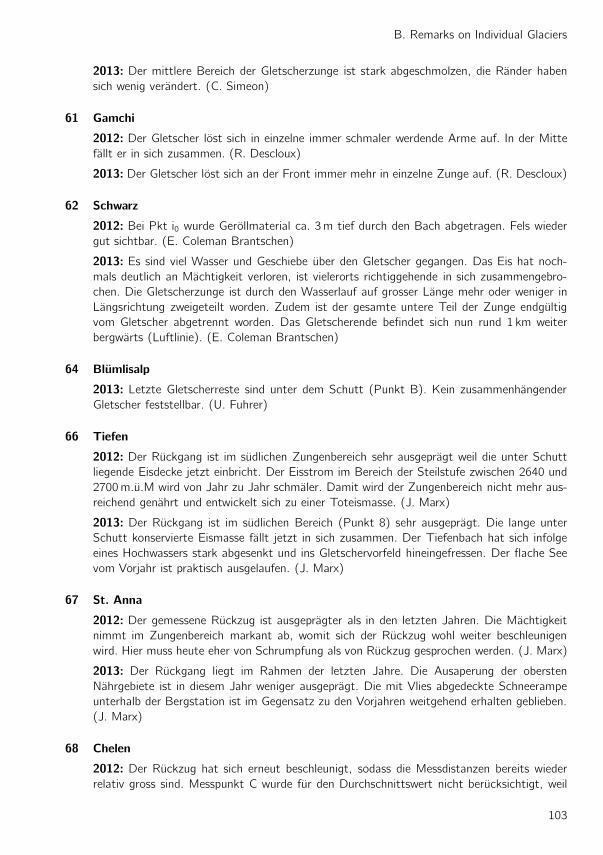
B. Remarks on Individual Glaciers
2013: Der mittlere Bereich der Gletscherzunge ist stark abgeschmolzen, die Rander haben
sich wenig verandert. (C. Simeon)
61 Gamchi
2012: Der Gletscher lost sich in einzelne immer schmaler werdende Arme auf. In der Mitte
fallt er in sich zusammen. (R. Descloux)
2013: Der Gletscher lost sich an der Front immer mehr in einzelne Zunge auf. (R. Descloux)
62 Schwarz
2012: Bei Pkt i0 wurde Gerollmaterial ca. 3m tief durch den Bach abgetragen. Fels wieder
gut sichtbar. (E. Coleman Brantschen)
2013: Es sind viel Wasser und Geschiebe uber den Gletscher gegangen. Das Eis hat noch-
mals deutlich an Machtigkeit verloren, ist vielerorts richtiggehende in sich zusammengebro-
chen. Die Gletscherzunge ist durch den Wasserlauf auf grosser Lange mehr oder weniger in
Langsrichtung zweigeteilt worden. Zudem ist der gesamte untere Teil der Zunge endgultig
vom Gletscher abgetrennt worden. Das Gletscherende befindet sich nun rund 1 km weiter
bergwarts (Luftlinie). (E. Coleman Brantschen)
64 Blumlisalp
2013: Letzte Gletscherreste sind unter dem Schutt (Punkt B). Kein zusammenhangender
Gletscher feststellbar. (U. Fuhrer)
66 Tiefen
2012: Der Ruckgang ist im sudlichen Zungenbereich sehr ausgepragt weil die unter Schutt
liegende Eisdecke jetzt einbricht. Der Eisstrom im Bereich der Steilstufe zwischen 2640 und
2700m.u.M wird von Jahr zu Jahr schmaler. Damit wird der Zungenbereich nicht mehr aus-
reichend genahrt und entwickelt sich zu einer Toteismasse. (J. Marx)
2013: Der Ruckgang ist im sudlichen Bereich (Punkt 8) sehr ausgepragt. Die lange unter
Schutt konservierte Eismasse fallt jetzt in sich zusammen. Der Tiefenbach hat sich infolge
eines Hochwassers stark abgesenkt und ins Gletschervorfeld hineingefressen. Der flache See
vom Vorjahr ist praktisch ausgelaufen. (J. Marx)
67 St. Anna
2012: Der gemessene Ruckzug ist ausgepragter als in den letzten Jahren. Die Machtigkeit
nimmt im Zungenbereich markant ab, womit sich der Ruckzug wohl weiter beschleunigen
wird. Hier muss heute eher von Schrumpfung als von Ruckzug gesprochen werden. (J. Marx)
2013: Der Ruckgang liegt im Rahmen der letzten Jahre. Die Ausaperung der obersten
Nahrgebiete ist in diesem Jahr weniger ausgepragt. Die mit Vlies abgedeckte Schneerampe
unterhalb der Bergstation ist im Gegensatz zu den Vorjahren weitgehend erhalten geblieben.
(J. Marx)
68 Chelen
2012: Der Ruckzug hat sich erneut beschleunigt, sodass die Messdistanzen bereits wieder
relativ gross sind. Messpunkt C wurde fur den Durchschnittswert nicht berucksichtigt, weil
103
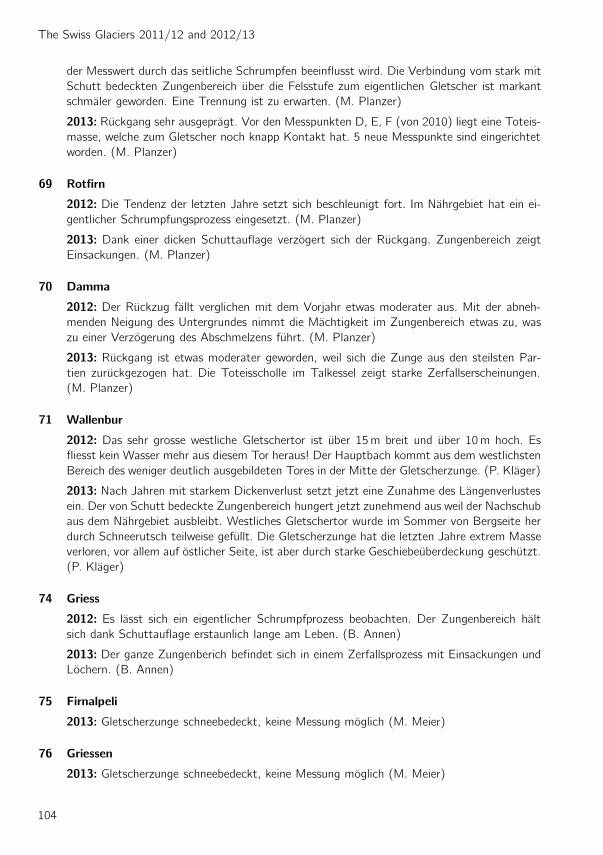
The Swiss Glaciers 2011/12 and 2012/13
der Messwert durch das seitliche Schrumpfen beeinflusst wird. Die Verbindung vom stark mit
Schutt bedeckten Zungenbereich uber die Felsstufe zum eigentlichen Gletscher ist markant
schmaler geworden. Eine Trennung ist zu erwarten. (M. Planzer)
2013: Ruckgang sehr ausgepragt. Vor den Messpunkten D, E, F (von 2010) liegt eine Toteis-
masse, welche zum Gletscher noch knapp Kontakt hat. 5 neue Messpunkte sind eingerichtet
worden. (M. Planzer)
69 Rotfirn
2012: Die Tendenz der letzten Jahre setzt sich beschleunigt fort. Im Nahrgebiet hat ein ei-
gentlicher Schrumpfungsprozess eingesetzt. (M. Planzer)
2013: Dank einer dicken Schuttauflage verzogert sich der Ruckgang. Zungenbereich zeigt
Einsackungen. (M. Planzer)
70 Damma
2012: Der Ruckzug fallt verglichen mit dem Vorjahr etwas moderater aus. Mit der abneh-
menden Neigung des Untergrundes nimmt die Machtigkeit im Zungenbereich etwas zu, was
zu einer Verzogerung des Abschmelzens fuhrt. (M. Planzer)
2013: Ruckgang ist etwas moderater geworden, weil sich die Zunge aus den steilsten Par-
tien zuruckgezogen hat. Die Toteisscholle im Talkessel zeigt starke Zerfallserscheinungen.
(M. Planzer)
71 Wallenbur
2012: Das sehr grosse westliche Gletschertor ist uber 15m breit und uber 10m hoch. Es
fliesst kein Wasser mehr aus diesem Tor heraus! Der Hauptbach kommt aus dem westlichsten
Bereich des weniger deutlich ausgebildeten Tores in der Mitte der Gletscherzunge. (P. Klager)
2013: Nach Jahren mit starkem Dickenverlust setzt jetzt eine Zunahme des Langenverlustes
ein. Der von Schutt bedeckte Zungenbereich hungert jetzt zunehmend aus weil der Nachschub
aus dem Nahrgebiet ausbleibt. Westliches Gletschertor wurde im Sommer von Bergseite her
durch Schneerutsch teilweise gefullt. Die Gletscherzunge hat die letzten Jahre extrem Masse
verloren, vor allem auf ostlicher Seite, ist aber durch starke Geschiebeuberdeckung geschutzt.
(P. Klager)
74 Griess
2012: Es lasst sich ein eigentlicher Schrumpfprozess beobachten. Der Zungenbereich halt
sich dank Schuttauflage erstaunlich lange am Leben. (B. Annen)
2013: Der ganze Zungenberich befindet sich in einem Zerfallsprozess mit Einsackungen und
Lochern. (B. Annen)
75 Firnalpeli
2013: Gletscherzunge schneebedeckt, keine Messung moglich (M. Meier)
76 Griessen
2013: Gletscherzunge schneebedeckt, keine Messung moglich (M. Meier)
104
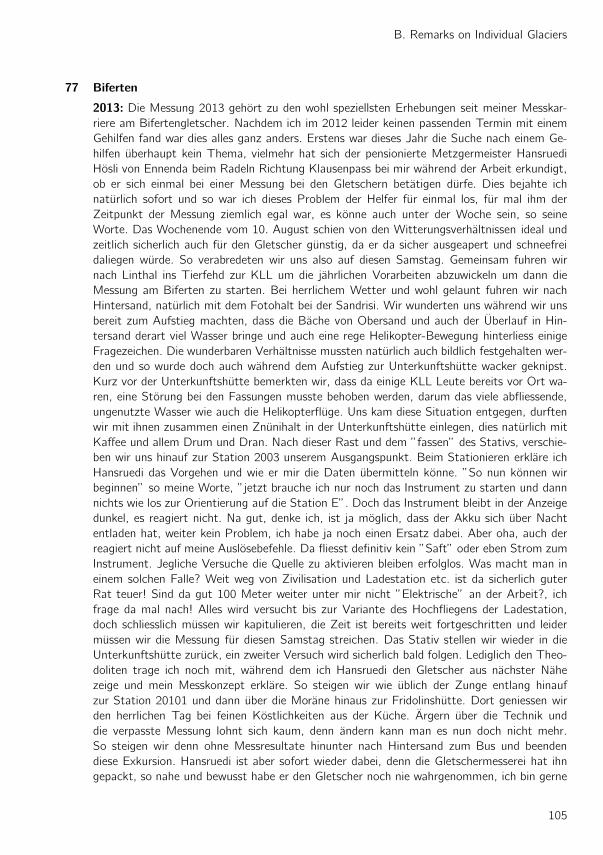
B. Remarks on Individual Glaciers
77 Biferten
2013: Die Messung 2013 gehort zu den wohl speziellsten Erhebungen seit meiner Messkar-
riere am Bifertengletscher. Nachdem ich im 2012 leider keinen passenden Termin mit einem
Gehilfen fand war dies alles ganz anders. Erstens war dieses Jahr die Suche nach einem Ge-
hilfen uberhaupt kein Thema, vielmehr hat sich der pensionierte Metzgermeister Hansruedi
Hosli von Ennenda beim Radeln Richtung Klausenpass bei mir wahrend der Arbeit erkundigt,
ob er sich einmal bei einer Messung bei den Gletschern betatigen durfe. Dies bejahte ich
naturlich sofort und so war ich dieses Problem der Helfer fur einmal los, fur mal ihm der
Zeitpunkt der Messung ziemlich egal war, es konne auch unter der Woche sein, so seine
Worte. Das Wochenende vom 10. August schien von den Witterungsverhaltnissen ideal und
zeitlich sicherlich auch fur den Gletscher gunstig, da er da sicher ausgeapert und schneefrei
daliegen wurde. So verabredeten wir uns also auf diesen Samstag. Gemeinsam fuhren wir
nach Linthal ins Tierfehd zur KLL um die jahrlichen Vorarbeiten abzuwickeln um dann die
Messung am Biferten zu starten. Bei herrlichem Wetter und wohl gelaunt fuhren wir nach
Hintersand, naturlich mit dem Fotohalt bei der Sandrisi. Wir wunderten uns wahrend wir uns
bereit zum Aufstieg machten, dass die Bache von Obersand und auch der Uberlauf in Hin-
tersand derart viel Wasser bringe und auch eine rege Helikopter-Bewegung hinterliess einige
Fragezeichen. Die wunderbaren Verhaltnisse mussten naturlich auch bildlich festgehalten wer-
den und so wurde doch auch wahrend dem Aufstieg zur Unterkunftshutte wacker geknipst.
Kurz vor der Unterkunftshutte bemerkten wir, dass da einige KLL Leute bereits vor Ort wa-
ren, eine Storung bei den Fassungen musste behoben werden, darum das viele abfliessende,
ungenutzte Wasser wie auch die Helikopterfluge. Uns kam diese Situation entgegen, durften
wir mit ihnen zusammen einen Znunihalt in der Unterkunftshutte einlegen, dies naturlich mit
Kaffee und allem Drum und Dran. Nach dieser Rast und dem ”fassen” des Stativs, verschie-
ben wir uns hinauf zur Station 2003 unserem Ausgangspunkt. Beim Stationieren erklare ich
Hansruedi das Vorgehen und wie er mir die Daten ubermitteln konne. ”So nun konnen wir
beginnen” so meine Worte, ”jetzt brauche ich nur noch das Instrument zu starten und dann
nichts wie los zur Orientierung auf die Station E”. Doch das Instrument bleibt in der Anzeige
dunkel, es reagiert nicht. Na gut, denke ich, ist ja moglich, dass der Akku sich uber Nacht
entladen hat, weiter kein Problem, ich habe ja noch einen Ersatz dabei. Aber oha, auch der
reagiert nicht auf meine Auslosebefehle. Da fliesst definitiv kein ”Saft” oder eben Strom zum
Instrument. Jegliche Versuche die Quelle zu aktivieren bleiben erfolglos. Was macht man in
einem solchen Falle? Weit weg von Zivilisation und Ladestation etc. ist da sicherlich guter
Rat teuer! Sind da gut 100 Meter weiter unter mir nicht ”Elektrische” an der Arbeit?, ich
frage da mal nach! Alles wird versucht bis zur Variante des Hochfliegens der Ladestation,
doch schliesslich mussen wir kapitulieren, die Zeit ist bereits weit fortgeschritten und leider
mussen wir die Messung fur diesen Samstag streichen. Das Stativ stellen wir wieder in die
Unterkunftshutte zuruck, ein zweiter Versuch wird sicherlich bald folgen. Lediglich den Theo-
doliten trage ich noch mit, wahrend dem ich Hansruedi den Gletscher aus nachster Nahe
zeige und mein Messkonzept erklare. So steigen wir wie ublich der Zunge entlang hinauf
zur Station 20101 und dann uber die Morane hinaus zur Fridolinshutte. Dort geniessen wir
den herrlichen Tag bei feinen Kostlichkeiten aus der Kuche. Argern uber die Technik und
die verpasste Messung lohnt sich kaum, denn andern kann man es nun doch nicht mehr.
So steigen wir denn ohne Messresultate hinunter nach Hintersand zum Bus und beenden
diese Exkursion. Hansruedi ist aber sofort wieder dabei, denn die Gletschermesserei hat ihn
gepackt, so nahe und bewusst habe er den Gletscher noch nie wahrgenommen, ich bin gerne
105
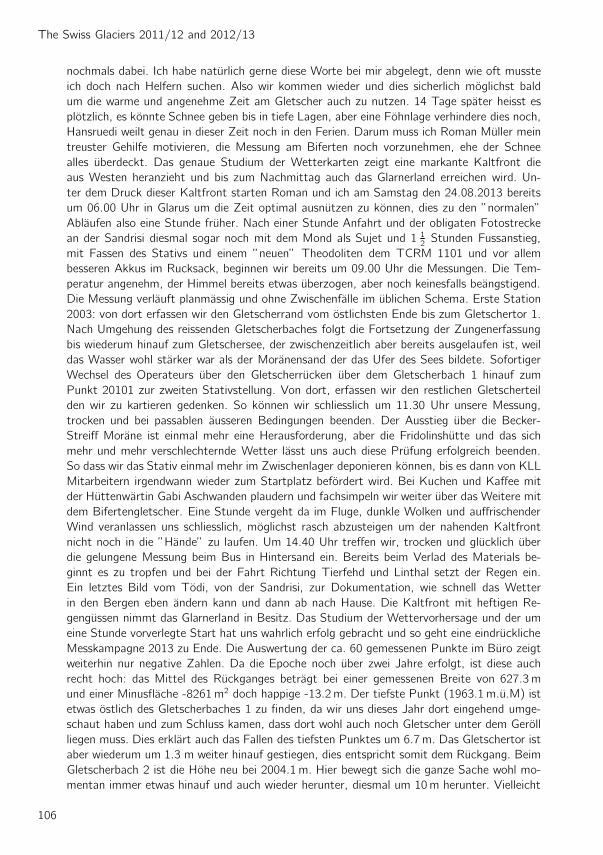
The Swiss Glaciers 2011/12 and 2012/13
nochmals dabei. Ich habe naturlich gerne diese Worte bei mir abgelegt, denn wie oft musste
ich doch nach Helfern suchen. Also wir kommen wieder und dies sicherlich moglichst bald
um die warme und angenehme Zeit am Gletscher auch zu nutzen. 14 Tage spater heisst es
plotzlich, es konnte Schnee geben bis in tiefe Lagen, aber eine Fohnlage verhindere dies noch,
Hansruedi weilt genau in dieser Zeit noch in den Ferien. Darum muss ich Roman Muller mein
treuster Gehilfe motivieren, die Messung am Biferten noch vorzunehmen, ehe der Schnee
alles uberdeckt. Das genaue Studium der Wetterkarten zeigt eine markante Kaltfront die
aus Westen heranzieht und bis zum Nachmittag auch das Glarnerland erreichen wird. Un-
ter dem Druck dieser Kaltfront starten Roman und ich am Samstag den 24.08.2013 bereits
um 06.00 Uhr in Glarus um die Zeit optimal ausnutzen zu konnen, dies zu den ”normalen”
Ablaufen also eine Stunde fruher. Nach einer Stunde Anfahrt und der obligaten Fotostrecke
an der Sandrisi diesmal sogar noch mit dem Mond als Sujet und 1 12Stunden Fussanstieg,
mit Fassen des Stativs und einem ”neuen” Theodoliten dem TCRM 1101 und vor allem
besseren Akkus im Rucksack, beginnen wir bereits um 09.00 Uhr die Messungen. Die Tem-
peratur angenehm, der Himmel bereits etwas uberzogen, aber noch keinesfalls beangstigend.
Die Messung verlauft planmassig und ohne Zwischenfalle im ublichen Schema. Erste Station
2003: von dort erfassen wir den Gletscherrand vom ostlichsten Ende bis zum Gletschertor 1.
Nach Umgehung des reissenden Gletscherbaches folgt die Fortsetzung der Zungenerfassung
bis wiederum hinauf zum Gletschersee, der zwischenzeitlich aber bereits ausgelaufen ist, weil
das Wasser wohl starker war als der Moranensand der das Ufer des Sees bildete. Sofortiger
Wechsel des Operateurs uber den Gletscherrucken uber dem Gletscherbach 1 hinauf zum
Punkt 20101 zur zweiten Stativstellung. Von dort, erfassen wir den restlichen Gletscherteil
den wir zu kartieren gedenken. So konnen wir schliesslich um 11.30 Uhr unsere Messung,
trocken und bei passablen ausseren Bedingungen beenden. Der Ausstieg uber die Becker-
Streiff Morane ist einmal mehr eine Herausforderung, aber die Fridolinshutte und das sich
mehr und mehr verschlechternde Wetter lasst uns auch diese Prufung erfolgreich beenden.
So dass wir das Stativ einmal mehr im Zwischenlager deponieren konnen, bis es dann von KLL
Mitarbeitern irgendwann wieder zum Startplatz befordert wird. Bei Kuchen und Kaffee mit
der Huttenwartin Gabi Aschwanden plaudern und fachsimpeln wir weiter uber das Weitere mit
dem Bifertengletscher. Eine Stunde vergeht da im Fluge, dunkle Wolken und auffrischender
Wind veranlassen uns schliesslich, moglichst rasch abzusteigen um der nahenden Kaltfront
nicht noch in die ”Hande” zu laufen. Um 14.40 Uhr treffen wir, trocken und glucklich uber
die gelungene Messung beim Bus in Hintersand ein. Bereits beim Verlad des Materials be-
ginnt es zu tropfen und bei der Fahrt Richtung Tierfehd und Linthal setzt der Regen ein.
Ein letztes Bild vom Todi, von der Sandrisi, zur Dokumentation, wie schnell das Wetter
in den Bergen eben andern kann und dann ab nach Hause. Die Kaltfront mit heftigen Re-
gengussen nimmt das Glarnerland in Besitz. Das Studium der Wettervorhersage und der um
eine Stunde vorverlegte Start hat uns wahrlich erfolg gebracht und so geht eine eindruckliche
Messkampagne 2013 zu Ende. Die Auswertung der ca. 60 gemessenen Punkte im Buro zeigt
weiterhin nur negative Zahlen. Da die Epoche noch uber zwei Jahre erfolgt, ist diese auch
recht hoch: das Mittel des Ruckganges betragt bei einer gemessenen Breite von 627.3m
und einer Minusflache -8261m2 doch happige -13.2m. Der tiefste Punkt (1963.1m.u.M) ist
etwas ostlich des Gletscherbaches 1 zu finden, da wir uns dieses Jahr dort eingehend umge-
schaut haben und zum Schluss kamen, dass dort wohl auch noch Gletscher unter dem Geroll
liegen muss. Dies erklart auch das Fallen des tiefsten Punktes um 6.7m. Das Gletschertor ist
aber wiederum um 1.3 m weiter hinauf gestiegen, dies entspricht somit dem Ruckgang. Beim
Gletscherbach 2 ist die Hohe neu bei 2004.1m. Hier bewegt sich die ganze Sache wohl mo-
mentan immer etwas hinauf und auch wieder herunter, diesmal um 10m herunter. Vielleicht
106
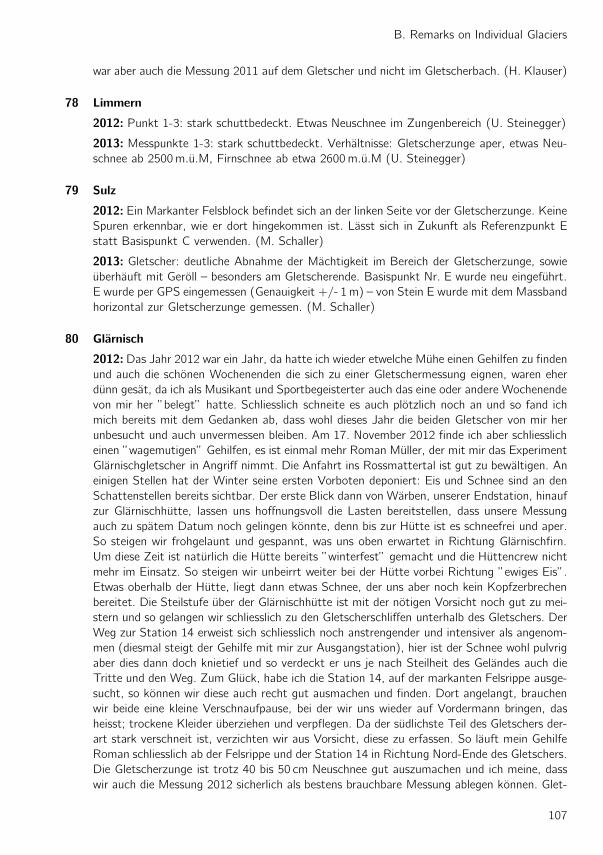
B. Remarks on Individual Glaciers
war aber auch die Messung 2011 auf dem Gletscher und nicht im Gletscherbach. (H. Klauser)
78 Limmern
2012: Punkt 1-3: stark schuttbedeckt. Etwas Neuschnee im Zungenbereich (U. Steinegger)
2013: Messpunkte 1-3: stark schuttbedeckt. Verhaltnisse: Gletscherzunge aper, etwas Neu-
schnee ab 2500m.u.M, Firnschnee ab etwa 2600m.u.M (U. Steinegger)
79 Sulz
2012: Ein Markanter Felsblock befindet sich an der linken Seite vor der Gletscherzunge. Keine
Spuren erkennbar, wie er dort hingekommen ist. Lasst sich in Zukunft als Referenzpunkt E
statt Basispunkt C verwenden. (M. Schaller)
2013: Gletscher: deutliche Abnahme der Machtigkeit im Bereich der Gletscherzunge, sowie
uberhauft mit Geroll – besonders am Gletscherende. Basispunkt Nr. E wurde neu eingefuhrt.
E wurde per GPS eingemessen (Genauigkeit +/- 1m) – von Stein E wurde mit dem Massband
horizontal zur Gletscherzunge gemessen. (M. Schaller)
80 Glarnisch
2012: Das Jahr 2012 war ein Jahr, da hatte ich wieder etwelche Muhe einen Gehilfen zu finden
und auch die schonen Wochenenden die sich zu einer Gletschermessung eignen, waren eher
dunn gesat, da ich als Musikant und Sportbegeisterter auch das eine oder andere Wochenende
von mir her ”belegt” hatte. Schliesslich schneite es auch plotzlich noch an und so fand ich
mich bereits mit dem Gedanken ab, dass wohl dieses Jahr die beiden Gletscher von mir her
unbesucht und auch unvermessen bleiben. Am 17. November 2012 finde ich aber schliesslich
einen ”wagemutigen” Gehilfen, es ist einmal mehr Roman Muller, der mit mir das Experiment
Glarnischgletscher in Angriff nimmt. Die Anfahrt ins Rossmattertal ist gut zu bewaltigen. An
einigen Stellen hat der Winter seine ersten Vorboten deponiert: Eis und Schnee sind an den
Schattenstellen bereits sichtbar. Der erste Blick dann von Warben, unserer Endstation, hinauf
zur Glarnischhutte, lassen uns hoffnungsvoll die Lasten bereitstellen, dass unsere Messung
auch zu spatem Datum noch gelingen konnte, denn bis zur Hutte ist es schneefrei und aper.
So steigen wir frohgelaunt und gespannt, was uns oben erwartet in Richtung Glarnischfirn.
Um diese Zeit ist naturlich die Hutte bereits ”winterfest” gemacht und die Huttencrew nicht
mehr im Einsatz. So steigen wir unbeirrt weiter bei der Hutte vorbei Richtung ”ewiges Eis”.
Etwas oberhalb der Hutte, liegt dann etwas Schnee, der uns aber noch kein Kopfzerbrechen
bereitet. Die Steilstufe uber der Glarnischhutte ist mit der notigen Vorsicht noch gut zu mei-
stern und so gelangen wir schliesslich zu den Gletscherschliffen unterhalb des Gletschers. Der
Weg zur Station 14 erweist sich schliesslich noch anstrengender und intensiver als angenom-
men (diesmal steigt der Gehilfe mit mir zur Ausgangstation), hier ist der Schnee wohl pulvrig
aber dies dann doch knietief und so verdeckt er uns je nach Steilheit des Gelandes auch die
Tritte und den Weg. Zum Gluck, habe ich die Station 14, auf der markanten Felsrippe ausge-
sucht, so konnen wir diese auch recht gut ausmachen und finden. Dort angelangt, brauchen
wir beide eine kleine Verschnaufpause, bei der wir uns wieder auf Vordermann bringen, das
heisst; trockene Kleider uberziehen und verpflegen. Da der sudlichste Teil des Gletschers der-
art stark verschneit ist, verzichten wir aus Vorsicht, diese zu erfassen. So lauft mein Gehilfe
Roman schliesslich ab der Felsrippe und der Station 14 in Richtung Nord-Ende des Gletschers.
Die Gletscherzunge ist trotz 40 bis 50 cm Neuschnee gut auszumachen und ich meine, dass
wir auch die Messung 2012 sicherlich als bestens brauchbare Messung ablegen konnen. Glet-
107
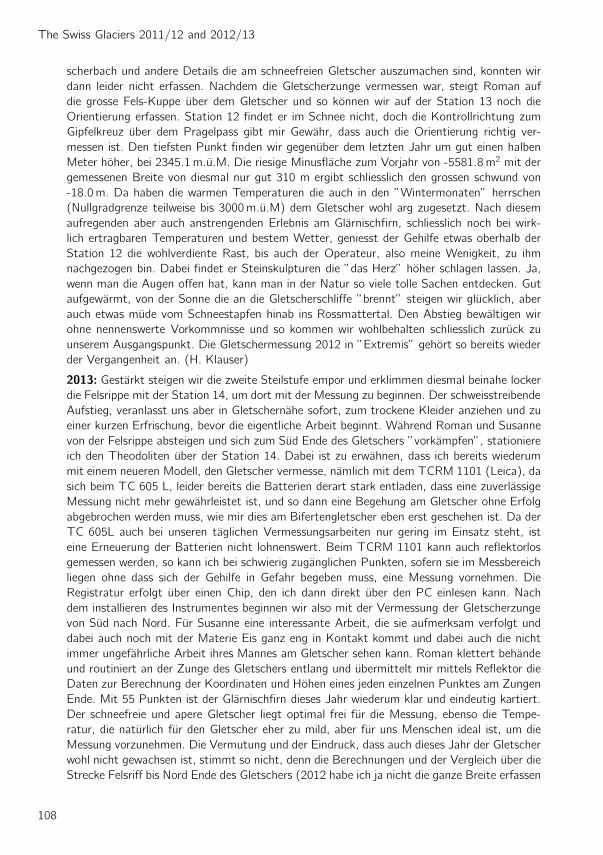
The Swiss Glaciers 2011/12 and 2012/13
scherbach und andere Details die am schneefreien Gletscher auszumachen sind, konnten wir
dann leider nicht erfassen. Nachdem die Gletscherzunge vermessen war, steigt Roman auf
die grosse Fels-Kuppe uber dem Gletscher und so konnen wir auf der Station 13 noch die
Orientierung erfassen. Station 12 findet er im Schnee nicht, doch die Kontrollrichtung zum
Gipfelkreuz uber dem Pragelpass gibt mir Gewahr, dass auch die Orientierung richtig ver-
messen ist. Den tiefsten Punkt finden wir gegenuber dem letzten Jahr um gut einen halben
Meter hoher, bei 2345.1m.u.M. Die riesige Minusflache zum Vorjahr von -5581.8m2 mit der
gemessenen Breite von diesmal nur gut 310 m ergibt schliesslich den grossen schwund von
-18.0m. Da haben die warmen Temperaturen die auch in den ”Wintermonaten” herrschen
(Nullgradgrenze teilweise bis 3000m.u.M) dem Gletscher wohl arg zugesetzt. Nach diesem
aufregenden aber auch anstrengenden Erlebnis am Glarnischfirn, schliesslich noch bei wirk-
lich ertragbaren Temperaturen und bestem Wetter, geniesst der Gehilfe etwas oberhalb der
Station 12 die wohlverdiente Rast, bis auch der Operateur, also meine Wenigkeit, zu ihm
nachgezogen bin. Dabei findet er Steinskulpturen die ”das Herz” hoher schlagen lassen. Ja,
wenn man die Augen offen hat, kann man in der Natur so viele tolle Sachen entdecken. Gut
aufgewarmt, von der Sonne die an die Gletscherschliffe ”brennt” steigen wir glucklich, aber
auch etwas mude vom Schneestapfen hinab ins Rossmattertal. Den Abstieg bewaltigen wir
ohne nennenswerte Vorkommnisse und so kommen wir wohlbehalten schliesslich zuruck zu
unserem Ausgangspunkt. Die Gletschermessung 2012 in ”Extremis” gehort so bereits wieder
der Vergangenheit an. (H. Klauser)
2013: Gestarkt steigen wir die zweite Steilstufe empor und erklimmen diesmal beinahe locker
die Felsrippe mit der Station 14, um dort mit der Messung zu beginnen. Der schweisstreibende
Aufstieg, veranlasst uns aber in Gletschernahe sofort, zum trockene Kleider anziehen und zu
einer kurzen Erfrischung, bevor die eigentliche Arbeit beginnt. Wahrend Roman und Susanne
von der Felsrippe absteigen und sich zum Sud Ende des Gletschers ”vorkampfen”, stationiere
ich den Theodoliten uber der Station 14. Dabei ist zu erwahnen, dass ich bereits wiederum
mit einem neueren Modell, den Gletscher vermesse, namlich mit dem TCRM 1101 (Leica), da
sich beim TC 605 L, leider bereits die Batterien derart stark entladen, dass eine zuverlassige
Messung nicht mehr gewahrleistet ist, und so dann eine Begehung am Gletscher ohne Erfolg
abgebrochen werden muss, wie mir dies am Bifertengletscher eben erst geschehen ist. Da der
TC 605L auch bei unseren taglichen Vermessungsarbeiten nur gering im Einsatz steht, ist
eine Erneuerung der Batterien nicht lohnenswert. Beim TCRM 1101 kann auch reflektorlos
gemessen werden, so kann ich bei schwierig zuganglichen Punkten, sofern sie im Messbereich
liegen ohne dass sich der Gehilfe in Gefahr begeben muss, eine Messung vornehmen. Die
Registratur erfolgt uber einen Chip, den ich dann direkt uber den PC einlesen kann. Nach
dem installieren des Instrumentes beginnen wir also mit der Vermessung der Gletscherzunge
von Sud nach Nord. Fur Susanne eine interessante Arbeit, die sie aufmerksam verfolgt und
dabei auch noch mit der Materie Eis ganz eng in Kontakt kommt und dabei auch die nicht
immer ungefahrliche Arbeit ihres Mannes am Gletscher sehen kann. Roman klettert behande
und routiniert an der Zunge des Gletschers entlang und ubermittelt mir mittels Reflektor die
Daten zur Berechnung der Koordinaten und Hohen eines jeden einzelnen Punktes am Zungen
Ende. Mit 55 Punkten ist der Glarnischfirn dieses Jahr wiederum klar und eindeutig kartiert.
Der schneefreie und apere Gletscher liegt optimal frei fur die Messung, ebenso die Tempe-
ratur, die naturlich fur den Gletscher eher zu mild, aber fur uns Menschen ideal ist, um die
Messung vorzunehmen. Die Vermutung und der Eindruck, dass auch dieses Jahr der Gletscher
wohl nicht gewachsen ist, stimmt so nicht, denn die Berechnungen und der Vergleich uber die
Strecke Felsriff bis Nord Ende des Gletschers (2012 habe ich ja nicht die ganze Breite erfassen
108
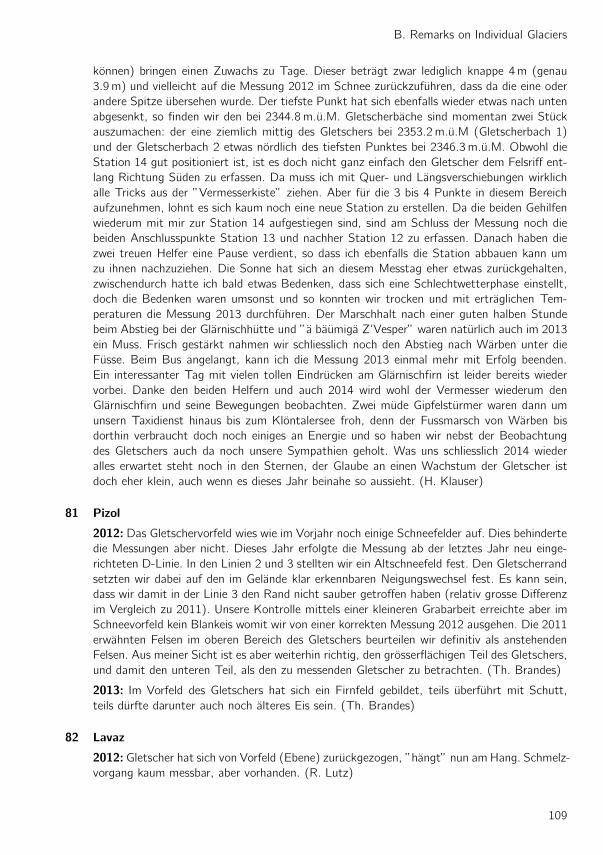
B. Remarks on Individual Glaciers
konnen) bringen einen Zuwachs zu Tage. Dieser betragt zwar lediglich knappe 4m (genau
3.9m) und vielleicht auf die Messung 2012 im Schnee zuruckzufuhren, dass da die eine oder
andere Spitze ubersehen wurde. Der tiefste Punkt hat sich ebenfalls wieder etwas nach unten
abgesenkt, so finden wir den bei 2344.8m.u.M. Gletscherbache sind momentan zwei Stuck
auszumachen: der eine ziemlich mittig des Gletschers bei 2353.2m.u.M (Gletscherbach 1)
und der Gletscherbach 2 etwas nordlich des tiefsten Punktes bei 2346.3m.u.M. Obwohl die
Station 14 gut positioniert ist, ist es doch nicht ganz einfach den Gletscher dem Felsriff ent-
lang Richtung Suden zu erfassen. Da muss ich mit Quer- und Langsverschiebungen wirklich
alle Tricks aus der ”Vermesserkiste” ziehen. Aber fur die 3 bis 4 Punkte in diesem Bereich
aufzunehmen, lohnt es sich kaum noch eine neue Station zu erstellen. Da die beiden Gehilfen
wiederum mit mir zur Station 14 aufgestiegen sind, sind am Schluss der Messung noch die
beiden Anschlusspunkte Station 13 und nachher Station 12 zu erfassen. Danach haben die
zwei treuen Helfer eine Pause verdient, so dass ich ebenfalls die Station abbauen kann um
zu ihnen nachzuziehen. Die Sonne hat sich an diesem Messtag eher etwas zuruckgehalten,
zwischendurch hatte ich bald etwas Bedenken, dass sich eine Schlechtwetterphase einstellt,
doch die Bedenken waren umsonst und so konnten wir trocken und mit ertraglichen Tem-
peraturen die Messung 2013 durchfuhren. Der Marschhalt nach einer guten halben Stunde
beim Abstieg bei der Glarnischhutte und ”a baumiga Z‘Vesper” waren naturlich auch im 2013
ein Muss. Frisch gestarkt nahmen wir schliesslich noch den Abstieg nach Warben unter die
Fusse. Beim Bus angelangt, kann ich die Messung 2013 einmal mehr mit Erfolg beenden.
Ein interessanter Tag mit vielen tollen Eindrucken am Glarnischfirn ist leider bereits wieder
vorbei. Danke den beiden Helfern und auch 2014 wird wohl der Vermesser wiederum den
Glarnischfirn und seine Bewegungen beobachten. Zwei mude Gipfelsturmer waren dann um
unsern Taxidienst hinaus bis zum Klontalersee froh, denn der Fussmarsch von Warben bis
dorthin verbraucht doch noch einiges an Energie und so haben wir nebst der Beobachtung
des Gletschers auch da noch unsere Sympathien geholt. Was uns schliesslich 2014 wieder
alles erwartet steht noch in den Sternen, der Glaube an einen Wachstum der Gletscher ist
doch eher klein, auch wenn es dieses Jahr beinahe so aussieht. (H. Klauser)
81 Pizol
2012: Das Gletschervorfeld wies wie im Vorjahr noch einige Schneefelder auf. Dies behinderte
die Messungen aber nicht. Dieses Jahr erfolgte die Messung ab der letztes Jahr neu einge-
richteten D-Linie. In den Linien 2 und 3 stellten wir ein Altschneefeld fest. Den Gletscherrand
setzten wir dabei auf den im Gelande klar erkennbaren Neigungswechsel fest. Es kann sein,
dass wir damit in der Linie 3 den Rand nicht sauber getroffen haben (relativ grosse Differenz
im Vergleich zu 2011). Unsere Kontrolle mittels einer kleineren Grabarbeit erreichte aber im
Schneevorfeld kein Blankeis womit wir von einer korrekten Messung 2012 ausgehen. Die 2011
erwahnten Felsen im oberen Bereich des Gletschers beurteilen wir definitiv als anstehenden
Felsen. Aus meiner Sicht ist es aber weiterhin richtig, den grosserflachigen Teil des Gletschers,
und damit den unteren Teil, als den zu messenden Gletscher zu betrachten. (Th. Brandes)
2013: Im Vorfeld des Gletschers hat sich ein Firnfeld gebildet, teils uberfuhrt mit Schutt,
teils durfte darunter auch noch alteres Eis sein. (Th. Brandes)
82 Lavaz
2012:Gletscher hat sich von Vorfeld (Ebene) zuruckgezogen, ”hangt” nun am Hang. Schmelz-
vorgang kaum messbar, aber vorhanden. (R. Lutz)
109
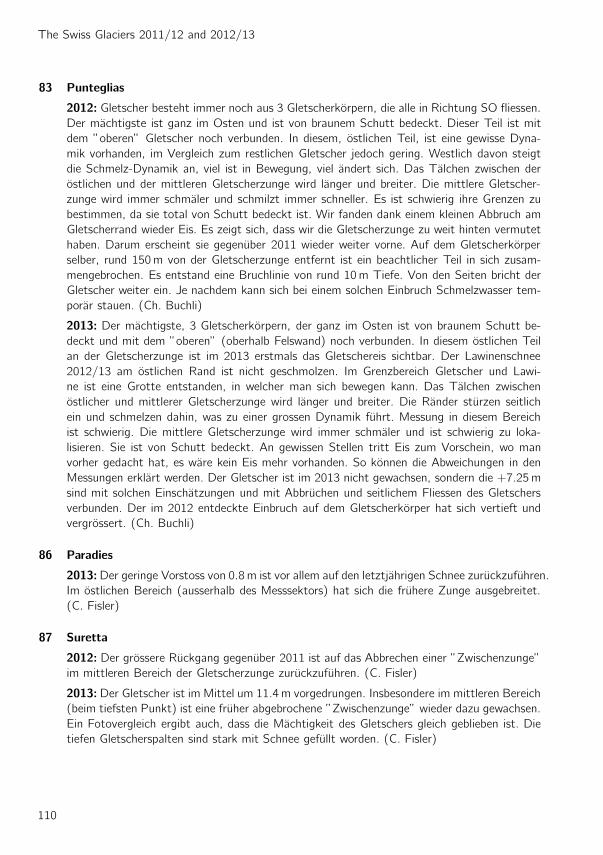
The Swiss Glaciers 2011/12 and 2012/13
83 Punteglias
2012: Gletscher besteht immer noch aus 3 Gletscherkorpern, die alle in Richtung SO fliessen.
Der machtigste ist ganz im Osten und ist von braunem Schutt bedeckt. Dieser Teil ist mit
dem ”oberen” Gletscher noch verbunden. In diesem, ostlichen Teil, ist eine gewisse Dyna-
mik vorhanden, im Vergleich zum restlichen Gletscher jedoch gering. Westlich davon steigt
die Schmelz-Dynamik an, viel ist in Bewegung, viel andert sich. Das Talchen zwischen der
ostlichen und der mittleren Gletscherzunge wird langer und breiter. Die mittlere Gletscher-
zunge wird immer schmaler und schmilzt immer schneller. Es ist schwierig ihre Grenzen zu
bestimmen, da sie total von Schutt bedeckt ist. Wir fanden dank einem kleinen Abbruch am
Gletscherrand wieder Eis. Es zeigt sich, dass wir die Gletscherzunge zu weit hinten vermutet
haben. Darum erscheint sie gegenuber 2011 wieder weiter vorne. Auf dem Gletscherkorper
selber, rund 150m von der Gletscherzunge entfernt ist ein beachtlicher Teil in sich zusam-
mengebrochen. Es entstand eine Bruchlinie von rund 10m Tiefe. Von den Seiten bricht der
Gletscher weiter ein. Je nachdem kann sich bei einem solchen Einbruch Schmelzwasser tem-
porar stauen. (Ch. Buchli)
2013: Der machtigste, 3 Gletscherkorpern, der ganz im Osten ist von braunem Schutt be-
deckt und mit dem ”oberen” (oberhalb Felswand) noch verbunden. In diesem ostlichen Teil
an der Gletscherzunge ist im 2013 erstmals das Gletschereis sichtbar. Der Lawinenschnee
2012/13 am ostlichen Rand ist nicht geschmolzen. Im Grenzbereich Gletscher und Lawi-
ne ist eine Grotte entstanden, in welcher man sich bewegen kann. Das Talchen zwischen
ostlicher und mittlerer Gletscherzunge wird langer und breiter. Die Rander sturzen seitlich
ein und schmelzen dahin, was zu einer grossen Dynamik fuhrt. Messung in diesem Bereich
ist schwierig. Die mittlere Gletscherzunge wird immer schmaler und ist schwierig zu loka-
lisieren. Sie ist von Schutt bedeckt. An gewissen Stellen tritt Eis zum Vorschein, wo man
vorher gedacht hat, es ware kein Eis mehr vorhanden. So konnen die Abweichungen in den
Messungen erklart werden. Der Gletscher ist im 2013 nicht gewachsen, sondern die +7.25m
sind mit solchen Einschatzungen und mit Abbruchen und seitlichem Fliessen des Gletschers
verbunden. Der im 2012 entdeckte Einbruch auf dem Gletscherkorper hat sich vertieft und
vergrossert. (Ch. Buchli)
86 Paradies
2013:Der geringe Vorstoss von 0.8m ist vor allem auf den letztjahrigen Schnee zuruckzufuhren.
Im ostlichen Bereich (ausserhalb des Messsektors) hat sich die fruhere Zunge ausgebreitet.
(C. Fisler)
87 Suretta
2012: Der grossere Ruckgang gegenuber 2011 ist auf das Abbrechen einer ”Zwischenzunge”
im mittleren Bereich der Gletscherzunge zuruckzufuhren. (C. Fisler)
2013: Der Gletscher ist im Mittel um 11.4m vorgedrungen. Insbesondere im mittleren Bereich
(beim tiefsten Punkt) ist eine fruher abgebrochene ”Zwischenzunge” wieder dazu gewachsen.
Ein Fotovergleich ergibt auch, dass die Machtigkeit des Gletschers gleich geblieben ist. Die
tiefen Gletscherspalten sind stark mit Schnee gefullt worden. (C. Fisler)
110
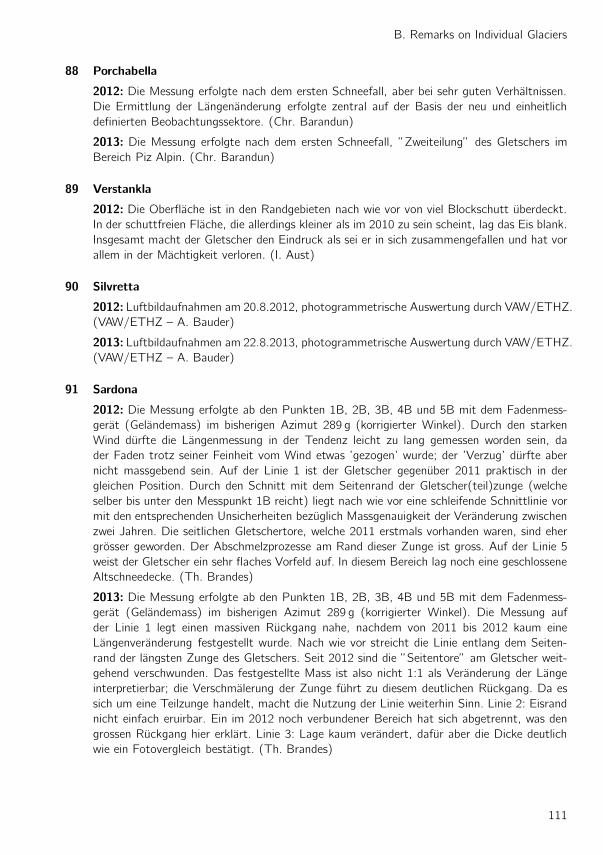
B. Remarks on Individual Glaciers
88 Porchabella
2012: Die Messung erfolgte nach dem ersten Schneefall, aber bei sehr guten Verhaltnissen.
Die Ermittlung der Langenanderung erfolgte zentral auf der Basis der neu und einheitlich
definierten Beobachtungssektore. (Chr. Barandun)
2013: Die Messung erfolgte nach dem ersten Schneefall, ”Zweiteilung” des Gletschers im
Bereich Piz Alpin. (Chr. Barandun)
89 Verstankla
2012: Die Oberflache ist in den Randgebieten nach wie vor von viel Blockschutt uberdeckt.
In der schuttfreien Flache, die allerdings kleiner als im 2010 zu sein scheint, lag das Eis blank.
Insgesamt macht der Gletscher den Eindruck als sei er in sich zusammengefallen und hat vor
allem in der Machtigkeit verloren. (I. Aust)
90 Silvretta
2012: Luftbildaufnahmen am 20.8.2012, photogrammetrische Auswertung durch VAW/ETHZ.
(VAW/ETHZ – A. Bauder)
2013: Luftbildaufnahmen am 22.8.2013, photogrammetrische Auswertung durch VAW/ETHZ.
(VAW/ETHZ – A. Bauder)
91 Sardona
2012: Die Messung erfolgte ab den Punkten 1B, 2B, 3B, 4B und 5B mit dem Fadenmess-
gerat (Gelandemass) im bisherigen Azimut 289 g (korrigierter Winkel). Durch den starken
Wind durfte die Langenmessung in der Tendenz leicht zu lang gemessen worden sein, da
der Faden trotz seiner Feinheit vom Wind etwas ’gezogen’ wurde; der ’Verzug’ durfte aber
nicht massgebend sein. Auf der Linie 1 ist der Gletscher gegenuber 2011 praktisch in der
gleichen Position. Durch den Schnitt mit dem Seitenrand der Gletscher(teil)zunge (welche
selber bis unter den Messpunkt 1B reicht) liegt nach wie vor eine schleifende Schnittlinie vor
mit den entsprechenden Unsicherheiten bezuglich Massgenauigkeit der Veranderung zwischen
zwei Jahren. Die seitlichen Gletschertore, welche 2011 erstmals vorhanden waren, sind eher
grosser geworden. Der Abschmelzprozesse am Rand dieser Zunge ist gross. Auf der Linie 5
weist der Gletscher ein sehr flaches Vorfeld auf. In diesem Bereich lag noch eine geschlossene
Altschneedecke. (Th. Brandes)
2013: Die Messung erfolgte ab den Punkten 1B, 2B, 3B, 4B und 5B mit dem Fadenmess-
gerat (Gelandemass) im bisherigen Azimut 289 g (korrigierter Winkel). Die Messung auf
der Linie 1 legt einen massiven Ruckgang nahe, nachdem von 2011 bis 2012 kaum eine
Langenveranderung festgestellt wurde. Nach wie vor streicht die Linie entlang dem Seiten-
rand der langsten Zunge des Gletschers. Seit 2012 sind die ”Seitentore” am Gletscher weit-
gehend verschwunden. Das festgestellte Mass ist also nicht 1:1 als Veranderung der Lange
interpretierbar; die Verschmalerung der Zunge fuhrt zu diesem deutlichen Ruckgang. Da es
sich um eine Teilzunge handelt, macht die Nutzung der Linie weiterhin Sinn. Linie 2: Eisrand
nicht einfach eruirbar. Ein im 2012 noch verbundener Bereich hat sich abgetrennt, was den
grossen Ruckgang hier erklart. Linie 3: Lage kaum verandert, dafur aber die Dicke deutlich
wie ein Fotovergleich bestatigt. (Th. Brandes)
111
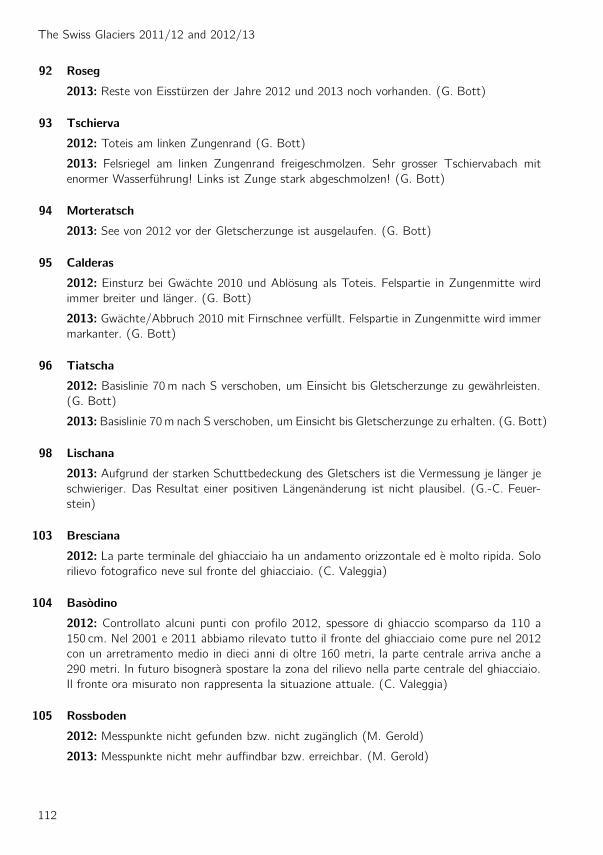
The Swiss Glaciers 2011/12 and 2012/13
92 Roseg
2013: Reste von Eissturzen der Jahre 2012 und 2013 noch vorhanden. (G. Bott)
93 Tschierva
2012: Toteis am linken Zungenrand (G. Bott)
2013: Felsriegel am linken Zungenrand freigeschmolzen. Sehr grosser Tschiervabach mit
enormer Wasserfuhrung! Links ist Zunge stark abgeschmolzen! (G. Bott)
94 Morteratsch
2013: See von 2012 vor der Gletscherzunge ist ausgelaufen. (G. Bott)
95 Calderas
2012: Einsturz bei Gwachte 2010 und Ablosung als Toteis. Felspartie in Zungenmitte wird
immer breiter und langer. (G. Bott)
2013: Gwachte/Abbruch 2010 mit Firnschnee verfullt. Felspartie in Zungenmitte wird immer
markanter. (G. Bott)
96 Tiatscha
2012: Basislinie 70m nach S verschoben, um Einsicht bis Gletscherzunge zu gewahrleisten.
(G. Bott)
2013:Basislinie 70m nach S verschoben, um Einsicht bis Gletscherzunge zu erhalten. (G. Bott)
98 Lischana
2013: Aufgrund der starken Schuttbedeckung des Gletschers ist die Vermessung je langer je
schwieriger. Das Resultat einer positiven Langenanderung ist nicht plausibel. (G.-C. Feuer-
stein)
103 Bresciana
2012: La parte terminale del ghiacciaio ha un andamento orizzontale ed e molto ripida. Solo
rilievo fotografico neve sul fronte del ghiacciaio. (C. Valeggia)
104 Basodino
2012: Controllato alcuni punti con profilo 2012, spessore di ghiaccio scomparso da 110 a
150 cm. Nel 2001 e 2011 abbiamo rilevato tutto il fronte del ghiacciaio come pure nel 2012
con un arretramento medio in dieci anni di oltre 160 metri, la parte centrale arriva anche a
290 metri. In futuro bisognera spostare la zona del rilievo nella parte centrale del ghiacciaio.
Il fronte ora misurato non rappresenta la situazione attuale. (C. Valeggia)
105 Rossboden
2012: Messpunkte nicht gefunden bzw. nicht zuganglich (M. Gerold)
2013: Messpunkte nicht mehr auffindbar bzw. erreichbar. (M. Gerold)
112
B. Remarks on Individual Glaciers
109 Alpetli (Kanderfirn)
2012: Grossere Felsblocke frisch ausgeapert im Mittelteil der auslaufenden Gletscherzunge.
(U. Fuhrer)
2013: Der fortschreitende Gletscher-Ruckzug erreicht nun fast das breite Dolomitband.
(U. Fuhrer)
111 Ammerten
2012: Die Messung bei P1 war diesmal positiv – wir sind dort so sehr am Rand, dass die
Messung in Langsrichtung leider sehr einfach zu grossen Abweichungen fuhrt. Das ist nicht
ganz optimal. Der Mittelwert ist aussagekraftiger und der Vorstoss dieses Jahr nicht wirklich
relevant. (W. Hodel)
112 Dungel
2012: Der Gletscher war vollstandig von einer geringmachtigen Schneedecke uberzogen. Das
Vorfeld war mehrheitlich schneefrei und die Vermessung gelang deshalb ohne Probleme. Der
direkt an die Zunge anschliessende See ist im Vergleich zu 2011 etwas grosser geworden.
(A. Wipf)
113 Gelten
2012: Die Zunge war vollstandig ausgeapert. Die ehemalige Hauptzunge ist noch schmaler
geworden. Weiter ostlich oberhalb einer Terrasse bildet der Gletscher eine breite, leicht gegen
Nordosten abfallende Front. Im Westen stirnt der Gletscher auf ca. 2600m.u.M immer noch
in einen kleinen See. Dieser hat sich gegenuber dem letzten Jahr leicht vergrossert. Mittler-
weile hat sich ein sehr schones Gletschertor ausgebildet. (A. Wipf)
114 Plattalva
2012: Bei Punkt 5 verlauft der Gletscherrand spitzwinklig zu Messrichtung ganzer Gletscher
mit Neuschnee bedeckt, oberes Firngebiet verschwunden (U. Steinegger)
2013: Bei Punkt 5 verlauft der Gletscherrand spitzwinklig zu Messrichtung, Gletscherzunge
mit Neuschnee bedeckt, Firnschnee meist bis zur Zunge (U. Steinegger)
115 Scaletta
2012: Auffallig ist wie der Felsriegel in der Mitte zwischen den 2 Gletscherteilen immer grosser
wird. Im nordlichen Teil sind die Spalten am Zusammenschmelzen. (B. Teufen)
2013: Fixpunkt A war unter Murgangschutt begraben, wieder freigelegt. Wegen Lawinen-
schnee auf dem Gletscherende konnten keine Messungen gemacht werden. (B. Teufen)
117 Valleggia
2012: Controllato alcuni punti con profilo 2011, spessore di ghiaccio scomparso varia da 350
a 450 cm. (C. Valeggia)
113

The Swiss Glaciers 2011/12 and 2012/13
118 Val Torta
2012: Il ghiacciaio e estinto (ghiacciaio morto) e non ha piu una zona di alimentazione. Esiste
ancora un nevaio (C. Valeggia)
119 Cavagnoli
2012: Controllato 3 punti con profilo anno 2011 spessore di ghiaccio scomparso 250 cm. La
parte terminale del ghiacciaio continua a ritirarsi, ad appiattirsi e a perdere spessore favorita
dal fatto che termina in una zona pianeggiante con un laghetto. Il ghiacciaio non dispone piu
di una zona di accumulo e la tendenza, in atto da parecchi anni, di dividersi in campi isolati
di ghiaccio morto continua. Lo spessore di ghiaccio scomparso dal 2011 al 2012 varia da 210
a 250 cm. (C. Valeggia)
120 Corno
2012: La parte di ghiacciaio rimasta attiva con zona di accumulo e una di ablazione ha perso
di spessore nel periodo 2011-2012 che varia da 160 a 430 cm. (C. Valeggia)
2013: Profilo non misurato. Considerata una superficie di ca. 70x80m di ghiaccio morto, in
quanto non piu alimentata dal resto del ghiacciaio. (M. Soldati)
173 Seewjinen
2012: Luftbildaufnahmen am 20.9.2012, photogrammetrische Auswertung durch VAW/ETHZ
im Auftrag der Kraftwerke Mattmark AG. (VAW/ETHZ – A. Bauder)
2013: Luftbildaufnahmen am 4.9.2013, photogrammetrische Auswertung durch VAW/ETHZ
im Auftrag der Kraftwerke Mattmark AG. (VAW/ETHZ – A. Bauder)
174 Hohlaub
2012: Luftbildaufnahmen am 20.9.2012, photogrammetrische Auswertung durch VAW/ETHZ
im Auftrag der Kraftwerke Mattmark AG. (VAW/ETHZ – A. Bauder)
2013: Luftbildaufnahmen am 4.9.2013, photogrammetrische Auswertung durch VAW/ETHZ
im Auftrag der Kraftwerke Mattmark AG. (VAW/ETHZ – A. Bauder)
352 Croslina
2012: Controllato 3 punti con profilo 2011, spessore di ghiaccio scomparso varia da 220 a
280 cm. Il rilievo del profilo ha mostrato variazioni di spessore da 220 a 280 cm. Il ghiacciaio
non dispone piu di una zona di accumulo e la tendenza, in atto da parecchi anni e la sua
estinzione. (C. Valeggia)
353 Camadra
2012: Controllato profilo longitudinale con anno 2011, spessore di ghiaccio scomparso me-
diamente di circa 150 cm. Il ghiacciaio non dispone piu di una zona di accumulo e la tendenza,
in atto da parecchi anni e la sua estinzione. (C. Valeggia)
114
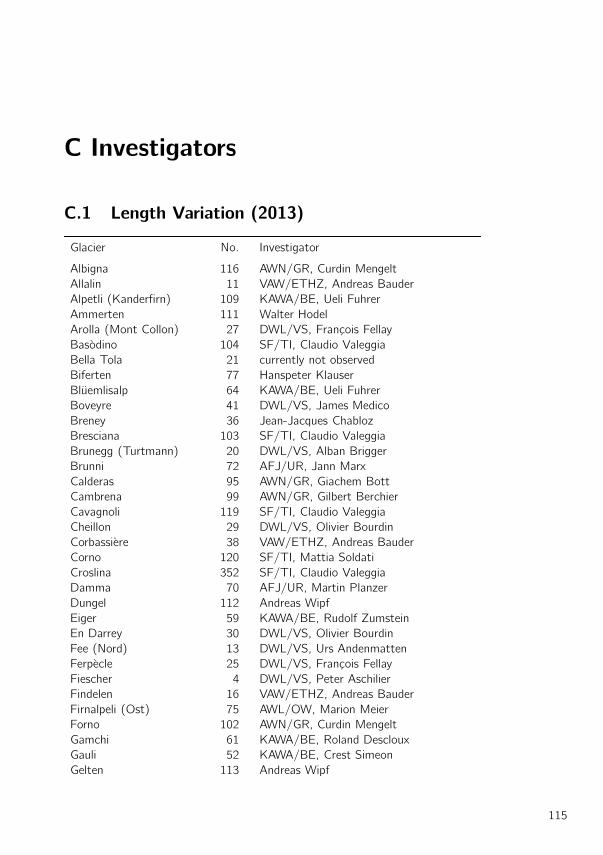
C Investigators
C.1 Length Variation (2013)
Glacier No. Investigator
Albigna 116 AWN/GR, Curdin Mengelt
Allalin 11 VAW/ETHZ, Andreas Bauder
Alpetli (Kanderfirn) 109 KAWA/BE, Ueli Fuhrer
Ammerten 111 Walter Hodel
Arolla (Mont Collon) 27 DWL/VS, Francois Fellay
Basodino 104 SF/TI, Claudio Valeggia
Bella Tola 21 currently not observed
Biferten 77 Hanspeter Klauser
Bluemlisalp 64 KAWA/BE, Ueli Fuhrer
Boveyre 41 DWL/VS, James Medico
Breney 36 Jean-Jacques Chabloz
Bresciana 103 SF/TI, Claudio Valeggia
Brunegg (Turtmann) 20 DWL/VS, Alban Brigger
Brunni 72 AFJ/UR, Jann Marx
Calderas 95 AWN/GR, Giachem Bott
Cambrena 99 AWN/GR, Gilbert Berchier
Cavagnoli 119 SF/TI, Claudio Valeggia
Cheillon 29 DWL/VS, Olivier Bourdin
Corbassiere 38 VAW/ETHZ, Andreas Bauder
Corno 120 SF/TI, Mattia Soldati
Croslina 352 SF/TI, Claudio Valeggia
Damma 70 AFJ/UR, Martin Planzer
Dungel 112 Andreas Wipf
Eiger 59 KAWA/BE, Rudolf Zumstein
En Darrey 30 DWL/VS, Olivier Bourdin
Fee (Nord) 13 DWL/VS, Urs Andenmatten
Ferpecle 25 DWL/VS, Francois Fellay
Fiescher 4 DWL/VS, Peter Aschilier
Findelen 16 VAW/ETHZ, Andreas Bauder
Firnalpeli (Ost) 75 AWL/OW, Marion Meier
Forno 102 AWN/GR, Curdin Mengelt
Gamchi 61 KAWA/BE, Roland Descloux
Gauli 52 KAWA/BE, Crest Simeon
Gelten 113 Andreas Wipf
115
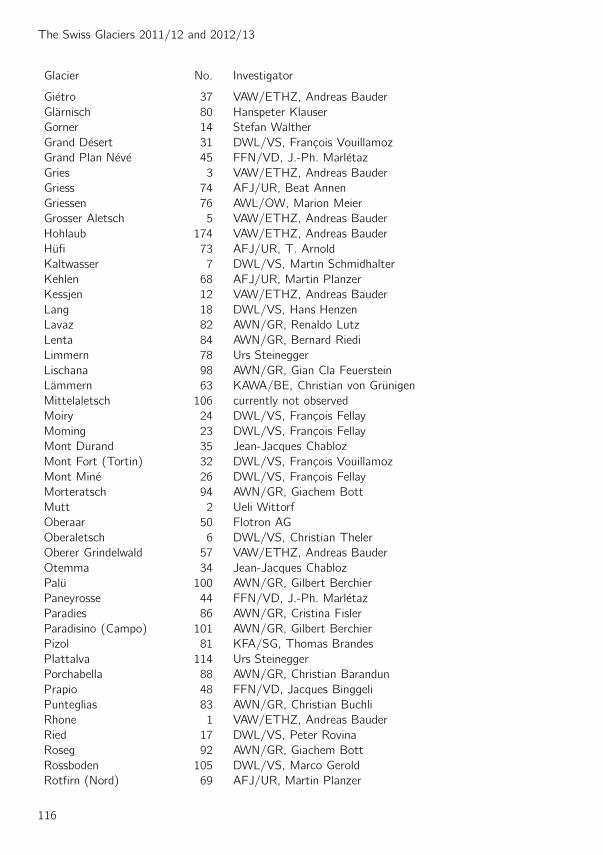
The Swiss Glaciers 2011/12 and 2012/13
Glacier No. Investigator
Gietro 37 VAW/ETHZ, Andreas Bauder
Glarnisch 80 Hanspeter Klauser
Gorner 14 Stefan Walther
Grand Desert 31 DWL/VS, Francois Vouillamoz
Grand Plan Neve 45 FFN/VD, J.-Ph. Marletaz
Gries 3 VAW/ETHZ, Andreas Bauder
Griess 74 AFJ/UR, Beat Annen
Griessen 76 AWL/OW, Marion Meier
Grosser Aletsch 5 VAW/ETHZ, Andreas Bauder
Hohlaub 174 VAW/ETHZ, Andreas Bauder
Hufi 73 AFJ/UR, T. Arnold
Kaltwasser 7 DWL/VS, Martin Schmidhalter
Kehlen 68 AFJ/UR, Martin Planzer
Kessjen 12 VAW/ETHZ, Andreas Bauder
Lang 18 DWL/VS, Hans Henzen
Lavaz 82 AWN/GR, Renaldo Lutz
Lenta 84 AWN/GR, Bernard Riedi
Limmern 78 Urs Steinegger
Lischana 98 AWN/GR, Gian Cla Feuerstein
Lammern 63 KAWA/BE, Christian von Grunigen
Mittelaletsch 106 currently not observed
Moiry 24 DWL/VS, Francois Fellay
Moming 23 DWL/VS, Francois Fellay
Mont Durand 35 Jean-Jacques Chabloz
Mont Fort (Tortin) 32 DWL/VS, Francois Vouillamoz
Mont Mine 26 DWL/VS, Francois Fellay
Morteratsch 94 AWN/GR, Giachem Bott
Mutt 2 Ueli Wittorf
Oberaar 50 Flotron AG
Oberaletsch 6 DWL/VS, Christian Theler
Oberer Grindelwald 57 VAW/ETHZ, Andreas Bauder
Otemma 34 Jean-Jacques Chabloz
Palu 100 AWN/GR, Gilbert Berchier
Paneyrosse 44 FFN/VD, J.-Ph. Marletaz
Paradies 86 AWN/GR, Cristina Fisler
Paradisino (Campo) 101 AWN/GR, Gilbert Berchier
Pizol 81 KFA/SG, Thomas Brandes
Plattalva 114 Urs Steinegger
Porchabella 88 AWN/GR, Christian Barandun
Prapio 48 FFN/VD, Jacques Binggeli
Punteglias 83 AWN/GR, Christian Buchli
Rhone 1 VAW/ETHZ, Andreas Bauder
Ried 17 DWL/VS, Peter Rovina
Roseg 92 AWN/GR, Giachem Bott
Rossboden 105 DWL/VS, Marco Gerold
Rotfirn (Nord) 69 AFJ/UR, Martin Planzer
116
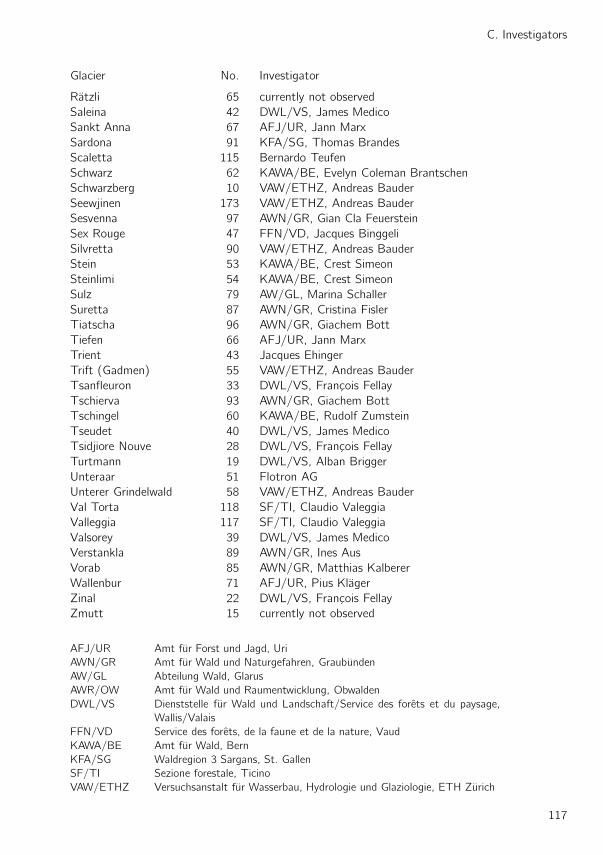
C. Investigators
Glacier No. Investigator
Ratzli 65 currently not observed
Saleina 42 DWL/VS, James Medico
Sankt Anna 67 AFJ/UR, Jann Marx
Sardona 91 KFA/SG, Thomas Brandes
Scaletta 115 Bernardo Teufen
Schwarz 62 KAWA/BE, Evelyn Coleman Brantschen
Schwarzberg 10 VAW/ETHZ, Andreas Bauder
Seewjinen 173 VAW/ETHZ, Andreas Bauder
Sesvenna 97 AWN/GR, Gian Cla Feuerstein
Sex Rouge 47 FFN/VD, Jacques Binggeli
Silvretta 90 VAW/ETHZ, Andreas Bauder
Stein 53 KAWA/BE, Crest Simeon
Steinlimi 54 KAWA/BE, Crest Simeon
Sulz 79 AW/GL, Marina Schaller
Suretta 87 AWN/GR, Cristina Fisler
Tiatscha 96 AWN/GR, Giachem Bott
Tiefen 66 AFJ/UR, Jann Marx
Trient 43 Jacques Ehinger
Trift (Gadmen) 55 VAW/ETHZ, Andreas Bauder
Tsanfleuron 33 DWL/VS, Francois Fellay
Tschierva 93 AWN/GR, Giachem Bott
Tschingel 60 KAWA/BE, Rudolf Zumstein
Tseudet 40 DWL/VS, James Medico
Tsidjiore Nouve 28 DWL/VS, Francois Fellay
Turtmann 19 DWL/VS, Alban Brigger
Unteraar 51 Flotron AG
Unterer Grindelwald 58 VAW/ETHZ, Andreas Bauder
Val Torta 118 SF/TI, Claudio Valeggia
Valleggia 117 SF/TI, Claudio Valeggia
Valsorey 39 DWL/VS, James Medico
Verstankla 89 AWN/GR, Ines Aus
Vorab 85 AWN/GR, Matthias Kalberer
Wallenbur 71 AFJ/UR, Pius Klager
Zinal 22 DWL/VS, Francois Fellay
Zmutt 15 currently not observed
AFJ/UR Amt fur Forst und Jagd, Uri
AWN/GR Amt fur Wald und Naturgefahren, Graubunden
AW/GL Abteilung Wald, Glarus
AWR/OW Amt fur Wald und Raumentwicklung, Obwalden
DWL/VS Dienststelle fur Wald und Landschaft/Service des forets et du paysage,
Wallis/Valais
FFN/VD Service des forets, de la faune et de la nature, Vaud
KAWA/BE Amt fur Wald, Bern
KFA/SG Waldregion 3 Sargans, St. Gallen
SF/TI Sezione forestale, Ticino
VAW/ETHZ Versuchsanstalt fur Wasserbau, Hydrologie und Glaziologie, ETH Zurich
117

The Swiss Glaciers 2011/12 and 2012/13
C.2 Mass Balance and Velocity
Glacier No. Investigator
Allalin 11 VAW/ETHZ, Andreas Bauder
Basodino 104 Giovanni Kappenberger
Clariden 141 Giovanni Kappenberger
Corbassiere 38 VAW/ETHZ, Andreas Bauder
Findelen 16 DGUF / GIUZ, Matthias Huss, Nadine Salz-
mann, Gwendolyn Leysinger-Vieli
Gietro 37 VAW/ETHZ, Andreas Bauder
Gries 3 VAW/ETHZ, Martin Funk
Grosser Aletsch 5 VAW/ETHZ, Andreas Bauder
Hohlaub 174 VAW/ETHZ, Andreas Bauder
Oberaar 50 Flotron AG
Pizol 81 VAW/ETHZ / DGUF, Matthias Huss
Plaine Morte 65 DGUF, Matthias Huss
Rhone 1 VAW/ETHZ, Andreas Bauder
Sankt Anna 67 DGUF, Mauro Fischer
Schwarzberg 10 VAW/ETHZ, Andreas Bauder
Silvretta 90 VAW/ETHZ, Andreas Bauder
Tsanfleuron 33 DGUF, Matthias Huss
Unteraar 51 Flotron AG
Flotron AG Flotron AG, Meiringen
VAW/ETHZ Versuchsanstalt fur Wasserbau, Hydrologie und Glaziologie,
ETH Zurich
GIUZ Geographisches Institut, Universitat Zurich
DGUF Departement des Geosciences, Universite de Fribourg
118