Embed Size (px)
Citation preview

y. Exp. Biol. (1971), 55, S21-540 5 2 1With 8 text-figures
Printed in Great Britain
THE SWIMMING ENERGETICS OF TROUT
II. OXYGEN CONSUMPTION AND SWIMMING EFFICIENCY
BY P. W. WEBB*
Department of Zoology , University of Bristol, Bristol
(Received 30 March 1971)
INTRODUCTION
In the preceding paper (Webb, 1971) the thrust and power output of rainbow troutswimming at subfatigue levels were calculated from the effects of extra drag loads onthe frequency and amplitude of the tail beat. These data can be compared with theexpected power made available to the propulsive system, calculated from the oxygenconsumption of the fish, in order to calculate the aerobic efficiency of swimming. Thecalculation of aerobic efficiency, and the assumptions involved, have been discussed byBrett (1962, 1963) and Smit (1965). One of these assumptions is that no portion ofthe total energy expenditure is obtained from anaerobic respiration. This assumptiondoes not apply where increasing velocity increments have been used, culminating infatigue (Brett, 1964). No data are available on the anaerobic respiration of fish in anincreasing-velocity test. However, since these tests lead to exhaustion of the fish, thetotal anaerobic fraction can be calculated from measurements of oxygen and/or lactatedebt following exhaustion (see Black et al. 1962). An attempt is made in this paper toextend the efficiency calculations to include the anaerobic fraction of energy expenditure,on the basis of total debt measurements reported in the literature.
In studies of fish propulsive energetics the expected thrust power output has some-times been calculated from oxygen-consumption data (Smit, 1965) or body-fuel de-pletion (Osborne, 1961) by assuming values for the efficiency of the muscles andcaudal propeller. It is usually assumed that fish muscles have similar properties toother animal muscle systems, and that the caudal propeller will be as efficient asman-made propellers. The latter assumption is supported by mathematical modelsof swimming (see, for example, Taylor, 1952; Lighthill, i960, 1970; Hertel, 1966);however, no experimental evidence is available. Therefore, the aerobic efficiencyhas been calculated for five groups of fish, four with extra drag loads attached. Theloads caused changes in the parameters of the propulsive wave (Webb, 1971) and thesecan be related to expected changes in muscle efficiency in order to calculate theefficiency of the caudal propeller.
MATERIALS AND METHODS
The methods used were basically similar to those described by Webb (1971). ABrett respirometer with a circular chamber (Brett, 1964) was used in its originalcapacity as a water treadmill. The upstream half of the chamber was covered with
* Present Address: Fisheries Research Board of Canada, Biological Station, Nanaimo, B.C.

522 P. W. WEBB
black Polythene sheeting, while the downstream half was strongly illuminated. Thisimproved the station-holding ability of the fish.
Experiments were performed on five groups offish: a control group, and groups 1-4with extra drag loads. The values of these loads were calculated from the data inWebb (1971).
The water velocity in the fish chamber was increased in 0-2 ft/sec increments for
the control group and groups 1-3, and in o*i ft/sec increments for group 4, until thefish was exhausted. The time to fatigue was recorded. The critical swimming speedwas calculated by adjusting the last velocity increment in proportion to the time for
which the fish swam after that increment (Brett, 1964; Webb, 1971). The experimentalprocedure differed from that described earlier in that the test period was increasedto 60 min.
During the 45 min of the test period, water was recirculated through an aeratingsystem to maintain the dissolved oxygen content of the water close to air-saturation.During the 3Oth~45th min of any test period the respirometer was isolated from theaerating circulation. The decrease in dissolved oxygen content of the water wasmeasured from two sets of 150 ml water samples, taken at the beginning and the endof the 15 min period, using the Alstberg modification of the Winkler Method (StandardMethods, 1967). From the decrease in water oxygen content, the oxygen consumptionof the fish was calculated in mg O2/kg/h.
The dissolved oxygen content of the respirometer water never fell below 60 % air-saturation. At the highest swimming speeds, and oxygen consumption rates, theoxygen content did not usually fall below 75 % air saturation.
It was observed that each velocity increment was associated with a limited amountof unsteady swimming, lasting for a maximum of 5 min. The time period selected forthe measurement of oxygen consumption gave sufficient time for the fish to settledown after this period. There was also sufficient time to replace the oxygen usedduring the 15 min period before the next velocity increment.
All experiments were performed at 15 + 0-2 °C, which was the same as the acclima-tion temperature for the fish. The experiments were performed in spring and summermonths.
The characteristics of the fish used are shown in Table 1.
Table 1. Characteristics (mean and 2 standard errors) of the fish usedto measure oxygen consumption
Wettedsurface Muscle
Length Depth Width area Mass mass SpeedGroup (L, cm) (rf, cm) (w, cm) (S, cm3) (M, g) (Mm, g) correction
Control 29*2107 5710-3 2-910-2 — 2637126-6 128-9117*9 1*12— = o*oiL3 = o*49-M
Group 1 29*4 + 0*4 5-810-2 3*olo*i 348*4114-1 270*91267 138*214-3 1-14= o*4oLa = o*oiL3 = o*5om
Group 2 3o-iio*5 6-ilo*2 3*iio*i 354'9i27*8 291*4133*6 145*4119*4 1*13= o*39L2 = o*oiL8 = o*5oM
Group 3 29710*3 5-910*2 3*olo-i 357-9128-0 258-4129-4 137-0118-9 1*14= o*4iL2 '== o-oiL3 =
Group 4 30-0 + 0*3 5*9lo*2 3*ilo-i 359-9113*1 278*9116*2 145'= o-oiL8 =

The swimming energetics of trout. II 523
RESULTS
Oxygen consumption
Relationship between oxygen consumption and swimming speed
The results for the oxygen consumption of trout at various cruising speeds aregiven in Table 2. The relationship between the logarithm of oxygen consumption andswimming speed was found to be linear in all five groups of fish (Fig. 1) with the slopeincreasing with the size of the extra drag loads. The linear relationship supportsBrett's (1964) hypothesis that this sort of relationship would be typical for fish. Theregression equations relating logarithm oxygen consumption to swimming speed aregiven in Table 3.
Table 2. Oxygen consumption and swimming speeds for the five groups of trout
Swimmingspeed
(cm/sec,mean)
IO-2
16-924-230-637*444*251-057*964-2
10-317*324*731-1
38-o44*752-0
10-317*224*130-937*9
10-4
17*324*731-2
10-313*717-1120-5
23*927*5
2 S.E.S
0 70-40-3o-6o-80-9I - I
i*3—
0-3
o-60 6 2o-8i - o1-4—
O-2
0-30-4o-6o-8
o*5o-80 71 7
o*5o-60 70-9I - I—
Oxygenconsumption(mg O2/kg/h,
mean)
Control group
147*3150-2199-4237*9294*4355*1488-0657*4954*3
Group 1
112-4
1507206-1268-7365*2486-2614-4
Group 2
127*3166-6226-3336-3474-6
Group 3
142-7211*5
354*5496-6
Group 4
141-51699229-1314-0354*8">24*I
2 S.E.S
IO'4J8*512*12O*318-027*562-1
587—
1 6 715*621-922-83O-240-9
io-810-929-02 6 841-6
24*527*561-353*8
24*5II-221-3
47*427-8—
No. f
41 0
1 0
1 0
1 0
1 0
1 0
72
81 2
1 1
9971
1 1
1 1
1 1
1 0
1 0
1 0
1 0
1 0
7
1 1
1 0
1 1
1 0
81
P. W. WEBB
ij/
10 20 30 40 10 20 30Swimming speed (cm/sec)
10 30
Fig. i. Relationship between oxygen consumption ana swimming speed in the live groupsof trout. Vertical and horizontal bars represent two standard errors about the mean oxygenconsumption and swimming speed. The vertical solid lines represent the critical swimmingspeed, the vertical dotted lines 2 standard errors about the mean.
Standard oxygen consumption
The standard rate of oxygen consumption was calculated by extrapolating the logoxygen consumption/speed relationship to zero swimming speed. The mean standardrate for all five groups of fish was 72-5 mg O2/kg/h, with the control group and groups1-3 falling between 74 and 76 mg O2/kg/h. The value for group 4, with the steepestslope, was 63-4 mg O2/kg/h. The values for standard oxygen consumption agreereasonably well with the standard rate of 95 mg O2/kg/h measured by Skidmore (1970)

The swimming energetics of trout. II $25
for fish of the same size and stock, confined in a small darkened chamber. Brett (1965)obtained a value of 73 mg O2/kg/h for sockeye salmon of the same weight using thesame method as used in the present paper.
Table 3. Linear regression equations relating log oxygen consumptionand swimming speed calculated for the data in Table 2
(Critical swimming speeds and standard and active rates of oxygen consumption also shown.)
ControlGroup iGroup 3Group 3Group 4
Linear regressionLogO2 = 1-878 + 0-016^LogO2 = 1-870+0-018^Log O2 = i-87o+o-o2iF"LogO2 = 1-878+0-027^LogO2 = 1-802+0-033^
Criticalswimming
speed(cm/sec)
58-i ±5-545-1 ±2-137-2 ±2-328-6 ±3-223-7 + 1-3
Standardoxygen
consumption(mg/kg/h)
75'574-174-175*563-4
Activeoxygen
consumption(mg/kg/h)
658480447435378
Active oxygen consumption
The active rate of oxygen consumption was 658-5 mg O2/kg/h in the control group,and fell in groups 1-4 as the size of the extra drag load increased. This is expected,as although all fish are assumed to make their maximum effort at the critical swimmingspeed, the rate at which they work is proportional to the critical swimming speed.This fails with increasing size of the load, and therefore so does the power outputand hence oxygen consumption.
The critical swimming speed
The critical swimming speed for the control group was 58-1 cm/sec (2 body lengths/sec). Critical swimming speeds for all the groups of fish were about 10 % higher thanthose measured in the previous paper (Webb, 1971). Usually, a decrease in the testperiod is associated with an increase in the critical speed (Bainbridge, 1962; Brett,1964, 1967; Dahlberg, Shumway & Doudoroff, 1968). Brett (1967) found that de-creasing the test period from 60 to 45 min increased the critical swimming speed ofsockeye salmon from 4-1 to 4-2 L/sec. However, Brett (1964) found that there was agreater difference in the critical swimming speed dependent on the time of year atwhich the measurements were made. Thus, winter sockeye salmon reached a criticalspeed of 3-2 L/sec. while summer fish swam at 4-0 L/sec. This is a decrease of 20%in the winter fish. The same phenomenon is probably the source of the higher summerspeeds obtained here.
DISCUSSION
Aerobic efficiency of cruising swimming
The cruising efficiency is defined as:
energy required to develop thrust_
aerob energy available from consumed oxygen'
(i)
This efficiency is identical to that considered by Brett (1963) and Smit (1965), whocalculated ET from the drag of a dead fish and of an equivalent rigid body, respectively.

526 P. W. WEBB
The proportion of oxygen used in swimming
The oxygen consumed for locomotion is usually calculated as the difference betweenthe oxygen consumption at any speed, and the standard rate (Brett, 1963, 1964, 1965;Smit, 1965). At the critical swimming speed this difference is
active—standard = metabolic scope (Fry, 1957).
The validity of this method depends on the standard rate remaining constant duringswimming activity, and on no oxygen being used elsewhere as a result of activity.Brett (1963) stresses that the standard rate is the lowest deductable value from thetotal oxygen consumption at any speed.
Two factors could give rise to error in the calculation of the oxygen used in swim-ming. These are increased activity of the ventilatory muscles and the heart. Webb(1971) has suggested that the extra ventilatory work would mainly be performed bythe propulsive muscle, and therefore .contribute to drag. Although fish like the troutventilate during swimming (i.e. use opercular movements), the changes in rate anddepth of ventilation with increasing speed and oxygen demand are not significant.Hence it is doubtful if increased ventilation during swimming is mediated by theventilatory muscles.
Cameron & Cech (1970) have measured the weight of the ventilatory muscle inseveral species of mullet (Mugil). The mean ventilatory muscle weight was 1-5 % ofthe body weight. If the trout had a similar amount of ventilatory muscle, and if itconsumed oxygen at the same rate as the red muscle, representing 8*6 % of the bodyweight (Webb, 1970), then a maximum error of 16% would be introduced in thecalculation of the oxygen used in swimming at the critical swimming speed. The errorwill, in practice, be very much lower than this, as it is doubtful if the ventilatorymuscle increases the amount of work done during swimming. In addition, some of themuscle is white muscle, which has a lower rate of oxygen consumption than red muscle(Wittenberger & Diatcuic, 1965).
Heart rate increases markedly during swimming (Smith, Brett & Davies, 1967;Stevens & Randall, 1967; Sutterlin, 1969). Jones (1971) has calculated that the heartcould consume about 6 % of the active rate of oxygen consumption, when workingunder optimum conditions.
The contributions of the heart and ventilatory muscle to the swimming oxygenconsumption will result in the calculation of a value for ^aerob slightly lower than thatexpected for the mechanical system. However, the values calculated for ^aeroi)w^include the costs of supply of metabolites and removal of waste from the skeletaltissues, and as such are more meaningful in terms of the overall locomotor activity.
A further factor affecting the validity of calculating the oxygen availability forswimming appears to apply here. Critical examination of the active rate of oxygenconsumption for the control group suggests that the value is high. The active rate of658mgO2/kg/h for the trout swimming at 58*1 cm/sec is higher than the value532 mg O2/kg/h recorded by Rao (1968) for fish of the same species swimming atspeeds greater than 58 cm/sec. The value measured here is only a little lower thanthe value of 690 mg O2/kg/h measured by Brett (1965) for sockeye salmon swimmingat 96 cm/sec. Both these active rates were measured for fish of the same weight as

The swimming energetics of trout. II S27
those used in the present paper. The fish used here have already been shown to havea poor swimming ability in comparison with other salmonids (Webb, 1971). It there-fore appears unlikely that they should have such a relatively high active rate.
The active rate of oxygen consumption also appears high in comparison with thevalues for the other four groups with extra drag loads. This is readily seen when theresults for the four groups are normalized with respect to mechanical parameters ofthe propulsive system, as is shown in Fig. 6. The control group can only be fitted onthis figure after the active rate has been reduced to a more typical level.
It might be considered that the latter effect is a result of the extra drag loads inter-fering with the fish. However, fish were allowed to recover for about 30 h after theoperation, which is longer than the time recommended for recovery from dorsalaortic cannulation (Houston, DeWilde & Madden, 1969). Furthermore, active ratesof oxygen consumption for the loaded groups are more similar to the rates expectedin comparison with other salmonids.
The active rate in the loaded groups is expected to be depressed to some extent,not only through a decrease in the maximum power output of the fish with increasingload, but also through a reduction in the efficiency of ventilation. This is basicallyram-jet, and therefore as the critical swimming speed falls with increasing load, sowill the pressure of the water at the mouth. However, it appears that this effect is small,as the active rates of oxygen consumption in groups 1-4 do not fall in the same wayas the fall from the control group to group 1. Furthermore, normalization of the datawith reference to the mechanical properties of the propulsive system (see Fig. 6) wouldbe expected to show efficiency reductions from group 1 to group 4 which were notcorrelated with these mechanical properties. In practice this is not found.
£" 500
400
300
200
100
6 I10 20 30 40 50
Swimming speed (cm/sec)60
Fig. 2. The oxygen consumption used in swimming for the control group of fish.
A further factor that might be expected to result in high control values is excessiveexcitement in the control group. Brett (1964) found that excitement tended to affectthe standard rates, rather than the active rates. Since the standard rates are comparablebetween the various groups, and it is the active rate that is apparently affected, it isdoubtful if the high active rate of oxygen consumption in the control group is theresult of excitement.
528 P. W. WEBB
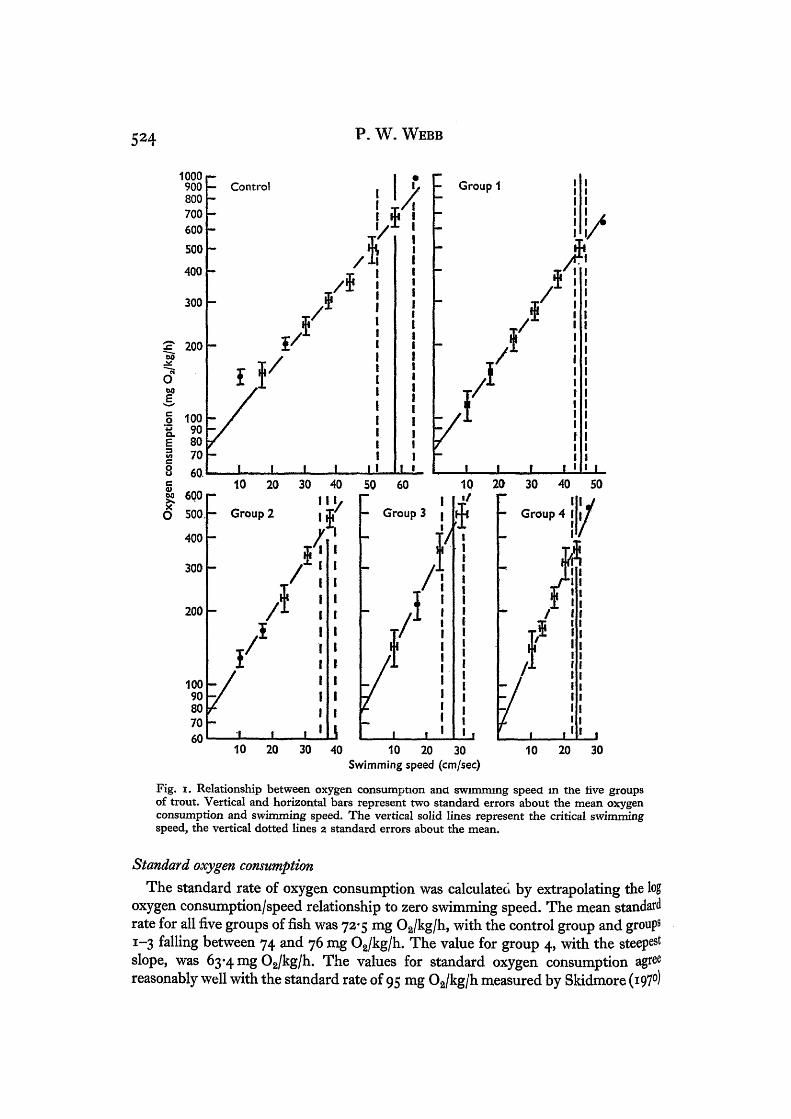
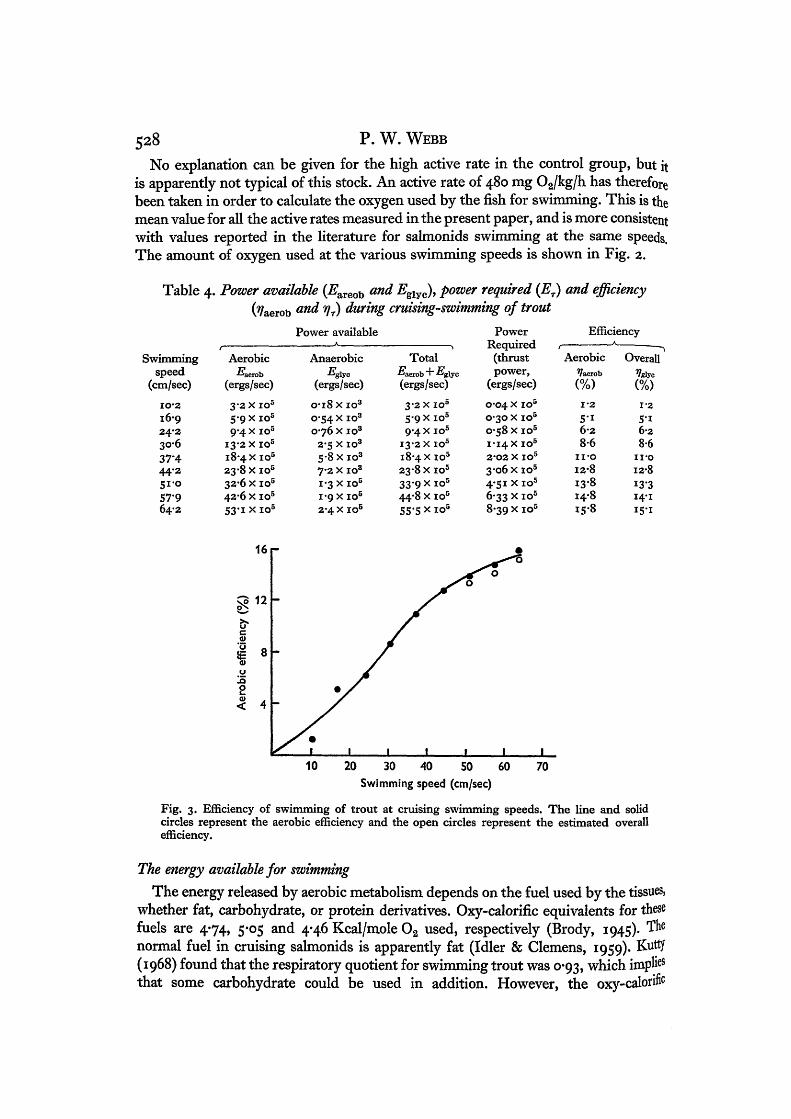
No explanation can be given for the high active rate in the control group, but itis apparently not typical of this stock. An active rate of 480 mg O2/kg/h has thereforebeen taken in order to calculate the oxygen used by the fish for swimming. This is themean value for all the active rates measured in the present paper, and is more consistentwith values reported in the literature for salmonids swimming at the same speeds.The amount of oxygen used at the various swimming speeds is shown in Fig. 2.
Table 4. Power available (-E reob an& giye)> power required (ET) and efficiency0/aerob and VT) during cruising-swimming of trout
Swimmingspeed
(cm/sec)
IO-216-924*230-637-444-251-057'964-2
t
Aerobic•"aerob
(ergs/sec)
3-3 x io5
5-9 x io5
9-4 x io5
13-2 x i o 5
18-4 x i o 5
33-8 x io5
33-6 x io5
43-6 x io5
53-1xio5
Power available
Anaerobic•Egiyc
(ergs/sec)
0-18 x io3
0-54 x io3
0-76 x io3
3-5 x io3
5-8 x io 3
7-3 x io3
i«3 x io5
1-9 x i o 5
3-4 x io5
Total•ZTaerob + Eglyc
(ergs/sec)3-3 xio 5
5-9 x io 5
9-4 x io5
13-3 x io5
18-4 x io5
23-8 x io5
33-9 x i o 5
44-8 x io5
55'5 x io5
PowerRequired
(thrustpower,
(ergs/sec)0-04 x io5
0-30 x io5
0-58 x io 5
114X io5
2-02 x io5
3-06 x io5
4-51 x io5
633 x io5
8*39 x io5
EfficiencyA
1
Aerobic'/aerob
( % )
1 - 2
5*16-28-6
II-O
12-813-814-815-8
Overall
(%)
1-3
5-1
6-38-6
II-O13-813-314-115*1
16
12
£ 8
2CD
<
10 20 30 40 SO 60
Swimming speed (cm/sec)
70
Fig. 3. Efficiency of swimming of trout at cruising swimming speeds. The line and solidcircles represent the aerobic efficiency and the open circles represent the estimated overallefficiency.
The energy available for swimming
The energy released by aerobic metabolism depends on the fuel used by the tissues,whether fat, carbohydrate, or protein derivatives. Oxy-calorific equivalents for thesefuels are 474, 5-05 and 4-46 Kcal/mole O2 used, respectively (Brody, 1945). Thenormal fuel in cruising salmonids is apparently fat (Idler & Clemens, 1959). Kutty(1968) found that the respiratory quotient for swimming trout was 0*93, which impliesthat some carbohydrate could be used in addition. However, the oxy-calorific

The swimming energetics of trout. II 529
equivalent for fat has been used here to calculate the energy available for swimming.This is close to the mean for all three fuels, and its use can only introduce a maximumerror of ± 6 % (Brett, 1962).
The energy equivalent of the consumed oxygen is therefore taken as 1*47 xio 8 ergs/mg O2. The amount of energy released by aerobic respiration, EaeTOli is shown for thevarious swimming speeds of the control group in Table 4.
Aerobic efficiencyValues for the power output of the fish taken from Webb (1971) are included in
Table 4. These are the values of Er. The values for ET were used to calculate from equation (1), and are shown graphically in Fig. 3. The maximum ^aerobI5%- This is comparable with values reported for sustained activity in man, cal-culated by a similar method (Malomsoki & Nemessuri, 1967).
Overall efficiency
The fish were exhausted at the end of any experiment, and it is probable that someportion of their total energy expenditure was derived from anaerobic respiration.Therefore, an overall efficiency can be defined:
™ **i /2)
energy released by anaerobic respiration+-£aerOb
•"glyc "•" -"aerob
The amount of energy made available from anaerobic respiration is unknown. Thetotal amount of Eglvc could, in principle, be calculated from measurements of theoxygen debt; alternatively, it could be calculated from the total fuel depletion onexhausting the fish. The fuel is probably carbohydrates (Black et al. 1962). Theanaerobic energy fraction could therefore be measured in terms of lactate productionor carbohydrate depletion.
Oxygen debt
Brett (1964) measured the oxygen debt in sockeye salmon following exercise. Thedebt was measured as the oxygen consumption in excess of the standard rate. It wasnot possible to measure the total debt directly since the fish began to move spon-taneously after about 3-4 h, and before oxygen consumption levels had returned tonormal levels. Black (19570, » c) n a s shown that a lactate debt persists in the bloodfor 8-12 h following exercise to exhaustion. It is also possible that the oxygen debtis not completely paid back. This would occur if some of the lactate produced duringexercise were excreted (Black et al. 1962). Thus the oxygen debt is likely to be anunreliable method for measuring the total Eglyc used in swimming.
Lactate debt
The lactate debt is related to the amount of glycolytic metabolism, and could berelated to Eglyc. Extensive studies on the relation between lactate debt and exercisehave been made particularly by Black and his collaborators (1962). However, becauseof the extended periods for which the lactate is present in the blood and tissues, it
3 4 EXB55

530 P. W. WEBB
is difficult to calculate the total debt. Moreover, some lactate may be excreted, andit is possible that some could be produced during recovery, for example, from theventilatory muscles.
Glycogen depletion
The most promising method of calculating the total anaerobic debt is from theamount of glycogen used up to exhaustion. The use of glycogen in the calculationassumes that no other source of energy is used. Black et al. (i960), Black, Robertson &Parker (1961) and Stevens & Black (1966) have shown that strenuous exercise doesnot result in the depletion of either muscle glucose or blood glucose or liver glycogen.Apparently, salmonids are unable to utilize glucose at a sufficiently high rate duringlocomotion for it to make a significant contribution to the total energy budget (Mac-Leod, Jonas & Roberts, 1963). Other carbohydrates are used in glycolytic metabolism -for example, inositol - but only in negligible quantities (Black et al. 1961).
Glycogen is the usual source of energy for the high levels of exercise which leadto exhaustion. In man, the amount of glycogen depleted is directly proportional tothe intensity and duration of such exercise (Ahlborg et al. 1967). This is probably alsotrue for the trout, as there is a direct correlation between the levels of lactate producedat different levels of activity and the amount of glycogen used (Black et al. i960).
In salmonids, glycogen is apparently not used during cruising levels of activity.Moderate activity is associated with very small levels of lactate in the blood, andnegligible decreases in glycogen (Miller, Sinclair & Hochachka, 1959; Black et al.i960; Black et al. 1962; Connor et al. 1964).
The amount of glycogen used up to exhaustion should, therefore, be representativeof the total amount of anaerobic respiration. The problem is further simplified becausethe rate of resynthesis of glycogen is low. As a result, the debt in terms of glycogen isaccumulative in the time used in these experiments (Stevens & Black, 1966). Therefore,the total amount of glycogen up to exhaustion was calculated from data in Miller et al.(1959), Black etal. (i960), Black etal. (1962), Miller & Miller (1962) and Wendt (1965,1967). The mean value from these sources was 0-19 g/100 g muscle wet weight. Themean weight of the fish used was 140 g. The muscle mass of the fish used here, com-parable with that sampled by the above authors, was 130 g. Hence the total amountof glycogen used up to exhaustion is of the order of 0*247 g.
Anaerobic respiration of glycogen results in the production of two moles of lactateand three moles of ATP (see for example Prosser & Brown, 1961). The free energychange on hydrolysis of one mole of ATP is about 12 kcal. Thus 1 mole of glycogencould make about 36 kcal available to the fish. This represents about 8-36 x io9 ergs,so that the energy made available from anaerobic respiration for these trout is of theorder of 2-06 x io9 ergs.
Anaerobic metabolism at cruising speeds
It has already been mentioned that moderate (cruising) activity is not associatedwith any significant levels of anaerobic respiration. However, in experiments of thesort where the swimming speed is increased by discrete increments, an oxygen debtof some sort is found at all levels of activity (Brett, 1964; Kutty, 1968). Furthermore

The swimming energetics of trout. II 531
this debt is apparently accumulative (Brett, 1964) and has the effect of reducing theexpected maximum swimming speed.
In man the commencement of any exercise period is associated with an increasein the blood lactate levels (Saiki, Margaria & Cuttica, 1967). This is apparently theresult of anaerobic respiration by the active tissues until the cardiovascular system isable to adjust to the new demands (di Prampero, Cerretelli & Piiper, 1970). It wasobserved that the trout swam irregularly for a period of about 3-5 min after eachvelocity increment. This is of the same order of time required by the cardiovascularsystem to adjust to a step increase in swimming speed (Stevens & Randall, 1967).Furthermore, when salmonids are forced to swim at cruising speeds for long periods,the amount of lactate in the blood falls.
Therefore, it is suggested that there is an anaerobic energy fraction used in thefirst few minutes of each increase in exercise level. This will be the source of theobserved oxygen debt, and lactate levels in the blood at low swimming speeds.
At higher cruising speeds greater than 80% of the critical speed, Webb (1970)observed that the white muscle system was used as well as the red muscle system. Thewhite muscle probably operates anaerobically (see Bone, 1966; George, 1962) and hencethese speeds are probably associated with a continual anaerobic energy fraction con-tributing to the total swimming budget.
The amount of anaerobic energy used in swimming
From the above discussion it is concluded that a small amount of anaerobic energyis used at the start of each swimming period. Otherwise, the total swimming energyrequirements are supplied aerobically, except at speeds greater than 80 % of the criticalspeed. Then, some proportion of the total energy expenditure is continuously derivedanaerobically.
The total amount of anaerobic energy has been distributed in proportion to thetime for which the system operates and the rate at which energy is dissipated. This isproportional to F2'8 (Webb, 1971), where V represents the swimming speed. Then,£"glyc at some swimming speed is proportional to F2"8£(Fig. 4), where t is 5 min at speedsless than 80 % of the critical swimming speed, and 60 min at speeds greater than this(Fig. 4). The total Eglyc is then
for all values of V. Then, at some speed Vif the anaerobic fraction Ei glyc is given by
2-o6xio9T2.8E* «yc = s(F2.8z) W** e rSs- (3)
The anaerobic energy expenditure in ergs/sec is calculated by dividing Eiglyc by3600 sec (the test period). Values for 2?glyc at each swimming speed have been cal-culated, and are shown in Table 4. These have been added to the aerobic energyfraction to calculate the overall efficiency from equation (2).
Overall efficiency
The overall efficiency is shown in Fig. 3 and Table 4. At all speeds the anaerobicenergy fraction is very small in comparison with the aerobic energy. The overall
34-3

532 P. W. WEBB
efficiency is only smaller than the aerobic efficiency by detectable amounts at higherswimming speeds, greater than 80% of the critical speed.
It must be realized that the above calculations are only rough approximations ofEgl c. However, they do suggest that future studies on the sustained activity of fishmay ignore this factor of anaerobic energy release, which is, in any case, an artifactof the experimental procedure.
Fig. 4. (A) Diagram illustrating the proposed use of anaerobic energy sources in an increasing-velocity test. Four speeds are represented, corresponding to 40, 60, 80 and 100 % of the criticalswimming speed. The solid line represents the energy made available from aerobic energysources. The shaded areas represent the energy made available continuously from anaerobicenergy sources, and the solid shading represents the anaerobic energy requirements at avelocity increment. At speeds greater than 80 % VCIa, the latter energy contribution is assumednegligible in comparison with the continual anaerobic energy contribution. (B) Proposedenergy changes over a 5 min period after a velocity increment. Note: the scales are notthe same for the aerobic and anaerobic contributions.
The efficiency of the muscles and caudal propeller
The efficiencies 7}T and ^aerot» a r e t n e products of the efficiencies of the muscles andcaudal propeller. Thus
V&QTOh ~ %nO x %» (4)
whereVmo ~ aerobic muscle efficiency
muscle mechanical power outputE.
andaerob
7jp — caudal propeller mechanical efficiencythrust power output (ET)
(5)
(6)muscle mechanial power output'Muscle efficiency
No data are available on the efficiency of fish muscle, so it must be assumed thatchanges in efficiency are related to some factor, like shortening speed during con-traction as in the muscles of other groups of animals (see Hill, 1950). Thus when theshortening speed is constant, it may then be assumed that efficiency is constant when

The swimming energetics of trout. II 533
the load is the same. It is assumed that the muscle mechanical efficiency is dependenton the shortening speed, and that the aerobic efficiency of the muscles in convertingfuel to useful energy substrates (ATP) is constant. Then, the aerobic efficiency fromequation (5) can also be considered to vary with shortening speed.
The propulsive muscles form an integral part of the propeller system. Thereforethe characteristics, frequency and amplitude of the propeller system (Webb, 1971) willalso represent the activity in terms of shortening speed of the muscles. In addition,the characteristics of the propeller system are linearly related to swimming speed(Bainbridge, 1958; Webb, 1971) and hence swimming speed will also be directlyrelated to muscle-shortening speeds.
Webb (1971) has shown that different groups of fish with extra loads of differentsizes can be compared with reference to their maximum levels of activity (the criticalswimming speed). Five levels of activity, representing 20, 40, 60, 80 and 100 % ofthe critical swimming speed (% VCIit) will therefore be considered. These levels ofactivity will represent muscle-shortening speeds which are the same in each group.It is assumed that the maximum red muscle power output will occur at VCTit. Thisimplies that the maximum efficiency will occur at some lower level of activity,probably about 70% VCTlt on the basis of Hill's (1950) observations. The swimmingspeed represented by this value of VCTlt would be more similar to a speed maintainedfor about 200 min, which Brett (1967) has suggested would be more representativeof true sustained activity. The implication is, then, that true sustained activity wouldbe associated with maximum red muscle efficiency.
Assuming further that the maximum value of ?/m0 is 20 %, then the diagram givenby Hill (1950) can be used to construct a curve relating aerobic muscle efficiency to% crit- This is included in Fig. 7. The calculations suggest that there is a variationof only 3 % in 7jmQ over the upper 80 % of the cruising speed range. ijm0 will be lowerthan shown in Fig. 7, above 80 % VCTlt, because of white muscle activity at theseswimming speeds. These muscles may be assumed to be working at a low efficiency,as the white muscle would be contracting at low speeds under low loads. The usualoptimum range of operation is probably at higher speeds and larger loads as foundat sprint speeds.
Propeller efficiency
The ratio V/Vw has generally been assumed to be representative of yp (Gadd, 1952;Taylor, 1952; Lighthill, i960; Hertel, 1966), where
V forward swimming speed of fish , .Vw ~ backward speed of propulsive wave'
This follows because VjVw represents the ratio between the increase in momentumgiven to the water by the propulsive wave, and the amount of kinetic energy requiredto accelerate that water. The ratio also reflects the pressure difference across themoving portions of the body, and hence the energy lost in cross flows.
The relationship between VjVw and %eTOh can be tested by means of the results forgroups 1-4, on the basis of the assumptions made above for the muscle system. Thusat any value of % Fcrit, ^aerob should vary only with r/p or VjVw,
has been calculated for each level of % VCIlt. The value of the thrust for each
534 P- W. WEBB
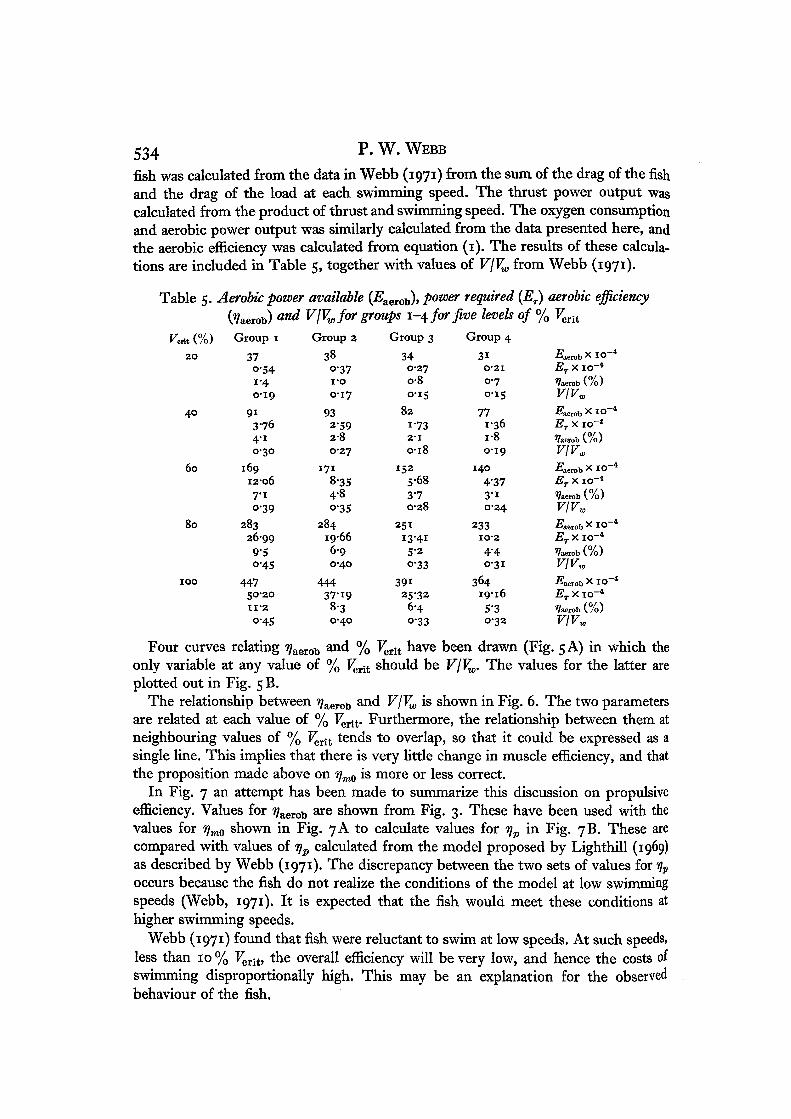
fish was calculated from the data in Webb (1971) from the sum of the drag of the fishand the drag of the load at each swimming speed. The thrust power output wascalculated from the product of thrust and swimming speed. The oxygen consumptionand aerobic power output was similarly calculated from the data presented here, andthe aerobic efficiency was calculated from equation (1). The results of these calcula-tions are included in Table 5, together with values of V\VW from Webb (1971).
Table 5. Aerobic power available (EaeT0}i), power required (ET) aerobic efficiencyand VjVw for groups 1-4 for five levels of % Fcri t
20
40
60
80
1 0 0
Jroup i
37o-541-40-19
9 1
3-764'i0-30
16912-067-i0-39
28326-99
9-5o-45
44750-20II-2
o-45
Group 2
380-37I'O
0-17
932'592-80-27
171
8-354*8O'35
28419666 90-40
44437-198-30-40
Group 3340-27o-80-15
82i-732 - 1
0-18
1525-683-70-28
25113-41
5-2O-33
39125-32
6-4o-33
Group 431
O-2I0-70-15
771-36i-80-19
1 4 0
4*373 ' i0-24
233IO-2
4*4O-3I
364I9-l65-30-32
•Eaerob x IOET X IO~4
^aerob V. M
v\vwEaerob x 10 -ET x io~4
^aerob (%)
v\vw-p v rr.~•"aerob A l oET x 10-4
^aerob ( /o )
v\v9£*aerob x 10-ET x 10 - 4
%erob (%)
v\vw^aerob X IO~ET x 10-4
%erob (%)
vivw
Four curves relating q^^ and % VCTlt have been drawn (Fig. 5 A) in which theonly variable at any value of % VCTit should be V\VW. The values for the latter areplotted out in Fig. 5 B.
The relationship between ?;aerOb an<i VjVw is shown in Fig. 6. The two parametersare related at each value of % T ,rit. Furthermore, the relationship between them atneighbouring values of % P^rit tends to overlap, so that it could be expressed as asingle line. This implies that there is very little change in muscle efficiency, and thatthe proposition made above on 7jm0 is more or less correct.
In Fig. 7 an attempt has been made to summarize this discussion on propulsiveefficiency. Values for ^aeroi3 are shown from Fig. 3. These have been used with thevalues for 7)m0 shown in Fig. 7A to calculate values for rjp in Fig. 7B. These arecompared with values of yp calculated from the model proposed by Lighthill (1969)as described by Webb (1971). The discrepancy between the two sets of values for rjp
occurs because the fish do not realize the conditions of the model at low swimmingspeeds (Webb, 1971). It is expected that the fish would meet these conditions athigher swimming speeds.
Webb (1971) found that fish were reluctant to swim at low speeds. At such speeds,less than 10% Fcrit, the overall efficiency will be very low, and hence the costs ofswimming disproportionally high. This may be an explanation for the observedbehaviour of the fish.

The swimming energetics of trout. II 535
Fig. s. (A) Relationship between the aerobic efficiency and swimming speed (expressed apercentage of Vciit) for groups 1-4. The points have been calculated for values of 20, 40, 60,80 and 100% Vciit. (B) Values for V\VW as a function of % V^ for all five groups of fish.A, Control group; D, group 1; • , group 2; O, group 3; • , group 4.
Table 6. Calculations of V\VW at swimming speeds from o to 300 cmjsec (0-10 Ljsec)for rainbow trout using Bainbridge's equation (1958)
Swimming speed
V (cm/sec)
51 0
152 0
3O4 0
So6 07 09 0
1 0 0
1502 0 0
2 5 03 0 0
VjL
0-17o-330-500-67I*OO
i-331-672*OO
2-333-o3-335'O6678-33
IO'OO
Wave velocity
Vw (cm/sec)
3i'736*340-845-354-563-472-58 1 69 9 8
108-7117-9163-2208-5253-8299-3
v\vw0-160-270-370-44o-SS0 6 30-690-73o-8o0 8 20*850-920 96c-o8I-OO

P. W. WEBB
Propeller efficiency at high swimming speeds
The difference between 7}p calculated here and that predicted by Lighthill (1960)becomes smaller at higher cruising speeds. It is at these speeds that Lighthill's modelbecomes truly applicable to the swimming trout. Then the propeller efficiency j s
expected to reach values of about 90 % as VjVw reaches about o-8.It has also been shown that yp can be related to VJVW. Values for V\VW can be cal-
culated by means of Bainbridge's equation (1958) as described by Webb (1971). Thishas been done for the fish used here up to a maximum sprint speed of 300 cm/sec
10
100
80
60
100— • o80 # •
i°. . _ ° D 20
40
40 o
0-1 0-2 0-3 0-4 0-5 0-6 0-7
Fig. 6 .The relationship between ijaevot, and V/Vw with % F ^ t as parameter. Numbered lineson the left of the points represent the minimum values of ^aerOb at each value of % Fcrit,and the lines on the right represent the maxima. Key as for Fig. 5.
Table 7. Values for VjVw reported in the literature and values forthe control group offish from the present experiments
Fish
WhitingMackerelBreamGoldfishDaceRainbow trout
VjL
0-91*1-06*2-37*2-87*i-68*0-360 6 1
0-851-09i-33i-571-832-05
V(cm/sec)
16-842-5454642
IO-I1 6 923-63°-437-243'9SO-758-i
vw(cm/sec)
25-077
59655743-249*547-859'468074-575*384-8
VjV
0-67)O-55)076^071074)
O-23>
o-340-490-51o-55o-590*670-69;
j, Reference
Gray, 1933 a
Bainbridge, 1963
. Webb, 1971
* From Webb (1970).

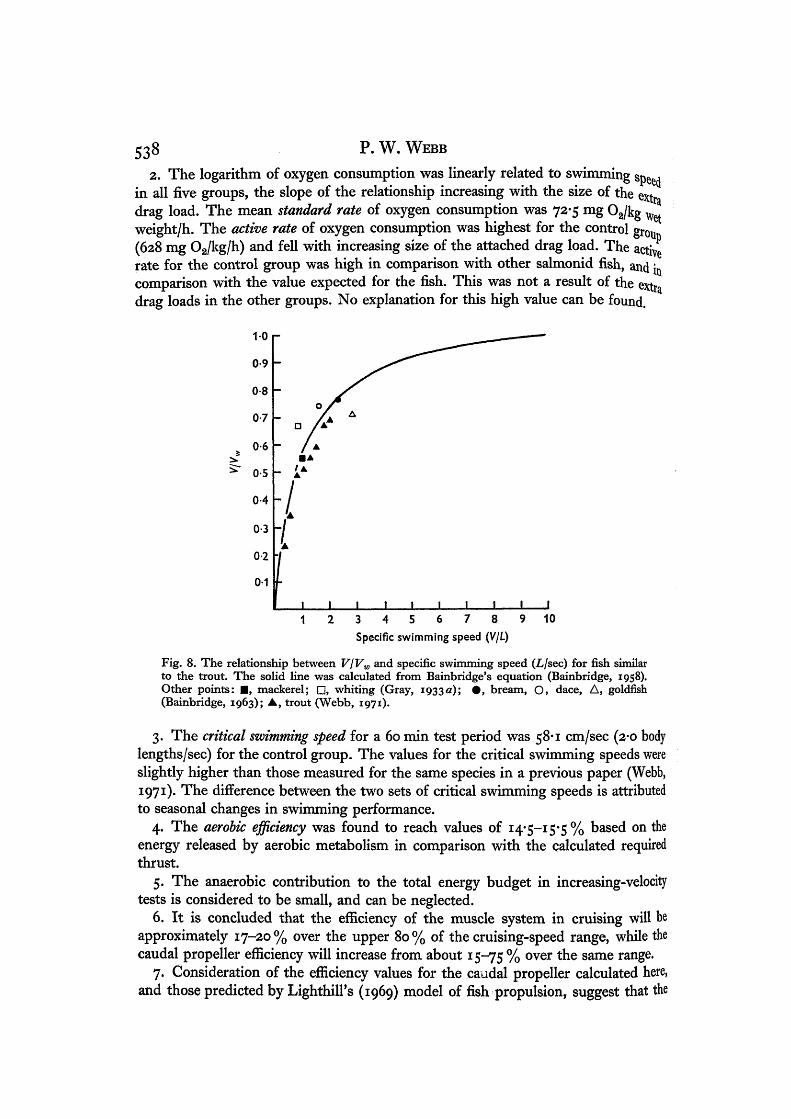
The swimming energetics of trout. II 537hoLlsec) in Table 6. VjVw is shown plotted against specific swimming speed (V/L)in Fig. 8. The figure shows that the propeller conditions for optimum efficiency occurat a swimming speed of about 4 L/sec. This is similar to the maximum cruising speedsobserved in many fish (see tables in Webb, 1970, 1971).
The validity of the theoretical line in Fig. 8 can be indicated by putting in somevalues reported in the literature. Values for VjVw have been given by Gray (1933 a),
20 r A 100 1 - B
80
tfaerob 6 0
40
20
20 40 60 80 100 20 40 60 80 1000/ 1//o 'cnt
Fig. 7. Summary of the efficiency relationships for aerobic efficiency, muscle efficiency andpropeller efficiency described in the text, at cruising speeds expressed as % Vctit. (A) Opencircles represent red muscle efficiency, assuming that the muscles behave in the same wayas other vertebrate muscle systems, with the maximum power output occurring at Vciit.Aerobic efficiency values (solid circles) are taken from the results in Fig. 3. (B) Propellerefficiency. The solid squares have been calculated from the values shown in (A). Open squareshave been calculated from the model proposed by Lighthill (1969) from the values calculatedfrom Webb (1971).
Bainbridge (1963) and Webb (1971). These are shown in Table 7. The agreementbetween these values and the theoretical line is good. Most values have been de-termined close to the optimum value predicted by Lighthill (i960).
The calculations of VjVw imply that the propeller efficiency will be high over mostof the cruising-speed range of fishes, and over the whole of the sprint-speed range.
SUMMARY
i. The oxygen consumption of rainbow trout was measured at a variety of sub-fatigue swimming speeds, at a temperature of 15 °C. Five groups of fish were used,a control group and four groups with extra drag loads attached to the body.
538 P. W. WEBB
2. The logarithm of oxygen consumption was linearly related to swimming Spe ,in all five groups, the slope of the relationship increasing with the size of the extdrag load. The mean standard rate of oxygen consumption was 72-5 mg O2/kg Wet
weight/h. The active rate of oxygen consumption was highest for the control groiln
(628 mg O2/kg/h) and fell with increasing size of the attached drag load. The activ!rate for the control group was high in comparison with other salmonid fish, and incomparison with the value expected for the fish. This was not a result of the extradrag loads in the other groups. No explanation for this high value can be found.
0-1
3 4 5 6 7 8 9Specific swimming speed (V/L)
10
Fig. 8. The relationship between V\VW and specific swimming speed (L/sec) for fish similarto the trout. The solid line was calculated from Bainbridge's equation (Bainbridge, 1958).Other points: • , mackerel; • , whiting (Gray, 1933a); • , bream, O, dace, A, goldfish(Bainbridge, 1963); • , trout (Webb, 1971).
3. The critical swimming speed for a 60 min test period was 58*1 cm/sec (2-0 bodylengths/sec) for the control group. The values for the critical swimming speeds wereslightly higher than those measured for the same species in a previous paper (Webb,1971). The difference between the two sets of critical swimming speeds is attributedto seasonal changes in swimming performance.
4. The aerobic efficiency was found to reach values of 14*5-15-5% based on theenergy released by aerobic metabolism in comparison with the calculated requiredthrust.
5. The anaerobic contribution to the total energy budget in increasing-velocitytests is considered to be small, and can be neglected.
6. It is concluded that the efficiency of the muscle system in cruising will beapproximately 17-20% over the upper 80% of the cruising-speed range, while thecaudal propeller efficiency will increase from about 15-75 % o v e r ^ e s a m e range.
7. Consideration of the efficiency values for the caudal propeller calculated here,and those predicted by Lighthill's (1969) model of fish propulsion, suggest that the

The swimming energetics of trout. II 539
fficiency of the propeller system will reach an optimum value at the maximumC uising speeds of most fish, and will remain close to this value at spring speeds.
This work was presented in part towards the degree of Ph.D. in the Department ofZoology, University of Bristol. I wish to thank my supervisor, Dr Q. Bone, for hisdvice and encouragement during the course of this work, and Professor G. M. Hughesd Dr G. M. Jarman for many useful discussions.The work was supported by a Scientific Research Council Studentship.I also wish to thank Dr J. R. Brett for reading the manuscript for this paper, and
for his valuable criticism.
REFERENCES
AHLBORG, B., BERGSTROM, J., EKELUND, L. & HULTMAN, E. (1967). Muscle glycogen and muscle electro-lytes during prolonged physical exercise. Ada physiol. scand. 70, 129-42.
BAINBRIDGE, R. (1958). The speed of swimming of fish as related to size and to the frequency and theamplitude of the tail beat. J. exp. Biol. 35, 109-33.
BAINBRIDGE, R. (1962). Training, speed and stamina in trout. J. exp. Biol. 39, 537-55.BAINBRIDGE, R. (1963). Caudal fin and body movements in the propulsion of some fish. J. exp. Biol. 40,
23-56.BLACK, E. C. (i957«)• Alterations in the blood level of lactic acid in certain salmonid fishes following
muscular activity. I. Kamloops trout, Salmo gairdneri. J. Fish. Res. Bd Can. 14, 117-34.BLACK, E. C. (i957&)- Alterations in the blood level of lactic acid in certain salmonid fishes following
muscular activity. II. Lake Trout, Salvelinus namaychus. J. Fish. Res. Bd Can. 14, 645-9.BLACK, E. C. (1957 c)- Alterations in the blood level of lactic acid in certain salmonid fishes following
muscular activity. III. Sockeye salmon, Oncorhynchus nerka. J. Fish. Res. Bd Can. 14, 807-14.BLACK, E. C, CONNOR, A. R., LAM, K. & CHIU, W. (1962). Changes in glycogen pyruvate and lactate
in rainbow trout (Salmo gairdneri) during and following muscular activity, jf. Fish. Res. Bd Can. 19,409-36.
BLACK, E. C, ROBERTSON, A. C , HANSLIP, A. R. & CHIU, W. (i960). Alterations in glycogen, glucoseand lactate in Rainbow and Kamloops trout (Salmo gairdneri) following muscular activity. J. Fish.Res. Bd Can. 17, 487-500.
BLACK, E. C, ROBERTSON, A. C. & PARKER, R. R. (1961). Comparative Physiology of CarbohydrateMetabolism in Heterothermic Animals (ed. A. W. Martins), pp. 89-124. University of WashingtonPress.
BONE, Q. (1966). On the function of the two types of myotomal muscle fibre in elasmobranch fish. J. mar.biol. Ass. U.K. 46, 321-49.
BRETT, J. R. (1962). Some considerations in the study of respiratory metabolism in fish, particularlysalmon. J. Fish. Res. Bd Can. 19, 1025-38.
BRETT, J. R. (1963). The energy required for swimming of young sockeye salmon with a comparisonof the dead drag force. Trans. R. Soc. Can. 1 (ser. iv), 441-57.
BRETT, J. R. (1964). The respiratory metabolism and swimming performance of young sockeye salmon.y. Fish. Res. Bd Can. 21, 1183-226.
BRETT, J. R. (1965). The relation of size to the rate of oxygen consumption and sustained swimmingspeeds of sockeye salmon (Oncorhynchus nerka). J. Fish. Res. Bd Can. 22, 1491-501.
BRETT, J. R. (1967). Swimming performance of sockeye salmon in relation to fatigue time and temper-ature, y. Fish. Res. Bd Can. 24, 1731-41.
BRODY, S. (1945). Bioenergetics and Growth. New York: Reinhold.CAMERON, J. N. & CECH, J. J. (1970). Notes on the energy cost of gill ventilation. Comp. Biochem.
Physiol. 34, 447-55.CONNOR, A. R., ELLING, C. H., BLACK, E. C, COLLINS, G. B., GAULEY, J. R. & TREVOR-SMITH, E.
(1964). Changes in glycogen and lactate levels in migrating salmonid fish ascending experimental'endless' fishways. y. Fish. Res. Bd Can. 21, 255-90.
DAHLBERG, M. L., SHUMWAY, D. L. & DOUDOROFF, P. (1968). Influence of dissolved oxygen and carbondioxide on the swimming performance of the large-mouthed bass and coho salmon, y. Fish. Res.Bd Can. 25, 49-70.
FRY, F. E. J. (1957). The aquatic respiration of fish. In Physiology of Fishes, vol. 1 (ed. M. E. Brown).Academic Press.
GADD, G. E. (1952). Some hydrodynamic aspects of swimming in snakes and eels. Phil. Mag. 48 (7th.ser.), 663-70.

540 P. W. WEBB
GEORGE, J. C. (1962). A histophysiological study of the red and white muscles of the mackerel. A^Midi. Nat. 68, 487-94.
GRAY, J. (1933). Studies in animal locomotion. I. The movement of fish with special reference to theeel. J. exp. Biol. 10, 88-104.
HERTEL, H. (1966). Structure, Form and Movement, English ed. New York: Reinhold.HILL, A. V. (1950). The dimensions of animals and their muscular dynamics. Sci. Prog. 38, 209-30.HOUSTON, A. H., DEWILDE, M. A. & MADDEN, J. A. (1969). Some physiological consequences of aortic
cannulation in the Brook Trout (Salvelinusfontinalis). J. Fish. Res. Bd Can. 26, 1847-56.IDLER, D. R. & CLEMENS, W. A. (1959). Energy expenditure of the Fraser River sockeye salmon during
migration, spawning and death Int. Pacific Salmon Fish. Prog. Rep. pp. 1-80.JONES, D. R. (1971). A theoretical analysis of factors which may limit the maximum oxygen uptake of
fish: The oxygen cost of the cardiac and branchial pumps. J. theor. Biol. (in the Press).KUTTY, M. N. (1968). Respiratory quotients in goldfish and rainbow trout. J. Fish. Res. Bd Can. 25
1689-728.LIGHTHILL, M. J. (i960). Note on the swimming of slender fish. J. Fluid Mech. 9, 305-17.LIGHTHILL, M. J. (1969). Hydromechanics of aquatic animal propulsion. A. Rev. Fluid Mech. 1, 413-46.LIGHTHILL, M. J. (1970). Aquatic animal propulsion of high hydromechanical efficiency. J. Fluid Mech.
44. 265-301.MACLEOD, R. A., JONAS, R. E. E. & ROBERTS, E. (1963). Glycolytic enzymes in the tissues of a salmonid
fish (Salmo gairdnerii gairdnerii). Can. J. Biochem. Physiol. 41, 1971-81.MALOMSOKI, J. & NEMESSURI, M. (1967). Determination of the economic efficiency of muscular work
by gas exchange measurements. Acta Physiol. hung. 31, 57-72.MILLER, R. B. & MILLER, F. (1962). Diet, glycogen reserves and resistance to fatigue in hatchery reared
rainbow trout. Part II. J. Fish. Res. Bd Can. 19, 365-75.MILLER, R. B., SINCLAIR, A. C. & HOCHACHKA, P. W. (1959). Diet, glycogen reserves and resistance to
fatigue in hatchery reared trout. J. Fish. Res. Bd Can. 16, 321-8.OSBORNE, M. F. M. (1961). Hydrodynamic performance of migratory salmon. J. exp. Biol. 38, 365-90.DI PRAMPERO, P. E., CERRETELLI, P. & PIIPER, J. (1970). Lactic acid formation on gastrocnemius muscle
of the dog and its relation to O2 debt contraction. Resp. Physiol. 8, 347—53.PROSSER, C. L. & BROWN, F. A. (1961). Comparative Animal Physiology. London: W. B. Saunders.RAO, R. M. M. (1968). Oxygen consumption of rainbow trout (Salmo gairdneri) in relation to activity
and salinity. Can. J. Zool. 46, 781-6.SAIKI, H., MARGARIA, R. & CUTTICA, F. (1967). Lactic acid production in sub-maximal work. Int. Z.
angew. Physiol. 24, 57-61.SKIDMORE, J. F. (1970). Respiration and osmoregulation in rainbow trout with gill damaged by zinc
sulphate. J. exp. Biol. 50, 481-94.SMIT, H. (1965). Some experiments on the oxygen consumption of goldfish (Carasius auratus L) in
relation to swimming speeds. Can. J. Zool. 43, 623-33.SMITH, L. S., BRETT, J. R. & DAVIES, J. C. (1967). Cardiovascular dynamics in swimming adult salmon.
J. Fish. Res. Bd Can. 24, 1775-90.Standard Methods for the Examination of Water and Wastezvater (1967). New York: American Public
Health Ass.STEVENS, E. D. & BLACK, E. C. (1966). The effect of intermittent exercise on carbohydrate metabolism
in rainbow trout (Salmo gairdneri). y. Fish. Res. Bd Can. z$, 471-85.STEVENS, E. D. & RANDALL, D. J. (1967). Changes in blood pressure, heart rate, and breathing rate
during moderate swimming activity in rainbow trout, y. exp. Biol. 46, 307-15.SUTTERLIN, A. M. (1969). Effects of exercise on cardiac and ventilatory frequency in three species of
freshwater teleosts. Physiol. Zool. 42, 36-52.TAYLOR, G. (1952). Analysis of the swimming of long narrow animals. Proc. R. Soc. Lond. A 214, 158-
83.WEBB, P. W. (1970). Some aspects of the energetics of swimming of fish with special reference to the
cruising performance of rainbow trout. Ph.D. thesis, University of Bristol.WEBB, P. W. (1971). The swimming energetics of trout. I. Thrust and power output at cruising speeds.
y. exp. Biol. ss, 489-520.WEBB, P. W. & BRETT, J. R. (in preparation). The hydrodynamics of swimming of fishes.WENDT, C. (1965). Liver and muscle glycogen and blood lactate in hatchery reared Salmo salar follow-
ing exercise in winter and summer. Rep. Inst. Freshwater Res. Drottningholm 46, 148-67.WENDT, C. (1967). Mortality in hatchery reared Salmo salar after exercise. Rep. Inst. Freshwater Res.
Drottningholm 46 98-112.WITTENBERGER, C. & DIATCUIC, I. V. (1965). Effort metabolism in lateral muscles in carp. y. Fish. Res.
Bd Can. 22, 1397-406.