Embed Size (px)
Citation preview

i
STATUS OF THESIS
Title of thesis
I WIDYA CHRYSANTI PUSPITASARI.hereby allow my thesis to be placed at the
Information Resource Center (IRC) of Universiti Teknologi PETRONAS (UTP) with the
following conditions:
1. The thesis becomes the property of UTP.
2. The IRC of UTP may make copies of the thesis for academic purposes only.
3. This thesis is classified as
Confidential
Non-confidential
If this thesis is confidential, please state the reason:
– .
The contents of the thesis will remain confidential for – years.
Remarks on disclosure:
– .
Endorsed by
WIDYA CHRYSANTI PUSPITASARI ASSOC. PROF. DR. PATTHI HUSSAIN
Pondok Bambu Asri Timur 4/11 Department of Mechanical Engineering
Jakarta Timur, Indonesia Universiti Teknologi PETRONAS
Bandar Seri Iskandar, 31750 Tronoh
Perak Darul Ridzuan, Malaysia
Date: ___________________ Date: ___________________
The Study of Adhesion Bonding Between Steel Substrate and
Intumescent Coating
√

ii
APPROVAL PAGE
UNIVERSITI TEKNOLOGI PETRONAS
Approval by Supervisor (s)
The undersigned certify that they have read, and recommend to The Postgraduate
Studies Program for acceptance, a thesis entitled “The Study of Adhesion Bonding
Between Steel Substrate and Intumescent Coating” submitted by (Widya
Chrysanti Puspitasari) for the fulfillment of the requirements for the degree of
Master of Science in Mechanical Engineering.
_______________________
Date
Signature : ______________________________
Main supervisor : AP. Dr. Patthi Hussain
Date : ______________________________
Signature : ______________________________
Co-Supervisor : AP. Dr. Puteri Sri Melor Megat Yusoff
Date : ______________________________
Signature : ______________________________
Co-Supervisor : AP. Dr. Faiz Ahmad
Date : ______________________________

iii
UNIVERSITI TEKNOLOGI PETRONAS
The Study of Adhesion Bonding Between Steel Substrate and Intumescent Coating
By
Widya Chrysanti Puspitasari
A THESIS
SUBMITTED TO THE POSTGRADUATE STUDIES PROGRAMME
AS A REQUIREMENT FOR THE DEGREE OF MASTER OF SCIENCE
IN MECHANICAL ENGINEERING
BANDAR SERI ISKANDAR
PERAK
FEBRUARY 2010

iv
DECLARATION
I hereby declare that the thesis is based on my original work except for quotations and
citations which have been duly acknowledged. I also declare that it has not been previously
or concurrently submitted for any other degree at Universiti Teknologi PETRONAS (UTP)
or other institutions.
Signature : ________________________________________________
Name : WIDYA CHRYSANTI PUSPITASARI _______________
Date : ________________________________________________

v
ACKNOWLEDGEMENT
First of all, praises and thanks are due to Allah SWT, the almighty God, the creator, the
source of life and grace: for giving the strength and wisdom I needed to succeed in life.
I would like to thank all the people who helped and inspired me during my study; my
gratitude is due to my supervisor, AP. Dr. Patthi Hussain, for his guidance during my
research at Universiti Teknologi PETRONAS. I gratefully acknowledge AP. Dr. Puteri Sri
Melor and AP. Dr. Faiz, my co-supervisors, for their suggestions, criticism and assistance
during the construction of my thesis. Their involvement became a source of encouragement
for my research aside from the fact that they are always there when I needed help and as a
result, research life became efficient and rewarding for me.
I would also like to acknowledge all UTP technologists especially to the Material
Laboratory Technologist namely: En Anuar, En. Faisal, En. Omar, En. Shairul, En. Irwan,
and En. Jani for the assistance and support they offered when I was conducting my
experiments. My sincere gratitude is also due to the Postgraduate office staffs for their
assistance during my study.
It is a pleasure to pay tribute also to all my friends in UTP for the past two years, especially
to my friends who were always there to support me when I needed some advice and
comfort. I am grateful for the friendship that we made through tough times and I wish you
all the best. I hope that we will all meet again sometime in the future outside the four
corners of UTP.
This work could not be completed without the love and support of my whole family. Words
fail to express my appreciation to my mom who’s never ending support and prayer has
taken the load of my shoulder. I would also like to thank my two beautiful sisters for their
encouragement and taking care of our mom and for always sending me pictures of our cats.
Lastly, I express my thanks to my beloved, for his support, patience, advices and for
understanding me since we have been together.

vi
Finally, I would like to thank everybody who was important to the successful realization of
this thesis, as well as expressing my apology that I could not mention personally one by
one.
This thesis is dedicated with love to my father. I believe you are now at peace joining Allah
SWT in heaven. You will always be your daughter’s inspiration.
Thank you.. Papa. I Love You.

vii
ABSTRACT
The aim of the current study is to characterize the adhesion bonding of intumescent coating
on steel substrate with respect to its mechanical, physical and chemical properties, before
and after a fire test. Carbon steel was used as the substrate material and its surface was sand
blasted to ensure strong bonding between the steel substrate and the intumescent coating. A
primer coating was applied on the steel substrate prior to applying the intumescent to further
strengthen the bonding. The coated steel substrates were subjected to fire in a furnace at
1000oC for various durations ranging from 30, 45, and 90 to 120 min. All coated steel
substrates were also subjected to corrosion test by immersing them in 2% sodium chloride
(NaCl) both for 15 min and three months duration using Electrochemistry Impedance
Spectroscopy. For mechanical property, the shear strength of the intumescent coating was
measured for various coating thicknesses ranging from 1, 2, 3, 4, 10 to 22 mm through lap
shear test. The changes in microstructure of the adhesion bonding were monitored using the
Scanning Electron Microscope (SEM).
The microstructure observation indicated a profound mechanical interlocking mechanism
between the primer coating and the steel substrate. However, separation between the
resultant char and steel was observed for all the fired specimens. The specimen’s impedance
before fire test and before immersion was 437x106 Ω.cm2. After 15 min exposure to NaCl,
this value was reduced by 26, 53, 60 and 65% for specimens fired for 30, 45, 90 and 120
min, respectively. Further reduction in the impedance by 97.6, 97.8, 97.9 and 98.9% for
samples fired for 30, 45, 90 and 120 min, respectively, were measured after three months of
NaCl immersion. The results showed that the corrosion resistance of the substrates
worsened with the duration of firing and immersion in NaCl. A marked decrease in shear
strength of the intumescent coating from 1.95 MPa to 0.23 MPa was also measured as the
thickness increased from 1 mm to 22 mm, respectively. Despite the two hours of firing, the
temperature of the steel substrate was kept below 100°C and no re-crystallization was
observed. Hence, the strength of the steel was maintained.
Keywords: intumescent coating, adhesion bonding, lap shear, interface, fire test

viii
ABSTRAK
Objektif kajian semasa adalah untuk menciri sifat-sifat mekanikal, fizikal dan kimia bagi
ikatan lekatan (adhesion bonding) antara salutan intumescent dan substrat keluli sebelum
dan selepas ujian kebakaran dijalankan. Kesemua permukaan substrat keluli melalui proses
pembagasan pasir untuk memastikan ikatan salutan yang kuat. Malah, salutan primer juga
diguna sebelum salutan intumescent disapu di atas permukaan substrat bagi tujuan yang
sama. Substrat bersalut intumescent dibakar di dalam ketuhar pada suhu 1000oC selama 30,
45, 90 dan 120 min secara berasingan. Sampel substrat juga diuji ketahannya terhadap
kakisan di dalam rendaman larutan 2% natrium klorida (NaCl) untuk kedua-dua tempoh
selama 15 min dan tiga bulan. Ujian ricih bertindih juga dijalankan untuk mengukur kesan
perubahan ketebalan salutan terhadap kekuatan ricih salutan. Bagi melengkapkan siasatan,
perubahan mikrostruktur ikatan lekatan sebelum dan selepas ujian pembakaran turut
diperhatikan.
Pemerhatian mikrostruktur menunjukkan ikatan lekatan mekanikal yang saling berpautan
antara salutan primer dan substrat keluli. Di samping itu, pemisahan antara debu arang yang
terhasil dan permukaan keluli turut dicerap bagi kesemua spesimen yang dibakar. Impedan
spesimen sebelum dibakar dan tanpa rendaman NaCl ialah 437x106 Ω.cm2. Ujian kakisan
menunjukkan penurunan nilai impedan sebanyak 26, 53, 60 dan 65% masing-masing bagi
sampel yang dibakar selama 30, 45, 90 dan 120 min. Peratusan penurunan meningkat
kepada 97.6, 97.8, 97.9 dan 98.9% bagi sampel yang dibakar selama 30, 45, 90 dan 120 min
akibat direndam di dalam NaCl selama 3 bulan. Keputusan ini menunjukkan ketahanan
kakisan substrat menurun dengan meningkatnya tempoh pembakaran dan pendedahan
kepada NaCl. Penurunan ketara kekuatan ricih salutan intumescent daripada 1.95 MPa
kepada 0.23 MPa disukat apabila ketebalan salutan bertambah masing-masing daripada 1
kepada 22 mm. Sepanjang ujian kebakaran, suhu substrat keluli direkod di bawah paras
100°C dan tiada tanda-tanda pengkristalan semula berlaku. Ini menunjukkan kekuatan
keluli masih dipertahankan.
Kata kunci: salutan intumescent, ikatan lekatan, tindih ricih, ujian kebakaran

ix
TABLE OF CONTENTS
STATUS OF THESIS ............................................................................................................ i
APPROVAL PAGE .............................................................................................................. ii
DECLARATION.................................................................................................................. iv
ACKNOWLEDGEMENT.................................................................................................... v
ABSTRACT......................................................................................................................... vii
ABSTRAK ..........................................................................................................................viii
TABLE OF CONTENTS..................................................................................................... ix
LIST OF TABLES .............................................................................................................. xii
LIST OF FIGURES ...........................................................................................................xiii
CHAPTER 1 INTRODUCTION ......................................................................................... 1
1.1 Background............................................................................................................ 1 1.2 Problem Statement................................................................................................ 4 1.3 Research Objectives .............................................................................................. 5 1.4 Scope of Work ....................................................................................................... 5 1.5 Organization of the Thesis ................................................................................... 6
CHAPTER 2 THEORY AND LITERATURE REVIEW ................................................. 7
2.1 Categories of Flame Retardant ............................................................................ 9 2.2 Intumescent Coating ........................................................................................... 10
2.2.1 Type of Intumescent Coatings ...................................................................... 10 2.2.2 Properties of Intumescent Coatings .............................................................. 12 2.2.3 Intumescent Coating Application.................................................................. 13 2.2.4 Intumescent Coating Reaction Mechanism................................................... 14
2.3 Carbon Fiber ....................................................................................................... 20 2.4 Steel Substrate ..................................................................................................... 21
2.4.1 Thermal Properties of Steel........................................................................... 21 2.4.2 Mechanical Properties of Steel...................................................................... 22 2.4.3 Chemical Properties of Steel......................................................................... 23
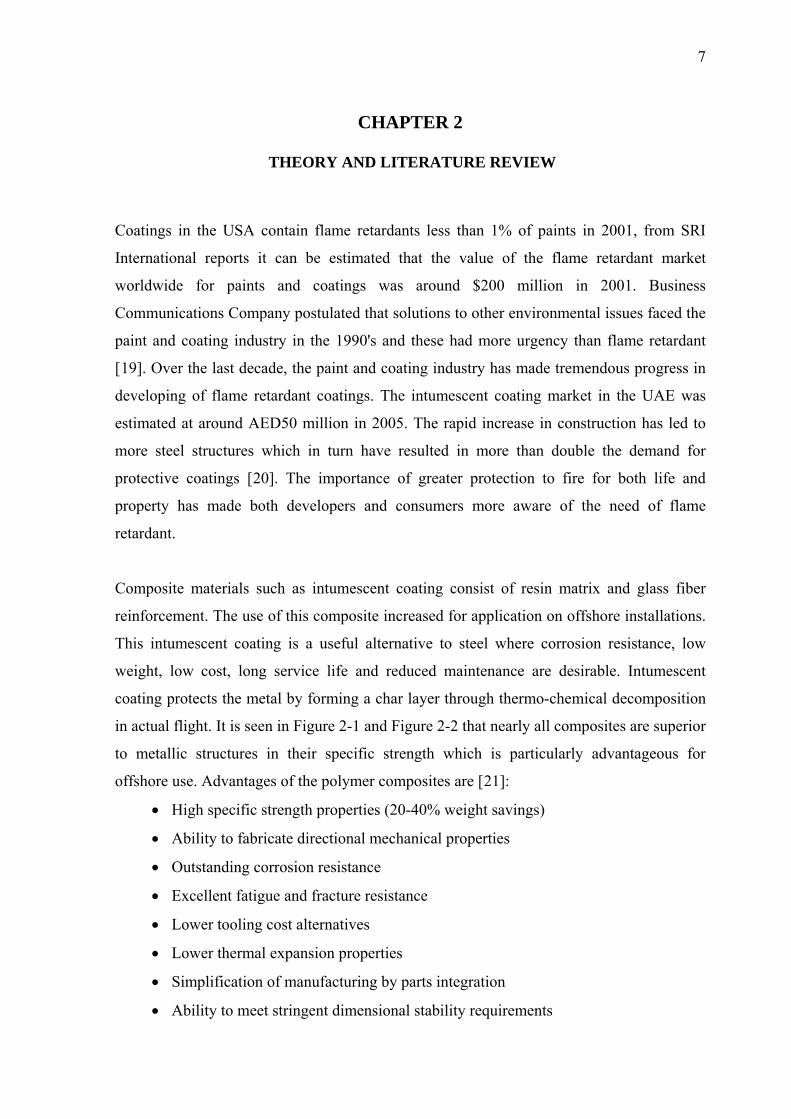
2.5 Adhesion............................................................................................................... 23 2.5.1 Adhesion Theory........................................................................................... 24 2.5.2 Adhesion Bonding Between Coating and Steel Substrate ............................ 26
2.6 Electrochemical Description of an Organic Coating on a Metal Substrate... 27 2.7 Literature Review................................................................................................ 30
2.7.1 Effect Thermo Oxidation to Adhesion.......................................................... 30 2.7.2 Effect of Coating Thickness to Adhesion ..................................................... 31 2.7.3 Effect of Water Uptake to Adhesion............................................................. 32
CHAPTER 3 MATERIALS AND METHODOLOGY ................................................... 34
3.1 Materials .............................................................................................................. 34

x
3.1.1 Intumescent Coating...................................................................................... 34 3.1.2 Primer Coating .............................................................................................. 35 3.1.3 Steel Substrate............................................................................................... 35
3.2 Material Preparation .......................................................................................... 36 3.2.1 Steel Substrate Preparation ........................................................................... 36 3.2.2 Intumescent Coating Preparation .................................................................. 36
3.3 Physical Properties Characterization................................................................ 37 3.3.1 Microstructure Examination.......................................................................... 37
3.4 Chemical Properties Measurement ................................................................... 38 3.4.1 Salt Spray Test .............................................................................................. 38 3.4.2 Electrochemistry Impedance Spectroscopy (EIS) Test................................. 38
3.5 Lap Shear Test .................................................................................................... 38 3.6 Coating Characterization ................................................................................... 39
3.6.1 Thermal Properties Characterization............................................................. 39 3.6.1.1 Thermo Gravimetric Analysis (TGA)........................................................ 39 3.6.1.2 Differential Scanning Calorimetry (DSC) ................................................ 39 3.6.1.3 Fourier Transform Infrared Spectroscopy (FTIR).................................... 39
3.6.2 Coating Composition Measurement.............................................................. 40 3.6.2.1 Energy Dispersive X-Ray (EDX) and X-Ray Fluorescence (XRF) ........... 40
3.7 Mechanical Properties Characterization .......................................................... 40 3.7.1 Hardness Test ................................................................................................ 40
3.8 Fire Test ............................................................................................................... 41
CHAPTER 4 RESULTS AND DISCUSSION.................................................................. 43
4.1 Physical Properties Characterization................................................................ 43 4.1.1 Optical Micrographs Analysis Before Fire Test ........................................... 43 4.1.2 Optical Micrographs Analysis After Fire Test.............................................. 44 4.1.3 Electron Micrographs Analysis Before Fire Test.......................................... 46 4.1.4 Electron Micrographs Analysis After Fire Test ............................................ 48 4.1.5 Energy Dispersive X-Ray Analysis .............................................................. 54
4.2 Chemical Properties Measurement ................................................................... 61 4.2.1 Salt Spray ...................................................................................................... 61
4.2.1.1 Bare Steel Substrate .................................................................................. 61 4.2.1.2 Primer Coating Coated Steel Substrate .................................................... 62
4.2.2 Steel Substrate Coated with Intumescent Coating ........................................ 62 4.2.3 Electrochemistry Impedance Spectroscopy (EIS)......................................... 63
4.2.3.1 After fire test.............................................................................................. 63 4.2.3.2 After three months immersion in sodium chloride .................................... 64
4.2.4 Electron micrographs of EIS sample............................................................. 66 4.3 Lap Shear Test .................................................................................................... 66 4.4 Coating Characterization ................................................................................... 69
4.4.1 Thermal Properties Measurement ................................................................. 69 4.4.1.1 Thermo Gravimetric Analysis (TGA)........................................................ 69 4.4.1.2 Differential Scanning Calorimetry (DSC) ................................................ 72 4.4.1.3 Fourier Transform Infrared Spectroscopy (FTIR).................................... 73
4.4.2 Coating Composition Measurement.............................................................. 75 4.4.2.1 X-Ray Fluorescent (XRF) : Intumescent Coating ..................................... 75 4.4.2.2 X-Ray Fluorescent (XRF) : Primer Coating ............................................. 77
4.4.3 Mechanical Properties................................................................................... 78 4.5 Steel Substrate Characterization....................................................................... 79

xi
4.5.1 Hardness of Steel Substrate........................................................................... 79 4.5.2 Chemical Properties Measurement of Steel Substrate .................................. 81
4.5.2.1 Energy Dispersive X-Ray (EDX)............................................................... 81 4.5.2.2 X-Ray Diffraction (XRD) .......................................................................... 82 4.5.2.3 X-Ray Fluorescent (XRF).......................................................................... 82
4.6 Fire Test ............................................................................................................... 83
CHAPTER 5 CONCLUSION AND RECOMMENDATIONS ...................................... 88
5.1 Conclusions .......................................................................................................... 88 5.2 Recommendations ............................................................................................... 89
REFERENCES.................................................................................................................... 90

xii
LIST OF TABLES
Table 2-1 Compares of the coefficient of thermal expansion, melting temperature, thermal conductivity and specific heat of the different materials . ............... 23
Table 3-1 Intumescent coating Chartek 7 resin and hardener composition .................... 34 Table 3-2 Technical data of intumescent coating Chartek 7........................................... 34 Table 3-3 Primer coating Intergard 251 composition ..................................................... 35 Table 4-1 Energy Dispersive X-Ray results for sample before fire test. ........................ 57 Table 4-2 Energy Dispersive X-Ray result for sample after fire test. The element weight
is in wt. %...................................................................................................... 60 Table 4-3 Coating degradation observation through Rp and Rest Potential................... 65 Table 4-4 The FTIR analysis of intumescent coating and char ...................................... 74 Table 4-5 Intumescent coating composition by using XRF............................................ 76 Table 4-6 Zinc phosphate primer coating composition by using XRF ........................... 78 Table 4-7 Hardness of intumescent coating (Shore D) ................................................... 79 Table 4-8 Hardness of Steel Substrate before and after Fire Test................................... 80 Table 4-9 XRF chemical composition analysis of steel substrate................................... 82 Table 4-10 Fire test of uncoated steel for 60 minutes duration....................................... 83 Table 4-11 The temperature of flame from fire, back of steel substrate and environment
during fire test ............................................................................................... 85

xiii
LIST OF FIGURES
Figure 1-1 Condensed phase during combustion . ............................................................ 3 Figure 2-1 Specific strength versus specific stiffness for a range of engineering
materials. ......................................................................................................... 8 Figure 2-2 Strength per volume cost versus stiffness per volume cost for a range of
engineering materials. ..................................................................................... 8 Figure 2-3 The different time temperature curves for this kind of hydrocarbon fire and
cellulosic fires (as used for most building regulations standards on fire protection) ..................................................................................................... 15
Figure 2-4 The burning cycle.......................................................................................... 16 Figure 2-5 Pyrolysis reaction during fire test.................................................................. 17 Figure 2-6 Schematic of frontal model. .......................................................................... 18 Figure 2-7 Model prediction of substrate thermal response........................................... 19 Figure 2-8 Iron Carbon phase diagram. .......................................................................... 22 Figure 2-9 Van der Waals interaction. ............................................................................ 24 Figure 2-10 A liquid drop on a solid substrate with three different phases. ................... 25 Figure 2-11 Equivalent circuit of an organic coating on a metal substrate overlaid on a
schematic of a painted metal surface. ........................................................ 28 Figure 2-12 Purely Capacitive Coating........................................................................... 29 Figure 2-13 Nyquist plot for excellent coating. .............................................................. 30 Figure 2-14 Nyquist plot for damage coating. ................................................................ 30 Figure 2-15 Schematic drawing of tri-layer models. ...................................................... 32 Figure 2-16 Effect of moisture (wet and dry) on mechanical properties of adhesive
joints........................................................................................................... 33 Figure 2-17 Effect of water uptake on joint strength . .................................................... 33 Figure 3-1 Surface roughness of steel substrate using profilometer. .............................. 36 Figure 3-2 Schematic of intumescent coated steel sample (all dimensions are in mm). 37 Figure 3-3 The schematic of lap shear test sample dimension
(all dimensions are in mm)............................................................................ 39 Figure 3-4 The hardness indentation on steel substrate of the sample using Vickers
hardness tester, Leco LM 247AT.................................................................. 41 Figure 3-5 a) The experimental set up the fire test, b) The center of the sample (arrow)
taken for further examination........................................................................ 41 Figure 4-1 Optical micrographs. a) steel substrate, b) cross section of intumescent coated
steel. Magnification : 100x............................................................................ 43 Figure 4-2 Microstructure of steel substrate conditioned with different fire test duration
of a) 30 min, b) 45 min, c) 90 min and d) 120 min of fire test duration. Magnification: 100x. ..................................................................................... 45
Figure 4-3 Effect of annealing cold-worked carbon steel. .............................................. 46 Figure 4-4 Electron micrographs for sample before fire test. a) Overall sample
structures, b) interface of intumescent coating and primer coating, c) interface of primer coating and steel substrate, d) carbon fiber in intumescent coating. .......................................................................................................... 47
Figure 4-5 Electron micrographs for sample after fire test for 30 minutes. a) Overall sample structures, b) interface of intumescent coating and primer coating, c)

xiv
interface of primer coating and steel substrate, d) carbon fiber in intumescent coating. .......................................................................................................... 49
Figure 4-6 Electron micrographs for sample after fire test for 45 minutes. a) Overall sample structures, b) interface of intumescent coating and primer coating, c) interface of primer coating and steel substrate, d) charring layer. ................ 50
Figure 4-7 Electron micrographs for sample after fire test for 90 minutes. a) Overall sample structures, b) interface of intumescent coating and primer coating, c) interface of primer coating and steel substrate, d) carbon fiber and charring layer in intumescent coating.......................................................................... 51
Figure 4-8 Electron micrographs for sample after fire test for 120 minutes. a) Overall sample structures, b) interface of intumescent coating and primer coating, c) interface of primer coating and steel substrate, d) carbon fiber and charring layer in intumescent coating.......................................................................... 53
Figure 4-9 Electron micrographs on interface of intumescent coating and primer coating before fire test. Points 1-4 refer to the EDX analysis. .................................. 54
Figure 4-10 Energy Dispersive X-Ray analysis, 1) primer coating and 2) at the interface between primer coating and intumescent coating before fire test................. 55
Figure 4-11 Energy Dispersive X-Ray analysis of intumescent coating before fire test at point no 3 and 4............................................................................................. 56
Figure 4-12 Electron micrographs on interface of intumescent coating and primer coating after fire test...................................................................................... 57
Figure 4-13 Energy Dispersive X-Ray analysis, 1) primer coating and 2) interface of intumescent coating and primer coating after fire test. ................................. 58
Figure 4-14 Energy Dispersive X-Ray analysis of intumescent coating after fire test. .. 59 Figure 4-15 Steel substrate was sprayed with 2% NaCl, a) before salt spray test, b) after
salt spray. ................................................................................................... 61 Figure 4-16 Steel substrate coated with zinc phosphate primer coating, a) before salt
spray test, b) after salt spray....................................................................... 62 Figure 4-17 Steel substrate coated with intumescent coating, ........................................ 63 Figure 4-18 Nyquist plot of intumescent coated steel sample before and after exposure
for 30 to 120 minutes of fire test................................................................ 64 Figure 4-19 Nyquist plot of intumescent coating resistance of before and after fired
samples for three months immersion in 2% NaCl. .................................... 65 Figure 4-20 Electron micrographs of intumescent coated sample, a) before immersion
and b) after 3 months immersion in 2% NaCl. .......................................... 66 Figure 4-21 Lap shear test sample, a) 1 mm thickness and b)10 mm thickness. ............ 67 Figure 4-22 Primer coating respond as adhesion promoter to intumescent coating. ...... 67 Figure 4-23 Lap shear test result of six different intumescent coating thickness. .......... 68 Figure 4-24 The adhesion interaction pulls the epoxy coating into complete contact with
the rough steel substrate surface. ............................................................... 68 Figure 4-25 The thermal degradation of intumescent coating, primer coating and carbon
fiber by using Thermo Gravimetric Analyzer with range temperature 30oC to 850oC...................................................................................................... 70
Figure 4-26 Thermal decomposition of Intumescent coating analysis using DSC......... 72 Figure 4-27 FTIR results of functional group structural changes of
intumescent coating and char. .................................................................... 74 Figure 4-28 Graph of hardness measurement of steel substrate for 0, 30, 45, 90 and 120
min of fire test. ........................................................................................... 80 Figure 4-29 Energy Dispersive X-Ray analysis of steel substrate.................................. 81 Figure 4-30 X-Ray Diffraction (XRD) graph of steel substrate. .................................... 82

xv
Figure 4-31 The fire test result of uncoated and intumescent coating coated steel after one hour fire test......................................................................................... 84
Figure 4-32 The temperature of flame, back of steel substrate and environment during fire test........................................................................................................ 86
Figure 4-33 Intumescent coated steel fire test sample, a) before fire test and b) after fire test. ............................................................................................................. 87

1
CHAPTER 1
INTRODUCTION
1.1 Background
Recently, adhesion phenomena become a very important field of study since they are
relevant to many scientific and technological areas. Adhesion happens when solids are
brought in contact such as in coatings, paints, and composite materials. The final
performance of these materials are highly dependent on the quality of the interface that is
formed between the coating and substrate.
The adhesion plays an important role especially for steel and intumescent coating in steel
structures. The use of intumescent coating is for steel protection from fire and also for
aesthetic value. Therefore, weak adhesion strength will result the separation of steel and
intumescent coating which is one of the principal causes for deterioration or damage on the
structural steel.
Steel is a material that is commonly used in construction of bridges, buildings, boats and
cars. Steel also plays an important role in other fields like marine furniture and offshore
platforms. The structural steelwork used in buildings usually requires fire protective
materials to reduce the devastating cost of fire in terms of property damage and life hazard.
Indeed, preventing structural collapse of a building during fire, which could occur if load
bearing steel elements reach a temperature above 550oC, is paramount to ensure safe
evacuation of people from the building, and is a prime requirement of building regulations
(HMSO, 1992) in many countries such as United Kingdom, USA and Europe countries [1,
2].
Passive fireproofing materials are the materials commonly used to protect steel structures
which are composed of insulating systems designed to decrease heat transfer from a fire to
the structure being protected. These can be panels or blankets, however usually, coatings
such as mineral-based or organic resin-based products, known as intumescent coatings, are
preferred. Intumescent coatings are designed to perform under severe conditions to maintain
2
the steel integrity between 1 to 3 hours when the temperature of the surroundings in excess
of 1100 °C [3,4,5,6].
Fire retardant coatings such as intumescent coatings are widely used to reduce flammability
of various structures. The use of intumescent coating is one of the most cost-effective,
convenient, and efficient way to protect materials against fire [7,8]. It has two main
advantages: it can prevent the penetration of heat and the spreading of flames, and it does
not modify the intrinsic properties such as mechanical properties of the intumescent coated
material [9].
Intumescence is defined as the swelling of certain substances as they are heated. Upon
heating, intumescent coatings will expand into multi cellular layer which acts as a thermal
barrier. These layers effectively protect its substrate against rapid increase of temperature
and thereby maintain the structural integrity of the structure. Intumescent coatings contain
active ingredients which are bound together by a binder (such as epoxy). Generally, the
active ingredients are composed of an acid source (normally ammonium polyphosphate or
other mineral acid), a carbon source (such as char forming polymers or polyols) and a
blowing agent (e.g. melamine). The composition of an intumescent coating has to be
optimized in terms of physical and chemical properties in order to form an effective
protective char [10].
Several researchers have studied about intumescent coating since past decades. Ammonium
polyphosphate (APP) as acid source is one of the fire retardant active ingredients which
have important effect to coating performance and durability. The APP act as acid source and
it contains many phosphates. It has ideal II crystalline type with high polymerization degree
(n > 1000) which ensures low-water-solubility, preferable decentralization and excellent
waterproof performance. However, APP possesses high heat stability and lack of
transference performance. The flame-retardant coating with the addition of APP has good
adhesive attraction, forms steady intumescent charring layer under flame, prevents the
coating from falling off and ensures the flame-retardant performance [9, 10]. An
investigation on the combination of different ingredients of fire retardant in a thermoset
epoxy coating was reviewed by Jimenez et.al [11].

3
The combination between APP and boric acid gave the best protection results. The
experiment showed that this combination leads to the smallest decrease of viscosity when
the resin degrades while the highest mechanical resistance and the highest expansion were
achieved. Furthermore, this additive interacts with the thermoset resin epoxy to increase its
thermal stability. The reaction between boric acid and APP occurs during heating -
permitting an adhesion between the coating and the steel substrate [11].
Figure 1-1 describes the condensed phase of intumescent coating during combustion.
Anderson et. al have discussed further investigation of intumescent system [12,13]. The
experimentation on intumescent reaction mechanism system with simplified mathematical
model was performed. The development of frontal model provided considerable insight to
intumescent reaction mechanisms. The frontal model assumed that the important physics of
intumescent took place in a narrow zone which was relatively sensitive to temperature. With
this assumption, the frontal model predicted and explained a fundamental property of
intumescing system which was the formation of an isothermal front which moved from the
free surface to the substrate. As long as the isothermal front persisted, the heat transfer to
the substrate was limited by the temperature gradient between the front and the substrate. As
an effect, the substrate was protected from higher temperatures of fire by an intervening
front that was characterized by a temperature considerably lower than the fire temperature
[13]. Though this model and simulation can predict the intumescent coating reaction
mechanism, there was considerable interest in achieving better understanding of the
mechanism in terms of the adhesion of intumescent coating on the steel substrate.
Figure 1-1 Condensed phase during combustion [14].
GAS PHASE
HeatCombustion product
Smoke
Carbonization
Heat
Oxygen
Combustible gases
Char Foam
Thermal Feedback
Decomposition Area

4
1.2 Problem Statement
The interface mechanism and the phenomena at the bonding between steel substrate and
intumescent coating are not fully understood yet. In coating of structural building, the
adhesion and adhesion strength are important in assessing the performance of the coating
which also determines its quality. The bonding strength depends on wetting ability, surface
tension as well as surface roughness of the substrate.
The wetting between contacts of two surfaces is necessary to get good adhesion between
coatings to coatings and coatings to steel substrate. The loss of solvent or wrong coating
proportion may destroy the bonding. In addition, one material must absorb on the other to
achieve good adhesion. In order to achieve, they must be highly compatible with each other
[15]. Besides the properties of coating material, the interface interaction between the steel
substrate and coating also became a fundamental aspect for coating durability. The reactions
between the ingredients and additives play an important role in intumescent coating system,
especially at the interface between the intumescent coating and the steel substrate.
It is also well known that the wet ability of the coating is significantly influenced with
surface roughness of a steel surface. The thickness of the coating also influences the
adhesive bonding strength. In order to achieve good adhesion, the bonding should have
consistent strength and long durability. The suitable surface roughness and thickness are
necessary to get optimum adhesion strength.
The use of a primer coating to promote adhesion and fill in the voids in the steel substrate
can help to improve part appearance and quality. Generally, the inhibitive pigments are
added into organic coatings as the main substance for corrosion inhibition. For this purpose,
zinc phosphate is commonly used as additives because it is known as a green pigment in
contrary to toxic pigments like chromate pigments [16]. Zubielewicz and Bastos [17, 18]
considered that zinc phosphate neither acted in compliance with electrochemical mechanism
nor improved the barrier function of the binder, and they further believed that the addition
of zinc phosphate did not exhibit any positive effect on the corrosion performance of the
coatings.

5
The reactions of the intumescent coating during combustion at high temperature can in
either or both of the vapor phase and the condensed phase occur. The combustion of the
intumescent coating is a complex process where there may be different mechanisms
occurring as the combustion increases. The formation of charring layer during the
combustion will give effect to the bonding strength of the steel substrate. However, from the
literature reviews there are not many works and revelation regarding the adhesion bonding
between steel substrate and intumescent coating especially after combustion and also primer
coating resistance to aggressive environment. Therefore, the study of adhesion on contact
area becomes an interesting subject to be discussed.
1.3 Research Objectives
As the adhesion bonding of steel substrate and intumescent coating is influenced by coating
thickness and aggressive environment, it is the objective of the current study to investigate
and characterize the effect of adhesion bonding of intumescent coating to steel substrate
with respect to the mechanical, physical and chemical properties. The properties of the
bonding, coatings and steel substrate were also investigated after the fire test.
1.4 Scope of Work
The study is focused on the adhesion bonding between intumescent coating/primer coating
and primer coating/steel substrate. It involves the characterization of the intumescent
coating, primer coating, carbon fiber and steel substrate, specifically on the mechanical,
physical, chemical, and thermal properties.
Six different commercial intumescent coating thicknesses were evaluated to investigate the
adhesion strength to steel substrate. The variable thicknesses are 1, 2, 3, 4, 10 and 22 mm
according to the actual condition. The effect of combustion on adhesion was also studied
with four variable fire test duration of 30 min, 45 min, 90 min and 120 min with
temperature maintain above 1000oC. The adhesion after combustion and three months
immersion in salt water were also investigated using electrochemical impedance
spectroscopy (EIS). EIS is a well-known electrochemical analysis to evaluate the
performance of organic coatings to corrosion. The morphology of the interface of steel

6
substrate and intumescent coating were also examined to study the effect of the combustion
and EIS test on the adhesion characteristics.
1.5 Organization of the Thesis
The thesis is presented in five chapters. Chapter 1 describes the research background related
to steel substrate and intumescent coating, their limitations and fire protection system that
can overcome their limitations. The motivation of the study and followed by the research
objectives and scope of study were presented.
Chapter 2 contains an extensive review on the mechanism of intumescent coating at room
and elevated temperatures. It also describes the effect of additives on the intumescent
coating, coating strength as well as the surface roughness of the substrate. The properties of
intumescent coating, primer coating, and steel substrate as well as the preparation methods
are also presented. Literature review on the properties of intumescent coating and steel
related to the current study are also presented to gauge the development of intumescent
coating research.
In Chapter 3, details of the materials used, equipment required and sample preparation of
the coating samples are described. Here, the mechanical properties, thermal, chemical
testing and morphological study involved are reported in detail.
Chapter 4 analyzes the obtained results. The study of surface roughness on steel surface, as
well as on the mechanical properties of the intumescent coating and steel substrate are
presented. The coating resistance to corrosion attack after fire test is also discussed as
qualitative method to assess the intumescent coating bonding quality on steel substrate. The
fire test and lap shear test of the intumescent coating sample on steel substrate, as well as
the thermal characteristics of the intumescent coating are discussed.
In Chapter 5, conclusions on the mechanical properties, thermal properties and chemical
properties of the intumescent coating on steel substrate are drawn. The effects of fire test
duration to coating resistance are also summarized. Finally, suggestions for future research
are also given.
7
CHAPTER 2
THEORY AND LITERATURE REVIEW
Coatings in the USA contain flame retardants less than 1% of paints in 2001, from SRI
International reports it can be estimated that the value of the flame retardant market
worldwide for paints and coatings was around $200 million in 2001. Business
Communications Company postulated that solutions to other environmental issues faced the
paint and coating industry in the 1990's and these had more urgency than flame retardant
[19]. Over the last decade, the paint and coating industry has made tremendous progress in
developing of flame retardant coatings. The intumescent coating market in the UAE was
estimated at around AED50 million in 2005. The rapid increase in construction has led to
more steel structures which in turn have resulted in more than double the demand for
protective coatings [20]. The importance of greater protection to fire for both life and
property has made both developers and consumers more aware of the need of flame
retardant.
Composite materials such as intumescent coating consist of resin matrix and glass fiber
reinforcement. The use of this composite increased for application on offshore installations.
This intumescent coating is a useful alternative to steel where corrosion resistance, low
weight, low cost, long service life and reduced maintenance are desirable. Intumescent
coating protects the metal by forming a char layer through thermo-chemical decomposition
in actual flight. It is seen in Figure 2-1 and Figure 2-2 that nearly all composites are superior
to metallic structures in their specific strength which is particularly advantageous for
offshore use. Advantages of the polymer composites are [21]:
• High specific strength properties (20-40% weight savings)
• Ability to fabricate directional mechanical properties
• Outstanding corrosion resistance
• Excellent fatigue and fracture resistance
• Lower tooling cost alternatives
• Lower thermal expansion properties
• Simplification of manufacturing by parts integration
• Ability to meet stringent dimensional stability requirements

8
10 100
100
1000
COMPOSITES
Glass/polyeste
rCarb
on/epoxy
Aramid/epoxy
METALLICSAluminum
SteelSpec
ific
Stre
ngth
, S u
t/γg
(MPa
)
Specific Stiffness, E/γg (GPa)
450
Figure 2-1 Specific strength versus specific stiffness for a range of engineering materials.
Specific strength is defined as the ratio of the ultimate tensile strength (Sut) to specific
gravity (γg) and specific stiffness as the ratio of Young’s modulus (E) to specific gravity
[22].
10 100
10
100
COMPOSITES
Glass/p
olyest
er
Carbon
/epox
y
Aramid/ep
oxy
METALLICS
Aluminum
Steel
Stre
ngth
/Vol
ume
Cos
t(M
Pa/£
/Litr
e)
Stiffness/Volume Cost (GPa/£/Litre)
1 5
Figure 2-2 Strength per volume cost versus stiffness per volume cost for a range of
engineering materials [22].
Epoxy resin are used in load-bearing structures such as aircraft, military vehicles, ships,
buildings and offshore structures due to their good mechanical, physical and chemical
properties and high strength to light weight ratios. However, for flammable matrix resins -

9
attention must be paid to fire risks, hazards from smoke and fumes. In order to increase
safety, some researches and improvements in flame retardancy have been given significant
priority. In infrastructures, and in many other civil engineering applications of fiber
reinforced plastic (FRP) structures, a fire situation may cause a very rapid rise of
temperature, and consequently strength degradation and final collapse. Thus, a predictability
of life under a rapidly rising temperature is extremely important for FRP structural
designers [23].
2.1 Categories of Flame Retardant
Flame retardants consist of some categories: inorganic, organophosphorus, nitrogen-based
organic, halogenated and intumescent flame retardant. Inorganic flame retardant is a number
of inorganic compounds which are used as flame retardant. The mechanism is interfering by
various physical processes with the burning process such as release of water or non-
flammable gases which dilute the gas feeding flames, absorption of heat energy thus cooling
the fire, production of a non-flammable and resistant layer on the surface of material. These
mechanisms of inorganic compounds are relatively low efficiency and the products having
to often be used in relatively large concentrations, or more usually, in combination with
other types of flame retardants. Specific application forms of these products can enable such
high concentrations to be added to plastics without modifying their performance properties
[24].
Organophosphorus flame retardants are primarily phosphate esters and represent around
20% by volume of the total global production. This category is widely used both in
polymers and textile cellulose fibres. Organophosphorus flame retardants in particular,
triaryl phosphates are used as alternatives to brominates flame retardants.
Organophosphorus flame retardants may in some cases also contain bromine or chlorine
[25].
Nitrogen-based organic flame retardants hinder the formation of flammable gases and are
primarily used in polymers containing nitrogen such as polyurethane and polyamide.
Melamines and melamine derivatives are the most important nitrogen-based flame
retardants and these acts as intumescent swelling systems [26].

10
Phosphorus based flame retardants is often used to increase the effectiveness of nitrogen
based flame retardants. They can be either simply added to plastics, or reacted into the
plastic molecules. Melamine-based products are the most widely used type of nitrogen
flame retardant today, and are used in furniture and building foams, nylons [27].
Halogenated flame retardant is flame retardant which is containing chlorine or bromine
atoms. These act by effectively removing the H+ and OH
- radicals in the gas flame phase.
This considerably slows or prevents the burning process, thus reducing heat generation and
so the production of further gaseous flammable material [27].
Barrier technologies have a wide immediate commercial applicability and involve layers of
materials that provide fire resistance. These include boric acid-treated cotton materials used
in mattresses, blends of natural and synthetic fibers used in furniture and mattresses. In
addition, the high performance synthetic materials are also used in fire fighter uniforms and
space suits [28]. Intumescent coating is one of these technologies.
2.2 Intumescent Coating
2.2.1 Type of Intumescent Coatings
Additives are added to intumescent coating in order to optimize the performance at high
temperature. Intumescent coating additives undergo a thermal degradation process on
heating which produces a thermally stable, foamed, multi cellular residue called
intumescent char. The additives are added to a polymeric material which is later involved in
a fire, they produce an intumescent char which accumulates on the surface, while the
polymer is consumed. The char layers will be providing insulation to the underlying
materials and partially protecting it from the action of flame [29].
There are two different types of intumescent coatings: traditional chemical intumescent fire
retardant coatings with chemical fire retardant mechanism and physical intumescent
coatings containing expandable graphite with physical fire retardant mechanism. The
development of these coatings is focused on improving the fire retardant efficiency, weather
durability of the products, and reducing the emission of smoke and volatile organic

11
compounds (VOC) as well as toxic gases to provide safe and environmental-friendly
products for end-users [30].
The types of traditional intumescent coatings consist of three basic components which are
carbon source, acid source and gas source [31]. A carbon source can be a carbon-rich
polyhydric compound, such as a starch, glucose, pentaerythritol. An acid source or a
dehydrating agent is capable of promoting the formation of a carbonaceous char from the
carbon source. This is usually a source of phosphoric acid, such as ammonium phosphate,
diammonium phosphate, and the other phosphates. The last important substance is a gas
source. An intumescing agent that would expand the film of coating upon heating depends
with the gas content. Nitrogen or halogen releasing compound such as urea, melamine and
melamine phosphates or chlorinated paraffin are usually used as gas source [32].
The ideal compatibility between these three basic components is important to producing an
excellent fire retardancy at high temperature The dehydration to char and release of gas in a
transitional semi-liquid state sufficient to enable foaming and expansion to occur, followed
by full carbonization without char collapse [33].
A water-based intumescent coating for various lignocellulosic materials, such as lumber,
was formulated by expandable graphite, limestone, a polymeric binder such as phenol-
formaldehyde resin, pentaerythritol and urea. Aluminum hydroxide is often used to increase
absorption and neutralization of toxic gases and as an absorbent promoter [34].
Combining melamine phosphates and ammonium polyphosphate might give better products
with synergism. Recent results illustrated that combining layered double hydroxides with
ammonium polyphosphate in polyamid-6/polypropylene would give synergistic fire
retardant effect [35]. Similar studies of aluminosilicates on intumescent flame retardancy of
ammonium polyphosphate and pentaerythritol in polypropylene had been reported [36].
Results suggested that synergistic effect might give better products. Smaller amount of fire
retardants additives can be used so that the mechanical properties would not be changed.
Expandable graphite intumescent coatings are the second type of intumescent coating. This
type of intumescent coatings contains expandable graphite which is a new generation of fire
retardant additives. Expandable graphite is formed by treating crystalline graphite, which is

12
composed of stacks of parallel planes of carbon atoms, with intercalates such as sulfuric
acid and/or nitric acid. The chemical reaction in the case of H2SO4 is expressed by the
following equation [37]:
H2SO4 + ¼ O2 SO4 + ½ H2O (2-1)
Since no covalent bonding exists between the planes of the carbon atoms, intercalates can
be inserted into the gap and positioned within the graphite lattice. When the intercalated
graphite is exposed to heat or flame, the inserted molecules would decompose and release
gases. The gas forces the graphite layer planes apart and the graphite would expand.
Expandable graphite coatings can expand to a greater degree than the traditional
intumescent coatings, and thus provide better insulation to the underlying materials [38].
However, drawbacks with expandable graphite coatings are the popcorn effect and the blow
off the graphite at high temperature. The popcorn effect can often be hindered, where the
expansion of the grains of graphite would cause the grains to pop off the surface of the
underlying material. Second, the expanded graphite might be blown off the underlying
material by the air turbulence induced in a fire. A suitable choice of binder or carbon source
can be used to prevent the popcorn effect and to hold the expanded coating together.
Expandable graphite is often used with ammonium polyphosphate or polyurethane to
produce a synergistic fire retardant effect [39,40].
2.2.2 Properties of Intumescent Coatings
The development of intumescent coatings in the past few years are to increase the properties
of this coating at high temperature. Intumescent coatings are supposed to have better fire
retardancy, lower smoke emission, low hygroscopic property, high temperature resistance,
resistance to mildew and rot, and other multi-functions.
Leach resistant and durable to weather are the basic properties of intumescent coatings.
Some additives such as a microencapsulated ammonium polyphosphate with low water
solubility were used in an intumescent coating formulation. A methylstyrene-acrylate
copolymer with better leach resistance and weather durability, as well as adhesion under
wet conditions was chosen as the binder. For this coating, no ammonium is given off at 75%

13
to 100% relative humidity conditions, and fire classification (DIN 4102) F 30 [41] is
reached before and after accelerated tropical weathering [42]. As disclosed by some patents,
amorphous silica, ammonium tri hydrate (ATH) and magnesium hydroxide can act as a
filler and smoke suppressant or absorbent promoters apart from being water-resistant in the
intumescent coatings [43, 44].
The addition of transition metal oxides are usually used to hold smoke and promote char
formation via a reductive coupling mechanism in poly (vinyl chloride) [45,46]. Cerium
oxide and/or molybdenum oxide can also be added into the intumescent coating formulation
to inhibit smoke release [47] as disclosed in a patent.
Zinc borate and boric acid can be used not only as fire retardants, but also to reduce smoke
release and after-glowing of the coating [48]. Toxic gas absorbent materials such as
limestone (CaO), calcium carbonate (CaCO3), sodium bicarbonate (NaHCO3), or sodium
carbonate (Na2CO3) can be added into the intumescent coating containing expandable
graphite to remove and eliminate those toxic gases. Typical reaction mechanisms can be
described by the following chemical equations [49]:
[HCO3]+ ½ [SO4] [CO2] + ½ [H2SO4] + H2O (2-2)
[CO3] + [SO2] + ½ [O2] [SO4] + [CO2] (2-3)
H2O + [SO2] + NO [H2SO4] + ½ [N2] (2-4)
[H2CO3] + [H2SO4] [H2SO4] + [CO2] + H2O (2-5)
[H2CO3] H2O + [CO2] (2-6)
An intumescent coating should not only have fireproof and waterproof properties, but also
anti-corrosion and resistance to mildew and rot.
2.2.3 Intumescent Coating Application
The Intumescent coatings can be applied to various substrates such as metal, plastics,
textiles and wood. The intumescent coating application also might be applied in a wide
range of places including hallways, stairwells, and furnace areas of public buildings such as
hospitals, nursing homes and courthouses.

14
Intumescent coatings are also used to protect LPG Vessels. A significant delay in the
operation of the safety valve can be made with the presence of the intumescent coating.
These methods for the protection of LPG vessels are promising in regard to the prevention
of explosions in these vessels under fire [50,51].
The protection of electric wire and cable also use intumescent coating. Some literatures
discussed about the technology and testing methods of various intumescent coatings for
electric wire and cable [52,53]. The intumescent coatings were found to be quite effective in
reducing the burning behavior of power cables at high temperature.
The epoxy intumescent paint is also suitable for restoring the interiors of railway passenger
cars. Based on the assessment of brushing properties, indicative fire tests, and realistic fire
rig tests carried out in a modified railway car [54]. An intumescent coating consisting of
polyurethane, APP and pentaerythritol, as well as acrylic polymer binder has no moisture-
uptake problems. It has a limiting oxygen index of at least 25%. It can be applied to the
surface of blinds or curtains. [55].
The application of intumescent coating on the surface of the wood, for interior and exterior
applications such as roofing, walls, and floor sheathing are highly developed. This coating
can also be applied to other substrates such as glass-fiber laminated composites, etc [56].
Lots of information on the researches and applications of the fire coatings for wood or
timber are reported in patents [57,58] and literatures [59,60].
2.2.4 Intumescent Coating Reaction Mechanism
There are two commonly used hydrocarbon fire test curves. Firstly, it is defined by several
standards, including ISO 834 for hydrocarbon curve [61], the Norwegian Petroleum
Directorate (NPD), Underwriters Laboratory in their standard UL1709 [62] and BS 476
Appendix D [63]. The comparison of cellulosic fire and hydrocarbon fire are shown in
Figure 2-3.
Fire test curves designed to replicate the time/temperature profile of a typical building fire
fuelled by items such as wood and paper commonly called the cellulosic curve and defined
in standards such as BS 476 Part 20 to 22 [63, 64] and ASTM E119 [65].

15
There are two types of hydrocarbon fuel. Hydrocarbon fuel burning under atmospheric
pressure is classed as a pool fire, while fires that result from pressurized inventory streams
are referred to as jet fires. Products tested to a hydrocarbon fire curve are required in both
onshore and offshore oil and gas facilities, and may be required in other types of chemical
plant depending on the hazardous nature of the process.
00
1000
800
600
400
200
1200
20 40 60 80 100 120 140
Time, t (mins)
Tem
pera
ture
, T
(o C)
1400
hydrocarbon curve (NPD)
cellulosic curve (BS 476)
Figure 2-3 The different time temperature curves for this kind of hydrocarbon fire and
cellulosic fires (as used for most building regulations standards on fire protection) [14].
Hydrocarbon fires are characterized by a rapid and massive temperature increase as the fuel
ignites. This also causes a high level of pressure that would seriously compromise
traditional thin-film intumescent. Most other traditional structural steelwork fire protection
systems would also find it difficult to cope with this level of force.
The intumescent coating mechanism at high temperature is almost similar with how
materials burn. This intumescent coating does not burn directly but they must be first
decomposed by heat (pyrolysis) to release flammable gases. Visible flames appear when
these flammable gases burn with the oxygen (O2) in the air. If this coating does not break
down into gases then they will only burn slowly. The formation of multi cellular chars
forms a stable carbonaceous barrier which prevents access of the flame to the underlying
material. However, even materials such as wood do in fact burn vigorously, because once
ignited the heat generated breaks down long-chain solid molecules into smaller molecules
which transpire as gases [66]. The intumescent coating charring layer performance is
essentially known as physical barrier to heat and mass transfer between the flame and the

16
burning material. The pyrolysis reaction of the polymer produces combustible volatile
products to feed flame. The combustion is reduced by the decrease in temperature, caused in
turn by a lower heat supply from the flame. The diffusion at the volatile products towards
the flame is hindered with further reduction of the flame feed. Furthermore, whatever may
be the role of oxygen in the combustion process, its diffusion towards the polymer burning
surface is also hindered. This series of events can lead to an interruption in the self-
sustained combustion process because the flame is starved. As previously mentioned, flame
retardants act by interfering with one or more steps of the burning cycle. A schematic
diagram of this cycle is given Figure 2-4.
Figure 2-4 The burning cycle [66].
As shown in burning cycle, a polymer burns via the vapor phase combustion of the volatile
products produced during its thermal oxidation degradation. The vapors phase combustion
is a free radical process which can be simplified and expressed as follows, where RCH3 is
representative of the hydrocarbon undergoing combustion [66]:
RCH3 +OH- RCH2- + H2O (2-7)
RCH2 + O2 RCHO + OH- (2-8)
2OH- + CO H2O + CO2 (2-9)
H+ + O2 OH- + O-2 (2-10)
H2 + O-2 OH- + H+ (2-11)

17
Several flame retardants act by inhibiting this vapor phase combustion. They produce
decomposition products at the same temperature as the polymer substrate decomposes. Less
reactive radicals are formed, which inhibit the combustion process.
The combustion itself is maintained by the action of high energy radicals: H+ and OH- at the
gas phase. At this stage, molecules decompose to give free carbon which can react with
oxygen in air to burn to CO, generating heat energy. The schematic of pyrolysis system is in
Figure 2-5.
A simplified mathematical model has been developed [67] describing an intumescent
system which complements the work done in the more detailed analytic model [68]. The
model is constructed for intumescent systems in which it is assumed that the transition to
the intumescent state occurs at an infinitesimally thin zone or front.
Figure 2-5 Pyrolysis reaction during fire test.
In the analytic model developed by Anderson and Wauters [12], assumed the intumescence
coating mechanism occur continuously as a function of mass loss. The frontal model that
used is one dimensional. The coating can be divided into two regions separated by the front,
as depicted in Figure 2-6. To the left of the front, the temperature is not sufficiently high to
start Intumescence and the material velocity is zero. To the right of the front, intumescence
has occurred and the char is moving with a uniform and nonzero velocity, uf. It will be
found, though, that uf changes with time. The heat equation (2-12), applies to both regions,
though the convective term is not present in the region to the left of the front since u = 0:

18
ρCp (∂T/∂t + u ∂T/∂t) = ∂/∂x k ∂T/∂x (2-12)
The symbol ρ, Cp, and k are the density, specific heat and thermal conductivity,
respectively. The material properties can be summarized for the two regions:
Virgin State (Left Region) Char State (Right Region)
m = mo m = mf
ρ = ρo ρ = ρf
u = 0 u = uf
k= ko k = kf
Where m represents the total coating mass and the subscript zero refers to the initial or
virgin state, and the subscript f refers to the final state after tumescence has occurred.
Figure 2-6 Schematic of frontal model [12].
In order for intumescence to occur, several distinct reactions must occur nearly
simultaneously in the proper sequence [13]. The development of a Frontal Model has
m = mf
ρ = ρf
u = uf
k = kf
m = mo
ρ = ρo
u = uo
k = ko
T
VIRGIN
MATERIAL
SUBSTRATE
Intumescent
Front
(Infinitesimally
Thin)
h q
uf
CHAR
h (t)
L (t)

19
provided considerable insight into intumescent reaction mechanisms. The major assumption
of the Frontal Model is that the important physics of Intumescence takes place in a narrow
zone which is relatively sensitive to temperature. The Frontal Model then takes advantage
of this assumption by approximating mathematically this pyrolization region, called the
front, as infinitesimally thin and at a temperature T* (intumescent coating critical
temperature). The heat equation is applicable on both sides of the front (i.e., the virgin
material side and the char side) and the two regions (virgin material and char regions) are
connected by using jump conditions in the velocity, heat flux, and mass (such as mass loss).
With these assumptions, the Frontal Model predicts and explains a fundamental property of
an intumescing system-the formation of an isothermal front which moves from the free
surface to the substrate. As long as the isothermal front persists, the heat transfer to the
substrate is limited by the temperature gradient between the front and substrate. In effect,
the substrate is protected from the higher temperatures of a fire by an intervening front that
is characterized by a temperature considerably lower than the flame temperature.
Figure 2-7 Model prediction of substrate thermal response [13].
Figure 2-7 is representative of the temperature-time history of the substrate coating
interface. Note the plateau or leveling off of the temperature in Figure 2-7. The
interpretation of this interesting feature predicted by the frontal model is as follows: the
substrate is heating with time. However, the heat conducted to the substrate is limited
because the temperature of the front is clamped at T*. The substrate is shielded effectively

20
from the high temperature of the external heat source which limits the heat flux until the
front reaches the substrate. To be sure, the time it takes for the front to reach the substrate is
dependent on the applied heat flux at the external surface and the effectiveness of the
intervening char, but the substrate cannot rise in temperature past T* until the front reaches
the substrate. The time duration or length of the plateau is dependent on the external heat
flux and the quantity of heat absorbed via endothermic process at the front. The time it takes
for the front to reach the substrate depends upon the velocity of the front, h, which changes
with position. The velocity has its largest value now the surface begins to intumesce and its
smallest value the moment the front reaches the substrate. As char intervenes between the
surface and the front, the velocity of the front can slow. Indeed, the slower the front moves
toward the substrate, the more evident the plateau in Figure 2-7. If a char does not form
between the surface and front that is the char ablates away, the front will see a larger heat
flux than if there is an intervening char; the front would reach the substrate in a much
shorter time, resulting in a short plateau [13].
2.3 Carbon Fiber
Though the intumescent coatings adhere well to most substrate, it is known to embed carbon
fiber in the coatings. The carbon fiber is mechanically attached to the substrate. The
function of this carbon fiber is to reinforce the char once it forms in a fire. More
specifically, this carbon fiber reduces the change that the coating will crack or fissure.
Fissures reduce the protection provided by the coating because they allow heat to more
easily reach the substrate. When fissure in the material do occur, they are not as deep when
carbon fiber is used. As a result, the intumescent coating does not need to be applied as
thickly. Glass cloth has also been used to reinforce intumescent coating. Glass, however,
softens at temperature to which the coating might be exposed. Once the glass softens, it
provides no benefits [69].
The carbon fiber also provides an additional advantage before there is a fire [69].
Intumescent coating are often applied to steel substrate and are often applied where the
coating is exposed to harsh environmental condition including large temperature swings of
as much as 120oC. Such temperatures swings can cause the intumescent coating debonding
from the substrate. However, the carbon fiber will reduce debonding. Debonding occurs

21
because of temperature swings because of the difference in the coefficient of thermal
expansion between the coating and the substrate. When the temperature changes, the
coating and the substrate expand or contract by different amount. This difference in
expansion or contraction stresses the bond between the coating and the substrate. Even
though the intumescent coating is flexible, sufficient stress can break the bond between the
coating and the substrate. However, carbon fiber embedded in the intumescent coating
makes the coefficient of thermal expansion of the coating much closer to the coefficient of
thermal expansion of the substrate. As a result, less stress occurs and debonding is much
less likely to happen [70].
2.4 Steel Substrate
Steel is non combustible material that is available in various product type: structural (hot
rolled), reinforcing or cool formed. As with any other material, exposure to elevated
temperature leads to temporary decrease in the strength and stiffness of steel. Such
prolonged degradation adversely affect the resulting deformation and load carrying
capabilities of steel during the fire exposure such as deformations are increased and strength
and stiffness are reduced. Steel thermal properties are also affected, such as the coefficient
of thermal expansion, specific heat and conductivity, which effect the heat transfer and
temperature profile calculations [71].
2.4.1 Thermal Properties of Steel
After exposure to temperatures in excess of about 600oC for more than 15 min or more,
unprotected steel will quite visibly deform, twist and buckle. Starting from 600oC, the
crystalline or metallurgical changes are inconsequential during the fire itself relative to the
significant decrease in strength at these elevated temperatures. However, the significant
heating effects of the fire could permanently alter the nature of the steel material. Usually
steel that has experienced a hot and prolonged fire will have such extensive damage that
replacement rather than its straightening and repair, will be prudent on cost consideration
alone, so the long term metallurgical changes will be irrelevant [71]. According to iron
carbon phase diagram in Figure 2-8, the maximum temperature of steel to maintain its
metallurgical structure is below eutectoid temperature, 723oC. Steel that has not exposed to
very significant temperature for a prolonged time will not be significantly deformed, its

22
metallurgy will not be affected after cooling and hence it will regain its original thermal
properties.
Figure 2-8 Iron Carbon phase diagram [72].
The coefficient of thermal expansion, melting point, thermal conductivity, heat capacity and
specific heat some materials are listed in the Table 2-1. When a metal is heated, it will
expand. Some metals expand more rapidly than others as the temperature increases. The
coefficient of thermal expansion describes how fast a material expands when subjected to
heat. The greater the coefficient, the more a material expands. Melting point is another
important thermal property. The material will change from a solid to liquid at this
temperature. If heat can travel rapidly across the material, it has high thermal conductivity
[73].
2.4.2 Mechanical Properties of Steel
Hardness, ductility and strength are the three properties which related to one and another.
By measuring the hardness of a metal, the strength, brittleness and ductility of metal are
indirectly measured. Factors to be considered include the nature of the applied load and its
duration, as well as the environmental condition. Application time may be only a fraction of
a second or it may extend over a period of many years. Service temperature may be an

23
important factor. Table 2-1 presents the comparison of each property for different materials.
As temperature changes, mechanical properties also change. The strength, hardness,
ductility and modulus of elasticity are normally affected. Generally, as the strength and
hardness increase, ductility decreases and the material becomes brittle. A loss of ductility,
tensile strength or impact strength as the temperature increases occur suddenly as the
temperature reaches a thermal transition level [34].
Table 2-1 Compares of the coefficient of thermal expansion, melting temperature, thermal
conductivity and specific heat of the different materials [73].
Material Coefficient of Thermal
Expansion (per oF)
Melting
Temperature (oF)
Thermal
Conductivity
(cal/cm2/oC/sec/cm)
Specific Heat
(BTU/lb/oF)
Gray Iron 6.0 x 10⁻⁶ 2400 0.11 0.130
Steel 6.5 x 10⁻⁶ 2700 0.11 0.116
Nickel 7.3 x 10⁻⁶ 2650 0.22 0.109
Copper 9.2 x 10⁻⁶ 1980 0.94 0.093
Aluminum 12.8 x 10⁻⁶ 1220 0.45 0.222
Magnesium 14.4 x 10⁻⁶ 1200 0.37 0.095
Zinc 17 x 10-6 790 0.27 0.031
Nylon 50 x 10-6 300 0.0006 0.400
Polystyrene 100 x 10-6 250 0.001 0.320
2.4.3 Chemical Properties of Steel
Corrosion resistance is one of the most important chemical properties of a metal. A metal
that has good corrosion resistance is able to protect itself against chemical attack by the
environment. A corrosion resistance material can resist humidity without deteriorating. It
can also resist sunlight, water and heat. The use of intumescent coating will protect steel
from corrosion attack due to its high properties of chemical resistance.
2.5 Adhesion
The bonding of an adhesive to an object or a surface is the sum of a number of mechanical,
physical, and chemical forces that overlap and influence one another. Mechanical
interlocking is caused by the mechanical anchoring of the adhesive in the pores and the
24
uneven parts of the surface, electrostatic forces, as regard to the difference in electro
negativities of adhering materials, and the other adhesion mechanisms dealing with
intermolecular and chemical bonding forces that occur at the interfaces of heterogeneous
systems [74].
2.5.1 Adhesion Theory
The adsorption theory states that adhesion results from intimate intermolecular contact
between two materials, and involves surface forces that develop between the atoms in the
two surfaces. The figure is presented in Figure 2-9.
Figure 2-9 Van der Waals interaction [75].
The adsorption theory is the most important mechanism to achieve good adhesion. The most
common surface forces that form at the adhesive-adherent interface are Van der Waals
forces. In addition, acid-base interactions and hydrogen bonds, generally considered a type
of acid-base interaction, may also contribute to intrinsic adhesion forces. Research has
experimentally demonstrated that the mechanism of adhesion in many adhesive joints only
involves interfacial secondary forces. The calculated attractive forces between two surfaces
are considerably higher than the experimentally measured strength of adhesive joints; this
discrepancy between theoretical and experimental strength values has been attributed to
voids, defects or other geometric irregularities which may cause stress concentrations
during loading. To obtain good adsorption, intimate contact must be reached such that van
der Waals interaction or the acid-base interaction or both take place; hence good wetting is
essential [75, 74].

25
Consider a liquid drop on a solid substrate; there are three different phases present
according to Figure 2-10. Therefore, there are three surface tensions that need to be
considered: solid-liquid, liquid-gas and solid-gas. Young’s equation [76] gives the relation
between the equilibrium contact angle θ the drop makes with the surface and the three
surface tensions as:
γSV = γSL + γ cos θequilibrium (2-13)
Figure 2-10 A liquid drop on a solid substrate with three different phases.
Young’s equation can also be interpreted as a mechanical force balance on the three-phase
contact line; the surface tension is energy per unit area, equivalent to a force per unit length
acting on the contact line. Where γ ≡ γLV denotes the liquid vapor surface tension when the
three phases, solid, liquid and gas, are at least in mechanical equilibrium (force balance)
with each other. Here s, sl and γ are the interfacial free energy per unit area for the solid–
vapour, solid–liquid and liquid–vapour interfaces. In addition, we consider chemical
equilibrium (chemical potential matching for each component present) and thermal
equilibrium (temperature matching) between liquid and gas, so that the gas is the saturated
vapor of the liquid. Mechanical, chemical and thermal equilibrium together are referred to
as thermodynamics equilibrium [76].
According to equation (2-13), angle θequilibrium is understood to be measured
macroscopically, on a scale above that of long-ranged intermolecular forces. If the three
tensions are known, the wetting state of the fluid follows directly. If γSV < γSL + γ, a droplet
with a finite contact angle minimizes the free energy of the system; we speak of partial
wetting. On the other hand, if γSV = γSL + γ, the contact angle is zero. The system will
consequently be in equilibrium when a macroscopic uniform liquid layer covers the whole
solid surface and we speak of complete wetting.

26
The distinction between the different wetting states is usually made by considering the
equilibrium spreading coefficient Seq ≤ 0, which represents the surface free energy γSV
relative to its value for complete wetting:
Sequilibrium ≡ γSL – ( γSL + γ ) = γ (cos θequilibrium – 1) (2-14)
Figure 2-10 shows the three wetting states that may exist in any three-phase system. For a
solid-liquid-vapor system, complete drying would correspond to the intrusion of a
macroscopic vapor layer between the solid and the liquid. From a thermodynamic point of
view, the wetting and drying states are very similar, the only difference being that liquid and
vapor are interchanged. In practice, drying is rather rare (with mercury on for instance, glass
as a notable exception) since Van der Waals forces tend to thin vapor layers [76]. The
research work focuses on wetting the steel substrate by intumescent coating material.
2.5.2 Adhesion Bonding Between Coating and Steel Substrate
The metal and the surface characteristics of metal can have major effects on adhesion. The
surface tension of a clean metal surface (usually metal oxide) is higher than that of any
potential coating. However, metal surface are frequently contaminated with oil and such
surface can have very low surface tension. Steel can be cleaned by abrasive particle blasting
such as sand blasting. The surface of steel, including rust, is removed, leaving a rough
surface. The surface of clean steel is not iron; rather, hydrate iron oxides are present as a
monolayer on the iron. The surface is rarely uniform on the molecular level. Adhesion to
this surface is promoted by developing hydrogen bonds between groups on the resin
molecules and the oxide and hydroxide groups on the surface of the steel [77].
It follows that adhesion is promoted by using resins having multiple hydrogen-bond
donating and accepting groups, such as carboxylic acid (strongly hydrogen-coating), amine
(strongly hydrogen-accepting), hydroxyl, urethane, amide (the latter three being both
hydrogen-donating and hydrogen accepting), and the phosphate (hydrogen-donating and
hydrogen accepting). One might assume that a large number of such substituent on a
molecule would be desirable. However, it is known from adsorption studies that if there are

27
large numbers of polar groups, at equilibrium the absorbed layer can be very thin. At
equilibrium, adsorption of adjacent polar groups is favored sterically, resulting in a thin
absorbed layer with the polar groups on the steel surface and the only hydrocarbon groups
exposed to the rest of the coating. The interaction between the rest of the coating and the
hydrocarbon groups would be expected to be weak, resulting in a weak boundary layer and
poor cohesion [77].
In general, the results of many studies of adsorption of polymer molecules in metal surface
are consistent with Figure 2-10. Although strong interaction between coating and steel is
critical for achieving good adhesion, it is also important to develop interaction that cannot
be displaced easily by water. A reason that the presence of multiple groups in resin
molecules, such as hydroxyl groups on epoxy resins, may be desirable is that some may
remain bonded to the steel while others are reversibly displaced by water. This phenomenon
has been termed cooperative adhesion [78].
It was found empirically that amine groups on the cross-linked resin molecules promote
corrosion protection. Explanations for the effect are controversial; one hypothesis is that the
amine groups interact strongly with the steel surface and are not easily displaced by water
from the surface as are hydroxyl groups. Phosphate groups are another subsistent group that
has been found to improve adhesion in the presence of water (wet adhesion). For example,
the use of epoxy phosphate in epoxy coating has shown to improvement on both adhesion
and wet adhesion [79].
2.6 Electrochemical Description of an Organic Coating on a Metal Substrate
Electrochemical Impedance Spectroscopy is used to characterize a painted metal substrate -
simultaneously measuring two phenomena: (1) the deterioration of the organic coating
caused by exposure to an electrolyte and (2) the increase in corrosion rate of the underlying
substrate due to the deterioration of the coating and subsequent attack by the electrolyte. In
EIS, an AC voltage of varying frequency is applied to the sample [80].
The capacitance of a metal electrode in contact with an electrolyte gives an important
information for any electrochemical system [81]. As the organic coating deteriorates with
time during exposure to an electrolyte, EIS can track changes in the capacitance of the

28
coating. The capacitance will change as the coating swells or absorbs water, for example. In
addition, changes in the porosity of the coating also can be measured. EIS can also
simultaneously monitor the rate of corrosion of the metallic substrate which generally
increases as the protective coating fails, allowing the electrolyte to contact the substrate. To
quantify these physical and chemical processes with EIS, we need an appropriate equivalent
circuit. The equivalent circuit that is most commonly used to describe an organic coating on
a metallic substrate is shown in Figure 2-11. Figure 2-11 , the equivalent circuit is overlaid
on a schematic of a coated metal substrate.
Figure 2-11 Equivalent circuit of an organic coating on a metal substrate overlaid on a
schematic of a painted metal surface.
Ru (Uncompensated Resistance) is the resistance of the electrolyte between the working
electrode and reference electrode. For studies of organic coatings, the electrolyte is very
conductive, so Ru is usually very low (1-50 ohms) and can be ignored. CCoating (Coating
Capacitance) is the capacitance of the organic coating gives an important parameter to
measure during coating failure. Because most coatings are relatively thick, the coating
capacitance tends to be rather low, in the range of 1 nF/cm2. The physical and chemical
properties of the coating that affect the capacitance are [81]:
Ccoating = (ε) (εo) (A)/t (2-15)
Where ε is the dielectric constant of the coating, εo is 8.85 x 10⁻¹⁴ Farads/cm, A is the area
(cm2), and t is the thickness (cm). The capacitance is related to the magnitude of the
impedance (|Z|):

29
(|Z| = 1 / (2πfCcoating) (2-16)
f is the frequency of the applied AC voltage. Rpore (Pore Resistance) is the resistance of the
coating changes during exposure due to the penetration of electrolyte into the micro pores of
the coating. Upon immersion, the pore resistance can be very high (>1010 ohm) and usually
decreases with time of exposure to the electrolyte. However, it is not unusual for Rpore to
increase after long exposure times; the increase is commonly attributed to corrosion
products from the metal substrate blocking the pores. RP (Polarization Resistance) is the
Polarization Resistance describes the corrosion rate of the metal substrate beneath the
coating. For a metal in the absence of a coating, the corrosion rate can be determined from
the Polarization Resistance. The Polarization Resistance is inversely proportional to the
corrosion rate. A typical Polarization Resistance for a bare metal is 5000 ohm-cm2. Rp must
be normalized because it is electrode area dependent. Cdl (Double Layer Capacitance) is the
coating is not the only structural feature of the sample that gives rise to a capacitance. There
is a charge on the metal electrode and a charge in the electrolyte that are separated by the
electrolyte interface. Since this interface is commonly known as the double layer in
electrochemical theory, the capacitance is called the Double Layer Capacitance and
abbreviated Cdl [82]. The value of Cdl is usually in the range of 10–40 μF/cm2. This
capacitance is much higher than Ccoating (~ 1 nF/ cm2, or 10–9 F/cm2), so the Cdl of even a
small holiday will be apparent in the EIS response.
|Z| = 1/(Cdl x Rt) (2-17)
A metal covered with an undamaged coating generally has very high impedance. The
equivalent circuit for such a situation is in Figure 2-12 and the Nyquist for this model is
shown in Figure 2-13.
Figure 2-12 Purely Capacitive Coating.

30
Figure 2-13 Nyquist plot for excellent coating.
The Nyquist plot for the equivalent circuit in Figure 2-11 is shown Figure 2-14. The
adhesion bonding strength can be observed by fitting a data curve to this Nyquist type of
model.
Figure 2-14 Nyquist plot for damage coating.
2.7 Literature Review
2.7.1 Effect Thermo Oxidation to Adhesion
The past experimental data have shown that the contact thermo oxidation can have the
considerable effects on the stability performance of the adhesive joints. The cohesive

31
characteristics of the boundary layers in the adhesive joints are affected by the contact
thermo oxidation reactions of the polymer catalyzed by iron surface compounds [83]. As
pointed out by Kalnins and Ozolins [84], oxygen from several sources can take part in the
contact thermo oxidation, oxygen which diffuses through the polymer layer, oxygen
captured at the interface, and finally, oxygen which is absorbed or chemisorbed by metal
surface oxide. The main features of contact thermo oxidation (oxygen uptake, carbon
dioxide evolution, change in the carbonyl group content, and change in the layer weight)
under conditions of a free access of oxygen through the polymeric layer are kinetically
interrelated with the change in peel strength. The rate of change of the individual kinetic
parameters of contact thermo oxidation as well as of peel strength is dependent on the
thickness of the adhesive layer and on the contact temperature. The dependence of peel
strength on the contact time t can be described by an expression based on the assumption
that the magnitude of peel strength is controlled by two main competing processes, the
accumulation of oxygen-containing groups and the oxidation cross-linking which increase
the peel strength values, on the one hand, and the reactions of oxidative destruction which
decrease peel strength, on the other hand.
Water may affect both the chemical and physical properties of the adhesive and the nature
of the interface that exists between it and substrate [85]. Brockmann [86] studied the change
in strength and deformability of the adhesive (usually a polymer-based material) layer under
hot and humid environmental conditions and concluded that, for aluminum adherents, the
water stability is dependent on the adhesive and surface treatment. He pointed out that the
two most effective ways to increase stability were: to change the surface condition through
special surface pretreatment, and to use corrosion resistant primers.
2.7.2 Effect of Coating Thickness to Adhesion
An interphase is created between the coating part with bulk properties and the metallic
surface when epoxy-amine pre-polymers are applied onto metallic substrates. A partial
dissolution of the metal oxide is observed. Then, metallic ions diffuse in the liquid
monomers mixture (epoxy-amine) and react with the amine groups of either IPDA or DETA
monomers to form organometallic complexes. The practical adhesion decreases because of
the increase of the residual stresses when the interphase is formed [87]. The interphase
figure is shown in Figure 2-15.

32
Figure 2-15 Schematic drawing of tri-layer models [87].
In more recent work, Dillingham et.al [88] showed spectroscopically that the molecular
structure in the interfacial region of an epoxy/aluminum joint varied with the curing agent
and the curing temperature and was different from bulk cured resin. Interphase produced by
purely physical process is also well known. Such a process produces the so called trans
crystalline region. This region had properties that are different from bulk and these
properties influence the mechanical behavior of joint system of materials which contain
them [89].
2.7.3 Effect of Water Uptake to Adhesion
As is generally known and accepted, adhesively bonded joints will suffer a loss in joint
strength when exposed to high humidity, liquid water and/or high temperatures. It can be
seen from Figure 2-16 and Figure 2-17 that the young modulus, yield stress and ultimate
stress decrease when the adhesive becomes wet, while the strain to failure increases. In
other words, moisture increases the flexibility and ductility of the adhesive.
Abdel Wahab et. al. [90] have investigated the degradation in the joint strength due to water
uptake in terms of the change in mechanical properties and swelling. There is evidence of
swelling, which becomes significant as water uptake increases. The effect of moisture on
the mechanical properties of adhesive was determined by testing bulk specimens in
dumbbell form under dry and wet conditions. The wet specimens were immersed in water at
60°C until saturation. Both dry and wet specimens were subjected to tensile loading and the
stress/strain diagrams were obtained. Figure 2-16 shows a comparison between these
diagrams. It can be seen from Figure 2-16 that the E-modulus (the slope of the linear part),
yield stress and ultimate stress decrease when the adhesive becomes wet, while the strain to

33
failure increases. In other words, moisture increases the flexibility and ductility of the
adhesive.
Figure 2-16 Effect of moisture (wet and dry) on mechanical properties of adhesive joints
[90].
The strength retention as a function of immersion time (in weeks) is shown in Figure 2-17
for the tensile butt joints, respectively. It can be seen that the silane improves the durability
of the joint. The loss in strength is more significant in the first 3 weeks of ageing [91].
Figure 2-17 Effect of water uptake on joint strength [91].

34
CHAPTER 3
MATERIALS AND METHODOLOGY
3.1 Materials
3.1.1 Intumescent Coating
The Chartek 7 intumescent coating and the Intergard 251 primer coating were supplied by
International Paint Sdn Bhd. Chartek 7 is reinforced epoxy intumescent fireproofing
coating, suitable for the protection of steel, aluminum and others from cellulosic and
hydrocarbon (pool and jet) fires. The composition and properties of intumescent coating are
given in Table 3-1 and Table 3-2.
Table 3-1 Intumescent coating Chartek 7 resin and hardener composition [92]. Ingredient Concentration range ( wt.% )
PART A
Epoxy resin (av.mol.wt.<700) 25 - < 50
Triphenyl phosphate 2.5 - < 10
PART B
Tetraethylenepentamine 1 - < 2.5
Table 3-2 Technical data of intumescent coating Chartek 7 [92].
Property Value Unit Tensile strength 12.8 (1850) MPa (psi) Lap shear strength 10.0 (1450) MPa (psi) Thermal conductivity at 0.123 (1.45) W/moC (Btu-in/hr ft2oF) room temperature Coefficient of thermal 68 x 10-6 cm/cmoC expansion 38 x 10-6 (in/inoF)
Moisture Absorption 3.3% non topcoated
1.4% topcoated Flame Spread 25.0 Smoke Generation 130.9 Toxicity Index 1.3 Hardness Typically 70 Shore D

35
3.1.2 Primer Coating
Primer coating Intergard 251 is one of the preferred primers coating which have completed
the primer qualification procedure from International Coatings. Intergard 251 is Zinc
Phosphate based primer coating. The composition of primer coating is presented in Table
3-3.
Table 3-3 Primer coating Intergard 251 composition [93].
Ingredient Concentration Range ( wt. % )
PART A
2-Methoxy-1-propanol <1
Bis-amine wax <1
Epoxy Resin liquid 10-25
Ethyl Benzene 2.5-10
Iron oxide 2.5-10
Propylene glycol monomethyl ether 2.5-10
Talc 10.-25
U.f. resin <1
Xylene 10-25
Zinc phosphate 2.5-10
PART B
2,4,6-
Tris(dimethylaminomethyl)phenol
2.5-10
Xylene >50
3.1.3 Steel Substrate
Carbon steel plate with thickness 15 mm was prepared according to the required standard
NACE 2-SSPC-SP 10 [94] and supplier packing list as substrate [95]. Carbon steel is
known as cheap material with various applications.
The steel substrate preparation is described on the next section. The chemical compositions
of the steel substrate are given in XRF and XRD analysis in next chapter.

36
3.2 Material Preparation
3.2.1 Steel Substrate Preparation
The first step in the sample preparation was to clean the sample surface using thinner from
grease, dirt and oil. After the surface was cleaned, sand blasting was performed using Air
Compressor Airman 370 CFM. Garnet sand with particle size 30-60 mesh and 20-40 mesh
were shot from nozzle size 3/8” for about 10 minutes to each steel surface. The steel
substrate surface roughness was achieved 50-55 um while according to NACE SSPC-SP10
[94] and Swedish standard Sa 2.5, the surface roughness is 50-75 um. Figure 3-1 shows the
result of measurement using MOHR Profilometer with testing distance 12.5mm and three
times repetition.
Figure 3-1 Surface roughness of steel substrate using profilometer.
Ra is general surface roughness. This equipment measures average surface roughness by
comparing all the peaks and valleys to the mean line, and then averaging them all over the
entire cutoff length. Rz is mean roughness depth.
3.2.2 Intumescent Coating Preparation
Mixing of correct proportion of epoxy intumescent coating and hardener was performed
according to application manual [92]. The mixtures were processed using the method
described hereinafter. The ratio by weight of part A (resin) to part B (hardener) is 2.45: 1
and 4: 1 for intumescent coating and primer coating, respectively. The resin (Part A) was
dissolved in hardener (Part B) with correct proportion, by using weighing scale. The
coatings were prepared by mixing epoxy and hardener using mixer at 600 rpms and were
applied onto steel surface of carbon steel using brush. After the homogenous mixture was
achieved, this mixture was applied onto the steel substrate surface (20 x 20 cm2). The

37
thickness of the coating was measured by automatic caliper before and after dry. A small
amount of thinner as a solvent was added to the mixture to improve the flow ability to be
applied to the steel substrate. This solvent evaporated and did not affect the coating
properties. The schematic of intumescent coated steel is presented in Figure 3-2.
Figure 3-2 Schematic of intumescent coated steel sample (all dimensions are in mm).
3.3 Physical Properties Characterization
3.3.1 Microstructure Examination
Investigation of the physical condition of the samples before and after fire test was
conducted using optical microscope and scanning electron microscope (SEM). Every
intumescent coating coated sample was cut, cold mounted, and ground using silicon carbide
paper grid 120-1200, polished with diamond suspension of 6µm and 1μm diameter and
etched with 2% Nital. The cross section sample is given at Figure 3-2. The morphology of
the interface layer of the steel substrate and the interface layer between the primer coating
and the intumescent coating were observed using Optical Microscope Nikon Eclipse ME600
and Scanning Electron Microscope (SEM) Oxford Leo 1430.
For this study, the variable durations of fire test are 30 min, 45 min, 90 min and 120 min. In
practice, people need one to two hours to evacuate to a safe place during fire accident. The
microstructure of the steel substrate after fire test will show the quality of the coatings and
also the strength of the steel.

38
3.4 Chemical Properties Measurement
3.4.1 Salt Spray Test
The chemical resistant of the coating was examined using Salt Spray test chamber according
to the required standard ASTM B117 [96]. Three types samples of the bare steel substrate,
steel substrate coated with primer coating and steel substrate coated with intumescent
coating were sprayed with 2% NaCl solution for 2 weeks. The temperature was maintained
at 36-37oC.
3.4.2 Electrochemistry Impedance Spectroscopy (EIS) Test
The corrosion resistance of the bonding interface between the coating and steel substrate is
important to be investigated. The corrosion resistance measurement was performed by
measuring the impedance of the coated sample with graphite as auxiliary electrode and
Ag/AgCl as the reference electrode. The set up was made of a Weld tester ACM machine
with an ACM Instrument analyzer. The electrolyte solution was 2% NaCl, made from 20mg
of 99.99 wt. % purity NaCl in 1 liter of water. The PH was around 6 and the temperature
was 25oC. Every sample tested was connected with copper wire and mounted with cold
mounting. The surface of the sample has to be flat and clean from dirt, oil or dust before the
test. The surface of the samples was ground using SiC paper with grid 120-800, and then it
was cleaned with water and ethanol to remove all the dirt.
The coating qualities of sample before fire test, after fire test and after three months
immersion were tested using EIS test. The adhesion bonding condition also can be
measured from the test. Three months immersion was chosen as average time allowance for
repair the structure.
3.5 Lap Shear Test
The aim of this test is to correlate the variable coating thickness to adhesive strength of the
coating to steel substrate. The test procedure was according to ASTM 3163 [97], with pre
load of 100 N, and speed of 0.05 in/min. Five samples of each thickness were tested for
more accurate data. The lap shear test sample dimension is shown in Figure 3-3.

39
Figure 3-3 The schematic of lap shear test sample dimension (all dimensions are in mm).
The thickness of intumescent coating depends with the application. In real life, Chartek 7 is
used to apply on the steel structure with 10 mm while other brands only around 1 mm to
5 mm of thickness. Therefore, in order to understand about the adhesion bonding on
intumescent coating to steel substrate, the variables of thickness were 1 mm, 2 mm, 3 mm, 4
mm, 10 mm and 22 mm.
3.6 Coating Characterization
3.6.1 Thermal Properties Characterization
3.6.1.1 Thermo Gravimetric Analysis (TGA)
The thermo gravimetric analysis of samples (approx. 10 mg) were carried out at a heating
rate of 10°C /min of gas Nitrogen with flow rate 20 ml/min over the whole range of
temperature 25°C to 800°C. The data was recorded using Pyris Player Data Analyzer.
3.6.1.2 Differential Scanning Calorimetry (DSC)
DSC thermo grams were performed using Perkin Elmer Instruments Pyris 1 to determine
the thermal history of the intumescent coating. The sample weight was about 10 mg and
encapsulated in an aluminum pan. The DSC instrument was heated from -40°C to 400°C at
a heating rate of 10°C/min under the nitrogen flow of 20 ml/min.
3.6.1.3 Fourier Transform Infrared Spectroscopy (FTIR)
The functional group of intumescent coating powder before and after fire was analyzed by
FTIR, model Perkin Elmer. The powder samples were ground and mixed with KBr to form

40
pellets and attached to FTIR instrument. Then, the spectra were analyzed using Spectrum
One data acquisition system. The FTIR spectra data were recorded in the range of 4000-300
cm-1, the number of scanning is 8.
3.6.2 Coating Composition Measurement
3.6.2.1 Energy Dispersive X-Ray (EDX) and X-Ray Fluorescence (XRF)
The combination of EDX and XRF results not only improve the accuracy of the analysis but
also the range of elements that can be detected [98]. EDX was employed to determine the
chemical composition of the intumescent, primer coating and steel substrate.
The chemical analysis was conducted using XRF testing machine, Bruker AXS, XRF S4
Pioneer. The steel sample was in the form of 40 mm circle, while the intumescent coating
and primer coating were in the form of fine powder, of 20 g each in weight. The surface of
the steel sample was cleaned using thinner and ground with SiC paper grid 800-1200.
3.7 Mechanical Properties Characterization
3.7.1 Hardness Test
The mechanical properties of intumescent coating were conducted using Shore D Scale
Durometer Hardness. Five indentations on intumescent coating sample were taken to get
accurate result. For the steel substrate, hardness test was performed using Micro hardness
Vickers tester, Leco LM 247AT. The steel surface was ground with silicon carbide paper
grid 240-1200 and polished with diamond suspension 6 μm and 1μm in order to get flat and
smooth surface. An example of the indentation is presented in Figure 3-4.
Vickers hardness is a measure of the hardness of a material, calculated from the size of an
impression produced under load by a pyramid-shaped diamond indenter. The indenter
employed in the Vickers test is a square-based pyramid whose opposite sides meet at the
apex at an angle of 136º. The diamond is pressed into the surface of the material with 300
kilogram-force, dwelling time of 15 seconds and the size of the impression is measured with
the aid of a calibrated microscope. The Vickers number (HV) is calculated using the
following formula [99]:

41
⎟⎠⎞
⎜⎝⎛= 2854.1
DFHV (3-1)
With F being the applied load (measured in kilogram-force) and D2 the area of the
indentation (measured in square millimeters). The applied load is usually specified when the
HV is cited.
Figure 3-4 The hardness indentation on steel substrate of the sample using Vickers hardness
tester, Leco LM 247AT.
3.8 Fire Test
Fire test was conducted to evaluate the penetration of fire to the steel substrate according to
standard ASTM E119 [100].The fire test is schematically presented in Figure 3-5.
Figure 3-5 a) The experimental set up the fire test, b) The center of the sample (arrow)
taken for further examination.
a) b)
7 cm 1 cm

42
The test was carried out for 30, 45, 90 and 120 minutes. The heat of the fire was set up
according to hydrocarbon fire temperature. The fire was shot from LPG Bunsen burner with
temperature of 1000oC at a distance of 7 cm from the intumescent coating surface. The steel
substrate surface was monitored every second for 300 seconds and the temperature was
measured using Hanna Thermocouple. The thermocouple was used to measure the
temperature on the sample surface, at the back of the sample and at 15 cm behind the
sample (environment).

43
CHAPTER 4
RESULTS AND DISCUSSION
4.1 Physical Properties Characterization
Physical properties of the steel substrate and the adhesion bonding of intumescent coating to
steel were analyzed under optical microscope and scanning electron microscope. These
physical properties in this section are divided into two sections, before and after fire test.
The effect of heat from burner influences coating adhesion to steel substrate. Therefore, the
time variables for fire tests from 30 minutes to 120 minutes are sufficient to investigate the
adhesion at interface between steel and intumescent coating. A good mixture of intumescent
coating is a key to have satisfying property profile of the produced material and enable the
whole process to be much more efficient.
4.1.1 Optical Micrographs Analysis Before Fire Test
The microstructure of the steel substrate and the cross section of the intumescent coated
steel are shown in Figure 4-1a and Figure 4-1b.Figure 4-1a shows that the steel substrate
contains ferrite structures with elongated grains. The evidence of this phase was further
confirmed with XRF and XRD result which indicate that the substrate is a carbon steel.
Figure 4-1 Optical micrographs, a) steel substrate, b) cross section of intumescent coated
steel. Magnification : 100x.
50 µm 50μm
b) a)
Intumescent Coating
Primer Coating
Steel Substrate

44
Figure 4-1b shows the intumescent coating formed uniform surface with the primer
indicating good wetting of the intumescent on the zinc phosphate primer surface. The
jagged interface of the steel substrate surface is the result of blasting during surface
preparation. The surface roughness aids in developing adhesive bonding between the steel
and the primer coating with interlocking effect.
A thin layer of primer was applied on the steel surface in order to enhance the adhesion
bonding between intumescent coatings to steel substrate. The successfulness of primer
coating fulfill the jagged interface on steel depends on the surface tension of primer coating
and steel substrate. Flaws and dirt would increase the surface tension on steel surface and
resulted to bad adhesion with primer coating. In order to eliminate the flaws on the jagged
steel surface, good wetting of the surface is important. Intimate contact occurs when the
adhesive spontaneously spreads over the surface. Spreading (spontaneous or not) can be
examined by contact angle measurement [101].
4.1.2 Optical Micrographs Analysis After Fire Test
The intumescent coated steel was burnt out for 30, 45, 90 and 120 minutes using LPG
burner. As seen in Figure 4-2, the structure integrity of primer coating and steel substrate
surface were well performed and these are shown by stable microstructures on the steel
substrate surface although induced heat from LPG gas. The grain size on the surface shows
that grain shape was not affected by heat and there was no phase transformation on the
surface.
Figure 4-2a shows the interface between steel substrate, primer coating and intumescent
coating after burnt for 30 minutes. The structures remained stable by showing no gap
formation after 30 minutes exposure. The steel microstructures remain the same as before
the fire test. The intumescent coating has successfully protected the steel from the heat.
Figure 4-2b shows the interface of steel, primer coating and intumescent coating and the
structures are also remained unchanged by showing no gap formation after 45 minutes fire
test. The figure shows no phase changed created for 45 minutes of fire test.

45
Figure 4-2 Microstructure of steel substrate conditioned with different fire test duration of
a) 30 min, b) 45 min, c) 90 min and d) 120 min of fire test duration. Magnification: 100x.
Figure 4-2c shows the interface of steel, primer coating and intumescent coating after 90
minutes fire test. It could maintain the structure by showing no debonding and no new phase
formed after fire test.
Figure 4-2d shows interface of steel substrate, primer coating and intumescent coating
remained stable and no gap was formed after 120 minutes of fire duration. The ferrite phase
remained stable and the grain size was slightly increased. No crack has occurred on the steel
surface after two hours of exposure time.
Referring to Figure 4-3, the effect of annealing will occur at temperature above 400oC. The
optical micrographs show that the intumescent coating and primer coating could protect the
steel substrate from softening by holding the temperature at the interface below 400oC.
50 µm 50 µm
50 µm 50 µm
a) b)
c) d)
Intumescent Coating
Primer Coating
Steel Substrate
Intumescent Coating
Primer Coating
Steel Substrate
Intumescent Coating
Primer Coating
Steel Substrate
Intumescent Coating
Primer Coating
Steel Substrate

46
Figure 4-3 Effect of annealing cold-worked carbon steel [102].
The re-crystallization temperature of pure iron is in the region of 500°C consequently the
higher temperature of 650°C brings about rapid re-crystallization of the distorted ferrite
[102]. Therefore, the optical micrographs of steel substrate after fire test were inline with
the theory.
4.1.3 Electron Micrographs Analysis Before Fire Test
Further investigation on adhesion bonding of steel substrate, intumescent coating and
carbon fiber performance before fire test are presented in Figure 4-4. The Electron
Micrographs of Figure 4-4a shows the cross section of intumescent coated steel sample. The
thickness of primer coating is 75 μm while the thickness of intumescent coating is 10 mm,
both created during experiment. This figure shows that all the elements are uniformly
bonded together.
Figure 4-4b shows good bonding between intumescent coating and primer coating. This is
achieved since both are using the same binder, epoxy based. The presence of additives will
be revealed using EDX in next section.

47
Figure 4-4c shows the small gap between the primer coating and the steel substrate and this
is due to the effect of mechanical interlocking. The primer coating viscosity and jagged
profile of the steel substrate determine the size of the gap created at the interface.
Figure 4-4 Electron micrographs for sample before fire test. a) Overall sample structures,
b) interface of intumescent coating and primer coating, c) interface of primer coating and
steel substrate, d) carbon fiber in intumescent coating.
The mechanical bonds involve solely mechanical interlocking at the steel substrate surface
and primer coating. Mechanical anchoring promoted sand blasting produces a large number
of pits and corrugations. According to tortuous surface profile, contact angle of the liquid
polymer decreases with an increase in roughness. The surface roughness alone may change
the advancing contact angle (θa) on a rough surface compared with the contact angle (θ) on
a smooth surface of identical surface chemistry. This change can be expressed by [103]:
c) d)
Intumescent Coating
Primer Coating
Steel Substrate
a) b)
Intumescent Coating
Primer Coating
Primer Coating
Steel Substrate
Intumescent Coating
Carbon fiber

48
θθ coscos fa r= eq (4-1)
Where, rf is the roughness factor which is the ratio of actual to nominal surface areas of the
solid. The roughness (r >1) will reinforce the wetting properties of the smooth substrate. If
θeq is more than 900, roughening will result in a bigger θa. This will decrease the apparent
surface tension of the solid surface, γsv. Therefore, the sand blasting treatment is very
important to achieve good mechanical bonding between steel and intumescent coating since
it created new surfaces.
Figure 4-4d shows carbon fibers were embedded in the middle of intumescent coating. The
carbon fiber formed a good bonding with intumescent coating without creating any defect
between them.
4.1.4 Electron Micrographs Analysis After Fire Test
The intumescent coating, primer coating and steel substrate integrity after fire test are
presented in Figure 4-5 to Figure 4-8, respectively.
Figure 4-5a shows the cross section of intumescent coated steel after 30 minutes of the fire
test. Comparing to sample before the fire test, the adhesion bonding on the steel surface and
the intumescent coating degraded by showing a small gap on it.
Figure 4-5b shows the interface of primer coating and intumescent coating remained stable
and no crack has occurred. The adhesion bonding was strong enough to hold the heat.
Figure 4-5c shows the gap along the steel surface and primer coating formed and this is due
to different in thermal expansion of the material and adhesion properties. According to
literature, the thermal expansion of steel is 12 x 10-6 /oC while intumescent coating has
higher value as 68 x 10-6 /oC [104]. Therefore, by increasing the temperature, the
intumescent coating would easily expand wider than the steel. The jagged surface on steel
surface locked the intumescent coating from debonding.

49
Figure 4-5d shows the carbon fiber within the intumescent coating after fire test. The TGA
result shows that the carbon fiber melting point was higher than intumescent coating.
Therefore, the carbon fiber protected the lower side intumescent coating at high
temperature.
Figure 4-5 Electron micrographs for sample after fire test for 30 minutes. a) Overall
sample structures, b) interface of intumescent coating and primer coating, c) interface of
primer coating and steel substrate, d) carbon fiber in intumescent coating.
The Electron Micrographs in Figure 4-6 show the intumescent coated steel after 45 minutes
of fire test. The big pores were formed on intumescent coating due to the escaping blowing
agent which is shown in Figure 4-6a. Figure 4-6b shows the adhesion bonding of
intumescent coating and primer coating remaining stable and still able to maintain its
integrity after the fire test for 45 minutes. No gap formed along primer and steel substrate
surface.
a) b)
c) d)
Intumescent Coating
Primer Coating
Steel Substrate
Intumescent Coating
Primer Coating
Primer Coating
Steel Substrate
Intumescent Coating
Charring
Steel Substrate
Steel Substrate

50
Figure 4-6 Electron micrographs for sample after fire test for 45 minutes. a) Overall
sample structures, b) interface of intumescent coating and primer coating, c) interface of
primer coating and steel substrate, d) charring layer.
A bigger gap formed along the interface of steel substrate and primer coating which is
shown in Figure 4-6c. The gap might be a site for oxygen or hydrogen entrapped due to the
environment between the primer coating and steel substrate. The oxygen may form FeO,
Fe2O3 or other iron oxides with steel substrate on the steel surface. In addition, the oxygen
may also cause to form some bonding between hydroxyl groups of the epoxy binder which
may causes the debonding of the coating by increasing the temperature and time. Figure
4-6d shows the creation of charring layer of intumescent coating on the surface after 45
minutes of fire test duration. The cracks in the charring layer indicated that heat at this
location place reached the melting point of intumescent coating.
a) b)
c) d)
Intumescent Coating
Primer Coating
Steel Substrate
Intumescent Coating
Primer Coating
Primer Coating
Steel Substrate
Charring
Steel Substrate

51
The intumescent coated steel condition after 90 minutes fire test is shown in Figure 4-7.
Figure 4-7a shows that the intumescent coating was able to protect the steel substrate from
changes in structure and properties after 90 minutes of fire test.
Figure 4-7 Electron micrographs for sample after fire test for 90 minutes. a) Overall
sample structures, b) interface of intumescent coating and primer coating, c) interface of
primer coating and steel substrate, d) carbon fiber and charring layer in intumescent coating.
Figure 4-7b shows that after 90 minutes of fire test, the adhesion bonding between primer
coating and steel substrate remained stable and no crack was formed along the surface.
Figure 4-7c shows the gap between primer coating and steel substrate with some amount of
primer coating embedded on steel surface. This is probably due to the lock and key
mechanism of mechanical interlocking system on steel surface and the additives that
enhance the adhesion bonding to steel substrate.
a) b)
c) d)
Intumescent Coating
Primer Coating
Steel Substrate
Intumescent Coating
Primer Coating
Primer Coating
Steel Substrate
Charring
Carbon fiber

52
Figure 4-7d shows that the heat started to destroy the carbon fiber after 90 minutes of fire
test and formed char on it. The carbon fiber reinforced the intumescent coating to maintain
its structure at high temperature.
The longest fire test duration was 120 minutes and the electron micrographs can be seen in
Figure 4-8. Figure 4-8a shows the structure remained stable with no crack formation on
steel surface. From this figure, the intumescent coating successfully protected the steel at
temperature 1000oC up to two hours.
Figure 4-8b shows the stable interface layer between intumescent coating and primer
coating by showing no crack and debonding. The primer coating degradation is shown by
small cracks in the structure of primer coating. This was probably due to the heat reaching
the melting temperature.
Figure 4-8c shows no crack was formed on steel substrate surface but a gap was formed
along the surface. The steel substrate microstructure remained stable by showing no phase
changes. The degradation of primer coating was observed by forming pores on the surface
after the two hour fire test.
Figure 4-8d shows the carbon fiber successfully degraded after two hours fire test. The
degradation of the carbon fiber was due to the heat was reaching the carbon fiber’s Tg
(glass temperature). This figure also indicates that the carbon fiber is not only a good
reinforcement but also good capacitor. The intumescent coating acted as a fire retardant
coating unless the carbon fiber is melted and the entire charring layer was formed.
The higher melting point of carbon fiber than intumescent decomposition temperature is
useful to maintain the charring structure. The thickness of the coating applied to the steel
substrate is an important parameter which limits the performance of the coating. The
intumescent coating thickness should be chosen correctly to protect the fiber from
environmental attack, minimize the residual stress, minimize the lost in strength, optimize
the toughness, and induce a none brittle failure modes [105]. Based on literature, the carbon
fiber is useful for structural application due to their high specific strength, high modulus and
near zero coefficient thermal expansion. Many composite which contain carbon fibers can

53
be used at high temperature with less degradation and a good resistance to corrosive
environment except for oxygen at high temperature [106].
Figure 4-8 Electron micrographs for sample after fire test for 120 minutes. a) Overall
sample structures, b) interface of intumescent coating and primer coating, c) interface of
primer coating and steel substrate, d) carbon fiber and charring layer in intumescent coating.
Figure 4-5 to Figure 4-8 show that the weakest region is at interface between the steel
substrate and the primer coating. As this will be evidence for the lap shear test results, the
interface strength between steel and primer coating is high since fracture happened at the
interface layer between the intumescent coating and the primer coating. This means the
adhesion strength of the steel substrate and the primer coating is primarily due to
mechanical interlocking mechanism. Surface preparation before applying the coating
becomes important part since the steel surface roughness can promote the adhesion strength
of the interface.
a) b)
c) d)
Charring
Intumescent Coating
Primer Coating
Steel Substrate
Intumescent Coating
Primer Coating
Primer Coating
Steel Substrate
Carbon fiber

54
4.1.5 Energy Dispersive X-Ray Analysis
Referring to electron micrographs at previous section, the interface between intumescent
coating and primer coating maintained stable after two hours exposed with fire. EDX was
used for further investigation on the interface between intumescent coating and primer
coating.
Figure 4-9 shows the some points on electron micrograph which refers to 1) primer coating,
2) the interface between intumescent coating and primer coating, 3) intumescent coating,
and 4) intumescent coating, before exposed to fire. The EDX analysis on every point depict
in Figure 4-10 and Figure 4-11.
Figure 4-9 Electron micrographs on interface of intumescent coating and primer coating
before fire test. Points 1-4 refer to the EDX analysis.
Figure 4-11 shows the graph of EDX result of primer coating, at the interface of primer
coating and intumescent coating. The primer coating at point analysis no 1 shows that the
coating consist of high phosphate and zinc. Some additives such as Ca, Ti and Fe were
found. These elements were added as a mixture and as fluxing agent. The interface of
primer coating and intumescent coating shows high silicon and phosphate elements.
•1
• 2
• 3
• 4

55
Figure 4-10 Energy Dispersive X-Ray analysis, 1) primer coating and 2) at the interface
between primer coating and intumescent coating before fire test.
Figure 4-11 shows the intumescent coating EDX analyses at point no 3 and 4. Both points
consist of high phosphate, titanium, calcium, silicon and other additives. The function of
phosphate content in intumescent coating is as char forming agent. A char forming agent
will promote the formation of a char when the intumescent is exposed to fire, typically by
acting as a fire retardant which controls the rate and mechanism of thermal decomposition
of the cured epoxy.
P
1)
2)
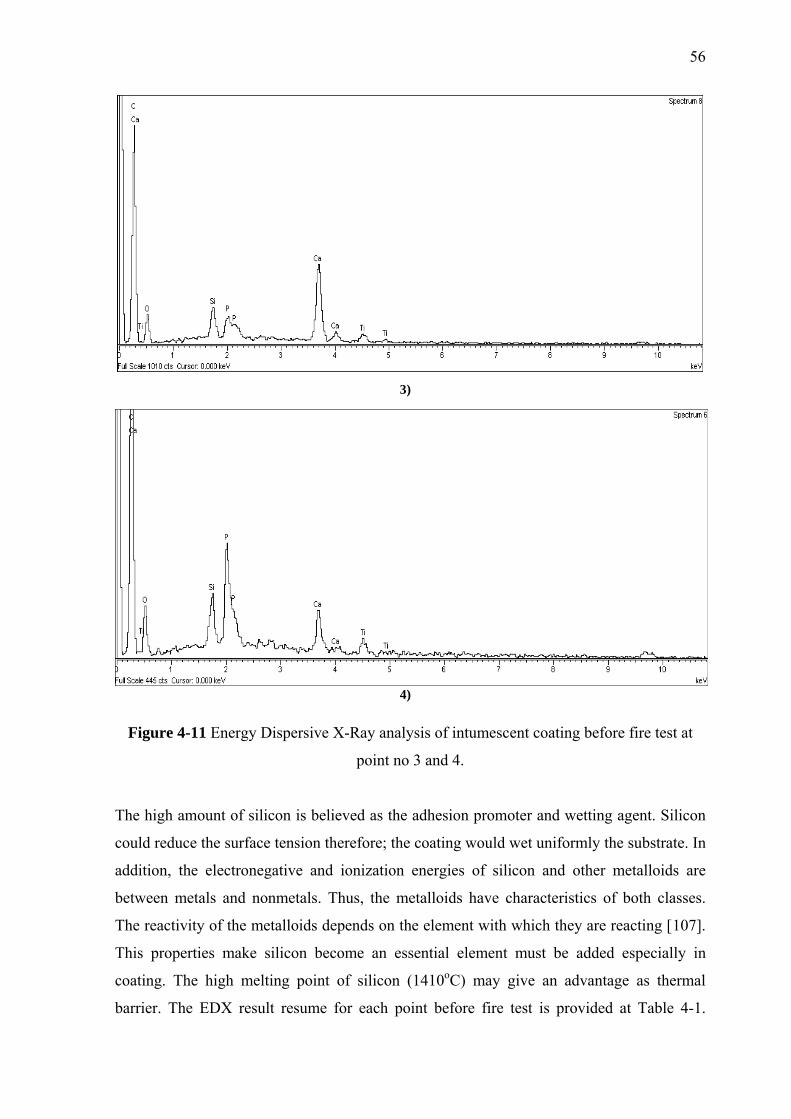
56
Figure 4-11 Energy Dispersive X-Ray analysis of intumescent coating before fire test at
point no 3 and 4.
The high amount of silicon is believed as the adhesion promoter and wetting agent. Silicon
could reduce the surface tension therefore; the coating would wet uniformly the substrate. In
addition, the electronegative and ionization energies of silicon and other metalloids are
between metals and nonmetals. Thus, the metalloids have characteristics of both classes.
The reactivity of the metalloids depends on the element with which they are reacting [107].
This properties make silicon become an essential element must be added especially in
coating. The high melting point of silicon (1410oC) may give an advantage as thermal
barrier. The EDX result resume for each point before fire test is provided at Table 4-1.
3)
4)

57
Figure 4-12 shows electron micrographs analysis of the interface between intumescent
coating and primer coating after fire test.
Table 4-1 Energy Dispersive X-Ray results for sample before fire test. Element (wt. %)
No C O Mg Si Al P Ca Fe Ti Zn
Primer Coating
1. 60.90 22.41 3.80 2.53 1.17 1.18 6.59 1.42
Intumescent Coating
2. 40.32 29.82 10.24 12.84 0.59 1.72 2.65 1.83
3. 63.36 27.20 1.67 0.96 5.47 0.84
4. 70.68 23.50 1.23 2.55 1.35 0.96
Figure 4-12 Electron micrographs on interface of intumescent coating and primer coating
after fire test. Points 1-4 refer to EDX analysis.
Figure 4-13 shows the EDX analysis result on the interface of intumescent coating and
primer coating after fire test. The EDX analysis at the interface between intumescent
coating and primer coating (point analysis no 2) indicates the silicon content might form
covalent bonding with carbon and iron. This is because silicon is metalloid element which
can bond with metal and non metal. The covalent bonding of silicon and iron has great
adhesion strength due to a mixture of metallic and multiple covalent bonds that are
responsible for the very strong adhesion at the interface. According to the literature, the
interface region has been used to refer to the region which is formed because of the bonding
• 1
• 2
• 3
• 4

58
and reaction between strengthening particulate in the intumescent coating and primer
coating. The morphological, chemical reaction and thermo-mechanical properties of the
interface are distinct from the intumescent coating and primer coating. Combination of
dissimilar material in a composite created inevitably interface region since residual stress
was generated during fabrication and in service due to the difference in thermo-mechanical
characteristic [105]. The graphs show the quantity of silicon remain high after fire test on
the interface while the oxide slightly decreased compare with the result before fire test. This
is because during fire test, some of the elements reacted with others to form char layers
while silicon remain stable due to the high melting point.
Figure 4-13 Energy Dispersive X-Ray analysis, 1) primer coating and 2) interface of
intumescent coating and primer coating after fire test.
1)
2)

59
The EDX result at Figure 4-14 shows that the intumescent coating contains high silicon and
phosphate after fire test. Point analysis no 3 and 4 indicate that intumescent coating contains
some fluxing agent, such as aluminum, iron and magnesium. According to literatures
[108,109], beside in order to enhance the adhesion bonding, fluxing agents also are added to
intumescent coating as char formation char. During char formation, these fluxing agents
react with phosphorus and silicon component forming phosporosilicate glass which expands
and foams due to gases released by thermal decomposition of the intumescent coating.
Fluxing agent includes such as metal oxide of titanium, molybdenum, calcium, iron,
aluminium, zinc and tin [110].
Figure 4-14 Energy Dispersive X-Ray analysis of intumescent coating after fire test.
3)
4)

60
Fe2O3 can stabilize the carbon backbone and increase the char residue by promoting an
early cross linking reaction of thermoset carbon chain, which indicates that it might be used
as modifiers to improve the thermal stability of intumescent coating system. The higher
composition of TiO2 and Fe2O3 among other fluxing agents in this intumescent coating
system is to enhance the formation of char layer at an elevated temperature. TiO2 also acts
as wetting agents and anti foaming agents [110].
The continuation of EDX result after fire test is presented at Table 4-2. The high amount of
silicon at point analysis no 2 (14.95 wt.%) shows that the adhesion bonding of intumescent
coating and primer coating was due to the presence of silicon. The phosphate element
indicates that phosphate is the main element for char formation during fire test. The reaction
as follows [10]:
(H3PO4.PO3)n (HPO3)n + nNH3 (4-2)
(HPO3)n + polymer Char + H3O4 (4-3)
Table 4-2 Energy Dispersive X-Ray result for sample after fire test. Element Weight (wt.%)
No C O Mg Si P Ca Ti Fe Zn
Primer Coating
1. 43.18 29.50 5.19 6.29 1.19 7.61 6.13 0.90
Intumescent Coating
2. 32.9 41.16 10.30 14.95 0.45 1.05
3. 67.67 23.48 3.00 2.51 2.19 1.16
4. 73.32 10.10 2.55 12.25 1.26 0.52
The carbon content was increased for point analysis no 3 to 4. This is probably because the
charring layer of intumescent coating was formed up to nearly the interface after 120
minutes of fire test. This indicates the intumescent reaction was continuously forming a char
layer by synergist reaction of each substance as the time went by. The degradation of primer
coating after 120 minutes of fire test indicates that heat was reached primer coating
therefore the possibility to transfer to steel substrate is higher. The heat may affect the
adhesion bonding although the adhesion bonding after fire test shows unchanged the
structure. The Electrochemistry Impedance Spectroscopy (EIS) test will investigate further
about the adhesion bonding to corrosion resistance on next section.

61
4.2 Chemical Properties Measurement
4.2.1 Salt Spray
4.2.1.1 Bare Steel Substrate
Carbon steel is such technologically important substrates where there were many studies
carried out on the adhesion to it of organic system, predominantly in the form of coating.
The limitation of carbon steel is the production of copious amount of corrosion product in
an aqueous environment. The surface was ground and cleaned with ethanol before
conducting the test which is shown in Figure 4-15a. Figure 4-15b shows that oxide fully
covered the surface of steel substrate after salt spray test with 2% NaCl concentration for
two weeks. A simplified view of what happens when a piece of iron corrodes is summarized
below [111]:
4 Fe 4Fe2+ + 8e- (anodic reaction) (4-4)
Water and oxygen are also needed for corrosion:
4H2O + 8e- + 2O2 8(OH)- (anodic reaction) (4-5)
After overall corrosion of the iron is thus a combination of (4-4) and (4-5):
4Fe + 4H2O +2O2 4Fe(OH)2 (anodic reaction) (4-6)
The iron hydroxide reacts further with air to form hydrated ferric oxide – rust:
4Fe(OH)2+O2 2Fe2O3+2H2O (anodic reaction) (4-7)
Figure 4-15 Steel substrate was sprayed with 2% NaCl, a) before salt spray test, b) after salt
spray.
1 cm 1 cm
a) b)

62
The copious corrosion product on steel substrate shows that low carbon steel has poor
corrosion resistance. The actual mechanism in the corrosion of iron and steel is extremely
complex and embraces the fields of chemistry and electrochemistry. Iron will corrode only
in the presence of both water and oxygen.
4.2.1.2 Primer Coating Coated Steel Substrate
Figure 4-16 shows the macrographs of steel substrate coated with zinc phosphate as primer
coating. Figure 4-16a shows the zinc phosphate primer coating that was applied to the steel
substrate surface as corrosion resistant coating and also as an adhesion promoter. The side
along the sample is uncoated. According to Figure 4-16b, the corrosion product was formed
starting from the uncoated side. It indicates that the steel still can be corroded unless the
primer coating uniformly covered the surface and no defect on the coating.
Figure 4-16 Steel substrate coated with zinc phosphate primer coating, a) before salt spray
test, b) after salt spray.
4.2.2 Steel Substrate Coated with Intumescent Coating
Figure 4-17 shows the samples of intumescent coated steel before and after salt spray. The
intumescent coating was applied on the surface of primer coating and steel substrate. The
epoxy based intumescent coating is known to have excellent corrosion properties since
epoxy has hard and durable structure.
Figure 4-17a shows the surface of intumescent coating was uniform and no defect on the
surface. The sodium chloride was sprayed to the sample and the result is shown in Figure
1 cm 1 cm
a) b)

63
4-17b. The figure shows that there is no corrosion product was produced on the surface after
the exposure to salt spray. This is because the electron can not easily transfer to the coating
structure due to the crosslink structure of epoxy.
Figure 4-17 Steel substrate coated with intumescent coating, a) before salt spray b) after
salt spray.
4.2.3 Electrochemistry Impedance Spectroscopy (EIS)
The effect of the duration of fire test to adhesion bonding between steel substrate and
intumescent coated steel was revealed by EIS test. Measurements were performed in the
EIS mode in the 0.5 Hz to 100 kHz frequency range. The Nyquist graphs are shown Figure
4-18 and Figure 4-19. The summary of Polarization Resistance and Rest Potential are given
in Table 4-3.
4.2.3.1 After fire test
Figure 4-18 shows Nyquist graph of intumescent coated steel before and after fire test.
According to the theory, coating impedance higher than 10 7 Ω.cm2 indicates the coating has
excellent corrosion resistance while coating impedance between 5x10⁵ to 106 Ω.cm2
indicates the area of steel to be corroded is increased to 0.3% to 1 % [112]. The coating
impedance before fire test is 43.7x 10⁷ Ω.cm2. After fire test, the impedance was reduced to
32.3 x 10⁷ Ω.cm2 , 20.4 x 10⁷ Ω.cm2, 17.1 x 10⁷ Ω.cm2, 15.2 x 10⁷ Ω.cm2 for 30, 45, 90 and
120 minutes of fire test duration. However, the coating was still able to maintain the
corrosion resistance up to two hours exposure to fire test. The degradation most probably
1 cm 1 cm
a) b)

64
happen because a thicker char was formed by increasing the time, hence the cross linking
structure of epoxy was broken, thus water easily penetrated to the steel substrate.
050
100150200250300350400450500
0 100 200 300 400 500 600 700
Mill
ions
Millions
Z'
Z" (o
hm.c
m²)
0 Min 30 Min 45 Min 90 Min 120 Min
Z' (ohm.cm²)
Figure 4-18 Nyquist plot of intumescent coated steel sample before and after exposure for
30 to 120 minutes of fire test.
4.2.3.2 After three months immersion in sodium chloride
The Nyquist plot in Figure 4-19 shows that the coating impedance is dramatically decreased
to 1.43 x 10⁷ Ω.cm2, 1.03 x 10⁷ Ω.cm2, 9.55 x 10⁶ Ω.cm2,, 8.94 x 10⁷ Ω.cm2, 4.52 x 10⁶
Ω.cm2 after three months immersion in sodium chloride for sample before fire and after fire
test for 30, 45, 90 and 120 minutes. Obviously, the chemical properties of intumescent
coating, primer coating and steel substrate gradually degraded and lost the corrosion
resistance after applying the heat on the coating surface. The EIS results in Figure 4-19
reveal that the higher quantity of water uptake in intumescent coating and primer coating
will reduce the impedance of the coating and result in reduction quality of the coating. The
significant reduction of impedance after immersion is believed that the corrosion occurred
on the steel during immersion.

65
02468
10121416
0 10 20 30 40 50 60
Mill
ions
MillionsZ' (ohm.cm²)
Z" (o
hm.c
m²)
0 Min 30 Min 45 Min 90 Min 120 Min
Figure 4-19 Nyquist plot of intumescent coating resistance of before and after fired samples
for three months immersion in 2% NaCl.
Table 4-3 shows the polarization resistance (corrosion rate) and rest potential of the
samples. The reduction of polarization resistance and rest potential indicates the resistance
of steel substrate to be corroded is increased. The primer coating was getting weaker to
protect steel from corrosion by increasing the fire test duration and also immersion in
electrolyte solution.
Table 4-3 Coating degradation observation through Rp and Rest Potential.
RP (Ω.cm2) Rest Potential (mV) Duration After Fire Test After Immersion
0 4.37E+08 1.43E+07 574.27 -225.28 30 3.23E+08 1.03E+07 328.42 -217.06 45 2.04E+08 9.55E+06 220.03 -305.01 90 1.71E+08 8.94E+06 168.97 -352.62 120 1.45E+08 7.92E+06 66.232 -465.22
The decreasing of coating resistance also shows that the electrolyte solution was contacted
with the steel and corrosion is initiated. The SEM micrograph on interface of primer coating
and steel shows a narrow gap was created and also the degradation of primer steel occurred
along the time. This gap could be a corrosion site since corrosion will only happen by the
presence of oxygen and water.

66
4.2.4 Electron Micrographs of EIS Sample
Figure 4-20 shows the electron micrographs of two hours exposure with fire test before and
after three months immersion sample in sodium chloride. Figure 4-20a shows the surface
degradation of intumescent coating and primer coating after fire test might be the reason of
the decreasing of the coating performance. The arrows indicate the coating structure has
failed even before immersion in electrolyte solution.
Figure 4-20 Electron micrographs of intumescent coated sample, a) before immersion and
b) after 3 months immersion in 2% NaCl.
The evidence of crack of the coating and the corrosion occurred after three months
immersion in sodium chloride is shown Figure 4-20b. The dramatic decrease of impedance
is due to the primer coating failed to protect the steel by letting the steel surface to be
corroded. This figure also shows that the jagged surface could be a high risk location for
pitting corrosion. The three months immersion in sodium chloride prove that water uptake
could break down the adhesion bonding between intumescent coating, primer coating and
steel substrate. The resistance of the coating changes during exposure due to the penetration
of electrolyte into the micro pores of the coating.
4.3 Lap Shear Test
In this study, the adhesion strength of steel substrate to epoxy coating was studied. Figure
4-21 shows the fracture mode with different thickness. The mode of fracture depends with
a) b)
Primer Coating
Steel Subtrate
Primer Coating
Steel Subtrate

67
the thickness of the intumescent coating. The sample with thicker coating will fracture on
the interface with steel substrate while the thinner coatings fracture mode is in the middle.
Figure 4-21 Lap shear test sample, a) 1 mm thickness and b)10 mm thickness.
Traditionally, stress redistribution is achieved by optimizing the interfacial strength so that
partial debonding occurs [113]. The stress is transferred by shear at the interface due to the
differences in the modules of the fibers and resin. Thus, by increasing the thickness of the
coating, the stress distribution on the surface also increases.
Figure 4-22 shows that primer coating is used as adhesion promoter to intumescent coating.
The thin layer of intumescent coating on primer coating surface also showed that this
coating successfully spread to the primer coating surface and the mechanism is cohesive
bonding.
Figure 4-22 Primer coating respond as adhesion promoter to intumescent coating.
Figure 4-23 shows that the lap shear strength is inversely proportional to the intumescent
thickness on steel substrate. The shear strength continuously decreased and achieved 0.13
MPa for 22mm intumescent coating thickness. The maximum lap shear strength for this
coating is 1.95 MPa.
a) b)
Steel Primer coating
intumescent
5 mm 5 mm
10 mm

68
0.130.23
1.151.25
1.801.95
0.0
0.5
1.0
1.5
2.0
2.5
1 2 3 4 10 22
Coating Thickness (mm)
Stre
ss (M
Pa)
Figure 4-23 Lap shear test result of six different intumescent coating thickness.
The lower lap shear strength compared to standard (10 MPa) is due to the lower adhesion
bonding strength between the epoxy and fillers in intumescent coating. In addition, the
porous morphology on the intumescent coating also reduced the strength. The cohesive
fracture indicates that the bonding between the coatings to steel substrate is strong.
Figure 4-24 shows the tortuous surface on steel substrate and adhesion interaction between
the coatings to steel substrate. Lap Shear determines the shear strength of adhesives for
bonding materials. The strength of adhesive bonds depends on the conditions under which
the adhesion bonding process is carried out. Therefore, variations in this process lead to
variations in the accuracy of the results acquired from strength tests of these adhesion
bonds. The important properties of a protective coating are wear resistance (high hardness),
high-temperature robustness (high melting point), corrosion resistance (formation of a
protective oxide scale), and strong adhesion to the substrate being protected [114].
Figure 4-24 The adhesion interaction pulls the epoxy coating into complete contact with the
rough steel substrate surface.
Epoxy coating
Steel substrate

69
The bonding between the coating and the steel substrate metal is mainly determined by
mechanical interaction and welding of coating particles with the metal [114]. The tortuous
surface on steel substrate is to enhance the adhesion strength with polymer. Figure 4-24
shows that the polymer completely fills the pores on the surface of the substrate. At these
pores, the exit of the polymer is partially blocked by part of the steel substrate. This place in
the interface will exhibit a so-called lock and key effect. A key, when turned into the
tumblers of a lock, can not be removed from the lock because of the physical impediment
provided by the tumblers. In the same way, a solid adhesive in a pore can not move pass the
locking of the pore without physically deforming. Plastic deformation acts as an energy
absorbing mechanism and the strength of the adhesive bond appears to increase [115].
The intrinsic work of adhesion or cohesion is independent of the shear rate, peel angel,
thickness of the adhesive and thickness of the steel substrate [116].
4.4 Coating Characterization
4.4.1 Thermal Properties Measurement
The thermal properties of intumescent coating, primer coating and carbon fiber are
important to identify their act at high temperature and its effect to adhesion bonding to steel
substrate. The formation of the charring layer and the heat insulation of intumescent coating
to steel depends with these properties.
4.4.1.1 Thermo Gravimetric Analysis (TGA)
The TGA curves of intumescent coating, primer coating and carbon fiber are presented in
Figure 4-25.
From the TG curves in Figure 4-25, it can be seen that the weight loss of the intumescent
coating is 5 wt. % at the beginning of the experiment within 20oC to 160oC. The small
decomposition at this stage is due to softening epoxy and solvent vaporization. The
softening stage is crucial since intumesce reaction will occur after this stage. The softening
temperature is determined by cross link reaction of epoxy with hardener. This reaction will
affect the mechanical, physical and chemical properties of the intumescent coating.
Therefore, the physical significance of the glass transition for epoxies is at temperatures

70
above the Tg. The values of the physical properties such us tensile strength, lap shear and
adhesive bonding strength are substantially reduce. The coefficient of thermal expansion on
the other hand greatly increases.
0
20
40
60
80
100
120
0 100 200 300 400 500 600 700 800 900 1000
Temperature (°C)
Wei
ght L
oss (
wt.%
)
Intumescent Coating Primer Coating Fiber Carbon
Figure 4-25 The thermal degradation of intumescent coating, primer coating and carbon
fiber by using Thermo Gravimetric Analyzer with range temperature 30oC to 850oC.
The next stage of the experiment (150–500 °C) is the key weight loss region that the coating
begins to decompose largely, the weight loss is 55 wt. %. The biggest lost is due to the
reaction of some ingredients to form char layer within the temperature. At this stage, the
intumescent coating started to release the acid source (Triphenyl Phosphate (TPP)), carbon
source (char forming) and blowing agent to form charring layer. The acid source
decomposed upon thermal exposure to release an expansion gas such as nitrogen, carbon
dioxide or water vapor, thereby expanding the car to increase the char thickness. This gas
should be released before the charring layer is formed otherwise the coating could not
insulate the steel.
In the later stages of experiment, the weight loss of the intumescent coating is 18 wt. % at
temperature 470oC to 800oC. At this stage, it can be seen that charring layer formation
consumed approximately 60 wt. % of the intumescent coating and gradually decreased by
increasing the temperature.
17 wt. %50 wt. %55 wt. %

71
According to Jun Wei et. al [117], the coating melts at the second stage, when the acid
source decomposes to release NH3, H2O and phosphoric acid thermally degrades, dehydrates
to release poly-metaphosphoric acid and pyrophosphoric acid, moreover reacts with
pentaerythritol and other organic materials which contains hydroxyl groups, dehydrates, to
form the charring framework. At the same time, the ammonia gas begins to release NH3 gas
when the temperature is over 296 °C. The NH3 gas blows the charring layer to form a
compact, firm and multiple charring layers.
Jun Wei et. al and Duquesne et. al [118,119] also stated that the opposite high temperature
and high pressure air current occasion on the surface resulted the carbon in the charring
layer is oxygenized to CO2 by O2. The weight loss under 370°C is due to the decomposing
blowing agent and NH3 releasing. The ammonia released by blowing agent can dilute the
oxygenous concentration, blow the charring layer and form intumescent, microporosite
foam charring layer. Some charring layer is off by gas because of the weak strength of
adhesion on the structure. Some inorganic framework maintains at last, the most important
components of the rudimental are the matter of inorganic phosphate. The released inorganic
elements release will also be confirmed by FTIR in next section.
The glass transition of primer coating can be seen in Figure 4-25. This figure shows that the
primer coating started to decompose at around 120oC-250oC. The small decomposition is
due to epoxy softening and it is confirmed that the binder is epoxy, same with the
intumescent coating. This will enhance the adhesion bonding between two coatings since
they have same chemical structure. The primer coating decomposed larger from 250oC to
600oC and continuously degradable by increasing the temperature. The higher glass
transition than intumescent coating is probably because of the additives inside the primer
coating which is able to resist at high temperature. The benefit for adhesion is at high
temperature when the intumescent coating already melted, the primer coating is still able to
absorb the heat for some time thus protect the steel from overheating and weakening.
From Figure 4-25 also, the decomposed temperature of carbon fiber is the highest among
intumescent coating and primer coating. The carbon fiber started to decompose from 400oC
and above. This evidence shows that carbon fiber acts as reinforcement and strengthens the
char and up until it reached the glass transition temperature. The carbon fiber weight loss is

72
also very small, 17 wt. %. The use of carbon fiber aside from strengthening the char proved
cost effective since the residue is relatively small.
4.4.1.2 Differential Scanning Calorimetry (DSC)
The DSC curve of intumescent coating is presented in Figure 4-26. The endothermic
reactions can not occur spontaneously but it needs energy. Some works must be done in
order to get the endothermic reactions to occur. The endothermic reaction occurs when the
energy is absorbed. Thus, a temperature drop is measured during the reaction.
0
10
20
30
40
50
60
70
80
90
0 50 100 150 200 250 300 350
Temperature (°C)
Hea
t Flo
w E
ndo
Up
(mW
Figure 4-26 Thermal decomposition of Intumescent coating analysis using DSC.
The elimination of water and heat absorption of epoxy binder of intumescent coating
required energy 47 mW and it occurred at 162oC. The softening of epoxy binder started
from this temperature. The softening of epoxy is important as a starting point to perform a
synergist reaction between the acid source, carbon source and gas source. Only a small
quantity of reaction mixtures transforms into solid foam charring layer at high temperature.
However, the majority loses is in the forming of gas products. The lack of matrix materials
influences the flame-retardant performance and the matrix plays a very important role in the
course of charring foam. The release of pyrolysis gases such as H2O, NH3, CO2 and
hydrocarbons are essential factor to create effective production of large amount of multi
162oC
73
cellular charring layer during combustion [117]. With the increase of temperature, water of
crystallization and epoxy resin in the intumescent coating are gradually decomposed and
eliminated, and the dehydration can form steam and absorb heat from the system. The heat
can not be freely released from the system due to high viscosity of the epoxy resin matrix,
so the melted matrix triggered by the heat can form a porous structure.
The DSC curves are continuously rising and no major peaks were observed below 350oC for
primer coating and carbon fiber. The several minor endothermic peaks that are observed are
irregular. It indicates that the melting point of primer coating and carbon fiber are above
350oC. The TGA result of primer coating and carbon fiber confirm that both materials have
higher temperature to degrade than intumescent coating.
4.4.1.3 Fourier Transform Infrared Spectroscopy (FTIR)
The organic and inorganic substance in intumescent coating can be observed using FTIR
spectra. Figure 4-27 shows the char residue contains fewer group of organic substances and
inorganic simple substances than that of the intumescent coating.
From Figure 4-27 and Table 4-4, the FTIR spectra present the elongation of some bands.
The strong characteristic vibration peak at 3217.04 cm−1 (O-H) implies the fire retardant has
good system since the epoxy functional group remain stable after fire test.
The bands near 2200 cm−1 can be assigned to the characteristic vibration peaks of nitriles
groups (C=N). This is an evidence of the presence of nitrogen gas as the blowing agent of
the intumescent coating. The stretching vibration peaks of the P–O–C band from 1000 cm−1
to 1200 cm−1 and P=O band from 900 cm−1 to 1050 cm−1 can keep shifting to lower
frequency sharply, respectively.
According to Jun Wei et.al [117], phosphides make some organic materials drastic degrade
irregularly, reduce flammable gas, and make the high-carbon compounds dehydrate, char to
form compact charring-layer structure by bridging reactions in the heat degradation in the
solid phase.

74
10
17.5
25
32.5
40
47.5
55
62.5
70
400900140019002400290034003900
Wavelength (cm-1)
% T
rans
mita
nce
Intumescent Coating Char
3217.04
2354.92
1423.37 1193.85
794.62
Figure 4-27 FTIR results of functional group structural changes of
intumescent coating and char.
Table 4-4 The FTIR analysis of intumescent coating and char [120].
Functional
Class
Wave Length
(cm-1) Assignment
Intumescent
Coating wave
length (cm-1)
Char
wavelength
(cm-1)
Alcohol and
Phenols 3200-3550 O-H (H-Bonded) 3218.97 3217.04
Nitriles 2240-2260 C=N (sharp) 2374.21 2354.92
Ketone 1690 R-CO-R 1689.53 -
Alkena 1350-1470 CH2 &CH3
Sulfate (str) 1350-1450 S=O 1446.51 1423.37
Phospsonate 1230-1260 P=O
Phosphoramide 1200-1275 P=O
Silicon function 1250±10 Si-CH3
Amine Oxide
aromatic 1250±50 N-H
1245.93 -
Phosphate 1100-1200 P=O 1193.85 1193.85
Esters 900-1050 P-OR 923.84 -
Alkena 880-995 C-H & =CH2 883.34 -
Alkena 780-850 C-H & =CH2 794.62 794.62
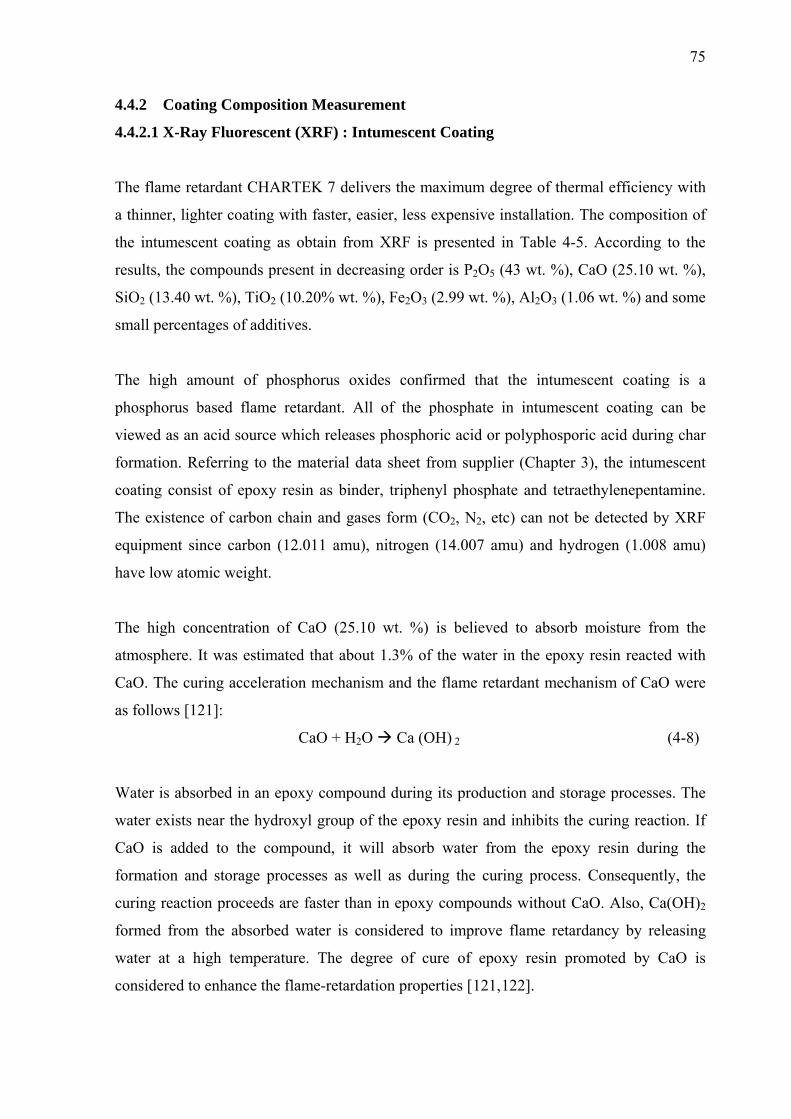
75
4.4.2 Coating Composition Measurement
4.4.2.1 X-Ray Fluorescent (XRF) : Intumescent Coating
The flame retardant CHARTEK 7 delivers the maximum degree of thermal efficiency with
a thinner, lighter coating with faster, easier, less expensive installation. The composition of
the intumescent coating as obtain from XRF is presented in Table 4-5. According to the
results, the compounds present in decreasing order is P2O5 (43 wt. %), CaO (25.10 wt. %),
SiO2 (13.40 wt. %), TiO2 (10.20% wt. %), Fe2O3 (2.99 wt. %), Al2O3 (1.06 wt. %) and some
small percentages of additives.
The high amount of phosphorus oxides confirmed that the intumescent coating is a
phosphorus based flame retardant. All of the phosphate in intumescent coating can be
viewed as an acid source which releases phosphoric acid or polyphosporic acid during char
formation. Referring to the material data sheet from supplier (Chapter 3), the intumescent
coating consist of epoxy resin as binder, triphenyl phosphate and tetraethylenepentamine.
The existence of carbon chain and gases form (CO2, N2, etc) can not be detected by XRF
equipment since carbon (12.011 amu), nitrogen (14.007 amu) and hydrogen (1.008 amu)
have low atomic weight.
The high concentration of CaO (25.10 wt. %) is believed to absorb moisture from the
atmosphere. It was estimated that about 1.3% of the water in the epoxy resin reacted with
CaO. The curing acceleration mechanism and the flame retardant mechanism of CaO were
as follows [121]:
CaO + H2O Ca (OH) 2 (4-8)
Water is absorbed in an epoxy compound during its production and storage processes. The
water exists near the hydroxyl group of the epoxy resin and inhibits the curing reaction. If
CaO is added to the compound, it will absorb water from the epoxy resin during the
formation and storage processes as well as during the curing process. Consequently, the
curing reaction proceeds are faster than in epoxy compounds without CaO. Also, Ca(OH)2
formed from the absorbed water is considered to improve flame retardancy by releasing
water at a high temperature. The degree of cure of epoxy resin promoted by CaO is
considered to enhance the flame-retardation properties [121,122].

76
Table 4-5 Intumescent coating composition by using XRF
Compound wt.% Al2O3 1.06% SiO2 13.40% P2O5 43.00% Cl 0.72%
K2O 1.22% CaO 25.10% TiO2 10.20% Cr2O3 0.17% MnO 0.13% Fe2O3 2.99% CuO 0.68% ZnO 0.14%
others 1.20% Total 100.00%
Silicon dioxide, SiO2 is an amorphous mineral fiber that acts as fiber and filler in
intumescent coating system and has superior property as impact resistance improver. SiO2
used to strengthen the char formed from intumescent coating at an elevated temperature,
forms phosphorosilicates glass within the char which improves the insulation of the coated
steel substrate and the durability of the char, SiO2 could also be used to improve anti aging
[123 ,124]. It is believed that mix of SiO2 and Al2O3 will partly forms a compound oxide
and partly forms particles having a multi-phase structure composed of a silicon dioxide
phase and an aluminum oxide phase (mullite). Mullite (3Al2O3-SiO2) is an excellent
structural material due to its high temperature stability, strength and creep resistance. It has
a low dielectric constant and high electrical insulation capabilities [125,126]. These
properties will increase the corrosion resistance of the coating due to hard and high thermal
stability.
The chlorine element was found in this intumescent coating with 0.72 wt. %. It might come
from acid source that was used in this study. Organoclorine flame retardant emits hydrogen
halide (HX) gas during their decomposition. This interferes with the flame reactions by
promoting scavenging of the high energy H+ and OH- chain branching radicals [127]:
H+ + HX H2 +H- (4-9)
OH- + HX H2O + X- (4-10)

77
These reactions compete with those occurring in the absence of halogen. The halogen atom
produced is a low energy radical which is incapable of propagating the oxidation process.
This reduces the rate of heat transfer back to polymer, which decrease the burning rate and
leads to extinction of the flame [127]. The disadvantage of halogen containing system is
releasing more smoke than the untreated polymer formulations, a part of which is corrosive
hydrogen halide. The function of chlorine element in this intumescent coating is to release
Cl- radical to the environment and produces water, thus it will slow down the thermal
degradation of intumescent coating. The corrosion resistance of the coating will be affected
by hydrogen chlorine amount during charring formation.
The current researches indicate no significant connection between chronic exposure to low
concentrations of chlorine and adverse health effects. Finnish [128] showed an increase in
chronic coughs and a tendency for hyper-secretion of mucous among workers. However,
these workers showed normal pulmonary function in tests or chest X- Rays. One of the most
comprehensive studies, involving 300 chlorine plant workers chronically exposed to 0.006
to 1.42 ppm, showed no statistically significant increase in abnormal chest X-Rays,
electrocardiograms, or pulmonary function tests. Other studies of workers in the chlor-alkali
industry have resulted in similar observations. No significant effects have been indicated for
chlorine levels normally found in work places where chlorine is handled. Those levels
typically are well below one ppm. As for the air breathed by the general population,
chlorine levels in ambient air are so low that they are either can not measured or no
toxicological importance [128].
4.4.2.2 X-Ray Fluorescent (XRF): Primer Coating
The use of primer coating is to promote adhesion and fill in voids in the substrate that can
help to improve quality. The major composition for this primer coating is ZnO (22 wt. %),
Fe2O3 (25.90 wt. %), SiO2 (20.10 wt. %), CaO (19.2 wt. %) and P2O5 (2.98 wt.%). The
composition test result is presented in Table 4-6.
According to material data sheet from the supplier, this primer coating is zinc phosphate
epoxy based. Zinc phosphate which is used with epoxy resin binders has provided excellent
adhesion to steel substrate. All extenders and pigments, in addition to the active
anticorrosive ones, have a role to play in the formulations improvement. For example,

78
lamellar extenders are used to provide a barrier to the moisture permeation, so increasing
corrosion protection [129]. Silicon oxide has been used in coatings for many years, in
various applications. Silicon oxide in water-based coatings improves corrosion protection
and reduces cracking and pigment sedimentation. Other pigments employed were titanium
dioxide, barium sulphate and talc [130].
Table 4-6 Zinc phosphate primer coating composition by using XRF.
The pigment material in the formulation which colors the formulation and provides it with
corrosion inhibiting properties is zinc chromate and strontium chromate. The extender
material which is filler that provides some tooth for adhesion for subsequent topcoat
application is a natural fibrous magnesium silicate or a porous low micron particle size
silica-magnesium oxide material. The results in the above table shows this coating contains
of high percentage of SiO2 (20.10 wt. %), CaO (19.2 wt. %), MgO (8.35 wt. %), Fe2O3
(25.90 wt. %) and small amount of P2O5 (2.98 wt. %). The presence of these elements are
also believed as fire retardant additives in primer coating. Thus, for certain duration, primer
coating still can stand up from softening of steel substrate.
4.4.3 Mechanical Properties
The hardness of intumescent coating is presented in Table 4-7. The hardness of the
intumescent coating was measured by using Shore D hardness test which refer to ASTM D
Compound wt.% MgO 8.35%Al2O3 0.28%SiO2 20.10%P2O5 2.98%Cl 0.04%K2O 0.04%CaO 19.20%Cr2O3 0.05%MnO 0.04%Fe2O3 25.90%CuO 0.07%ZnO 22%Br 0.29%SrO 0.06%Others 1%Total 100.00%

79
2240-03. The hardness result test was taken for 7 different locations on the intumescent
coating surface. The result shows that the coating hardness was 71 Shore D while compared
to the data from supplier; the hardness was 70 Shore D [92].
Table 4-7 Hardness of intumescent coating (Shore D).
Indentation Shore D
1 70
2 70
3 75
4 70
5 75
6 70
7 70
Average 71
stdev 2.44
Therefore, the coating that was used in this study had same property with the standard. The
high hardness of polymer does not guarantee that the others properties are also good, since
in polymer, there are some additives added which will influence the properties.
4.5 Steel Substrate Characterization
4.5.1 Hardness of Steel Substrate
The data of hardness test is presented at Table 4-8 and the graph is showed at Figure 4-28.
Referring optical and SEM micrograph, the strength of steel substrate remained stable by
showing no new phase and re-crystallization formation during fire test up to two hours. The
hardness test result for sample before fire test, after 30 min, 45 min, 90 min and 120 min of
fire test show that the hardness are gradually increased.
The critical core temperature of steel substrate depends with carbon concentration in the
material. It is known that small heat on the steel surface will have effect to its properties.
The optical and electron micrographs confirm that the intumescent coating was able to
protect steel from weakening for up to two hours of firing.

80
Table 4-8 Hardness of steel substrate before and after fire test.
Fire Test Duration No 0 min 30 min 45 min 90 min 120 min
1 114.8 123.3 132.5 143.3 167.4 2 110 124.2 124.7 140.8 169.1 3 111.9 129.6 131.7 134.9 164.5 4 111.6 125.7 128.7 136.6 165.5
5 113 129.4 124.9 137.5 163.5
Average Hardness
(HV) 112.26 126.44 128.5 138.62 166
Standard Deviation 1.78 2.92 3.66 3.38 2.25
The increased hardness on steel substrate has a correlation with the time limit for heat to
reach the steel. If the temperature is continuous across the coating, therefore the velocity
and thermal conductivity will also do the same. The frontal model was derived to assist
understanding of intumescent reaction mechanism [13].
112126 129 139
166
0
60
120
180
0 min 30 min 45 min 90 min 120 min
Fire Test Duration
Har
dnes
s Val
ue (H
V)
Figure 4-28 Graph of hardness measurement of steel substrate for 0, 30, 45, 90 and 120 min
of fire test.

81
According to this theory, it is obviously seen that the interface between steel and coating
can be destroyed if the heat reach the substrate. The heat transfer to the substrate is limited
by the temperature gradient between front and substrate. The surface hardening could
happen easily if the heat temperature reaches 450oC which is in the austenite phase.
The increase hardness of steel substrate in this experiment might be achieved due to
normalizing heat treatment on the surface substrate. Normalizing is a process whereby iron
base alloys are heated to approximately 100°F (56°C) above the upper critical temperature,
followed by cooling to room temperature in still air. According to the result, the steel
substrate hardness was still within the range of carbon steel hardness, 120 - 164 HV [131].
Therefore the use of coating will protect the steel from weakening and extremely useful to
safe money.
4.5.2 Chemical Properties Measurement of Steel Substrate
4.5.2.1 Energy Dispersive X-Ray (EDX)
Figure 4-29 shows the chemical composition of steel substrate using EDX. According to
this figure, the steel that was used in this study contained Fe and C. This graph supports the
microstructure of steel substrate that shows ferrite structure. The chemical compositions of
other element were analyzed using XRF.
Figure 4-29 Energy Dispersive X-Ray analysis of steel substrate.
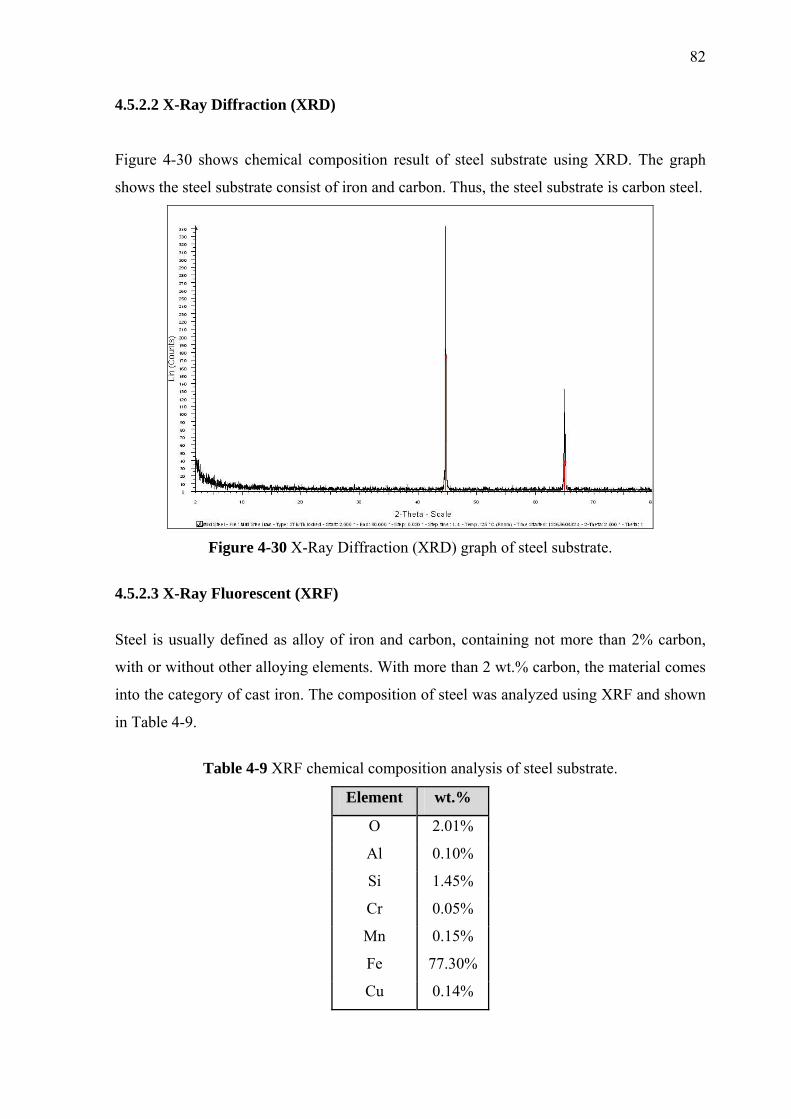
82
4.5.2.2 X-Ray Diffraction (XRD)
Figure 4-30 shows chemical composition result of steel substrate using XRD. The graph
shows the steel substrate consist of iron and carbon. Thus, the steel substrate is carbon steel.
Figure 4-30 X-Ray Diffraction (XRD) graph of steel substrate.
4.5.2.3 X-Ray Fluorescent (XRF)
Steel is usually defined as alloy of iron and carbon, containing not more than 2% carbon,
with or without other alloying elements. With more than 2 wt.% carbon, the material comes
into the category of cast iron. The composition of steel was analyzed using XRF and shown
in Table 4-9.
Table 4-9 XRF chemical composition analysis of steel substrate.
Element wt.%
O 2.01%
Al 0.10%
Si 1.45%
Cr 0.05%
Mn 0.15%
Fe 77.30%
Cu 0.14%

83
This table shows that the steel composition major elements are iron with small percentage
of Si, Mn, and Cu. Residual elements such as chromium, aluminium and copper, which are
unavoidably retained from raw materials, may present in small quantities, in addition to
impurities such as oxides. In addition, the presence of these elements will improve the
properties of the steel. Comparing to the MATWEB material database [131], the substrate
that was used for this experiment is low carbon steel.
4.6 Fire Test
The summary of temperature of fire, back steel and environment are given in
Table 4-10.
Table 4-10 Fire test of uncoated steel for 60 minutes duration.
Temperature (oC) Time (min)
Flame Back of Steel Substrate Environment
5 887 221 20
10 892 228 21.8
15 912 245 21.5
20 915 278 21.5
25 930 372 22.7
30 940 390 24.3
35 974 408 25
40 940 416 25.3
45 1006 420 25.9
50 1004 424 25
55 1004 424 25.8
60 1005 420 25.3 Average
Temperature (o C) 950.75 353.83 23.68
Fire Spread (oC/min) 15.85 5.90 0.39
Temperature Reduction 62.78%
Five plates were evaluated: uncoated steel, intumescent coated steel for fire test duration 30,
45, 90 and 120 min. The surface of the sample was burnt with LPG gas butane for 30 min,
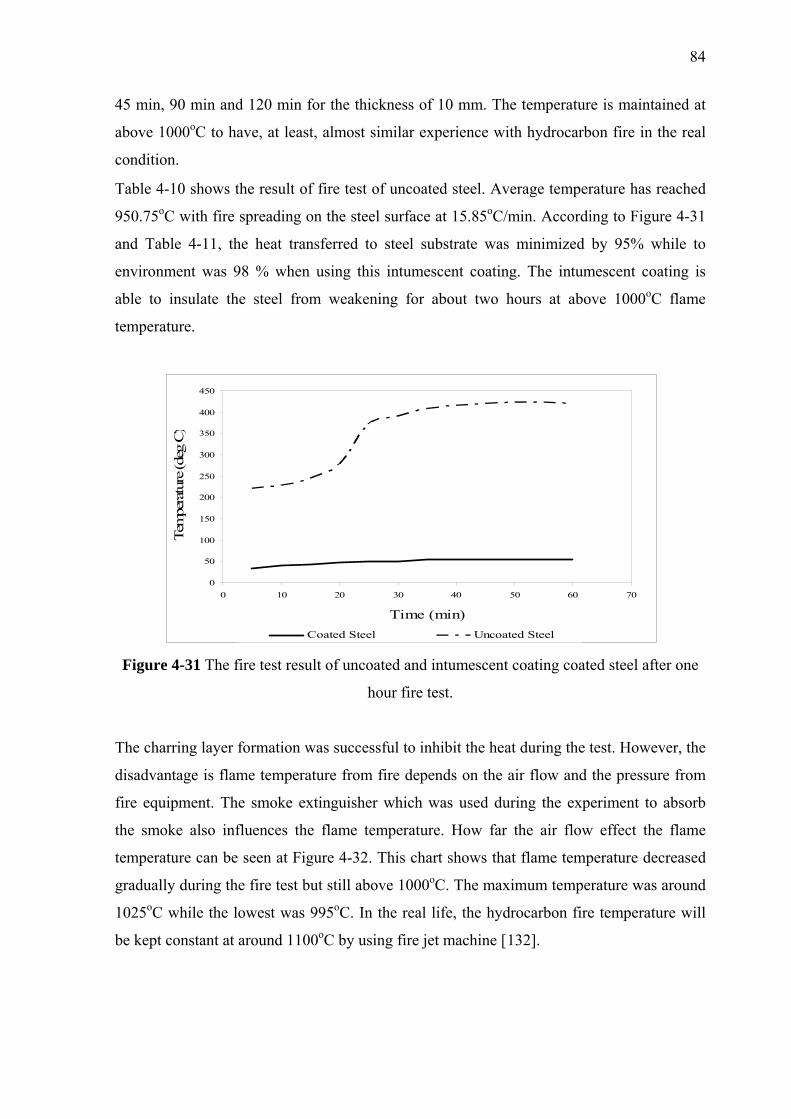
84
45 min, 90 min and 120 min for the thickness of 10 mm. The temperature is maintained at
above 1000oC to have, at least, almost similar experience with hydrocarbon fire in the real
condition. Table 4-10 shows the result of fire test of uncoated steel. Average temperature has reached
950.75oC with fire spreading on the steel surface at 15.85oC/min. According to Figure 4-31
and Table 4-11, the heat transferred to steel substrate was minimized by 95% while to
environment was 98 % when using this intumescent coating. The intumescent coating is
able to insulate the steel from weakening for about two hours at above 1000oC flame
temperature.
0
50
100
150
200
250
300
350
400
450
0 10 20 30 40 50 60 70
Time (min)
Tem
pera
ture
(deg
C)
Coated Steel Uncoated Steel Figure 4-31 The fire test result of uncoated and intumescent coating coated steel after one
hour fire test.
The charring layer formation was successful to inhibit the heat during the test. However, the
disadvantage is flame temperature from fire depends on the air flow and the pressure from
fire equipment. The smoke extinguisher which was used during the experiment to absorb
the smoke also influences the flame temperature. How far the air flow effect the flame
temperature can be seen at Figure 4-32. This chart shows that flame temperature decreased
gradually during the fire test but still above 1000oC. The maximum temperature was around
1025oC while the lowest was 995oC. In the real life, the hydrocarbon fire temperature will
be kept constant at around 1100oC by using fire jet machine [132].

85
Table 4-11 The temperature of flame from fire, back of steel substrate and environment
during fire test.
Temperature (oC) Time (min)
Flame Back of Steel Substrate Environment
5 900 34 20
10 920 40 20
15 925 43 20.2
20 1003 48 20.2
25 1005 49.5 20.2
30 1006 49.2 21.4
35 1015 53.2 20.3
40 1017 54.8 20.1
45 1018 55 36
50 1018 55.2 23.3
55 1019 55.6 23.3
60 1011 55.5 23.3
65 1012 50.7 20
70 1014 54 20.4
75 1015 54.5 20.1 80 1016 53.9 23.6 85 1018 54.7 20.2 90 1016 53.3 21 95 1018 58.9 20
100 1008 69.2 21.2 105 1009 64.7 20 110 1005 61.5 20 115 1005 68.6 20.2
120 1009 67.3 21.8 Average
Temperature (oC)
1000 54 22
Fire Spread (oC/min) 8.33 0.45 0.18
Temperature Reduction 94.6%
Hydrocarbon fire protection has to respond to a very rapid temperature increase and extreme
turbulence fuelled by the burning of hydrocarbon products such as oil and gas. This type of
fire often found in severe environmental conditions such as the oil, gas and petrochemical
processing industries, places very high demands on the fire protection coating system. Thick

86
film epoxy intumescent coatings were used to protect substrates against high and rapid
flame temperature.
The temperature at the back of the steels gradually increased during fire test because the
coating has limited time to insulate the steel. The intumescent coating element works as a
synergy and forms carbonaceous layer on the surface. Figure 4-33 shows sample before and
after fire test.
0
200
400
600
800
1000
1200
5 15 25 35 45 55 65 75 85 95 105 115
Time (min)
Tem
pera
ture
(°C)
Flame Temperature Environment Temperature Steel Temperature
Figure 4-32 The temperature of flame, back of steel substrate and environment during fire
test.
When the temperature of the coating surface reached the critical temperature under the heat
of flame, the surface begins to melt and is converted into highly viscous liquid.
Simultaneously, reactions are initiated that resulted in the release of inert gases with low
thermal conductivity. These gases were trapped inside the vicious fluid (formation of
bubbles).
Temperature reduction up to 94.6 %

87
Figure 4-33 Intumescent coated steel fire test sample, a) before fire test and b) after fire
test.
The result is the expansion of foaming, sometimes up to several times its original thickness
(2-10mm), to form a protective carbonaceous char (Figure 4-33) that acts as an isolative
barrier between the fire and the substrate [13]. The char formed with the char thickness
almost reached 4 times the original thickness of the intumescent coating. The thick char has
a much lower thermal conductivity than in the intumescent coating before burn out.
The constant environment temperature showed that the coating has an excellent insulation
with the formation of multi carbonaceous layer during the two hour fire test and the low
hardness strength of intumescent coating can be balanced with the presence of various level
additives in the material.
a) b)

88
CHAPTER 5
CONCLUSION AND RECOMMENDATIONS
5.1 Conclusions
The study on adhesion bonding of intumescent coating to steel substrate was observed. The
main conclusions can be derived as follows:
The intumescent coating has a good thermal barrier by showing temperature reduction
up to 94.6% for up to two hours of firing. Adhesion bonding on the steel substrate and
coatings was broken due to the attainment of the glass temperature (Tg) of the heat of the
coatings and carbon fiber. Further observation shows that the adhesion bonding broke due
to the penetration of water to steel substrate especially after immersion. The mechanical
properties show that the steel substrate strength maintained by showing no new phase
formation and no re-crystallization, though the hardness is increased. Lap shear strength
decreased inversely proportional by increasing the coating thickness and showing cohesive
fracture on intumescent coating surface. The surface treatment of the steel is important to
promote the adhesion bonding since the tortuous surface increases the surface area. The
type of adhesion bonding between the coatings and steel substrate are mechanical
interlocking and adsorption bonding. The intumescent coating and primer coating contains
non hazardous element, therefore this coating is safe to use. The additives elements such
Silicon, Phosphate and Calcium are useful to promote the adhesion bonding of the coatings
to steel substrate. In addition, the compatibility of the primer coating and intumescent
coating will result in a good adhesion bond by forming diffusion adhesion bonding.

89
5.2 Recommendations
The investigation of silicon presence and other additives to adhesion bonding strength is
recommended for further study.
Though the lap shear strength is poor; the intumescent coating has excellent thermal barrier.
Thus, the suitable application for the intumescent coating is on the wall and surface without
any load. The improvement on lap shear strength of the intumescent coating will result in
great thermal barrier and can be applied in any area, such as rig platform, bridge or building.
The development in chemical compostion of intumescent coating is also needed to produce
a thin coating thickness with excellent thermal barrier.

90
REFERENCES
[1] W. Zhenyu, H. Enhou, and W. Ke, "An investigation into fire protection and water resistance of intumescent nano-coatings", Journal of Surface and Coatings Technology, vol. 201, pp. 1528-1535, 2006.
[2] "The workplace (health, safety and welfare) regulations 1992", Statutory Instrument,
Ed. United Kingdom, 1992.
[3] J.A. Seiner and T. A. Ward, “Fire protective coatings for structural steel”, Polymer Paint Colour Journal, vol. 178, pp. 75, 1988.
[4] G. K. Castle, “Fire Protection of Structural Steel”, Loss Prevention Journal, vol. 8, pp.
57, 1974.
[5] S.C. Upadhya, Asian Paints (I) Ltd., Paintindia, vol. 50, pp. 45–52, 2000. [6] S. Duquesne, S. Magnet, C. Jama, and R. Delobel, “Intumescent paints: fire protective
coatings for metallic substrates”, Surface Coating Technology , vol. 302, pp. 180-181, 2004.
[7] H. L. Vandersall, "Intumescent coating systems, their development and chemistry," Fire
Flammability, vol. 2, pp. 97-140, 1971. [8] J. A. Rhys, “Intumescent coatings and their uses”, Fire and Material Journal, vol. 4,
pp.154-156, 1980. [9] G. Jun-wei, Z. Guang-cheng, D. Shan-lai, Z. Qiu-yu, and J. Kong, "Study on
preparation and fire-retardant mechanism analysis of intumescent flame-retardant coatings”, Surface and Coating Technology, vol. 201, pp. 7835-7841, 2007.
[10] S. Bourbigot, M. Le Bras, S. Duquesne, and M. Rochery, "Recent advances for
intumescent polymers”, Macromolecular Materials and Engineering, vol. 289, pp. 499, 2004.
[11] M. Jimenez, S. Duquesne, and S.Bourbigot, "Characterization of the performance of an
intumescent fire protective coating", Surface and Coating Technology, pp. 981, 2006. [12] J. Charles E. Anderson and D. K. Wauters, "A Thermodynamic Heat Transfer Model
for Intumescent System", International Journal of Engineering Science, vol. 27, pp. 881-889, 1984.
[13] J. Charles E. Anderson, D. Jeremo, M. William A, and J. Buckmaster, "Intumescent
reaction mechanism”, Journal of Fire Sciences, vol. 3, pp. 161, 1985.
[14] Websites of fire retardant coating companies, Leighs Paints, 2008. url : http://www.leighspaints.co.uk/

91
[15 ] R. Rose A and P. V. Yaneff, Coatings of Polymers and Plastics. New York: Marcel Dekker, Inc, 2003.
[16] S. Yawei, J. Cao Jia, M. Guozhe, Z. Tao and W. Fuhui, "The role of a zinc phosphate
pigment in the corrosion of scratched epoxy-coated steel”, Corrosion Science, vol. 51, pp. 371-379, 2009.
[17] M. Zubielewicz and W. Gnot, “Mechanisms of non-toxic anticorrosive pigments in
organic waterborne coatings”, Prog. Org. Coat. Vol. 49, pp. 358, 2004. [18] A.C. Bastos, M.G. Ferreira, and A.M. Simões, “Corrosion inhibition by chromate and
phosphate extracts for iron substrates studied by EIS and SVET”, Corros. Sci. vol. 48, pp.1500, 2006.
[19] F. Uwe, H. Fred, M. Hiroaki and Y. Wei, "Flame Retardants”, Sri Consulting, Ed., December 2008. url:http://www.sriconsulting.com/SCUP/Public/Reports/FLAME000/
[20] A. Holt, "Fire-resistant coatings market sees 200 % growth in the UAE”, AME Info.
The Ultimate Middle East business resource, Al Gurg Leigh Paints, 2001. [21] R.F. Gibson, “Principles of composite material mechanics”, McGraw-Hill, New York,
pp.1-3,1994.
[22] R.F. Gibson, “Principles of composite material mechanics”, McGraw-Hill, New York, pp.11, 1994. [23] R.F. Gibson, “Principles of composite material mechanics”, McGraw-Hill, New York,
pp. 13, 1994.
[24] European Flame Retardants Association “How do they work?”, 2006. url : http://www.flameretardants.eu/Content/Default.asp?PageID=130
[25] S. Posner, "Guidance on alternative flame retardants to the use of commercial
pentabromodiphenylether (c-PentaBDE)”, 2009. [26] "Flame retardants - a general introduction”, Environmental Health Criteria, vol.
192, 1997. [27] G. A. Skinner, "Smoke-the hazard, the measurement and the remedy”, Journal of
Chemical Technology and Biotechnology, vol. 31, pp. 445-456, 1981. [28] G. A. Skinner, "Smoke-the hazard, the measurement and the remedy”, Journal of
Chemical Technology and Biotechnology, vol. 31, pp. 457, 1981.
[29] G. Camino, "Fire retardant polymeric materials in Atmospheric oxidation and anti Oxidant", Elsevier, vol. Chapter 10, pp. 461-494, 1993.

92
[30] J. Hao and W. K. Chow, "A brief review of intumescent fire retardant coatings",Architectural Science Review, 2003.
[31] K. Russell, "Fire retardant coatings," Handbook of Fire Retardant Coatings and Fire
Testing Services, Lancaster: Technomic Publishing Co, pp. 265, 1994. [32] L.C. Camino and G. Martinasso, Polymer Degradation Stabilisation, vol. 23, pp. 359-
376, 1989. [33] A. R. Horrocks, "Developments in flame retardants for heat and fire resistant textiles –
the role of char formation and intumescence”, Polymer Degradation Stabilisation, vol. 54, pp. 143-154, 1996.
[34] W. D. Callister, "Materials Science And Engineering : An Introduction”, seventh
edition, 2007. [35] J. Xu and J. Hao, "The Combustion and Thermal Behavior of PA-6/PP Blends with
added Nano-LDH and APP," Polymer Materials Science and Engineering, 2001. [36] J. Wang, W. Ping, and J. Hao, "Comparative study of the effect of aluminosilicates on
intumescent flame retardancy of PP/APP/PER systems by CONE/LOI/XPS", Am. Chem. Soc. 220th, 2000.
[37] S. Duquesne, M.L. Bras, and S. Bourbigot, "Analysis of fire gases released from
polyurethane and fire-retarded polyurethane coatings", Journal of Fire Sciences, vol. 8, pp. 456-482, 2000.
[38] R.L. Buxton and E. M. Parker. vol. US Patent 6245842 United States, June 12, 2001. [39] P. Penczek and, R. Ostrysz, "Expandable graphite as a fire retardant in
unsaturated polyester resins", Proceedings of the Flame Retardants 2000 Conference, Interscience Communications, pp. 105-111, 2000.
[40] S. Duquesne, M. Le Bras and S. Bourbigot, "Thermal degradation of polyurethane and
polyurethane/expandable graphite coatings”, Polymer Degradation Stabilisation, vol. 74, pp. 493-499, 2001.
[41] DIN 4102-18, “Fire behaviour of building materials and components; fire barriers,
verification of automatic closure (continuous performance test)", German National Standard: German National Standard, 1991.
[42] W.D. Pirig, S. Rothkamp, and V. Thewes, "Intumescent coatings stable in tropical climates", Europe Patent 902062 A1, 1999.
[43] H. Bennett, "Fire retardant coating composition comprising fly ash and polymer emulsion binder", vol. US Patent 4229329 United States, 1980.
[44] R. Vitaly, "Fire-protective coatings, paints and varnishes", vol. US Patent 4849298
United States, 1989.

93
[45] B. Li and J. Wang, "A cone calorimetric study of flame retardancy and smoke emission of PVC. I. The effect of cuprous and molybdic oxides", Journal of Fire Sciences, vol. 15, pp. 341-357, 1997.
[46] R.P. Lattimer and W. J. Kronke, "The functional role of molybdenum trioxide as a
smoke retarder additive in rigid poly(vinyl chloride)", Journal Applied Science, vol. 26, pp. 1191-1210, 1981.
[47] M. S. Deogon, "Intumescent fireproofing compositions", vol. WO patent 9111498 A1,
1991. [48] K.K. Shen and T. S. Griffin, "Fire and Polymers", ACS Symposium Series 425,
American Chemical Society, pp. 157, 1990. [49] Y. Niu and Y. Xie, "Fire and waterproof coatings for fibers", vol. Chinese Patent
1061610 A, China, 1992. [50] Y.N. Shebeko, I.A. Bolodian, V.N. Filippov, and E. A. Navzenya, "Explosion
prevention of LPG vessels using fire retardant coatings and safety valves", Proc. Asia-Pac. Int. Symp. Combust. Energy Util, vol. 5, pp. 215-226, 1999.
[51] Y.N. Shebeko, I.A. Bolodian and V.N. Filippov, "A study of the behavior of a
protected vessel containing LPG during pool fire engulfment", J. Hazard. Mater, vol. 77, pp. 43-56, 2000.
[52] A. R. Hochstim, "Fire retardant coatings for group electric cables and the testing methods", New Adv, Flame Retard. Technol., Fall Conf, 1999.
[53] N.K. Saxena, S. Singh, and T. P. Sharma, "Fire retardant coatings for electric cables",
Paintindia, vol. 49, pp. 35-37, 1999. [54] D.M. Bishop and D. Bottomley, "Fire-retardant paints", J. Oil Colour Chem. Assoc,
vol. 66, pp. 373-396, 1983. [55] I. Broutier and F. Damour, "Halogen-free fire-retarding composition, yarn fire-retarded
with the latter and fire-resistant textile structure comprising such yarns", vol. US Patent 630974 United States, 2001.
[56] T. Subyakto, K. Takeshi, H. Toshimitsu, I. Shigehisa, K. Shuichi and G. Hideo,
"Improving fire retardancy of fast growing wood by coating with fire retardant and surface densification", Fire Material, vol. 22, pp. 207-212, 1998.
[57] S. Gottfried, "Intumescent fire-retardant composition for high temperature and long
duration protection", vol. US Patent 5723515 United States, 1998. [58] F. Liu and W. Zhu, "Fire retardant intumescent coating for lignocellulosic materials",
vol .US Patent 5968669, 1999.

94
[59] M.K.Yalinkilic, Y. Imamura, M. Takahashi, and Z. Demirci, "Effect of boron addition to adhesive and/or surface coating on fire-retardant properties of particle board", Wood Fiber Science, vol. 30, pp. 348-359, 1998.
[60] L.G. Eskind and Petersburg, "New improvements in intumescence," Plastic
Engineering., vol. 56, pp. 29-30, Brookfield, 2000. [61] ISO 834:1985, “Fire-resistance tests –Elements of building construction", International
Organization for Standardization, 1975. [62] UL 1709:1994, “Rapid Rise Fire Test of Protection Materials for Structural Steel",
Underwriters Laboratories, 1994. [63] BS 476-22:1987, “Fire tests on building materials and structures. Methods for
determination of the fire resistance of non-load bearing elements of construction", British Standard Institution, 1987.
[64] BS 476-20:1987, “Fire tests on building materials and structures. Method for
determination of the fire resistance of elements of construction general principles)", British Standard Institution, 1987.
[65] ASTM E119:2008, “Standard Test Methods for Fire Tests of Building Construction
and Materials", ASTM International, vol. 04.07, 2008. [66] C.F. Cullis and M. M. Hirschler, "The combustion of organic polymers", 1981. [67] J. Buckmaster, A. Charles, and A. Nachman, "A Model for intumescent paint",
International Journal of Engineering Science, 1971. [68] A. Charles and D. K. Wauters, "A Thermodynamic Heat Transfer Model for
Intumescent System", International Journal of Engineering Science, vol. 27, pp. 881-889, 1984.
[69] G. K. Castle. vol. US Patent 3913290 United States, 1995. [70] B. George and G. K. Castle, "Reinforcement System For Mastic Intumescent Fire
Protection Coatings Comprising a Hybrid Mesh fabric", vol. US Patent 5433991 United States, 1995.
[71] C. A. Harper, Handbook of Building Materials For Fire Protection: Mcgraw Hill, 2004. [72] R. Cornell and H. K. D. H. Bhadeshia, "Decarburization of Steel”, United Kingdom:
University of Cambridge, 2002. [73] B. Daniel A and J. C. Warner, "Material Properties", Metallurgy Fundamentals:
The Goodheart-Willcox Company, Inc., 2005. [74] J. Toth, "Adsorption: Theory, Modeling, and Analysis " 2002.

95
[75]Website Special Chemical for Polymer, “Adhesion”, 2008. url:http://www.specialchem4polymers.com/.
[76] T. Young, Phil. Trans. R. Soc, vol. 95, pp. 65, 1985. [77] W. Zeno W, N. Frank, P. Jones, and D. A. Wicks, "Adhesion in Organic coatings”,
Wiley-Interscience, 2006. [78] W. Funke, "Towards Environmentally Acceptable Corrosion Protection by Organic
Coatings - Problems and Realisation", Journal of Coatings Technology, Vol: 55, No: 705, p. 31-38, 1983.
[79] J. Massingill, Journal Coating Technology, vol. 62, pp. 31, 1990. [80] L. David, P. Pete, and B. Rodgers, "Evaluation of Organic Coatings with
Electrochemical Impedance Spectroscopy, Part 2: Application of EIS to Coatings", Gamry Instruments. JCT Coatings Tech, pp. 88, 2004.
[81] L. David, P. Pete, and B. Rodgers, "Evaluation of Organic Coatings with
Electrochemical Impedance Spectroscopy, Part 2: Application of EIS to Coatings", Gamry Instruments. JCT Coatings Tech, pp. 89, 2004.
[82] L. David, P. Pete, and B. Rodgers , "Electrochemical Impedance Spectroscopy Theory: A Primer", Gamry Instruments, 2007.
[83] M. Kalnins, "Adhesive Interaction of Polyethyelene with Steel", International Journal
Adhesion Adhesives, vol. 143, 1990. [84] M. Kalnins and J. Ozolins, "Kinetics of Adhesion Interaction of Polyolefins with
metals under Conditions of Contact Thermo oxidation", International Journal Adhesion Adhesives, vol. 22, pp. 179, 2002.
[85] M. R. Bowditch, "The durability of adhesive joints in the presence of water", International Journal Adhesion Adhesives, vol. 16, pp. 73, 1996.
[86] W. Brockman, "The Environmental Resistance of Metal Bonds in New Industries and
Applications for Advanced Materials Technology", 19th SAMPE Symposium, Exhibition, Azuza, CA, 1974.
[87] A. Maëlenn and A. A. Roche, "Residual stresses and practical adhesion: effect of
organo-metallic complex formation and crystallization", Journal Adhesion Science Technology, vol. 20, pp. 1889 - 1903, 2006.
[88] R. G. Dillingham and F. J. Boerio, "Interphase Composition in Aluminium/Epoxy
Adhesive Joints", Journal Adhesion, vol. 24, pp. 313-335, 1987. [89 ] T. K. Kwei, H. Schonhorn, and H. L. Frisch, "Dynamic Mechanical Properties of The
Transcrystalline Regions in Two Polyefins", Journal Applied Polymer Science, vol. 38, pp. 2512-2516, 1967.

96
[90] M. M. Abdel Wahab, A. D. Crocombe, A. Beevers, and K. Ebteha, "Coupled stress- diffusion analysis for durability study in adhesively bonded joints", International Journal Adhesion Adhesives, vol. 22, pp. 62, 2002.
[91] M. M. Abdel Wahab, A. D. Crocombe, A. Beevers, and K. Ebteha, "Coupled stress-
diffusion analysis for durability study in adhesively bonded joints", International Journal Adhesion Adhesives, vol. 22, pp. 63, 2002.
[92] "Material Data Sheet Chartek 7 Part A and B", International Paint, Azko Nobel, 2006.
[93] "Material Safety Data Sheet Intergard 251", International Paint, Azko Nobel, 2005. [94] NACE Standard, Joint Surface Preparation Standard, 2000. [95] "Chartek 7", International Paint, Azko Nobel, 2003. [96] ASTM B117:1997, “Standard Practice for Operating Salt Spray (Fog) Apparatus",
ASTM International, 1997.
[97] ASTM D3163:2008, “Standard Test Method for Determining Strength of Adhesively Bonded Rigid Plastic Lap-Shear Joints in Shear by Tension Loading", ASTM International 2008.
[98] Lab Report XRD S8, “Quantitative Analysis of Geological Sample : Combined
XRD/XRF analysis”, Bruker Advanched X-Ray solution, 2006. [99] "Material Hardness", Calce and the University of Maryland, 2001.
url : http://www.calce.umd.edu/general/Facilities/Hardness_ad_.htm. [100] ASTM E119 - 08a. “Standard Test Methods for Fire Tests of Building Construction
and Materials", ASTM International vol. 04.07, 2009.
[101] N. Wenzel, Ind. Eng. Chem, vol. 28, pp. 988, 1936.
[102] Key to metals websites, “Low carbon steel“, 2009.
url : http://steel.keytometals.com/Articles/Art15.htm. [103] J. K. Kim and Y.W. Mai, "Engineered Interfaces In Fiber Reinforced Composites",
Elsevier, 1998. [104] M. Kutz, “Heat Transfer Calculation”, Mcgraw Hill, 2006 [105] S. D. Gardener, C. U. Pittman, and R. M. Hackett, "Residual thermal stresses in
filamentary polymer matrix composite materials incorporating an elastomeric interphase: A Mathematical assessment", Journal of composite science Technology, vol. 46, pp. 307-318, 1993a.
[106] J.K. Kim and Y. W.Mai, "High Strength, High Fracture Toughness Fiber Composites

97
With Interface Control - A Review", Composites Science Technology, vol. 41, pp. 333-378, 1991a.
[107 ] G. Giunchi and S. Ceresara, "Article based on a metal alloy of nickel, chromium and
metalloid elements including microcrystalline precipitates, metal alloy and preparation method", vol. US Patent 6461744 United States, 2002.
[108] L. Bin, Journal of Polymer Degradation Stabilization, vol. 68, pp. 197, 2000. [109] L. Bin, Journal of Polymer Degradation Stabilization, vol. 74, pp. 195, 2001. [110] H. Joseph W, M. Marlborough, B. David C, and N. H. Nashua, "Low Density, Light
weight, Intumescent coating", vol. US Patent 6096812 United States, 2000. [111] "Corrosion of Iron and Steel", Technical Data Sheet, vol. 1, Wattyl Australia Pty Ltd.,
2008. url: www.wattyl.co.nz/i-06%20corrosion%20of%20iron%20&%20steel.pdf [112] Z. Z. Lazarevic, "Determination of the protective properties of electrodeposited
organic epoxy coatings on aluminium and modified aluminium surfaces", Corrosion Science, vol. 47, pp. 823-834, 2005.
[113] K. L. Reifsnider, "Modeling of the Interphase in Polymer-Matrix Composite Material
Systems", Composites, vol. 25, pp. 461, 1994. [114] Z. Qiwu, M. Hiroki, S. Fumio, and M. Baron, "Debromination of hexabromobenzene
by its co-grinding with CaO", Chemosphere, vol. 48, pp. 787-793, 2002. [115] A. V. Pocius, “Adhesion and Adhesives Technology - An Introduction 2nd edition”,
Hanser, 2002. [116] R. L. Patrick, "Treatise on Adhesion and Adhesives", vol. 6, 1988. [117] G. Jun-wei, Z. Guang-cheng, D. Shan-lai, Z. Qiu-yu, and J. Kong, "Study On
Preparation And Fire-Retardant Mechanism Analysis Of Intumescent Flame-Retardant Coatings", Surface and Coating Technology, vol. 201, pp. 7835-7841, 2007.
[118] S. Duquesne, S. Magnet, C. Jama, and R. Delobel, "Intumescent paint : fire protective
coating for metallic substrates", Journal Surface and Technology, vol. 180-181, 2004. [119] G. Jun-Wei, Z. Guang –cheng, D. Shai-Lai, Paint Coating Ind, vol. 35, pp. 26, 2005. [120] M.S.Robert and et. al, "Spectrometric Identification of Organic Compounds : 7th
edition", Wiley, 2005. [121] I. Toshiaki, K. Hiroyoshi, N. Akira, N. Takafumi, and M. Kakimoto, "Calcium borate
flame retardation system for epoxy molding compounds", Polymer Engineering and Science, 2006.

98
[122] Z. Qiwu, M. Hiroki, S. Fumio, and M. Baron, "Debromination of hexabromobenzene by its co-grinding with CaO", Chemosphere, vol. 48, pp. 787-793, 2002.
[123] W. Zhen-Yu, En Hou, and K. Wei, Progress Organic Coating, vol. 53, pp. 29, 2005. [124] L. Guoxin, Y. Junfen, H. Tingshu, W. Yonghua, and G. Liang, "An Investigation
of the thermal degradation of the intumescent coating containing MoO3 and Fe2O3", Journal Surface and Technology, vol. 202, pp. 3121-3128, 2008.
[125] S. Makoto, I. Kazuhiko, and M. Iji, "Flame-Retardant Resin Composition”, US Patent
7247666, 2007. [126] "Ceramic Properties Tables", Ferro-Ceramic Grinding Inc, 2009.
url : http://www.ferroceramic.com/alumina_nitride_table.htm [127] G. A. Skinner, "Smoke-the hazard, the measurement and the remedy", Journal of
Chemical Technology and Biotechnology, vol. 31, pp. 445-452, 1981.
[128] "Chlorine: Effects on Health and the Environment", The Chlorine Institute, 1999. url : www.chlorineinstitute.org/files/PDFs/ChlorineEffectsOnHealth.pdf
[129] S. Gee, Surface Coatings International, vol. 7, pp. 316-320, 1997. [130] J.J. Caprari, A.R. Di Sarli, and B. d. Amo, "Zinc phosphate as corrosion inhibitive
pigment of waterborne epoxy paints used for steel protection", contributed paper, 2000.
[131] MATWEB, Website Material Property Data, 2009.
url: http://www.matweb.com/search/MaterialGroupSearch.aspx.
[132] I. Toshiaki, K. Hiroyoshi, N. Akira, N. Takafumi, and M. Kakimoto, "Calcium borate flame retardation system for epoxy molding compounds", Polymer Engineering and Science, 2006.