Embed Size (px)
Citation preview
4 Cellulose Acetate Membrane Spanning and Adhesion Properties
To create a suspended, organic membrane over an inorganic substrate with large topographical
features requires various strategies. This chapter discusses the spanning of a cellulose acetate
membrane across silicon microchannels and the method used for good adhesion between cellulose
acetate and the substrate. An overview of adhesion theory is first discussed along with factors that
affect adhesion and techniques used to characterize adhesion strength.
Porous polymer films, prepared using phase inversion techniques, are coated onto inorganic silicon
substrates and then characterized for adhesion strength. Experimental data from a blister test setup
was used to measure the critical pressure point when a leak was observed on both chemically and
mechanically roughened surfaces with a spin-coated, phase-separated cellulose acetate film. These
films were observed to have the best adhesion with surfaces treated with octadecyltrichlorosilane
(OTS), withstanding pressures above 50 kPa. The last section of this chapter presents the theory
and experimental results for spanning cellulose acetate membranes across silicon microchannels.
Based on the surface properties of the substrate and the material properties of the cellulose acetate
lacquer, it was possible to successfully span 75 µm wide silicon microchannels.
4.1. Polymer adhesion overviewPolymeric films are widely used in the microelectronic industry in such application areas as
photoresists, interlayer dielectrics, and packaging [87]. Porous polymers, such as those formed
using the phase inversion process, have gained interest in the fields of filtration, drug delivery,
protein separation, and microdialysis [187]. Unfortunately these films undergo a considerable
amount of residual stress after formation, causing them to delaminate from the substrate. In order
to enhance film adhesion, microfabricated structures as well as chemical coupling agents have been
employed to adhere polyimide films to silicon substrates [71, 75]. In this section a short
89
background on the theory of adhesion, characterization techniques used to gauge the adhesion
strength, and factors that affect adhesion quality will be discussed.
4.1.1. Theories of Adhesion
Adhesion is defined as the state in which two surfaces are held together by physical and/or
chemical attraction. The main adhesion theories include (i) mechanical interlocking, (ii)
interdiffusion, (iii) adsorption and surface reaction, and (iv) electrostatic surface attraction. The
next four sections provide a description of each theory. Due to the variety of materials and the
diversity of adhesion conditions, the field of adhesion is a complex topic and can’t be defined
solely by a single model or theory. In reality, several adhesion theories are involved simultaneously
to describe an adhesion interface. In the following discussion, the terms ‘coating’, ‘film’, and
‘membrane’ are used interchangeably.
4.1.1.1. Mechanical interlocking theory.
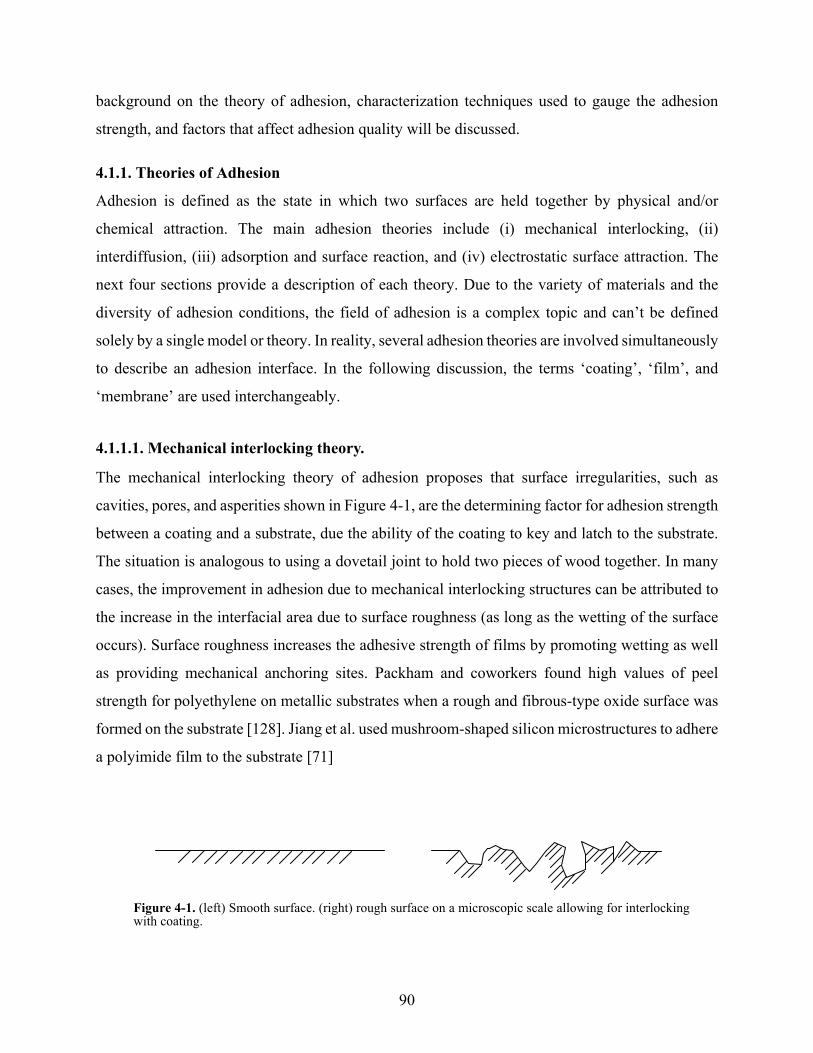
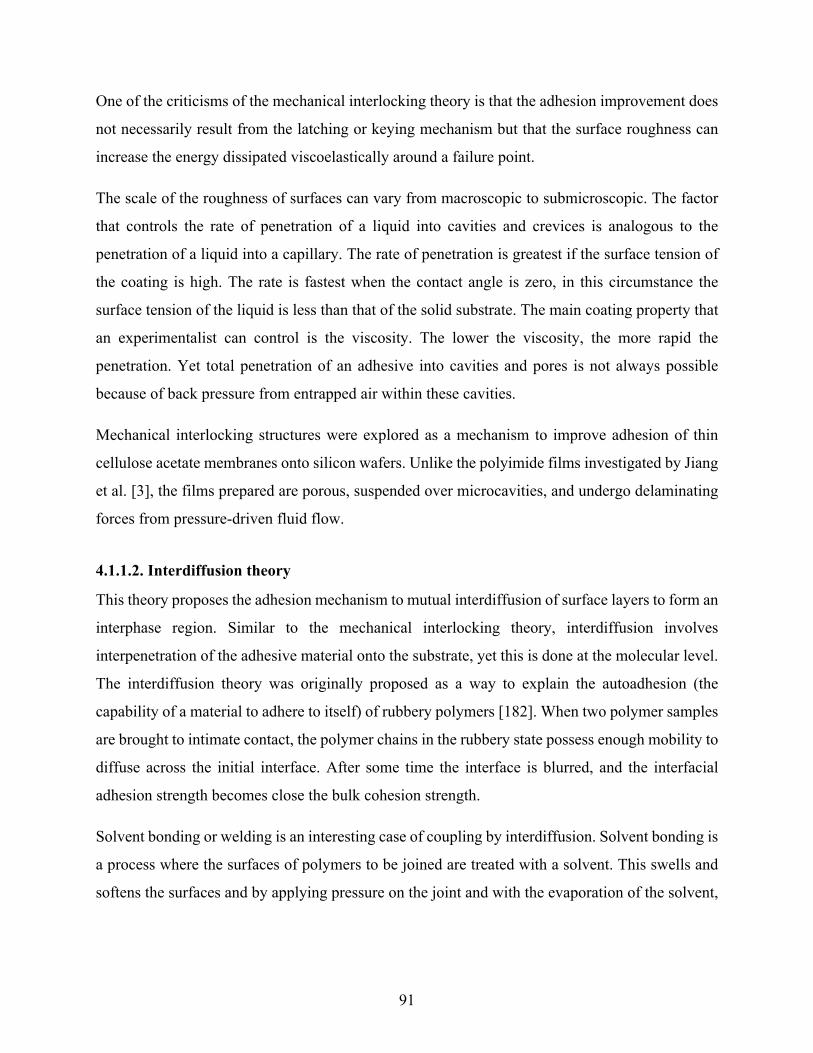
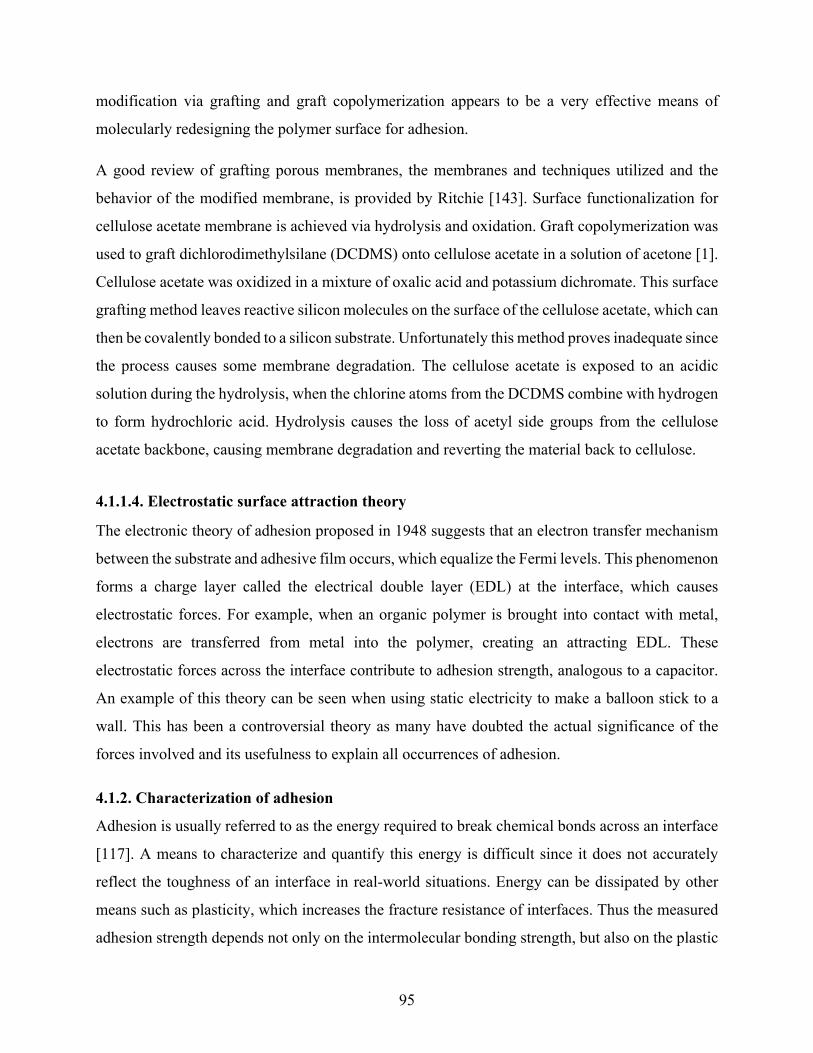
The mechanical interlocking theory of adhesion proposes that surface irregularities, such as
cavities, pores, and asperities shown in Figure 4-1, are the determining factor for adhesion strength
between a coating and a substrate, due the ability of the coating to key and latch to the substrate.
The situation is analogous to using a dovetail joint to hold two pieces of wood together. In many
cases, the improvement in adhesion due to mechanical interlocking structures can be attributed to
the increase in the interfacial area due to surface roughness (as long as the wetting of the surface
occurs). Surface roughness increases the adhesive strength of films by promoting wetting as well
as providing mechanical anchoring sites. Packham and coworkers found high values of peel
strength for polyethylene on metallic substrates when a rough and fibrous-type oxide surface was
formed on the substrate [128]. Jiang et al. used mushroom-shaped silicon microstructures to adhere
a polyimide film to the substrate [71]
Figure 4-1. (left) Smooth surface. (right) rough surface on a microscopic scale allowing for interlockingwith coating.
Chip
90
One of the criticisms of the mechanical interlocking theory is that the adhesion improvement does
not necessarily result from the latching or keying mechanism but that the surface roughness can
increase the energy dissipated viscoelastically around a failure point.
The scale of the roughness of surfaces can vary from macroscopic to submicroscopic. The factor
that controls the rate of penetration of a liquid into cavities and crevices is analogous to the
penetration of a liquid into a capillary. The rate of penetration is greatest if the surface tension of
the coating is high. The rate is fastest when the contact angle is zero, in this circumstance the
surface tension of the liquid is less than that of the solid substrate. The main coating property that
an experimentalist can control is the viscosity. The lower the viscosity, the more rapid the
penetration. Yet total penetration of an adhesive into cavities and pores is not always possible
because of back pressure from entrapped air within these cavities.
Mechanical interlocking structures were explored as a mechanism to improve adhesion of thin
cellulose acetate membranes onto silicon wafers. Unlike the polyimide films investigated by Jiang
et al. [3], the films prepared are porous, suspended over microcavities, and undergo delaminating
forces from pressure-driven fluid flow.
4.1.1.2. Interdiffusion theory
This theory proposes the adhesion mechanism to mutual interdiffusion of surface layers to form an
interphase region. Similar to the mechanical interlocking theory, interdiffusion involves
interpenetration of the adhesive material onto the substrate, yet this is done at the molecular level.
The interdiffusion theory was originally proposed as a way to explain the autoadhesion (the
capability of a material to adhere to itself) of rubbery polymers [182]. When two polymer samples
are brought to intimate contact, the polymer chains in the rubbery state possess enough mobility to
diffuse across the initial interface. After some time the interface is blurred, and the interfacial
adhesion strength becomes close the bulk cohesion strength.
Solvent bonding or welding is an interesting case of coupling by interdiffusion. Solvent bonding is
a process where the surfaces of polymers to be joined are treated with a solvent. This swells and
softens the surfaces and by applying pressure on the joint and with the evaporation of the solvent,
91
the two surfaces bond. Interdiffusion presumably occurs in the presence of the solvent, even if the
polymers are immiscible to each other in a lacquer.
4.1.1.3. Adsorption and surface reaction theory
Adsorption theory of adhesion is the most widely applicable and assumes that adhesive materials
will adhere to a substrate due to interatomic and intermolecular forces at the interface. The most
common interfacial forces are from van der Waals and Lewis acid-base interactions and less
frequently ionic, covalent, or metallic interfacial bonds. The magnitude of these forces can be
generally related to fundamental thermodynamic quantities, such as surface free energies of both
the adhesive and adherend. Covalent bonds are generally considered the strongest bonding force
in comparison with physical interactions such as van der Waals, which are secondary force
interactions. The typical strength of a covalent bond is of the order of 100 to 1000 kJ/mol, while
van der Waals interactions and hydrogen bonds do not exceed 50 kJ/mol. The formation of
chemical bonds relies on the reactivity of both the coating and the substrate.
The best adhesion method is multiple, strong linkages across the interface between two materials.
Two distinct surface modification methods that provide a large number of linkages to improve
adhesion based on adsorption theory, are surfactants and silane coupling agents. In addition, it is
possible to modify the polymer structure to improve adhesion to the substrate using polymer graft
copolymerization. These modification methods will now be overviewed briefly.
4.1.1.3.1. Surfactants
A surfactant is a substance that has the property of absorbing onto surfaces and altering the free
energy of these surfaces [145]. Surfactants essentially lower the surface tension of coatings.
Surfactants are usually organic compounds that are amphipathic, meaning they contain both
hydrophobic groups (the "tail" of the molecule) and hydrophilic groups (the "head" of the
molecule). These two different chemical groups have the purpose of one end being compatible with
the liquid to be modified and the other having a lower surface tension. Therefore, they are typically
soluble in both organic solvents and water. A surfactant can be classified by the presence of
charged groups in its head. A nonionic surfactant has no charge groups in its head while the head
of an ionic surfactant carries a net charge. If that net charge is negative, the surfactant is more
92
specifically called anionic; if the net charge is positive, it is called cationic; if both positive and
negative charges are present then it is called zwitterionic.
Since most surfaces are negatively charges and in order to make those surfaces hydrophobic by use
of a surfactant, the best type is a cationic surfactant. This surfactant will adsorb onto the surface
with its positively charged hydrophilic head group oriented toward the negatively charged surface
and its hydrophobic group oriented away from the surface. Prakash used a roughened surface along
with the use of a cationic surfactant called BMDSAC (benzyl, methyl, distearyl ammonium
chloride) for adhering cellulose acetate membranes [136]. Using a cationic surfactant allowed
attachment of the surfactant onto the silicon surface and provided a hydrophobic surface that
excludes moisture, allowing for better adhesion between the cellulose acetate and the surface.
Surfaces can also be rendered hydrophobic by using silane coupling agents as will be discussed in
the following section.
4.1.1.3.2. Silane Coupling Agent
The strongest interaction between a substrate surface and a film is when covalent bonds are formed
instead of the easily displaced hydrogen bonds. One approach is to use reactive silanes, these
enhance the adhesion of materials to hydroxyl surfaces, such as glass and silicon dioxide. The most
common silane coupling agent has the general structure X3Si(CH2)nY, where n= 0 to 3, X is a
hydrolysable group on silicon and Y is an organofunctional group usually selected for reactivity to
the film coating.
A variety of reactive silanes are available, all have a trialkoxysilyl group attached to a short
hydrocarbon chain, the other end has a functional reactive group such as amine, mercaptan, epoxy,
etc. The alkoxysilyl group reacts with the hydroxyl groups on the surface of the silicon dioxide,
causing covalent bonds to be formed that have a series of hydrocarbon tails with reactive groups
on the end. Experimental evidence has shown that typically the silane primer layer is not a
monolayer but is about 2 to 100nm thick. Thinner layers are deposited from the solutions
containing lower concentrations of silane.
The benefit of silane coupling agents is the enhancement of the environmental resistance of the
interface, specifically to moisture. Hydrophobic silane coupling agents generate a water-resistant
93
interface between the organic polymer and the inorganic substrate. Coupling agents are usually
applied from dilute aqueous solutions of organic solvents, and must undergo initial hydrolysis and
oligomerization prior to interacting with the chosen substrate. The silanes may interact with the
substrate initially through hydrogen bonding to surface hydroxyl groups, with subsequent
condensation reaction generating siloxane structures. It is possible that lateral polymerization
occurs without the formation of bonds to the surface, this leads to a siloxane agglomerate that
creates a cloudy appearance on the substrate.
Reactive silane groups can chemically react with a polymer film coating. Even without covalent
bonds, a degree of interpenetration is sufficient for polymer chains to diffuse and establish an
entangled network. The polysiloxane layer has an open porous structure and a film coating may
penetrate this and then harden to form an interpenetrating network interphase region. The
interdiffusion of macromolecular chains requires both polymer and silane functionalized surface
to have sufficient solubility and the chains to have sufficient mobility. Jenkins et al. showed a trend
of increasing adhesion energy with increasing chain length was observed for CH3-terminated
silanes, while an opposite trend of decreasing adhesion energy with increasing chain length was
found for vinyl-terminated silanes [70]. Jang et al. reacted long hydrocarbon chains of varying
length onto an acrylic-based trimethoxysilane substrate [69]. Improvements in initial adhesion and
durability of glass-reinforced polyester laminates and castings were noted. Abdel-Sadek et al.
showed that different silanes (APTES, GOPTS, CIPTMS) were used as adhesion promoters for
polyethylene and polytetrafluoroethylene sheets [2]
In this thesis, octadecyltrichlorosilane, an eighteen carbon chain silane, is shown to considerably
improve the adhesion of cellulose acetate membranes to a silicon substrate.
4.1.1.3.3. Polymer graft copolymerization
Many times a polymer has surface characteristics that are less optimal for adhesion to another
substrate. One technique to assist with the attachment an organic polymer to inorganic surfaces is
by modifying the polymer for easier bonding to the surface. Polymer grafting techniques allow the
controlled modification and functionalization of the polymer surface. When the polymer surface to
be modified possess reactive groups (either intrinsic or externally introduced) capable of coupling
with other components, surface modification can be conducted by chemical reactions. Surface
94
modification via grafting and graft copolymerization appears to be a very effective means of
molecularly redesigning the polymer surface for adhesion.
A good review of grafting porous membranes, the membranes and techniques utilized and the
behavior of the modified membrane, is provided by Ritchie [143]. Surface functionalization for
cellulose acetate membrane is achieved via hydrolysis and oxidation. Graft copolymerization was
used to graft dichlorodimethylsilane (DCDMS) onto cellulose acetate in a solution of acetone [1].
Cellulose acetate was oxidized in a mixture of oxalic acid and potassium dichromate. This surface
grafting method leaves reactive silicon molecules on the surface of the cellulose acetate, which can
then be covalently bonded to a silicon substrate. Unfortunately this method proves inadequate since
the process causes some membrane degradation. The cellulose acetate is exposed to an acidic
solution during the hydrolysis, when the chlorine atoms from the DCDMS combine with hydrogen
to form hydrochloric acid. Hydrolysis causes the loss of acetyl side groups from the cellulose
acetate backbone, causing membrane degradation and reverting the material back to cellulose.
4.1.1.4. Electrostatic surface attraction theory
The electronic theory of adhesion proposed in 1948 suggests that an electron transfer mechanism
between the substrate and adhesive film occurs, which equalize the Fermi levels. This phenomenon
forms a charge layer called the electrical double layer (EDL) at the interface, which causes
electrostatic forces. For example, when an organic polymer is brought into contact with metal,
electrons are transferred from metal into the polymer, creating an attracting EDL. These
electrostatic forces across the interface contribute to adhesion strength, analogous to a capacitor.
An example of this theory can be seen when using static electricity to make a balloon stick to a
wall. This has been a controversial theory as many have doubted the actual significance of the
forces involved and its usefulness to explain all occurrences of adhesion.
4.1.2. Characterization of adhesion
Adhesion is usually referred to as the energy required to break chemical bonds across an interface
[117]. A means to characterize and quantify this energy is difficult since it does not accurately
reflect the toughness of an interface in real-world situations. Energy can be dissipated by other
means such as plasticity, which increases the fracture resistance of interfaces. Thus the measured
adhesion strength depends not only on the intermolecular bonding strength, but also on the plastic
95
and viscoelastic deformation processes. Therefore, it would seem that the minimum measured
value for adhesion strength reflects the best estimate since the material deformation is usually
avoided. One way to quantify the adhesion strength is to determine the maximum mechanical stress
that can be attained normal to the interface. This stress is influenced by the variables such as bulk
modulus and thickness of the film, type of mechanical loading, environmental conditions, etc.
number of techniques have been developed to quantify the adhesion strength between a deformable
adhering layer and a rigid substrate. Many of the techniques such as the peel test, the tape test, and
pull-off test, and scratch test, are easy to perform yet usually provide qualitative information and
are difficult to relate directly to mechanical properties of the interface. For example, with the peel
test the main limitation is that the majority of mechanical energy supplied in peeling is dissipated
or stored in deforming the test specimen and little of the energy contributes to the fracture process.
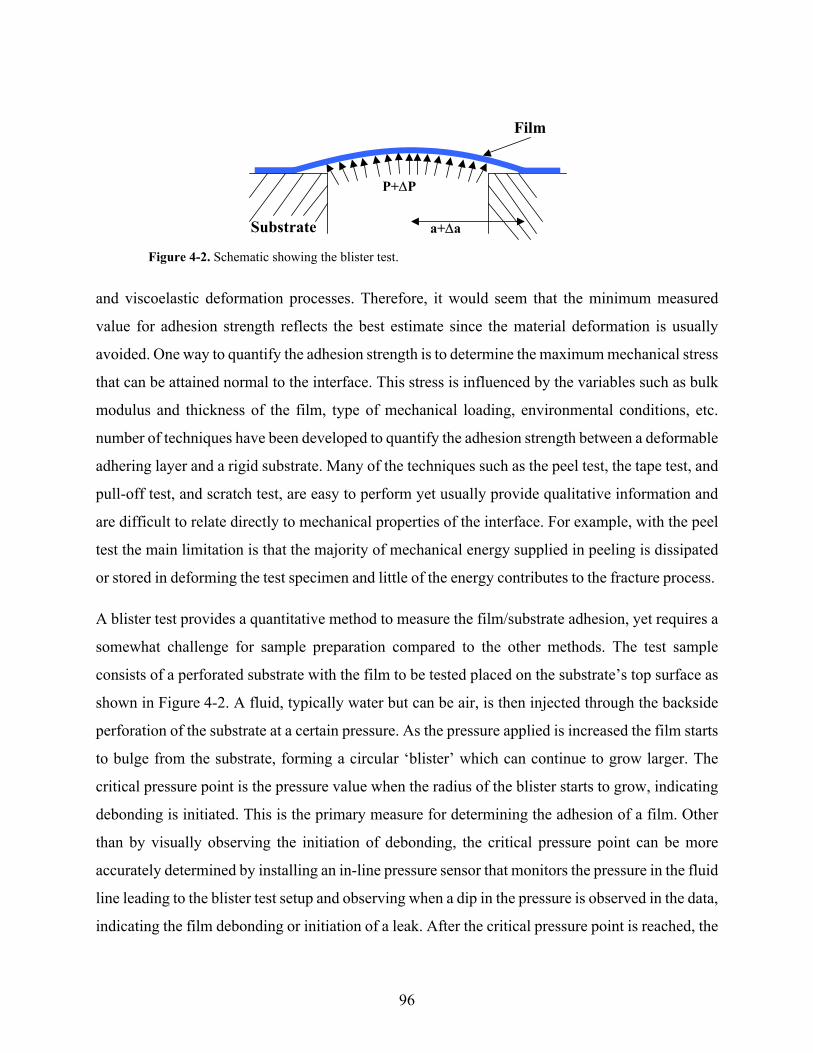
A blister test provides a quantitative method to measure the film/substrate adhesion, yet requires a
somewhat challenge for sample preparation compared to the other methods. The test sample
consists of a perforated substrate with the film to be tested placed on the substrate’s top surface as
shown in Figure 4-2. A fluid, typically water but can be air, is then injected through the backside
perforation of the substrate at a certain pressure. As the pressure applied is increased the film starts
to bulge from the substrate, forming a circular ‘blister’ which can continue to grow larger. The
critical pressure point is the pressure value when the radius of the blister starts to grow, indicating
debonding is initiated. This is the primary measure for determining the adhesion of a film. Other
than by visually observing the initiation of debonding, the critical pressure point can be more
accurately determined by installing an in-line pressure sensor that monitors the pressure in the fluid
line leading to the blister test setup and observing when a dip in the pressure is observed in the data,
indicating the film debonding or initiation of a leak. After the critical pressure point is reached, the
Film
P+∆P
a+∆aSubstrate
Figure 4-2. Schematic showing the blister test.
96
blister becomes unstable and propagates along the interface with increasing diameter. To obtain
adhesion values, either as maximum stress or bonding energy (work of adhesion), both the height
and diameter of the blister must be monitored using microscopy or interferometry. Unfortunately
the surface of the porous cellulose acetate is difficult to image since it wets during fluid application
on the backside and becomes transparent. The porosity of the cellulose acetate membranes causes
the pores to be filled up with liquid
Advantages of the blister test over other methods include: (1) no direct mechanical contact to film
that can affect debonding, (2) small detachment angles and low debonding rates minimize the
energy dissipative effect of the film, and (3) the applied forces are uniform and symmetric without
requiring any force alignment.
4.1.3. Factors that affect adhesion
4.1.3.1. Molecular weight
Molecular weight is an important factor affecting the mechanical properties of a polymer film. The
adhesion between a polymer and substrate often shows a maximum as a function of the number of
intermingling chains or density of ‘stickers’ along a chain. Low molecular weight, uncrosslinked
glassy and semi-crystalline polymers, such as cellulose acetate, tend to be very brittle. Cohesive
failure for these low molecular weight polymers normally occurs by chain scission or pullout with
little deformation. As the molecular weight increases, the toughness and tensile strength increases
rapidly as craze and yield zones begin to form and dissipate energy close to a crack or debond area.
The higher the molecular weight, the higher the viscosity.
4.1.3.2. Internal film stresses
Internal residual stresses in films are forces that counteract adhesion. These result from the
inability of coatings to shrink as they form films on rigid substrates. When a coating adheres to a
rigid substrate, shrinkage (after solidification) can only occur in the thickness direction. Frustration
of in-plane shrinkage leads to a tensile stress. These stresses occur for many different reasons such
as varying thermal expansion coefficients between a film and substrate as well as evaporation of a
solvent from a film. Stresses can result not just from volume contractions, but also from volume
expansions such as swelling of films during exposure to high humidity and water immersion [189].
97
In addition to biaxial in-plane stress (which acts normal to a cross-section of the coating), peeling
and interface stress are also present in a solidified coating. Peeling stresses act in a direction normal
to the plane of the substrate, while interface stresses act at the coating and substrate interface.
Excessive stress is a major concern with regard to film coating performance and quality because
defects such as peeling, curling, cracking, crazing, rippling, buckling, and bending often occur to
relieve that stress. For example, if the local stress exceeds the local cohesive strength of a coating,
the result is cracking. Good adhesion can be obtained if the interface can sustain sufficient stress
to induce dissipative forms of deformation such as flow, yield, or crazing, in the polymer.
Residual stresses can also cause other problems such as hillock and void formation, variation in
grain size, and film delamination. In addition, nonuniform films that have defects or imperfections
can lead to localized stresses that adversely effect adhesion [10]. Localized imperfections result in
greater stress and greater probability of crack formation. If the crack propagates to the coating-
substrate interface, stress concentration can cause the film to delaminate.
In one example, the drying of cellulose acetate (CA) coatings cast in acetone, final stress increased
from 10 to 45 MPa as coating thickness decreased from 60 to 10 µm [179]. This thickness
dependent coating stress for a solvent-cast polymer coating is attributed to (1) less shrinkage in
thicker coatings due to more trapped solvent (from skinning) and (2) greater amounts of polymer
stress relaxation in thicker coatings. For porous cellulose acetate coatings prepared by dry-cast
phase separation, Vaessen et al. showed that final in-plane stress ranged from 20 MPa for coatings
with small pores (~1µm) to 5 MPa for coatings containing small pores and macrovoids (~200 µm).
4.1.3.3. Wetting
A liquid spreads spontaneously on a substrate if the surface tension of the liquid is lower than the
surface free energy of the solid. Wetting is a major factor for forming uniform, adhered coatings
on substrates. If the film coating does not spread over a substrate so that there is intermolecular
contact between the substrate and the coating, there cannot be interactions and hence no adhesion
between the film and the substrate.
If a coating has a relatively high surface tension and is applied to a substrate that has a
comparatively low surface energy, the coating will not wet the substrate. Mechanical forces, such
98
as centrifugal forces, may spread the coating on the substrate surface, but since the surface is not
wetted, surface tension forces draw the liquid coating toward a spherical shape. As this occurs,
solvent is evaporating, causing viscosity to increase so that before the coating forms a sphere the
liquid essentially stops. This results in an uneven film thickness with areas having little if any
coating next to areas that have an excessive film thickness, this is commonly called crawling.
4.2. Materials and Experimental Setup
4.2.1. Chemically modified substrates (GOPTS, APTES, and OTS)
Experiments were performed with three different silane solutions:
• 1% solution of (3-glycidyloxypropyl)trimethoxysilane (GOPTS) (98%, Sigma-Aldrich, St. Louis, MO) in toluene (HPLC grade, Fisher Scientific, Pittsburgh, PA),
• 3% solution of 3-aminopropyltriethoxysilane (APTES) (95%, ACROS, Morris Plains, NJ) in acetone (extra dry, ACROS),
• 3% solution of octadecyltrichlorosilane (OTS) (90+%, Sigma-Alrich) in 2-proanol (anyhy-drous 99.5%, Sigma-Aldrich).
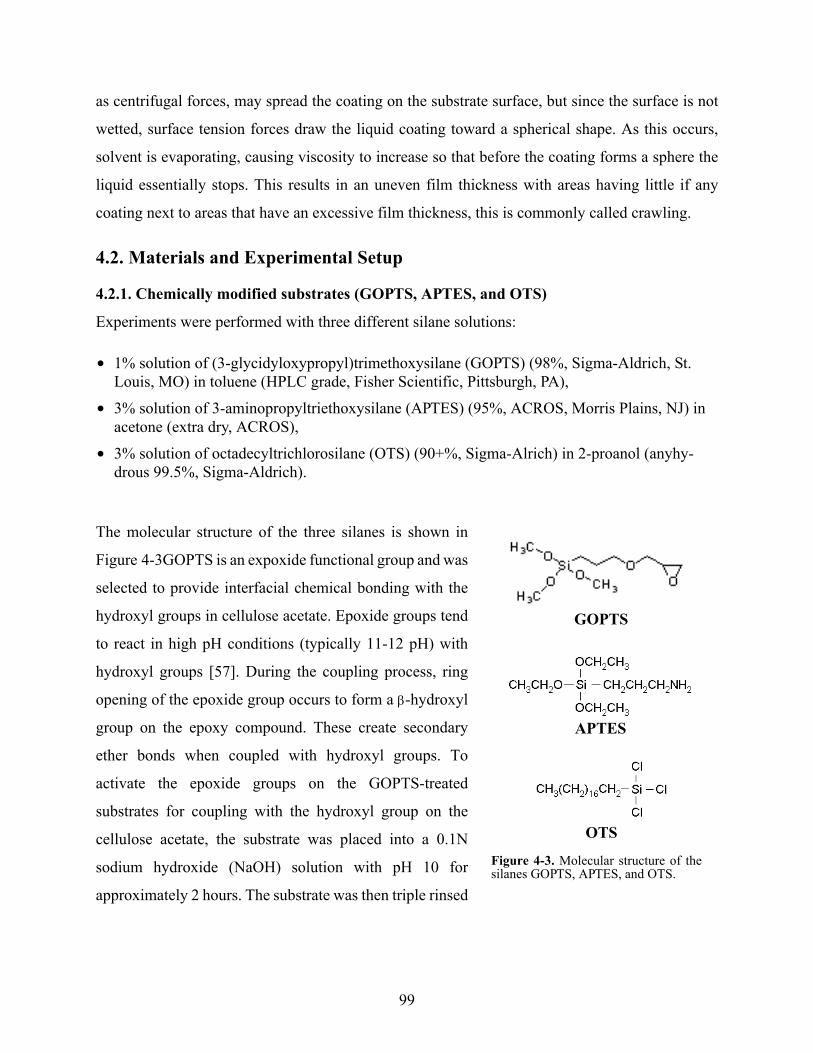
The molecular structure of the three silanes is shown in
Figure 4-3GOPTS is an expoxide functional group and was
selected to provide interfacial chemical bonding with the
hydroxyl groups in cellulose acetate. Epoxide groups tend
to react in high pH conditions (typically 11-12 pH) with
hydroxyl groups [57]. During the coupling process, ring
opening of the epoxide group occurs to form a β-hydroxyl
group on the epoxy compound. These create secondary
ether bonds when coupled with hydroxyl groups. To
activate the epoxide groups on the GOPTS-treated
substrates for coupling with the hydroxyl group on the
cellulose acetate, the substrate was placed into a 0.1N
sodium hydroxide (NaOH) solution with pH 10 for
approximately 2 hours. The substrate was then triple rinsed
GOPTS
APTES
OTS
Figure 4-3. Molecular structure of thesilanes GOPTS, APTES, and OTS.
99
with deionized water to remove any remaining NaOH. It was not possible to add NaOH to the
polymer lacquer since this hydrolyzed the cellulose acetate, causing it to precipitate out of solution.
The chlorosilane (OTS) reacts with the alcohol producing an alkoxylsilane and HCl acid. Mild
warming of the OTS solution was performed to promote completion of the reaction. Part of the HCl
acid reacts with the alcohol to produce small quantities of alkyl halide and water, causing the
formation of silanols from alkoxysilanes that can condense onto the substrate.
In order to prepare the substrates for chemical modification, silicon wafers with 1 µm of silicon
dioxide (Silicon Quest International, Santa Clara, CA) were treated in an oxygen plasma at 15 sccm
of O2, 0.230 mTorr pressure, and 100 W of platen power using a Technics PE-IIA/B RIE system.
This oxygen plasma removes any organics and oxidizes the surface of the silicon, providing a
native oxide layer that has numerous hydroxyl groups. Substrates were then placed in a convection
oven at 100°C to avoid any moisture condensation on the surface. Substrates were removed from
the oven and allowed to cool for 5 min. The silane solutions were then placed on the substrate and
incubated for 1 hour with OTS and APTES, while an incubation of 18 hours was performed with
GOPTS. All silane treatments were performed in a closed container to avoid solvent evaporation.
It was important to keep the fluidic interconnect made of poly(dimethylsiloxane) (PDMS) away
from any of the solvents since this polymer tended to swell if exposed. Afterwards, the substrates
were rinsed repeatedly with acetone, dried with nitrogen, and placed in a 100°C oven for 15
minutes.
4.2.2. Adhesion chip design
The polymer lacquer is coated over three different adhesion chip designs (the spanning criteria is
later discussed in this chapter) each being 1cm x 1cm in size as shown in Figure 4-4. Each design
has a different set of pressure openings that were used to apply pressure to the backside of the
cellulose acetate membrane. The first design consists of a grid hole pattern that has a varying
number of circular holes and either a silicon dioxide or platinum surface. These grid hole designs
either have 400 holes in a 20 x 20 array, each hole is 30 µm in diameter and is spaced 10 µm apart
as shown in the top of Figure 4-5 or have 9 holes in a 3 x 3 array, each hole is 30 µm in diameter
holes and is spaced 300 µm apart as shown in the bottom of Figure 4-5. The second design consists
of a set of 5 microchannels with spanning platinum microbridges as discussed in Chapter 3 and
100
shown in Figure 3-8. These platinum microbridges are 5 µm wide and are spaced 5 µm apart, with
the length of one microchannel set being 1500 µm. The smallest width and spacing is used to
guarantee that the polymer is supported by the microbridges during stresses caused by precipitation
and that it does not fill into the silicon microchannels.
4.2.3. Mechanically modified surfaces (Interlocking structures)
To determine whether mechanical interlocking structures can adhere cellulose acetate to the
inorganic silicon substrate, a series of silicon posts were fabricated alongside the pressure openings
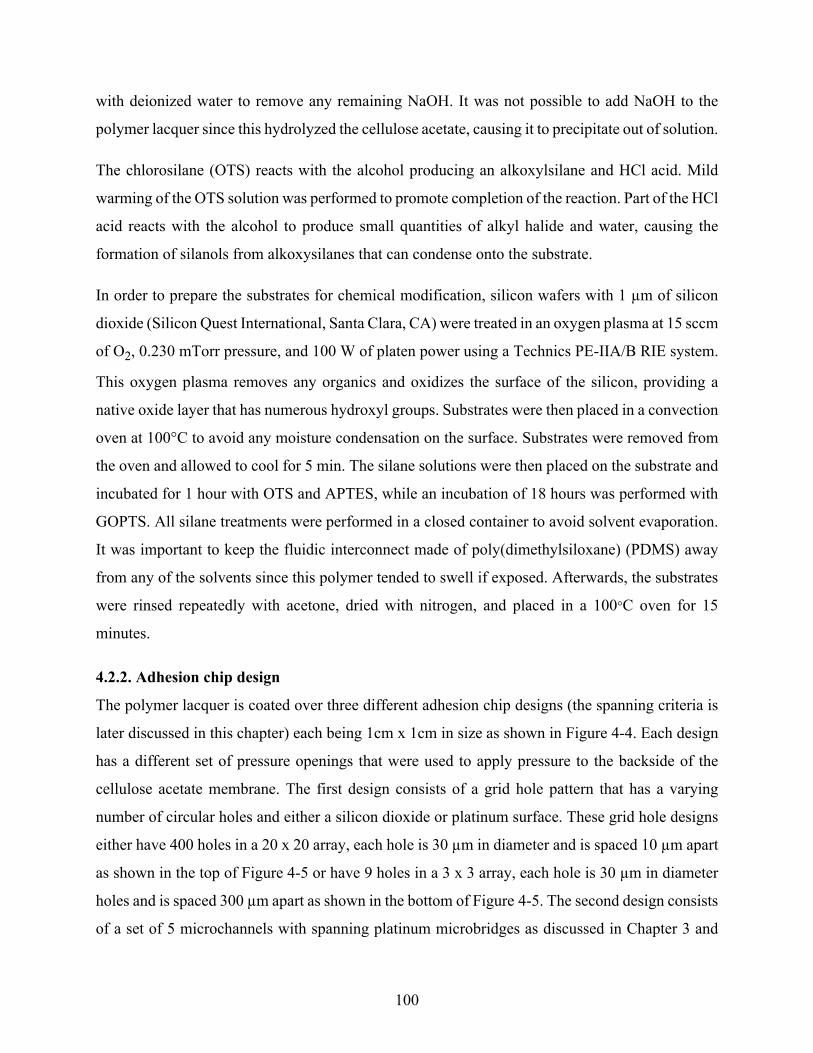
Figure 4-4. Photography from an optical micrograph showing an adhesion chip with the center grid hole designalong with some test structures at the four corners.
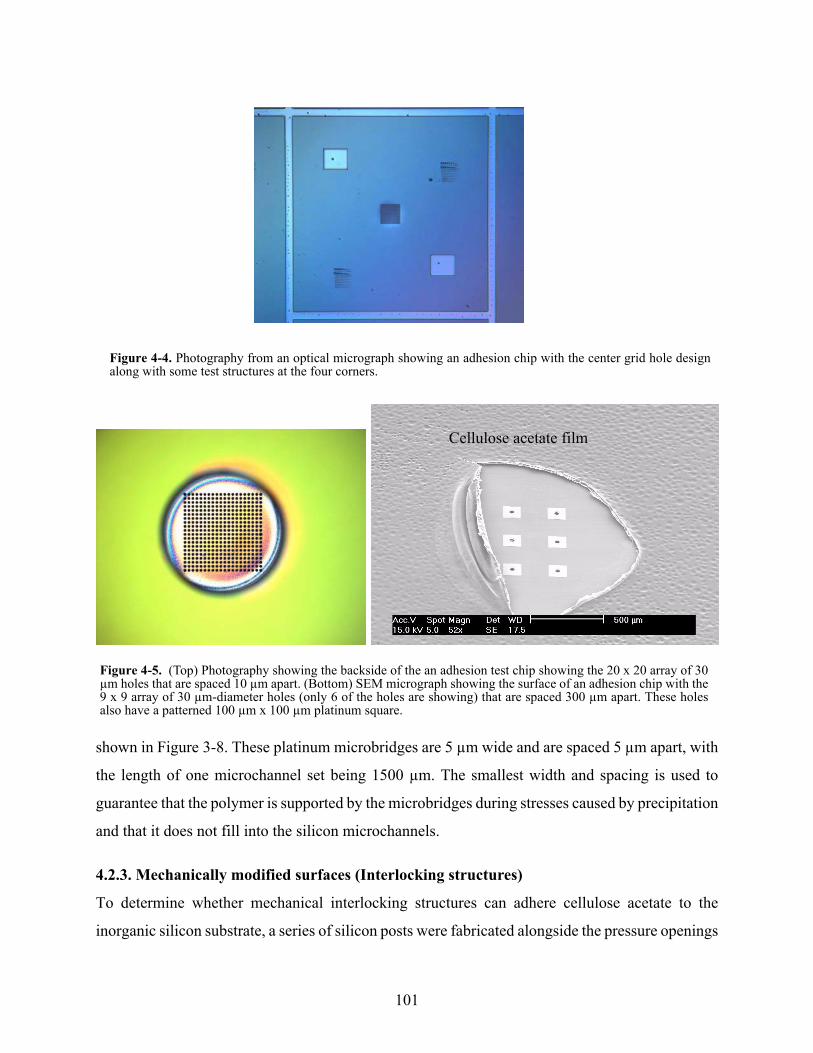
Figure 4-5. (Top) Photography showing the backside of the an adhesion test chip showing the 20 x 20 array of 30µm holes that are spaced 10 µm apart. (Bottom) SEM micrograph showing the surface of an adhesion chip with the9 x 9 array of 30 µm-diameter holes (only 6 of the holes are showing) that are spaced 300 µm apart. These holesalso have a patterned 100 µm x 100 µm platinum square.
Cellulose acetate film
101
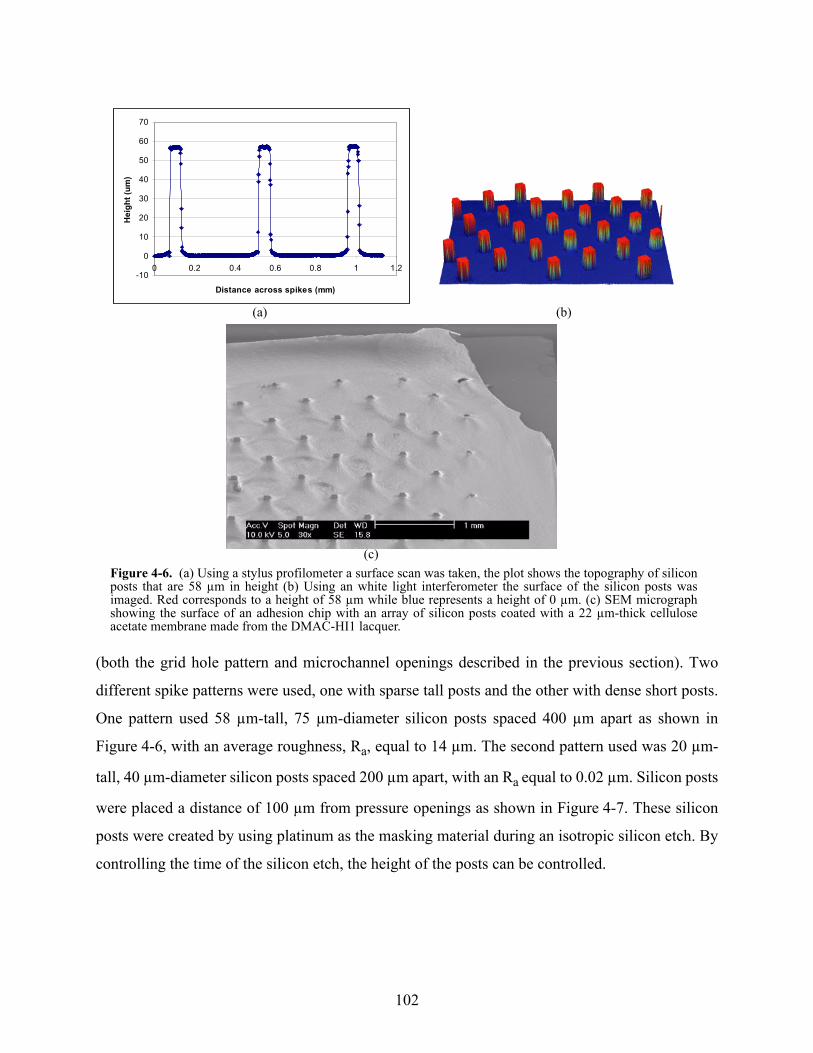
(both the grid hole pattern and microchannel openings described in the previous section). Two
different spike patterns were used, one with sparse tall posts and the other with dense short posts.
One pattern used 58 µm-tall, 75 µm-diameter silicon posts spaced 400 µm apart as shown in
Figure 4-6, with an average roughness, Ra, equal to 14 µm. The second pattern used was 20 µm-
tall, 40 µm-diameter silicon posts spaced 200 µm apart, with an Ra equal to 0.02 µm. Silicon posts
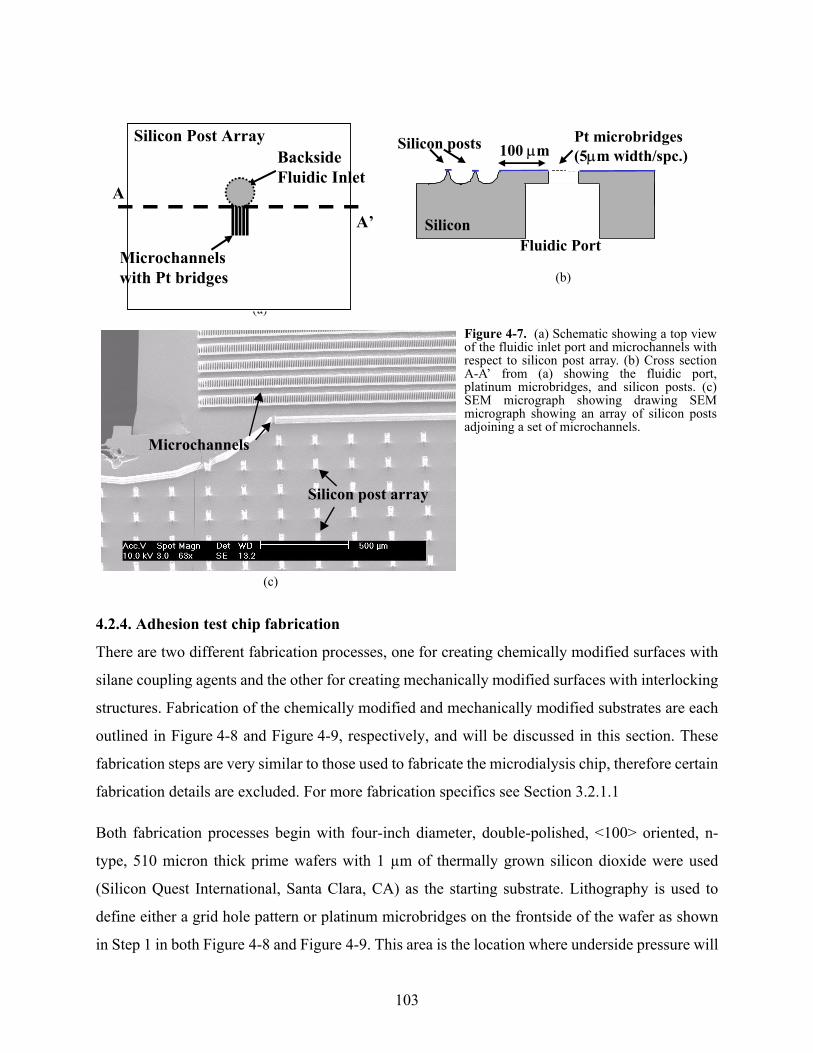
were placed a distance of 100 µm from pressure openings as shown in Figure 4-7. These silicon
posts were created by using platinum as the masking material during an isotropic silicon etch. By
controlling the time of the silicon etch, the height of the posts can be controlled.
-10
0
10
20
30
40
50
60
70
0 0.2 0.4 0.6 0.8 1 1.2
Distance across spikes (mm)
Hei
ght (
um)
Figure 4-6. (a) Using a stylus profilometer a surface scan was taken, the plot shows the topography of siliconposts that are 58 µm in height (b) Using an white light interferometer the surface of the silicon posts wasimaged. Red corresponds to a height of 58 µm while blue represents a height of 0 µm. (c) SEM micrographshowing the surface of an adhesion chip with an array of silicon posts coated with a 22 µm-thick celluloseacetate membrane made from the DMAC-HI1 lacquer.
(a) (b)
(c)
102
4.2.4. Adhesion test chip fabrication
There are two different fabrication processes, one for creating chemically modified surfaces with
silane coupling agents and the other for creating mechanically modified surfaces with interlocking
structures. Fabrication of the chemically modified and mechanically modified substrates are each
outlined in Figure 4-8 and Figure 4-9, respectively, and will be discussed in this section. These
fabrication steps are very similar to those used to fabricate the microdialysis chip, therefore certain
fabrication details are excluded. For more fabrication specifics see Section 3.2.1.1
Both fabrication processes begin with four-inch diameter, double-polished, <100> oriented, n-
type, 510 micron thick prime wafers with 1 µm of thermally grown silicon dioxide were used
(Silicon Quest International, Santa Clara, CA) as the starting substrate. Lithography is used to
define either a grid hole pattern or platinum microbridges on the frontside of the wafer as shown
in Step 1 in both Figure 4-8 and Figure 4-9. This area is the location where underside pressure will
Figure 4-7. (a) Schematic showing a top viewof the fluidic inlet port and microchannels withrespect to silicon post array. (b) Cross sectionA-A’ from (a) showing the fluidic port,platinum microbridges, and silicon posts. (c)SEM micrograph showing drawing SEMmicrograph showing an array of silicon postsadjoining a set of microchannels.
Microchannels
Silicon post array
(a)
(b)
(c)
Microchannels with Pt bridges
Backside Fluidic Inlet
Silicon Post Array
A
A’
Pt microbridges (5µm width/spc.)
Silicon
Silicon posts 100 µm
Fluidic Port
103
be applied to the cellulose acetate film. Mechanically modified substrates also have squares
patterned alongside this location as shown on the leftside of Step 1 in Figure 4-9, which will
eventually serve as a mask for silicon posts. To test the spanning capability of the lacquer, test
microchannels were also patterned as shown on the rightside of Step 1 in both Figure 4-8 and
Figure 4-9.
For adhesion chips with platinum microbridges, deposition and patterning of the platinum is
performed using lift-off as described in Section 3.2.1.1. Backside lithography was necessary to
pattern the area where the inlet port will be etched. This inlet port will apply fluidic pressure to the
backside of the cellulose acetate. A backside aligner (MA6, Karl Suss, Waterbury Center, VT) was
used to pattern a thick-film photoresist onto the wafer. The backside oxide layer was then patterned
using a wet silicon dioxide as shown in Step 2 in both Figure 4-8 and Figure 4-9.
Deep reactive ion etching (DRIE) (Surface Technology Systems, UK) was used to etch the silicon
on the wafer backside to create the fluidic inlet port as shown in Step 3 in both Figure 4-8 and
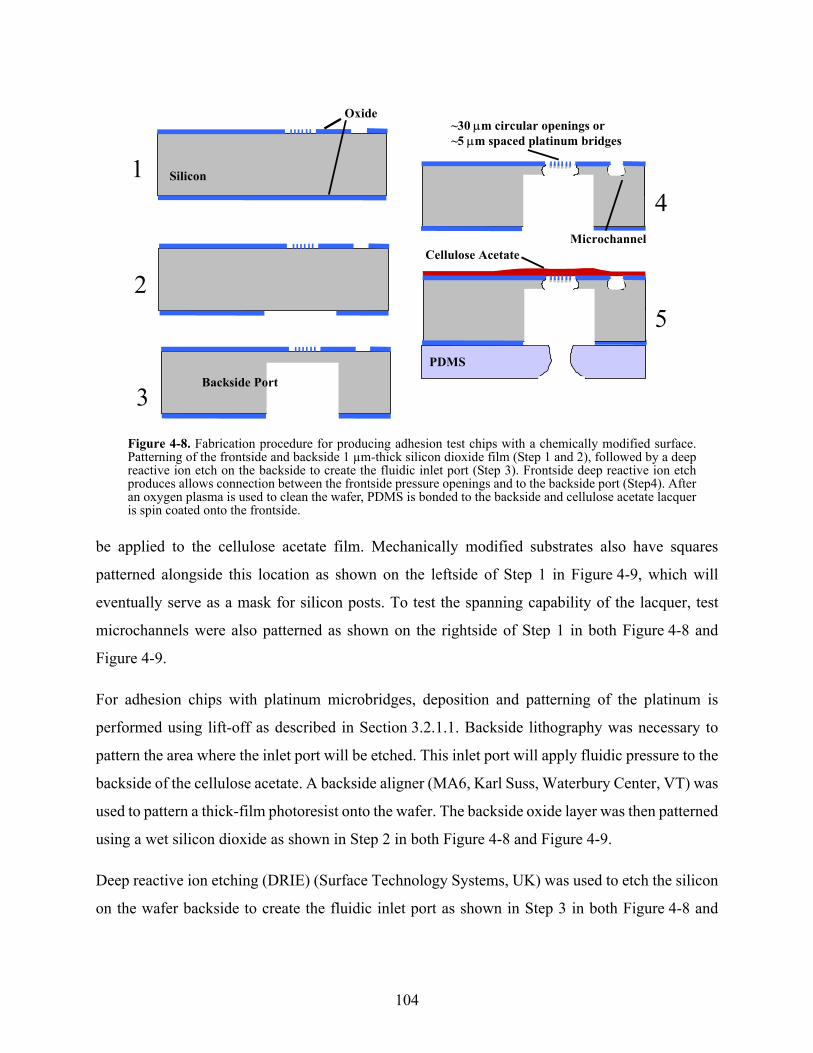
Figure 4-8. Fabrication procedure for producing adhesion test chips with a chemically modified surface.Patterning of the frontside and backside 1 µm-thick silicon dioxide film (Step 1 and 2), followed by a deepreactive ion etch on the backside to create the fluidic inlet port (Step 3). Frontside deep reactive ion etchproduces allows connection between the frontside pressure openings and to the backside port (Step4). Afteran oxygen plasma is used to clean the wafer, PDMS is bonded to the backside and cellulose acetate lacqueris spin coated onto the frontside.
Oxide
1
2
3
4
5
Microchannel
Silicon
PDMSBackside Port
~30 µm circular openings or ~5 µm spaced platinum bridges
Cellulose Acetate
104
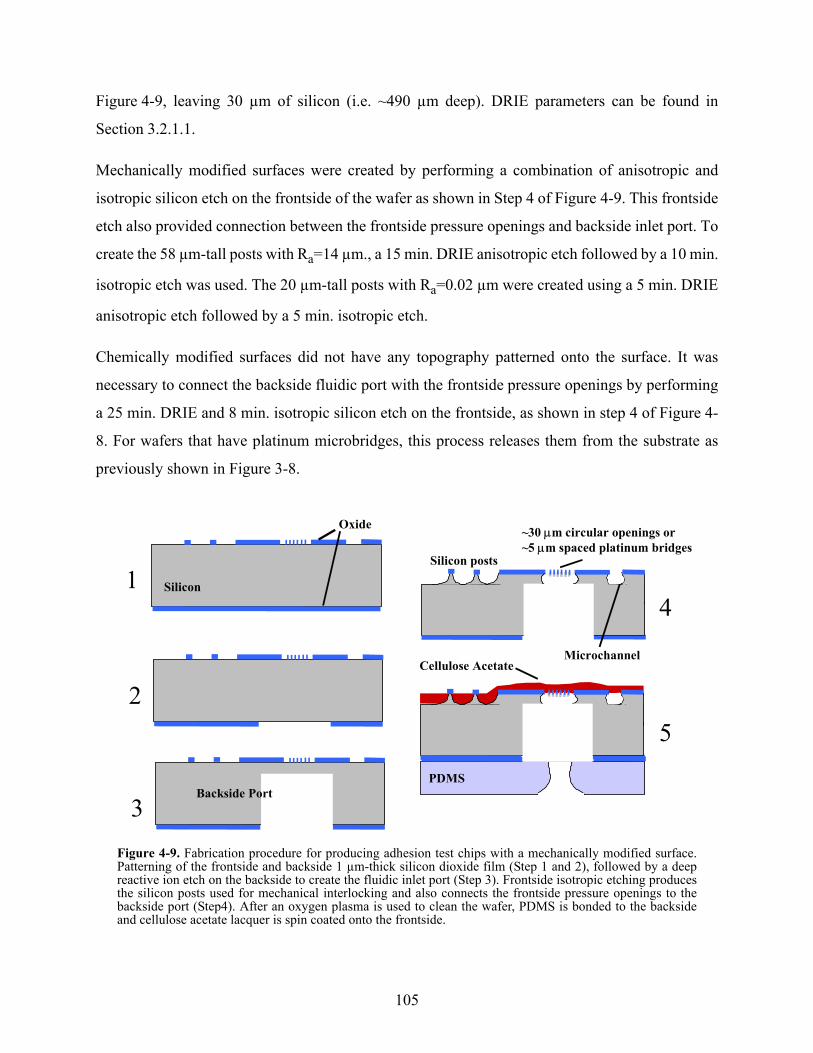
Figure 4-9, leaving 30 µm of silicon (i.e. ~490 µm deep). DRIE parameters can be found in
Section 3.2.1.1.
Mechanically modified surfaces were created by performing a combination of anisotropic and
isotropic silicon etch on the frontside of the wafer as shown in Step 4 of Figure 4-9. This frontside
etch also provided connection between the frontside pressure openings and backside inlet port. To
create the 58 µm-tall posts with Ra=14 µm., a 15 min. DRIE anisotropic etch followed by a 10 min.
isotropic etch was used. The 20 µm-tall posts with Ra=0.02 µm were created using a 5 min. DRIE
anisotropic etch followed by a 5 min. isotropic etch.
Chemically modified surfaces did not have any topography patterned onto the surface. It was
necessary to connect the backside fluidic port with the frontside pressure openings by performing
a 25 min. DRIE and 8 min. isotropic silicon etch on the frontside, as shown in step 4 of Figure 4-
8. For wafers that have platinum microbridges, this process releases them from the substrate as
previously shown in Figure 3-8.
Figure 4-9. Fabrication procedure for producing adhesion test chips with a mechanically modified surface.Patterning of the frontside and backside 1 µm-thick silicon dioxide film (Step 1 and 2), followed by a deepreactive ion etch on the backside to create the fluidic inlet port (Step 3). Frontside isotropic etching producesthe silicon posts used for mechanical interlocking and also connects the frontside pressure openings to thebackside port (Step4). After an oxygen plasma is used to clean the wafer, PDMS is bonded to the backsideand cellulose acetate lacquer is spin coated onto the frontside.
1
2
3
4
5
Silicon
PDMS
Oxide
Microchannel
~30 µm circular openings or ~5 µm spaced platinum bridges
Silicon posts
Cellulose Acetate
Backside Port
105
Wafers were then cleaved into 1 cm x 1 cm sized chips using a diamond scribe. To assist in the
cleaving, a 200 µm-wide boundary around the chips was patterned and etched during the frontside
silicon etching. This boundary allowed for easier fracturing of the silicon. Chips were dehydrated
at 100°C in a convection oven to remove any moisture from the surface. The backside silicon
surface and a PDMS sheet were cleaned and activated in an oxygen plasma chamber (PEIIA,
Technics RIE) for 10 min. and subsequently bonded to each other (step 5, Figure 4-8 and Figure 4-
9). The PDMS sheet has a hole punched into it to accommodate fluidic tubing that will apply the
backside fluidic pressure for the blister tests. The frontside of the substrates were then exposed to
an oxygen plasma for 10 min., removing organics from the surface and exposing hydroxyl groups.
For chemically modified surfaces, a silane coupling agent was used to modify the surface as
described in Section 4.2.1.
Five different polymer lacquers (DMAC-LO4, DMAC-HI1, DMAC-MIX1, ACET-HI1, ACET-
HI2) were spin coated onto the substrates at speeds from 1-4 kRPM and then immediately placed
in a deionized water bath. Lacquer compositions can be found in Table 2-3. After 2 hours in the
bath, the substrates were removed from the water and allowed to air dry over 6 hours. The film
adhesion was tested using a scratch pick initially. Subsequently, films were immersed in a
deionized water bath for 1-2 hrs to observe any delamination from the surface.
4.2.5. Blister test setup
Adhesion of the polymer to the substrate is quantified by using a blister test setup shown in
Figure 4-10. A syringe pump (CMA/102, CMA Microdialysis Inc, North Chelmsford, MA) set to
10 mL/min. provides increasing water pressure to the back of the polymer film. The pump has an
RS-232 connection allowing it to be plugged into a computer’s serial port. This allows the pump
to be controlled as well as provide flowrate and fluid volume output.
The chip is mounted onto a custom-made sample holder, which has four support legs about 1-inch
in height. This setup allows fluidic tubing to be connected to the backside of a chip as shown in
Figure 4-10. Two different pressure transducers were used to measure the inline pressure on the
tubing leading into the microdialysis chip. One pressure transducer (163PC, Honeywell,
Morristown, NJ) was for lower pressures reaching a maximum pressure rating of 11.77 kPa, with
a sensitivity of 3.67 V/kPA. The other pressure transducer (MPX2050, Freescale Semiconductor,
106
Austin, TX) was for higher pressures reaching a maximum pressure rating of 50kPa, with a
sensitivity of 0.80 mV/kPa. The sensors were calibrated by using a static fluid column as a standard
pressure source. By varying the height of the fluid in the column, different hydrostatic pressures
were attained. Using a measuring tape, the height of fluid column was measured while the output
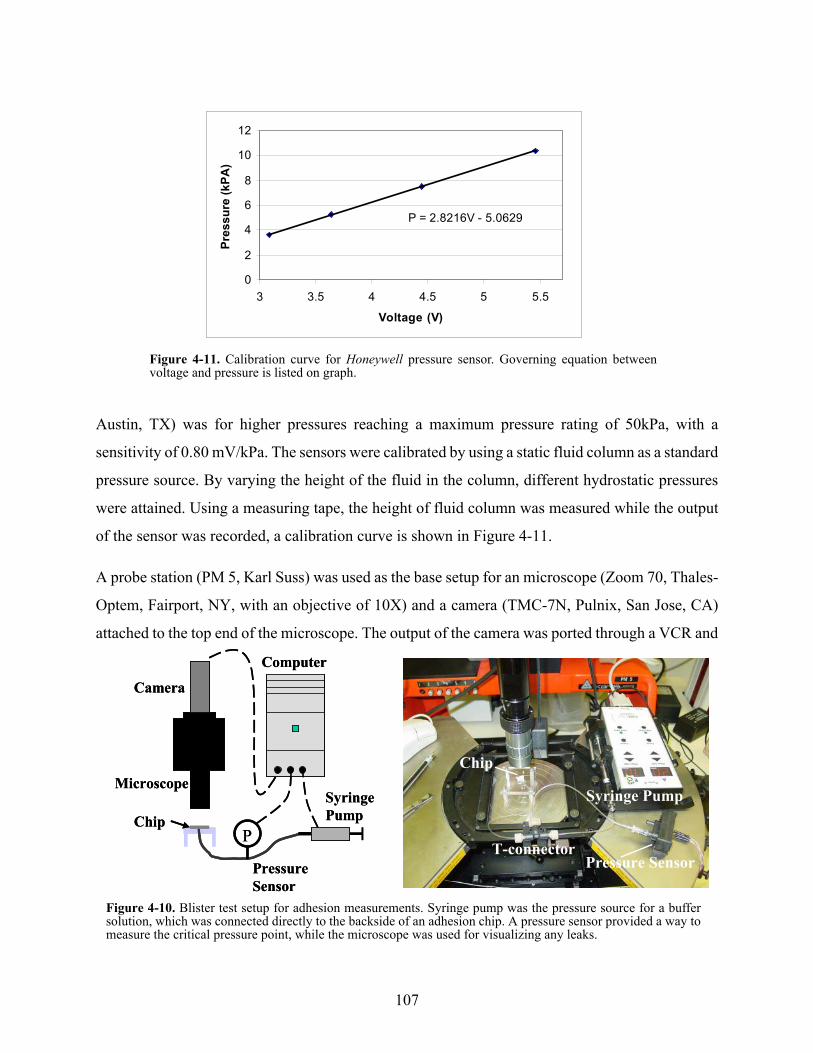
of the sensor was recorded, a calibration curve is shown in Figure 4-11.
A probe station (PM 5, Karl Suss) was used as the base setup for an microscope (Zoom 70, Thales-
Optem, Fairport, NY, with an objective of 10X) and a camera (TMC-7N, Pulnix, San Jose, CA)
attached to the top end of the microscope. The output of the camera was ported through a VCR and
P
Pressure Sensor
Chip
Camera
Microscope
Computer
Syringe Pump
P
Pressure Sensor
Chip
Camera
Microscope
Computer
Syringe Pump
Figure 4-10. Blister test setup for adhesion measurements. Syringe pump was the pressure source for a buffersolution, which was connected directly to the backside of an adhesion chip. A pressure sensor provided a way tomeasure the critical pressure point, while the microscope was used for visualizing any leaks.
Syringe Pump
Chip
Pressure SensorT-connector
Figure 4-11. Calibration curve for Honeywell pressure sensor. Governing equation betweenvoltage and pressure is listed on graph.
P = 2.8216V - 5.0629
0
2
4
6
8
10
12
3 3.5 4 4.5 5 5.5
Voltage (V)
Pres
sure
(kPA
)
107
then connected to a framegrabber (FlashBus MV Lite, Integral Technologies, Indianapolis, IN)
installed on a computer (Intel Pentium III, Intel Corp., Santa Clara, CA). The camera was used to
gauge the film delamination and fluid leaks.
The computer was running LabVIEW software (National Instruments, Austin, TX) along with a
data acquisition card (PCI-6023E, National Instruments). These were used to sample the pressure
transducers over a certain time period. Since Microsoft Windows is not a real-time operating
system, the LabVIEW code takes approximately 30 ms to complete one sample acquisition. Due
to this constraint the sampling rate needed to be set higher than 30 ms, therefore a sampling period
of 100 ms was used in the acquisition software.
Leak testing of the adhesion test setup was performed using adhesion chips coated with SU-8
epoxy film. SU-8 25 was spin coated at 2 kRPM to form a 17 µm-thick film that covered the
pressure openings. After softbaking the chip at 100°C, a hard, impervious film was formed
4.2.6. Adhesion chip and setup preparation
In order to avoid any trapped air bubbles, deionized water was pumped into all of the tubing that
connected the syringe pump, pressure sensor, and T-connector. The tubing that connects to the
sample chip was open to atmosphere as the syringe pump was flushed at 20 µL/min. After a visual
inspection determined that no bubbles were in the fluidic tubing, the tubing was connected to the
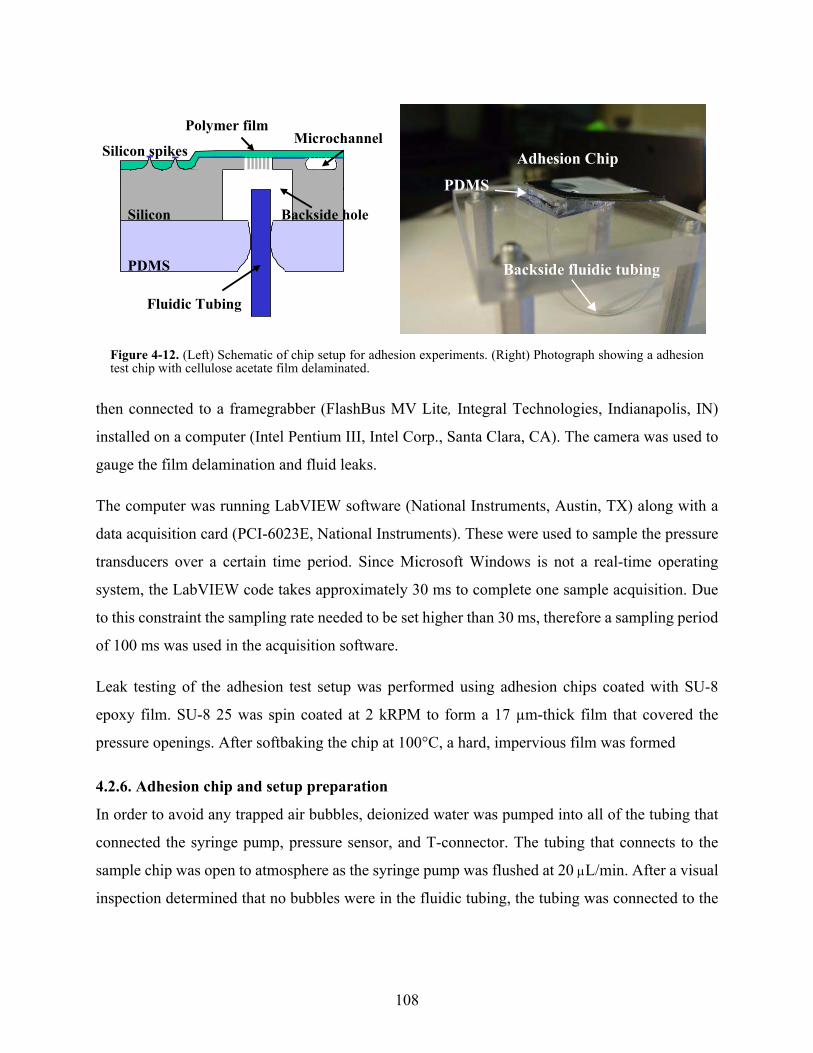
Figure 4-12. (Left) Schematic of chip setup for adhesion experiments. (Right) Photograph showing a adhesiontest chip with cellulose acetate film delaminated.
Polymer filmMicrochannel
Silicon spikes
PDMS
Backside holeSilicon
Fluidic Tubing
PDMS
Adhesion Chip
Backside fluidic tubing
108
backside of the adhesion chip as shown A schematic of the chip setup for the adhesion
measurements is shown in Figure 4-12.
A 4mm-thick PDMS layer, with a 1/16” circular hole punch, is bonded to the backside of the 1cm
x 1cm chip by first activating the surface with an oxygen plasma set to 100 W for 15 sec.
Fabrication of PDMS sheets is described in Chapter 3. The backside hole is approximately 1.5mm
in width.
In every experiment, a constant volumetric flow rate of 10µL/min was used to test film adhesion.
As the volume underneath the film fills up with fluid, the pressure reading from the sensor is
monitored to determine the point of debonding and leak formation. Pressure is recorded as a
function of time. Also, the surface of the film is recorded using video camera to observe any leaks
or cracks in the film.
4.3. Results and Discussion
4.3.1. Chemically modified surfaces
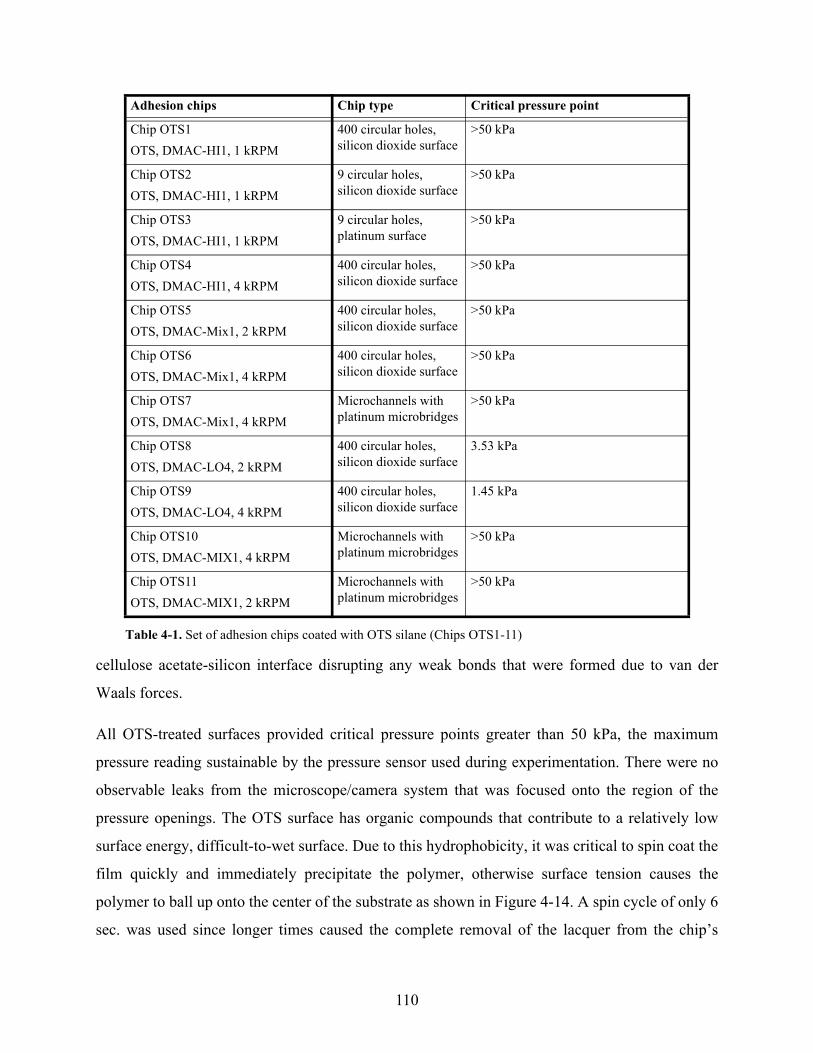
Of all the silane coupling agents OTS provided the best adhesion of cellulose acetate membranes
to a silicon substrate as shown in Table 4-1 and Table 4-2. APTES and GOPTS-treated surfaces
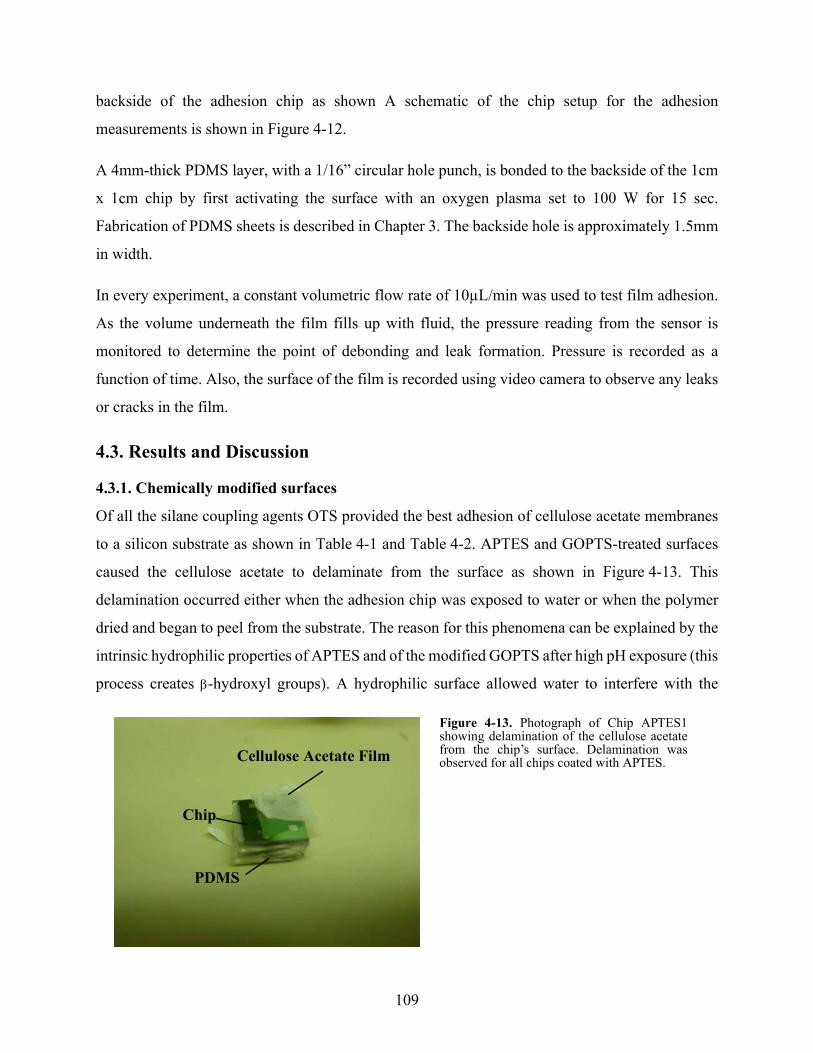
caused the cellulose acetate to delaminate from the surface as shown in Figure 4-13. This
delamination occurred either when the adhesion chip was exposed to water or when the polymer
dried and began to peel from the substrate. The reason for this phenomena can be explained by the
intrinsic hydrophilic properties of APTES and of the modified GOPTS after high pH exposure (this
process creates β-hydroxyl groups). A hydrophilic surface allowed water to interfere with the
Cellulose Acetate Film
PDMS
Chip
Figure 4-13. Photograph of Chip APTES1showing delamination of the cellulose acetatefrom the chip’s surface. Delamination wasobserved for all chips coated with APTES.
109
cellulose acetate-silicon interface disrupting any weak bonds that were formed due to van der
Waals forces.
All OTS-treated surfaces provided critical pressure points greater than 50 kPa, the maximum
pressure reading sustainable by the pressure sensor used during experimentation. There were no
observable leaks from the microscope/camera system that was focused onto the region of the
pressure openings. The OTS surface has organic compounds that contribute to a relatively low
surface energy, difficult-to-wet surface. Due to this hydrophobicity, it was critical to spin coat the
film quickly and immediately precipitate the polymer, otherwise surface tension causes the
polymer to ball up onto the center of the substrate as shown in Figure 4-14. A spin cycle of only 6
sec. was used since longer times caused the complete removal of the lacquer from the chip’s
Adhesion chips Chip type Critical pressure point
Chip OTS1OTS, DMAC-HI1, 1 kRPM
400 circular holes, silicon dioxide surface
>50 kPa
Chip OTS2OTS, DMAC-HI1, 1 kRPM
9 circular holes, silicon dioxide surface
>50 kPa
Chip OTS3OTS, DMAC-HI1, 1 kRPM
9 circular holes, platinum surface
>50 kPa
Chip OTS4OTS, DMAC-HI1, 4 kRPM
400 circular holes, silicon dioxide surface
>50 kPa
Chip OTS5OTS, DMAC-Mix1, 2 kRPM
400 circular holes, silicon dioxide surface
>50 kPa
Chip OTS6OTS, DMAC-Mix1, 4 kRPM
400 circular holes, silicon dioxide surface
>50 kPa
Chip OTS7OTS, DMAC-Mix1, 4 kRPM
Microchannels with platinum microbridges
>50 kPa
Chip OTS8OTS, DMAC-LO4, 2 kRPM
400 circular holes, silicon dioxide surface
3.53 kPa
Chip OTS9OTS, DMAC-LO4, 4 kRPM
400 circular holes, silicon dioxide surface
1.45 kPa
Chip OTS10OTS, DMAC-MIX1, 4 kRPM
Microchannels with platinum microbridges
>50 kPa
Chip OTS11OTS, DMAC-MIX1, 2 kRPM
Microchannels with platinum microbridges
>50 kPa
Table 4-1. Set of adhesion chips coated with OTS silane (Chips OTS1-11)
110
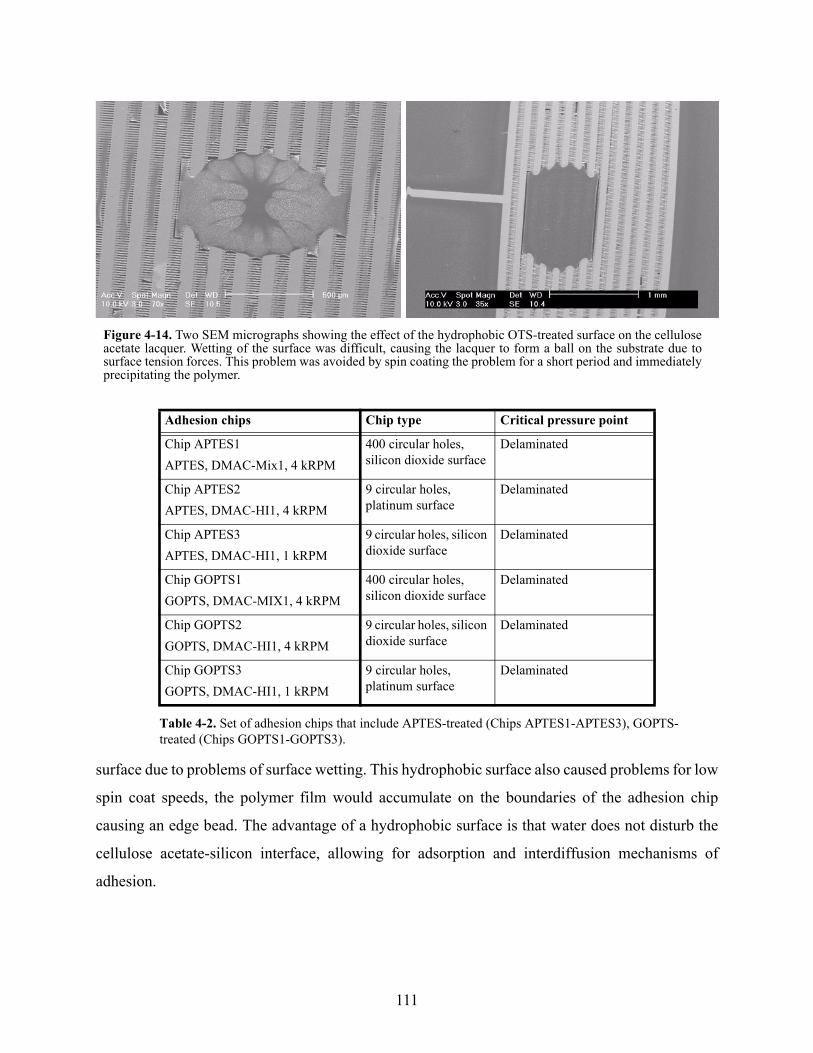
surface due to problems of surface wetting. This hydrophobic surface also caused problems for low
spin coat speeds, the polymer film would accumulate on the boundaries of the adhesion chip
causing an edge bead. The advantage of a hydrophobic surface is that water does not disturb the
cellulose acetate-silicon interface, allowing for adsorption and interdiffusion mechanisms of
adhesion.
Adhesion chips Chip type Critical pressure point
Chip APTES1APTES, DMAC-Mix1, 4 kRPM
400 circular holes, silicon dioxide surface
Delaminated
Chip APTES2APTES, DMAC-HI1, 4 kRPM
9 circular holes, platinum surface
Delaminated
Chip APTES3APTES, DMAC-HI1, 1 kRPM
9 circular holes, silicon dioxide surface
Delaminated
Chip GOPTS1GOPTS, DMAC-MIX1, 4 kRPM
400 circular holes, silicon dioxide surface
Delaminated
Chip GOPTS2GOPTS, DMAC-HI1, 4 kRPM
9 circular holes, silicon dioxide surface
Delaminated
Chip GOPTS3GOPTS, DMAC-HI1, 1 kRPM
9 circular holes, platinum surface
Delaminated
Table 4-2. Set of adhesion chips that include APTES-treated (Chips APTES1-APTES3), GOPTS-treated (Chips GOPTS1-GOPTS3).
Figure 4-14. Two SEM micrographs showing the effect of the hydrophobic OTS-treated surface on the celluloseacetate lacquer. Wetting of the surface was difficult, causing the lacquer to form a ball on the substrate due tosurface tension forces. This problem was avoided by spin coating the problem for a short period and immediatelyprecipitating the polymer.
111
All lacquers, except lacquer DMAC-LO4, adhered to OTS-treated substrates. DMAC-LO4 is made
with low molecular weight cellulose acetate. This lacquers did not provide sufficient adhesion, as
these membranes tended to become brittle and lose mechanical integrity. High molecular weight
cellulose acetate allowed for more interdiffusion and intermingling between the longer polymer
chains and the 18-carbon self-assembled monolayer created by the OTS.
No difference was observed between the different adhesion chips with varying pressure opening
designs. Both large or small number of circular holes, silicon dioxide and platinum surfaces,
provided greater than 50 kPa critical pressure values. In addition, no difference was observed
between different thickness films based on controlling the spin speed.
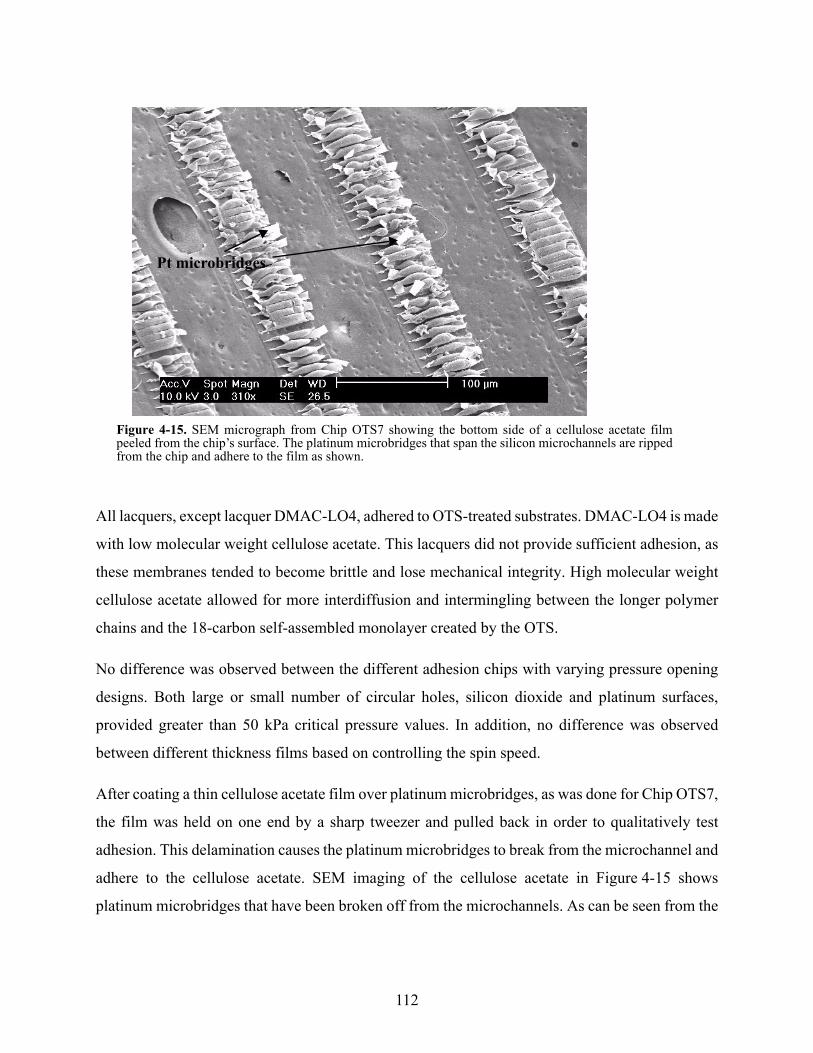
After coating a thin cellulose acetate film over platinum microbridges, as was done for Chip OTS7,
the film was held on one end by a sharp tweezer and pulled back in order to qualitatively test
adhesion. This delamination causes the platinum microbridges to break from the microchannel and
adhere to the cellulose acetate. SEM imaging of the cellulose acetate in Figure 4-15 shows
platinum microbridges that have been broken off from the microchannels. As can be seen from the
Figure 4-15. SEM micrograph from Chip OTS7 showing the bottom side of a cellulose acetate filmpeeled from the chip’s surface. The platinum microbridges that span the silicon microchannels are rippedfrom the chip and adhere to the film as shown.
Pt microbridges
112
picture, the cellulose not only spans across the gaps between the microbridges but forms a strong
bond by wrapping around them.
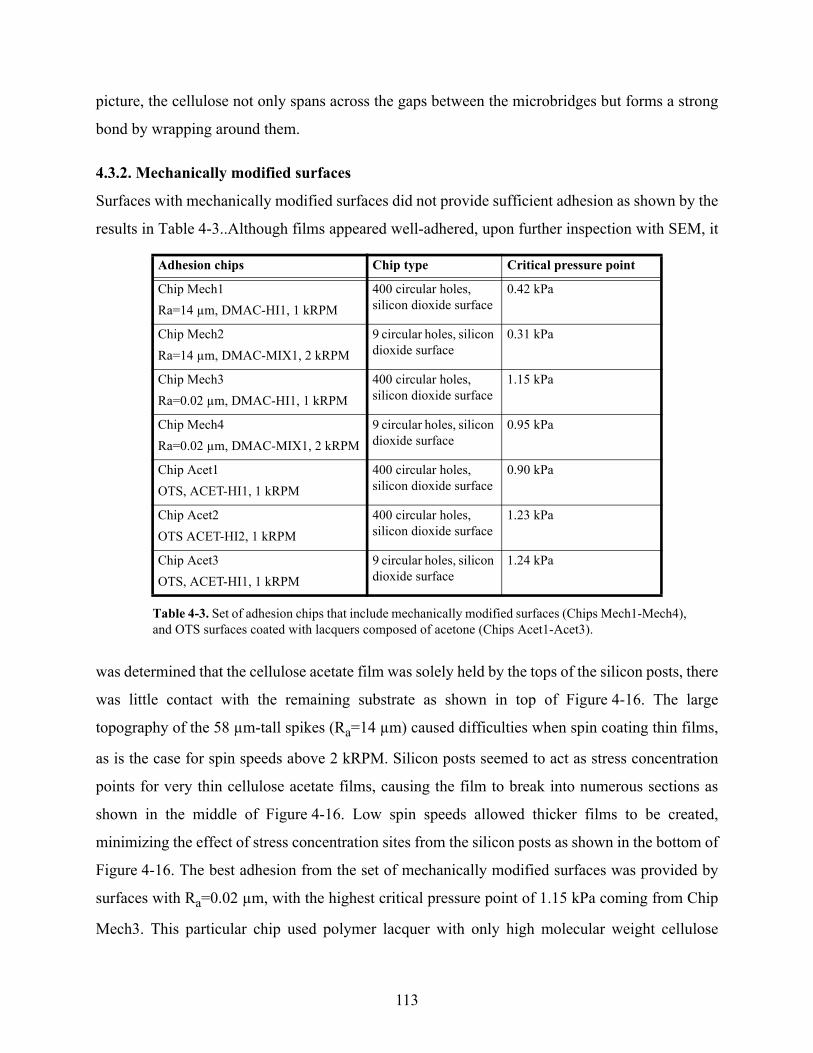
4.3.2. Mechanically modified surfaces
Surfaces with mechanically modified surfaces did not provide sufficient adhesion as shown by the
results in Table 4-3..Although films appeared well-adhered, upon further inspection with SEM, it
was determined that the cellulose acetate film was solely held by the tops of the silicon posts, there
was little contact with the remaining substrate as shown in top of Figure 4-16. The large
topography of the 58 µm-tall spikes (Ra=14 µm) caused difficulties when spin coating thin films,
as is the case for spin speeds above 2 kRPM. Silicon posts seemed to act as stress concentration
points for very thin cellulose acetate films, causing the film to break into numerous sections as
shown in the middle of Figure 4-16. Low spin speeds allowed thicker films to be created,
minimizing the effect of stress concentration sites from the silicon posts as shown in the bottom of
Figure 4-16. The best adhesion from the set of mechanically modified surfaces was provided by
surfaces with Ra=0.02 µm, with the highest critical pressure point of 1.15 kPa coming from Chip
Mech3. This particular chip used polymer lacquer with only high molecular weight cellulose
Adhesion chips Chip type Critical pressure point
Chip Mech1Ra=14 µm, DMAC-HI1, 1 kRPM
400 circular holes, silicon dioxide surface
0.42 kPa
Chip Mech2Ra=14 µm, DMAC-MIX1, 2 kRPM
9 circular holes, silicon dioxide surface
0.31 kPa
Chip Mech3Ra=0.02 µm, DMAC-HI1, 1 kRPM
400 circular holes, silicon dioxide surface
1.15 kPa
Chip Mech4Ra=0.02 µm, DMAC-MIX1, 2 kRPM
9 circular holes, silicon dioxide surface
0.95 kPa
Chip Acet1OTS, ACET-HI1, 1 kRPM
400 circular holes, silicon dioxide surface
0.90 kPa
Chip Acet2OTS ACET-HI2, 1 kRPM
400 circular holes, silicon dioxide surface
1.23 kPa
Chip Acet3OTS, ACET-HI1, 1 kRPM
9 circular holes, silicon dioxide surface
1.24 kPa
Table 4-3. Set of adhesion chips that include mechanically modified surfaces (Chips Mech1-Mech4), and OTS surfaces coated with lacquers composed of acetone (Chips Acet1-Acet3).
113
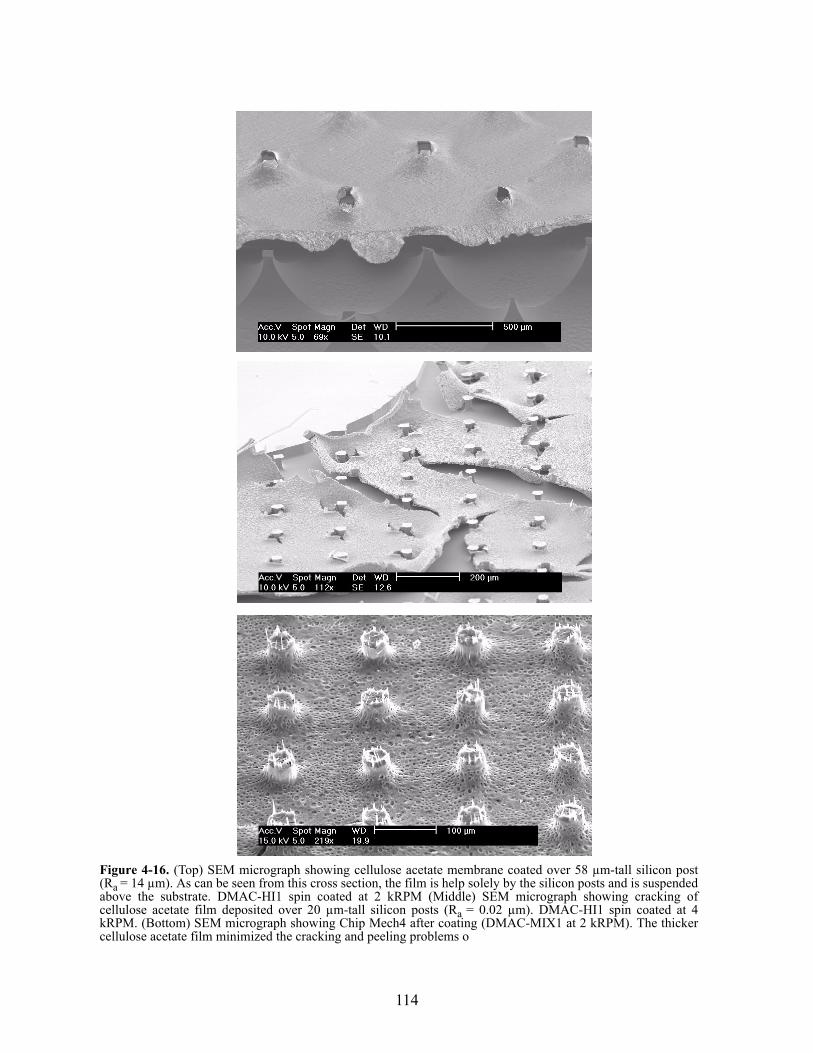
Figure 4-16. (Top) SEM micrograph showing cellulose acetate membrane coated over 58 µm-tall silicon post(Ra = 14 µm). As can be seen from this cross section, the film is help solely by the silicon posts and is suspendedabove the substrate. DMAC-HI1 spin coated at 2 kRPM (Middle) SEM micrograph showing cracking ofcellulose acetate film deposited over 20 µm-tall silicon posts (Ra = 0.02 µm). DMAC-HI1 spin coated at 4kRPM. (Bottom) SEM micrograph showing Chip Mech4 after coating (DMAC-MIX1 at 2 kRPM). The thickercellulose acetate film minimized the cracking and peeling problems o
114
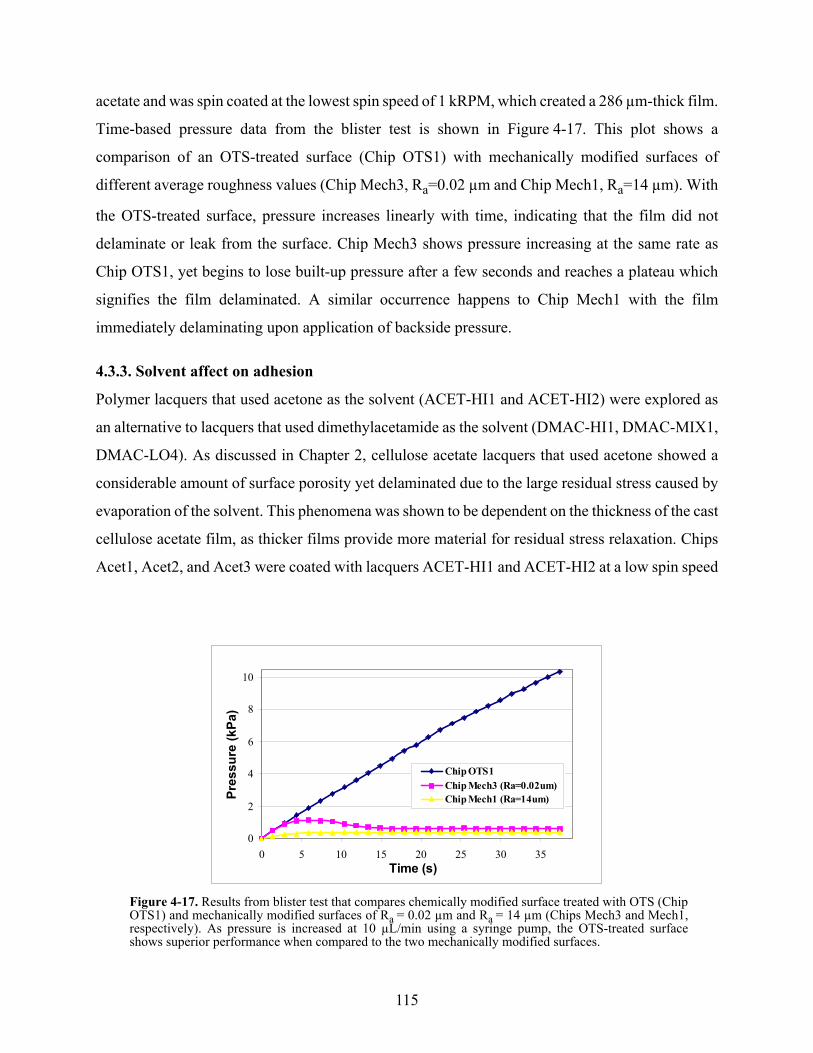
acetate and was spin coated at the lowest spin speed of 1 kRPM, which created a 286 µm-thick film.
Time-based pressure data from the blister test is shown in Figure 4-17. This plot shows a
comparison of an OTS-treated surface (Chip OTS1) with mechanically modified surfaces of
different average roughness values (Chip Mech3, Ra=0.02 µm and Chip Mech1, Ra=14 µm). With
the OTS-treated surface, pressure increases linearly with time, indicating that the film did not
delaminate or leak from the surface. Chip Mech3 shows pressure increasing at the same rate as
Chip OTS1, yet begins to lose built-up pressure after a few seconds and reaches a plateau which
signifies the film delaminated. A similar occurrence happens to Chip Mech1 with the film
immediately delaminating upon application of backside pressure.
4.3.3. Solvent affect on adhesion
Polymer lacquers that used acetone as the solvent (ACET-HI1 and ACET-HI2) were explored as
an alternative to lacquers that used dimethylacetamide as the solvent (DMAC-HI1, DMAC-MIX1,
DMAC-LO4). As discussed in Chapter 2, cellulose acetate lacquers that used acetone showed a
considerable amount of surface porosity yet delaminated due to the large residual stress caused by
evaporation of the solvent. This phenomena was shown to be dependent on the thickness of the cast
cellulose acetate film, as thicker films provide more material for residual stress relaxation. Chips
Acet1, Acet2, and Acet3 were coated with lacquers ACET-HI1 and ACET-HI2 at a low spin speed
Figure 4-17. Results from blister test that compares chemically modified surface treated with OTS (ChipOTS1) and mechanically modified surfaces of Ra = 0.02 µm and Ra = 14 µm (Chips Mech3 and Mech1,respectively). As pressure is increased at 10 µL/min using a syringe pump, the OTS-treated surfaceshows superior performance when compared to the two mechanically modified surfaces.
0
2
4
6
8
10
0 5 10 15 20 25 30 35Time (s)
Pres
sure
(kPa
)
Chip OTS1Chip Mech3 (Ra=0.02um)Chip Mech1 (Ra=14um)
115
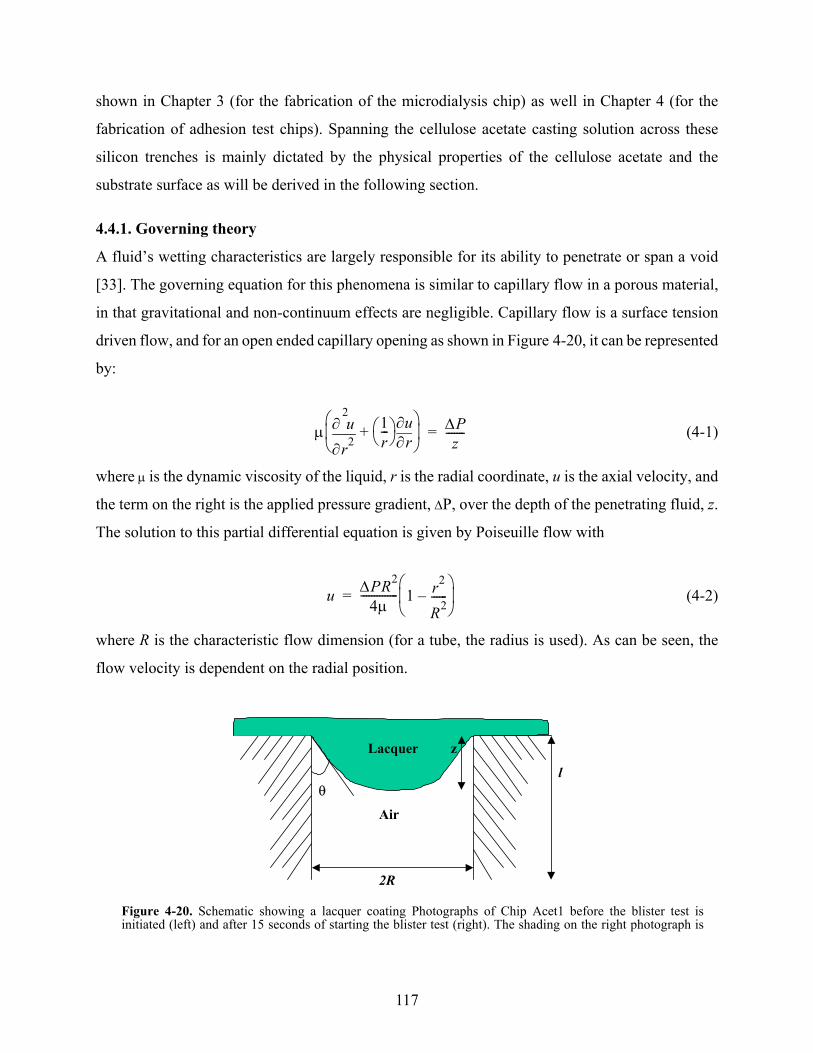
of 1 kRPM. As pressure increased the film began to immediately leak upon observation through
the microscope as shown in Figure 4-19.
4.4. Membrane spanning and polymer characterizationSpanning of cellulose acetate membranes over cavities was previously demonstrated by Russo et
al. [151, 152]. Thin silicon nitride windows with etched openings were used to support a porous
cellulose acetate membrane created using immersion precipitation techniques, with a molecular
weight cut-off of 350 Da. Similarly in this thesis a cellulose acetate lacquer is spanned over etched
silicon trenches that contain platinum microbridges, creating the roof for fluidic microchannels as
-0.2
0
0.2
0.4
0.6
0.8
1
0 10 20 30 40 50
Time (s)
Pres
sure
(kPa
)
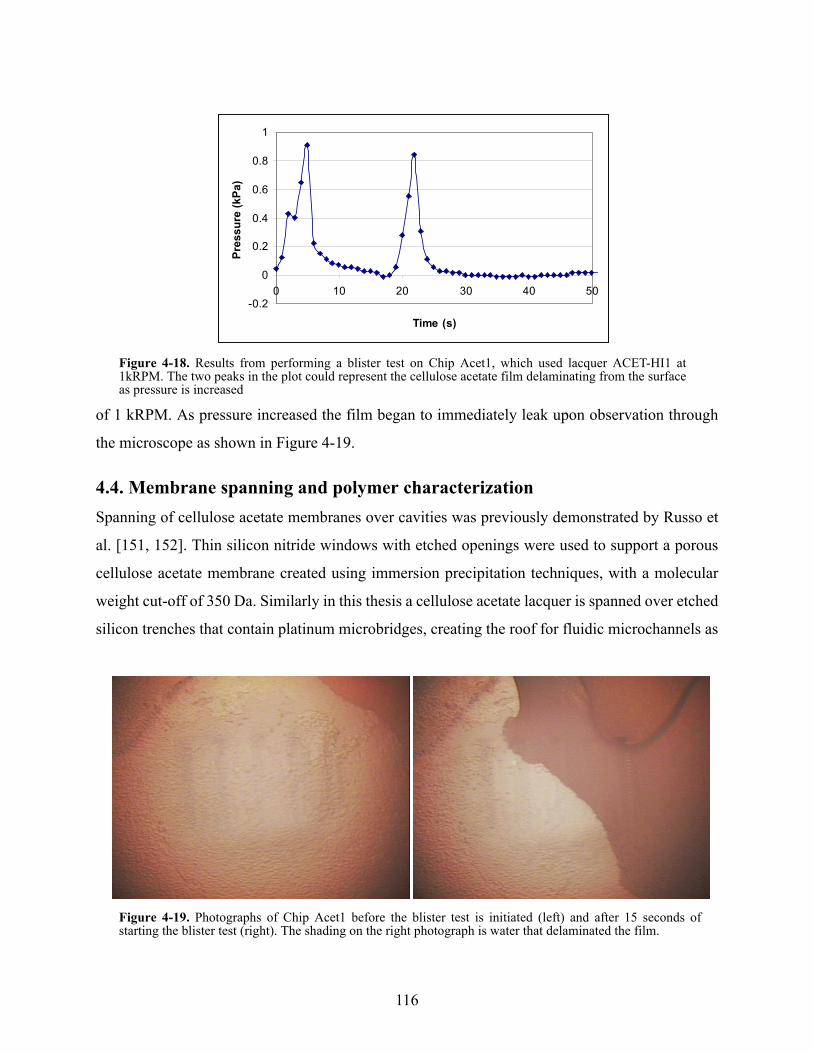
Figure 4-18. Results from performing a blister test on Chip Acet1, which used lacquer ACET-HI1 at1kRPM. The two peaks in the plot could represent the cellulose acetate film delaminating from the surfaceas pressure is increased
Figure 4-19. Photographs of Chip Acet1 before the blister test is initiated (left) and after 15 seconds ofstarting the blister test (right). The shading on the right photograph is water that delaminated the film.
116
shown in Chapter 3 (for the fabrication of the microdialysis chip) as well in Chapter 4 (for the
fabrication of adhesion test chips). Spanning the cellulose acetate casting solution across these
silicon trenches is mainly dictated by the physical properties of the cellulose acetate and the
substrate surface as will be derived in the following section.
4.4.1. Governing theory
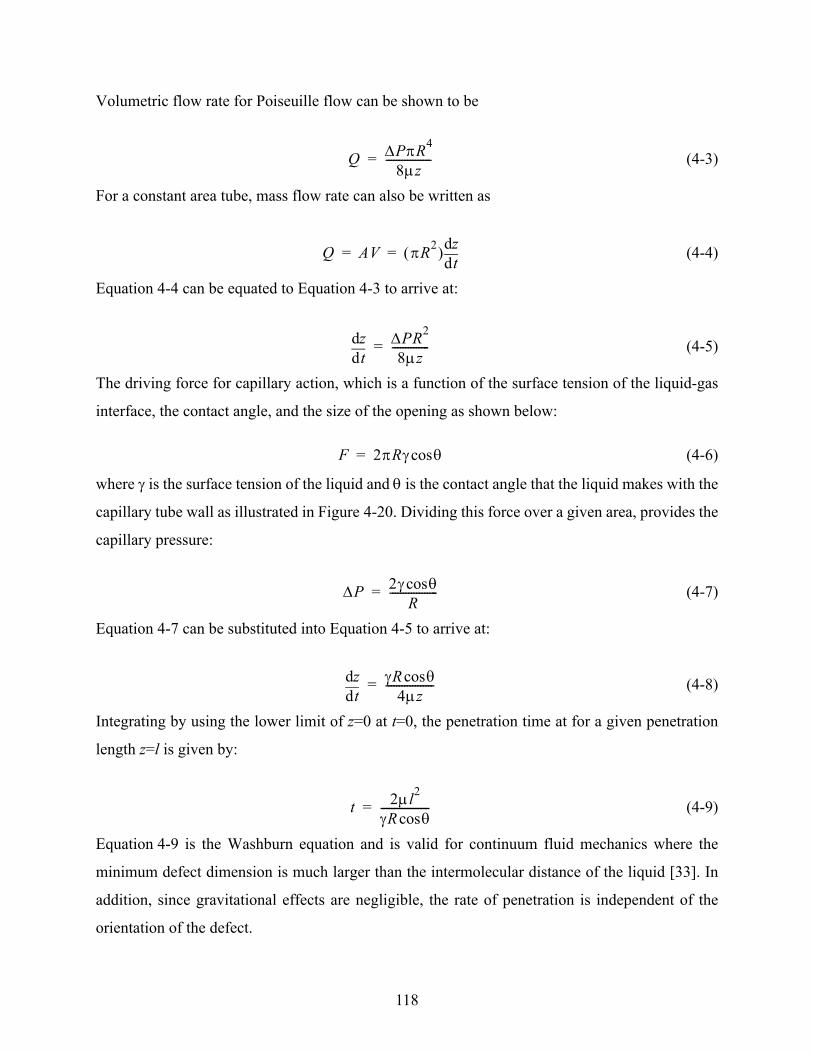
A fluid’s wetting characteristics are largely responsible for its ability to penetrate or span a void
[33]. The governing equation for this phenomena is similar to capillary flow in a porous material,
in that gravitational and non-continuum effects are negligible. Capillary flow is a surface tension
driven flow, and for an open ended capillary opening as shown in Figure 4-20, it can be represented
by:
(4-1)
where µ is the dynamic viscosity of the liquid, r is the radial coordinate, u is the axial velocity, and
the term on the right is the applied pressure gradient, ∆P, over the depth of the penetrating fluid, z.
The solution to this partial differential equation is given by Poiseuille flow with
(4-2)
where R is the characteristic flow dimension (for a tube, the radius is used). As can be seen, the
flow velocity is dependent on the radial position.
2R
θ
z
l
Air
Lacquer
Figure 4-20. Schematic showing a lacquer coating Photographs of Chip Acet1 before the blister test isinitiated (left) and after 15 seconds of starting the blister test (right). The shading on the right photograph is
µr2
2
∂
∂ u 1r---
r∂
∂u+ ∆P
z-------=
u ∆PR2
4µ-------------- 1 r2
R2------–
=
117
Volumetric flow rate for Poiseuille flow can be shown to be
(4-3)
For a constant area tube, mass flow rate can also be written as
(4-4)
Equation 4-4 can be equated to Equation 4-3 to arrive at:
(4-5)
The driving force for capillary action, which is a function of the surface tension of the liquid-gas
interface, the contact angle, and the size of the opening as shown below:
(4-6)
where γ is the surface tension of the liquid and θ is the contact angle that the liquid makes with the
capillary tube wall as illustrated in Figure 4-20. Dividing this force over a given area, provides the
capillary pressure:
(4-7)
Equation 4-7 can be substituted into Equation 4-5 to arrive at:
(4-8)
Integrating by using the lower limit of z=0 at t=0, the penetration time at for a given penetration
length z=l is given by:
(4-9)
Equation 4-9 is the Washburn equation and is valid for continuum fluid mechanics where the
minimum defect dimension is much larger than the intermolecular distance of the liquid [33]. In
addition, since gravitational effects are negligible, the rate of penetration is independent of the
orientation of the defect.
Q ∆PπR4
8µz-----------------=
Q AV πR2( ) tddz= =
tddz ∆PR2
8µz--------------=
F 2πRγ θcos=
∆P 2γ θcosR
------------------=
tddz γR θcos
4µz------------------=
t 2µl2
γR θcos------------------=
118
If the gravity force caused by the film weight above the opening is acting in the same direction as
capillary flow, it can be defined as:
(4-10)
whereρ is the density of the lacquer and g is the acceleration due to gravity equal to 9.8 m2/s. The
gravitational force is dependent on the amount of lacquer directly above the opening, which is
given by zπR2. If gravity was solely used to penetrate an opening, the penetration time is:
(4-11)
As can be seen from this equation, density of the lacquer decreases, it takes a longer time for the
lacquer to penetrate an opening. In addition the 1/R2 dependence of the gravity term means that as
the size of the opening is larger, it takes a shorter amount of time for the lacquer to penetrate the
opening.
For a non-circular cross section, Cartesian coordinates can be used for Equation 4-1. An opening
with an elliptical shape that has width a and length b, and neglecting gravitational forces, it can be
shown that the penetration time is:
(4-12)
When openings are closed ended, the trapped air will reduce the effective pressure gradient, thus
reducing flow rate and increasing penetration time. Deutsch showed that the governing equation
for the penetrating liquid with a closed end opening is written as [33]:
(4-13)
where Po is the atmospheric pressure and P1 is the pressure of the trapped air (which was initially
atmospheric). This equation takes into account capillary forces as well as the resistive force from
entrapped air. The solution for Equation 4-13 can be shown to be:
F zπR2ρg=
t 8µlρgR2-------------=
t 2µl2
abγ θcos--------------------- a2 b2+
a b+-----------------
=
µr2
2
∂
∂ u 1r---
r∂
∂u+ 1
l--- Po P1– 2γ θcos
R------------------+
=
119
(4-14)
From Equation 4-14, it is determined that flow will cease when:
(4-15)
4.4.2. Spin coat cavity test
In order to experimentally determine the opening size that polymer spanning is possible, a series
of varying cavity widths and length were fabricated in silicon as shown in Figure 4-21. Using a
silicon dioxide as a masking material, cavities were etched to 100 µm of depth. Four different
lacquers were used (DMAC-HI1, DMAC-MIX1, DMAC-LO1, and DMAC-LO4) and spin coated
at various spin speeds from 1-4 kRPM.
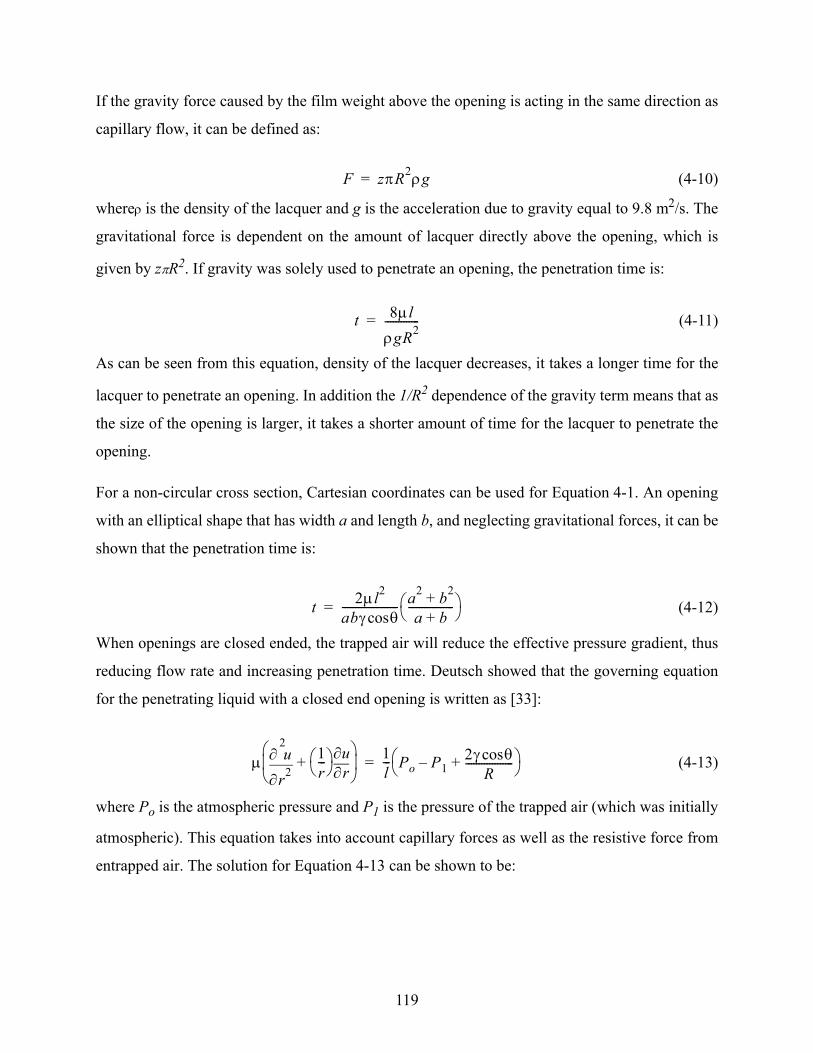
The thinner the lacquer spin coated onto the cavity test chip, the greater the problems with spanning
the film across the cavity. As was discussed in Chapter 2, the fabrication process for porous
cellulose acetate membranes creates a considerable amount of residual stress due to precipitation
of the polymer [179]. It was noted that longer channels caused the membrane to break off from one
edge of the cavity and shrink as shown at the left in Figure 4-22. In this micrograph, 50 µm-wide
cavities were fabricated alongside each other with lengths of 25, 50, 75, 100, 200, and 500 µm. The
u R2
4µ------ 1 r2
R2------–
2 l z–( )γ θ PozR–cos[ ]
lR l z–( )---------------------------------------------------------=
zl-- 2γ θcos
RPo 2γ θcos+----------------------------------=
Figure 4-21. SEM micrographs showing coated cavity openings of varying width and length. Lacquer DMAC-MIX1 was spin coated at 4 kRPM over the substrate. Cavities that are 100 µm-wide and varying length areshown on the left, while cavities of 50 µm-wide and varying length are shown on the right.
120
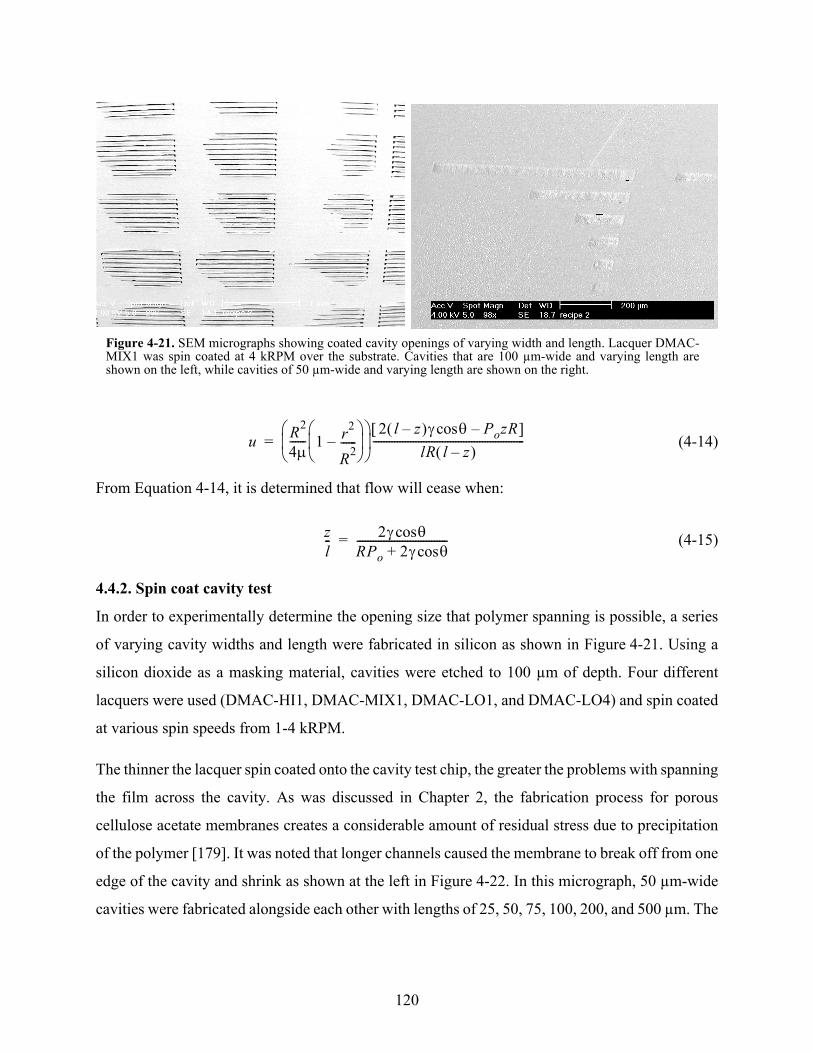
cavities with 25, 50, and 75 µm-lengths did not show any significant tears or film shrinkage, while
cavities with lengths greater than 100 µm demonstrated spanning problems.
It was necessary to fabricate a series of platinum microbridges, that spanned the top of the cavities,
to provide more structural support to the cellulose acetate membrane. The right micrograph in
Figure 4-22 shows a coated substrate (lacquer DMAC-MIX1 at 2 kRPM) with a 50 µm-wide cavity
that was 1000 µm in length. A series of 5 µm-wide, 50 µm-spacing platinum microbridges are
visible through the membrane, providing adhesion points that allow the highly stressed membrane
to span the entire length of the cavity. Small tears are visible on the surface of the cellulose acetate,
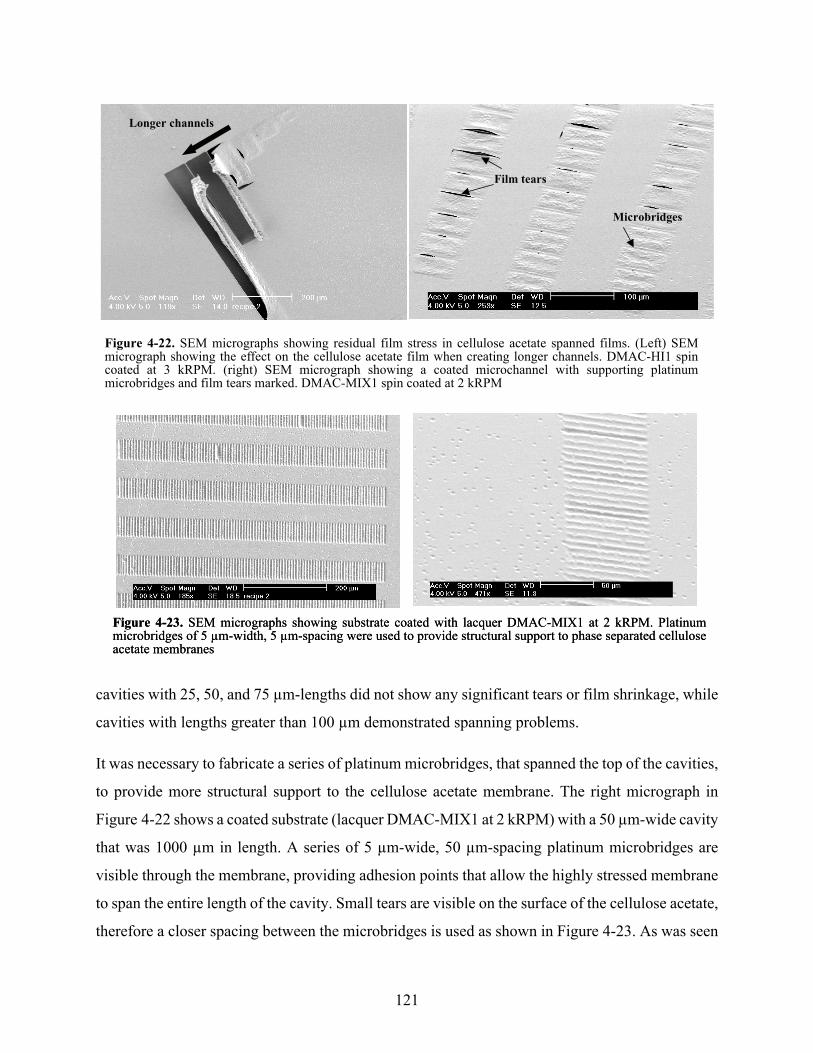
therefore a closer spacing between the microbridges is used as shown in Figure 4-23. As was seen
Longer channels
Microbridges
Film tears
Figure 4-22. SEM micrographs showing residual film stress in cellulose acetate spanned films. (Left) SEMmicrograph showing the effect on the cellulose acetate film when creating longer channels. DMAC-HI1 spincoated at 3 kRPM. (right) SEM micrograph showing a coated microchannel with supporting platinummicrobridges and film tears marked. DMAC-MIX1 spin coated at 2 kRPM
Figure 4-23. SEM micrographs showing substrate coated with lacquer DMAC-MIX1 at 2 kRPM. Platinummicrobridges of 5 µm-width, 5 µm-spacing were used to provide structural support to phase separated celluloseacetate membranes
Figure 4-23. SEM micrographs showing substrate coated with lacquer DMAC-MIX1 at 2 kRPM. Platinummicrobridges of 5 µm-width, 5 µm-spacing were used to provide structural support to phase separated celluloseacetate membranes
121
in Figure 4-15, the cellulose acetate slightly penetrates into the microchannel, undercoating the
platinum microbridges. This undercoating allows for better adhesion of the cellulose acetate to the
substrate as the membrane undergoes residual stresses from the immersion precipitation process.
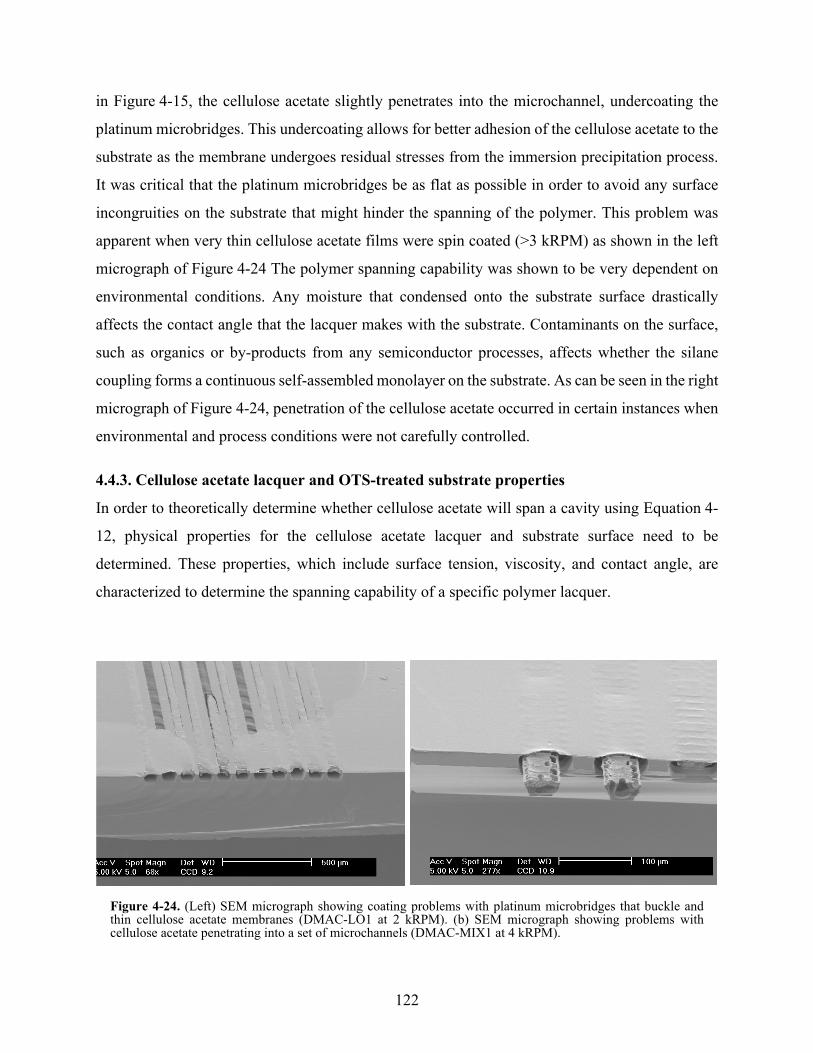
It was critical that the platinum microbridges be as flat as possible in order to avoid any surface
incongruities on the substrate that might hinder the spanning of the polymer. This problem was
apparent when very thin cellulose acetate films were spin coated (>3 kRPM) as shown in the left
micrograph of Figure 4-24 The polymer spanning capability was shown to be very dependent on
environmental conditions. Any moisture that condensed onto the substrate surface drastically
affects the contact angle that the lacquer makes with the substrate. Contaminants on the surface,
such as organics or by-products from any semiconductor processes, affects whether the silane
coupling forms a continuous self-assembled monolayer on the substrate. As can be seen in the right
micrograph of Figure 4-24, penetration of the cellulose acetate occurred in certain instances when
environmental and process conditions were not carefully controlled.
4.4.3. Cellulose acetate lacquer and OTS-treated substrate properties
In order to theoretically determine whether cellulose acetate will span a cavity using Equation 4-
12, physical properties for the cellulose acetate lacquer and substrate surface need to be
determined. These properties, which include surface tension, viscosity, and contact angle, are
characterized to determine the spanning capability of a specific polymer lacquer.
Figure 4-24. (Left) SEM micrograph showing coating problems with platinum microbridges that buckle andthin cellulose acetate membranes (DMAC-LO1 at 2 kRPM). (b) SEM micrograph showing problems withcellulose acetate penetrating into a set of microchannels (DMAC-MIX1 at 4 kRPM).
122
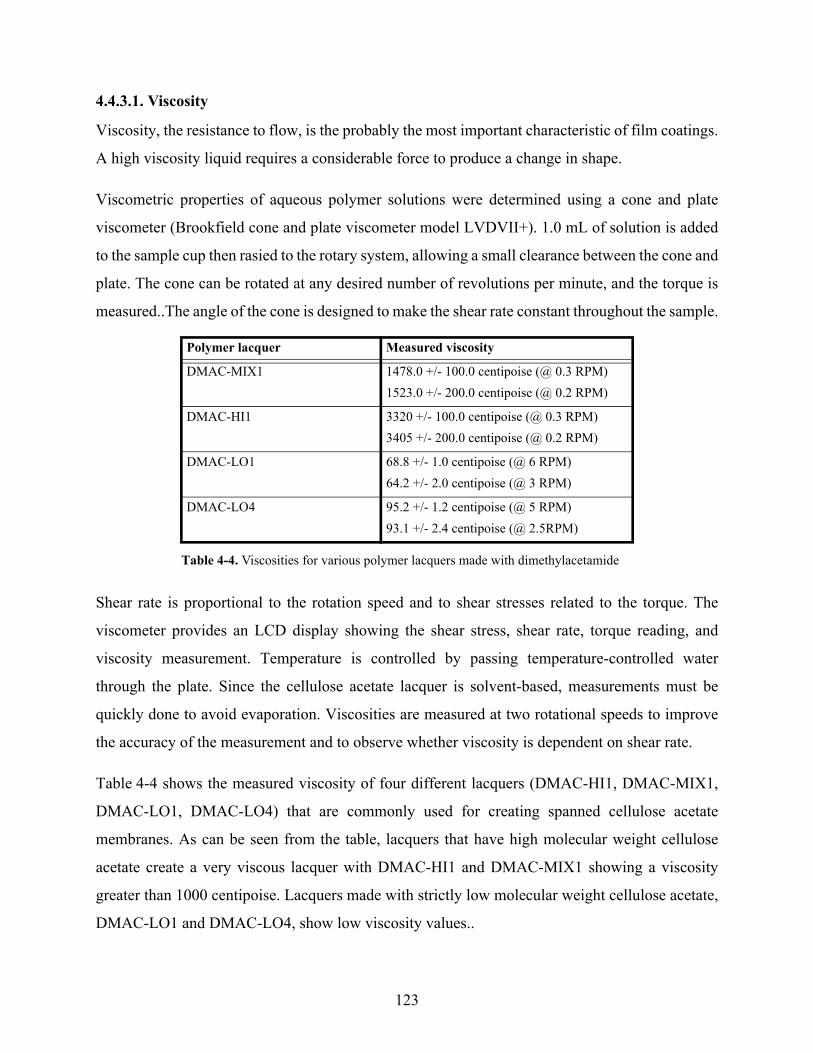
4.4.3.1. Viscosity
Viscosity, the resistance to flow, is the probably the most important characteristic of film coatings.
A high viscosity liquid requires a considerable force to produce a change in shape.
Viscometric properties of aqueous polymer solutions were determined using a cone and plate
viscometer (Brookfield cone and plate viscometer model LVDVII+). 1.0 mL of solution is added
to the sample cup then rasied to the rotary system, allowing a small clearance between the cone and
plate. The cone can be rotated at any desired number of revolutions per minute, and the torque is
measured..The angle of the cone is designed to make the shear rate constant throughout the sample.
Shear rate is proportional to the rotation speed and to shear stresses related to the torque. The
viscometer provides an LCD display showing the shear stress, shear rate, torque reading, and
viscosity measurement. Temperature is controlled by passing temperature-controlled water
through the plate. Since the cellulose acetate lacquer is solvent-based, measurements must be
quickly done to avoid evaporation. Viscosities are measured at two rotational speeds to improve
the accuracy of the measurement and to observe whether viscosity is dependent on shear rate.
Table 4-4 shows the measured viscosity of four different lacquers (DMAC-HI1, DMAC-MIX1,
DMAC-LO1, DMAC-LO4) that are commonly used for creating spanned cellulose acetate
membranes. As can be seen from the table, lacquers that have high molecular weight cellulose
acetate create a very viscous lacquer with DMAC-HI1 and DMAC-MIX1 showing a viscosity
greater than 1000 centipoise. Lacquers made with strictly low molecular weight cellulose acetate,
DMAC-LO1 and DMAC-LO4, show low viscosity values..
Polymer lacquer Measured viscosity
DMAC-MIX1 1478.0 +/- 100.0 centipoise (@ 0.3 RPM)1523.0 +/- 200.0 centipoise (@ 0.2 RPM)
DMAC-HI1 3320 +/- 100.0 centipoise (@ 0.3 RPM)3405 +/- 200.0 centipoise (@ 0.2 RPM)
DMAC-LO1 68.8 +/- 1.0 centipoise (@ 6 RPM)64.2 +/- 2.0 centipoise (@ 3 RPM)
DMAC-LO4 95.2 +/- 1.2 centipoise (@ 5 RPM)93.1 +/- 2.4 centipoise (@ 2.5RPM)
Table 4-4. Viscosities for various polymer lacquers made with dimethylacetamide
123
The viscosity of a polymer solution will usually increase with the solvating power of the solvent at
a given concentration, because this allows the polymer to stretch out further and to become
entangled with other polymer molecules more easily. A poorer solvent forces the polymer to
become more compact and to occupy a smaller volume, resulting in a lower viscosity.
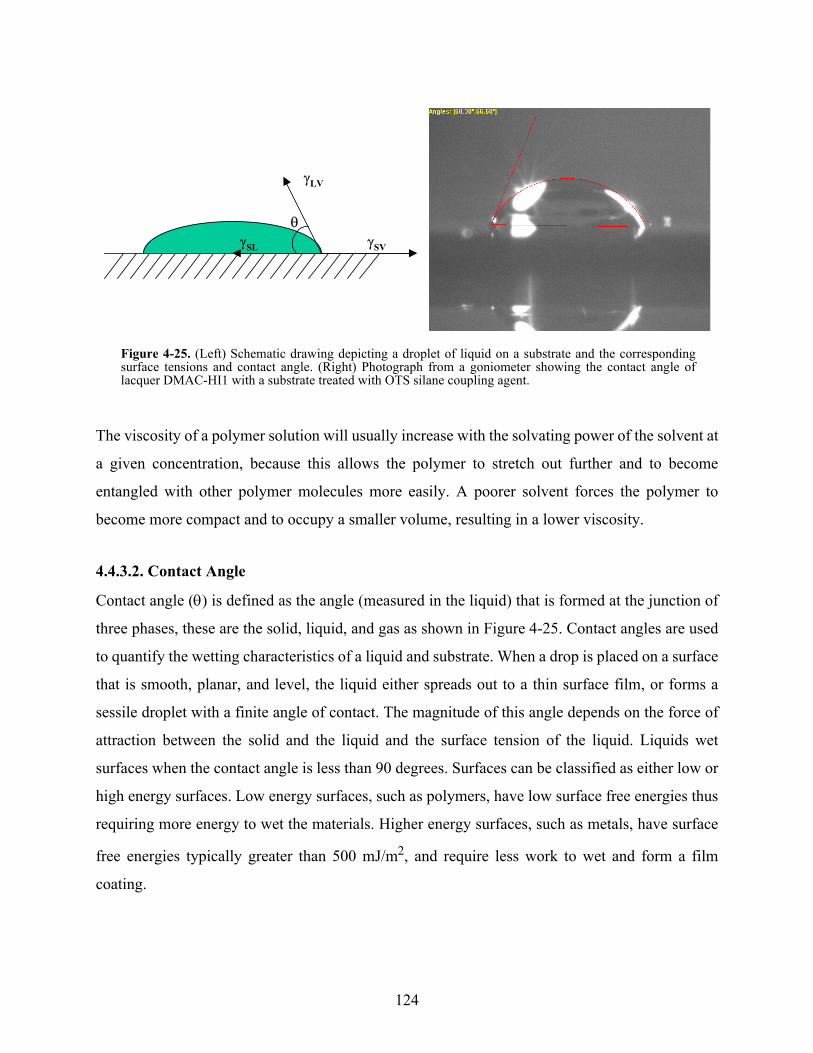
4.4.3.2. Contact Angle
Contact angle (θ) is defined as the angle (measured in the liquid) that is formed at the junction of
three phases, these are the solid, liquid, and gas as shown in Figure 4-25. Contact angles are used
to quantify the wetting characteristics of a liquid and substrate. When a drop is placed on a surface
that is smooth, planar, and level, the liquid either spreads out to a thin surface film, or forms a
sessile droplet with a finite angle of contact. The magnitude of this angle depends on the force of
attraction between the solid and the liquid and the surface tension of the liquid. Liquids wet
surfaces when the contact angle is less than 90 degrees. Surfaces can be classified as either low or
high energy surfaces. Low energy surfaces, such as polymers, have low surface free energies thus
requiring more energy to wet the materials. Higher energy surfaces, such as metals, have surface
free energies typically greater than 500 mJ/m2, and require less work to wet and form a film
coating.
Figure 4-25. (Left) Schematic drawing depicting a droplet of liquid on a substrate and the correspondingsurface tensions and contact angle. (Right) Photograph from a goniometer showing the contact angle oflacquer DMAC-HI1 with a substrate treated with OTS silane coupling agent.
θ
γLV
γSVγSL
124
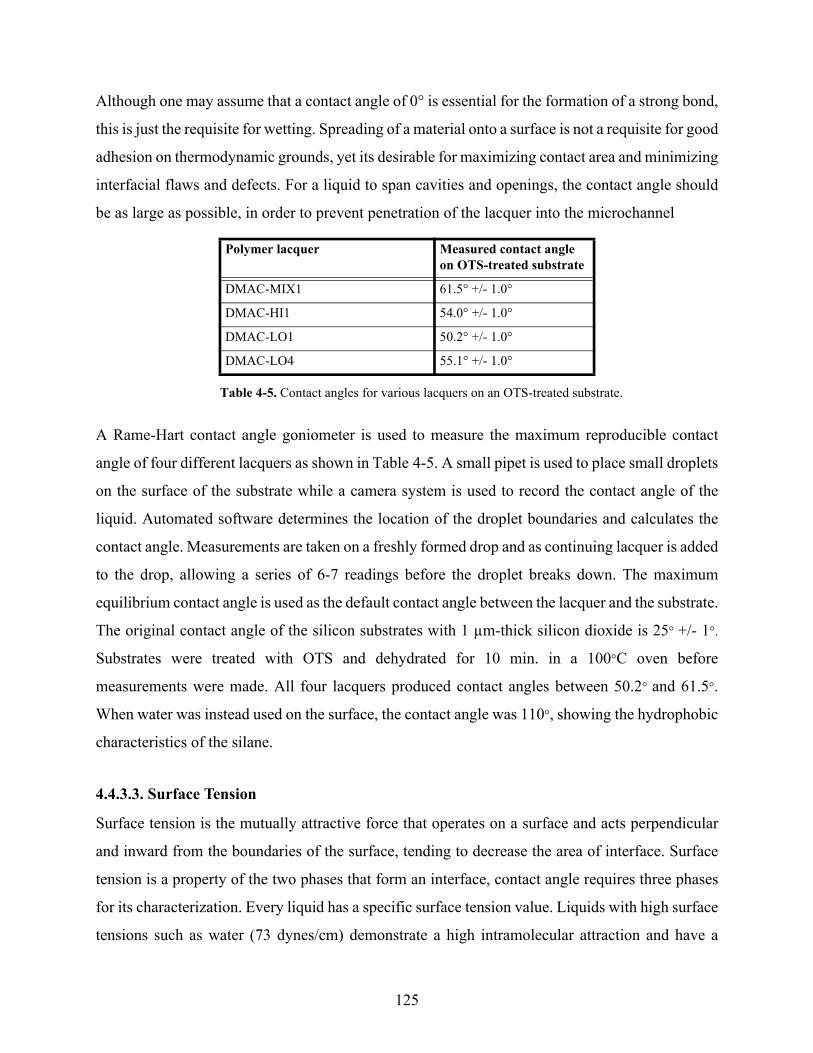
Although one may assume that a contact angle of 0° is essential for the formation of a strong bond,
this is just the requisite for wetting. Spreading of a material onto a surface is not a requisite for good
adhesion on thermodynamic grounds, yet its desirable for maximizing contact area and minimizing
interfacial flaws and defects. For a liquid to span cavities and openings, the contact angle should
be as large as possible, in order to prevent penetration of the lacquer into the microchannel
A Rame-Hart contact angle goniometer is used to measure the maximum reproducible contact
angle of four different lacquers as shown in Table 4-5. A small pipet is used to place small droplets
on the surface of the substrate while a camera system is used to record the contact angle of the
liquid. Automated software determines the location of the droplet boundaries and calculates the
contact angle. Measurements are taken on a freshly formed drop and as continuing lacquer is added
to the drop, allowing a series of 6-7 readings before the droplet breaks down. The maximum
equilibrium contact angle is used as the default contact angle between the lacquer and the substrate.
The original contact angle of the silicon substrates with 1 µm-thick silicon dioxide is 25° +/- 1°.
Substrates were treated with OTS and dehydrated for 10 min. in a 100°C oven before
measurements were made. All four lacquers produced contact angles between 50.2° and 61.5°.
When water was instead used on the surface, the contact angle was 110°, showing the hydrophobic
characteristics of the silane.
4.4.3.3. Surface Tension
Surface tension is the mutually attractive force that operates on a surface and acts perpendicular
and inward from the boundaries of the surface, tending to decrease the area of interface. Surface
tension is a property of the two phases that form an interface, contact angle requires three phases
for its characterization. Every liquid has a specific surface tension value. Liquids with high surface
tensions such as water (73 dynes/cm) demonstrate a high intramolecular attraction and have a
Polymer lacquer Measured contact angle on OTS-treated substrate
DMAC-MIX1 61.5° +/- 1.0°
DMAC-HI1 54.0° +/- 1.0°
DMAC-LO1 50.2° +/- 1.0°
DMAC-LO4 55.1° +/- 1.0°
Table 4-5. Contact angles for various lacquers on an OTS-treated substrate.
125
strong tendency to bead up. Liquids with low values, such as acetone, have low intramolecular
attractions and have a weak tendency to bead up.
A Du Nouy ring method was used to measure the surface tension of four polymer lacquers
(DMAC-HI1, DMAC-MIX1, DMAC-LO1, DMAC-LO4). The method uses a platinum ring of
precisely known dimensions, which is suspended from a counter-balanced lever arm. The arm is
held by torsion applied to a wire. As the ring is dipped into the lacquer and then raised, it carries a
film of the lacquer..
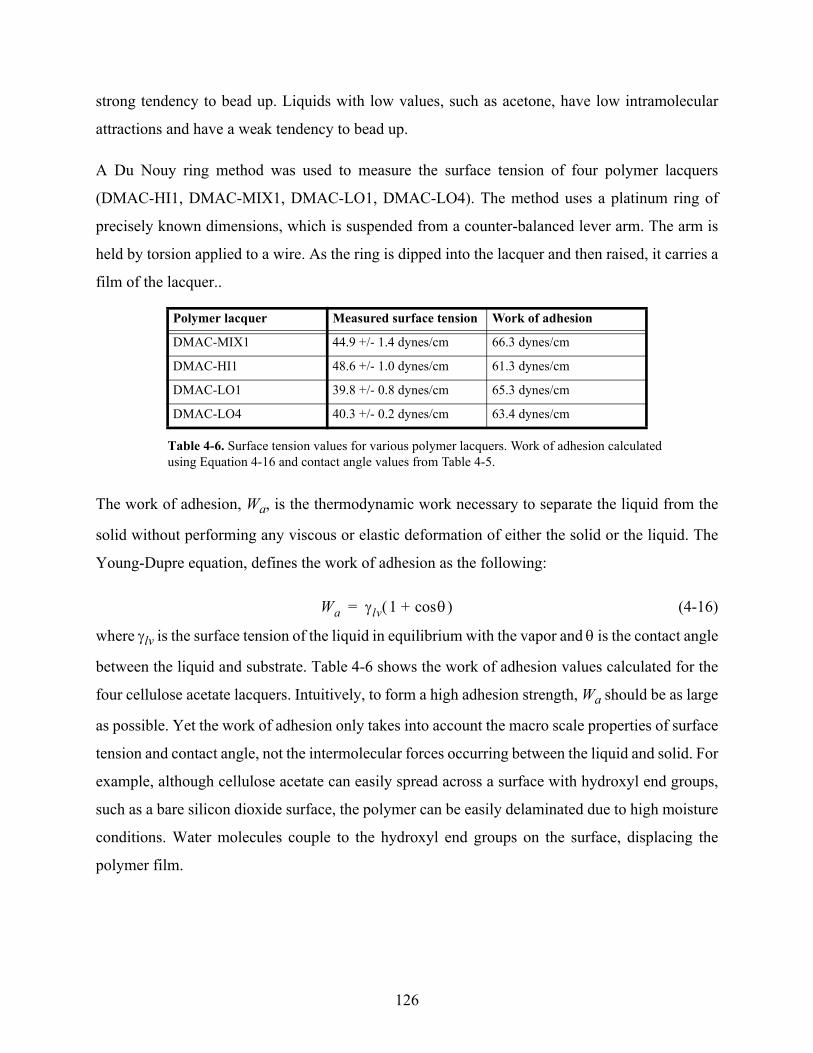
The work of adhesion, Wa, is the thermodynamic work necessary to separate the liquid from the
solid without performing any viscous or elastic deformation of either the solid or the liquid. The
Young-Dupre equation, defines the work of adhesion as the following:
(4-16)
where γlv is the surface tension of the liquid in equilibrium with the vapor and θ is the contact angle
between the liquid and substrate. Table 4-6 shows the work of adhesion values calculated for the
four cellulose acetate lacquers. Intuitively, to form a high adhesion strength, Wa should be as large
as possible. Yet the work of adhesion only takes into account the macro scale properties of surface
tension and contact angle, not the intermolecular forces occurring between the liquid and solid. For
example, although cellulose acetate can easily spread across a surface with hydroxyl end groups,
such as a bare silicon dioxide surface, the polymer can be easily delaminated due to high moisture
conditions. Water molecules couple to the hydroxyl end groups on the surface, displacing the
polymer film.
Polymer lacquer Measured surface tension Work of adhesion
DMAC-MIX1 44.9 +/- 1.4 dynes/cm 66.3 dynes/cm
DMAC-HI1 48.6 +/- 1.0 dynes/cm 61.3 dynes/cm
DMAC-LO1 39.8 +/- 0.8 dynes/cm 65.3 dynes/cm
DMAC-LO4 40.3 +/- 0.2 dynes/cm 63.4 dynes/cm
Table 4-6. Surface tension values for various polymer lacquers. Work of adhesion calculated using Equation 4-16 and contact angle values from Table 4-5.
Wa γlv 1 θcos+( )=
126
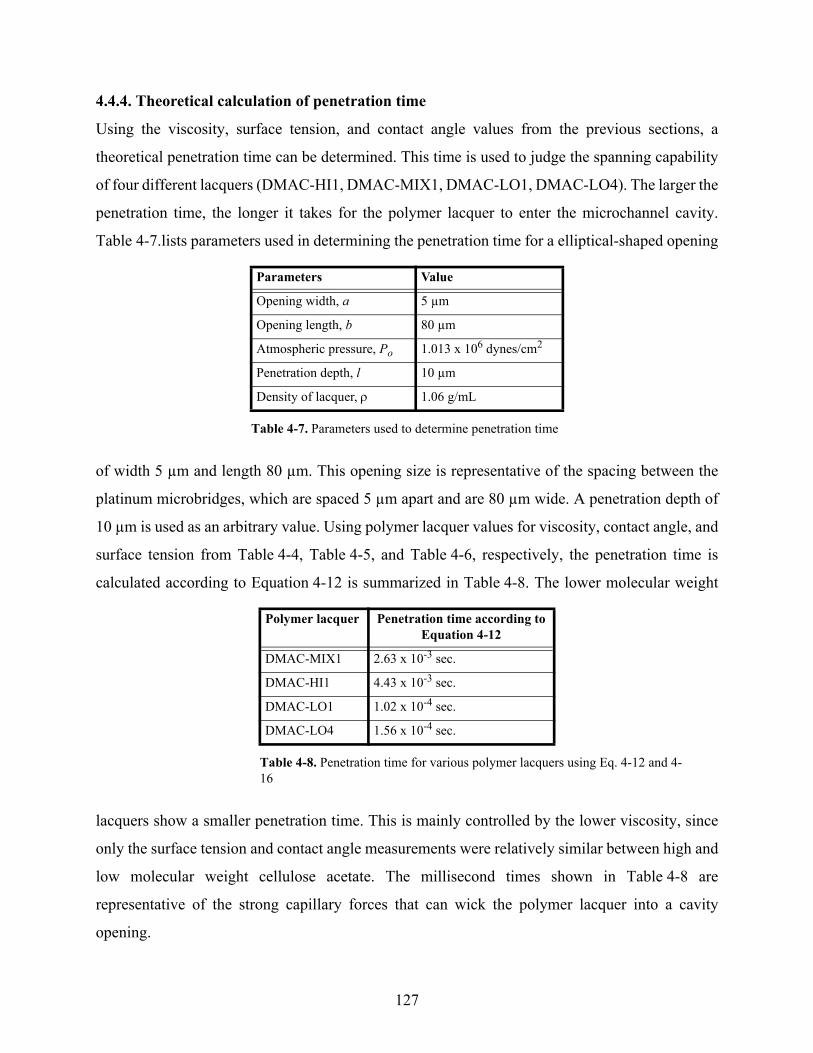
4.4.4. Theoretical calculation of penetration time
Using the viscosity, surface tension, and contact angle values from the previous sections, a
theoretical penetration time can be determined. This time is used to judge the spanning capability
of four different lacquers (DMAC-HI1, DMAC-MIX1, DMAC-LO1, DMAC-LO4). The larger the
penetration time, the longer it takes for the polymer lacquer to enter the microchannel cavity.
Table 4-7.lists parameters used in determining the penetration time for a elliptical-shaped opening
of width 5 µm and length 80 µm. This opening size is representative of the spacing between the
platinum microbridges, which are spaced 5 µm apart and are 80 µm wide. A penetration depth of
10 µm is used as an arbitrary value. Using polymer lacquer values for viscosity, contact angle, and
surface tension from Table 4-4, Table 4-5, and Table 4-6, respectively, the penetration time is
calculated according to Equation 4-12 is summarized in Table 4-8. The lower molecular weight
lacquers show a smaller penetration time. This is mainly controlled by the lower viscosity, since
only the surface tension and contact angle measurements were relatively similar between high and
low molecular weight cellulose acetate. The millisecond times shown in Table 4-8 are
representative of the strong capillary forces that can wick the polymer lacquer into a cavity
opening.
Parameters Value
Opening width, a 5 µm
Opening length, b 80 µm
Atmospheric pressure, Po 1.013 x 10⁶ dynes/cm2
Penetration depth, l 10 µm
Density of lacquer, ρ 1.06 g/mL
Table 4-7. Parameters used to determine penetration time
Polymer lacquer Penetration time according to Equation 4-12
DMAC-MIX1 2.63 x 10⁻³ sec.
DMAC-HI1 4.43 x 10⁻³ sec.
DMAC-LO1 1.02 x 10⁻⁴ sec.
DMAC-LO4 1.56 x 10⁻⁴ sec.
Table 4-8. Penetration time for various polymer lacquers using Eq. 4-12 and 4-16
127
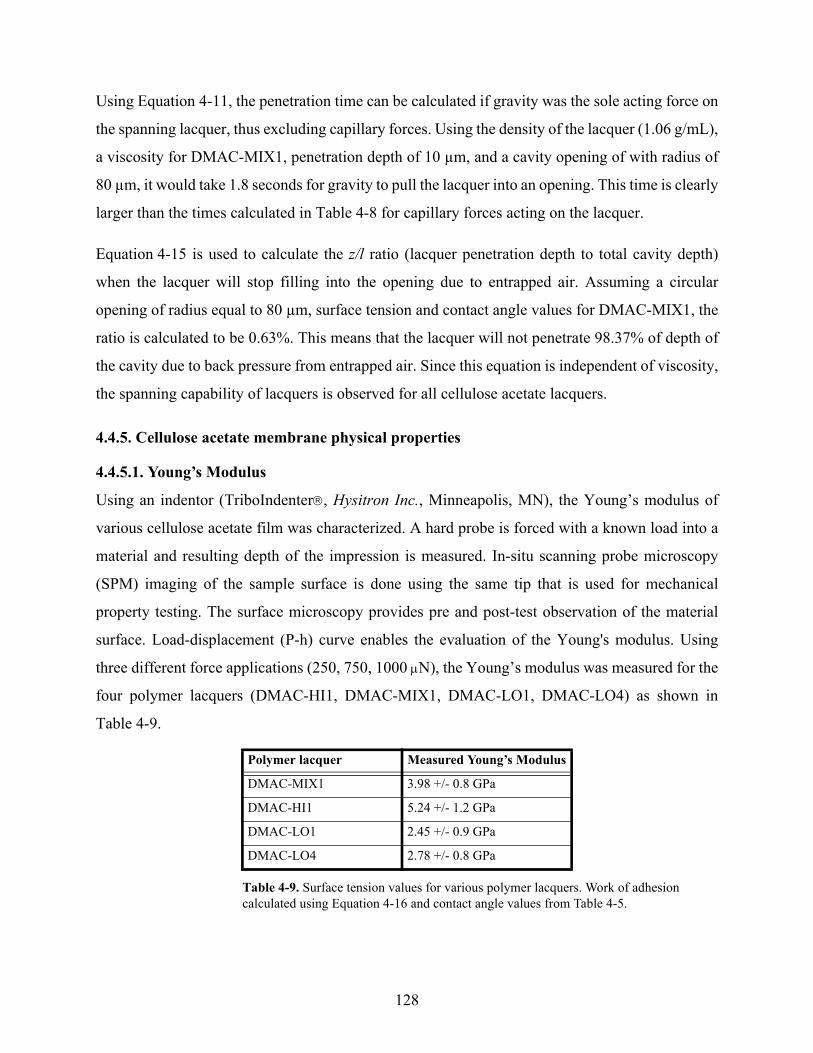
Using Equation 4-11, the penetration time can be calculated if gravity was the sole acting force on
the spanning lacquer, thus excluding capillary forces. Using the density of the lacquer (1.06 g/mL),
a viscosity for DMAC-MIX1, penetration depth of 10 µm, and a cavity opening of with radius of
80 µm, it would take 1.8 seconds for gravity to pull the lacquer into an opening. This time is clearly
larger than the times calculated in Table 4-8 for capillary forces acting on the lacquer.
Equation 4-15 is used to calculate the z/l ratio (lacquer penetration depth to total cavity depth)
when the lacquer will stop filling into the opening due to entrapped air. Assuming a circular
opening of radius equal to 80 µm, surface tension and contact angle values for DMAC-MIX1, the
ratio is calculated to be 0.63%. This means that the lacquer will not penetrate 98.37% of depth of
the cavity due to back pressure from entrapped air. Since this equation is independent of viscosity,
the spanning capability of lacquers is observed for all cellulose acetate lacquers.
4.4.5. Cellulose acetate membrane physical properties
4.4.5.1. Young’s Modulus
Using an indentor (TriboIndenter, Hysitron Inc., Minneapolis, MN), the Young’s modulus of
various cellulose acetate film was characterized. A hard probe is forced with a known load into a
material and resulting depth of the impression is measured. In-situ scanning probe microscopy
(SPM) imaging of the sample surface is done using the same tip that is used for mechanical
property testing. The surface microscopy provides pre and post-test observation of the material
surface. Load-displacement (P-h) curve enables the evaluation of the Young's modulus. Using
three different force applications (250, 750, 1000 µN), the Young’s modulus was measured for the
four polymer lacquers (DMAC-HI1, DMAC-MIX1, DMAC-LO1, DMAC-LO4) as shown in
Table 4-9.
Polymer lacquer Measured Young’s Modulus
DMAC-MIX1 3.98 +/- 0.8 GPa
DMAC-HI1 5.24 +/- 1.2 GPa
DMAC-LO1 2.45 +/- 0.9 GPa
DMAC-LO4 2.78 +/- 0.8 GPa
Table 4-9. Surface tension values for various polymer lacquers. Work of adhesion calculated using Equation 4-16 and contact angle values from Table 4-5.
128
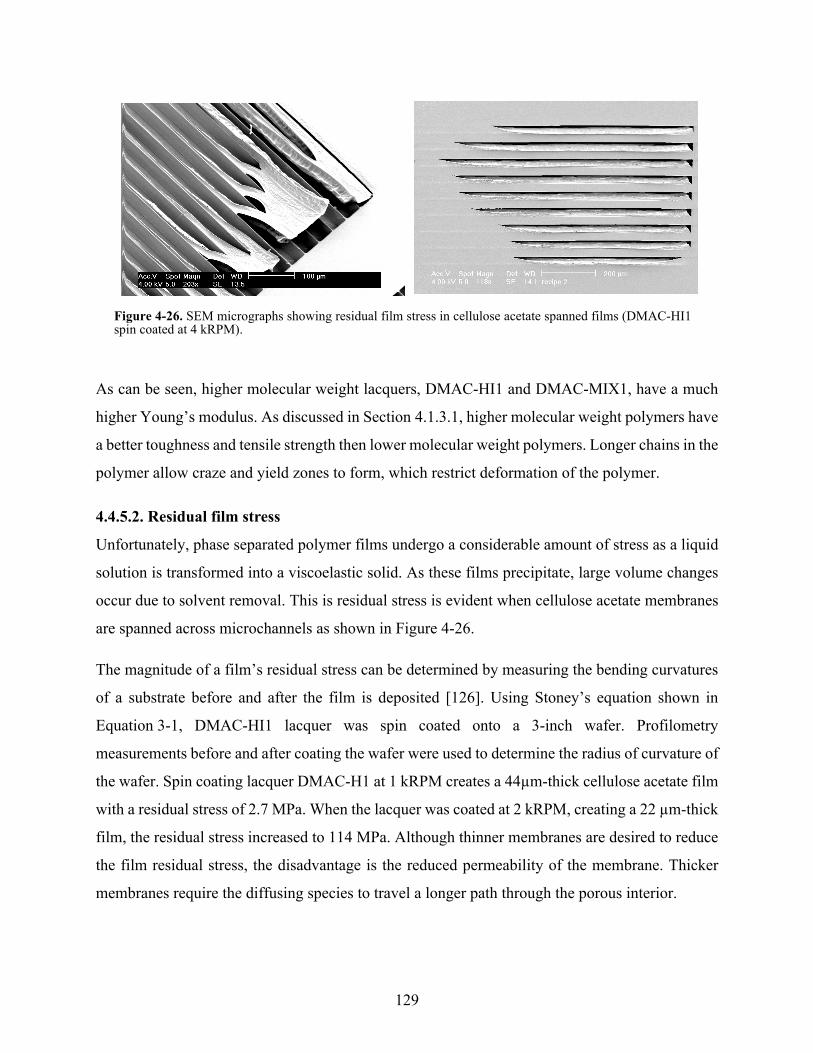
As can be seen, higher molecular weight lacquers, DMAC-HI1 and DMAC-MIX1, have a much
higher Young’s modulus. As discussed in Section 4.1.3.1, higher molecular weight polymers have
a better toughness and tensile strength then lower molecular weight polymers. Longer chains in the
polymer allow craze and yield zones to form, which restrict deformation of the polymer.
4.4.5.2. Residual film stress
Unfortunately, phase separated polymer films undergo a considerable amount of stress as a liquid
solution is transformed into a viscoelastic solid. As these films precipitate, large volume changes
occur due to solvent removal. This is residual stress is evident when cellulose acetate membranes
are spanned across microchannels as shown in Figure 4-26.
The magnitude of a film’s residual stress can be determined by measuring the bending curvatures
of a substrate before and after the film is deposited [126]. Using Stoney’s equation shown in
Equation 3-1, DMAC-HI1 lacquer was spin coated onto a 3-inch wafer. Profilometry
measurements before and after coating the wafer were used to determine the radius of curvature of
the wafer. Spin coating lacquer DMAC-H1 at 1 kRPM creates a 44µm-thick cellulose acetate film
with a residual stress of 2.7 MPa. When the lacquer was coated at 2 kRPM, creating a 22 µm-thick
film, the residual stress increased to 114 MPa. Although thinner membranes are desired to reduce
the film residual stress, the disadvantage is the reduced permeability of the membrane. Thicker
membranes require the diffusing species to travel a longer path through the porous interior.
Figure 4-26. SEM micrographs showing residual film stress in cellulose acetate spanned films (DMAC-HI1spin coated at 4 kRPM).
129