Embed Size (px)
Citation preview

The structure of the patent attorney service market in the EU Member
States
Rainer Frietsch, Ulrich Schmoch, Oliver Rothengatter, Nadine Bethke
Final Report
CONTRACT NUMBER: MARKT/2014/222/B2/SE/LV
Fraunhofer Institute for Systems and Innovation Research ISI
May 2015
Contact address and further information:
Dr. Rainer Frietsch Fraunhofer Institute for Systems and Innovation Research ISI Competence Center Policy and Regions Breslauer Strasse 48 76139 Karlsruhe Phone: +49-721-6809-197
E-Mail: [email protected]

Contents 1 Summary ............................................................................................................... 1
2 Introduction ............................................................................................................ 2
3 The data................................................................................................................. 2
4 The rules and regulations for the representatives ................................................... 6
5 Structure and experience of patent representatives ............................................... 7
6 The structure of the representatives' clients ......................................................... 13
7 Conclusions ......................................................................................................... 19
8 Data annex .......................................................................................................... 20
9 Cited literature...................................................................................................... 23
Figure 1: Fraunhofer ISI’s PATSTAT version and its supplements ................. 4
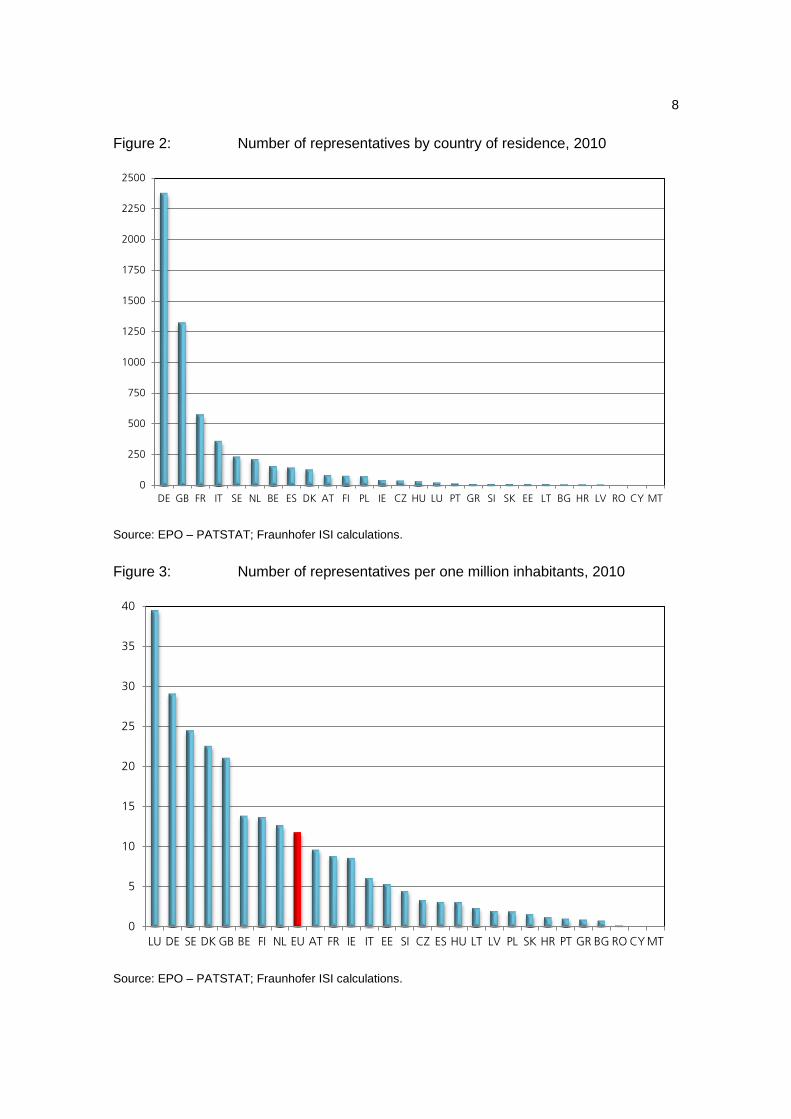
Figure 2: Number of representatives by country of residence, 2010 .............. 8
Figure 3: Number of representatives per one million inhabitants .................... 8
Figure 4: Average of the representatives' years of practice by
country, 2010 .................................................................................. 9
Figure 5: Average experience (cumulated number of filings) of
representatives by country, 2010 .................................................. 10
Figure 6: Share of the six largest EU-countries (country of
representative) in total filings at the EPO ...................................... 11
Figure 7: Number of patents processed by representatives in a
country as a share of applications from that particular
country .......................................................................................... 12
Figure 8: Growth rate (CAGR) of filings by representative country*,
2000-2010 .................................................................................... 12
Figure 9: Shares of applicant country groups by country of
representative, 2010 ..................................................................... 13
Figure 10: Shares of applicant types by country of representative,
2010 ............................................................................................. 14
Figure 11: Shares of patents processed by internal representatives by
country of residence, 2010 ............................................................ 15
Figure 12: Shares of patents processed by internal representatives by
applicant type, 2010 ...................................................................... 16
Figure 13: Absolute number of representatives per technology field*,
2010 ............................................................................................. 18
Figure 14: Average number of technological fields per representative
by country of representative; 2010 ................................................ 19
Table 1: Number of patents and number of patents with office / law
firm information in our dataset ......................................................... 5
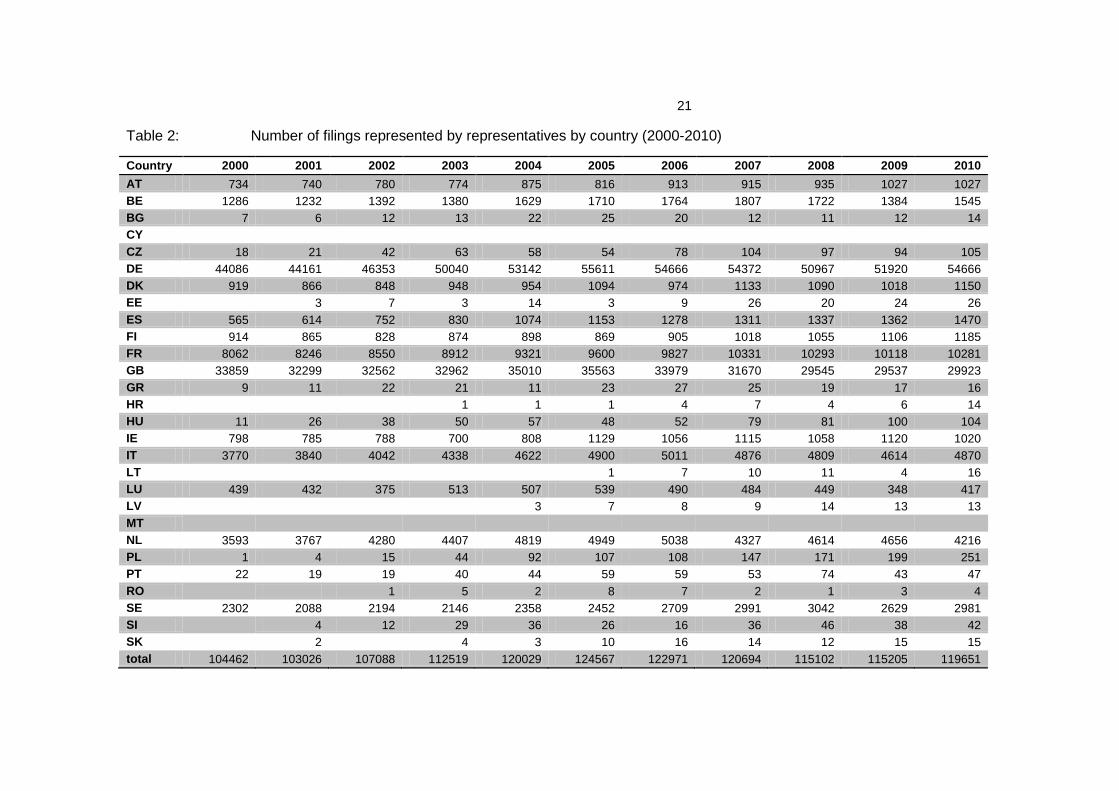
Table 2: Number of filings represented by representatives by
country (2000-2010) ..................................................................... 21
Table 3: Average number of technological fields per representative
by country of representative; 2000-2013 ....................................... 22

1
1 Summary
This report uses a match of PATSTAT and ESPACE data to analyse the struc-
ture and the role of legal representatives that represent the patent applicant be-
fore the EPO.
Though about 10,000 European patent attorneys are registered at the EPO,
only about 6,000 different representatives are responsible for the more than
100,000 EPO filings per year. And not all of them are registered European pat-
ent attorneys, as also other attorneys might act as legal representatives.
The majority of patents are filed by representatives from Germany and the UK.
Highest patent attorney density (per 1 million inhabitants) can be found in Lux-
embourg, Germany, Sweden, Denmark and the UK.
The most experienced (measured by the number of cumulated filings) represen-
tatives can be found in Ireland and the UK followed by Germany and Luxem-
bourg. Especially in the UK the relation between filings by national applicants
and by national representatives is very high, suggesting that a large number of
subsequent filings (e.g. from the US) are represented by UK attorneys. To
some extent this argument also holds for Germany and Ireland. Explanations
are language reasons in the case of UK and Ireland, as well as geographical
proximity and economies of scale in the case of Germany.
Large enterprises are responsible for the majority of filings represented by
German, UK, Dutch, Swedish, French and also Belgian attorneys. In Southern
and Central-Eastern Europe the representatives almost only work for SMEs and
individual inventors as well as public research organisations or universities.
In some countries the shares of patents processed by internal (to the applicant
company or institution) attorneys/representatives reach more than 30% (e.g.
Belgium, Netherlands or Sweden), while in Germany or the UK the shares of in-
ternal representations is only slightly above 5%.
Large enterprises have higher shares of patents processed by internal repre-
sentatives (13%) than small entities (less than 2%).
There is very little cross border provision of attorney services in the EU.
Representatives in the Northern and Western innovation-oriented countries
cover a larger number of technological fields, whereas attorneys in the South-
ern and Central-Eastern European countries have expertise in fewer techno-
logical fields.

2
2 Introduction
Patents are a vested right for a limited time, which applicants/inventors are granted.
Patents are essential to secure the investment in R&D and in the technological pro-
gress, especially in innovation-oriented countries. Applicants/inventors are granted this
right in exchange to a disclosure of their technology/process so that any other appli-
cant/inventor can take notice. Furthermore, patents have to fulfill several formal criteria,
among them novelty and inventive step, which are both examined by professionals in
the particular field. The formulation of patent applications is a sophisticated and chal-
lenging task, mostly fulfilled by professionals – patent attorneys – who then take re-
sponsibility of (in most cases) massive investments in R&D to be protected. As a patent
application is not a simple matter of filling a form and then a subsequent examination of
that form by the patent office, the way from the filing to the granted patent is a long one
and full of obstacles and traps. All this makes the patent attorney – or more generally
speaking the representative – a very important person within this process. High qualifi-
cations, broad experience and a number of other characteristics are mandatory or at
least helpful for a successful patent application. Patent attorneys are among the best
paid occupations in most countries.
Securing IPR by patents has gained importance in the past decades and the numbers
of patents have increased considerably all around the world. So the overall economic
effects of patent systems and the filing procedure have gained weight.
The costs of filing patents is in most cases defined by the procedural costs of the en-
deavor, where processing fees at the patent offices are calculable and straightforward,
and are therefore often used to assess the overall costs of a patent application, but
they are only a part of these overall costs. The costs for the services of the patent at-
torney, for translation, for prior art searches etc. are also considerable and make pa-
tents a costly thing. It becomes even more costly – though hard to predict – when law
suits or infringements are involved. And this holds for both parties of law suits or in-
fringements. This is why the resource endowment is often discussed as a crucial factor
for pursuing one’s own patent rights. The role of the legal representative in this proce-
dure is a so far under-explored research question in patent statistics. This report pro-
vides descriptive empirical evidence on the structures of patent attorneys active at the
European Patent Office.
3 The data
The patent data for the study was extracted from the "EPO Worldwide Patent Statistical
Database" (PATSTAT). PATSTAT is a relational database with more than 28 tables
and millions of entries that can be installed on a local server that is self administrated.
At Fraunhofer ISI it is implemented in Oracle SQL and covers information about pub-

3
lished patents from 83 patent authorities worldwide, dating back to the late 19th centu-
ry.
Due to its nature as a relational database, PATSTAT offers a unique analytical poten-
tial. First of all, it includes all information that are stated on a patent application, i.e.
application authorities (patent offices), several patent relevant dates (priority, filing,
publication date), the kind of an application (patent, utility model, etc.), inventor and
applicant addresses, patent families (INPADOC and DOCDB), patent classifications
(IPC and ECLA), title and abstract of a patent filing, technical relations and continua-
tions, citations to patents and to non-patent literature.
For the sake of this assignment, supplementary information was necessary to be add-
ed to PATSAT, thereby further enriching its analytical potential. Among these supple-
ments are classifications (Schmoch 2008) as well as applicant type (SME, large enter-
prise, individual inventor, public research organization, university), which was con-
structed using a link of PATSTAT and BvD's Orbis database as well as a classification
of small applicants (less than 10 patents in 11 years) and a manual assignment of the
remaining applicants (Frietsch et al. 2013; Neuhäusler et al. 2015).
It has to be kept in mind that we systematically increase the information and the quality
of PATSTAT with system immanent information. For example, we construct a priority
date from the family information, defining the date of worldwide first filing. In addition,
we fill in missing information for example on inventor or applicant country.
4
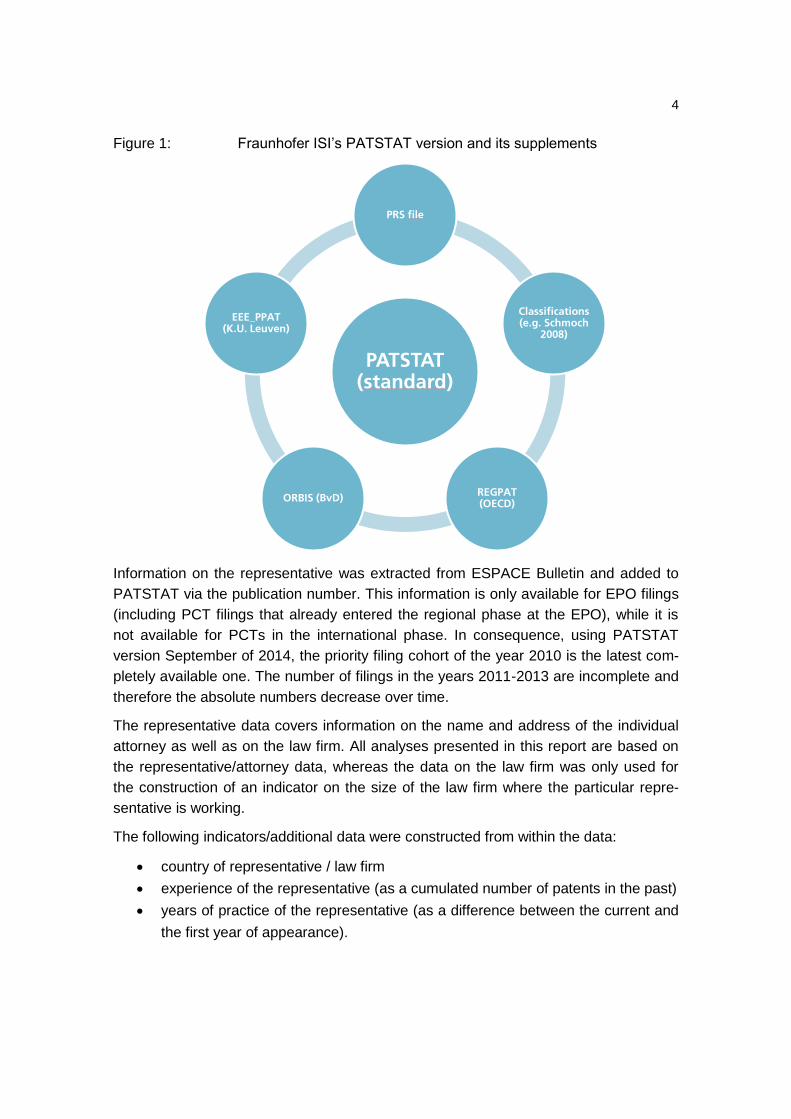
Figure 1: Fraunhofer ISI’s PATSTAT version and its supplements
Information on the representative was extracted from ESPACE Bulletin and added to
PATSTAT via the publication number. This information is only available for EPO filings
(including PCT filings that already entered the regional phase at the EPO), while it is
not available for PCTs in the international phase. In consequence, using PATSTAT
version September of 2014, the priority filing cohort of the year 2010 is the latest com-
pletely available one. The number of filings in the years 2011-2013 are incomplete and
therefore the absolute numbers decrease over time.
The representative data covers information on the name and address of the individual
attorney as well as on the law firm. All analyses presented in this report are based on
the representative/attorney data, whereas the data on the law firm was only used for
the construction of an indicator on the size of the law firm where the particular repre-
sentative is working.
The following indicators/additional data were constructed from within the data:
country of representative / law firm
experience of the representative (as a cumulated number of patents in the past)
years of practice of the representative (as a difference between the current and
the first year of appearance).
PATSTAT (standard)
PRS file
Classifications (e.g. Schmoch
2008)
REGPAT (OECD)
ORBIS (BvD)
EEE_PPAT (K.U. Leuven)

5
Not all patents provide information on the representative. The information is mentioned
in the field "representative" (INID1 code 74 or 740, respectively). In several of the EPO
filings no representative is mentioned, because this data might be deleted from the
document or it might not occur for unclear reasons – maybe simply because of missing
data.
In the case of our data set, about 87% of the patent filings to the EPO have information
on the representative that we were able to take into account for our analyses. Table 1
provides the number of total published patent filings at the EPO, the number of patent
filings with information on the representative, and the resulting share of filings with rep-
resentative information over the total number of filings per year. It was highest for the
year 2005, but it varies around 87% with decreasing trends in the recent two years,
which might be due to the incompleteness of these cohorts in the current PATSTAT
version.
For the remainder of this report, we will restrict the analyses to the patents with infor-
mation on the representative, so essentially to about 87% of total published filings.
Table 1: Number of patents and number of patents with office / law firm in-
formation in our dataset
Priority year
absolute N of patents
N of patents with information on representa-
tive
N of distinct repre-sentatives
Share of filings with representative information (in %)
2000 119,799 104,462 6,076 87.2
2001 118,465 103,026 6,170 87.0
2002 122,656 107,088 6,247 87.3
2003 128,872 112,519 6,222 87.3
2004 136,575 120,029 6,289 87.9
2005 141,428 124,567 6,360 88.1
2006 140,862 122,971 6,453 87.3
2007 138,139 120,694 6,357 87.4
2008 132,471 115,102 6,167 86.9
2009 133,568 115,205 6,274 86.3
2010 137,211 119,651 6,286 87.2
2011 113,693 97,307 5,686 85.6
2012 51,051 40,342 4,004 79.0
Source: EPO – PATSTAT; Fraunhofer ISI calculations.
1 www.wipo.int/standards/en/pdf/03-60-01.pdf

6
4 The rules and regulations for the representatives
For the representation at the EPO there are clear rules and regulations on who might
undertake this legal act on behalf of the patent applicant. Article 1342 of the European
Patent Convention (EPC) deals with the question who could act as a representative of
the patent owner. This can only be done by any natural person and national of one of
the 38 EPC member states, who has his place of business within the member states
and has passed the European qualifying examination. These are so-called European
patent attorneys. In addition, any legal practitioner who is entitled to represent patent
owners in patent matters in any of the EPC member states might also be able to act as
a representative at the EPO. So any national patent attorney could also act on behalf of
the patent applicant.
Next to the legal practitioners (lawyers/attorneys) a patent applicant who has its place
of business – this means either headquarter or a subsidiary organized as an own legal
entity – within the EPC member states might also file a patent without appointing a le-
gal practitioner. Even non-residential entities who have their place of business outside
the territory of the EPC might file an application on their own account, but then need to
appoint a legal practitioner in the further course of the process.
In the guide for applicants3 the EPO strongly recommends to appoint a professional
legal representative, especially to keep the probability of a successful application high.
Different to the US, where individual applicants who act pro-se – this is the term for
applicants who file on their own without support of a legal representative – get support
and even consultancy from the examiner, such a special rule does not exist at the
EPO. So if an individual fails to fulfil his/her requirements of the process, the filing pro-
cedure might come to an end and the patent will be rejected without any benefit of the
doubt. In the US, the applicant might even get some hints how to reformulate some
claims or change the scope of the patent to keep the process running. However, also in
Europe a communication between the examiner and the applicant (or his representa-
tive) occurs, where the applicant might get some useful information on how to refine his
application.
The majority of patent applications are filed by a professional legal representative, who
can be internal – so directly employed by the patent applicant – or external. Especially
small and medium-sized enterprises or at least small applicants (applicants with only
few patent applications) might choose external representatives, whereas larger enter-
prises and larger applicants might be able to sport their own patent attorney or even
2 http://www.epo.org/law-practice/legal-texts/html/epc/2013/e/ar134.html
3 http://documents.epo.org/projects/babylon/eponet.nsf/0/8266ED0366190630C12575E10 051F40E/$File/guide_for_applicants_part1_10_13_en.pdf

7
their own legal department with more than one attorney. However, the reality of large
multinational enterprises with own legal departments sees a mixture of internal and
external representatives. It is often the case that a number of legal practitioners are
involved in a patent filing procedure, as there is also plenty room for specialisation
even within the patent system. One person might be an expert in drafting the text, an-
other one even in writing the claims, a third one in corresponding with the office, and
another one being the best to act at the court of appeals in case of oppositions, or in
law suits when already granted patents are under attack. For licensing and contracting
even another legal representative might enter the scene. In fact, also in most of the
smaller law firms and for sure in the larger ones, a patent application is usually team-
work where prior art searches, correspondence, process management, fees payment
etc. are done by a team of people. However, as a representative on the patent applica-
tion only one person occurs, who has to fulfil the criteria of article 134 mentioned
above. This particular person named on the patent as a representative is in the scope
of this analysis.
5 Structure and experience of patent representatives
We restrict our analyses to the EU-28 member countries. Most of the figures and tables
use the country of residence of the representative and only a few provide data accord-
ing to the country of the applicant. As a matter of fact not only the size of the EU mem-
ber countries in terms of inhabitants is different, but also in terms of their innovation
and patent orientation/activity. In consequence, also the numbers of patent attorneys in
the member countries vary considerably between almost 2,400 in the case of Germany
and none at all in the case of Malta (see Figure 2). The United Kingdom ranks second
with roughly half as much representatives than Germany. France ranks third again with
about half the size of the United Kingdom. In total, we find 6,286 different representa-
tives in the year 2010.
To get a better picture beyond country size effects, Figure 3 displays the number of
representatives in relation to the countries’ population. In this perspective Luxembourg
ranks first with almost 40, followed by Germany with 29, then comes a group consisting
of Sweden, Denmark and the United Kingdom having more than 20 attorneys per
1,000,000 inhabitants. Another group consisting of Belgium, Finland and the Nether-
lands are slightly below 15, while Austria, France and Ireland are slightly below 10.
8
Figure 2: Number of representatives by country of residence, 2010
Source: EPO – PATSTAT; Fraunhofer ISI calculations.
Figure 3: Number of representatives per one million inhabitants, 2010
Source: EPO – PATSTAT; Fraunhofer ISI calculations.
0
250
500
750
1000
1250
1500
1750
2000
2250
2500
DE GB FR IT SE NL BE ES DK AT FI PL IE CZ HU LU PT GR SI SK EE LT BG HR LV RO CY MT
0
5
10
15
20
25
30
35
40
LU DE SE DK GB BE FI NL EU AT FR IE IT EE SI CZ ES HU LT LV PL SK HR PT GR BG RO CY MT

9
When it comes to the average years of practice of the representatives in the particular
countries (see Figure 4), the Northern and Western innovation oriented and long-term
industrialised countries are at the top, whereas the Eastern European and some of the
Southern European countries (Portugal and Greece) can be found in the lower panel.
The variation between the countries at the top is not that large. United Kingdom, Ire-
land and Austria reach values of about 14 years and even in countries which rank 7th,
8th or 9th, namely Germany, Italy and the Netherlands, the representatives of the co-
hort of 2010 have – on average – 12 years of practice.
Figure 4: Average of the representatives' years of practice by country, 2010
Source: EPO – PATSTAT; Fraunhofer ISI calculations.
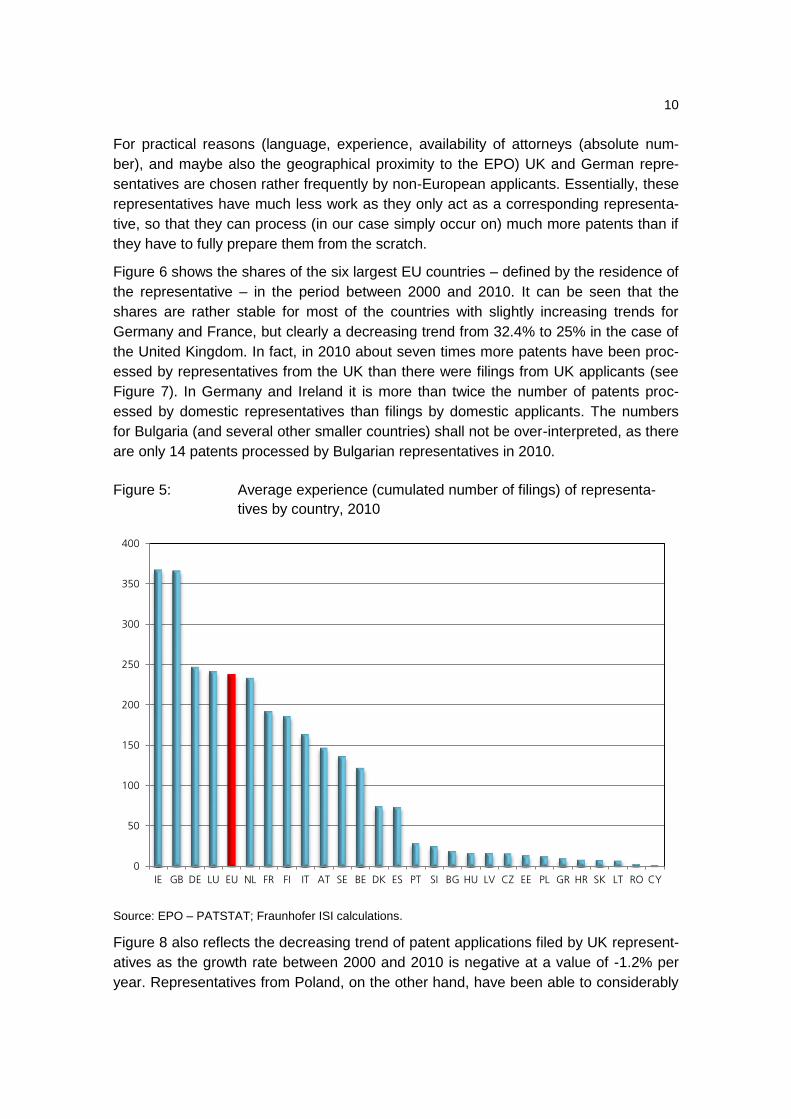
A much bigger difference can be seen in Figure 5 where the average experience – cal-
culated as the accumulated number of patent filings for each representative – in the
year 2010 is depicted. On average a representative in the United Kingdom and in Ire-
land had filed almost 370 patents, in Germany, Luxembourg and the Netherlands as
well as the EU average almost 250, whereas in most of the other Western European
countries like France, Finland, and Italy the experience is below 150 patents. The ex-
planation is – as will be further shown in another section below – that high shares of
the patents processed by UK, Irish and also by German representatives are filings from
non-European applicants, which are subsequent filings to priorities outside Europe. In
many cases the documents themselves are prepared by legal practitioners outside
Europe. As they are not allowed to file patents at the EPO (see the discussion in sec-
tion 2), a corresponding attorney needs to be found within Europe.
0
3
6
9
12
15
GB IE AT FI SE FR EU DE IT NL BE DK ES LU HU CZ SI BG EE SK PT LV GR PL HR LT RO CY MT
10
For practical reasons (language, experience, availability of attorneys (absolute num-
ber), and maybe also the geographical proximity to the EPO) UK and German repre-
sentatives are chosen rather frequently by non-European applicants. Essentially, these
representatives have much less work as they only act as a corresponding representa-
tive, so that they can process (in our case simply occur on) much more patents than if
they have to fully prepare them from the scratch.
Figure 6 shows the shares of the six largest EU countries – defined by the residence of
the representative – in the period between 2000 and 2010. It can be seen that the
shares are rather stable for most of the countries with slightly increasing trends for
Germany and France, but clearly a decreasing trend from 32.4% to 25% in the case of
the United Kingdom. In fact, in 2010 about seven times more patents have been proc-
essed by representatives from the UK than there were filings from UK applicants (see
Figure 7). In Germany and Ireland it is more than twice the number of patents proc-
essed by domestic representatives than filings by domestic applicants. The numbers
for Bulgaria (and several other smaller countries) shall not be over-interpreted, as there
are only 14 patents processed by Bulgarian representatives in 2010.
Figure 5: Average experience (cumulated number of filings) of representa-
tives by country, 2010
Source: EPO – PATSTAT; Fraunhofer ISI calculations.
Figure 8 also reflects the decreasing trend of patent applications filed by UK represent-
atives as the growth rate between 2000 and 2010 is negative at a value of -1.2% per
year. Representatives from Poland, on the other hand, have been able to considerably
0
50
100
150
200
250
300
350
400
IE GB DE LU EU NL FR FI IT AT SE BE DK ES PT SI BG HU LV CZ EE PL GR HR SK LT RO CY

11
increase their workload between 2000 and 2010 by almost 74% each year, which
means, however, a growth from one patent in 2000 to 251 patents in 2010. Hungary
and the Czech Republic were also able to considerably increase their shares, but in
absolute terms this means 104 or 105 patents in 2010, respectively. The majority of the
countries' workload in terms of filings processed by their representatives has been
around the overall average growth rate of patents at the EPO, namely at a rate be-
tween 2% and 3% per year. The absolute numbers can be found in Table 2 in the an-
nex.
Figure 6: Share of the six largest EU-countries (country of representative) in
total filings at the EPO
Source: EPO – PATSTAT; Fraunhofer ISI calculations.
0%
5%
10%
15%
20%
25%
30%
35%
40%
45%
50%
2000 2001 2002 2003 2004 2005 2006 2007 2008 2009 2010
DE GB FR IT NL SE

12
Figure 7: Number of patents processed by representatives in a country as a
share of applications from that particular country
Source: EPO – PATSTAT; Fraunhofer ISI calculations.
Figure 8: Growth rate (CAGR) of filings by representative country*, 2000-
2010
* For the missing EU-28 countries in this figure no CAGR has been calculated as the numbers in the early
years were zero.
Source: EPO – PATSTAT; Fraunhofer ISI calculations.
0%
100%
200%
300%
400%
500%
600%
700%
GB DE IE EU BG IT HU LU FR ES NL BE LT SE DK PL EE CZ HR LV FI AT PT SI SK GR RO CY MT
-5%
5%
15%
25%
35%
45%
55%
65%
75%
PL HU CZ ES PT BG GR AT FI SE IT IE FR DK DE BE NL EU LU GB

13
6 The structure of the representatives' clients
This section of the report focuses on the structure of the clients and not so much on the
representatives themselves, so here the applicant country as an additional dimension
comes in as well as the applicant type – differentiating SMEs, large enterprises,
PRO/universities, and individual inventors – and a differentiation of internal and exter-
nal representatives. Finally, this section also contains a differentiation by technological
fields.
Figure 9: Shares of applicant country groups by country of representative,
2010
Due to low absolute numbers, data for Malta and Cyprus are not analysable.
Source: EPO – PATSTAT; Fraunhofer ISI calculations.
Figure 9 provides the shares of applicant country groups – namely domestic, other-EU
and non-EU – by country of residence of the representative in the year 2010. For Malta
and Cyprus no usable data is available, due to low absolute numbers. Slovenia's and
Slovakia's representatives only process patents for domestic applicants. Also in a
number of other countries, among them Finland and Austria, the representatives proc-
ess high shares of applications by domestic applicants. High shares of filings from ap-
plicants located in other European countries can hardly be found. Greece, Hungary and
the Czech Republic as well as Latvia are exemptions, but with low absolute numbers.
12.4% of the patents processed by Belgian representatives are owned by applicants
from other European countries, which is a rather high share compared to most of the
0% 10% 20% 30% 40% 50% 60% 70% 80% 90% 100%
LU GB
IE RO DE BG EU HU LV BE SE
DK NL FR ES
GR HR IT PL LT AT PT CZ EE FI SI
SK CY MT
domestic other-EU non-EU

14
other countries. This might be due to language advantages of Flemish representatives,
also processing filings from the Netherlands and Wallonian representatives processing
filings from France. It is most interesting to see – and this was already mentioned
above – that a number of representatives in particular countries, namely UK, Ireland,
Germany but also Bulgaria and Luxembourg process high shares of applications by
non-European applicants. At least for the UK, Ireland and also Germany explanations
for this pattern have been already mentioned. Next to language advantages – English
is one of the official languages of the EPO and a universal language in business and
science –, also experience (economies of scale) and even a geographical proximity to
the EPO in the case of Germany are reasonable factors.
Figure 10: Shares of applicant types by country of representative, 2010
Due to low absolute numbers, data for Malta and Cyprus are not analysable.
Source: EPO – PATSTAT; Fraunhofer ISI calculations.
Differentiating the applicant types, Figure 10 provides information on the shares of the
four groups by country of residence of the representative in the year 2010. Again, data
for Malta and Cyprus is not available, due to low absolute numbers. While especially
the representatives from Eastern European countries, from the Southern European
countries Portugal and Spain, as well as Denmark result in shares of SME applicants
close to 50% or above, Germany, the UK, the Netherlands, Sweden, France as well as
Finland, Belgium, Ireland and even Luxembourg have rather high shares of large en-
terprises. Public research organisations and universities reach rather low levels in most
of the countries, but play major roles in Hungary, Greece, Portugal or Latvia. Individual
0% 10% 20% 30% 40% 50% 60% 70% 80% 90% 100%
RO LT EE LV BG PT HR SI
CZ GR SK HU PL ES AT DK
IT LU IE
BE FI
FR SE NL EU GB DE CY MT
SME large enterprise PRO/university individual inventor

15
inventors, on the other hand, are the only clients for Romanian representatives (but
these were only 4 patents in 2010) and are large groups in Greece, Slovakia, Hungary,
Slovenia, Slovakia as well as Latvia or Bulgaria.
Figure 11 shows that in Belgium and the Netherlands around 40% of the representa-
tives are employed by the applicant – so are by us defined as internal. Shares around
30% of internal representatives can also be found in Slovenia, Sweden and Finland. In
France, for example 10% of the patents are processed by internal representatives and
90% by external representatives, respectively. In the UK and Germany this share is
about 6.5% or 6.3%, respectively. At least in the case of Germany this might be some-
how surprising as the share of patent applications filed by large applicants is rather
high. As large applicants have a higher probability of employing internal representa-
tives, the expectation for this share might have been higher. One explanation again is
that about two thirds of the patents processed by German representatives are filed by
non-European applicants. Another explanation is that there might be a higher division
of labour between internal and external representatives, simply due to the fact that
German companies have a high absolute output of patent filings, which cannot all fully
be processed by internal representatives.
Figure 11: Shares of patents processed by internal representatives by country
of residence, 2010
Due to low absolute numbers, data for Malta and Cyprus are not analysable.
Source: EPO – PATSTAT; Fraunhofer ISI calculations.
0%
5%
10%
15%
20%
25%
30%
35%
40%
45%
BE NL SI SE FI RO LU DK FR EU GB DE PL IT AT CZ ES BG EE GR HR HU IE LT LV PT SK

16
Figure 12 depicts the shares of internal representatives by applicant types for the total
of European filings as well as filings made by EU-28 applicants. Large enterprises em-
ploy by far more internal representatives than any of the other groups. It is interesting
to note, however, that the shares of internal representatives are higher for total applica-
tions to the EPO than only by applicants from EU-28 countries – this means essentially
that they are much higher for non-EU-28 countries. The explanation might be that a
number of multinational companies have subsidiaries in Europe, very often with IP de-
partments or even simply IP management subsidiaries, which then fulfil the criteria of
article 134 of being a resident of the EPC states and/or having its place of business in
Europe.
Figure 12: Shares of patents processed by internal representatives by appli-
cant type, 2010
Source: EPO – PATSTAT; Fraunhofer ISI calculations.
Employing a classification suggested by Schmoch (2008), we were able to calculate
the number of representatives active in technology fields. Figure 13 depicts the abso-
lute number of distinct representatives per field. It has to be kept in mind, however, that
between the fields one representative might occur several times. In other words within
the fields there is no double counting, whereas between the fields there might be dou-
ble/multiple counting. In electrical machinery as well as in medical technology and
measurement more than 2,000 representatives have been active in the year 2010. The
fewest representatives can be found in the small fields (in terms of patent applications)
of Micro-structural and nano-technology, but also in food chemistry, polymers or textile
and paper machines.
0% 2% 4% 6% 8% 10% 12% 14%
SME
Large enterprises
Individual iventor
PRO/universities
EU-28 applicants
Total

17
The average number of technological fields per representative in each of the countries
of residence of the representative is shown in Figure 14. Representatives from Ireland
and the UK cover – on average – more than 25 or more than 20 fields, respectively.
This might be seen as another indication of rather high shares of subsequent patents
with priorities outside Europe – especially in the US –, where representatives from
these countries mainly act as corresponding representatives. For acting as correspon-
dence it is not absolutely essential to be an expert in the particular technological field.
At first sight, however, the result for Germany is in contradiction to this line of argumen-
tation as the average number of fields is only 13. We had found high shares of filings
for German representatives originating in non-European countries. Based on these
additional insights we might be able to further qualify the above-mentioned result. For
Ireland and the UK the language advantage seems to be the decisive factor for the
high shares of non-European filings. For Germany, the language advantage does not
really hold, but the proximity to the EPO and the economies of scale, due to a large
number of national filings might be attracting factors. In general, Figure 14 shows that
representatives in the Northern and Western innovation-oriented countries seem to be
able to cover a larger number of technological fields, whereas – maybe also as a mat-
ter of low absolute numbers – representatives in the Southern and Eastern European
countries are more concentrating their technological expertise.

18
Figure 13: Absolute number of representatives per technology field*, 2010
Source: EPO – PATSTAT; Fraunhofer ISI calculations.
0 500 1000 1500 2000 2500
Micro-structural and nano-technology
Basic communication processes
Food chemistry
IT methods for management
Analysis of biological materials
Macromolecular chemistry, polymers
Textile and paper machines
Control
Environmental technology
Optics
Semiconductors
Biotechnology
Telecommunications
Materials, metallurgy
Thermal processes and apparatus
Audio-visual technology
Digital communication
Surface technology, coating
Organic fine chemistry
Furniture, games
Other consumer goods
Engines, pumps, turbines
Machine tools
Basic materials chemistry
Pharmaceuticals
Mechanical elements
Handling
Computer technology
Transport
Civil engineering
Chemical engineering
Other special machines
Measurement
Medical technology
Electrical machinery, apparatus, energy

19
Figure 14: Average number of technological fields per representative by coun-
try of representative; 2010
Due to low absolute numbers, data for Malta and Cyprus are not analysable.
Source: EPO – PATSTAT; Fraunhofer ISI calculations.
7 Conclusions
The analysis of the structure of representatives at the EPO shows a high concentration
in absolute as well as in relative terms on Germany and the United Kingdom, with
some activity in other larger applicant countries like France, Italy, Sweden or the Neth-
erlands. As a matter of fact the most experienced representatives are located in Ger-
many and the UK, but this result might be biased due to high numbers of subsequent
filings in these countries, originating mainly in the US or also Japan. Explanations for
this effect are language issues in the case of the UK (and also Ireland) and geographi-
cal proximity to the EPO as well as economies of scale in the case of Germany.
Large companies are responsible for the majority of the representatives’ workload in
Germany and the UK, but also in France, the Netherlands, Belgium or Sweden – of
course mainly because many large and also multinational companies have their head-
quarters or IPR departments in these countries. The much lower absolute numbers of
patents in Southern and Eastern European countries mainly stem from SMEs, individ-
0
5
10
15
20
25
30
IE GB FI IT EU NL SE FR DE LU AT DK HU BE ES LV PT SI EE CZ PL LT BG HR GR CY RO SK MT

20
ual inventors and in some countries – for example like Portugal, Greece, Hungary or
Latvia – also stem from public research organisations or universities, which account for
large shares of filings from these countries.
It could be worthwhile to analyse the role of the representatives in the patenting proc-
ess and their impact on the filing outcome or the filing strategy. A focus on the experi-
enced representatives especially in the larger countries might be efficient and for a
broad picture also sufficient. A distinction between first and subsequent filings seems a
relevant dimension. Internal versus external as well as registered European attorneys
versus other legal representatives also seems a reasonable distinction to be taken into
account.
8 Data annex
21
Table 2: Number of filings represented by representatives by country (2000-2010)
Country 2000 2001 2002 2003 2004 2005 2006 2007 2008 2009 2010
AT 734 740 780 774 875 816 913 915 935 1027 1027
BE 1286 1232 1392 1380 1629 1710 1764 1807 1722 1384 1545
BG 7 6 12 13 22 25 20 12 11 12 14
CY
CZ 18 21 42 63 58 54 78 104 97 94 105
DE 44086 44161 46353 50040 53142 55611 54666 54372 50967 51920 54666
DK 919 866 848 948 954 1094 974 1133 1090 1018 1150
EE
3 7 3 14 3 9 26 20 24 26
ES 565 614 752 830 1074 1153 1278 1311 1337 1362 1470
FI 914 865 828 874 898 869 905 1018 1055 1106 1185
FR 8062 8246 8550 8912 9321 9600 9827 10331 10293 10118 10281
GB 33859 32299 32562 32962 35010 35563 33979 31670 29545 29537 29923
GR 9 11 22 21 11 23 27 25 19 17 16
HR
1 1 1 4 7 4 6 14
HU 11 26 38 50 57 48 52 79 81 100 104
IE 798 785 788 700 808 1129 1056 1115 1058 1120 1020
IT 3770 3840 4042 4338 4622 4900 5011 4876 4809 4614 4870
LT
1 7 10 11 4 16
LU 439 432 375 513 507 539 490 484 449 348 417
LV
3 7 8 9 14 13 13
MT
NL 3593 3767 4280 4407 4819 4949 5038 4327 4614 4656 4216
PL 1 4 15 44 92 107 108 147 171 199 251
PT 22 19 19 40 44 59 59 53 74 43 47
RO
1 5 2 8 7 2 1 3 4
SE 2302 2088 2194 2146 2358 2452 2709 2991 3042 2629 2981
SI
4 12 29 36 26 16 36 46 38 42
SK
2
4 3 10 16 14 12 15 15
total 104462 103026 107088 112519 120029 124567 122971 120694 115102 115205 119651

22
Table 3: Average number of technological fields per representative by country of representative; 2000-2013
2000 2001 2002 2003 2004 2005 2006 2007 2008 2009 2010 2011 2012 2013
AT 9.5 9.1 9.5 9.7 11.2 11.3 11.1 10.4 10.4 11.3 11.4 10.8 8.2 2.6
BE 8.6 8.5 9.7 9.0 9.3 9.3 9.0 9.9 9.0 8.6 9.0 10.1 8.0 1.6
BG 2.1 2.2 2.8 1.9 3.2 3.2 2.7 1.9 1.6 3.6 2.7 2.0 1.0 1.0
CY --- --- --- 2.0 --- 1.0 --- --- --- --- --- 2.0
CZ 3.5 2.5 2.4 3.4 2.6 2.3 3.1 3.6 3.9 3.7 3.5 3.2 3.0 1.0
DE 11.9 12.2 12.4 12.9 12.7 12.8 12.7 13.0 13.4 13.1 12.9 12.1 9.2 3.0
DK 11.4 11.8 11.6 11.1 11.8 12.2 10.6 10.9 12.1 11.0 11.3 12.0 7.8 1.3
EE 1.7 1.7 2.2 4.0 2.2 1.6 2.4 3.5 2.4 3.2 3.5 1.9 4.2 1.0
ES 5.1 5.6 5.6 5.6 6.7 6.2 6.3 6.3 6.3 6.2 6.9 6.8 5.2 1.7
FI 15.4 16.2 15.9 15.3 15.9 16.0 15.2 14.4 16.4 17.6 17.2 17.1 10.3 3.2
FR 12.7 12.6 13.8 13.5 14.0 13.6 13.6 14.6 15.1 13.7 13.7 12.8 10.3 2.7
GB 18.3 18.4 19.1 19.5 19.7 19.3 19.3 19.4 20.2 20.0 20.3 20.5 15.4 5.3
GR 1.8 2.3 2.2 2.3 2.7 2.4 3.4 1.9 1.9 2.3 2.1 2.4 1.8
HR --- 3.0 --- 1.5 1.0 1.0 2.3 1.9 3.3 1.8 2.7 2.0
HU 5.7 9.0 9.0 9.8 11.3 9.9 9.7 11.4 11.4 10.8 9.2 9.7 3.6 1.0
IE 22.9 24.9 22.4 22.2 23.3 24.1 21.8 22.6 24.1 24.5 25.8 22.1 15.7 2.0
IT 11.6 12.8 12.6 13.2 13.5 13.5 13.7 13.6 14.3 14.3 15.7 15.1 11.1 1.7
LT --- --- --- --- 1.0 1.5 1.3 2.0 2.5 1.2 3.0 3.3 1.9 1.0
LU 15.2 14.9 13.6 16.1 12.8 13.8 13.4 14.0 13.2 12.9 11.9 11.3 9.2 1.3
LV --- --- --- 3.0 3.5 2.0 2.3 2.8 4.7 4.8 4.8 5.8 8.7
MT --- 2.0 --- --- --- --- --- --- --- ---
NL 15.8 15.3 15.4 15.0 15.6 14.6 15.6 15.9 15.8 15.4 14.6 14.9 11.0 3.7
PL 1.0 2.2 1.8 2.2 2.5 2.3 2.8 2.6 3.1 2.7 3.2 3.7 3.3 1.0
PT 3.0 3.2 3.5 5.0 4.6 4.5 3.9 3.4 7.2 5.4 4.3 5.8 2.3
RO 1.0 1.7 1.0 1.9 2.6 1.5 1.8 1.3 1.5 1.4 2.0 1.8 2.7
SE 13.1 13.8 13.2 12.7 12.8 13.6 13.7 13.8 14.8 13.3 14.3 14.3 9.8 1.5
SI 2.0 3.5 8.6 8.9 9.4 4.5 3.6 5.5 5.5 4.5 3.8 4.9 4.1 2.0
SK 1.7 1.5 1.0 1.4 2.8 1.2 2.1 1.9 2.5 2.3 2.0 2.3 1.0

23
9 Cited literature
Frietsch, R.; Neuhäusler, P.; Rothengatter, O. (2013): SME Patenting – An Empirical Analysis in Nine Countries, Discussion Papers Innovation Systems and Policy Analysis Nr. 36, Karlsruhe: Fraunhofer ISI.
Neuhäusler, P.; Frietsch, R.; Rothengatter, O. (2015): Patentierung computerimple-mentierter Erfindungen - Aktuelle Rechtslage und ökonomische Implikationen, Fraunhofer ISI Discussion Papers Innovation Systems and Policy Analysis, Nr. 46: Fraunhofer ISI, Karlsruhe.
Schmoch, U. (2008): Concept of a Technology Classification for Country Comparisons. Final Report to the World Intellectual Property Office (WIPO), Karlsruhe: Fraunhofer ISI.