Embed Size (px)
Citation preview

The Structure of Survey-Based Brand Metrics
Donald R. Lehmann Kevin Lane Keller
John U. Farley
August 2008
Donald R. Lehmann is the George E. Warren Professor, Graduate School of Business, Columbia University, 507 Uris Hall, 3022 Broadway New York, NY 10027; (212) 854-3465; [email protected]. Kevin Lane Keller is the E. B. Osborn Professor of Marketing, Tuck School of Business, Dartmouth College, 100 Tuck Hall, Hanover, NH 03755; (603) 646-0393; [email protected]. John U. Farley is the C. V. Starr Senior Research Fellow, Tuck School of Business, Dartmouth College, 100 Tuck Hall, Hanover, NH 03755; (603) 646-1431; [email protected]. Thanks to Teng Ma for research inputs, Paul Wolfson for assistance with data analysis, and the editor and reviewers for numerous constructive comments.
ABSTRACT
To better understand how a brand is performing in the marketplace, firms employ a wide
variety of measures, with consumer-based surveys often playing a central role. This paper
identifies some core dimensions of survey-based measures of brand performance, explores
how they link to each other, and examines how these dimensions vary across both countries
and categories. Studies in the U.S. and China of soft drinks, toothpaste, and fast food suggest
that survey-based brand metrics can be categorized into six main dimensions that reflect a
four stage hierarchy-of-effects AIDA-type ordering: 1) Comprehension, 2) Comparative
Advantage, Interpersonal Relations, and History, 3) Preference, and 4) Attachment. Despite
differences in culture and their history, these dimensions usefully portray different brands and
products across the different countries.
Key Words:
Brand Metrics Brand Performance Brand Measurement Global Branding International Branding
2
Recognizing the significant intangible value of brands, building and managing brand equity
has become a priority for companies of all sizes in a wide variety of industries and markets.
Consequently, monitoring brand metrics which assess how a brand is performing in the
marketplace is critically important. Given the crucial role that consumers play in the success
of a brand, many of these metrics are designed to capture various aspects of consumer beliefs,
attitudes, and behaviors towards brands, often involving consumer surveys as input. Such
metrics are increasingly being summarized in an overall scorecard or dashboard for marketers
and senior management (Kaplan and Norton 1992).
A key challenge in developing survey-based brand-metrics and brand-metrics dashboards
is the wide range of possible measures that could be employed and the potential diversity of
geographical markets where those brand metrics might be applied. Differences in survey
responses from participants in different markets may result from different interpretations of
questions, different beliefs about branding, or another underlying aspect of consumer
behavior. Accordingly, our research goal is to suggest a parsimonious set of brand measures,
and relations among them, that can be used to measure brand performance regardless of the
country market involved or the particular type of product or service being sold.
Cross-cultural research studies show that, unsurprisingly, although there is considerable
commonality across countries, significant differences often emerge. Much of the focus of
cross-cultural research is on identifying commonalities and differences and the associated
underlying factors explaining why these patterns emerge.
Prior research in branding has shown that both similar and different effects can be found
across cultures and countries. For example, in a meta-analysis of seven brand extension
3
studies across multiple countries involving a total of 131 different brand extensions,
Bottomley and Holden (2001) found that although evaluations of brand extensions were a
function of quality of the original brand, fit between the parent and extension category, and
the interaction between the two, the relative impact of each of these components varied by
brand and culture. As another example, Zhang and Schmitt (2001) showed how subtle
differences in brand names impacted brand ratings in different countries.
Much published branding research, however, has primarily focused on a single country
– the U.S – and often a single category. Given cultural differences across countries and
consumer behavior variation across categories, it is not clear that the relevant measures and
dimensions for brand metrics will be the same, much less be linked together in the same way,
across disparate markets and distinct categories. Here, we examine consumers in two
important but quite different settings, the U.S. and China, across three categories in two
studies.
The purpose of the first study is primarily scale refinement and to gain insight into
different possible measures of brand performance. Specifically, we examine two well-known,
widely advertised, but physically similar brands (Coke and Pepsi), as well as a third smaller,
challenger brand (Dr Pepper or Sprite), on various brand-related measures to see 1) how
distinct the different possible measures of brand performance are and 2) whether the measured
performance of brands differs significantly. To address cultural issues, we compare the
measured brand performance of Coke and Pepsi in the U.S. and China.
Study 2 uses the measures and scales developed in Study 1 to deduce an underlying
structure of brand metrics. We group brand performance measures into distinct factors or
core dimensions and explore their inter-relationships. Study 2 also expands our investigation
4
to brands in two other categories (Crest and Colgate toothpaste and McDonald’s and KFC
quick-serve restaurants). In addition, we examine the relative contribution of brand,
individual subjects, category, and country to brand performance ratings.
STUDY 1
Measuring Brand Performance
Study 1 was designed to assess the broad range of potential brand performance measures. To
gain some initial insights, we focused on a single category, soft drinks. To examine the
impact of culture, two countries – the U.S. and China – were utilized. Finally, much research
in marketing and consumer behavior has shown that consumer response to marketing stimuli
can be characterized along many different dimensions. In particular, research has shown that
consumer response can vary from fairly low levels of brand awareness or familiarity to highly
involved brand loyalty relationships based on affective, cognitive and behavioral
considerations (Haugtvedt, Herr, and Kardes 2008). Therefore, we examined a number of
different research models and findings to ensure that we captured a wide range of possible
consumer response and resulting differences in brand performance.
Specifically, three main sources were used. First, research by Aaker (1996), Fournier
(1998), Keller (2002, 2008), and Keller and Lehmann (2003) suggests that consumer-based
brand performance measures can be grouped broadly into five principal categories:
Awareness, Associations (i.e., image and beliefs), Attitudes, Attachment (i.e., loyalty), and
Activity (e.g., purchase, consumption, and word of mouth). Accordingly, we included aspects
of each of the five principal categories of customer mind-set identified by these authors.
Second, we then added three specific elements of Ambler’s (2000) Brand Health measures:

5
Quality, Ambiance, and Service. Finally, we reviewed three widely used commercial brand
tracking approaches for additional measures:
- Young and Rubicam’s Brand Asset Valuator (BAV) which originally measured four principle dimensions: Relevance, Differentiation, Esteem, and Knowledge.
- Millward Brown’s BRANDZ which focuses on a pyramid of factors ranging from Presence at the bottom through Relevance, Performance, and Advantage to Bonding at the top.
- Research International’s Equity Engine which describes a structural model involving five constructs: Authority (Heritage, Trust, and Innovativeness); Identification (Bonding, Caring, and Nostalgia); Approval (Prestige, Acceptability, and Endorsement); Attitude; and Performance.
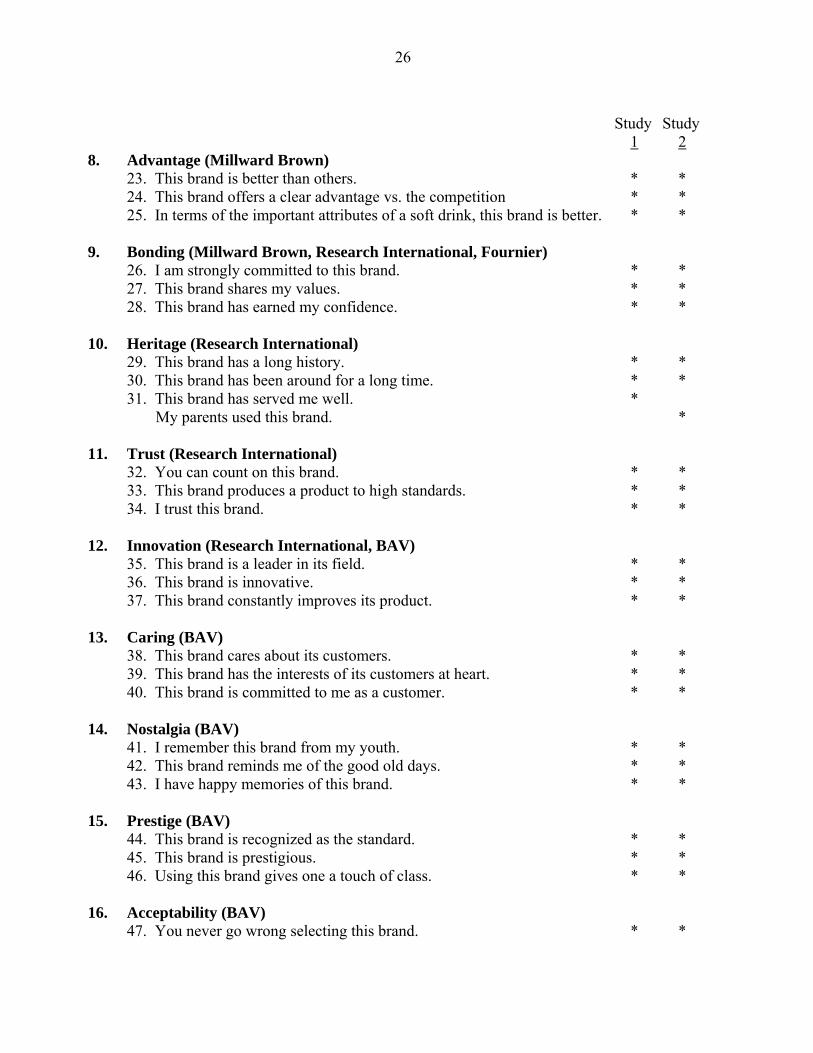
To generate scale items for the resulting 27 brand performance constructs, we began
with scales in the Handbook of Marketing Scales (Bearden and Netemeyer 1999) and refined
these based on pilot tests and discussions with individual respondents, as well as input from
market research suppliers that offer brand tracking and measurement services. This process
resulted in the scales that appear in Appendix A (with sources indicated).
Method
Study 1 focused on a single category, soft drinks, which is both widely consumed and the
subject of strong advertising and brand-building activities. Because one of our objectives was
to develop brand metrics that could distinguish between functionally similar brands in a
product category, we used both Coke and Pepsi as stimuli. To see if the structure of brand
performance, as well as the ratings of two major brands, was similar across countries, we
collected data in the U.S. (Chicago) and China (Shanghai). Finally, to see how a less-strong
brand would be rated, we included a third well-known brand in each country (Dr. Pepper in
the U.S.; Sprite in China). Although different in formulation from each other, both brands
represent established challenger brands in their respective markets.
6
Coke was introduced in the U.S. in 1886 and became the largest-selling cola drink by
the turn of the century. Pepsi was introduced in the U.S. in 1898. Coke got a strong
international push during and after World War II. Coke and Pepsi both secured permission to
operate in China during the early 1980’s as the economic reforms developed. Pepsi was the
first-to-market, with Coke close behind. Both brands sold (and sell) at significant price
premiums in China, where consumers consider “value for money” very important (Yang,
Farley, Hoenig and Liu 1999).
Data was collected by Research International using a shopping mall intercept approach.
Subjects were 100 adults (age 18 and over), evenly split between men and women, in each
country. Subjects were paid for their participation and rated the three brands on the 84 items
in Appendix A on five point scales, where higher numbers indicated greater agreement. In
addition, they provided demographic data, consumption patterns, and appropriate dollar and
yuan metric preferences among the three brands.
Findings
Scale evaluation. The first step in the analysis was to determine whether the 27
constructs were internally consistent. We examined each construct by computing average
item-item correlations both within and between each construct. We also computed coefficient
alpha and re-examined question wording. This resulted in the following modifications:
1. Item 3 (When you think of a soft drink, this brand comes to mind) did not fit well with
the other Presence variables. It also was not a good fit with the Awareness variables. Therefore we dropped it from the analyses.
2 Item 6 (I am quite familiar with) correlated more with the Knowledge measures and was therefore included there.
3. Item 22 (This brand lives up to its promises) was similarly related to Performance and
7
Trust measures and was dropped.
4. Item 31 (This brand has served me well) was moved to Performance since it was more correlated there.
5. Item 64 (There is a good substitute for this brand) had low correlations to other items and was dropped from Loyalty.
6. Items 74 and 75 (positive associations, positive thoughts) added nothing to the other four measures of Overall Attitude and were dropped to achieve parsimony.
7. Item 80 (I am unlikely to change my opinion of this brand) was dropped from Persistence since it focused on opinion vs. action.
The final 78 items included in each construct along with average inter-construct
correlations and coefficient alpha appear in Table 1. All the constructs appeared to have
adequate reliability, as all coefficient alphas were .76 or greater. Averages of the 78
remaining items were used to capture the 27 brand performance constructs. Given the nature
of the task, it is not surprising that there was considerable correlation among the constructs,
i.e., a large component of consumer response was overall liking of the brand, reflecting a halo
effect or common method variance.
(Insert Table 1 about here)
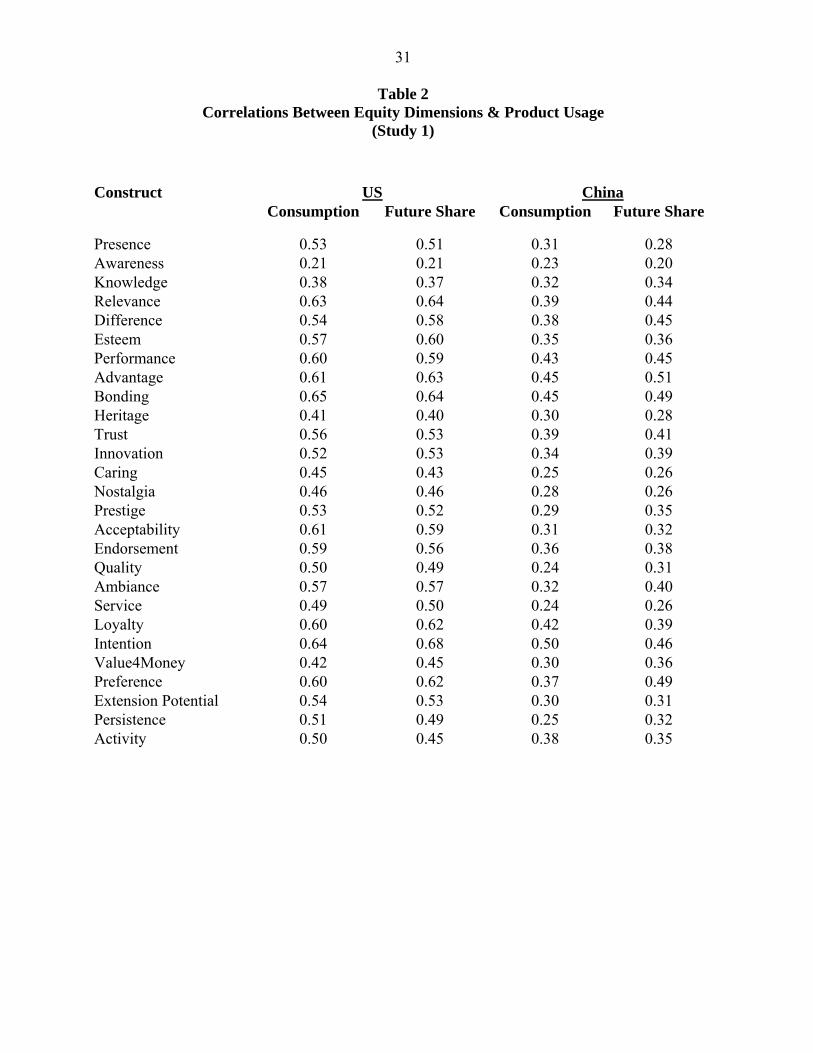
Predictive power of the dimensions of brand performance. We analyzed the
predictive power of measures of brand performance using two different behavioral measures,
past consumption and planned share of next ten purchases. The simple correlations of the 27
brand performance constructs with these key behavioral measures are shown in Table 2. All
of the correlations are positive and significantly different (p < .05) from 0. In the U.S., 23 of
the correlations range from .5 to .6, suggesting a consistently strong relationship.
(Insert Table 2 about here)
8
These results indicate that there is a significant relationship of brand performance measures
with both backward- and forward-looking behavioral measures.
Brand Profiles
If the 27 measures of brand performance are to be of much use within a product category,
they need to discriminate among brands. To see if they did, we computed the mean for each
brand and tested for significant differences. In the U.S., both Coke and Pepsi rated
significantly higher than Dr. Pepper on all 27 measures, with the smallest t-value greater than
3.1 More interesting is the comparison of Coke vs. Pepsi (see Table 3). At least for this
Chicago sample, Pepsi was rated higher on all the measures except Heritage and Nostalgia
and significantly higher (p<.05) for eight measures: Relevance, Advantage, Bonding,
Loyalty, Value for the Money, Overall, Extension Potential, and Persistence.
(Insert Table 3 about here)
In China, the picture was noticeably different. Coke was statistically significantly
stronger on Heritage and Nostalgia than Pepsi (p<.05), and at statistical parity with Pepsi on
the other 25 measures (there were no significant differences and no patterns in the signs: 11
were positive and 14 negative). This finding is consistent with the notion that, given its brand
development, Coke’s relative advantage in marketing in the international arena is its history.
As in the U.S., Coke and Pepsi were significantly stronger (p<.05) than the third brand
(Sprite) for all 27 dimensions for Coke and for 25 of 27 dimensions for Pepsi.
Examining the differences between countries (see Table 4) is potentially informative,
even though some distinctions may be due to different response styles in the two locations and
cultures. For Coke, it appears that only four measures are significantly higher in the U.S. 1 Here we report the conservative and less powerful independent t-test rather than the paired t-test which accounts for the repeated measures nature of the data. Obviously, the paired t-tests are even more significant.
9
compared to China: Knowledge, Nostalgia, Endorsement, and Extension. For Pepsi, however,
on 26 of 27 measures, the U.S. scores are larger, and 18 of these are significantly so. There
are no measures where Pepsi is rated significantly higher in China than in the U.S. This result
again suggests that Pepsi is not as strong a global brand as Coke in this context – its image is
significantly stronger in the domestic U.S. market than in its foreign China market.
(Insert Table 4 about here)
Summary
Overall, the results of this pilot study were encouraging. Specifically, 27 measures of brand
performance were analyzed. As expected, these measures were highly correlated. In our
samples, Pepsi’s brand performance appeared stronger in the U.S., but Coke’s brand
performance appeared stronger in China. In order to get a more complete view of the
measures of brand performance, in the next study we slightly modify the scales, examine the
underlying factor structure to these measures, and explore how the resulting dimensions inter-
relate and vary across categories, brands, and countries.
STUDY 2
The second study had three key goals. First, we replicate Study 1 results on a new sample,
employing multiple categories to enhance generalizability. Second, we explore the
underlying core dimensions of brand performance and how they relate to each other. Finally,
we consider the sensitivity of brand performance measures with respect to different brands,
categories, and countries. In addition, we control for differences in response styles and the
halo effect by normalizing responses within respondents.
Method

10
This study used the same 27 brand performance constructs. In Study 2, for simplicity and
clarity, we used three items per construct for a total of 81 items. As a result, modest changes
were made to thirteen of the scales; fourteen scales were unchanged (see Appendix A).
In addition to studying soft drinks, which allows for comparisons with the first study, we
also included fast food restaurants and toothpaste. We used two brands per category in order
to reduce the demands on the subjects. The specific brands used were Coke and Pepsi (soft
drinks); KFC and McDonald’s (fast food); and Colgate and Crest (toothpaste).
Adult men and women subjects were recruited in both the U.S. and China by Synovate,
a leading market research firm. Specifically, 150 respondents were recruited using the same
criteria as before at shopping malls in both Chicago and Shanghai. Each respondent provided
information on two brands in two product categories. The categories were combined into
three different versions (Soft Drinks – Fast Food, Soft Drink – Toothpaste, and Fast Food –
Toothpaste). One third of the sample (50) completed each version (4 brands overall). These
assignments resulted in a sample of 100 for each brand.
Results
Measurement invariance. We first performed exploratory factor analyses to determine
the structure among the 27 brand performance constructs. Each construct was measured by
the average of the three items designed to measure it (per Appendix A). In order to compare
constructs across countries, it is desirable to measure them consistently (He, Merz, and Alden
2008). To do so, we pooled the data across countries to identify the factors. We compared
this pooled factor structure with factor structures derived from separate analyses for each
11
country. The results in Table 5 suggest generally consistent results.2 For example, of the 22
measures that loaded heavily (>.60) on a factor in the analysis of the pooled data, 15 of them
loaded at least .50 on the corresponding factor in the analysis of both countries. In terms of
exceptions, Innovation was less closely tied (.36) to Interpersonal Relations in the U.S., and
Nostalgia was less linked (.30) to History in China. Also, interestingly, Persistence was not
linked to History in the two countries when analyzed separately, but was (.67 and .70) when
the data was pooled.
(Insert Table 5 about here)
Because the factor structure of brand performance is quite stable across countries, we
pooled data across categories (soft drinks, fast food, and toothpaste) and countries (U.S. and
China) and ran a varimax, orthogonally-rotated factor analysis on this combined data set.
There were only 2 eigenvectors greater than one, not surprising given the length of the survey
and the fact that the constructs are logically correlated. The first factor alone accounted for
64% of the variance, suggesting again that simple brand affect or common method variance
accounts for most of the responses.
Factor structure. Based on 1) theoretical reasons for expecting more factors, 2) the
observed distribution of the eigenvectors from the scree plot, and 3) the interpretability of the
results, however, we concluded that we should examine the factor structure in more detail.
Appendix B describes our approach in deciding on the number and the nature of factors. This
2 We also ran a factor analysis on the data with the subject means removed to account for one aspect of method bias. There were 4 eigenvalues greater than 1, accounting for 62% of the variance. For reasons of interpretability, and because the first eigenvalue still dominated and accounted for 42% of the variance, we again looked at a 6-factor solution. This solution accounted for 68% of the variance. Because the factor structure appeared largely consistent even when accounting for individual differences, we report the raw data results here.

12
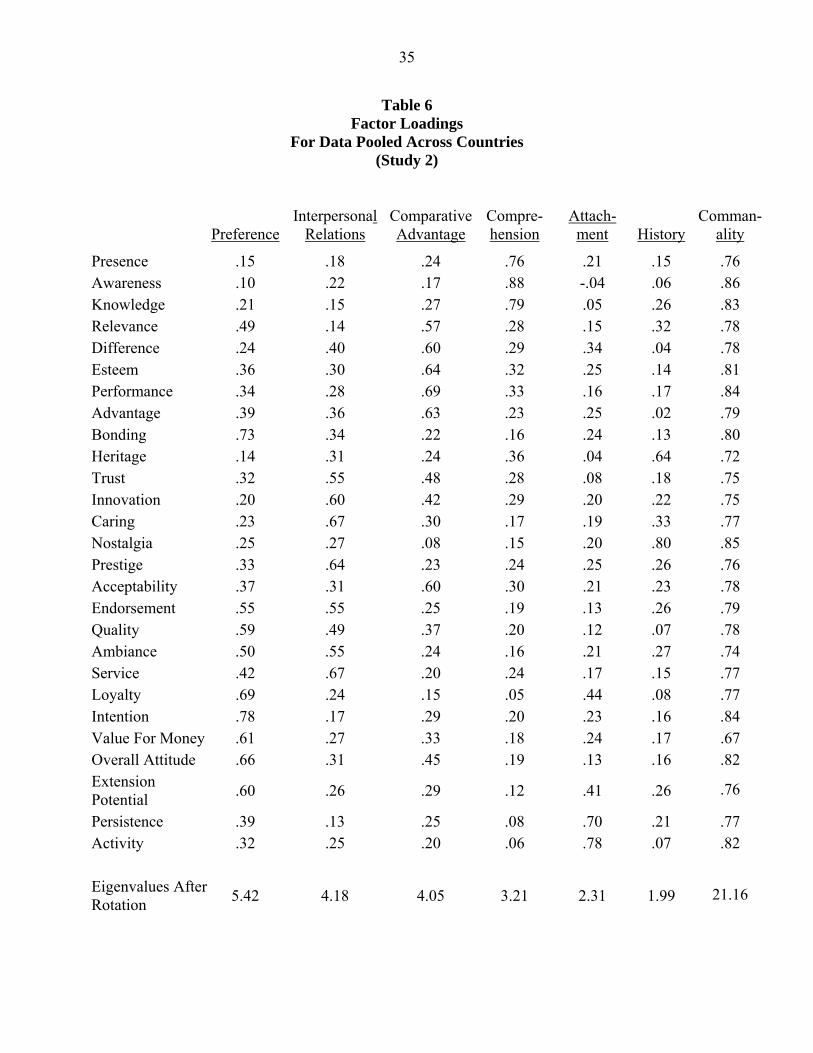
approach yielded a 6-factor solution as the best (see Table 6). The six factors accounted for at
least 71% of the variance in each of the 27 constructs, and overall accounted for 79% of the
total variance. Twenty-two of the constructs loaded cleanly (above 0.6) on a single factor. The
groupings, along with our name for the factors, are:
Factor Constructs 1. Comprehension Presence, Awareness, Knowledge 2. Comparative Advantage Difference, Esteem, Performance, Advantage,
Acceptability 3. Interpersonal Relations Caring, Prestige, Service, Innovation 4. History Heritage, Nostalgia 5. Preference Bonding, Loyalty, Intention, Value for Money, Overall
Attitude, Extension Potential 6. Attachment Persistence, Activity
(Insert Table 6 about here)
Of the other constructs, Relevance loaded on both Comparative Advantage and
Preference, Trust loaded on both Comparative Advantage and Interpersonal Relations, and
Endorsement, Quality, and Ambiance loaded on both Interpersonal Relations and Preference.
Therefore, to maintain as much discrimination as possible among the factors, we did not
include these constructs in any of the six factors.
Convergent and discriminant validity. We next created composite measures of the
factors by averaging scores on those constructs identified above as related to the factors. To
test for convergent and discriminant validity, we examined average construct-to-construct
correlations (see Table 7) between and within the factors, as well as computed coefficient
alpha when appropriate, i.e., when 3 or more constructs belonged to a factor. While all pairs
of factors had statistically significant positive correlations, the average intra-factor item
correlations were significantly larger than the average inter-factor item correlations and the
13
inter-factor correlations were significantly less than one. These results thus suggested the six
factors have both convergent and discriminant validity (Churchill 1979; Peter 1981).
(Insert Table 7 about here)
As a further test of discriminant validity, we selected 8 pairs of constructs with the
largest pairwise correlations, and therefore the pairs most likely not to have discriminant
validity. In Study 2, several pairwise correlations exceeded 0.70. The largest were:
Construct-to-construct correlation Ambiance – Endorsement .79 Quality – Overall Attitude .77 Acceptability – Performance .77 Intention – Attitude .79 Intention – Bonding .78 Difference – Advantage .78 Esteem – Performance .82 Knowledge – Awareness .76
Per the procedure suggested by Fornell and Larcker (1981), we calculated the "average
variance extracted" for each latent construct and then estimated the correlation between the
pair of constructs at the latent construct level in a confirmatory factor model. Discriminant
validity would be supported if both constructs' average variance extracted was greater than the
squared correlation between them. Seven out of eight pairs satisfied this test. The one pair
that did not was Esteem and Performance, the pair with the highest pairwise correlation.
These findings suggest that there is technically discriminant validity for the constructs,
although the high correlations suggest a parsimonious subset can capture most of the
information in them.
The Structure of Brand Performance

14
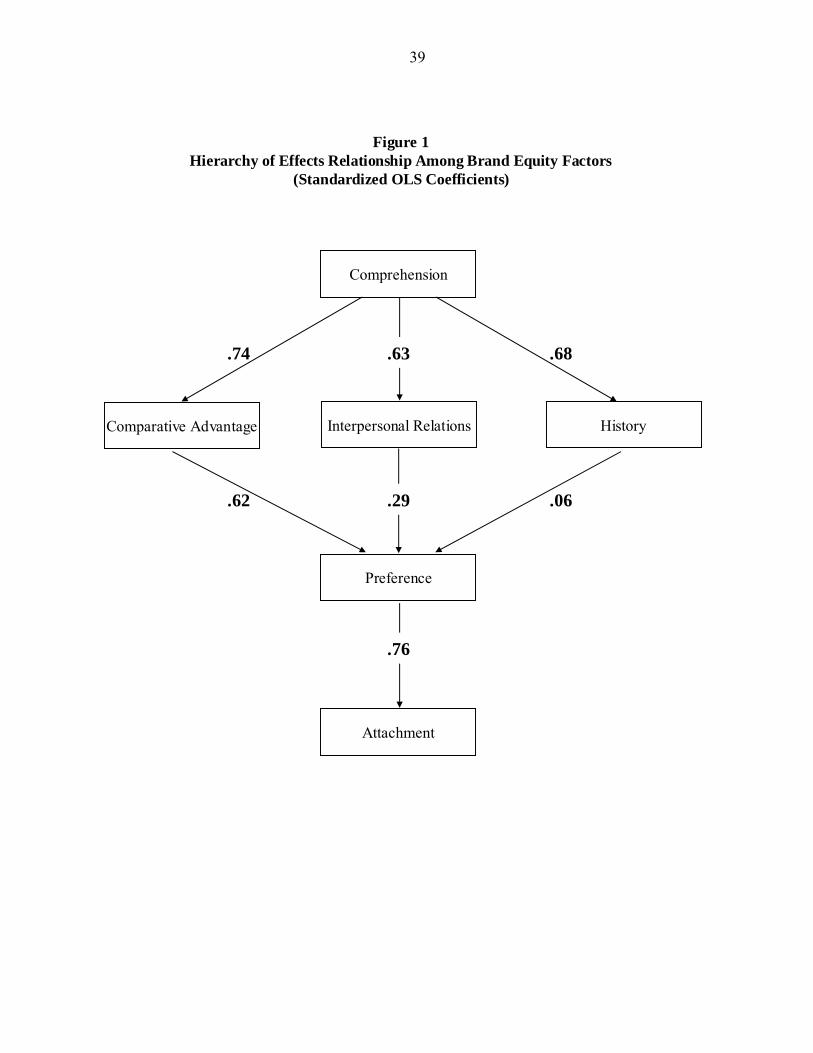
The six factors varied in content and valence in a way that appeared to be consistent with an
Awareness-Interest-Desire-Action (AIDA) hierarchy-of-effects structure (e.g., Howard and
Sheth 1969, Lavidge and Steiner 1961). Therefore, we examined the links between factors
via a structural model. We used item averages to measure the 27 constructs and construct
averages to measure the factors. Since the model is recursive, we used OLS regression to
estimate the links. The results are interesting and, importantly, can be related to prior
consumer behavior research (see Figure 1).
(Insert Figure 1 about here)
The first factor, Comprehension is strongly and significantly positively related to
Comparative Advantage, Interpersonal Relations, and History (β = .74, .63, and .68; t = 32.2,
25.4, and 23.8, respectively, p < .001). Of these three factors, Comparative Advantage is
most strongly related to Preference (β = .62; t = 23.9, p < .0001), followed by Interpersonal
Relations (β = .29, t = 10.1, p < .0001), with History having a much smaller but still
significant relationship (β = .06, t = 3.0, p < .01). As expected, Preference is strongly related
to Attachment (β = .76, t = 30.9, p < .0001).3
Based on this analysis, brand performance can be thought of in terms of four stages: 1)
Awareness, 2) Image and Associations (which encompasses Comparative Advantage,
Interpersonal Relations and History), 3) Preference, and 4) Attachment. The sequence
suggested by these four stages closely resembles the traditional AIDA-type hierarchy of
effects models found in much past research, as well as the conceptual model of brand value
creation put forth by Keller and Lehmann (2003). Brand performance can thus largely be
3 When we used the data with the subject means removed, the same pattern of results emerged, albeit with somewhat smaller coefficients.
15
captured by a small number of core dimensions that are inter-related in a logical structure
among themselves.
What Impacts Performance Ratings?
A question has been raised as to whether many of the effects that are ascribed to brand
performance may be at least partly due to category characteristics. For example, all soft
drinks may be seen as “fun,” all cars may provide “freedom,” and so on. Therefore, we
explored the extent to which brand performance ratings are driven by category vs. individual,
brand, or country factors by examining the source of variance in the responses to both the 27
constructs and the 6 factors.
Specifically, we performed separate ANOVAs on each of the constructs (and factors).
In these analyses, we allowed for the effects of country, category, and brand X category
interaction (since brand was nested within category), as well as category X country and
category X brand X country interactions (to see if results were unique to countries). We also
included a variable to control for individual differences in average responses (e.g., to capture
“yea-saying”).
The results (see Table 8) are instructive. Unsurprisingly, half of the communal
variance comes from individual differences, which captures true differences as well as halo
effects and response-style-based common method effects. The treatment factors, on average,
account for an additional 3.7% of the variance, leaving 46.3% as unexplained variance or
“noise.”
(Insert Table 8 about here)
Of the treatment factors, country had the largest effect on 14 of the constructs and
country interactions were largest in 10 cases. Country accounted for the largest amount of
16
variance explained (1.65%), followed by category (0.60%) and brand within category
(0.16%). The country-specific interactions accounted for 0.70% and 0.68%. Thus, there is
far more variance within than between country. Because the specific brands studied here
were all well-known and established, they produced relatively similar responses.
Looking at the each of the 27 constructs individually produces an interesting pattern.
Many of these are primarily country-driven (e.g. Awareness, Knowledge, Heritage, Nostalgia,
Acceptability, and Activity). Interestingly, brand has its impact not by category, but by
country and category. In other words, brand effects were country-specific. Constructs with
the largest systematic brand component, relative to the others, were Bonding, Intention, and
Overall Preference, all of which loaded on the same (evaluative) factor. This is illustrated by
the relatively small differences in mean ratings between the two brands studied in each
country.
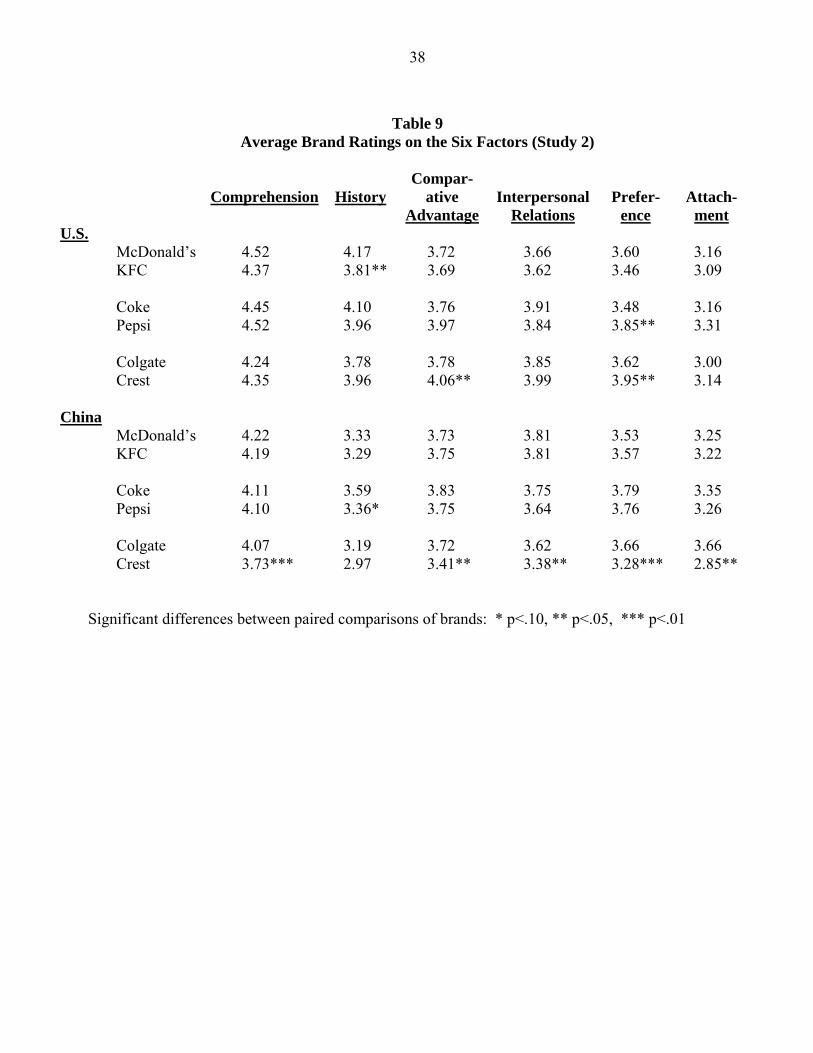
Unsurprisingly, the two major brands in each category – given their maturity and the
competitive nature of the categories – are similarly rated, on average, in terms of the six
factors (see Table 9). In large part, brand performance is due to overall liking. There are
some significant differences, however, on several factors between Crest and Colgate, with
Crest showing some superiority in the U.S. and Colgate showing some superiority in China.
This indicates that these brand performance dimensions can capture different images for the
major brands in a category.
(Insert Table 9 about here)
Note further that the Coke and Pepsi results are generally consistent with Study 1
results. Specifically, in the U.S., Coke had a positive, albeit insignificant advantage on the
History factor (Heritage and Nostalgia), whereas subjects generally had a more positive

17
attitude toward Pepsi. In China, Coke also has a significant advantage in terms of the History
factor and is essentially equivalent on the other five factors.
DISCUSSION
Summary and Implications
Perhaps because of its importance, brand performance has been approached in a number of
different ways by a number of different researchers employing a number of different
measures. This paper examined a broad range of these measures to explore their overlap and
to uncover core underlying dimensions and the structure of brand performance metrics which
balances parsimony and completeness. The paper also explored how different dimensions of
brand performance and profiles of leading brands might vary by country.
Study 1 showed that twenty-seven measures or constructs of brand performance can be
identified with satisfactory validity. In terms of understanding how profiles varied by
country, there were large differences between major and lesser brands and smaller – but
significant – differences among the two major brands, Coke and Pepsi. Country differences
between the U.S. and China were also evident in the ratings, providing some interesting
insights on the “globalness” of these globally marketed products.
Just as Deshpandé and Farley (1998) reviewed different scales of market orientation to
derive a simplified set of measures that parsimoniously capture the dimensions of market
orientation (Narvar and Slater 1990; Kohli, Jawarski, and Kumar 1993; and Deshpandé,
Farley and Webster 1993), we attempted to accomplish, as much as possible, a similar task
here for brand performance. What then are the core dimensions of brand performance? The
results suggest that brand performance can be usefully characterized according to six factors:
1. Comprehension: How much the brand is seen and thought of;
18
2. Comparative Advantage: How favorably regarded and well-differentiated the branded
product is;
3. Interpersonal Relations: Interpersonal, social aspects;
4. History: Past brand-related events, episodes and emotions;
5. Preference: Consumer attitudes towards the brand and its purchase; and
6. Attachment: How strongly consumers connect to and interact with the brand.
This six factor structure informs a number of key issues about brands, branding, and
brand performance. First, the six factors tap into a broad range of aspects of the brand and
vary in terms of tangibility, relationship to the product, level of abstraction, and self-
orientation. For example, Comprehension is a fairly direct, non-evaluative, product-related
measure; on the other hand, Attachment is a much higher order personal and evaluative
response. The remaining factors fall somewhat in between.
Our analysis thus reinforces the observation that no single measure fully captures the
richness of brand performance. For marketers to gain a full understanding of their brand
performance, multiple sets of measures and factors must be employed. Interestingly, even
some of the well-known industry models may not provide a full portrayal of brands given that
they lack certain measures. For example, the four original dimensions of Young &
Rubicam’s Brand Asset Valuator tap into Comprehension, Comparative Advantage, and
Preference, but seem much farther removed from Interpersonal Relations, History, and, to
some extent, Attachment. The recent addition of the Energy dimension to the model partially,
but not completely, rectifies this limitation.
Second, there is a logical sequence to the brand performance factors: 1)
Comprehension, 2) Comparative Advantage, Interpersonal Relations, and History, 3)

19
Preference, and 4) Attachment. The relationships among the six factors are consistent with
classic models of consumer decision-making (Lavidge and Steiner 1961) and brand building
(Keller 2008) that involve a hierarchy of effects – from simple, basic aspects of brand
awareness and knowledge to more involved consumer loyalty relationships. Of the best
known industry models, BRANDZ most explicitly incorporates a hierarchy of effects type
structure. We suggest capturing the links among the factors is important in and of itself.
Third, the study results point out the importance of brand intangibles. In an
increasingly less differentiated world, marketers may need to transcend physical product to
create more abstract associations. In this study, two factors of brand image were identified
that are not directly related to product performance – History and Interpersonal Relations –
and deserve greater attention.
History is a function of heritage and nostalgia and clearly offers an opportunity for
differentiation – it is impossible for a new firm or brand to “turn back the hands of time” to
achieve equivalence on this factor. As long as this history can be made relevant, it can play a
role in helping position a brand. The danger with heritage and nostalgia, however, is that the
brand can seem old-fashioned and not up-to-date, making it hard to attract new, younger
customers. Ideally, a brand would be seen as timeless – classic, but contemporary at the same
time.
Interpersonal relations deal with caring, service, and prestige, as well as
innovativeness. This dimension reflects how the customer feels he or she is treated by the
brand. Increasingly, these types of brand associations are necessary to create differentiation
in the absence of more tangible or direct product differences. With consumers becoming
increasingly empowered, companies will be judged more frequently on their attitudes and
20
behaviors towards customers. Put differently, consumers will value brands that provide
something special in terms of how they treat customers (Caring and Service), how other
customers see the brand (Prestige), which is related to social approval, and what new
offerings they introduce.
Finally, the results show that the structure of brand performance is similar across
countries. Interestingly, however, although the ratings of the brands within categories varied
significantly, country and category factors explained more variance than did the specific
major brands. Put differently, there is a clear distinction between categories and between
leading and secondary brands, but not necessarily as much distinction between the strongest
top brands within a category, at least within the brands we studied.
Limitations and Future Research
There are important limitations to our study. The substantive results are based on
specific consumer products in two countries in a particular sampling frame. Generalizability
of our results is not broadly demonstrated, although the methodology seems to be applicable
across country and product categories. The finding that there is relatively little difference
among leading brands, for example, may just reflect the particular brands chosen. Further,
more noticeable differences may emerge if subject burden is reduced or if customers loyal to
one brand are surveyed and analyzed separately. Additional methodological work can provide
even more rigorous tests of construct validity and measurement invariance, employing larger,
diverse samples, alternative question formats, and more extensive statistical tests.
Still, the results should provide both a standard of comparison as well as guidance for
future research. Future research should consider more closely how brand metrics vary by
countries, categories, and brands. Do different factors play different roles for different types

21
of countries, categories or brands? Are certain factors, e.g., Comprehension, especially
critical in entering a new geographic market or in economies like China transitioning from
command to market focus? How do the three different image factors work in different
settings and are there any interaction effects among them? We hope that these and related
questions provide fertile ground for future work.

22
REFERENCES
Aaker, David A. (1991), Managing Brand Equity. New York, NY: The Free Press.
______ (1996), Building Strong Brands. New York, NY: The Free Press.
______ and Kevin Lane Keller (1990), “Consumer Evaluations of Brand Extensions,” Journal of
Marketing, 54 (January), 27-41.
Aaker, Jennifer L. (1997), “Dimensions of Brand Personality,” Journal of Marketing Research,
34 (August), 347-356.
Aaker, Jennifer L., V. Benet-Martinez, and J. G. Berrocal (2001), “Consumption Symbols as
Carriers of Culture: A Study of Japanese and Spanish Brand Personality Constructs,”
Journal of Personality and Psychology, 81 (3), 492-508.
Ailawadi, Kusum, Donald R. Lehmann, and Scott A. Neslin (2003), “Revenue Premium as an
Outcome Measure of Brand Equity,” Journal of Marketing, 67 (October), 1-17
Ambler, Tim (2003), Marketing and the Bottom Line (2nd edition). London, U.K.: Pearson
Education.
Bearden, William O. and Richard G. Netemeyer (1998), Handbook of Marketing Scales: Multi-
Item Measures for Marketing and Consumer Behavior Research, 2nd ed., Thousand Oaks,
CA: Sage Publications.
Beckwith, Neil E. and Donald R. Lehmann (1975), “The Importance of the Halo Effect in Multi-
attribute Attitude Models,” Journal of Marketing Research, 12 (March), 265-275.
Bottomley, Paul A. and Stephen Holden (2001), “Do We Really Know How Consumers
Evaluate Brand Extensions: Empirical Generalizations Based on Secondary Analysis of
Eight Studies,” Journal of Marketing Research, 38 (November), 494-500.
23
Bruner, Gordon C. II, Paul J. Hensel, and Karen E. James (2005), Marketing Scales Handbook
IV. South-Western Publishing.
Churchill, Gilbert A. Jr. (1979), “A Paradigm For Developing Better Measures of Marketing
Constructs,” Journal of Marketing Research, 16 (February), 64-73.
Deshpandé, Rohit, and John U. Farley (1998), “Measuring Market Orientation: Generalization
and Synthesis,” Journal of Market-Focused Management, 2, 213-232.
______, John U. Farley, and Frederick E. Webster (1993), “The Effect of Corporate Culture,
Customer Orientation, and Innovativeness on Firm Performance,” Journal of Marketing,
57 (January), 23-37.
Fornell, Claes and David Larcker (1981), “Structural Equation Models With Unobservable
Variables and Measurement Error,” Journal of Marketing Research, 18 (1), 39-50.
Fournier, Susan (1998), “Consumers and Their Brands: Developing Relationship Theory in
Consumer Research,” Journal of Consumer Research, 25 (March), 343-373.
Haugtvedt, Curtis, Paul M. Herr, Frank R. Kardes eds., (2008), Handbook of Consumer
Psychology, New York: Lawrence Erlbaum.
He, Ti, Michael A. Merz, and Dana L. Alden (2008), “Diffusion of Measurement Invariance
Assessment in Cross-National Empirical Marketing Research: Perspectives from the
Literature and a Survey of Researchers,” Journal of International Marketing, 16 (2), 64-
83.
Howard, John and Jagdish Sheth (1969), The Theory of Buyer Behavior. Boston: J. Wiley &
Sons.
Kaplan, Robert S. and David P. Norton (1992), “The Balanced Scorecard – Measures That Drive
Performance,” Harvard Business Review, 70 (1), 71-80.

24
Keller, Kevin Lane (2002), Branding and Brand Equity. Cambridge, Mass: Marketing Science
Institute.
______ (2008), Strategic Brand Management (3rd Ed.). Upper Saddle River, N.J.: Prentice-Hall.
______ and Donald R. Lehmann (2003), “How Do Brands Create Value?,” Marketing
Management, May/June, 26-31.
Kohli, Ajay K., Bernard J. Jaworski, and Ajith Dumar (1993), “MARKOR: A Measure of
Market Orientation,” Journal of Market Research, 30 (November), 467-477.
Lavidge, Robert J. and Gary A. Steiner (1961), “A Model of Predictive Measurements of
Advertising Effectiveness,” Journal of Marketing, 25 (6), 59-62
Leuthesser, Lance (ed.) (1988), “Defining, Measuring, and Managing Brand Equity: A
Conference Summary,” Marketing Science Institute Report 88-104, Cambridge, MA.
Loken, Barbara, and Deborah Roedder John (1993), “Diluting Brand Beliefs: When Do Brand
Extensions Have a Negative Impact?,” Journal of Marketing, 57 (July), 71-84.
Norton, John C. and Stanley F. Slater (1990), “The Effect of Market Orientation on Business
Profitability,” Journal of Marketing, 54 (October), 20-35.
Peter, J. Paul (1981), “Construct Validity: A Review of Basic Issues and Marketing Practices,”
Journal of Marketing Research, 18 (May), 133-145.
Yang, John, John U. Farley, Scott Hoenig and Sharon Liu (1999), “The Evolution of Chinese
Consumers: What Will They Want Next?,” Harvard China Review, Vol. 1(2), 67-72.
Zhang, Shi, Bernd H. Schmitt (2001), “Creating Local Brands in Multilingual International
Markets,” Journal of Marketing Research,” 38 (August), 313-325.

25
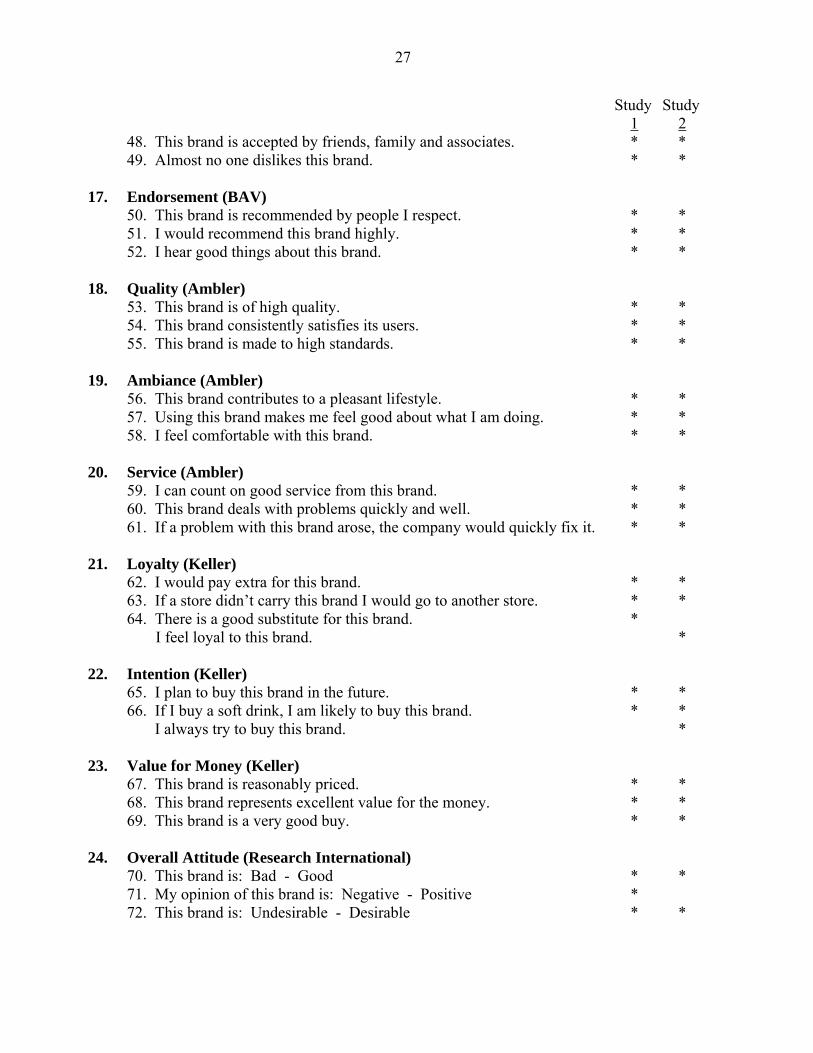
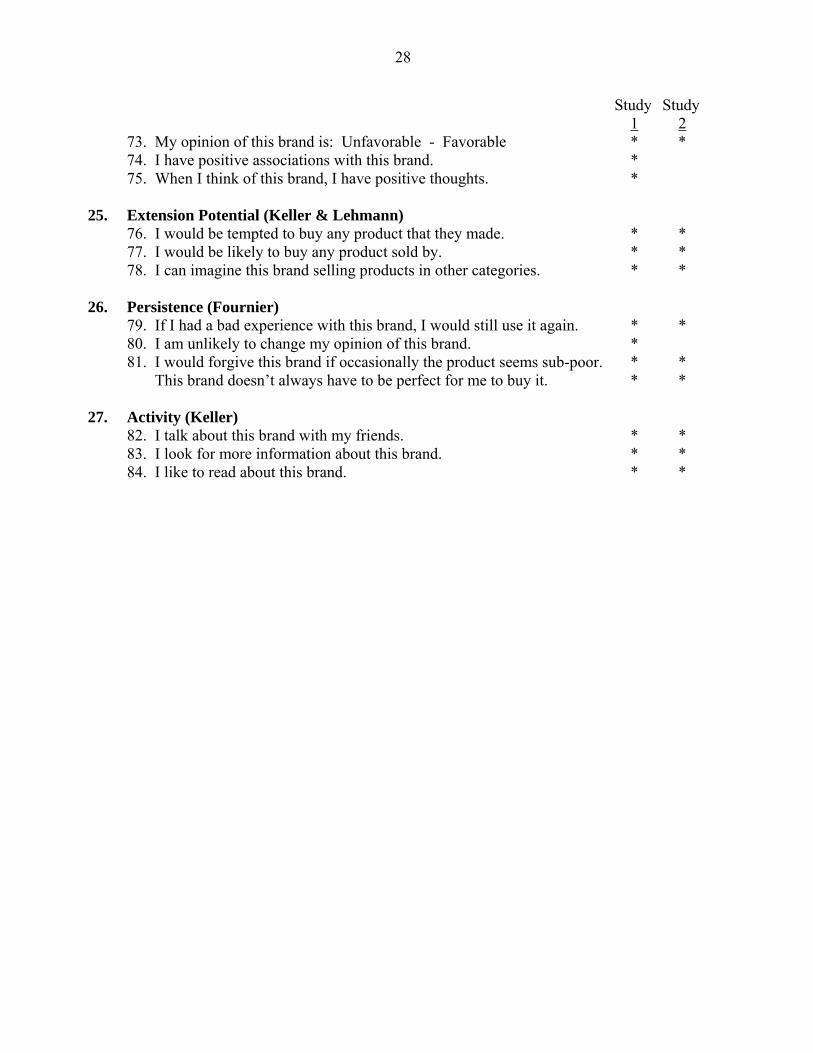
Appendix A Brand Performance Constructs and Items
(with sources in parentheses) Study Study 1 2
1. Presence (Millward Brown) 1. I often encounter this brand. * * 2. There are a lot of ads and other information about this brand. * * 3. When you think of a soft drink do these brands come to mind? * This brand is easy to find. * 2. Awareness (Aaker) 4. I am generally aware of this brand. * 5. I am aware of this brand. * * 6. I am quite familiar with this brand. * I have heard of this brand. * Most people are aware of this brand. * 3. Knowledge (BAV) 7. I have a detailed understanding of how this brand works. * 8. I have experience using this brand. * * 9. I know a lot about the brand. * * I am familiar with this brand. * 4. Relevance (BAV, Millward Brown) 10. The brand is relevant to me. * * 11. The brand is relevant to my family and/or close friends. * 12. This brand is a good one for me. * * 13. This brand fits my lifestyle. * * 5. Difference (BAV) 14. This brand stands out from its competitors. * * 15. This brand stands for something unique. * * 16. This brand is in a class by itself. * * 6. Esteem (BAV) 17. I hold the brand in high regard. * * 18. The brand has earned a strong reputation. * * 19. This brand respects me. * * 7. Performance (Millward Brown, Research International) 20. The brand performs well. * * 21. The brand is effective. * * 22. This brand lives up to its promises. * This brand has served me well. *
26
Study Study 1 2
8. Advantage (Millward Brown) 23. This brand is better than others. * * 24. This brand offers a clear advantage vs. the competition * * 25. In terms of the important attributes of a soft drink, this brand is better. * * 9. Bonding (Millward Brown, Research International, Fournier) 26. I am strongly committed to this brand. * * 27. This brand shares my values. * * 28. This brand has earned my confidence. * * 10. Heritage (Research International) 29. This brand has a long history. * * 30. This brand has been around for a long time. * * 31. This brand has served me well. * My parents used this brand. * 11. Trust (Research International) 32. You can count on this brand. * * 33. This brand produces a product to high standards. * * 34. I trust this brand. * * 12. Innovation (Research International, BAV) 35. This brand is a leader in its field. * * 36. This brand is innovative. * * 37. This brand constantly improves its product. * * 13. Caring (BAV) 38. This brand cares about its customers. * * 39. This brand has the interests of its customers at heart. * * 40. This brand is committed to me as a customer. * * 14. Nostalgia (BAV) 41. I remember this brand from my youth. * * 42. This brand reminds me of the good old days. * * 43. I have happy memories of this brand. * * 15. Prestige (BAV) 44. This brand is recognized as the standard. * * 45. This brand is prestigious. * * 46. Using this brand gives one a touch of class. * * 16. Acceptability (BAV) 47. You never go wrong selecting this brand. * *
27
Study Study 1 2
48. This brand is accepted by friends, family and associates. * * 49. Almost no one dislikes this brand. * * 17. Endorsement (BAV) 50. This brand is recommended by people I respect. * * 51. I would recommend this brand highly. * * 52. I hear good things about this brand. * * 18. Quality (Ambler) 53. This brand is of high quality. * * 54. This brand consistently satisfies its users. * * 55. This brand is made to high standards. * * 19. Ambiance (Ambler) 56. This brand contributes to a pleasant lifestyle. * * 57. Using this brand makes me feel good about what I am doing. * * 58. I feel comfortable with this brand. * * 20. Service (Ambler) 59. I can count on good service from this brand. * * 60. This brand deals with problems quickly and well. * * 61. If a problem with this brand arose, the company would quickly fix it. * * 21. Loyalty (Keller) 62. I would pay extra for this brand. * * 63. If a store didn’t carry this brand I would go to another store. * * 64. There is a good substitute for this brand. * I feel loyal to this brand. * 22. Intention (Keller) 65. I plan to buy this brand in the future. * * 66. If I buy a soft drink, I am likely to buy this brand. * * I always try to buy this brand. * 23. Value for Money (Keller) 67. This brand is reasonably priced. * * 68. This brand represents excellent value for the money. * * 69. This brand is a very good buy. * * 24. Overall Attitude (Research International) 70. This brand is: Bad - Good * * 71. My opinion of this brand is: Negative - Positive * 72. This brand is: Undesirable - Desirable * *
28
Study Study 1 2
73. My opinion of this brand is: Unfavorable - Favorable * * 74. I have positive associations with this brand. * 75. When I think of this brand, I have positive thoughts. * 25. Extension Potential (Keller & Lehmann) 76. I would be tempted to buy any product that they made. * * 77. I would be likely to buy any product sold by. * * 78. I can imagine this brand selling products in other categories. * * 26. Persistence (Fournier) 79. If I had a bad experience with this brand, I would still use it again. * * 80. I am unlikely to change my opinion of this brand. * 81. I would forgive this brand if occasionally the product seems sub-poor. * * This brand doesn’t always have to be perfect for me to buy it. * * 27. Activity (Keller) 82. I talk about this brand with my friends. * * 83. I look for more information about this brand. * * 84. I like to read about this brand. * *

29
Appendix B Factor Identification
In exploratory factor analysis, the common approach for identifying the number of “significant” factors is to use an eigenvalue equal to one as the cutoff. The logic behind this is that if there were k independent (uncorrelated) variables, a principle component analysis would generate an eigenvalue equal to one for each variable. Thus, a factor should explain at least as much as an independent random variable, i.e., have an eigenvalue δ ≥ 1.
This logic makes sense under the assumption that the observed variables (x’s) are reflexive indicators of a set of factors (f’s). However, in many cases the observed variables may all (also) be influenced by a single determinant (d). In that case, much of the common variance (covariance, correlation) among the observed variables may be due to d, i.e., in essence is “spurious.” The cause may be methodological (e.g., common method bias) or substantive (e.g., overall attitude or halo can influence all the beliefs about a product; Beckwith and Lehmann, 1975). The impact of the common determinant is that the first eigenvector (and eigenvalue) will be large and the rest smaller. Therefore, if the focus is on finding groups of variables that explain at least as much as a variable which is independent from the others after adjusting for the (spurious) impact of d, the cutoff should be lower than 1.0.
There are at least three ways to deal with this. First, and probably the oldest, is to simply ignore the first eigenvalue and vector (which is largely driven by d) and concentrate on eigenvalues 2 through k, e.g., looking for an elbow in the scree lot. Another alternative is to remove the effect of d on each of the X variables via regression and then analyze the residuals. This approach (essentially two stage least squares) makes sense if you have measures of d but, if d is a factor rather than a precisely measured variable, i.e., not measured without error, this approach has problems of its own.
The approach we introduce here is a simple adjustment to help determine the cutoff value. We assume the first eigenvalue, δ1, is driven primarily by overall attitude or brand halo in our data. Thus, logically, δ1 largely represents halo, and the total remaining amount of variance available in the k variables is k ⎯ δ1. Under this assumption, an otherwise independent variable would explain (k ⎯ δ1) / k percent of the variance. This approach provides a different lower bound than the standard cutoff rule. For example, with 27 variables, if the first eigenvalue is 18 (i.e., explains 2/3 of the variance as is the case here), then the cutoff becomes (27 ⎯ 18) / 27 = .33
This approach is logical rather than statistical, in keeping with the logic-based “eigenvalue greater than one” rule. It is also true that some portion of δ1 may represent correlation among the X’s not due to d. To the extent this is true, the proposed cutoff should be adjusted upward. Nonetheless, it is important to remember that the main objective of factor analysis is to derive a “simple structure” which represents the data and that multiple criteria (e.g., the loading pattern, the scree plot, etc.) are relevant. Therefore rather than arguing for a single “right” number, we suggest considering using a cutoff close to (k - δ1) / k as well as interpretability as criteria for identifying factors.
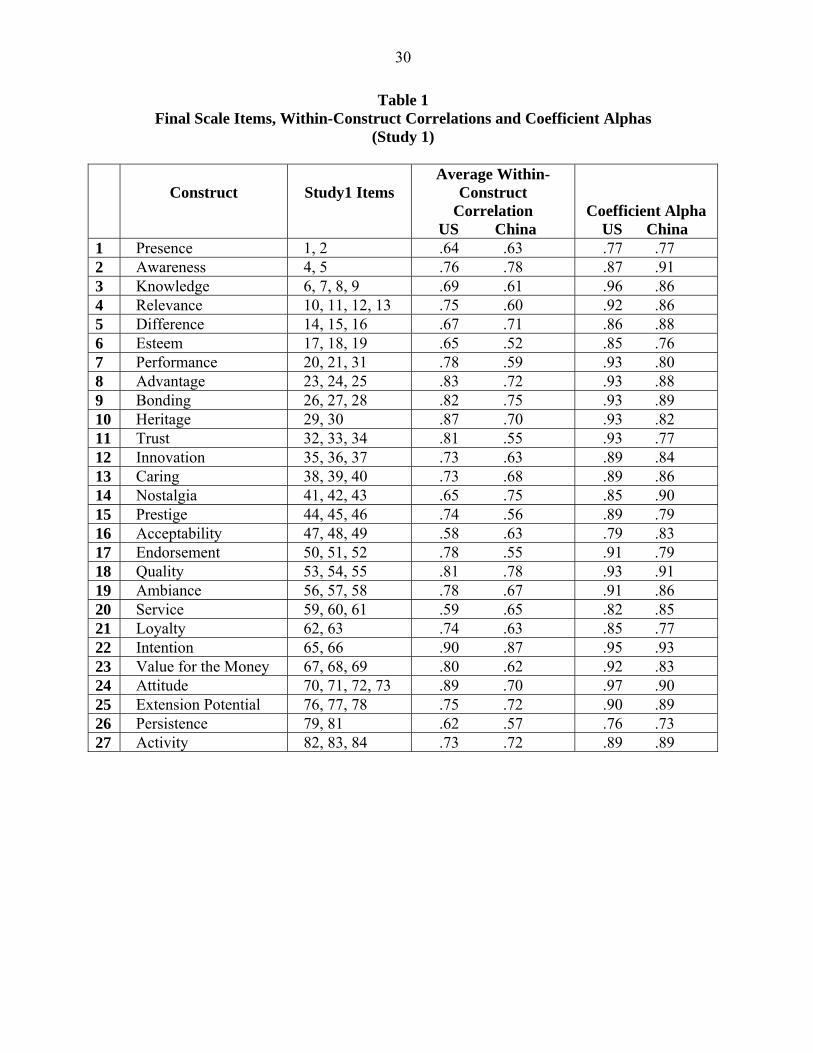
30
Table 1 Final Scale Items, Within-Construct Correlations and Coefficient Alphas
(Study 1)
Construct
Study1 Items
Average Within-Construct
Correlation US China
Coefficient Alpha US China
1 Presence 1, 2 .64 .63 .77 .77 2 Awareness 4, 5 .76 .78 .87 .91 3 Knowledge 6, 7, 8, 9 .69 .61 .96 .86 4 Relevance 10, 11, 12, 13 .75 .60 .92 .86 5 Difference 14, 15, 16 .67 .71 .86 .88 6 Esteem 17, 18, 19 .65 .52 .85 .76 7 Performance 20, 21, 31 .78 .59 .93 .80 8 Advantage 23, 24, 25 .83 .72 .93 .88 9 Bonding 26, 27, 28 .82 .75 .93 .89 10 Heritage 29, 30 .87 .70 .93 .82 11 Trust 32, 33, 34 .81 .55 .93 .77 12 Innovation 35, 36, 37 .73 .63 .89 .84 13 Caring 38, 39, 40 .73 .68 .89 .86 14 Nostalgia 41, 42, 43 .65 .75 .85 .90 15 Prestige 44, 45, 46 .74 .56 .89 .79 16 Acceptability 47, 48, 49 .58 .63 .79 .83 17 Endorsement 50, 51, 52 .78 .55 .91 .79 18 Quality 53, 54, 55 .81 .78 .93 .91 19 Ambiance 56, 57, 58 .78 .67 .91 .86 20 Service 59, 60, 61 .59 .65 .82 .85 21 Loyalty 62, 63 .74 .63 .85 .77 22 Intention 65, 66 .90 .87 .95 .93 23 Value for the Money 67, 68, 69 .80 .62 .92 .83 24 Attitude 70, 71, 72, 73 .89 .70 .97 .90 25 Extension Potential 76, 77, 78 .75 .72 .90 .89 26 Persistence 79, 81 .62 .57 .76 .73 27 Activity 82, 83, 84 .73 .72 .89 .89
31
Table 2 Correlations Between Equity Dimensions & Product Usage
(Study 1)
Construct US
China Consumption Future Share Consumption Future Share
Presence 0.53 0.51 0.31 0.28 Awareness 0.21 0.21 0.23 0.20 Knowledge 0.38 0.37 0.32 0.34 Relevance 0.63 0.64 0.39 0.44 Difference 0.54 0.58 0.38 0.45 Esteem 0.57 0.60 0.35 0.36 Performance 0.60 0.59 0.43 0.45 Advantage 0.61 0.63 0.45 0.51 Bonding 0.65 0.64 0.45 0.49 Heritage 0.41 0.40 0.30 0.28 Trust 0.56 0.53 0.39 0.41 Innovation 0.52 0.53 0.34 0.39 Caring 0.45 0.43 0.25 0.26 Nostalgia 0.46 0.46 0.28 0.26 Prestige 0.53 0.52 0.29 0.35 Acceptability 0.61 0.59 0.31 0.32 Endorsement 0.59 0.56 0.36 0.38 Quality 0.50 0.49 0.24 0.31 Ambiance 0.57 0.57 0.32 0.40 Service 0.49 0.50 0.24 0.26 Loyalty 0.60 0.62 0.42 0.39 Intention 0.64 0.68 0.50 0.46 Value4Money 0.42 0.45 0.30 0.36 Preference 0.60 0.62 0.37 0.49 Extension Potential 0.54 0.53 0.30 0.31 Persistence 0.51 0.49 0.25 0.32 Activity 0.50 0.45 0.38 0.35

32
Table 3
Within Country Differences Between Coke and Pepsi Ratings (Study 1)
U.S.
China Mean Difference t Statistic Mean Difference t Statistic Presence -0.100 -0.86 -0.030 -0.40 Awareness -0.045 -0.62 0.020 0.38 Knowledge -0.025 -0.28 0.053 0.71 Relevance -0.325 -2.25 -0.073 -0.84 Difference -0.267 -1.83 0.023 0.25 Esteem -0.223 -1.61 0.030 0.42 Performance -0.203 -1.36 0.000 0.00 Advantage -0.377 -2.23 -0.050 -0.56 Bonding -0.360 -2.1 -0.090 -0.88 Heritage 0.135 1.25 0.440 6.34 Trust -0.230 -1.55 0.030 0.43 Innovation -0.220 -1.63 -0.017 -0.22 Caring -0.147 -1.11 -0.003 -0.06 Nostalgia 0.090 0.73 0.267 2.84 Prestige -0.083 -0.6 0.057 0.83 Acceptability -0.187 -1.48 -0.077 -1.13 Endorsement -0.197 -1.49 -0.050 -0.60 Quality -0.177 -1.43 0.027 0.42 Ambiance -0.210 -1.43 -0.033 -0.46 Service -0.217 -1.7 0.010 0.18 Loyalty -0.545 -3.1 0.005 0.05 Intention -0.360 -1.95 -0.035 -0.35 Value For Money -0.273 -2.06 0.027 0.47 Overall -0.388 -2.36 0.040 0.47 Extension -0.293 -2.02 -0.017 -0.22 Persistence -0.335 -2.23 0.015 0.22 Activities -0.197 -1.47 -0.087 -0.99 Comprehension -0.173 -1.36 -0.016 0-.26 Product -0.374 -2.2 0.003 0.03 Interpersonal -0.343 -2.43 -0.021 -0.29 Attitudes -0.100 -0.86 -0.030 -0.40 Commitment -0.045 -0.62 0.020 0.38
*Difference = Coke - Pepsi

33
Table 4 Between Country Differences Between Coke and Pepsi Ratings
(Study 1)
Coke
Pepsi
U.S. China t Statistic U.S. China t Statistic Presence 4.335 4.255 0.65 4.435 4.285 1.28 Awareness 4.765 4.735 0.36 4.810 4.715 1.08 Knowledge 4.640 4.215 4.29 4.665 4.163 4.97 Relevance 3.973 3.728 1.7 4.298 3.800 3.61 Difference 3.927 4.023 -0.7 4.193 4.000 1.57 Esteem 3.997 4.077 -0.65 4.220 4.047 1.36 Performance 4.063 4.123 -0.46 4.267 4.123 1.06 Advantage 3.800 4.017 -1.51 4.177 4.067 0.79 Bonding 3.673 3.483 1.12 4.033 3.573 2.81 Heritage 4.695 4.570 1.26 4.560 4.130 3.7 Trust 4.120 3.950 1.24 4.350 3.920 3.2 Innovation 4.090 3.957 1 4.310 3.973 2.8 Caring 4.090 3.960 0.94 4.237 3.963 2.07 Nostalgia 4.360 3.423 6.44 4.270 3.157 7.72 Prestige 4.103 3.997 0.82 4.187 3.940 1.91 Acceptability 4.133 3.880 1.93 4.320 3.957 3.1 Endorsement 4.173 3.687 3.48 4.370 3.737 4.95 Quality 4.310 4.193 0.91 4.487 4.167 2.85 Ambiance 3.993 3.900 0.67 4.203 3.933 1.96 Service 3.880 3.780 0.74 4.097 3.770 2.5 Loyalty 3.305 3.355 -0.28 3.850 3.350 2.88 Intention 3.905 3.905 0 4.265 3.940 2.09 Value For Money 3.887 3.840 0.34 4.160 3.813 2.61 Overall 4.013 4.215 -1.44 4.400 4.175 1.74 Extension 3.790 3.433 2.3 4.083 3.450 4.37 Persistence 3.175 3.310 -0.82 3.510 3.295 1.35 Activities 3.187 3.427 -1.5 3.383 3.513 -0.82 Comprehension 4.062 3.867 1.6 4.236 3.883 3.03 Product 3.959 4.060 -0.71 4.333 4.058 2.04 Interpersonal 3.364 3.381 -0.13 3.707 3.402 2.29 Attitudes 4.335 4.255 0.65 4.435 4.285 1.28 Commitment 4.765 4.735 0.36 4.810 4.715 1.08 *Difference = Coke rating - Pepsi rating

34
Table 5 Factor Loadings
(Study 2) Commonality
Total U.S. China Total U.S. China Total U.S. China Total U.S. China Total U.S. China Total U.S. China
Presence 0.15 0.20 0.15 0.18 0.11 0.15 0.24 0.19 0.29 0.76 0.74 0.76 0.21 0.18 0.23 0.15 0.27 0.08 0.76Awareness 0.10 0.11 0.11 0.22 0.18 0.20 0.17 0.16 0.24 0.88 0.86 0.84 ‐0.04 ‐0.05 ‐0.10 0.06 0.11 0.07 0.86Knowledge 0.21 0.15 0.27 0.15 0.21 0.19 0.27 0.24 0.28 0.79 0.86 0.75 0.05 0.06 0.15 0.26 0.04 0.17 0.83Relevance 0.49 0.50 0.45 0.14 0.24 0.18 0.57 0.49 0.47 0.28 0.38 0.32 0.15 0.25 0.27 0.32 ‐0.01 0.21 0.78Difference 0.24 0.28 0.26 0.40 0.29 0.24 0.60 0.67 0.65 0.29 0.24 0.37 0.34 0.34 0.19 0.04 0.17 0.10 0.78Esteem 0.36 0.46 0.29 0.30 0.23 0.30 0.64 0.56 0.70 0.32 0.36 0.32 0.25 0.33 0.13 0.14 0.13 0.10 0.81Performance 0.34 0.42 0.28 0.28 0.21 0.27 0.69 0.64 0.71 0.33 0.40 0.33 0.16 0.19 0.18 0.17 0.09 0.10 0.84Advantage 0.39 0.48 0.31 0.36 0.21 0.33 0.63 0.63 0.63 0.23 0.21 0.58 0.25 0.28 0.13 0.02 0.14 0.04 0.79Bonding 0.73 0.77 0.71 0.34 0.29 0.36 0.22 0.24 0.15 0.16 0.16 0.22 0.24 0.25 0.19 0.13 0.16 0.20 0.80Heritage 0.14 0.15 0.23 0.31 0.30 0.24 0.24 0.12 0.20 0.36 0.47 0.23 0.04 0.17 0.15 0.64 0.67 0.79 0.72Trust 0.32 0.40 0.39 0.55 0.31 0.43 0.48 0.53 0.46 0.28 0.25 0.27 0.08 0.10 ‐0.10 0.18 0.50 0.36 0.75Innovation 0.20 0.34 0.15 0.60 0.38 0.54 0.42 0.50 0.36 0.29 0.20 0.40 0.20 0.19 0.09 0.22 0.51 0.24 0.75Caring 0.23 0.27 0.16 0.67 0.66 0.66 0.30 0.44 0.32 0.17 0.15 0.21 0.19 0.15 0.31 0.33 0.27 0.18 0.77Nostalgia 0.25 0.21 0.18 0.27 0.70 0.30 0.08 0.02 0.04 0.15 0.33 0.04 0.20 0.31 0.63 0.80 0.20 0.50 0.85Prestige 0.33 0.35 0.33 0.64 0.67 0.63 0.23 0.29 0.34 0.24 0.28 0.18 0.25 0.24 0.07 0.26 0.17 0.26 0.76Acceptability 0.37 0.39 0.35 0.31 0.30 0.23 0.60 0.60 0.67 0.30 0.38 0.22 0.21 0.23 0.26 0.23 0.09 0.17 0.78Endorsement 0.55 0.59 0.45 0.55 0.50 0.66 0.25 0.38 0.20 0.19 0.23 0.16 0.13 0.09 0.29 0.26 0.13 0.08 0.79Quality 0.59 0.62 0.64 0.49 0.29 0.42 0.37 0.47 0.38 0.20 0.18 0.17 0.12 0.06 0.86 0.07 0.27 0.13 0.78Ambiance 0.50 0.52 0.38 0.55 0.56 0.61 0.24 0.34 0.24 0.16 0.18 0.18 0.21 0.19 0.31 0.27 0.09 0.18 0.74Service 0.42 0.43 0.36 0.67 0.59 0.71 0.20 0.41 0.21 0.24 0.23 0.22 0.17 0.08 0.18 0.15 0.11 0.07 0.77Loyalty 0.69 0.67 0.70 0.24 0.26 0.23 0.15 0.18 0.18 0.05 0.03 0.12 0.44 0.43 0.40 0.08 0.03 0.18 0.77Intention 0.78 0.81 0.77 0.17 0.17 0.19 0.29 0.22 0.21 0.20 0.22 0.26 0.23 0.28 0.21 0.16 0.11 0.15 0.84Value For Money 0.61 0.58 0.69 0.27 0.35 0.19 0.33 0.30 0.40 0.18 0.20 0.13 0.24 0.28 0.17 0.17 0.09 0.17 0.67Overall Attitude 0.66 0.69 0.70 0.31 0.20 0.33 0.45 0.43 0.38 0.19 0.25 0.16 0.13 0.16 0.12 0.16 0.25 0.12 0.82Extension Potential 0.60 0.61 0.61 0.26 0.27 0.26 0.29 0.34 0.24 0.12 0.15 0.09 0.41 0.41 0.52 0.26 0.20 0.52 0.76Persistence 0.39 0.42 0.38 0.13 0.14 0.17 0.25 0.30 0.26 0.08 0.09 0.12 0.70 0.67 0.70 0.21 0.67 0.70 0.77Activity 0.32 0.29 0.43 0.25 0.23 0.36 0.20 0.18 0.37 0.06 0.04 0.10 0.78 0.82 0.46 0.07 0.12 0.46 0.82
5.42 4.18 4.05 3.21 2.31 1.99 21.16
0.20 0.16 0.16 0.12 0.09 0.07 0.78
Variance Explained After Rotation
% Variance Accounted For
Performance Interpersonal Relations Comparative Advantage Comprehension Attachment History
35
Table 6 Factor Loadings
For Data Pooled Across Countries (Study 2)
Preference Interpersonal
Relations ComparativeAdvantage
Compre-hension
Attach-ment History
Comman-ality
Presence .15 .18 .24 .76 .21 .15 .76 Awareness .10 .22 .17 .88 -.04 .06 .86 Knowledge .21 .15 .27 .79 .05 .26 .83 Relevance .49 .14 .57 .28 .15 .32 .78 Difference .24 .40 .60 .29 .34 .04 .78 Esteem .36 .30 .64 .32 .25 .14 .81 Performance .34 .28 .69 .33 .16 .17 .84 Advantage .39 .36 .63 .23 .25 .02 .79 Bonding .73 .34 .22 .16 .24 .13 .80 Heritage .14 .31 .24 .36 .04 .64 .72 Trust .32 .55 .48 .28 .08 .18 .75 Innovation .20 .60 .42 .29 .20 .22 .75 Caring .23 .67 .30 .17 .19 .33 .77 Nostalgia .25 .27 .08 .15 .20 .80 .85 Prestige .33 .64 .23 .24 .25 .26 .76 Acceptability .37 .31 .60 .30 .21 .23 .78 Endorsement .55 .55 .25 .19 .13 .26 .79 Quality .59 .49 .37 .20 .12 .07 .78 Ambiance .50 .55 .24 .16 .21 .27 .74 Service .42 .67 .20 .24 .17 .15 .77 Loyalty .69 .24 .15 .05 .44 .08 .77 Intention .78 .17 .29 .20 .23 .16 .84 Value For Money .61 .27 .33 .18 .24 .17 .67 Overall Attitude .66 .31 .45 .19 .13 .16 .82 Extension Potential .60 .26 .29 .12 .41 .26 .76
Persistence .39 .13 .25 .08 .70 .21 .77 Activity .32 .25 .20 .06 .78 .07 .82 Eigenvalues After Rotation 5.42 4.18 4.05 3.21 2.31 1.99 21.16

36
Table 7 Pearson Correlation Coefficients of Factors (Study 2)
Comparative Interpersonal Prefer- Attach- Comprehension History Advantage Relations ence ment
Comprehension 1.00 0.55 0.67 0.58 0.52 0.33
History - 1.00 0.58 0.67 0.58 0.45
Advantage - - 1.00 0.78 0.82 0.61
Interpersonal - - - 1.00 0.76 0.55
Preference - - - - 1.00 0.65
Attachment - - - - - 1.00

37
Table 8 Sources of Variances in Brand Responses (Sums of Squares)
(Study 2)
Interaction Effects
Category by
Main Effects Category
by Country
Brand by
Category
Brand by
Country
Attribute Country Category Individual Error
Presence 17.21 11.11 3.97 7.08 8.27 613.26 575.64 Awareness 36.89 12.76 1.53 1.35 4.86 734.25 406.50 Knowledge 67.15 16.14 0.29 0.93 7.47 668.15 499.58 Relevance 25.93 3.58 6.00 0.69 15.60 829.17 878.57 Difference 0.62 5.79 8.38 0.35 8.33 730.76 675.40 Esteem 4.58 3.27 6.19 0.38 10.68 731.15 684.12 Performance 15.71 4.39 15.50 0.87 13.52 770.47 777.66 Advantage 0.29 4.52 12.98 2.99 11.37 684.94 793.65 Bonding 4.38 7.22 3.97 4.98 18.05 810.49 901.12 Heritage 99.08 13.20 2.56 8.06 9.90 721.14 665.44 Trust 9.34 16.85 11.49 0.88 6.36 713.47 762.37 Innovation 18.46 0.82 9.66 0.13 7.09 609.58 687.48 Caring 21.69 0.23 16.35 0.94 1.49 798.02 701.25 Nostalgia 204.91 21.12 4.80 8.37 6.77 1120.70 887.54 Prestige 1.32 7.51 18.43 2.56 8.00 696.47 624.23 Acceptability 24.72 7.33 6.56 0.94 7.08 690.58 731.18 Endorsement 23.54 9.51 17.32 0.92 8.52 759.32 716.00 Quality 3.75 29.27 31.76 1.52 8.50 709.51 717.80 Ambiance 5.62 10.01 22.90 0.22 10.94 814.86 695.43 Service 3.82 1.82 25.32 0.97 4.10 793.22 651.65 Loyalty 31.69 12.34 14.58 4.25 11.95 1048.58 977.77 Intention 0.44 5.63 8.95 9.09 34.48 772.36 1072.80 Value4Money 10.32 18.03 16.03 2.71 8.81 866.28 761.06 Attitude 7.56 2.89 19.81 3.06 19.62 764.57 898.98 Extension 16.75 15.40 13.17 2.29 5.30 1016.56 787.84 Persistence 0.44 11.60 1.81 1.09 7.20 1093.42 819.08 Activity 62.53 6.80 4.98 0.16 3.17 1188.95 811.44 Average Percent 1.65 0.60 0.70 0.16 0.68 50.1 45.3 Explained
38
Table 9
Average Brand Ratings on the Six Factors (Study 2)
Comprehension
History
Compar-ative
Advantage
Interpersonal
Relations
Prefer-
ence
Attach-
ment U.S. McDonald’s 4.52 4.17 3.72 3.66 3.60 3.16 KFC 4.37 3.81** 3.69 3.62 3.46 3.09 Coke 4.45 4.10 3.76 3.91 3.48 3.16 Pepsi 4.52 3.96 3.97 3.84 3.85** 3.31 Colgate 4.24 3.78 3.78 3.85 3.62 3.00 Crest 4.35 3.96 4.06** 3.99 3.95** 3.14 China McDonald’s 4.22 3.33 3.73 3.81 3.53 3.25 KFC 4.19 3.29 3.75 3.81 3.57 3.22 Coke 4.11 3.59 3.83 3.75 3.79 3.35 Pepsi 4.10 3.36* 3.75 3.64 3.76 3.26 Colgate 4.07 3.19 3.72 3.62 3.66 3.66 Crest 3.73*** 2.97 3.41** 3.38** 3.28*** 2.85**
Significant differences between paired comparisons of brands: * p<.10, ** p<.05, *** p<.01
39
Figure 1Hierarchy of Effects Relationship Among Brand Equity Factors
(Standardized OLS Coefficients)
Comprehension
Comparative Advantage Interpersonal Relations History
Attachment
Preference
.63 .68
.62 .29 .06
.76
.74


![Delft University of Technology A Test Case Prioritization ... · test case execution order. They can be divided into two main categories [22]: white-box metrics and black-box metrics](https://img.pdfslide.us/doc/110x75/5ecf18bd59f6445324374515/delft-university-of-technology-a-test-case-prioritization-test-case-execution.jpg)


![Introductory Marketing Simulations · Introductory Marketing Simulations ... 2 categories [H&M] 2 categories [H&M] Brand Portfolio 2 products ... Marketing Spending Marketing Mix](https://img.pdfslide.us/doc/110x75/5b04a5247f8b9a2e228e2fab/introductory-marketing-marketing-simulations-2-categories-hm-2-categories.jpg)