Embed Size (px)
Citation preview

MAPPING THE STRUCTURE OF THE NEW ZEALAND FOOD & BEVERAGE INDUSTRY
Prepared for the Food and Beverage Taskforce
November 2005

Coriolis Research Ltd. is a strategic market research firm founded in 1997 and based in Auckland, New Zealand. Coriolis primarily works with clients in the food and fast moving consumer goods supply chain, from primary producers to retailers. In addition to working with clients, Coriolis regularly produces reports on current industry topics. Recent reports have included an analysis of Retail Globalization: Who’s Winning” and an “Overview of the Growth of Foodservice.
The coriolis force, named for French physicist Gaspard Coriolis (1792-1843), may be seen on a large scale in the movement of winds and ocean currents on the rotating earth. It dominates weather patterns, producing the counterclockwise flow observed around low-pressure zones in the Northern Hemisphere and the clockwise flow around such zones in the Southern Hemisphere. It is the result of a centripetal force on a mass moving with a velocity radially outward in a rotating plane. In market research it means understanding the big picture before you get into the details.
PO BOX 10 202, Mt. Eden, Auckland 1030, New ZealandTel: +64 9 623 1848; Fax: +64 9 353 1515; email: [email protected]
www.coriolisresearch.com

Executive Summary The objective of this document is not to give answers. We all know the answers. Listen at every industry conference, read every industry body’s strategic plan, analyse every company’s annual report. Its all there – innovate, add value, enter nmarkets, grow sustainably, and ultimately create wealth and employment.
ew
Rather this is a document of questions. How is our food industry doing? What are we making? Where are we selling it? Is this a growth market? These are vitally important questions because this country is still, in many ways, a country built on the sheep’s back (and the cow’s teat). So we need to get this right. So how are we doing? New Zealand food and beverage exports have grown from $9.3b in 1994 to $15.4b in 2004, adding $6.1b in non-inflation adjusted growth over the last decade. This equates to a respectable 5.2% compound annual growth rate (cagr) on sales over the period. This is less than the 6.4% achieved by Pepsico over the same period, but more than the 4.3% achieved by Nestle, and broadly in the middle range of most major food and beverage companies. This strong growth has been driven in large part by the traditional segments of the business – dairy, meat and horticulture – however the fast developing beverages sector actually led growth, achieving a cagr of 15.2%. Much of the performance of the past decade has been underpinned by strong production growth in our farms and factories. This has been through a combination of both producing more and, in most cases, increasing productivity per unit. However, it is unclear whether these traditional segments have “enough gas in the tank” to drive continued growth in the middle range, let alone allow us to beat the competition. All of our key sectors, except kiwifruit, are experiencing very low global consumption growth in the -1 to 2% range. Unfortunately, in kiwifruit we are growing slower than the market and losing global market share. It is difficult to sustain long term growth with industries experiencing long term consumption decline. Over the period we have experienced the effect of some one time shifts in product range, for example the one-time move from frozen to chilled lamb. In addition, we have benefited from a number of global crises affecting the meat industry. These will not happen in the next decade. We have failed to significantly diversify our customer base and attract new customers. Our success is still reliant on the low growth, aging markets of the Australia, the United Kingdom, North America and Europe. On an export sales dollar per capita basis, we export $55.30 per capita to the countries of Oceania, $16.27 to the United Kingdom and $7.83 to the US and Canada, but only $2.44 per person to the fast growing Asian market and less than $2 per person to any other part of the world, including a paltry $0.13 per person to the Indian Subcontinent (primarily Sri Lanka). We need to lift our performance in the markets of the future, rather than fight for the declining markets of the past. All is not doom and gloom. Wine has been a great success for the industry. Exports have grown from $44 million in 1994 to $367 million in 2004, achieving a stellar 23.6% cagr over the decade. What we need is another ten wine industries to grow and emerge as the new leaders, continuing to drive strong growth across the sector. These industries exist in an embryonic form – we just need to find and nurture them.

3
Mapping
Overview
PROJECT SCOPEThis report provides a top level overview of the New Zealand food and beverage industry
– In December 2004, the New Zealand Government created the Food and Beverage Taskforce as a Government and industry-led initiative, to capitalise on one of the country's fastest-growing sectors.
– Coriolis Research was asked by the taskforce to provide an overview of the New Zealand Food and Beverage sector. This overview of the New Zealand food and beverage sector had a number of key objectives:
– Create a common set of comparable quantitative measures
– Provide a framework of facts for understanding the current industry
– Develop an understanding of historic growth and, by implication, future growth potential of the industry
– Analyse the total food and beverage industry from a “business” point of view
– The research does not prescribe solutions for the industry; instead it gives the members of the taskforce the information, ideas and context they need to develop a plan to ensure the industry remains a platform for growth in the future

4
Mapping
Overview
PROJECT STRUCTUREThe analysis of the industry was structured as follows
– Split the industry into four resource based sectors:
– 1. Pastoral land producing meat & dairy
– 2. Arable land & horticulture producing grain, fruit, vegetables and beverages
– 3. The ocean producing seafood
– 4. Other food including both imports and processed combinations of the above
– Within each segment look at:
– Primary production
– Manufacturing and wholesaling
– Markets
Brief overview of domestic markets
More detailed evaluation of export markets (given their importance to the industry)— on a global basis: consumption, production, imports and exports — Divide markets into domestic and eight cultural global mega regions (Europe/Russia, Sub-Saharan
Africa, NA/ME/CA, Indian Sub-continent, E/SE Asia, US/Canada, Latin America and Oceania

5
Mapping
Overview
PROJECT LIMITATIONSThe project had a number of limitations
– The analysis looked briefly at all of the main sectors of the New Zealand food and beverage industry and is, as a result, “a mile wide and inch deep.” It is fully expected that this will be a “living document” and that the taskforce will provide additional data, context and colour to the document
– The numbers in this section come from a number of sources. While we believe the data is directionally correct, we recognise the limitations in what information is available. In many cases different data sources disagree (e.g. MAF vs. FAO). Many data sources themselves incorporate estimates of industry experts (e.g. milk production in Mozambique). If you disagree with the data presented, please forward yours.
– If you have any questions about the source or meaning of a number in this report, please contact the project leader, Tim Morris at Coriolis Research on (09) 623 1848

6
Mapping
Overview
Food industry 416 10%
Other employment
1,658 40%
Unemployed 75 2%
Under 15 883 22%
Retired 437 11%
Doing something else
616 15%
WHY THE INDUSTRY IS IMPORTANT One in ten people work in the food industry and it employs 20% of the working population
Food industry employment (people, thousands, 2003/4)
1. Defined as over 65 and not working; Note: Uses total people (working proprietors, full-time and part-time employees); may not count seasonal labour fully; people may have more than one job; Source: SNZ National Population Estimates; SNZ Household Labourforce Survey; SNZ Business Demographics; Coriolis analysis
Total = 4,084 thousand resident population Total = 416 thousand persons employed
New Zealand population Food industry
Employed2,074 / 50%
1
…or 20% of thoseemployed
Livestock farming
116 / 27%
Foodservice86 / 21%
Food retail69 / 17%
Crop & Horticulture
farming37 / 9%
MarineFishing5 / 1%Food &
beverage manufacturing
75 / 18%
Food & beverage wholesale
28 / 7%

7
Mapping
Overview
FOOD INDUSTRY MODELThe food industry begins with three natural resources and ends with sales to domestic consumers or to export markets; in a wider sense, it also includes a number of support functions
Resource ProductionManufacturing& Wholesaling Markets
Fruit & Vegetable Processing &WholesalingFruit &
Vegetables
Grain-basedManufacturing& Wholesaling
PastureLivestock Meat Processing
& WholesalingDomesticExport
Milk Dairy Processing& Wholesaling
Grains
Beverage Manufacturing& Wholesaling
Arable land & Horticulture
Seafood Processing &Wholesaling
Fish & Other SeafoodSeafood
Other Food Manufacturing& Wholesaling
Food Imports
DomesticExportDomesticExportDomesticExportDomesticExportDomesticExportDomesticExport
Farm Equipment, Supplies,Genetics, etc.
Supplies
Consum
ers
Education, Recruiting & Human Resource
Market Research, Advertising & Design, Research & Development
Information Systems
Finance,Banking & Insurance
Logistics & Distribution
SupportFunctions
Primary
Government regulation
Packaging

8
Mapping
Overview
SIMPLIFIED FOOD INDUSTRY MODELHowever, for the purposes of this overview, we have simplified the model; the complete model is available in the appendix
PrimaryProduction
Manufacturing& Wholesaling
Domestic
Export

9
Mapping
Overview
1. PRIMARY PRODUCTIONThe first section of this overview looks at primary production
PrimaryProduction

10
Mapping
Overview
Grassland 8,255 53%Tussock &
danthonia 3,287 21%
Plantation forest 1,879 12%
Arable crop 424 3%
Other land 383 2%
Horticulture 110 1%
Native bush 1,302
8%
Total New Zealand land use(sqkm, thousands, 2002)
Farm 156 58%
National parks & reserves
80 30%
Other 32
12%
LAND USEFarm land accounts for 56% of New Zealand land use, of which pastoral land accounts for 74%
Total = 268,000 sqkm
Total = 15,640,000 hectares
Total New Zealand farm land use(hectares, thousands, 2002)
Pastoral74%
Source: SNZ Agricultural Production survey; MAF; Coriolis analysis

11
Mapping
Overview
LESS LAND USED FOR FOOD PRODUCTIONThe amount of land used for food production is declining
Long term change in farm land use in New Zealand food (hectares; thousands; 1985 vs 2002)
Source: SNZ; various other sources; Coriolis analysis
FarmLandUse1985
LessGrassland
LessHigh
Country
MoreHorti-culture
MoreFodder
LessGrain
More plantation
timber
LessOther LandUse
FarmLandUse 2002
17,719
-1,092
-1,247+23 +122
-122
+781
-54415,640
Discussion Points
• Causes of declining land use in food production
• Will this trend continue?
Notes
• See appendix for details
• Seafood not included as the amount of ocean has not changed; no measure available of area under aquaculture
Food farming-2,316

12
Mapping
Overview
FEWER FOOD PRODUCING FARMS The number of food producing farms is declining
Long term change in number of food producing farms in New Zealand (farms; actual; 1985 vs 2002)
Source: SNZ; various other sources; Coriolis analysis
Farmsin
1985
FewerSheep& Beef
FewerDairy
MoreDeer
FewerOther
Livestock
FewerGrain
MoreFruit
MoreVegetables
Farmsin
2002
67,954
-8,664-1,978
+1,443
-1,023 -1,125
+3,016 +587 60,210
Discussion Points
• Causes of decline in number of food producing farms
• Will this trend continue?
Notes
• Over almost the same period (1985-2004) the number of fishing boats declined by -1,191; no comparable measure available for number of aquaculture farms
• See main document for details
Food farms-7,744

13
Mapping
Overview
MORE SMALLER FARM / FEWER LARGER FARMS There has been an across the board decline in farms numbers by size, except for the very small
Long term change in number of food producing farms by farm size(farms; actual; by size group in hectares; 1985 vs 2002)
Source: SNZ; various other sources; Coriolis analysis
Discussion Points
• Implications for average farm efficiency and productivity
• Is polarisation occurring?
• Will this trend continue?
Notes
• See main document for details
6,74
0
6,12
6
5,22
1
6,57
1
6,66
4
9,32
3
10,7
77
9,24
0
4,22
5
2,93
6
6,27
6
5,89
1
5,93
4
4,01
7
6,46
2
9,04
3
7,46
0
3,86
7
2,62
2
9,29
4
Under 5 5-9 10-19 20-39 40-59 60-99 100-199 200-399 400-799 800+
ProbablyLifestyle
1985
2002

14
Mapping
Overview
MORE PEOPLE EMPLOYED IN THE PRIMARY SECTOR The number of people employed in the primary production of food is increasing
Long term change in number of people employed on farms by type (people; actual; 1985 vs 1998)
Source: SNZ; various other sources; Coriolis analysis
Employedin
1985
MoreSheep& Beef
MoreDairy
MoreDeer
MoreOther
Livestock
FewerGrain
MoreFruit
MoreVege-tables
Employedin
2002
118,474 +1,042
+16,905 +2,173+4,279
-395
+9,526+6,127 157,938 Discussion Points
• Are we becoming more labour intensive in primary production?
• Role of changing tax law (i.e. employing previously unpaid family members?)
• Will this trend continue?
Notes
• See various sections for details• Total people not FTE; farm employment survey
conducted only twice in last 18 years (1998, 2004)
• Uses 1998 data as this incorporated working proprietors (not measured in 2004 survey), except seafood which uses 2003 data which incorporates working proprietors
• May not capture total pool of seasonal labour; no measure of unpaid working family members (35,000 across livestock & horticulture in 1985 survey – the only time this was measured)
Food farm and fishing employment+39,464
LessFishermen
-193

15
Mapping
Overview
8,933
28,250
50,970 $6,098
4.5
39.5
1,7945.2
14,000
48,400 $6,330
217 1.6
2,300 3,240 $317
598 1.84,870 13,470 $1,749
Land Use # of livestock # of farms Employment Turnover
Livestock farming overview by farm type(various)
Beef & Sheep
Sheep
Dairy
Deer
Mixed/Other
Source: various (see detail pages); Coriolis analysis
Discussion Points
• Relative efficiency be sector
Notes
• Definitions and details available on relevant pages
• Sheep and beef data combined in most cases due to statistical softness between different definitions (i.e. primarily sheep, sheep-beef, beef)
52.6
Beef
11,542 49,420 116,080 $14,494
(m) (ha; 000) (actual) (people) (NZ$; m)
A. PASTORAL AGRICULTURE - OVERVIEWBeef, sheep and dairy farming dominate New Zealand livestock farming

16
Mapping
Overview
$1,838 $1,753 $2,033 $2,533 $2,835 $2,565$173 $183 $218
$270$330 $318$1,080 $1,178
$1,436$1,877
$2,233$2,056
$801 $847$1,001
$1,196
$1,388$1,198$3,915 $4,080
$4,829
$6,789
$7,898
$6,330
$226 $227
$299
$339
$404
$317
$191 $207
$198
$184
$250
$234
$152 $149
$154
$168
$203
$194
$242 $245
$295
$372
$430
$547
$325 $355
$446
$499
$594
$549
$95 $135
$184
$208
$239
$186
1998 1999 2000 2001 2002 2003
Total farm turnover by farm type(dollars, millions, 1998-2003)
A. PASTORAL AGRICULTURE - FARM TURNOVER GROWTHPasture farm turnover showed strong growth in the last five years
Sheep Farming
Grain/Sheep/Beef
Sheep/Beef
Beef
Dairy
Deer
Horses
6.9%
12.9%
13.7%
8.4%
10.1%
7.0%
CAGR98-03
14.4%
Source: SNZ Annual Enterprise Survey; Coriolis analysis
Discussion Points
• Has the cycle turned? If so, are we heading for a hard landing or soft?
• How much is sustainable? How much is cyclical or currency? How much is one off events (i.e. BSE)?
Notes
• AES 2004 data not yet available
• Comparable data not prior to 1998
• Methodology defines farm by primary income source
• Actual dollars; not inflation adjusted
9.9%
$9,359
$14,494
Poultry 4.1%Pigs 5.0%Mixed livestock 17.7%Livestock nec 11.1%
$9,038
$11,093
$14,435
$16,804

17
Mapping
Overview
A. PASTORAL AGRICULTURE - DIRECTIONAL TRENDSOver the medium-to-long term, some sectors of livestock farming are struggling, while others are experiencing good growth
# of livestock
(85-02 (95-02)Land Use
(85-02)
# of Farms(85-02) (95-02)
Employ-ment(85-98
Turnover(98-03)
Beef ▼ ▼ ▲ ▲ ▲ ▲ ▲Sheep ▼ ▼ ▼ ▼ ▲ ▼ ▲Sheep/ Beef - - ▼ ▼ ▼ ▲ ▲Dairy ▲ ▲ ▲ ▼ ▼ ▲ ▲Deer ▲ ▲ ▲ ▲ ▲ ▲ ▲Pigs ▼ ▼ ▲ ▼ ▼ ▲ ▲Poultry ▲ ▲ ▲ ▼ ▼ ▲ ▲Other ▼ ▼ ▼ ▲ ▲ ▲ ▲
Directional trends in livestock farming(growth or decline)
Discussion Points
• Long-term prognosis for sheep?
• Ultimate potential of deer?
• Consolidation in dairy
Notes
• Differing time periods (e.g. turnover 5 years vs. land use 17 years)
• Use with caution; should be treated as directional; different surveys; different methods; different definitions
• Details available on specific pages
Source: various (see detail pages); Coriolis analysis
18
Mapping
Overview
A. PASTORAL AGRICULTURE - DRIVERS OF INCREASED OUTPUTThere are a limited number of drivers of increased output from pastoral agriculture
More pasture based output
Moregrazingland
Increase efficiency of land
More irrigation
Better animal genetics
Improved farm management
New or different species
Key drivers of change in pasture-based land output (model)
More high country
More grassland
Increase efficiency of animals
Better fertiliser utilisation
Better pasture

19
Mapping
Overview
A. PASTORAL AGRICULTURE - POTENTIAL FOR TRANSFORMATIVE CHANGEPastoral agriculture in New Zealand will struggle to increase volume output significantly over the next decade
Objective Key Driver
Potential for transformative
change Key Issues
None
Low
Medium
Low
Better pasture Low – Consumer opposition to genetic modification
Medium
Medium
New or different species
Low – Failure of numerous past attempts (e.g. goats)– Increased biosecurity regulation limiting new species
introduction1
More grassland
– Very marginal land created by historic subsidies– Increasing environmental concerns
– Competition with forestry– Increase in lifestyle blocks (+37,600ha/year)
– Public opposition to new schemes– Cost of systems/new schemes– Market pricing of water
– Groundwater pollution– Cost
– Dispersed and fragmented population– Traditional attitudes– Gap between leaders and average
– Consumer opposition to genetic modification
Better fertiliser utilisation
Improved farm management
Increased efficiency of animals
Better animal genetics
More grazing land
More high country
Increase efficiency of land
More irrigation
Potential for transformative change in pasture-based land output (model)
1. All commercial agriculture in New Zealand is based on non-indigenous species; therefore limiting introduction of non-indigenous species limits innovation

20
Mapping
Overview
A. PASTORAL AGRICULTURE - RECOMMENDATIONSBased on our research, we make the following recommendations to the taskforce
Recommendations to Food and Beverage Taskforce to increase pasture-based land output
Objective Issue Recommendations
1. Control spread of lifestyle blocks through zoning rather than through minimum block size2. Research actual lifestyle land required per household (i.e. are we forcing them to take 20ha when
they really want 2ha)3. Encourage systems to optimise production on lifestyle blocks (e.g. leasing by commercial farmers)
1. Review effect of environmental legislation on land use
1. Measure amount of water used by irrigation2. Expand area served by irrigation schemes3. Introduce market pricing to water to encourage efficient use of water resources4. Encourage conversion of border dike irrigation to centre pivot irrigation
1. Fund research into efficiency of fertiliser utilisation
Better pasture 1. Continue to fund pasture research2. Ensure free access to overseas species/germ plasm
1. Ensure we have the best initial farm management training program2. Explore farm extension program to disseminate best practice
1. Understand regulatory barriers to introduction of new genetic material2. Continue to fund agricultural research
New or different species
1. Government program to evaluate potential new livestock species2. Review Hazardous Substances and New Organisms Act to enable free and open access to non-
indigenous species required for continued innovation 3. Explore role of government in infant industry support
Decreasing amount of land being farmed
Better fertiliser utilisation
Improved farm management
Increased efficiency of animals
Better animal genetics
More grazing land
Massive growth of lifestyle blocks
Increase efficiency of land
More irrigation

21
Mapping
Overview
$273
$312
1999 2003
3.4%
CAGR
Total grain farm turnover(dollars, millions, 1999-2003)
B. ARABLE/HORTICULTURE – GRAIN - FARM TURNOVER GROWTH Grain farm turnover only grew at 3.4% per annum between 1999-2003
98-03
Source: SNZ Annual Enterprise Survey; Coriolis analysis
Discussion Points
• Low growth of grain
Notes
• AES 2004 data not yet available
• Comparable data not available for earlier periods
• Methodology defines farm by primary income source
• Actual dollars; not inflation adjusted

22
Mapping
Overview
12,799
540
1,400
9,420$428
2,915
17
330
1,230
$532,093
30
430
1,090
$4811,964
320
2,300
5,020
$392
17,359
166
1,200
2,190 $279
2,754
20
290
1,850$673,099
14
1,200
5,53724
800 2,710 $150
Land Use Production # of farms Employment Turnover
Fruit & nut horticulture overview by type(various)
Apple & Pear
Grapes
Berry fruit
Other
Source: various (see detail pages); Coriolis analysis
Discussion Points
• Relative efficiency be sector
Notes
• Definitions and details available on relevant pages
• Production data understates other as data not collected for all fruit & nuts
58,520 1,131 7,950 23,510 $1,417
(m) (t; 000) (actual) (people) (NZ$; m)
Stone fruitCitrus
Kiwifruit
B. ARABLE/HORTICULTURE – FRUIT & NUTS - OVERVIEWApples, kiwifruit and grapes account for a large part of the fruit & nut sector

23
Mapping
Overview
B. ARABLE/HORTICULTURE – FRUIT & NUTS – DIRECTIONAL TRENDGrapes, avocados and “other” fruit & nuts stand out as the long-term winners
Land Use(85-02 (95-02)
Prod-uction(94-04)
# of Farms(85-02) (95-02)
Employ-ment(85-98
Turnover(98-03)
Apple & Pear ▲ ▼ = ▲ ▼ ▲ ▲Stone fruit ▼ ▼ ▼ ▲ ▲ ▲ ▲Citrus ▼ ▲ ▼ ▲ ▼ ▲ ▲
Berryfruit ▼ ▲ ▲ ▼ ▼ ▲ ▲
Kiwifruit ▼ = ▲ ▲ ▲ ▼ ▲Grapes ▲ ▲ ▲ ▲ ▲ ▲ ▲
Avocados ▲ ▲ ▲ ▲ ▲ n/a n/a
Other ▲ ▲ ▲ ▲ ▲ ▲ ▲
Directional trends in fruit & nut horticulture(growth or decline)
Discussion Points
• Long-term prognosis for apples
Notes
• Differing time periods (e.g. turnover 5 years vs. land use 17 years)
• Use with caution; should be treated as directional; different surveys; different methods; different definitions
• Details available on specific pages
Source: various (see detail pages); Coriolis analysis

24
Mapping
Overview
$338$428
$49
$53$38
$48
$331
$392
$134
$279
$54
$67
$96
$150
1999 2003
Total fruit orchard turnover by type(dollars, millions, 1999-2003)
Apples & Pears
Stone fruitCitrus
Kiwifruit
Grapes
Berry fruit
Other fruit/nuts nec
6.1%
2.0%6.0%
4.3%
20.1%
5.5%
CAGR
B. ARABLE/HORTICULTURE – FRUIT & NUTS - ORCHARD TURNOVER GROWTHOrchard turnover is up in the past four years, especially in grapes and other fruit
98-03
11.8%
Source: SNZ Annual Enterprise Survey; Coriolis analysis
Discussion Points
• Strong growth of grapes and other fruit
Notes
• AES 2004 data not yet available
• Comparable data not available for prior periods
• Methodology defines farm by primary income source
• Actual dollars; not inflation adjusted
8.0%
$1,040
$1,417

25
Mapping
Overview
$664
$886
1999 2003
Total vegetable farm turnover(dollars, millions, 1999-2003)
7.5%
CAGR
B. ARABLE/HORTICULTURE – VEGETABLES - FARM TURNOVER GROWTH Total vegetable farm turnover has grown at a compound rate of 7.5% in the past four years
98-03
Source: SNZ Annual Enterprise Survey; Coriolis analysis
Discussion Points
• What is driving turnover growth?
Notes
• Actual dollars; not inflation adjusted
• No additional breakdown available at source
• AES 2004 data not yet available
• Comparable data not available for prior periods
• Methodology defines farm by primary income source

26
Mapping
Overview
B. ARABLE/HORTICULTURE – VEGETABLES - DIRECTIONAL TREND From the limited data available, the vegetable industry does not look healthy
Directional trends in vegetable farming(growth or decline)
Discussion Points
• Why?
Notes
• Limited data available
• Differing time periods (e.g. turnover 5 years vs. land use 17 years)
• Use with caution; should be treated as directional; different surveys; different methods; different definitions
• Details available on specific pages
Source: various (see detail pages); Coriolis analysis
Land Use(82-02 (95-02)
Prod-uction(94-04)
# of Growers(97-04)
Employ-ment(85-98
Turnover(98-03)
Overall ▲ ▼ ▼ ▼ ▼ ▲Potatoes ▲ = ▲ ▼ n/a n/a
Onions ▲ ▼ ▼ ▼ n/a n/a
Squash ▲ ▼ ▼ ▼ n/a n/a
Carrots ▲ ▼ ▼ ▼ n/a n/a
Other ▲ ▼ ▲ ▼ n/a n/a
Peas & beans ▼ ▼ ▼ ▼ n/a n/a
Sweetcorn ▲ ▼ ▲ ▼ n/a n/a
Broc/Cab/Cauli ▲ ▼ ▲ ▲ n/a n/a
Asparagus ▼ ▼ ▼ ▼ n/a n/a

27
Mapping
Overview
B. ARABLE/HORTICULTURE - DRIVERS OF INCREASED CULTIVATED LAND OUTPUTThere are a limited number of drivers of increased output from cultivated land
More cultivation based output
Moreland
Increase efficiency of land
More irrigation
Better plant genetics
Improved farm management
New or different species
Key drivers of change in cultivated land output (model)
More crop land
More horticultural land
Increase efficiency of plants
Better fertiliser utilisation

28
Mapping
Overview
B. ARABLE/HORTICULTURE - POTENTIAL FOR TRANSFORMATIVE CHANGEWhile New Zealand will struggle to increase crop output, there appears to be opportunities in increased horticultural output
Objective Key Driver
Potential for transformative
change Key Issues
Low
Medium
High
Medium
Medium
Medium
New or different species
Medium – Emerging new species (e.g. nuts, olives)– Increased biosecurity regulation limiting new species
introduction1
– High cost of introducing new species
More horticultural land
– Competing land use (e.g. horses in Waikato)– Not a low cost producer of grains/pulses
– Increase in lifestyle blocks (+37,600ha/year)– More sheep-to-grapes/olives conversions
– Public opposition to new schemes– Cost of systems/new schemes– Market pricing of water
– Groundwater pollution– Cost vs. returns
– Dispersed and fragmented population– Traditional attitudes– More efficient production systems
– Improved cultivars of existing species– Consumer opposition to genetic modification
Better fertiliser utilisation
Improved farm/orchard management
Increased efficiency of plants
Better plant genetics
More land More crop land
Increase efficiency of land
More irrigation
Potential for transformative change in cultivated land output (model)
1. All commercial agriculture in New Zealand is based on non-indigenous species; therefore limiting introduction of non-indigenous species limits innovation

29
Mapping
Overview
B. ARABLE/HORTICULTURE - RECOMMENDATIONSBased on our research, we make the following recommendations to the Taskforce
Recommendations to Food and Beverage Taskforce to increase cultivated land output
Objective Issue Recommendations
1. Control spread of lifestyle blocks through zoning rather than through minimum block size2. Research actual lifestyle land required per household (i.e. are we forcing them to take 20ha when
they really want 2ha)3. Encourage systems to optimise production on lifestyle blocks (e.g. leasing by commercial farmers)
1. Research causes of arable crop land decline2. Research requirements for globally competitive grain production (e.g. new varieties)
1. Measure amount of water used by irrigation2. Expand area served by irrigation schemes3. Introduce market pricing to water to encourage efficient use of water resources4. Encourage use of drip irrigation
1. Fund research into efficiency of fertiliser utilisation (more efficient/less runoff)
1. Ensure we have the best initial farm/orchard management training program2. Explore farm extension program to disseminate best practice
1. Ensure access to leading international sources of plant genetics2. Understand regulatory barriers to introduction of new genetic material3. Continue to fund agricultural research
New or different species
1. Government program to evaluate potential new livestock species2. Review Hazardous Substances and New Organisms Act to enable free and open access to non-
indigenous species required for continued innovation (no new commercial plant species imported since act introduced (ie 7 years))
3. Explore role of government in infant industry support
Decline in land under arable crops
Better fertiliser utilisation
Improved farm management
Increased efficiency of plants
Better plants genetics
More land Massive growth of lifestyle blocks
Increase efficiency of land
More irrigation

30
Mapping
Overview
2. MANUFACTURING & WHOLESALINGThe second section of this overview looks at manufacturing and wholesaling
PrimaryProduction
Manufacturing& Wholesaling

31
Mapping
Overview
SWOT ANALYSIS –FOOD & BEVERAGE INDUSTRYNew Zealand food manufacturers face a uncertain future
Strengths Weaknesses
– Natural environment highly conducive to pastoral agriculture– Low cost energy inputs– Disease free status– Potential for year round production– Positive reputation internationally (but low awareness)
– Six to twelve weeks sea freight to major markets; very expensiveairfreight to Northern Hemisphere; excessive shipping costs across the Tasman
– Twelve to twenty four hours flight for senior managers to meet with customers
– Relatively small domestic market– Only one top 50 global food and beverage company based here
Opportunities Threats
– Continued income and consumption growth in Asia– Ongoing global growth of foodservice– Aging baby boomers seeking healthy foods– Closer economic integration with Australia– Growing Asian population in New Zealand– Ongoing moves towards more free trade through bilateral and
multilateral talks– Genetic modification to create super-food
– Consolidation by retail chains in North America, Europe and Asialeading to uneven bargaining and downward pressure on prices
– Consolidation by food and beverage manufacturers making New Zealand a sales office
– Increasing food and beverage production in China– Changing global weather patterns
SWOT analysis of New Zealand in a global food and beverage market

32
Mapping
Overview
CAPABILITY ASSESSMENTComparing the capabilities of the New Zealand food industry to Frito-Lay, a division of Pepsicowith roughly the same turnover, indicates Dairy is currently the best positioned sector
Global sales force regularly calling on all
accounts Strong brands
Track record of successful innovation
Market share leader in segment
Low cost production
infrastructureWell financed
parent(s)
Frito-Lay
�����
Dairy
Meat
Seafood
Horticulture (ex wine)
Wine
Other�
New Zealand Food & Beverage capability assessment(model)
Note: Frito-Lay, an operating division of Pepsico, had sales of about US$17.9b in 2004; Source: Coriolis analysis

33
Mapping
Overview
TOP 50 GLOBAL FOOD & BEVERAGE COMPANIESIn a globalising and consolidating world, food and beverage multinationals are the winners – we currently have one based in New Zealand; how do we have more?
$61,615
$36,151
$31,010
$29,938
$27,260
$26,971
$24,549
$21,044
$17,000
$14,850
$14,642
$14,522
$14,147
$11,452
$11,366
$11,070
$10,743
Nestlé
ADM
Kraft
Unilever
Cargill
PepsiCo
Tyson Foods
Coca-Cola
Mars
Groupe Danone
Diageo
ConAgra
Anheuser-Busch
Kirin Brewery
SABMiller
General Mills
Sara Lee
$10,525
$10,467
$10,150
$9,925
$9,879
$8,940
$8,812
$8,415
$8,415
$7,989
$7,967
$7,197
$6,993
$6,979
$6,884
$6,729
$6,678
Cadbury Schweppes
Heineken
Asahi Breweries
Suntory
Swift
Dean Foods
Kellogg
H.J Heinz
Smithfield Foods
Nippon Meat Packers
Interbrew Brussels
Carlsberg Breweries
Dairy Farmers of America
Associated British Foods
Scottish & Newcastle
FEMSA de CV
Campbell Soup
Top 50 Global Food and Beverage Companies(US$m; FY03 or early 04)
Source: Food Engineering; Coriolis analysis
$6,575
$6,560
$6,547
$6,259
$6,105
$6,068
$6,051
$5,418
$5,345
$5,149
$4,866
$4,856
$4,773
$4,749
$4,586
$4,250
Fonterra
Parmalat
Ajinomoto
Maruha
Danish Crown
Arla Foods
Groupe Lactis Laval
Meiji Milk
Yamazaki Baking
Allied Domecq
Friesland Coberco Meppel
Tate & Lyle
Dole Food Company
McCain Foods
Morinaga Milk Industry
Itoham Foods

34
Mapping
Overview
DRIVERS OF INCREASED F&B MANUFACTURING INVESTMENTMore food and beverage investment in New Zealand will come from delivering a world-class return on invested capital through addressing the higher costs of local manufacturing
World-classReturn on Invested Capital
Key cost drivers of more Food and Beverage investment (model)
More F&B manufacturing investment
=
Earnings before interest & tax (EBIT)
Invested capital/sales
Gross margin
Operating expense
Working capital/sales
Fixed assets/sales
Labour
Cost of goods
Occupancy
Shipping & freight
Cost of packaging
Repairs/Maintenance
Customer terms
Delivery time
Seasonality
Land cost
Equipment cost
DepreciationTax
Interest ratesNet profit(NPAT)
+
-
++
=
=
=++
+ -+=
&
=
Building cost =
Relativeposition
of NZ

35
Mapping
Overview
POTENTIAL FOR TRANSFORMATIVE CHANGEIncreasing the return from investment in food and beverage will come from the cumulative effect of a number of changes
Objective Key Driver
Potential for transformative
change Key Issues
Low
Lower operating expenses
Labour Low – Productivity of workforce– Availability of workers
Occupancy Low – Time and investment to open new facility
Shipping & freight Medium – Inability of SME to negotiate low shipping rates– Limited number of freight companies– Relatively high cost of crossing Cook Straight– Relatively high cost of crossing Tasman
Medium
High
None
Low
Low
– Remaining tariffs and duties on raw materials
– Depreciation rates unreflective of business reality
– Investment in New Zealand competes with other countries with a lower tax burden
– Cash flow impact of long travel time to key markets
– Time and cost involved in negotiating environmental regulation
– Remaining tariffs and duties on machinery and equipment– Limited number of suppliers
Depreciation
Lower working capital/sales
Distance to market
Lower fixed assets/sales
Land cost
Equipment cost
Larger gross margins
Tariffs and duties
Less tax Relative levels
Encouraging increased investment in Food & Beverage manufacturing (model)
1. All commercial agriculture in New Zealand is based on non-indigenous species; therefore limiting introduction of non-indigenous species limits innovation

36
Mapping
Overview
RECOMMENDATIONSBased on our research, we make the following recommendations to the taskforce
Objective Issue Recommendations
1. Investigate any remaining tariffs and duties on inputs to the food and beverage industry (ingredients and capital assets)
1. Ensure basic education is received by all2. Invest in training
1. Encourage a greater percent of the population to enter the workforce2. Facilitate development and spread of labour saving machinery3. Facilitate immigration of skilled workers
High shipping costs 1. Pool smaller exporters volumes and negotiate better rates in bulk
Achieving economies of scale
1. Understanding benefits and constraints on scale in New Zealand (vs. competition)2. Facilitate horizontal alliances between companies to share costs
Unrealistic depreciation
1. Align depreciation schedule with real-world usage
1. Benchmark f&b tax burden with relevant investment competitors (temperate climate livestock and horticulture producing countries (e.g. Chile))
1. Ensure factory-to-ship process is streamlined and un-encumbered with red-tape2. Ensure/encourage/facilitate competition in sea and air freight
Lower fixed assets/sales
Land cost 1. Streamline environmental consent process for green fields sites
Tight labour market
Less tax Relative tax burden
Lower working capital/sales
Distance to market
Larger gross margins
Remaining tariffs and duties
Lower operating expenses
Low workforce productivity
Recommendations to Food and Beverage Taskforce to increase investment in food and beverage manufacturing

37
Mapping
Overview
$5.3 $5.5$6.5
$5.4$6.1
$9.4$0.8$1.2
$1.2
$1.3
$1.2
$1.4
$1.6$1.4
$2.2
$1.4$1.4
$1.8
$1.5
$3.1
$3.9
1996 1999 2003
Food & Beverage manufacturing turnover by sector(dollars, billions, 1996-2003)
Source: SNZ Annual Enterprise Survey survey; Coriolis analysis and estimates
Meat
Dairy
Seafood
Fruit & vegetablesFlour, cereal, bakery
Other food
Beverages/tobacco
$17.3
3.1%
8.1%
3.8%
5.4%1.3%
5.0%
14.7%
CAGR
FOOD & BEVERAGE MANUFACTURING TURNOVERFood & beverage manufacturing is growing, driven by dairy, beverages/tobacco, fruit & vegetables and other food
(96-03)6.3%
Discussion Points
• Continuing reliance on livestock-based products
Notes
• No data available prior to 1996 (AES); 2004 data not yet available
• Beverages includes wine
• Beverages includes tobacco (inseparable at source)
$20.0
$26.4

38
Mapping
Overview
256 250 233
83 65 70
133 132 131
72 91 10631 28 3927 23 33
253207 195
326342
429
168 223
278
1994 1999 2003
Food & Beverage manufacturing enterprises by sector(enterprises, actual, 1994-2003)
Source: SNZ Business Demographics survey; Coriolis analysis
Meat
Dairy
Seafood
Fruit & vegetablesOils & fatsFlour & cereal
Bakery Products
Other food
Beverages1,349 1,361
1,514
-23
-13
-2
+34+8+6
-58
+103
+110
Absolute
NUMBER OF FOOD & BEVERAGE MANUFACTURING ENTERPRISESOnly three sectors of food and beverage manufacturing are creating significant numbers of new enterprises: beverages, “other food” and fruit & vegetables
Change(94-03)+165 Discussion Points
• Large economic importance of a small number of enterprises
Notes
• Defined as businesses registered for GST purposes (+$30,000pa)
• Beverages includes wine

39
Mapping
Overview
26,993 25,834 28,472
8,906 8,94310,551
6,220 6,985
7,1953,795 4,300
4,565414 399
238
1,034 547
7517,275 7,079
8,3857,667 7,128
7,5543,343 5,251
7,531
1994 1999 2003
Food & Beverage manufacturing employees by sector(people, actual, 1994-2003)
Source: SNZ Business Demographics survey; Coriolis analysis
Meat
Dairy
Seafood
Fruit & vegetablesOils & fatsFlour & cereal
Bakery Products
Other food
Beverages65,647 66,466
75,242
+1,479
+1,645
+975
+770-176-283
+1,110
-113
+4,188
Absolute
NUMBER OF EMPLOYEESFood and Beverage employment growth is coming from all sectors except “other food,” flour & cereal and oils and fats
Change(94-03)+9,595 Discussion Points
• Other food: more enterprises with fewer employees?
Notes
• Includes working proprietors
• Total employees not FTE

40
Mapping
Overview
NUMBER OF MANUFACTURING ENTERPRISES BY BUSINESS EMPLOYMENT SIZE The New Zealand food and beverage manufacturing sector is made up of a companies of a wide range of sizes (as defined by number of employees)Food & Beverage Manufacturing Enterprises by Employment Size by Sector(enterprises, actual, 2004)
10-19
20-49
100+
1-5
6-9
50-99
239 77 110 42
Source: SNZ Business Demographics survey; Coriolis analysis
2
Dairy Fruit &
Vege Toba
ccoMeat &
Meat Products
30560632 208
Beverages& Malt
OtherFood
BakeryProducts
Oil
& F
atFl
our
& C
erea
l
Num
ber o
f Em
ploy
ees
in E
nter
pris
e
None
Uses 2004 data unlike rest of document

41
Mapping
Overview
MANUFACTURING EMPLOYMENT BY BUSINESS EMPLOYMENT SIZE BY SECTOR However, the vast majority of employed people work in the large companies
Food & Beverage Manufacturing Employment By Sector(employees, actual, 2004)
10-19
20-49
100+
1-5
6-9
50-99
1,730 30,995 10,435 4,965
Note: Does not count sole proprietors and other business with no employees (e.g. holding companies)Source: SNZ Business Demographics survey; Coriolis analysis
470
Dairy Fruit &
Vege Toba
ccoCommercial
FishingMeat &
Meat Products
7,88017,3105,590
260 805
Beverages& Malt
OtherFood
Bake
ryPr
oduc
ts
Oil
& F
atFl
our
& C
erea
l
Num
ber o
f Em
ploy
ees
in E
nter
pris
e
Uses 2004 data unlike rest of document

42
Mapping
Overview
139 135 13218 42 4983 90 116137 136 153183 192
24258 4036
619792
1,004148
220
198
77
134
181
1994 1999 2003
Food & Beverage wholesale enterprises by sector(enterprises, actual, 1994-2003)
Source: SNZ Business Demographics survey; Coriolis analysis
MeatPoultry & Smallgoods
Seafood
Fruit & vegetables
Cereal & grains
Grocery nec
Soft drinks& confectionery
Liquor
1,462
1,781
2,111
-7+31
+16
+59
-22
+385
+50
+104
Absolute
NUMBER OF FOOD WHOLESALING ENTERPRISESThe number of food wholesalers is increasing, except cereal & grains and meat
Change(94-03)+649 Discussion Points
• More smaller importers?
Notes
• Defined as businesses registered for GST purposes (+$30,000pa)
Dairy +33

43
Mapping
Overview
1,070 795 90559 234 223
1,725 1,470 635
970 770975
2,8302,380 3,530
1,3001,055 795
17,480
15,960
18,903
475
695
7801,035
695
875
1994 1999 2003
Source: SNZ Business Demographics survey; Coriolis analysis
26,944
24,054
27,621
MeatPoultry & SmallgoodsSeafood
Fruit & vegetables
Cereal Grains
Grocery nec
Soft drinks& confectionery
Liquor
-165+164+5
+700
-505
+1,423
+305-160
Absolute
NUMBER OF FOOD WHOLESALING EMPLOYEESThree sectors are generating the bulk of food wholesaling employment growth: grocery nec, fruit & vegetables and soft drinks and confectioneryFood & Beverage wholesale employees by sector(people, actual, 1994-2003)
Discussion Points
•
Notes
• Includes working proprietors
• Total employees not FTE
• Nec: not elsewhere classified (iegeneralists)
Change(94-03)+677
Dairy -1,090

44
Mapping
Overview
$45 $58 $104$50 $69$79$33 $41$58$181
$242$277
$884
$1,222
$1,515$23
$41
$45
$186
$271
$365
1994 1999 2004
Food & Beverage imports by type(dollars, millions, 1994-2004)
Source: SNZ Business Demographics survey; Coriolis analysis
Meat
Dairy
Seafood
Fruit & vegetables
Other food(see next page)
Beverages
8.8%
5.9%
7.1%
4.4%
5.5%
7.0%
CAGR
FOOD & BEVERAGE IMPORTSFood and beverage imports are showing moderate growth, primarily in “other food”
(94-04)5.7% Discussion Points
• Growth of meat imports (primarily pork)
Notes
• Uses HS2 codes
• Dairy includes ice cream but excludes honey and eggs (in other food)
• Meat is primarily pork ($73m in 2004)
• Actual NZ dollars; not inflation adjusted
$1,401
$1,944
$2,443
Prep. meat & fish 4.7%

45
Mapping
Overview
$60 $67 $54
$105 $119 $158$24 $25 $33$81
$186$220
$47
$47$65
$95
$133
$164
$150
$144
$151
$60
$95
$131
$96
$150
$188
$166
$256
$353
1994 1999 2004
Details of “other food” imports by type(dollars, millions, 1994-2004)
Source: SNZ Business Demographics survey; Coriolis analysis
Spices, coffee & tea
Cereals
Milling, malt, starch
Misc grain, seed prep
Miscellaneous food
-1.1%
4.2%
3.2%
3.2%
7.9%
CAGR
OTHER FOOD IMPORTS“Other food” captures a range of food ingredients and products
(94-04)5.5%
Discussion Points
• Increasing imports of grain based products
• Growth of cocoa, misc. foods and preserved foods
• Growth of baking related (e.g. biscuits)
Notes
• Uses HS2 codes (with adjustments from prior page)
• “Baking related” (HS19) includes pasta, biscuits and other processed grain products
Fats & oils 5.6%
Sugars, confectionery 0.0%
Cocoa 8.1%
Baking related 10.5%
Preserved foods 6.9%
$884
$1,222
$1,515

46
Mapping
Overview
3. MARKETSThe third section of this overview looks at markets for our foods and beverages
PrimaryProduction
Manufacturing& Wholesaling
Domestic
Export

47
Mapping
Overview
Structure of the New Zealand food industry(model)
PrimaryProducer
Food & BevManufacturer
Food & BevWholesaler Food & Bev
Retailer
Consumer
FoodserviceImports
$2.4b
Exports$15.4b
WorldMarket
$9.5b
$1.8b
$13.8b
$5.0b
$27b
Source: SNZ; various other sources; Coriolis analysis and estimates
INDUSTRY STRUCTUREThe New Zealand food & beverage sector has both a domestic and an export component
Domestic Market

48
Mapping
Overview
TURNOVER GROWTH: DOMESTIC VS. EXPORT VS. IMPORTSNet of imports, industry output has grown by $10.2 billion over the last ten years, (to $25.3 billion sales in 2004), an average compound rate of growth of 5.3% in nominal termsTotal New Zealand food & beverage turnover growth by type(NZ$, b, 2004)
Source: see relevant sections of main document
Discussion Points
• Imports growing faster than exports
Notes
• Represents wholesale sales into domestic retail and foodservice markets not retail sales to customers and import/export value at border
• Domestic includes imports (effectively double counted); domestic production for domestic use would subtract imports less import wholesalers margins
• For details see complete document; significant footnotes exist for various numbers
-$1.4 -$2.4
$7.2
$12.4
$9.3
$15.4
1994 2004
Exports
Domestic
Imports
$15.1
$25.3
CAGR
5.2%
5.5%
5.7%
5.3%(94-04)
AbsoluteChange(94-04)+$10.2
+$6.1
+$5.1
-$1.0

49
Mapping
Overview
DOMESTIC VS. EXPORTThe relative strength of the domestic and exports components varies significantly by sector
Total New Zealand food & beverage turnover by segment(NZ$, b, 2004)
$2.0$1.4 $1.5
$1.0
$3.4
$0.2
$4.6$6.4
$2.0
$0.1
$0.4$0.6
$2.9
$1.2
Meat Dairy Fruits &vegetables
Grain-basedfoods
Other foods Seafood Beverages
$6.6
$7.8
$3.5
$1.1
$3.8
$1.5
$3.5
Discussion Points
• Role of comparative advantage
• What is required to build another $1 billion export sector? Which segment of “other” is the most likely candidate?
• Is innovation coming from the domestic or export sector?
Notes
• Represents wholesale sales into domestic retail and foodservice markets not retail sales to customers; Assumes one export dollar = one wholesale dollar to retail
• Domestic includes significant imports
• For details see complete document; significant footnotes exist for various numbers
Source: see relevant sections of main document

50
Mapping
Overview
$1.1$2.0
$0.8
$1.4$0.9
$1.5
$0.7
$1.0
$1.9
$3.4
$0.1
$0.2
$1.7
$2.9
1994 2004
Grain-based foods
$7.2
$12.4
Meat
Dairy
Fruit & vegetables
Other food
Seafood
Beverages
CAGR Discussion Points
• Relative importance of other food and beverages (vs. exports)
Notes
• Represents wholesale sales into domestic retail and foodservice markets not retail sales to customers
• Revised category classifications and data from earlier document based on additional analysis to including better data on alternative channels (e.g. hospitality)
• For details see complete document
6.2%
6.0%
5.0%
5.8%
4.6%
5.5%
(94-04)
5.5%
3.6%
Domestic food & beverage market by sector at wholesale(dollars, millions, 1994-2004)
Source: SNZ HHES; SNZ RTS; interviews; Coriolis Foodservice in New Zealand; Coriolis analysis & estimates
FOOD & BEVERAGE DOMESTIC MARKET BY SECTOR The domestic food and beverage industry has grown at a compound rate of 5.5% over the past decade

51
Mapping
Overview
$2,846 $3,039
$4,628
$3,632
$4,857
$6,461
$79
$88
$155
$790
$1,129
$1,428
$419
$513
$579
$198
$184
$314
$1,158
$1,318
$1,238
$139
$254
$570
1994 1999 2004
Grain-based foods
Source: WTA; SNZ; Coriolis analysis
$9,261
$11,380
$15,376
Discussion Points
• Heavy reliance on livestock-based food exports
• Growth in beverages coming from wine
Notes
• Revised classifications:• Meat now includes canned/preserved
meat (HS1601-1602)• Seafood now includes canned/preserved
seafood (HS1603-1605)• Dairy now includes ice cream (HS2105),
dairy protein (HS2106), Casein(HS3501) and albumin (HS3502) and excludes honey (HS0407) and eggs(HS0409)
• Fruit & vegetables now includes preserved f&v (HS2001-2008), but excludes Wine (HS2204-2206)
• Beverages includes HS22 (all), fruit juices (HS2009) and Wine (HS2204-2206)
• Oils and fat prim. meat fat; excl. butter • Addition of non-food dairy
(casein/albumins) has increased total• Excludes other of animal origin (HS05)
Meat
Dairy
VegetablesOther food
Seafood
Beverages
5.0%
5.7%
3.3%4.7%
0.7%
15.2%
CAGR(94-04)5.2%
7.0%
+$1,783
+$2,596
+$160+$116
+$80
+$431
AbsoluteChange(94-04)+$6,116
+$76
FOOD & BEVERAGE EXPORTS BY SECTOR Two sectors stand out for absolute growth (dairy and meat) and one for rate of growth (beverages)Food & Beverage exports by sector(dollars, millions, 1994-2004)
Fruit 6.1% +$638

52
Mapping
Overview
CONTRIBUTORS TO EXPORT VALUE GROWTHMuch of the food and beverage industry’s growth over the past decade has been driven by a small number of product group segmentsContributors to food and beverage export value growth over the last decade(NZ$, b, 1994-2004)
$9.2
$2.6
$1.8$0.8
$0.4 $15.4
Source: Customs data; SNZ; industry interviews; other; Coriolis estimates analysis
Discussion Points
• Do the performing sectors have the capability to grow in the next decade?
Notes
• Not inflation or exchange rate adjusted
$0.1 $0.1$0.1
F&BExports
1994
Dairy Meat Fruit &Vegetables
Grain-basedFoods
OtherFood
Seafood Beverages F&BExports
2004

53
Mapping
Overview
GLOBAL MARKET SEGMENTATIONFor the purposes of this analysis, the world market was segmented into eight cultural mega-regionsSegmentation of world markets into cultural mega-regions(model)
Sub-SaharanAfrica
Europe/Russia
East & SouthEast Asia
LatinAmerica
USA & Canada
Oceania
North AfricaMiddle EastCentral Asia
IndianSubcontinent

54
Mapping
Overview
297 313 326
800 807 809
30 32 34474 513 544
497 563 617429
474 514
1,1971,318
1,412
1,881
1,9822,056
1994 1999 2003
5,604
6,0036,312 1.3%
1.0%
2.0%
CAGR
POPULATION GROWTH BY MEGA-REGIONPopulations and population growth varies widely by mega-region with implications for current and future market sizes
1
(94-03)
2.4%
Discussion Points
• Where are the markets of the future?
• What do they want that we can produce?
USA/Canada
Europe/Russia
Sub-Saharan Africa
NA/ME/CA
E/SE Asia
Oceania1.5%Latin America
1.9%Indian Subcont.
1. CAGR = Compound Annual Growth Rate; Source: UN data; Coriolis Research
World population growth by mega-region(#, m, 1994-2003)
0.1%
1.1%
1.4%
0.4%
1.6%

55
Mapping
Overview
$7,812 $8,996 $9,610
$8,777$9,300
$9,984
$387$456
$498$2,820
$3,053$3,179
$731$830
$902
$1,382
$1,512$1,682
$1,528
$1,929$2,211$8,098
$9,682
$11,179
1994 1999 2003
$31,536
$35,758
$39,245 2.5%
3.6%
2.2%
CAGR
GDP GROWTH BY MEGA-REGIONWorld GDP and GDP growth rates, in real (inflation-adjusted) US dollars, vary significantly by region, with Asia being the standout in terms of total wealth creation
1
(94-03)
2.4%
1.4%
2.3%
Discussion Points
• How do we sell more to Asia? What do they want that we can produce?
USA/Canada
Europe/Russia
Sub-Saharan AfricaNA/ME/CA
E/SE Asia
2.8%Oceania1.3%Latin America
4.2%Indian Subcont.
World real gross domestic product growth by mega-region(US$, b, inflation adjusted 2000 dollars, 1994-2003)
Source: CountryWatch; World Bank; UN; Bank of China; Coriolis analysis
1.9%
3.1%

56
Mapping
Overview
$-
$5,000
$10,000
$15,000
$20,000
$25,000
$30,000
1994 1999 2003
2.6%
0.2%
CAGR
GDP PER CAPITA GROWTH BY MEGA-REGIONAsia and the Indian Subcontinent are the only regions to achieve real GDP per capita growth over 2% - Latin America and Sub-Saharan Africa are going backwards
(94-03)
-0.1%
1.3%
1.3%Discussion Points
• Will Latin America turn around?
• How long will it take Asia to reach developed world income levels?
• Do the food and beverages that New Zealand produces have a “take-off point” in terms of GDP/Capita?
USA/Canada
Europe/Russia
Sub-Saharan Africa
NA/ME/CA
E/SE Asia
1.6%Oceania
-0.2%Latin America
2.3%Indian Subcont.
Source: CountryWatch; World Bank; UN; Bank of China; Coriolis analysis
World real gross domestic product per capita growth by mega-region(US$, per person, inflation adjusted 2000 dollars, 1994-2003)

57
Mapping
Overview
USA/Canada $2,580
17%
Europe/Russia $3,562
24%
Oceania $1,650
11%
Asia $5,040
35%
Sub-Sah Africa $187 / 1%Latin
America $725 / 5%
NA/ME/CA $908 / 6%
Indian Sub $182 / 1%
TOTAL FOOD AND BEVERAGE EXPORTS VALUE BY MEGA-REGIONNew Zealand exported $14.8 billion in food and beverages last year – most of which went to traditional Northern Hemisphere markets and AsiaTotal New Zealand food and beverage export value by mega-region(NZ$, m, 2004)
TOTAL = NZ$14,834m
Source: Customs data; Coriolis analysis
Will not match total on earlier page; excludes non-food dairy (casein & albumins) and inclusion of some pet food (to simplify analysis)
58
Mapping
Overview
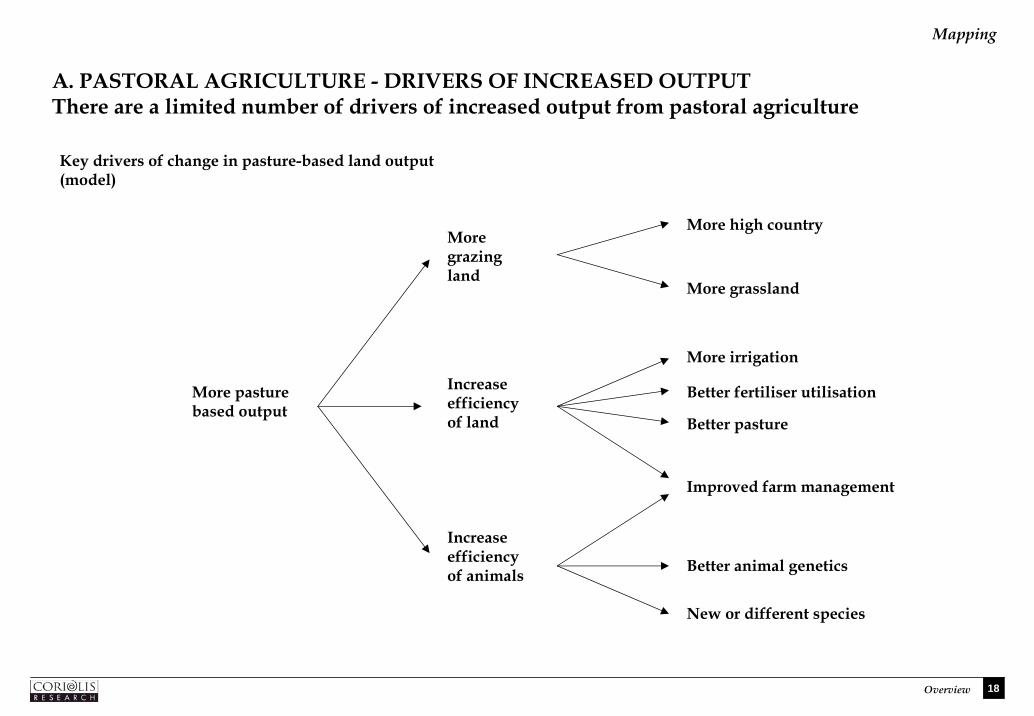
TOTAL FOOD AND BEVERAGE EXPORTS VALUE GROWTH BY MEGA-REGIONTotal New Zealand food and beverages exports have grown at a compound rate of 5.3% per annum over the past decade
$1,496 $1,853$2,580
$2,493$2,853
$3,562$832
$1,042
$1,650
$553
$575
$725
$44
$69
$187
$482
$653
$908
$97
$154
$182
$2,895
$3,573
$5,040
1994 1999 2004
$8,893
$10,773
$14,834 5.3%
5.7%
6.5%
CAGR1
(94-04)
15.5%
3.6%
5.6%
Discussion Points
• Why aren’t exports to Asia growing faster given this region’s strong growth?
• Exports to Australia/Oceania have doubled in the past decade – wneeds to happen for this to continue?
• Why is the slowest growth to Europe, given it is one of our traditional markets?
Notes
• Will not match total on earlier pagenon-food dairy (casein & albumins) and inclusion of some pet food (to simpanalysis)
USA/Canada
Europe/Russia
Sub-Saharan AfricaNA/ME/CA
E/SE Asia
7.1%Australia/Oceania
2.7%Latin America
6.5%Indian Subcont.
1. CAGR = Compound Annual Growth Rate; Source: NZ Customs data; NZTE; Coriolis Research
Total New Zealand food and beverage export value by mega-region(NZ$, m, 1994-2004)
hat
; excludes
lify

59
Mapping
Overview
$55.30
$16.27
$7.83$4.52 $3.56 $2.44 $1.82 $1.34 $0.31 $0.13
Oceania
United K
ingdom
USA/Canad
a
Europe/Russi
aEurope/R
ussia x
UK
Asia
NA/ME/C
A
Latin A
merica
Sub-Sah Afri
ca
Indian Sub
Discussion Points
• What is required to improve the performance of the US/Canada to UK levels?
• Can Asia match Europe/Russia ex. UK sales per capita?
• What generalised lessons can we draw from our success in Oceania?
Source: NZ Customs data; UN; NZTE; Coriolis Research
New Zealand food and beverage export value per capita by mega-region(NZ$, 2004)
EXPORT DOLLARS PER CAPITA BY REGIONOn a per capita basis, New Zealand exports perform well in close markets and in our traditional markets, which are culturally similar, English-speaking countries

60
Mapping
Overview
0%
10%
20%
30%
40%
50%
60%
70%
80%
90%
100%
USA/Canada
Europe/Russia
Sub-Saharan Africa
NA/ME/CA
E/SE Asia
Australia/Oceania
Latin America
Indian Subcont.
$5,007 $4,572 $1,130 $2,136 $1,989
Dairy Meat Seafood Hort(inc. Wine)
Other
Will not match total on earlier page; excludes non-food dairy (casein & albumins) and inclusion of some pet food (to simplify analysis)
EXPORT DESTINATION MATRIXTwo products – dairy and meat – and three markets – Asia, Europe and the US/Canada - are critical to New ZealandTotal New Zealand Food & Beverage exports by super region(NZ$, m, 2004)
Source: Customs data; Coriolis analysis

61
Mapping
Overview
EXPORT VALUES BY PRODUCT SEGMENTIn addition, New Zealand export food and beverage sales are highly dependent on a small number key sectors within those segments
Cheese $1,039 7%
Butter $960 6%
SMP $713 5%
WMP $1,691 11%
Other Dairy $604 4%
Beef $1,903 14%
Lamb $2,247 16%
Seafood $1,130 8%
Apples $480 3%
Kiwi $808 5%
Wine $367 2%
Other Hort $481 3%
Other $1,989 13%
Other Meat $422 3%
Total New Zealand food and beverage export value by product segments(NZ$, m, 2004)
TOTAL = NZ$14,834m
Notes: Category details and notes in sections; Dairy excludes HS3501 (Casein), which is not technically a food; Source: Customs data; Coriolis analysis
Dairy$5,00734%
Horticulture$2,136
14%
Meat$4,572 / 31%
Will not match total on earlier page; excludes non-food dairy (casein & albumins) and inclusion of some pet food (to simplify analysis)

62
Mapping
Overview
GLOBAL CONSUMPTION VS. NZ PRODUCTION GROWTHWhile New Zealand’s major exports are in low growth categories, in many cases it is gaining production share
-2
0
2
4
6
8
10
12
-2 0 2 4 6 8
World consumption growth vs. New Zealand production growth for major exports(%, CAGR, 1994-2004)
World Consumption Growth(kg/capita; cagr 94-04)
New ZealandProduction
Growth(t; cagr 94-04)
Lamb
Beef
Kiwifruit
SMPWine
ButterWMP
Seafood
Cheese
Apples
Size of bubble = NZ export sales
Note: SMP = Skim Milk Powder; WMP = Whole Milk PowderSource: Customs data; MAF; SONZAF; SNZ; Coriolis analysis
LosingShare
GainingShare

63
Mapping
Overview
TOTAL MARKET VIEWThe New Zealand food and beverage industry faces challenges in many of its key sectors
Performance scorecard of the New Zealand food & beverage industry by select key sector(various; 2004)
3.6% n/a
0.4%
0.03%
10.0%
3.5%
$367
23.6%
16.8%
43.5%
21.9%
35.6%
3.9%
19.1%
2.0%
5.6%
$808
9.4%
8.6%
7.1%
11.9%
8.9%
Global per capita consumption growth (cagr; 61-04)1
2.3% -0.8% -0.1%
1.8% -0.04%
12.3%
9.8%
-0.4%
$713
5.5%
~
-15.8%
6.5%
9.8%
6.0%
5.7%
1.3%
$960
2.0%
-2.6%
41.3%
5.6%
8.2%
2.1%
1.6%
4.0%
4.6%
$1,039
6.0%
-1.2%
8.2%
7.8%
8.8%
2.3% 0.2% -0.6% -0.7%3
to 3.8%0.7%
1.0% 2.1%
0.05%
3.2%
Global import growth from all countries (cagr; 94-04)1
3.6% -6.7% 0.4% n/a 3.3%
New Zealand export value ($m; 04) $1,691 $1,903 $2,247 $1,130 $480
Total value growth (cagr; 94-04)1 7.0% 3.8% 6.0% 0.5% 3.6%
- Europe/Russia -18.6% 5.8% 5.4% 6.4% 4.0%
- USA/Canada 31.9% 1.7% 15.0% -1.9% 4.1%
-1.7%
4.6%
1.2%
2.0%
0.09%
1.4%
0.9%
2.8%
3.7%
7.3%
3.8%
1.0%
6.7%
-0.1%
9.4%
0.8%
Global production growth rate (cagr; 94-04)1
1.7%
New Zealand global production share (%; 2004)
20.7%
New Zealand production growth (cagr; 94-04)1
5.3%
- E/SE Asia 8.7%
- Oceania/Australia 1.8%
Che
ese
Butte
r/G
hee
SMP2
WM
P2
Beef
Lam
b
Seaf
ood
App
les
Kiw
ifru
it
Win
e
Dairy Meat Horticulture
Select key food categories only(not a complete data set)
1. Some products use different periods due to missing data; 2. SMP = Skim Milk Powder; WMP = Whole Milk Powder; 3. -0.7% for Marine fish and 3.8% for Freshwater fishSource: see various sections of report; Coriolis analysis

64
Mapping
Overview
STRATEGIC VALUE OF KEY SEGMENTSAs it stands, the New Zealand Food & Beverage portfolio has a limited number of “stars”
SegmentValue($m)
Share of total F&B exports
(%$)
Cumulative share of total
exports(%$)
Global per capita
consumption growth
New Zealand Export Growth
(%$)
Lamb $2,247 16% 16% -0.6% 6.0% Cash Cow
Beef $1,903 14% 30% 0.2% 3.8% Cash Cow
Other F&B $1,989 13% 43% n/a 7.3% Rising Star
WMP $1,691 11% 54% 2.3% 7.0% Star
Seafood $1,130 8% 62% -0.7% to 3.8% 0.5% Falling Star
Cheese $1,039 7% 69% 2.3% 6.0% Star
Butter $960 6% 75% -0.8% 2.0% Cash Cow
Kiwifruit $808 5% 80% 3.6% 9.4% Star
SMP $713 5% 85% -0.1% 5.5% Cash Cow
Other Dairy $604 4% 89% n/a n/a ?
Other Hort $481 3% 92% n/a n/a ?
Apples $480 3% 95% 0.7% 3.6% Cash Cow
Other Meat $422 3% 98% n/a n/a ?
Wine $367 2% 100%
Indicated Strategic Value
n/a 23.6% Rising Star
Indicated strategic value of key segments (2004)
Source: see various sections of report; Coriolis analysis

65
Mapping
Overview
APPENDIX: MAPPING THE FOOD INDUSTRY The food industry begins with three natural resources and ends with sales to domestic consumers of to export markets
Resource ProductionManufacturing& Wholesaling Markets
Domestic
Export
Domestic
Export
Fruit & Vegetable Processing &Wholesaling
Fruit & Vegetables
Domestic
Export
Grain-basedManufacturing& Wholesaling
Domestic
Export
Pasture
Livestock Meat Processing& Wholesaling
Domestic
Export
Milk Dairy Processing& Wholesaling
Arable land & Horticulture
Grains
Domestic
ExportSeafood Processing& WholesalingFish & Other SeafoodSeafood
Beverage Manufacturing& Wholesaling
Domestic
Export
Other Food Manufacturing& Wholesaling
Food Imports

1
Mapping
Pastoral
1. PASTURE BASED PRODUCTIONThe first section of this report looks at pasture based production
Resource ProductionManufacturing& Wholesaling Markets
Domestic
Export
Pasture
Livestock Meat Processing& Wholesaling
Domestic
Export
Milk Dairy Processing& Wholesaling

2
Mapping
Pastoral
DRIVERS OF INCREASED PASTORAL AGRICULTURE OUTPUTThere are a limited number of drivers of increased output from pastoral agriculture
More pasture based output
Moregrazingland
Increase efficiency of land
More irrigation
Better animal genetics
Improved farm management
New or different species
Key drivers of change in pasture-based land output (model)
More high country
More grassland
Increase efficiency of animals
Better fertiliser utilisation
Better pasture

3
Mapping
Pastoral
POTENTIAL FOR TRANSFORMATIVE CHANGEPastoral agriculture in New Zealand will struggle to increase output significantly over the next decadePotential for transformative change in pasture-based land output (model)
1. All commercial agriculture in New Zealand is based on non-indigenous species; therefore limiting introduction of non-indigenous species limits innovation
Objective Key Driver
Potential for transformative
change Key Issues
None
Low
Medium
Low
Better pasture Low – Consumer opposition to genetic modification
Medium
Medium
New or different species
Low – Failure of numerous past attempts (e.g. goats)– Increased biosecurity regulation limiting new species
introduction1
More grassland
– Very marginal land created by historic subsidies– Increasing environmental concerns
– Competition with forestry– Increase in lifestyle blocks (+37,600ha/year)
– Public opposition to new schemes– Cost of systems/new schemes– Market pricing of water
– Groundwater pollution– Cost
– Dispersed and fragmented population– Traditional attitudes– Gap between leaders and average
– Consumer opposition to genetic modification
Better fertiliser utilisation
Improved farm management
Increased efficiency of animals
Better animal genetics
More grazing land
More high country
Increase efficiency of land
More irrigation

4
Mapping
Pastoral
RECOMMENDATIONSBased on our research, we make the following recommendations to the taskforce
Objective Issue Recommendations
1. Control spread of lifestyle blocks through zoning rather than through minimum block size2. Research actual lifestyle land required per household (i.e. are we forcing them to take 20ha when
they really want 2ha)3. Encourage systems to optimise production on lifestyle blocks (e.g. leasing by commercial farmers)
1. Review effect of environmental legislation on land use
1. Measure amount of water used by irrigation2. Expand area served by irrigation schemes3. Introduce market pricing to water to encourage efficient use of water resources4. Encourage conversion of border dike irrigation to centre pivot irrigation
1. Fund research into efficiency of fertiliser utilisation
Better pasture 1. Continue to fund pasture research2. Ensure free access to overseas species/germ plasm
1. Ensure we have the best initial farm management training program2. Explore farm extension program to disseminate best practice
1. Understand regulatory barriers to introduction of new genetic material2. Continue to fund agricultural research
New or different species
1. Government program to evaluate potential new livestock species2. Review Hazardous Substances and New Organisms Act to enable free and open access to non-
indigenous species required for continued innovation 3. Explore role of government in infant industry support
Decreasing amount of land being farmed
Better fertiliser utilisation
Improved farm management
Increased efficiency of animals
Better animal genetics
More grazing land
Massive growth of lifestyle blocks
Increase efficiency of land
More irrigation
Recommendations to Food and Beverage Taskforce to increase pasture-based land output

5
Mapping
Pastoral
8,933
28,250
50,970 $6,098
4.5
39.5
1,7945.2
14,000
48,400 $6,330
217 1.6
2,300 3,240 $317
598 1.84,870 13,470 $1,749
Land Use # of livestock # of farms Employment Turnover
Livestock farming overview by farm type(various)
Beef & Sheep
Sheep
Dairy
Deer
Mixed/Other
Source: various (see detail pages); Coriolis analysis
Discussion Points
• Relative efficiency by sector
Notes
• Definitions and details available on relevant pages
• Sheep and beef data combined in most cases due to statistical softness between different definitions (i.e. primarily sheep, sheep-beef, beef)
52.6
Beef
11,542 49,420 116,080 $14,494
(m) (head; m) (actual) (people) (NZ$; m)
OVERVIEW – LIVESTOCK FARMINGBeef, sheep and dairy farming dominate New Zealand livestock farming
6
Mapping
Pastoral
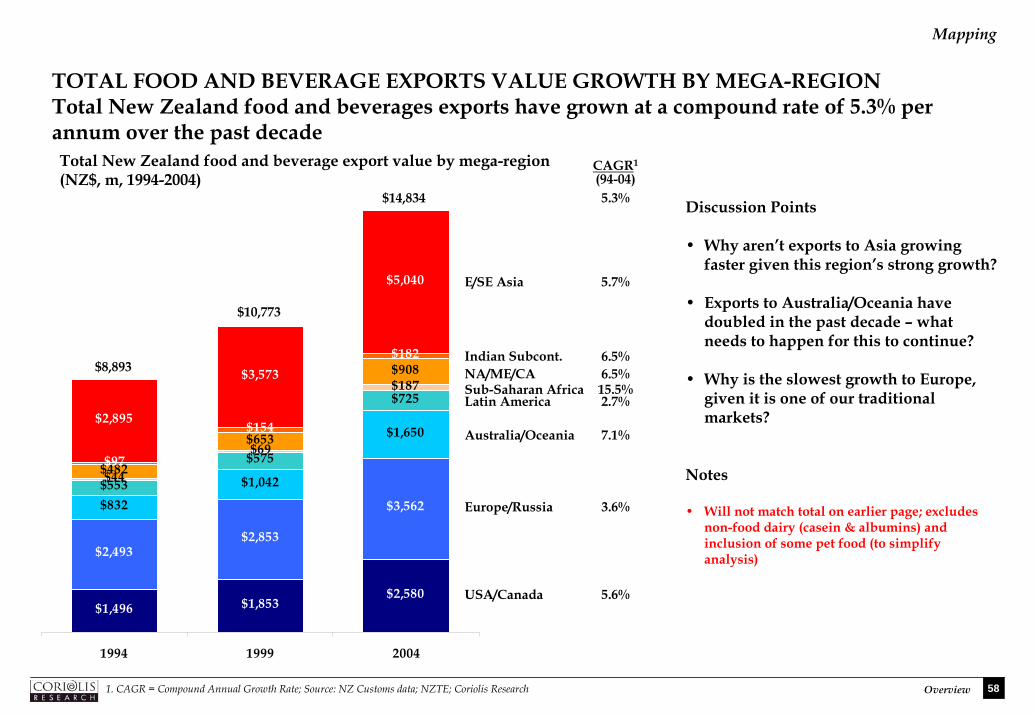
DIRECTIONAL TREND – LIVESTOCK FARMINGOver the medium-to-long term, some sectors of livestock farming are struggling, while others are experiencing good growth
# of livestock
(85-02 (95-02)Land Use
(85-02)
# of Farms(85-02) (95-02)
Employ-ment(85-98
Turnover(98-03)
Beef ▼ ▼ ▲ ▲ ▲ ▲ ▲Sheep ▼ ▼ ▼ ▼ ▲ ▼ ▲Sheep/ Beef - - ▼ ▼ ▼ ▲ ▲Dairy ▲ ▲ ▲ ▼ ▼ ▲ ▲Deer ▲ ▲ ▲ ▲ ▲ ▲ ▲Pigs ▼ ▼ ▲ ▼ ▼ ▲ ▲Poultry ▲ ▲ ▲ ▼ ▼ ▲ ▲Other ▼ ▼ ▼ ▲ ▲ ▲ ▲
Directional trends in livestock farming(growth or decline)
Discussion Points
• Long-term prognosis for sheep?
• Ultimate potential of deer?
• Consolidation in dairy
Notes
• Differing time periods (e.g. turnover 5 years vs. land use 17 years)
• Use with caution; should be treated as directional; different surveys; different methods; different definitions
• Details available on specific pages
Source: various (see detail pages); Coriolis analysis

7
Mapping
Pastoral
Grassland 8,255 53%Tussock &
danthonia 3,287 21%
Plantation forest 1,879 12%
Arable crop 424 3%
Other land 383 2%
Horticulture 110 1%
Native bush 1,302
8%
Total New Zealand land use(sqkm, thousands, 2002)
Farm 156 58%
National parks & reserves
80 30%
Other 32
12%
LAND USEPastoral land accounts for 74% of total farm land in New Zealand
Total = 268,000 sqkm
Total = 15,640,000 hectares
Total New Zealand farm land use(hectares, thousands, 2002)
Pastoral74%
Source: SNZ Agricultural Production survey; MAF; Coriolis analysis

8
Mapping
Pastoral
CHANGE IN FARM LAND USE – PASTORALThe total amount of pastoral land in use in New Zealand has shown significant decline in the past 20 years
3,854 3,770
2,329
613
868
1,429
1,230
1,794
44
217
558
103
464
329
1985 2002
Sheep
Sheep-Beef
Beef
Dairy
DeerMixed livestockLivestock nec
9,347
8,255
-84
-1,716
+560
+565
+172-455-135
AbsoluteChange17 years
-1,092
Note: No data available 1994/1995; definitions driven by more than 50% of farm income for that activity, therefore significant overlap will exist (e.g. beef cattle with some deer)Source: SNZ Agricultural Production survey; MAF; Coriolis analysis
Change in pastoral land use(hectares, thousands, 1985-2002)
2,932 2,613
960
201
374
307
268
166
1985 2002
Sheep
Sheep-BeefBeefOther livestock
-319
-759-67-102
4,534
3,287
AbsoluteChange17 years
-1,247
Grassland Tussock & Danthonia Discussion Points
• Sustainable long-run land use by agriculture
Notes
• Statistical softness in Sheep-Beef / Beef split; should be thought of as one category

9
Mapping
Pastoral
CHANGE IN FARM LAND USE – BY ISLANDThis decline in pastoral land has been driven by less grassland in the North Island and less tussock in the South Island
Source: SNZ Agricultural Production survey; MAF; Coriolis analysis
Change in pastoral land use by type and location(hectares, thousands, 1985-2002)
6,038
4,982
245
144
1985 2002
North Island South Island Discussion Points
• What expectation of further declines in grazing on high country land in the South Island?
• What is driving the decline of North Island grassland? Forestry (+800) cannot account for all of the decline
3,309 3,274
4,289
3,143
1985 2002
6,283
5,126
Grassland
Tussock
7,598
6,417
-1,056
-101
AbsoluteChange20 years
-1,157
-35
--1,146
AbsoluteChange20 years
-1,181

10
Mapping
Pastoral
LAND IRRIGATEDThe amount of land irrigated has increased, primarily pasture land for grazing and in the South Island
Source: SNZ Agricultural Production survey; MAF; Coriolis analysis
Discussion Points
• Ultimate long-run sustainable level of irrigation in the South Island
• Compatibility of high-capital irrigation with low-cost producer status
Notes
• Land irrigated in year; land under irrigation system is larger (469,733ha)
Land irrigated by location and type(hectares, thousands, 1985-2002)
227.2
330.2
29.4
54.0
1985 2002
NorthIsland
SouthIsland
256.6
384.2
91.9 98.2
164.7
286.0
1985 2002
Pasture
Horticulture& Crops
256.6
384.2
+6.3
+121.3
AbsoluteChange17 years
+127.5
+103.0
+24.6
AbsoluteChange17 years
+127.5
CAGR(85-02)
2.4%

11
Mapping
Pastoral
Sheep farming 13,000
26%
Beef farming 13,000
26%
Dairy farming 14,000
28%
Sheep/beef 2,000 / 4%
Grain/beef/sheep 250 / 1%
Number of pastoral farms by type(farms, actual, 2002)
Poultry 380 / 1%Pigs 360 / 1%
Mixed livestock 1,100 / 2%Livestock nec 730 / 1%
NUMBER OF LIVESTOCK FARMS BY TYPE Of the 49,420 livestock farms, most are beef and lamb farms (57%) and dairy cattle farms (28%); all other livestock farms make up only 15% of the total
Beef & lamb28,25057%
Deer 2,300 / 5%
Total = 49,420 pasture-based farms2
1. Includes some grain growing (which is an arable crop) but inseparable at source; 2. 47,120 food-based pasture farms (excluding horses)Source: SNZ Agricultural Statistics 2002; Coriolis analysis
1
Horses 2,300 / 5%

12
Mapping
Pastoral
19,696
9,11513,000
1,872
750
250
5,853
6,871 2,000
9,493
9,591 13,000
15,978
16,522 14,000
857
2,070 2,300
410
466 380
538
866 360
3,043
3,7031,100
470
100
730
1,432
1,0112,300
1985 1995 2002
Number of livestock farms by type(farms, actual, 1985-2002)
Sheep
Grain/beef/sheepSheep/beef
Beef
Dairy
DeerPoultryPigLivestock necMixed livestock
59,642
51,06549,420
-6,696
-1,622-3,853
+3,507
-1,978
+1,443-178-30
-1,943+260
-10,222
Absolute
CHANGE IN NUMBER OF FARMS BY TYPE - LIVESTOCKThe total number of livestock farms in New Zealand is falling
Change
+3,885
-500-4,871
+3,409
-2,522
+230-508-86
-2,603+630
-1,64517 years 10 years
Source: SNZ Agricultural Production survey; MAF; Coriolis analysis
Discussion Points
• Relative impact of economies of scale by farm type
Notes
• Statistical softness in Sheep-Beef / Beef split; should be thought of as one category
Horses +868 +1,289

13
Mapping
Pastoral
4,58
7
4,02
3
3,64
5
5,61
2 6,31
5
9,03
4
10,4
44
9,10
3
4,20
4
2,93
4
3,91
3
4,17
3 4,98
6
3,65
0
6,18
7
8,69
3
7,25
7
3,80
1
2,61
9
4,89
9
Under 5 5-9 10-19 20-39 40-59 60-99 100-199 200-399 400-799 800+
Note: total does not add exactly to number of farms given previously due to rounding at SNZ source (11,425 vs. 11,324)Source: SNZ Agricultural Production survey; MAF; Coriolis analysis
Discussion Points
• Relative impact of economies of scale by farm type
• How much of this is the effect of the growth of lifestyle blocks? retirement of high country land?
NUMBER OF FARMS BY SIZE - LIVESTOCKThere has been an almost across-the-board decline in the number of livestock farms, except for the very small Number of livestock farms by size group(#of farms, by size of farm, hectares, 1985-2002)
ProbablyLifestyle
1985
2002

14
Mapping
Pastoral
LIVESTOCK NUMBERSWhile sheep number are down strongly and beef numbers are flat to down, dairy cattle and deer numbers are up
1985 1995 2002
Sheep
Number of livestock by type(animals, millions, 1985-2002)
4.6 5.24.5
3.3
4.1 5.2
0.3
1.21.6
0.5
0.40.3
0.4
0.30.2
0.5
0.91.3
0.02
1985 1995 2002
Dairy cattle
Deer
PigsGoatsBroiler chicken1Other livestock2
+1.9
+1.3
-0.1-0.3+0.8n/a
AbsoluteChange
+1.1
+0.5
-0.1-0.1+0.4n/a
17 years 10 years+3.5 +1.1
Beef cattle -0.1
9.6
12.0
13.1
Other Livestock
-0.7
39.5
48.8
67.9
-28.3
-9.3
Discussion Points
• Sheep-to-dairy conversions• Sheep-to-forestry conversions
• Decline in beef cattle numbers
1. Chicken data in 100 millions of birds; 2. Other livestock includes lamas, ostrich, emu, alpaca and others; data not collected in previous surveySource: SNZ Agricultural Production survey; MAF; Coriolis analysis

15
Mapping
Pastoral
3.7 3.30.9 1.1
0.3 0.2
0.2
3.0 3.8
1.3
0.2 0.6
1.0
1985 2002 1985 2002
Number of livestock by type by island(animals, millions, 1985-2002)
Dairy cattleDeer
Pigs
Sheep
Beef cattle
34.0
0.1
42.5 Discussion Points
• Sheep-to-dairy conversions in the South Island
• Sheep-to-forestry conversions in the North Island
Notes
• Excludes goats and other livestock
• Livestock inventory at a given point-in-time, not total in year (e.g. 22 week hog lifecycle)
26.424.8
0.30.2
North Island South Island
32.5
35.3
18.4
21.1
-0.1
+0.8
+0.4
-16.2
Absolute
LIVESTOCK NUMBERS BY ISLANDWhile sheep numbers have fallen more in the North Island, other livestock are growing faster in the South Island
1. Chicken data in 100 millions of birds; 2. Other livestock includes lamas, ostrich, emu, alpaca and others; data not collected in previous surveySource: SNZ Agricultural Production survey; MAF; Coriolis analysis
Change17 years
-16.9
-0.4 0.0+0.9+1.0
-9.2
AbsoluteChange17 years
-11.4
+0.2+2.1
+0.7

16
Mapping
Pastoral
THREE MODELS FOR NEW LIVESTOCK - DEER, PIGS & GOATSExamples of three different models of livestock species development can be found
Number of livestock by type(animals, thousands, 1979-2004)
Discussion Points
• Role of government in new species development
• Ultimate potential of deer?
• Potential for new species: • Water buffalo• Milking sheep• Ostrich/Emu• Llama/Alpaca• Yak/Bison• Other?
• New Zealand is good at sheep; New Zealand is good at dairy; what else is required for success at milking sheep?
Notes
• Goats number is correct
• Data is a point-in-time inventory
Source: SNZ Agricultural Production survey; MAF SONZAF; Coriolis estimates and analysis
-
200
400
600
800
1,000
1,200
1,400
1,600
1,800
1979
1981
1983
1985
1987
1989
1991
1993
1995
1997
1999
2001
2003
Deer(Growth)
Pigs(Decline)
Goats(Fad)

17
Mapping
Pastoral
LIVESTOCK FARM EMPLOYMENTSheep, beef and dairy farms account for 86% of livestock farm employment
Number of people employed on livestock farms by type(people, actual, 1998)
Discussion Points
• Relative high level of employment on dairy farms
Notes
• Total people not FTE
• Farm employment survey conducted only twice in last 18 years (1998, 2004)
• Uses 1998 data as this incorporated working proprietors (not measured in 2004 survey)
• May not capture total pool of seasonal labour
• No measure of unpaid working family members (35,000 across livestock & horticulture in 1985 survey)
1. Includes full-time and part-time; includes working proprietorsSource: SNZ Agriculture Business Demographics survey (unpublished); Coriolis analysis
Sheep 22,910
20%
Grain/beef/sheep 1,900
2%
Sheep/beef 12,460
11%
Beef 13,700
12%
Dairy 48,400
41%
Deer / 3,240 / 3%Poultry / 2,150 / 2%
Pigs / 1,370 / 1%Beekeeping / 830 / 1%
Mixed livestock / 3,320 / 3%
Livestock nec
4,0603%
Horses1,7401%
Total = 116,080 employees1

18
Mapping
Pastoral
CHANGE IN LIVESTOCK FARM EMPLOYMENTOverall employment in livestock agriculture is up
28,10122,910
10,82214,360
11,005 13,700
31,495
48,400
1,067
3,240
723
1,370
1,413
2,150
5,684
8,210
1,371
1,740
1985 1998
Sheep -5,191 -1.6%
Sheep/Beef +3,538 2.2%
Beef +2,695 1.7%
Dairy +16,905
Deer +2,173Pigs +647Poultry +737Mixed livestock +2,526Horses +369
AbsoluteChange in number of people employed on livestock farms by type(people, actual, 1985-1998)
Discussion Points
• Vast bulk of employment growth coming from dairy farms
Notes
• Total people not FTE
• Farm employment survey conducted only twice in last 18 years (1998, 2004)
• Uses 1998 data as this incorporated working proprietors (not measured in 2004 survey)
• May not capture total pool of seasonal labour
• No measure of unpaid working family members (35,000 across livestock & horticulture in 1985 survey)
3.4%
8.9%3.3%3.3%2.9%1.9%
Change(85-98)
CAGR(85-98)
91,681
116,080
Net+1,042
Source: SNZ Agriculture Business Demographics survey (unpublished); Coriolis analysis

19
Mapping
Pastoral
$1,838 $1,753 $2,033 $2,533 $2,835 $2,565$173 $183 $218
$270$330 $318$1,080 $1,178
$1,436$1,877
$2,233$2,056
$801 $847$1,001
$1,196
$1,388$1,198$3,915 $4,080
$4,829
$6,789
$7,898
$6,330
$226 $227
$299
$339
$404
$317
$191 $207
$198
$184
$250
$234
$152 $149
$154
$168
$203
$194
$242 $245
$295
$372
$430
$547
$325 $355
$446
$499
$594
$549
$95 $135
$184
$208
$239
$186
1998 1999 2000 2001 2002 2003
Total farm turnover by farm type(dollars, millions, 1998-2003)
FARM TURNOVER GROWTH - LIVESTOCKLivestock farm turnover showed strong growth in the last five years
Sheep Farming
Grain/Sheep/Beef
Sheep/Beef
Beef
Dairy
Deer
Horses
6.9%
12.9%
13.7%
8.4%
10.1%
7.0%
CAGR98-03
14.4%
Source: SNZ Annual Enterprise Survey; Coriolis analysis
Discussion Points
• Has the cycle turned? If so, are we heading for a hard landing or soft?
• How much is sustainable? How much is cyclical or currency? How much is one off events (e.g. BSE)?
Notes
• AES 2004 data not yet available
• No comparable data available prior to 1998
• Methodology defines farm by primary income source
• Actual dollars; not inflation adjusted
9.9%
$9,359
$14,494
Poultry 4.1%Pigs 5.0%Mixed livestock 17.7%Livestock nec 11.1%
$9,038
$11,093
$14,435
$16,804

20
Mapping
Pastoral
1. PASTORAL BASED PRODUCTION - MEATMeat is the first main product of pasture land
Resource ProductionManufacturing& Wholesaling Markets
Pasture
Livestock Meat Processing& Wholesaling
Domestic
Export

21
Mapping
Pastoral
SWOT ANALYSIS – MEAT INDUSTRYThe New Zealand meat industry is not currently configured for the future
Strengths Weaknesses
– Natural environment highly conducive to pastoral agriculture– Low cost, efficient production of grazing animals– Very low cost sheep and lamb inputs– Low cost energy inputs– Low cost dairy cull cows as an offshoot of a successful dairy
industry– Low cost cattle inputs– Disease free status– Potential for year round production
– Significant dairy cow cull component not bred for meat quality– Significant sheep and lamb component with declining global
consumption– Self-destructive behaviour and commodity mindset of some
industry participants bringing down value of what should be a high end premium product
– Not a low cost grain producer; cattle not grain fed as preferred by premium customers in major markets
– No competency at vertically integrated intensive farming systems
Opportunities Threats
– Continued income and consumption growth in Asia– Ongoing global growth of foodservice– Move to healthier/leaner meats– Integration with Australia
– Consolidation of global meat processors– Increasing lamb production in China– Latin American producers improving quality and systems– Intensively farmed meats (poultry and pig) with falling real costs
per kg– Ongoing development of vertically-integrated intensive farming
systems in beef– Death of customer base (older consumers in the UK eat lamb;
younger consumers do not)– BSE and other health issues
SWOT analysis of New Zealand in global meat

22
Mapping
Pastoral
23,833
411$1,678
4,654
107
$564
1,350
24
$213
2,670
686
$1,692
$201528
33
$192812
53
155
Slaughter Production Exports
OVERVIEW – MEAT PRODUCTIONWhile the New Zealand meat industry is primarily focused on beef and lamb, the importance of other species should not be underestimated Meat processing overview by species(various)
Offal
Lamb
Calves
Deer
Mutton
1. Slaughter does not include 130m chickens to preserve scale; 2. Other exports: poultry $8m; pork $0m; other $28m (includes dried)Source: various (see detail pages); Coriolis analysis
33,8471
Beef
1,469 $4,576
(animal; m) (kg; m) (NZ$; m)
PoultryPork
130,000$362
146
24,350
132905
49223
64
1,640
23 2,470
Enterprises Employees Enterprises Employees
MeatProcessing
PoultryPoultry &Smallgoods
Bacon, Ham& Smallgoods
233 28,460 181 1,128
Meat processing industry structure(various)
Manufacturing Wholesaling

23
Mapping
Pastoral
248.3 242.0256.8
1996 1999 2004
Adult cattle slaughtered(#, thousands)
Total production(kg, m)
Meat per animal(kg)
1.1%
CAGR
BEEF – PRODUCTIVITY INDICATORSThe underlying productivity of New Zealand beef production – in terms of meat per animal – is not changing rapidlyKey beef productivity indicators (1996-2004)
(96-04)
0.4%
CAGR(96-04)
1.6%
CAGR(96-04)
2,440
2,225
2,670
1996 1999 2004
605.7
538.5
685.6
1996 1999 2004
Note: Does not include veal data; meat per animal is implied carcass weight; Source: MAF; SONZAF; SNZ; Coriolis analysis

24
Mapping
Pastoral
LOW BEEF YIELDS PER ANIMAL VS. COMPETITORSNew Zealand gets very low beef yields per animal versus other major producers
-
50
100
150
200
250
300
350
1961
1964
1967
1970
1973
1976
1979
1982
1985
1988
1991
1994
1997
2000
2003
Beef and veal meat production per animal(kilograms; 1961-2004)
Source: MAF; USDA; FAO; Coriolis analysis
New ZealandBelarus
Argentina
AustraliaUruguaySpain
GermanyIreland
United StatesDiscussion Points
• Why did yield growth plateau in the early 1990’s?
• United States gets twice as much meat per animal; why? management, breeding or grain-feeding?
• Long term prognosis?
• At least we beat Belarus (who are a larger beef exporter than NZ)
Notes
• Includes beef and veal data at source; veal represents 3.4% of NZ beef & veal production
CAGR(61-04)
1.2%n/a
0.0%
1.0%0.1%1.4%
1.3%0.7%
1.0%

25
Mapping
Pastoral
375.5401.0 411.3
1996 1999 2004
15.215.7
17.3
1996 1999 2004
Lambs slaughtered(#, thousands)
Meat per animal(kg)
-0.5%
CAGR
LAMB – PRODUCTIVITY INDICATORSWhile lamb numbers are in long-term decline, meat per animal is showing a reasonable increase, leading to increasing productionKey lamb productivity indicators (1996-2004)
Total production(kg, m)
(96-04) 1.6%
CAGR(96-04)
1.1%
CAGR(96-04)
24,72025,516
23,833
1996 1999 2004
Note: Does not include mutton data; Source: MAF; SONZAF; SNZ; Coriolis analysis

26
Mapping
Pastoral
LOW MEAT PER ANIMAL YIELDS VS. COMPETITORSNew Zealand gets very low lamb meat yields per animal relative to other comparable lamb producersLamb and mutton meat production per animal(kilograms; 1961-2004)
Source: MAF; USDA; FAO; Coriolis analysis
New ZealandIrelandAustraliaUK
United StatesDiscussion Points
• Why? Management, breeding or grain-feeding?
• Clearly this is only one factor in overall competitiveness; where do we excel?
• New Zealand CAGR was 1.0% in the recent period (1988-2004); can we continue this upward trend? 20kg/head by 2020? (i.e. where Australia is today)
Notes
• Includes lamb and mutton
0
5
10
15
20
25
30
1961
1964
1967
1970
1973
1976
1979
1982
1985
1988
1991
1994
1997
2000
2003
0.2%-0.7%0.3%0.1%
0.9%
CAGR(61-04)

27
Mapping
Pastoral
INDUSTRY STRUCTURE – MEAT PROCESSINGMeat processing is still primarily a New Zealand owned sector, but with growing international activity
– Built on low cost inputs of grass-fed livestock
– New Zealand is a low cost producer of grass-fed lamb and beef as a result of its efficient livestock farmers
– New Zealand is not a low cost producer of grain, hence is not a low cost producer of chicken, pork or other grain-based meats
– Domestic poultry industry a product of phyto-sanitary regulations (i.e. no imports)
– Meat processing is comprised of three segments with no operational or ownership overlap
– Meat processing (PPCS/Richmond, Alliance, Talleys/AFFCO, ANZCO)
– Poultry processing (Heinz/Tegel, Inghams)
– Bacon, ham and smallgoods processing (Huttons/Kiwi, others)
– Limited international ownership in the industry to date
– International ownership of poultry (Inghams, Tegel/Heinz)
– No trans-Tasman ownership or consolidation (other than Inghams)
– Strong Japanese shareholding in ANZCO (75%); UK ownership of Bernard Matthews
– No significant investment by New Zealand-based companies in international processing operations (other than AFFCO’s failed China venture)

28
Mapping
Pastoral
KEY COMPANIES – MEAT PROCESSINGNew Zealand has a strong base of locally owned meat processors
CompanyTurnover
(NZ$; m; 2004) Employees Ownership Activities
PPCS/Richmond $2,164($942+$1,222)
8,000(4,000+4,000)
New ZealandCooperative
New ZealandCooperative
New ZealandPublic Listed
Japan/NZPublic/Private
Tegel Foods $427 2,250 United StatesPublic Listed
– Poultry processing– Division of Heinz Watties; for sale
Huttons/Kiwi/Top Hat $127 ? Rank Group – Bacon, ham and smallgoods– Division of Mainland Products (former subsidiary of
Fonterra)
Wilson Foods/Wilson Hellaby
? 150 New Zealand Private
– Produces smallgood; owns Auckland Meat Processors
Inghams New Zealand $106 950 AustraliaPrivate
– Division of Ingham’s Enterprises Pty.
United KingdomPublic Listed
New ZealandPublic Unlisted
– Beef, lamb and venison processing– Accounts for 37% sheep/35% beef/54% venison exports
Alliance Group $1,147 5,700 – Beef and lamb processing
AFFCO Holdings $891 2,800 – Beef and lamb processing– 40% owned by Talley’s
ANZCO Foods $841 2,000 – Beef and lamb processing– Owned by Itoham Japan (48.3%), Nippon Suisan
(25.2%) & local management (26.5%)
Bernard Matthews New Zealand
$167 500 – Lamb and beef processing– Owned by Bernard Matthews UK
Blue Sky Meats $96 375 – Processes lamb, sheep, bobby calves and goats
Key companies in the meat manufacturing and wholesaling sector
Source: Management magazine Top 200; NZ Companies Office returns; press reports; interviews; Coriolis analysis

29
Mapping
Pastoral
MARKET SHARE – MEAT PROCESSINGFour companies account for about 78% of total New Zealand meat processing turnover
New Zealand meat processing turnover market share(dollars, millions, % of sales, 2004)
Discussion Points
• Who is driving product innovation?
• What is stopping trans-Tasman (or international) integration?
Notes
• Market share represents New Zealand wholesale domestic sales and export sales (at border); does not include international sales or margins
Source: SNZ AES, company annual reports; various published articles; Coriolis analysis and estimates
Richmond $1,222
19%
PPCS $942 14%
Alliance $1,147
18%
Affco $898 14%
ANZCO $841 13%
Other $1,495
22%
Total = $6,546 million

30
Mapping
Pastoral
ACQUISITIONS – MEAT PROCESSINGThere have been a number of significant deals in meat processing recently
Acquiror Acquiree Date Notes
Rank Group Huttons/Kiwi/Top Hat Aug 2005 Rank Group acquired Huttons/Kiwi as part of an asset swap with Fonterra
PPCS Richmond July 2004 Acquired 63% in April 2003; acquired remainder July 2004Delisted from NZX
Talleys AFFCO 2001-2003 Acquired 40% of AFFCO in stages
Rangatira Ltd Heller Tasty June 2003 Christchurch ham, bacon smallgoods company
Westmeat NZ Ltd Bells Continental Smallgoods
Jan 2002 Name changed to: Luscutto Continental Smallgoods
Mainland Products
Food Solutions (Huttons/Kiwi/Top Hat)
Dec 1998 Brierley’s sold Food Solutions (itself a merger of Top Hat bacon and Huttons Kiwi) to Mainland
Source: company annual reports; various published articles; Coriolis analysis

31
Mapping
Pastoral
MEAT PROCESSING TURNOVER GROWTHMeat processing turnover is growing modestly
Meat processing turnover(dollars, millions, 1996-2003)
CAGR(96-03)
3.1%
Source: SNZ AES, company annual reports; various published articles; Coriolis analysis and estimates
Discussion Points
• Effect of exchange rates
Notes
• No data available prior to 1996 (AES); 2004 data not yet available
$5.3$5.5
$6.5
1996 1999 2003

32
Mapping
Pastoral
163 153 146
2328
23
7069
64
1994 1999 2003
Discussion Points
• Is consolidation taking place or are there fewer plants?
Source: SNZ Business Demographics survey; Coriolis analysis
256250
233
Absolute
MEAT MANUFACTURING ENTERPRISESThe number of meat manufacturing enterprises is declining
Meat manufacturing enterprises by sub-sector(enterprises, actual, 1994-2003)
-17
-
-6
Change(94-03)
-23 -0.9%
-0.9%
CAGR
0.0%
(94-03)
-1.1%
Bacon, ham & smallgoods
Poultry processing
Meat processing

33
Mapping
Pastoral
23,41021,550
24,350
2,010
2,230
2,4701,560
2,050
1,640
1994 1999 2003
Source: SNZ Business Demographics survey; Coriolis analysis
26,98025,830
28,460
MEAT MANUFACTURING EMPLOYMENTEmployment in meat manufacturing is growing slightly
+960
+460
+80
AbsoluteChange(94-03)
+1,480 0.5%
0.5%
2.1%
CAGR(94-03)
0.4%
Bacon, ham & smallgoods
Poultry processing
Meat processing
Meat manufacturing employees by sector(people, actual, 1994-2003)
Discussion Points
• Fewer enterprises (prior page) but slightly more employees
Notes
• Includes working proprietors
• Total employees not FTE

34
Mapping
Pastoral
1,982 2,042 2,219 2,670836 814 1,290 1,350112 409 422 528843 822 765 812
10,756
5,796 5,136 4,654
1985 1994 1999 2004
Discussion Points
• Long-run implications for employment
• Will lamb and sheep numbers continue to decline?
Notes
• Excludes chicken numbers (130m) – we now have 5x chicken than sheep
Note does not include other livestock includes goats, lamas, ostrich, emu, alpaca and othersSource: SNZ Agricultural Production survey; MAF; Coriolis estimates and analysis
CAGR
LIVESTOCK SLAUGHTERThe total number of animals slaughtered is down, driven by a decline in sheep and lamb; however beef, veal and venison are showing growthNumber of livestock slaughtered by species(animals, 000, 1985-2004)
85-04 94-04-2.5% -0.6%
Mutton -4.3% -2.2%
Lamb
Veal 2.6% 5.2%Beef 1.6% 2.7%
Venison 8.5% 2.6%Pork -0.2% -0.1%
54,492
36,05734,304 33,847
39,963
26,174 24,472 23,833 -2.7% -0.9%

35
Mapping
Pastoral
227125 117 107
501
398 400 411
14
14 23 24
472
523 538
686
22 23
3347
49 48
5350
78102
155
6
1985 1994 1999 2004
Meat production by species(tonnes, thousands, 1985-2004)
Discussion Points
• Strongest growth in poultry
• Increasing role of dairy cull in beef industry (e.g. veal growth)
Note does not include other livestock includes goats, lamas, ostrich, emu, alpaca and others; data not collected in previous surveySource: SNZ Agricultural Production survey; MAF; Coriolis analysis
CAGR
MEAT PRODUCTIONTotal meat production is growing
85-04 94-040.6% 2.0%
Mutton -3.9% -1.5%
Lamb -1.0% 0.3%
Veal 2.8% 5.5%
Beef 2.0% 2.8%
Venison 9.4% 4.1%Pork 0.6% 0.8%
Poultry 6.2% 7.1%1,318
1,2091,251
1,469

36
Mapping
Pastoral
139 135 132
1842 49
1994 1999 2003
Enterprises
MEAT WHOLESALINGWhile the number of meat wholesalers is increasing, employment is flat
Source: SNZ Business Demographics survey; Coriolis analysis
157
177 181 1.4%
CAGR
Meat wholesaling enterprises by sub-sector(enterprises, actual, 1994-2003)
(94-03)
Poultry & smallgoods
Meatproducts
Employees
1,070
795905
59
234
223
1994 1999 2003
1,129
1,029
1,128
10.5%
-0.5%
0.0%
CAGR(94-03)
14.2%
-1.7%
Discussion Points
• Structural change in poultry and smallgoods wholesaling?
Notes
• Includes working proprietors
• Total employees not FTE

37
Mapping
Pastoral
$15$8
$20
$12
$8
$10
$18 $42
$73
$5
$24
$30
1994 1999 2004
Meat imports by segment(dollars, millions, 1994-2004)
$49
$82
$134Discussion Points
• Why are pork imports increasing?
Notes
• Classifications:• Beef (HS0201-0202) • Pork (HS0203)• Other fresh/frozen meat (remainder of
HS02)• Processed canned/preserved meat
(HS1601-1602)
Beef
Pork
3.0%
15.3%
CAGR(94-04)
10.5%
MEAT IMPORTS BY SEGMENT Meat imports are growing strongly, off a low base, through the growth of pork and processed meats
Other fresh/frozen meat -1.6%
Source: WTA; SNZ; Coriolis analysis
+$5
+$56
+$84
-$2
AbsoluteChange(94-04)
Processed meat 20.0% +$25

38
Mapping
Pastoral
Supermarkets $1,070
53%
Butchers $470 24%
Other retail $25 1%
Foodservice $435 22%
Domestic meat wholesale purchases by segment(dollars, millions, 2004)
Discussion Points
• Relative strength of supermarkets
Notes
• Includes fresh beef, lamb, pork, chicken and other fresh meats
• Includes bacon, ham and small goods
• Does not include sales to manufacturing and secondary use (e.g. canned soup)
Total = $2,000
MEAT - DOMESTIC MARKETDomestic retailers and foodservice purchased about $1.4 billion in meat last year
Source: SNZ HHES; SNZ RTS; interviews; past research; SNZ; Coriolis estimates & analysis

39
Mapping
Pastoral
Meat exports by segment(dollars, millions, 1994-2004)
$111 $142 $213
$1,206 $1,054
$1,692
$111 $307
$564$1,136
$1,242
$1,678
$47$47
$52
$120$149
$192
$100$88
$201
$14$10
$36
1994 1999 2004
Lamb/mutton, frozen
$2,846$3,039
$4,628Discussion Points
• Why is so much meat still exported frozen?
Notes
• Frozen lamb is correct or export statistics are wrong (HS020430-HS020443)
• Revised classifications from earlier document• Meat now includes canned/preserved
meat (HS1601-1602)
Beef, chilled
Lamb/mutton, chilled
Canned/processed meatVenisonOffalOther meat
6.7%
17.7%
1.1%4.8%7.2%9.8%
CAGR(94-04)
5.0%
4.0%
MEAT EXPORTS BY SEGMENT While chilled lamb is growing, too much of our meat is still exported frozen
Beef, frozen 3.4%
Source: WTA; SNZ; Coriolis analysis
+$102
+$454
+$5+$72+$101+$22
+$1,783
+$541
+$486
AbsoluteChange(94-04)

40
Mapping
Pastoral
$960 $1,017$1,381
$1,044$1,233
$1,707$122
$112
$162
$74$52
$100
$4$10
$17
$111$121
$124
$483$447
$1,082
1994 1999 2004
$2,799$2,991
$4,576 5.0%
8.4%
1.1%
CAGR
NEW ZEALAND MEAT EXPORT VALUE BY DESTINATIONThe total value of New Zealand’s meat exports have risen dramatically in the past five years, primarily through increased sales to Asia and EuropeNew Zealand meat export value by destination(NZ$, m, 1994-2004)
(94-04)
14.7%3.0%
5.0%
3.7%
Discussion Points
• What were the drivers of the sales growth in the 99-04 period? How sustainable is this growth?
Notes
• Excludes canned/ preserved meat (HS1601-1602) which accounted for $52m in 2004
Note: Uses HS02 which includes numerous minor meats (e.g. duck, horse, ostrich); Source: NZ Customs data; NZTE; Coriolis Research
USA/Canada
Europe/Russia
OceaniaLatin AmericaSub-Saharan AfricaNA/ME/CA
E/SE Asia
2.9%
+$192m
+$1.58b

41
Mapping
Pastoral
BEEF PRODUCTION VOLUME BY REGIONBeef production is growing faster in New Zealand than in any other region other than Asia; US/Canada production is stagnant and European production is declining Global beef/veal production by super-region (t, m, 1994-2004)
12,111 13,401 12,647
14,810 12,199 12,166
1,825 2,011 2,033537 561 710
12,122 13,664 15,120
2,575 2,751 3,0142,500 2,426 2,5511,913 2,019 2,1424,377
6,6618,052
1994 1999 2004
USA/Canada
Europe/Russia
AustraliaNew Zealand
Latin America
Sub-Saharan Africa
Indian Subcont.NA/ME/CA
E/SE Asia52,77055,694
58,434 1.0%
6.3%
1.1%
0.4%
0.2%
CAGR(94-04)
1.6%
2.2%
2.8%1.1%
-1.9%
Discussion Points
• What is E/SE Asia’s ultimate potential for beef production? What are the limiting factors?
• Why is New Zealand production growing more than twice as fast as Australia’s?
Source: MAF; SONZAF; UN; FAO; Coriolis analysis
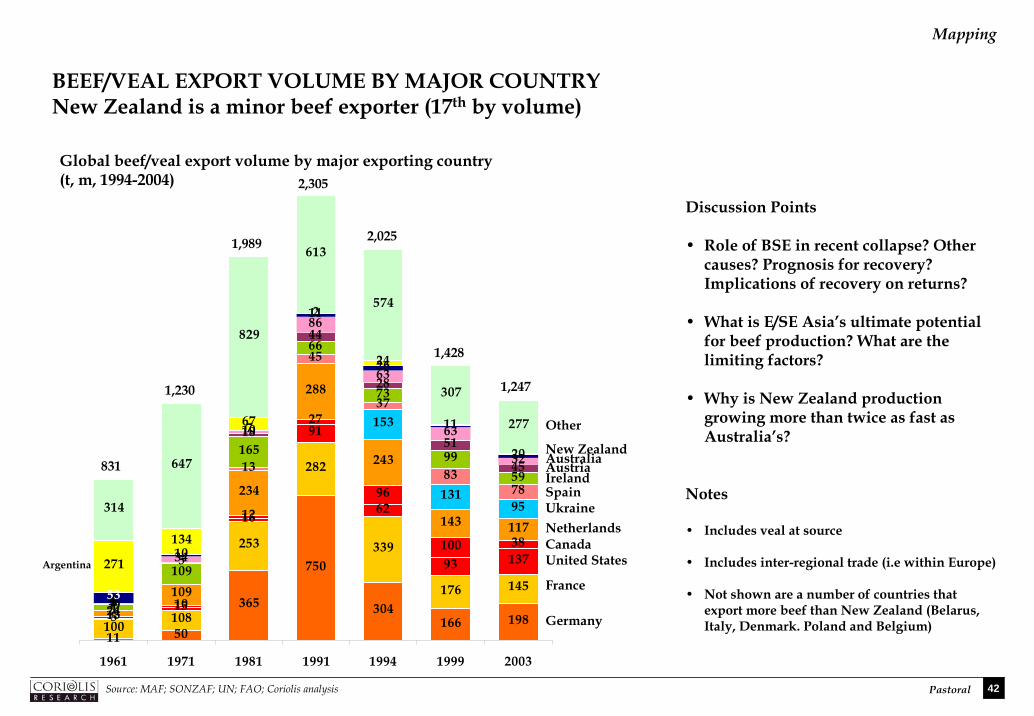
42
Mapping
Pastoral
11 50
365
750
304166 198100
108
253
282
339
176 145
515
16
91
62
93 137
1310
12
27
96
100 38
24109
234
288
243
143 117
153
13195
13
45
37
8378
139
109
165
66
73
9959
0
5
18
44
28
51
45
11
34
10
86
63
63
32
11
10
7
11
26
11
20
271
134
67
2
24
314
647
829
613
574
307
277
53
1961 1971 1981 1991 1994 1999 2003
Global beef/veal export volume by major exporting country(t, m, 1994-2004)
Germany
France
United States
NetherlandsUkraineSpain
AustriaIrelandAustralia831
Discussion Points
• Role of BSE in recent collapse? Other causes? Prognosis for recovery? Implications of recovery on returns?
• What is E/SE Asia’s ultimate potential for beef production? What are the limiting factors?
• Why is New Zealand production growing more than twice as fast as Australia’s?
Notes
• Includes veal at source
• Includes inter-regional trade (i.e within Europe)
• Not shown are a number of countries that export more beef than New Zealand (Belarus, Italy, Denmark. Poland and Belgium)
Source: MAF; SONZAF; UN; FAO; Coriolis analysis
Canada
New Zealand
Argentina
Other
1,230
1,989
2,305
2,025
1,428
1,247
BEEF/VEAL EXPORT VOLUME BY MAJOR COUNTRYNew Zealand is a minor beef exporter (17th by volume)

43
Mapping
Pastoral
$4.38
$3.85
$3.71
$3.47
$3.26
$3.22
$2.99
$2.97
$2.87
$2.77
$2.33
$2.23
$1.99
$1.75
$1.43
$1.36
$1.09
$0.74
$1.69
Discussion Points
• Do customers prefer feedlot beef?
• Why do we freeze high quality “clean green” grass fed beef and sell it so cheaply?
Notes
• Includes veal at source
Source: MAF; SONZAF; UN; FAO; Coriolis analysis
Netherlands
Belgium
France
United States
Denmark
Canada
Germany
Austria
Ireland
Spain
Australia
New Zealand
Italy
Poland
Belarus
Ukraine
Argentina
Uruguay
Other
BEEF/VEAL EXPORT VALUE PER KILO BY MAJOR COUNTRYNew Zealand get significantly less per kilo for its beef
Beef/veal export value per kilogram by select major exporting country(US$ per kilogram, 2004)

44
Mapping
Pastoral
104 101 42
1,5031,256
886
6
6
2
89
95
47
66
25
19
428
100
47
121
119
202
1994 1999 2003
Global beef/veal imports by super-region (t, m, 1994-2003)
USA/Canada
Europe/Russia
OceaniaLatin AmericaSub-Saharan AfricaNA/ME/CAE/SE Asia
2,317
1,701
1,245
-6.7%
5.8%
-9.6%
-21.8%
CAGR
BEEF IMPORT VOLUME BY REGIONGlobal beef/veal imports have collapsed over the past ten years
(94-03)
-12.9%-6.8%-11.3%
-5.7%
Discussion Points
• Why are global beef/veal export volumes collapsing?
• Will the situation turn around or will there be a bigger fight for a smaller pie?
• What proteins are gaining share in Europe?
• Have underlying consumer preferences changed forever?
Source: MAF; SONZAF; UN; FAO; Coriolis analysis

45
Mapping
Pastoral
$864$789
$1,025
$14$46
$25
$52$44
$75
$29$13
$34
$2$12
$27$355$290
$716
1994 1999 2004
New Zealand beef/veal export value by destination(NZ$, m, 1994-2004)
Source: NZ Customs data; NZTE; Coriolis Research
$1,316
$1,194
$1,903 3.8%
7.3%
31.5%
CAGR
NEW ZEALAND BEEF/VEAL EXPORT VALUE BY DESTINATIONWhile the US has traditionally been New Zealand’s key market, growth in beef exports is coming primarily from Asia
(94-04)
1.6%
5.8%
Discussion Points
• What were the drivers of the sales growth in the 99-04 period? How sustainable is this growth?
USA/Canada
Europe/RussiaOceaniaLatin AmericaNA/ME/CA
E/SE Asia
3.8%
1.7%

46
Mapping
Pastoral
BEEF EXPORT VALUE BY FORMWhile chilled beef exports are growing, most of New Zealand’s export beef is still frozen
$1,205$1,052
$1,690
$111
$142
$213
1994 1999 2004
New Zealand beef/veal export value by form (NZ$, m, 1994-2004)
Source: NZ Customs data; NZTE; Coriolis Research
3.8%
3.4%
CAGR(94-04)
Discussion Points
• Why isn’t the move to chilled occurring faster?
• What channel or market segment uses frozen beef?
• Is meat frozen for historical or market-led reasons?
Notes
• Slight variation with earlier summary present at data source
Frozen
Chilled
$1,316
$1,194
$1,903
6.7%

47
Mapping
Pastoral
NEW ZEALAND BEEF/VEAL EXPORT VALUE PER KILO BY DESTINATIONOverall, the export unit value of beef has risen in the last five years
New Zealand beef/veal export value per kg by destination(NZ$, 1994-2004)
Source: NZ Customs data; NZTE; Coriolis Research
Discussion Points
• What caused the rapid growth in value per kg in exports to Europe in frozen and chilled? Is this sustainable?
• Why do we get more for our frozen meat in Europe than in the US/Canada and Asia?
• Why are returns consistently higher in Asia than the US/Canada?
$-
$2.00
$4.00
$6.00
$8.00
$10.00
$-
$2.00
$4.00
$6.00
$8.00
$10.00
USA
/Can
ada
Euro
pe
Oce
ania
Latin
Am
eric
a
NA
/ME/
CA
E/SE
Asi
a
Frozen
Chilled
94 98 04

48
Mapping
Pastoral
151 123 106
1,996 1,757 1,573
648628
561
523517
518
339283
295
462553
590
1,5601,488
1,548
452417 459
923 1,4682,118
1994 1999 2004
USA/Canada
Europe/Russia
Australia
New ZealandLatin America
Sub-Saharan Africa
Indian Subcont.
NA/ME/CA
E/SE Asia
7,052 7,234
7,769 1.0%
8.7%
0.1%
-3.5%
-0.1%
CAGR
LAMB/MUTTON PRODUCTION VOLUME BY REGIONLamb/Mutton production is declining in the developed world and stagnant in the Arabic world, but growing strongly in AsiaGlobal lamb/mutton production by super-region (t, m, 1994-2004)
(94-04)
2.5%
-1.4%-0.1%
-1.4%
-2.4%
Discussion Points
• What is E/SE Asia’s ultimate potential for lamb production? What are the limiting factors?
• Why is New Zealand lamb/mutton production falling?
Source: MAF; SONZAF; UN; FAO; Coriolis analysis

49
Mapping
Pastoral
348427
493
369 357
67
175
243
208 23472
113
204
256 254
1961 1971 1981 1991 2003
Global lamb/mutton exports by select country (t, thousands, 1961-2003)
NewZealand
Australia
Other
487
716
940
0.1%
CAGR
LAMB/MUTTON EXPORT VOLUME BY SELECT COUNTRYThe importance of New Zealand in the world lamb trade is falling
(61-03)1.3%
3.0%
3.0%
Discussion Points
• Why are we losing share to Aust
• Why haven’t we seen New Zealand meat processors buying into Australia to increase their market power?
Notes
• Total world exports do not match totimports at source (under reporting?)
Source: MAF; SONZAF; UN; FAO; Coriolis analysis
834 845 ralia?
al world
71%
60%53%
44% 42%
14%
25%
26%
25% 28%
15% 16%22%
31% 30%
1961 1971 1981 1991 2003
-29%
AbsoluteChange(61-03)
+15%
+14%
Volume % of volume

50
Mapping
Pastoral
35 61 86
428441 413
7054 42
3951 5413
4822
110
9297
1
11
96
91104
1994 1999 2003
Global lamb/mutton imports by super-region (t, m, 1994-2003)
USA/Canada
Europe/Russia
OceaniaLatin AmericaSub-Saharan Africa
NA/ME/CA
E/SE Asia
792
839819 0.4%
0.9%
10.6%
-1.4%
CAGR
LAMB/MUTTON IMPORT VOLUME BY REGIONThe US/Canada has been the key growing importer of lamb
(94-03)
6.2%3.7%-5.6%
-0.4%
Discussion Points
• Given US lamb consumption is declining, at what point will imporstop substituting for domestic production?
• How close is Asia to being a net lamb exporter?
Source: MAF; SONZAF; UN; FAO; Coriolis analysis
Indian Subcont. -ts

51
Mapping
Pastoral
$78$201
$317
$883
$1,043
$1,498$57
$55
$62
$35
$33
$56
$10
$12
$15
$104
$103
$92
$85
$109
$208
1994 1999 2004
New Zealand lamb/mutton export value by destination(NZ$, m, 1994-2004)
$1,252
$1,554
$2,2476.0%
9.4%
-1.2%
CAGR
NEW ZEALAND LAMB/MUTTON EXPORT VALUE BY DESTINATIONThe value of New Zealand lamb exports are up
(94-04)
4.4%
5.4%
15.0%
Discussion Points
• What were the drivers of the almost $700m export sales growth in the 99-04 period? How sustainable is this gr
USA/Canada
Europe/Russia
Sub-Saharan AfricaNA/ME/CA
E/SE Asia
0.8%Oceania4.8%Latin America
Source: NZ Customs data; NZTE; Coriolis Research
owth?$693m

52
Mapping
Pastoral
NEW ZEALAND LAMB/MUTTON EXPORT VALUE PER KILO BY DESTINATIONThe value per kilo of New Zealand lamb exports to the US/Canada and Europe is up dramaticallyNew Zealand lamb/mutton export value per kg by destination(NZ$, 1994-2004)
Discussion Points
• What is driving dramatic per kilo price increases into the US/Canada and Europe?
• Can we encourage other parts of the world – such as Asia - to pay more for their lamb?
Source: NZ Customs data; NZTE; Coriolis Research
$-
$1.00
$2.00
$3.00
$4.00
$5.00
$6.00
$7.00
$8.00
$9.00
USA
/Can
ada
Euro
pe
Oce
ania
Latin
Am
eric
a
Sub-
Saha
ran
Afr
ica
NA
/ME/
CA
E/SE
Asi
a
94 98 04

53
Mapping
Pastoral
GLOBAL PER CAPITA MEAT CONSUMPTIONOn a global basis, pigmeat and chicken consumption appear to be growing at the expense of beef and lamb
-
2
4
6
8
10
12
14
16
1961
1964
1967
1970
1973
1976
1979
1982
1985
1988
1991
1994
1997
2000
2003
Global per capita meat consumption by select species (kg/capita, 1961-2004)
Pigmeat
Chicken
Beef & Veal
Lamb/MuttonTurkeyGoat
Discussion Points
• Intensively farmed vertically integrated animal systems growing at the expense of pasture based production
• Why has beef consumption fallen in the last ten years - a period of rising global incomes?
• Why is global lamb consumption falling while goat consumption is rising?
• Does New Zealand produce the meats of the past not the future?
• What lessons should be drawn from the success of turkey?
1.6%
3.5%
0.2%
-0.6%2.4%1.4%
CAGR(61-04)
Note: excludes numerous minor meats (e.g. duck, horse, camel, ostrich); Source: UN; FAO; Coriolis analysis

54
Mapping
Pastoral
$0.50
$1.00
$1.50
$2.00
$2.50
$3.00
$3.50
$4.00
1961
1964
1967
1970
1973
1976
1979
1982
1985
1988
1991
1994
1997
2000
2003
Inflation adjusted world price for major meats(US$/kg., FOB, inflation adjusted; indexed to 1982 dollars; 1961-2003)
Pigmeat
Beef & Veal
Lamb/Mutton
Turkey
Chicken
Discussion Points
• Lamb is the only major meat whose price has actually risen over the past forty years
• In 1961 chicken was 33% more than lamb; today it is 72% cheaper
• On average the price of chicken has fallen 3% per year for the past four decades
• Threat of vertical integration accelerating in beef (cf Smithfield)
Notes
• All values are inflation adjusted US dollars indexed to 1982 using the US CPI
• Represents value of all world trade (i.e. including intra-EU)
-1.4%
-0.4%
0.6%
-2.8%
-3.0%
CAGR
INFLATION-ADJUSTED PRICE OF MEATThis appears to be directly related to the relative change in price
(61-03)
Source: FAO; BLS; Coriolis analysis

55
Mapping
Pastoral
1. PASTURE BASED PRODUCTION - DAIRYThe second key output of pasture land is milk for the dairy industry
Resource ProductionManufacturing& Wholesaling Markets
Domestic
Export
Pasture
Livestock Meat Processing& Wholesaling
Domestic
Export
Milk Dairy Processing& Wholesaling

56
Mapping
Pastoral
SWOT ANALYSIS – DAIRY INDUSTRYNew Zealand currently has a strong position in dairy, but as a small milk producer in an absolute sense, is vulnerable to slight changes in global production
Strengths Weaknesses
– Low cost pasture-based dairy production system– National champion Fonterra with resources to address global
markets and opportunities– Growing market leadership position in Australasia/Oceania
– All our eggs in one basket (Fonterra)– No rich dairy cultural heritage or tradition to draw from for new
product development (vs. France or Italy)– Small milk producer in an absolute sense (~2%)– Limited defensibility of commodity and ingredient position
Opportunities Threats
– Consolidation of Australian market– Growth of incomes in Asia– Growing global dairy product consumption– Growth of neutraceuticals and functional foods
– Growing dairy production in Latin America and other pasture-based production systems
– Continued improvements by intensive feed-based systems returning them to low cost status (e.g. California)
– Changing global weather patterns
SWOT analysis of New Zealand in global dairy

57
Mapping
Pastoral
DAIRY – PRODUCTIVITY INDICATORSNew Zealand has been producing more milk by having more cows and by increasing production per headKey dairy productivity indicators (1994-2003)
2,808
3,358
3,842
1994 1999 2003
Cows in milk(#, thousands)
761
878
1,191
1994 1999 2003
Total milk solids(kg, b)
271261
310
1994 1999 2003
3.5%
CAGRMilk solids/Cow(kg)(94-03)
1.5%
CAGR(94-03)
5.1%
CAGR(94-03)
Source: MAF; SONZAF; SNZ; Coriolis analysis

58
Mapping
Pastoral
LOW MILK PER COW YIELDS VS. COMPETITORSHowever, as a pastoral-based system, New Zealand still gets relatively low milk yields per animalMilk production per cow(litres; 1961-2004)
Source: MAF; USDA; FAO; Coriolis analysis
New Zealand
IrelandAustralia
Chile
United StatesDiscussion Points
• Clearly this is only one factor in overall competitiveness; where do we excel?
• Why? Management, breeding or grain-feeding?
• Interaction between cost and yield (i.e. can you drive up yield (e.g. irrigation) while remaining a low cost producer?)
• Drivers of superior performance of Ireland and Australia (New Zealand outperformed Ireland until 1976)
• At what yield does the U.S. return to being a competitive exporter? (projection: 2020: New Zealand 4,100 vs. US 12,300)
Notes
• Uses milk not milksolids as there is no milksolids data available
-
1,000
2,000
3,000
4,000
5,000
6,000
7,000
8,000
9,000
1961
1965
1969
1973
1977
1981
1985
1989
1993
1997
2001
Denmark
Uruguay
CAGR(61-04)
0.7%
2.1%2.2%
0.6%
2.3%
1.8%
0.4%

59
Mapping
Pastoral
INDUSTRY STRUCTURE – DAIRY PROCESSINGDairy processing is concentrated in Fonterra, a national champion created in a government sanctioned mega-merger
– Built on low cost inputs of milk/milkfat from grass-fed livestock
– New Zealand is a low cost producer of milk as a result of grass-feeding dairy cows by efficient farmers
– Grass growth is highly seasonal leading to big swings in milk production
– New Zealand is not a low cost producer of grain, hence does not use significant additional feed (i.e. not a high input/high output model)
– Dairy processing is comprised of three segments, all with a strong Fonterra presence
– Transport-friendly dairy products for export markets (Fonterra, Westland, Tatua)
– Fluid milk and consumer dairy products for the local market (Fonterra/Mainland, NZDF, National Foods, United Milk)
– Ice-cream for domestic consumption and export (Fonterra/Tip Top, Unilever, Kiwi, Emerald Foods, Talley’s)
– Growing trans-Tasman/global integration driven by Fonterra

60
Mapping
Pastoral
KEY COMPANIES – DAIRY PROCESSINGWhile there are a number of players in the dairy industry, Fonterra is by far the largest
CompanyTurnover
(NZ$; m; 2004) Employees Ownership Activities
Fonterra Co-operative Group
$11,830 19,600 New Zealand Cooperative
NZDF (formerly Mainland) $980 1,600 Rank Group – Milk and dairy products for the domestic market– Previously Mainland Products (subsidiary of Fonterra);
now Rank group
United Milk/Kapiti ? 226 New Zealand Cooperative
– Production of fluid milk, cheese and ice cream– Subsidiary of Foodstuffs (Wellington)
Fonterra Brands (formerly NZDF)
$502 900 Fonterra Subsidiary
– Milk and dairy products for the domestic market– Previously owned by Rank Group; now Fonterra
Tip Top Ice Cream $140 400 FonterraSubsidiary
– Subsidiary of Fonterra
New Zealand Cooperative
New Zealand Cooperative
National Foods New Zealand
$50 65 PhilippinesPublic Listed
– Yoghurt and dairy foods– Subsidiary of National Foods Australia; owned by San
Miguel, Philippians
– Dairy processing (primarily for export)– Turnover includes sales of non-NZ subsidiaries
Westland Milk Products $235 209 – Dairy processing
Tatua Co-operative Dairy $110 200 – Dairy processing
Key companies in the dairy products manufacturing and wholesaling sector
Others+ Emerald Foods+ Gisborne Milk
Source: Management magazine Top 200; NZ Companies Office returns; press reports; interviews; Coriolis analysis

61
Mapping
Pastoral
DAIRY - MARKET SHAREOne company, Fonterra, dominates the New Zealand dairy industry
New Zealand dairy sales market share(% of sales; 2004)
Discussion Points
• Who is driving product innovation?• Why is there no major international
dairy company participation in the New Zealand market?
• How does this situation benefit the New Zealand consumer?
Notes
• Market share represents New Zealand wholesale domestic sales and export sales (at border); does not include international sales or margins
• Fonterra controls 95% of milk supply
Note: Fonterra includes Mainland Products; Source: company annual reports; various published articles; Coriolis analysis and estimates
Fonterra90%
Other10%
TatuaKapiti/United Milk
NZDFNational FoodsGisborne Milk
Open Country CheeseSynlait
ESTIMATE

62
Mapping
Pastoral
ACQUISITIONS – DAIRY PROCESSINGThe dairy processing sector has experienced a decade of acquisitions and consolidation
Acquiror Acquiree Date Notes
Fonterra New Zealand Dairy Foods
Aug 2005 Fonterra asset swap with Rank Group; Fonterra gets NZDF less some brands/products
Emerald Foods New Zealand Natural Oct 2004 Foodservice ice cream franchise business
Fonterra/Global Dairy
NZ Dairy Board, New Zealand Dairy Group, Kiwi Dairies
2001 Creation of mega-cooperative from New Zealand Dairy Board, New Zealand Dairy Group and Kiwi Dairies following extended court/legal/government battle
Foodstuffs Wellington
United Milk Ltd. Oct 2003 Foodstuffs Wellington (supermarket retailer) buys out other shareholders in milk & cheese ventureChanges company name to Kapiti Fine Foods
Rank Group Mainland Products Aug 2005 Rank Group asset swap with Fonterra; Rank gets Mainland Products less Mainland Cheese (and some others)
United Milk Ltd Kapiti Cheese Aug 2003 Foodstuffs Wellington (supermarket wholesaler) subsidiary acquires specialty cheese company
Rank Group New Zealand Dairy Foods Holdings
Feb 2002 Fonterra forced to divest NZDF as part of mega-cooperative formation
International Dairy Ventures (IDV)
NZ operations of Chateau Crème Delight
Oct 2003 Movenpick NZ manufacturing operations; Nestle bought Movenpick globally but sold New Zealand operations
New Zealand Dairy Foods
Puhoi Valley Cheese Nov 2000 Cheese company with $10m turnover

63
Mapping
Pastoral
DAIRY MANUFACTURING TURNOVER GROWTHThe dairy manufacturing sector, primarily Fonterra, has delivered strong growth
Dairy manufacturing turnover(dollars, millions, 1996-2003)
CAGR(96-03)
8.1%
Source: SNZ AES, company annual reports; various published articles; Coriolis analysis and estimates
Discussion Points
• Drivers of recent growth
Notes
• Part of jump between 99-03 may be a result of Fonterra’s Mainland Products being reclassified as a manufacturer?
• No data available prior to 1996 (AES); 2004 data not yet available
• Represents turnover of New Zealand operations, not global activities
• Processing turnover only; no separate data availability in AES on dairy wholesale;
$5.4
$6.1
$9.4
1996 1999 2003

64
Mapping
Pastoral
2215 15
21
1825
40
32
30
1994 1999 2003
Discussion Points
• What is happening in the Ice cream sector?
Source: SNZ Business Demographics survey; Coriolis analysis
Dairy manufacturing enterprises by sub-sector(enterprises, actual, 1994-2003)
83
65
70
-7
+4
-10
Absolute
DAIRY MANUFACTURING ENTERPRISESThe number of dairy manufacturing enterprises appears to have recovered slightly from a decline in the mid-90’s
Change(94-03)
-13 -1.7%
-2.8%
1.8%
CAGR(94-03)
-3.8%
Dairy products nec
Ice cream
Milk & cream processing

65
Mapping
Pastoral
9301,690
3,150810
830
800
7,1506,430
6,590
1994 1999 2003
Source: SNZ Business Demographics survey; Coriolis analysis
8,890 8,950
10,540
DAIRY MANUFACTURING EMPLOYMENTEmployment in dairy manufacturing continues to grow
+2,220
-10
-560
AbsoluteChange(94-03)
+1,650 1.7%
-0.8%
CAGR
-0.1%
(94-03)
13.0%
Dairy products nec
Ice cream
Milk & cream processing
Dairy manufacturing employees by sector(people, actual, 1994-2003)
Discussion Points
• Growth of big players in fewer enterprises (see previous)
Notes
• Includes working proprietors
• Total employees not FTE

66
Mapping
Pastoral
DAIRY MANUFACTURING EMPLOYMENT PER ENTERPRISEPer enterprise employment is increasing in all sectors except ice cream
Source: SNZ Business Demographics survey; Coriolis analysis
+168
-7
+41
AbsoluteChange(94-03)
2.1%
CAGR
-1.9%
(94-03)
17.4%Other dairy products nec
Ice cream
Milk & cream processing
Dairy manufacturing employees by sector(people, actual, 1994-2003)
Notes
• Includes working proprietors
• Total employees not FTE
0
50
100
150
200
250
1994 1999 2003

67
Mapping
Pastoral
272 317473
193239
285333382
557
168
203
425
79
94
138
9
171
253
1994 1999 2004
DAIRY PRODUCTION BY TYPENew Zealand’s growing milk production is turned into a range of transport friendly dairy products with strong growth coming from SMP and “other”New Zealand dairy production by type(tonnes, m, 1994-2004)
Butter
Cheese
WMP
SMP/BMP
Protein/Casein
Other
1,054
1,406
2,131 7.3%
39.6%
5.7%
CAGR(94-04)
9.8%
5.3%
4.0%
5.7%
Discussion Points
• What is other? How sustainable is its growth?
• Is the 1994 value for other correct? (Source: MAF SONZAF)
Note: SMP = Skim Milk Powder, BMP = Butter Milk Powder; Source: MAF; SONZAF; UN; FAO; Coriolis analysis

68
Mapping
Pastoral
16.3
12.4
2.8
1994 1999 2003
1,350
1,120
330
1994 1999 2003
8390
116
1994 1999 2003
Discussion Points
• Why? Reclassification of Mainland discussed earlier?
Notes
• Wholesaler defines as more than 50% of turnover from products they do not manufacture
Source: SNZ Business Demographics survey; Coriolis analysis
Dairy wholesaling statistics(enterprises, employees, actual, 1994-2003)
Enterprises
DAIRY WHOLESALINGWhile the number of dairy wholesaling enterprises is up, the number of people employed is down strongly
Employees Employees/Enterprise
+33
-1,020
-13

69
Mapping
Pastoral
$7$12
$18$7
$15
$26
$18
$14
$14
1994 1999 2004
$49
$82
$134 Discussion Points
• Why do we import ice cream?
• What is other dairy? Why are we importing it?
Notes
• Classifications• Cheese (HS0406)• Other Dairy (remainder of HS04)• Ice cream (HS2105)
Cheese
Other dairy
Ice Cream
9.6%
14.0%
-2.4%
CAGR(94-04)
6.0%
+$11
+$19
-$4
AbsoluteChange(94-04)
+$26
Source: WTA; SNZ; Coriolis analysis
NEW ZEALAND DAIRY IMPORTS BY SEGMENT While dairy imports are growing, the total value of import is only 2% of the value of exports
Dairy imports by segment(dollars, millions, 1994-2004)

70
Mapping
Pastoral
Supermarkets $870 60%
Other retail $380 27%
Foodservice $180 13%
Total = $1,430million
DAIRY – DOMESTIC MARKETThe domestic dairy market has wholesale sales of $1.4 billion
Discussion Points
• Opportunities for growth?
Notes
• Includes:• Milk & cream• Cheese• Yogurt & dairy foods• Cultured products• Ice Cream• Butter (excluding margarine)• Condensed milk• Various other dairy-based products
• Represents wholesale purchases of dairy products at cost to channel not retail sales to consumers
• Excludes ingredient purchases by manufacturers/others
New Zealand domestic dairy products market by channel(dollars, millions, 2004)
Source: SNZ HHES; SNZ RTS; interviews; Coriolis Foodservice in New Zealand; Coriolis analysis & estimates

71
Mapping
Pastoral
$791 $886 $960
$582$967 $1,039
$863
$1,090
$1,691
$416
$468
$713
$29
$82
$190
$316
$525
$1,032
$575
$705
$705
$60
$134
$131
1994 1999 2004
Dairy exports by segment(dollars, millions, 1994-2004)
WMP
$3,632
$4,857
$6,461 Discussion Points
• Significant growth coming from products other than Butter and Cheese
• Why isn’t casein growing?
Notes
• See next page for breakdown of other dairy
Butter/Ghee
Cheese
SMP
BMP
Other dairy
2.0%
6.0%
5.5%
20.5%
12.6%
CAGR(94-04)5.9%
7.0%
+$169
+$458
+$297
+$160
+$716
AbsoluteChange(94-04)+$2,829
+$828
DAIRY EXPORTS BY SEGMENT The dairy sector is the largest overall export sector, exports have almost doubled in the last 10 years
Casein 2.1% +$130
Albumins 8.1% +$71
Source: WTA; SNZ; Coriolis analysis

72
Mapping
Pastoral
$114$187
$377$54
$65
$24
$-
$36
$33
$31
$40
$46
$19
$43
$101
$23
$78
$255
$35
$44
$160
$40
$30
$37
1994 1999 2004
Dairy exports by segment(dollars, millions, 1994-2004)
Dairy cocoa
$316
$525
$1,032 Discussion Points
• Growing role of international trade barriers in structure of dairy production
Notes
• Classifications:• Other chapter 04 (HS04 less cheese, butter,
WMP/SMP/BMP, eggs and honey) • Ice cream (HS2105)• Dairy fat (HS1516.10/1517.10)• Lactose (HS1702.11/1702.19)• Dairy cocoa (HS1805)• Dairy bakery (HS1901.90)• Dairy chapter 21 (HS2106.90)• Dairy Sauce (HS2103.90)• Excludes milk-based animal food
Other chapter 4
Dairy fat
Dairy bakery
Dairy chapter 21
Dairy sauce
12.7%
-7.9%
18.1%
27.1%
16.6%
CAGR(94-04)12.6%
3.9%
+$263
-$30
+$82
+$232
+$126
AbsoluteChange(94-04)+$716
+$15
OTHER DAIRY EXPORTS BY SEGMENT New Zealand exports an increasing amount of dairy products under non-traditional dairy classifications
Ice cream -0.7% -$3
Source: WTA; SNZ; Coriolis analysis
Lactose n/a +$33

73
Mapping
Pastoral
$104 $265 $466$664 $530
$523$110 $208$254
$42$56
$63$460
$504
$601$23
$38
$127
$352
$486
$743
$78
$143
$164
$972
$1,466
$2,066
1994 1999 2004
New Zealand dairy export value by destination(NZ$, m, 1994-2004)
$2,805
$3,696
$5,007 6.0%
7.8%
7.8%
CAGR
NEW ZEALAND TOTAL DAIRY EXPORT VALUE BY DESTINATIONThe New Zealand dairy industry is achieving good export sales growth
(94-04)
18.7%
-2.4%
16.1%
Discussion Points
• What drove the +$500m sales increase to Asia in the last 5 years? Can this growth continue?
• How at risk are exports to Latin America give that regions growing production?
• Will exports value to Europe continue to decline at the same rate over the next decade?
Notes
• Excludes non-HS04 dairy products including casein
• Uses HS04 (Dairy) to simplify analysis which includes a small amount of eggs/honey ($34m in 2004)
USA/Canada
Europe/Russia
Sub-Saharan Africa
NA/ME/CA
E/SE Asia
Australia 8.7%4.2%Oceania
2.7%Latin America
7.8%Indian Subcont.
Source: NZ Customs data; NZTE; Coriolis Research

74
Mapping
Pastoral
77,784 82,347 85,944
234,293 220,345 219,572
8,403 10,560 10,4469,812 10,881 14,780
47,104 56,889 60,32311,139 12,514
13,58022,172 24,53028,72731,498
42,05048,06217,412
20,264
31,878
1994 1999 2004
Global milk production by super-region (t, m, 1994-2004)
USA/Canada
Europe/Russia
Australia/OceaniaNew Zealand
Latin America
459,616480,381
513,312
1.0%
CAGR
GLOBAL MILK PRODUCTION VOLUME BY REGIONOn a global scale, New Zealand is a relatively minor milk producer; India and Asia are showing stronger growth
(94-04)
2.5%
4.2%2.2%
-0.6%
Discussion Points
• Why is milk production falling in Europe? How quickly can this change?
• What is the capability and cost structure of Eastern Europe/Russia? of India?
• In the past 5 years E/SE Asia has added the equivalent of New Zealand’s total production; Can this growth continue?
Sub-Saharan AfricaNA/ME/CA
E/SE Asia
1.1%
6.2%
2.6%2.0%
Indian Subcont. 4.3%
Source: MAF; SONZAF; UN; FAO; Coriolis analysis

75
Mapping
Pastoral
3,693 4,282 4,717
8,0838,537
9,679
234
335
364
193
239
285
821
927
896
220
225
230
803
955
1,211
330
342
394
1994 1999 2004
Global cheese production by super-region (t, m, 1994-2004)
USA/Canada
Europe/Russia
AustraliaNew ZealandLatin America
14,378
15,842
17,776
2.5%
CAGR
CHEESE PRODUCTION VOLUME BY REGIONGlobal cheese production is centered in Europe and the USA/Canada
(94-04)
0.9%4.0%4.5%
1.8%
Discussion Points
• Why does Australia produce more cheese than New Zealand?
• Why is cheese production growing faster in Australia than in New Zealand?
Sub-Saharan AfricaNA/ME/CAE/SE Asia
2.1%1.8%4.2%0.5%
Source: MAF; SONZAF; UN; FAO; Coriolis analysis

76
Mapping
Pastoral
176 229 246
1,7731,991
2,648
32
43
59
116
136
159
9
19
21
159
210
232
1
2
3
186
262
297
1994 1999 2003
Global cheese imports by super-region (t, m, 1994-2003)
USA/Canada
Europe/Russia
OceaniaLatin AmericaSub-Saharan Africa
Indian Subcont.NA/ME/CA
E/SE Asia
2,453
2,893
3,667 4.6%
5.4%16.4%
3.8%
4.3%
CAGR
CHEESE IMPORT VOLUME BY REGIONEurope is the leading importer of cheese, primarily from other European countries
(94-03)
9.5%3.6%7.0%
4.6%
Discussion Points
• Why does Europe import so much cheese?
Notes
• Includes inter-regional trade (e.g. France to Germany) inseparable at source
Source: MAF; SONZAF; UN; FAO; Coriolis analysis

77
Mapping
Pastoral
$70$156 $156
$142
$172$126
$69
$130$161
$76
$95 $121
$1
$4 $10
$33
$84 $83
$190
$326$382
1994 1998 2004
New Zealand cheese export value by destination(NZ$, m, 1994-2004)
$582
$967
$1,039 6.0%
7.8%
9.5%
CAGR
NEW ZEALAND CHEESE EXPORT VALUE BY DESTINATIONThe growth of New Zealand cheese export value has slowed recently
(94-04)
21.6%
Discussion Points
• What drove the +$385m sales increase from 1994-1998? Why did it slow?
• Given Asia now represents 37% of NZ cheese exports, how willing are Asians to eat more cheese?
• Will exports value to Europe continue to decline at the same rate over the next decade?
• How much more cheese growth is available in Australia/Oceania?
USA/Canada
Europe/Russia
Sub-Saharan AfricaNA/ME/CA
E/SE Asia
8.8%Oceania
4.9%Latin America
Source: NZ Customs data; NZTE; Coriolis Research
-1.2%
8.2%

78
Mapping
Pastoral
$-
$0.50
$1.00
$1.50
$2.00
$2.50
$3.00
$3.50
$4.00
$4.50
$5.00
USA
/Can
ada
Euro
pe
Oce
ania
Latin
Am
eric
a
Sub-
Saha
ran
Afr
ica
NA
/ME/
CA
E/SE
Asi
a
New Zealand cheese export value per kg by destination(NZ$, 1994-2004)
Discussion Points
• Why is value per kg falling to Europe but rising to South America?
• Why haven’t prices to Australia /Oceania fallen as fast as those to Europe?
Source: NZ Customs data; NZTE; Coriolis Research
94 98 04
NEW ZEALAND CHEESE EXPORT VALUE PER KILO BY DESTINATIONThere is no clear trend in New Zealand cheese export pricing

79
Mapping
Pastoral
713 670 612
3,0942,758 2,719
143176 130
272317 473
199207 225
7674 86
324333 376
1,619 2,274
3,097215
230
237
1994 1999 2004
Global butter/ghee powder production by super-region (t, m, 1994-2004)
USA/Canada
Europe/Russia
AustraliaNew ZealandLatin America
6,6557,041
7,955
-1.5%
CAGR
BUTTER/GHEE PRODUCTION VOLUME BY REGIONGlobal butter/ghee production is going nowhere or backwards except in India and New Zealand
(94-04)
1.2%5.7%-0.9%
-1.3%
Discussion Points
• What is driving the growth of butter/ghee production in India?
• What capability does India have to export? In 10 years?
• Why is New Zealand producing more butter while the rest of the Western world is producing less?
• Why is butter production declining in Australia?
Sub-Saharan AfricaNA/ME/CA
E/SE Asia
1.8% / -0.4% ex-Ind.
1.0%
1.5%1.2%
Indian Subcont. 6.7%
Source: MAF; SONZAF; UN; FAO; Coriolis analysis

80
Mapping
Pastoral
8133 220
836760
940
1018
16
--
-
111106
113
2220
28507
530
54075
116
63408 249
299
1994 1999 2003
Global butter/ghee imports by super-region (t, m, 1994-2003)
USA/Canada
Europe/Russia
OceaniaLatin AmericaSub-Saharan Africa
Indian Subcont.
NA/ME/CA
E/SE Asia1,977 1,933
2,218 1.3%
-3.4%
-1.8%
45.0%
0.7%
CAGR
BUTTER/GHEE IMPORT VOLUME BY REGIONOverall, global butter/ghee imports are growing slowly
(94-03)
2.4%0.2%5.9%
1.3%
Discussion Points
• What potential is there for Arabic or Asian consumers to substitute other oils/fats for ghee?
Source: MAF; SONZAF; UN; FAO; Coriolis analysis

81
Mapping
Pastoral
NEW ZEALAND BUTTER/GHEE EXPORT VALUE BY DESTINATIONArabic countries, the US/Canada and E/SE Asia are importing more New Zealand butter/ghee, while overall Europe is importing less New Zealand butter/ghee export value by destination(NZ$, m, 1994-2004)
Source: NZ Customs data; NZTE; Coriolis Research
$4$52
$120
$470$331
$362
$24
$44
$52$59
$86
$51$3$7
$5$118 $206
$188$10
$17$3
$104
$142
$180
1994 1999 2004
$790
$886
$960 2.0%
5.6%
4.8%
CAGR(94-04)
5.5%
-2.6%
41.3%
Discussion Points
• What is the ultimate potential of the US/Canada market?
USA/Canada
Europe/Russia
Sub-Saharan Africa
NA/ME/CA
E/SE Asia
8.2%Oceania-1.5%Latin America
Indian Subcont. -11.8%

82
Mapping
Pastoral
$-
$0.50
$1.00
$1.50
$2.00
$2.50
$3.00
$3.50
$4.00
USA
/Can
ada
Euro
pe
Oce
ania
Latin
Am
eric
a
Sub-
Saha
ran
Afr
ica
NA
/ME/
CA
Indi
an S
ub.
E/SE
Asi
a
New Zealand butter/ghee export value per kg by destination(NZ$, 1994-2004)
Source: NZ Customs data; NZTE; Coriolis Research
Discussion Points
• With falling consumption and low global production growth, what is pushing up prices?
94 9804
NEW ZEALAND BUTTER/GHEE EXPORT VALUE PER KILO BY DESTINATIONExport butter value per kilo are up over the past decade

83
Mapping
Pastoral
646 734 775
2,086 1,821 1,699
221272
222
168203 425
7498
8516 91140
1522
220232
217
1994 1999 2004
Global skim milk powder production by super-region (t, m, 1994-2004)
USA/Canada
Europe/Russia
Australia
New ZealandLatin America
3,4703,384
3,455
1.8%
CAGR
SMP PRODUCTION VOLUME BY REGIONNew Zealand is dramatically increasing its SMP production in a declining market, effectively taking share from almost every other region
(94-04)
1.5%9.8%
0.0%
-2.0%
Discussion Points
• How is New Zealand growing in a market showing no growth? How long will this growth last?
• Why does the US produce SMP not WMP?
• What capability does Latin America have to switch from WMP to SMP?
Sub-Saharan AfricaNA/ME/CAE/SE Asia
-0.04%-0.1%-5.9%-4.3%
Source: MAF; SONZAF; UN; FAO; Coriolis analysis

84
Mapping
Pastoral
11 11 5
646724
627
27
6
267263
207
6553
55
250216
272
1652
35
512499
493
1994 1999 2003
Global skim milk powder imports by super-region (t, m, 1994-2003)
USA/Canada
Europe/Russia
Oceania
Latin America
Sub-Saharan Africa
Indian Subcont.
NA/ME/CA
E/SE Asia
1,7691,824
1,701 -0.4%
-0.4%
9.4%
-8.1%
0.9%
CAGR
SMP IMPORT VOLUME BY REGIONGlobal SMP imports – from all countries - are declining
(94-03)
-2.0%
-2.8%
13.9%
-0.3%
Discussion Points
• What is driving the growth ofin Oceania and the Indian Subcontinent?
Source: MAF; SONZAF; UN; FAO; Coriolis analysis
imports

85
Mapping
Pastoral
$14 $6 $2$0 $1 $1$7 $14 $18
$59 $63 $51$1 $3 $6$57 $48
$98$1 $8
$17
$277$324
$521
1994 1999 2004
New Zealand skim milk powder export value by destination(NZ$, m, 1994-2004)
Source: NZ Customs data; NZTE; Coriolis Research
$416
$468
$713
NEW ZEALAND SMP EXPORT VALUE BY DESTINATIONNew Zealand’s SMP export sales are growing, primarily to Asia and the Middle East
5.5%
6.5%
5.6%
CAGR(94-04)
22.0%
-15.8%USA/Canada
Sub-Saharan Africa
NA/ME/CA
E/SE Asia
9.8%Oceania-1.6%Latin America
Indian Subcont. 32.5%
Discussion Points
• What is the ultimate potential of the Asian market?

86
Mapping
Pastoral
NEW ZEALAND SMP EXPORT VALUE PER KILO BY DESTINATIONNew Zealand’s export value per kilo for SMP falls in a narrow band except for export to Australia/OceaniaNew Zealand SMP export value per kg by destination(NZ$, 1994-2004)
Source: NZ Customs data; NZTE; Coriolis Research
$-
$0.50
$1.00
$1.50
$2.00
$2.50
$3.00
$3.50
$4.00
$4.50
USA
/Can
ada
Oce
ania
Latin
Am
eric
a
Sub-
Sah
Afr
ica
NA
/ME/
CA
Indi
an S
ub
E/SE
Asi
a
94 98 04
Discussion Points
• Why is value to Oceania falling?
Notes
• HS040210

87
Mapping
Pastoral
84 58 22
1,103989
946
93145
187
333382 557
546749
88714
12
13
22
14
14
9
10
14
83
58
56
1994 1999 2004
Global whole milk powder production by super-region (t, m, 1994-2004)
USA/Canada
Europe/Russia
Australia
New Zealand
Latin America
Sub-Saharan Africa
Indian Subcont.NA/ME/CA
E/SE Asia
2,2872,415
2,6941.7%-3.9%4.4%
-12.7%
-4.7%
CAGR
WMP PRODUCTION VOLUME BY REGIONLatin America, Australia, and New Zealand are increasing WMP production at the expense of other producers
(94-04)
-0.6%
5.0%
5.3%
7.2%
-1.5%
Discussion Points
• Why is Australian production growing faster than New Zealand?
• What is the ultimate capacity of South America?
• What is the capability of Eastern Europe/Russia to produce WMP?
• How much is Fonterra involved in Latin American production?
• Why is Latin America producing WMP not SMP?
Source: MAF; SONZAF; UN; FAO; Coriolis analysis
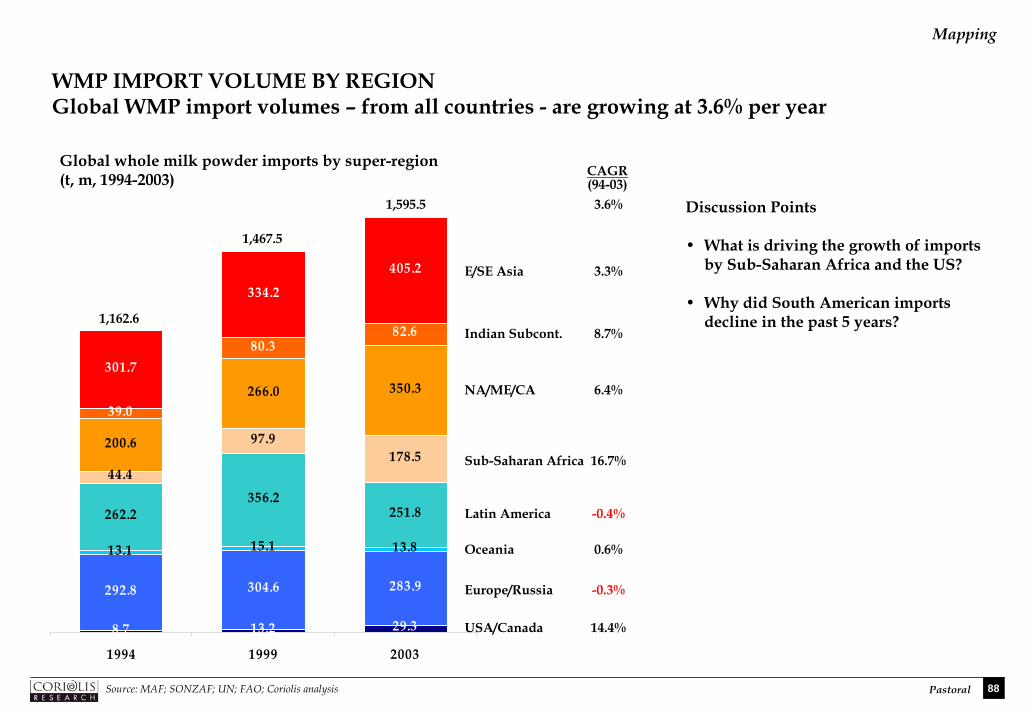
88
Mapping
Pastoral
8.7 13.2 29.3
292.8 304.6 283.9
13.1 15.1 13.8
262.2356.2
251.8
44.4
97.9178.5
200.6
266.0 350.339.0
80.382.6
301.7
334.2
405.2
1994 1999 2003
USA/Canada
Europe/Russia
Oceania
Latin America
Sub-Saharan Africa
Indian Subcont.
NA/ME/CA
E/SE Asia
1,162.6
1,467.5
1,595.5 3.6%
3.3%
8.7%
14.4%
6.4%
CAGR
WMP IMPORT VOLUME BY REGIONGlobal WMP import volumes – from all countries - are growing at 3.6% per year
Global whole milk powder imports by super-region (t, m, 1994-2003) (94-03)
16.7%
-0.4%
0.6%
-0.3%
Discussion Points
• What is driving the growth ofby Sub-Saharan Africa and th
• Why did South American imports decline in the past 5 years?
Source: MAF; SONZAF; UN; FAO; Coriolis analysis
imports e US?

89
Mapping
Pastoral
$5 $34 $74$48 $9$6$25 $34$29
$259 $242$318
$17 $18
$63$139 $153
$356
$63 $105
$134
$309
$496
$711
1994 1999 2004
New Zealand whole milk powder export value by destination(NZ$, m, 1994-2004)
Source: NZ Customs data; NZTE; Coriolis Research
$863
$1,090
$1,691
NEW ZEALAND WMP EXPORT VALUE BY DESTINATIONNew Zealand is experiencing good WMP sales growth, primarily to Asia and the Arabic world
7.0%
8.7%
9.9%
CAGR(94-04)
14.2%
31.9%USA/Canada
Sub-Saharan Africa
NA/ME/CA
E/SE Asia
1.8%Oceania
Latin America
Indian Subcont.
Europe/Russia -18.6%
Discussion Points
• What is the ultimate potential of the Asian market?
2.1%
7.9%

90
Mapping
Pastoral
NEW ZEALAND WMP EXPORT VALUE PER KILO BY DESTINATIONWMP export value per kg varies somewhat by region and appears to have drifted down in the past five yearsNew Zealand whole milk powder export value per kg by destination(NZ$, 1994-2004)
Source: NZ Customs data; NZTE; Coriolis Research
$-
$0.50
$1.00
$1.50
$2.00
$2.50
$3.00
$3.50
$4.00
$4.50
USA
/Can
ada
Euro
pe
Oce
ania
Latin
Am
eric
a
Sub-
Sah
Afr
ica
NA
/ME/
CA
Indi
an S
ub
E/SE
Asi
a
94 98 04
Discussion Points
• Why the regional variation?
• Why the rising sales to the US at a lower value?
• Why do we get more than the rest of the world for our WMP exports to Australia but less than the rest for our SMP exports?
Notes
• HS040221

91
Mapping
Pastoral
GLOBAL PER CAPITA SELECT DAIRY CONSUMPTIONOn a global basis, consumption of cheese and WMP are growing, while SMP and butter are decliningGlobal per capita dairy consumption by select product (kg/capita, 1961-2004)
Cheese
Butter/Ghee
SMPWMP
Discussion Points
• Why is global cheese consumptigrowing?
• Why the decline of butter/
• Why the decline of SMP and growth of WMP?
2.3%
-0.8%
-0.1%2.3%
CAGR
on
ghee?
(61-04)
-
0.5
1.0
1.5
2.0
2.5
3.0
1961
1964
1967
1970
1973
1976
1979
1982
1985
1988
1991
1994
1997
2000
2003
Source: MAF; SONZAF; UN; FAO; Coriolis analysis

92
Mapping
Pastoral
INFLATION-ADJUSTED EXPORT VALUE OF NZ DAIRYThis does not appear to be directly price related
Cheese
Butter/GheeSMPWMP
-1.6%
-2.3%0.9%
-1.5%
CAGR(61-04)
$0.25
$0.75
$1.25
$1.75
$2.25
$2.75
1961
1965
1969
1973
1977
1981
1985
1989
1993
1997
2001
Inflation adjusted New Zealand export price for select dairy products(US$/kg., FOB, inflation adjusted; indexed to 1982 dollars; 1961-2003)
Discussion Points
• Will prices continue to fall in reterms?
• If so, can we increase production faster than prices fall? (i.e. runnito stand still)
• Why has the price gap between SMP and WMP closed?
• Chicken is 40% of the price of cheese per kilo; are they substitutes?
Notes
• All values are inflation adjusted US dollars indexed to 1982 using th
• Represents value of New Zealand eonly
Source: FAO; BLS; Coriolis analysis
al
ng
e US CPI
xports

1
Mapping
Arable and Horticulture
2. ARABLE LAND & HORTICULTURE BASED PRODUCTION Plant-based foods & beverages are a product of arable and horticultural land
Resource ProductionManufacturing& Wholesaling Markets
Domestic
Export
Domestic
Export
Fruit & Vegetable Processing &WholesalingFruit & Vegetables
Domestic
Export
Grain-basedManufacturing& Wholesaling
Domestic
Export
Pasture
Livestock Meat Processing& Wholesaling
Domestic
Export
Milk Dairy Processing& Wholesaling
Arable land & Horticulture
Grains
Beverage Manufacturing& Wholesaling

2
Mapping
Arable and Horticulture
Grassland 8,255 53%Tussock &
danthonia 3,287 21%
Plantation forest 1,879 12%
Arable crop 424 3%
Other land 383 2%
Horticulture 110 1%
Native bush 1,302
8%
Total New Zealand land use(sqkm, thousands, 2002)
Farm 156 58%
National parks & reserves
80 30%
Other 32
12%
LAND USEArable crops and horticulture account for only 4% of farm land use
Total = 268,000 sqkm
Total = 15,640,000 hectares
Total New Zealand farm land use(hectares, thousands, 2002)
Grazing74%
Source: SNZ Agricultural Production survey; MAF; Coriolis analysis

3
Mapping
Arable and Horticulture
DRIVERS OF INCREASED CULTIVATED LAND OUTPUTThere are a limited number of drivers of increased output from cultivated land
More cultivation based output
Moreland
Increase efficiency of land
More irrigation
Better plant genetics
Improved farm management
New or different species
Key drivers of change in cultivated land output (model)
More crop land
More horticultural land
Increase efficiency of plants
Better fertiliser utilisation

4
Mapping
Arable and Horticulture
POTENTIAL FOR TRANSFORMATIVE CHANGEWhile New Zealand will struggle to increase crop output, there appears to be opportunities in increased horticultural outputPotential for transformative change in cultivated land output (model)
1. All commercial agriculture in New Zealand is based on non-indigenous species; therefore limiting introduction of non-indigenous species limits innovation
Objective Key Driver
Potential for transformative
change Key Issues
Low
Medium
High
Medium
Medium
Medium
New or different species
Medium – Emerging new species (e.g. nuts, olives)– Increased biosecurity regulation limiting new species
introduction1
– High cost of introducing new species
More horticultural land
– Competing land use (e.g. horses in Waikato)– Not a low cost producer of grains/pulses
– Increase in lifestyle blocks (+37,600ha/year)– More sheep-to-grapes/olives conversions
– Public opposition to new schemes– Cost of systems/new schemes– Market pricing of water
– Groundwater pollution– Cost vs. returns
– Dispersed and fragmented population– Traditional attitudes– More efficient production systems
– Improved cultivars of existing species– Consumer opposition to genetic modification
Better fertiliser utilisation
Improved farm/orchard management
Increased efficiency of plants
Better plant genetics
More land More crop land
Increase efficiency of land
More irrigation

5
Mapping
Arable and Horticulture
RECOMMENDATIONSBased on our research, we make the following recommendations to the Taskforce
Objective Issue Recommendations
1. Control spread of lifestyle blocks through zoning rather than through minimum block size2. Research actual lifestyle land required per household (i.e. are we forcing them to take 20ha when
they really want 2ha)3. Encourage systems to optimise production on lifestyle blocks (e.g. leasing by commercial farmers)
1. Research causes of arable crop land decline2. Research requirements for globally competitive grain production (e.g. new varieties)
1. Measure amount of water used by irrigation2. Expand area served by irrigation schemes3. Introduce market pricing to water to encourage efficient use of water resources4. Encourage use of drip irrigation
1. Fund research into efficiency of fertiliser utilisation (more efficient/less runoff)
1. Ensure we have the best initial farm/orchard management training program2. Explore farm extension program to disseminate best practice
1. Ensure access to leading international sources of plant genetics2. Understand regulatory barriers to introduction of new genetic material3. Continue to fund agricultural research
New or different species
1. Government program to evaluate potential new livestock species2. Review Hazardous Substances and New Organisms Act to enable free and open access to non-
indigenous species required for continued innovation (no new commercial plant species imported since act introduced (ie 7 years))
3. Explore role of government in infant industry support
Decline in land under arable crops
Better fertiliser utilisation
Improved farm management
Increased efficiency of plants
Better plants genetics
More land Massive growth of lifestyle blocks
Increase efficiency of land
More irrigation
Recommendations to Food and Beverage Taskforce to increase cultivated land output
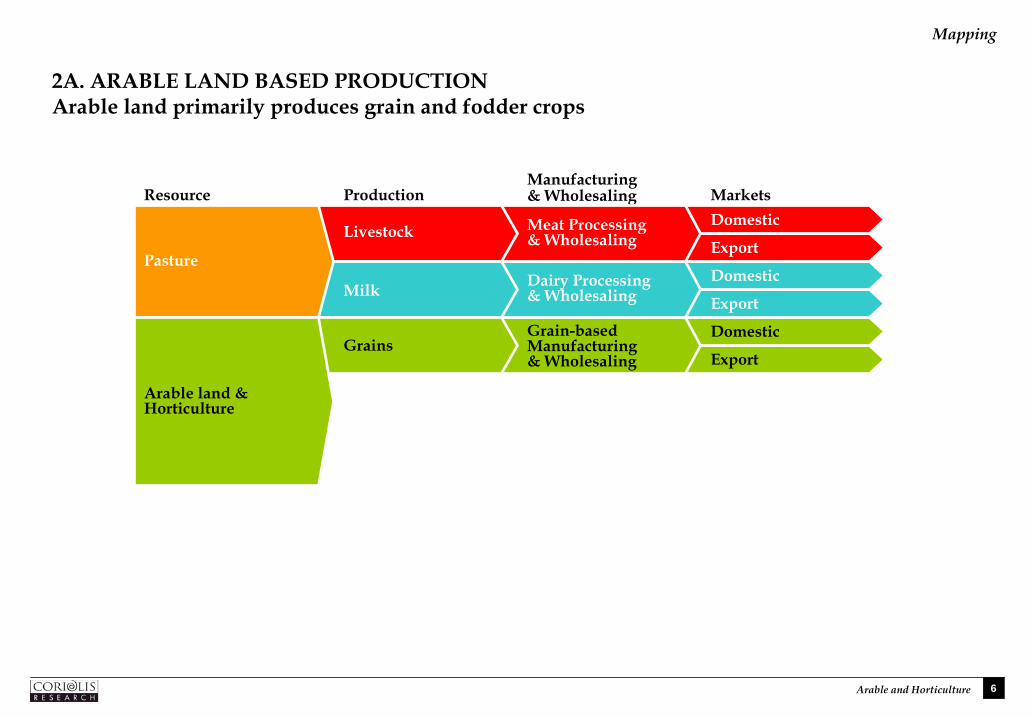
6
Mapping
Arable and Horticulture
2A. ARABLE LAND BASED PRODUCTION Arable land primarily produces grain and fodder crops
Resource ProductionManufacturing& Wholesaling Markets
Domestic
Export
Grain-basedManufacturing& Wholesaling
Domestic
Export
Pasture
Livestock Meat Processing& Wholesaling
Domestic
Export
Milk Dairy Processing& Wholesaling
Arable land & Horticulture
Grains

7
Mapping
Arable and Horticulture
$273
$312
1999 2003
3.4%
CAGR
Total grain farm turnover(dollars, millions, 1999-2003)
FARM TURNOVER GROWTH – GRAIN Grain farm turnover only grew at 3.4% per annum between 1999-2003
98-03
Source: SNZ Annual Enterprise Survey; Coriolis analysis
Discussion Points
• Grain has shown slow growth
Notes
• AES 2004 data not yet available
• Comparable data not available for earlier periods
• Methodology defines farm by primary income source
• Actual dollars; not inflation adjusted

8
Mapping
Arable and Horticulture
7252 42
152
68 78
13
10 7
1
2 3
18
17 14
10
158
214
280
1985 1995 2002
Wheat
Barley
OatsOther cerealMaize
Fodder/Other crops
425
361
424
-6+1-4
CHANGE IN FARM LAND USE – GRAINS & OTHER CROPPING, FODDER While total land use for grain, arable and fodder is flat, within that, grains are down and fodder crops are up
-30
-74
+122
AbsoluteChange
-10
+10
-3+1-2
+66
17 years 10 years
-1 +63
1. Unknown/missingSource: SNZ Agricultural Production survey; MAF; Coriolis analysis
Change in crop land use(hectares, thousands, 1985-2002)
1
Discussion Points
• Why did land used in barley production fall dramatically ?
• Role of dairy in the growth of fodder
• No competitive advantage in grain or grain-based products (e.g. poultry, pigs, biscuits, spirits)
Notes
• Total land use across all farm types (including those classified as pastoral)
• Maize excludes sweetcorn
• Fodder crops include kale, rape, swedes, turnips, and others

9
Mapping
Arable and Horticulture
1,645
935
520
1985 1995 2002
Number of grain & other cropping farms(farms, actual, 1985-2002)
-1,125
Absolute
CHANGE IN NUMBER OF FARMS BY TYPE – GRAIN & OTHER CROPPINGThe number of grain growing farms has declined dramatically; there are now only 520 farms focused on growing grains and other crops
Change
-415
17 years 10 years
Source: SNZ Agricultural Production survey; MAF; Coriolis analysis
Discussion Points
• Relative importance of small number of farm to total food industry
• Why is the number of grain farms declining? Will this decline continue?
• Role of economies of scale
Notes
• Farms defined at source by predominant source of income
• Does not include grain/sheep/beef farms classified under pastoral (for all years)

10
Mapping
Arable and Horticulture
128
180 19
2
236
125
169
280
120
18
2
30
60
60
50
30
130
95
31
3
40
Under 5 5-9 10-19 20-39 40-59 60-99 100-199 200-399 400-799 800+
Number of grain & other crops farms by size(#of farms, by size of farm, hectare, 1985-2002)
Note: total does not add exactly to number of farms given previously due to rounding at SNZ source (11,425 vs. 11,324)Source: SNZ Agricultural Production survey; MAF; Coriolis analysis
Discussion Points
• Relative impact of economies of scale
Notes
• Defined as farms registered for GST purposes (+$30,000pa)
• Excludes flowers/plant nurseries (2,500)
NUMBER OF FARMS BY SIZE – GRAINS & OTHER CROPPINGThe number of grain and other crop farms has fallen over the past two decades except for farms over 400ha
ProbablyLifestyle
1985
2002

11
Mapping
Arable and Horticulture
242 320 287396 304 38058 42 35143 197 170
6,179 6,099 6,381
1994 1999 2004
Crop production by type(tonnes, thousands, 1994-2004)
Source: MAF; FAO; Coriolis analysis
Discussion Points
• Very low to negative growth of grain production
• Wider implications of a grain industry that is not globally competitive
Notes
• Data based on MAF estimates and is not robust
• Includes silage/fodder produced on farm for own use
WheatBarleyOatsMaize
Silage/Fodder/Other Crops
7,018 6,9627,253
1.7%-0.4%-5.0%1.8%
0.3%
0.2%
CAGR
PRODUCTION - GRAINS & OTHER CROPPING, FODDER Grain and silage production is flat
(94-04)

12
Mapping
Arable and Horticulture
INDUSTRY STRUCTURE – GRAIN-BASED FOOD MANUFACTURING & WHOLESALING Grain-based food manufacturing can be split into three distinct segments
– Three distinct segments:
– Bread and other fresh baked goods
• Duopoly of Goodman Fielder (Australian) and George Weston (British)
• Created by economies of scale in daily distribution of fresh baked goods
– Breakfast cereals
• Three key companies: Sanitarium (Church-owned charity), Kelloggs (US; public) and Hubbards (private)
• Two manufacture in New Zealand (Sanitarium, Hubbards), one imports from Australia (Kelloggs)
– Biscuits, pasta and other shelf-stable grocery lines
• Biscuits primarily comprises Griffins (local production; French ownership) and Arnotts (Australian production; US ownership)
• Pasta and other grocery lines a mixture of smaller local producers (e.g. Tasti) and imports (e.g. San Remo)
– Significant overlap with “other food”; should not be looked at in isolation

13
Mapping
Arable and Horticulture
KEY COMPANIES – GRAIN-BASED FOODSThe large players in the grain-based foods sector are either the New Zealand operations of global or Australian category leaders or a handful of larger local firms
CompanyTurnover
(NZ$; m; 2004) Employees Ownership Activities
Goodman Fielder NZ / Bluebird Foods
$663 2,563 AustralianPublic Listed
– Production of bread, snack foods and grocery lines
Sanitarium $110 390 New ZealandCharity
– Manufacturer of breakfast cereal and grocery products– Sister company in Australia with similar ownership
Arnott’s New Zealand $79 61 United StatesPublic Listed
– Importer/wholesaler of biscuits and grocery products– Owned by Campbell’s Soup (US; Public)
Kellogg (NZ) $51 211 United StatesPublic Listed
– Importer/wholesaler of breakfast cereal
San Remo Pasta $31 141 AustraliaPrivate
– Importer of Australian made pasta
Hubbards Foods ? 150 New ZealandPrivate
– Manufacturer of breakfast cereal
Tasti Products ? 230 New ZealandPrivate
– Manufacturer of grocery products
FrancePublic Listed
AustraliaPublic Listed
Griffins Foods $218 901 – Production of biscuits– Subsidiary of Danone
Allied Foods (NZ) $172 1,554 – Subsidiary of George Weston Foods Australia (itseld a subsidiary of Associated British Foods)
Key companies in grain-based manufacturing and wholesaling
1. Excludes part time merchandisers; Source: Management magazine Top 200; NZ Companies Office returns; press reports; interviews; Coriolis analysis

14
Mapping
Arable and Horticulture
MARKET SHARE – GRAIN-BASED FOODSA small number of companies account for most grain-based foods
New Zealand grain-based manufacturing and wholesaling sales market share(% of sales; 2004)
Discussion Points
• Why is this dominated by global multinationals? What are the implications of your answer to the overall New Zealand food industry?
Notes
• Total currently does not include wholesale turnover leading to likely understatement of other
• Market share represents New Zealand wholesale domestic sales and export sales (at border); does not include international sales or margins
Source: Company annual reports; various published articles; Coriolis analysis and estimates
Goodman Fielder $663 47%
Griffins Foods $218 16%
Allied Foods $172 12%
Sanitarium $110 8%
Arnotts $79 6%
Other $158 11%
NO WHOLESALEDATA ISSUE

15
Mapping
Arable and Horticulture
ACQUISITIONS – GRAIN-BASED FOODSThere have been numerous acquisitions recently of grain-based manufacturers
Acquiror Acquiree Date Notes
Burns Philp Goodman Fielder 2003 Burns Philp acquires Australian listed Goodman Fielder including significant New Zealand operations
Goodman Fielder Aspak Foods 1999 Goodman Fielder acquired 66% outstanding shares in AspakFoods
Sanitarium Lisa’s Foods Mar 2003 Dips and Spreads business
Harraway & Sons Nicola’s Organics Nov 2002 Dunedin porridge company diversifies into organics
Cadbury Snack bars business of Mother Earth
Feb 2002 Snack bar production
Goodman Fielder Ernest Adams Oct 1999 Baked goods business with turnover of $44.4m
Source: various published articles

16
Mapping
Arable and Horticulture
$1.3 $1.2
$1.4
1996 1999 2003
CAGR
GRAIN-BASED FOOD MANUFACTURING TURNOVER GROWTHThe grain-based food sector is struggling to grow
Flour, cereal & bakery manufacturing turnover(dollars, millions, 1996-2003)
(96-03)1.3%
Source: SNZ AES, company annual reports; various published articles; Coriolis analysis and estimates
Discussion Points
• Drivers of low growth in flour, cereal & grain segment
Notes
• Excludes bakery wholesaling
• No data available prior to 1996 (AES); 2004 data not yet available

17
Mapping
Arable and Horticulture
560480
480 700
3,590 4,180
5,240
1,860 1,870
1,6501,840
1,040
1,490
70 50
1994 1999 2003
17 12 7
10 11 26
7061
62
172
135 115
11
11 18
1994 1999 2003
Discussion Points
• Is the decline of flour milling a result of an uncompetitive primary sector?
• Growth of bread employment
Source: SNZ Business Demographics survey; Coriolis analysis
GRAIN-BASED PRODUCT MANUFACTURINGThere are fewer cereal-based product manufacturing enterprises, but overall employment is up
Cereal-based product manufacturing statistics(enterprises, employees, actual, 1994-2003)
Enterprises
280
230 -52
AbsoluteChange(94-03)
Cereal food& baking mixFlour milling
Employees
9,130
8,330
7,640
-10
Bread
Cake &pastry
Biscuit
228
+16
-8
-57
+7
+800
AbsoluteChange(94-03)
-510+220
+1,650
-210
-350

18
Mapping
Arable and Horticulture
0
50
100
150
200
250
300
1994 1999 2003
Source: SNZ Business Demographics survey; Coriolis analysis
GRAIN-BASED PRODUCT MANUFACTURING EMPLOYMENT PER ENTERPRISEEmployment per enterprise is growing in bread and cereal food, but declining elsewhere
-30
AbsoluteChange(94-03)
-21.5%
CAGR(94-03)
Flour milling
Cereal-based product manufacturing employees per enterprise by sector(people, actual, 1994-2003)
Discussion Points
• Drivers of growth in bread employ
Notes
• Includes working proprietors
• Total employees not FTE
+13 3.8%Cereal food& baking mix
-21 -2.1%Biscuit-12 -1.2%Cake & pastry
+97 3.9%Breadment

19
Mapping
Arable and Horticulture
$75 $68$103
$18 $28
$37
$12$24
$18
$24$25
$33
$19
$32
$48
$22
$35
$43
$30
$98
$116
$10
$22
$12
1994 1999 2004
Grain-based imports by segment(dollars, millions, 1994-2004)
$209
$330
$410
CAGR(94-04)
7.0%
AbsoluteChange(94-04)
+$201
Source: WTA; SNZ; Coriolis analysis
Wheat 3.2% +$28
Rice 7.6% +$19
Biscuits, pastry, cakes 14.5% +$86
Discussion Points
• Role of changing tastes
• Role of changing ethnic makeup
• Level of Australian comparative advantage
Notes
• Details of classification:• Wheat (HS1001)• Rice (HS1006)• Other grains (remainder of HS10)• Milling (HS11)• Pasta (HS1902)• Cereal (HS1904)• Biscuits, pastry, cakes (HS1905)• Other baking related (remainder of HS19)
Other grains 4.2% +$6
Milled 3.2% +$9
Pasta 10.1% +$30
Cereal 6.8% +$21
Other baking related 2.2% +$2
IMPORTS BY SEGMENT – GRAIN-BASED FOODSImports of grain and grain based foods are growing strongly

20
Mapping
Arable and Horticulture
Supermarket $750 75%
Bakers $50 5%
Dairy/Grocery $50 5%
Other retail $60 6%
Foodservice $90 9%
Discussion Points
• Relative strength of supermarket channel
Notes
• Represents wholesale purchases of grain-based foods at cost to segment not retail sales to consumers
• Includes purchases by retail bakers (e.g. Baker’s Delight) of ingredients
Total = $1,000 million
DOMESTIC MARKET – GRAIN-BASED FOODSThe domestic market for grain-based foods has wholesale turnover of $1 billion
Wholesale purchases of fruit & vegetables by channel(dollars, millions, 2004)
Source: SNZ HHES; SNZ RTS; interviews; Coriolis Foodservice in New Zealand; Coriolis analysis & estimates

21
Mapping
Arable and Horticulture
$16 $13 $8
$17 $24
$69
$46$51
$78
1994 1999 2004
Grain-based exports by segment(dollars, millions, 1994-2004)
$79
$88
$155
CAGR(94-04)
7.0%
AbsoluteChange(94-04)
+$76
Source: WTA; SNZ; Coriolis analysis
Cereals/Milled -6.4% -$8
Biscuits, cakes & puddings 15.2% +$53
Other baking related 5.5% +$32
Discussion Points
• Influence of low-cost dairy
• How much of this is dairy tariff-busters?
Notes
• Details of classification:• Cereals/Milled (HS10,HS11)• Cakes & puddings (HS190590)• Other baking related (rest of HS19)
excluding dairy malt extract (HS190190)
EXPORTS BY SEGMENT – GRAIN-BASED FOODSGrowth in grain-based food export appears to be driven by processed products

22
Mapping
Arable and Horticulture
2B. HORTICULTURE BASED PRODUCTION Horticulture produces fruits and vegetables
Resource ProductionManufacturing& Wholesaling Markets
Domestic
Export
Fruit & Vegetable Processing &WholesalingFruit & Vegetables
Domestic
Export
Grain-basedManufacturing& Wholesaling
Domestic
Export
Pasture
Livestock Meat Processing& Wholesaling
Domestic
Export
Milk Dairy Processing& Wholesaling
Arable land & Horticulture
Grains

23
Mapping
Arable and Horticulture
SWOT ANALYSIS – HORTICULTURE INDUSTRYThe history of horticulture in New Zealand is based on innovation; this needs to continue
Strengths Weaknesses
– Long history of new fruit development– Research and development of new cultivars– Counter seasonal to Northern Hemisphere– Narrow seasonal window with only four competitors– Attractive climatic conditions and soil characteristics– Proximity to and capability to serve Asian markets where the
higher-quality/higher cost differentiated model is rewarded (specifically Japan)
– Fragmentation of the industry– Limited ability to supply fruit year round– Higher cost position relative to Chile
Opportunities Threats
– Aging baby boomers focusing on healthy living– Growth of functional foods– Potential of the Australian market– Potential for further growth in the United States (if the right
model can be found)– New unique and controlled varieties– Improved yields
– Growing production of apples, wine grapes and kiwifruit in China– Growing global consolidation of the wine industry– Increasing transport costs– Consolidation of Japanese retailers increasing relative strength
SWOT analysis of New Zealand in global horticulture

24
Mapping
Arable and Horticulture
SEASONAL WINDOWOne of New Zealand’s key strengths is its narrow seasonal window that it shares with only four competitors (Australia, South Africa, Chile and Argentina)New Zealand seasonal window in global horticulture
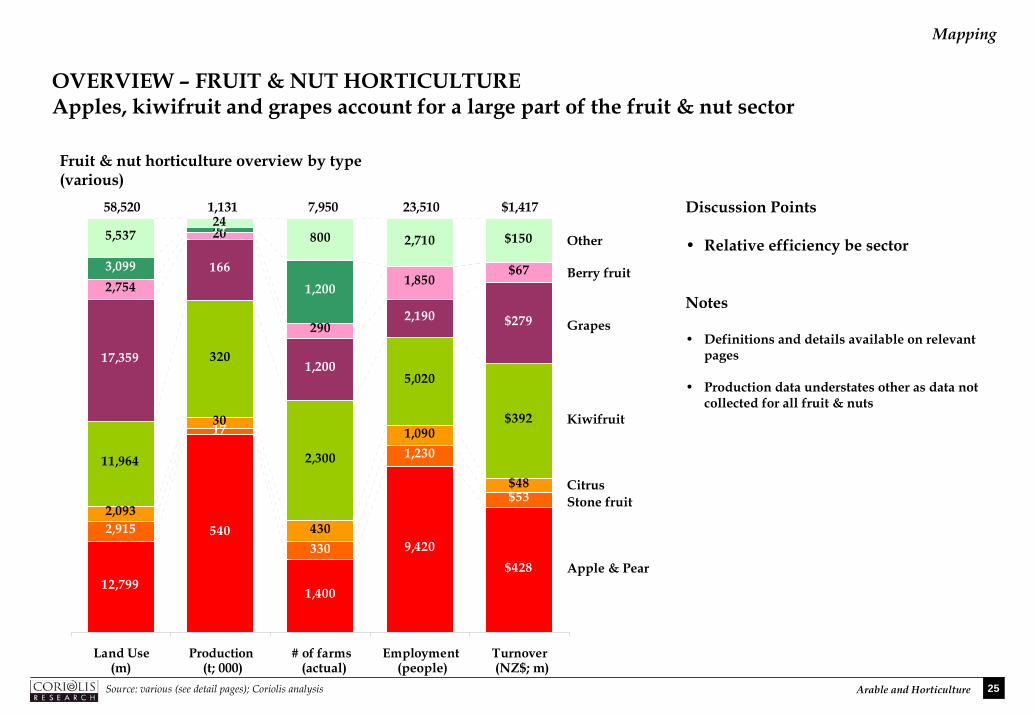
25
Mapping
Arable and Horticulture
12,799
540
1,400
9,420$428
2,915
17
330
1,230
$532,093
30
430
1,090
$4811,964
320
2,300
5,020
$392
17,359
166
1,200
2,190 $279
2,754
20
290
1,850$673,099
14
1,200
5,53724
800 2,710 $150
Land Use Production # of farms Employment Turnover
Fruit & nut horticulture overview by type(various)
Apple & Pear
Grapes
Berry fruit
Other
Source: various (see detail pages); Coriolis analysis
Discussion Points
• Relative efficiency be sector
Notes
• Definitions and details available on relevant pages
• Production data understates other as data not collected for all fruit & nuts
58,520 1,131 7,950 23,510 $1,417
(m) (t; 000) (actual) (people) (NZ$; m)
Stone fruitCitrus
Kiwifruit
OVERVIEW – FRUIT & NUT HORTICULTUREApples, kiwifruit and grapes account for a large part of the fruit & nut sector

26
Mapping
Arable and Horticulture
DIRECTIONAL TREND – FRUIT & NUT HORTICULTUREGrapes, avocados and “other” fruit & nuts stand out as the long-term winners
Land Use(85-02 (95-02)
Prod-uction(94-04)
# of Farms(85-02) (95-02)
Employ-ment(85-98
Turnover(98-03)
Apple & Pear ▲ ▼ = ▲ ▼ ▲ ▲Stone fruit ▼ ▼ ▼ ▲ ▲ ▲ ▲Citrus ▼ ▲ ▼ ▲ ▼ ▲ ▲
Berryfruit ▼ ▲ ▲ ▼ ▼ ▲ ▲
Kiwifruit ▼ = ▲ ▲ ▲ ▼ ▲Grapes ▲ ▲ ▲ ▲ ▲ ▲ ▲
Avocados ▲ ▲ ▲ ▲ ▲ n/a n/a
Other ▲ ▲ ▲ ▲ ▲ ▲ ▲
Directional trends in fruit & nut horticulture(growth or decline)
Discussion Points
• Long-term prognosis for apples
Notes
• Differing time periods (e.g. turnover 5 years vs. land use 17 years)
• Use with caution; should be treated as directional; different surveys; different methods; different definitions
• Details available on specific pages
Source: various (see detail pages); Coriolis analysis

27
Mapping
Arable and Horticulture
7,837
17,59512,799
3,787
2,963
2,9152,124
1,844
2,093
17,978
11,873
11,964
5,636
7,382 17,3592,934
1,356
2,754
1,2171,300
3,0992,5901,106
8741,019
1,841
1985 1995 2002
Change in fruit & nut land use(hectares, 1985-2002)
CHANGE IN LAND USE – FRUIT & NUTS While total land use for horticulture is up, this is being driven by grapes and other fruit, such as avocados, olives and nuts
Apples & Pears
Stone fruitCitrus
Kiwifruit
Grapes
Berry fruit
Other fruit nec
42,387
45,332
58,520
+4,962
-872-31
-6,014
+11,723
-180
+4,663
AbsoluteChange
-4,796
-48+249
+91
+9,977
+1,398
+4,518
17 years 10 years+16,133 +13,188
Note: No olive or nut data available for prior periods; data included in other fruit necSource: SNZ Agricultural Production survey; MAF; Coriolis analysis
Discussion Points
• Some amount of grapes, olives and nuts would appear to bring new land into horticulture
• Growth of Mediterranean fruit (grapes/olives)
• How do the economics of olive production in New Zealand compare with Spain or Turkey?
• What is the ultimate potential of avocados or the nut industry?
Notes
• Olives and nuts breakdown unavailable for 1995 or 1985
• Hort Research estimates differ in some cases; HR 2004 estimates Avocadoes 4,000ha; nuts1,841ha
AvocadosOlivesNuts
+1,882 +1,799

28
Mapping
Arable and Horticulture
Apple & pear 1,400 18%
Stone fruit 330 4%
Citrus 430 5%
Kiwifruit 2,300 29%
Grape growing 1,200 15%
Berry fruit 290 4%
Avocados 1,200 15%
Other fruit nec 800 10%
Number of fruit orchards by type(orchards, actual, 2002)
Total = 7,950 farms
Discussion Points
• Will the number of apples & pear farms continue to decline?
Notes
• Excludes plant nurseries (1,400) and cut flower and flower seed growing (1,100) as these are not food
• Other fruit nec is not a complete dataset, limited/patchy additional data available; nuts not available
NUMBER OF FARMS BY TYPE – FRUIT & NUT ORCHARDSThere are almost 8,000 fruit orchards in New Zealand, primarily (77%) apples, kiwifruit, grapes and avocados
Note: Includes tobacco farms which are not technically food but inseparable from hops which contributes to a beverage; includes grain which is an arable crop; excludes plant nurseries and Flowers (2,500); Source: SNZ Agricultural Statistics 2002; Coriolis analysis

29
Mapping
Arable and Horticulture
n/a
770
1,9011,400
304
266
330275
542
430
2,081
1,8442,300
377
5901,200
406
355
290
400
606
1,200
321
412
800
1985 1995 2002
Number of horticultural (food) farms by type(farms, actual, 1985-2002)
Apples & Pears
Stone fruitCitrus
Kiwifruit
Grapes
Berry fruit
Other fruit nec
4,934
6,516
7,950
+630
+26+155
+219
+823
-116
+479
+3,016
Absolute
CHANGE IN NUMBER OF FARMS BY TYPE – FRUIT & NUTSThe number of orchards is growing, driven primarily by more grape, kiwifruit, avocados and “other fruit nec” farms
Change
-501
+64-112
+456
+610
-65
+388
+1,43417 years 10 years
Source: SNZ Agricultural Production survey; MAF; Coriolis analysis
Discussion Points
• Will the number of apples & pear farms continue to decline?
Notes
• Excludes plant nurseries (1,400) and cut flower and flower seed growing (1,100) as these are not food
• Other fruit nec is not a complete dataset, limited/patchy additional data available; nuts not available
Avocados +800 +594

30
Mapping
Arable and Horticulture
1,36
4 1,60
4
1,10
6
534
174
93 41 16 2
2,04
0
1,38
5
698
222
150
80 18 3
3,24
0
Under 5 5-9 10-19 20-39 40-59 60-99 100-199 200-399 400-799 800+
Number of horticultural/cropping farms by size(#of farms, by size of farm, hectare, 1985-2002)
Note: total does not add exactly to number of farms given previously due to rounding at SNZ source (11,425 vs. 11,324)Source: SNZ Agricultural Production survey; MAF; Coriolis analysis
Discussion Points
• Is polarisation taking place?
• Role and impact of lifestyle farms
• Relative impact of economies of scale by farm type
Notes
• Defined as farms registered for GST purposes (+$30,000pa)
• Excludes flowers/plant nurseries (2,500)
NUMBER OF ORCHARDS BY SIZE – FRUIT & NUTSThere has been huge growth in the number of fruit farms in the past 17 years, primarily at the un-economic end of the spectrum
ProbablyLifestyle
+99
+1,876
1985
2002

31
Mapping
Arable and Horticulture
18.8%
Fruit production by type(tonnes, thousands, 1994-2004)
Source: MAF; FAO; Coriolis analysis
Discussion Points
• Lessons from kiwifruit industry productivity increases (more fruit from same land)
Notes
• Other fruit understated; no data available on nuts, olives and many other fruit (not collected)
• Data based on MAF estimates and is not statistically robust (eg stone fruit)
FRUIT PRODUCTIONFruit production is increasing, driven primarily by kiwifruit and grapes
532589
540
22
2917
5928
30
221217 320
5480
166
12
14
20
21
21
24
1994 1999 2004
Apples & Pears
Stone fruitCitrus
Kiwifruit
Grapes
Berry fruitOther fruit nec
922
987
1,131
0.2%
-2.2%-6.6%
3.8%
11.9%
5.3%1.6%2.1%
CAGR(94-04)
3
9
14 Avocados

32
Mapping
Arable and Horticulture
481
550
1994 2004
31,527
45,267
1994 2003
15,257
12,150
1994 2003
-2.5%
CAGR
APPLES – PRODUCTION INDICATORSWhile the area devoted to apples is declining, the yield is increasing, leading to slightly growing production
(94-03)
4.1%
CAGR(94-03)
1.3%
CAGR(94-04)
Hectares(#)
Total production(kg, m)
Production/Hectare(kg)
Source: MAF; SONZAF; SNZ; Coriolis analysis
Key apple productivity indicators (1994-2004)

33
Mapping
Arable and Horticulture
HIGH APPLE YIELDS PER HECTARE New Zealand gets world class apple yields per hectare
Apple production per hectare by select country(tonnes; 1961-2004)
Source: MAF; USDA; FAO; Coriolis analysis
New Zealand
China
South Africa
Australia
Chile
United States
Discussion Points
• We get good yields; which part of the equation is causing current industry turmoil?
• Implied that NZ area coming out of production is low yielding
• China now gets better yields than Australia
-
5
10
15
20
25
30
35
40
45
1961
1964
1967
1970
1973
1976
1979
1982
1985
1988
1991
1994
1997
2000
2003

34
Mapping
Arable and Horticulture
18,153
21,850
1994 2003
221
270
1994 2004
12,174 12,357
1994 2003
0.2%
CAGR
KIWIFRUIT – PRODUCTION INDICATORSKiwifruit farmers are improving their productivity by getting more fruit off the same land
(94-03) 2.1%
CAGR(94-03)
2.0%
CAGR(94-04)
Hectares(#)
Total production(kg, m)
Production/Hectare(kg)
Source: MAF; SONZAF; SNZ; Coriolis analysis
Key kiwifruit productivity indicators (1994-2004)

35
Mapping
Arable and Horticulture
0
5
10
15
20
25
30
1970
1973
1976
1979
1982
1985
1988
1991
1994
1997
2000
2003
Kiwifruit production per hectare by select country(tonnes; 1961-2004)
Source: MAF; USDA; FAO; Coriolis analysis
New Zealand
Italy
Australia
Chile
United States
Discussion Points
• Can we continue to improve yields at this rate?
Notes
• No comparable China data available
HIGH KIWIFRUIT YIELDS PER HECTARE New Zealand leads the world in kiwifruit yields per hectare

36
Mapping
Arable and Horticulture
54
143
1994 2004
7,5427,279
1994 2003
7,160
19,646
1994 2003
Hectares(#)
11.9%
CAGR
GRAPE – PRODUCTION INDICATORSNew Zealand wine production is increasing dramatically, land is being converted to grapes rather than any increase in productivityKey wine productivity indicators (1994-2004)
Total production(l, m)
Production/Hectare(l)
(94-03) -0.4%
CAGR(94-03)
10.2%
CAGR(94-04)
Source: MAF; SONZAF; SNZ; Coriolis analysis

37
Mapping
Arable and Horticulture
MID-RANGE GRAPE YIELDS PER HECTARE New Zealand gets a grape yield in the middle of the range
Grape production per hectare by select country(tonnes; 1961-2004)
Source: MAF; USDA; FAO; Coriolis analysis
New ZealandFrance
South Africa
Australia
Spain
United States
Discussion Points
• New Zealand yield trending down due to new plantings depressing yields?
• Old World vs. New World
• High year-to-year variability in New Zealand yields
Notes
• Includes table grapes (inseparable at source)
0
5
10
15
20
1961
1964
1967
1970
1973
1976
1979
1982
1985
1988
1991
1994
1997
2000
2003
Chile

38
Mapping
Arable and Horticulture
Apples & pears 9,420 40%
Stone fruit 1,230
5%
Citrus 1,090
5%
Kiwifruit 5,020 21%
Grapes 2,190
9%
Berry fruit 1,850
8%
Other fruit nec 2,710 12%
Number of people employed on orchards by type(people, actual, 1998)
Discussion Points
• Relative labour intensity of apples/pears
Notes
• Total people not FTE
• Farm employment survey conducted only twice in last 18 years (1998, 2004)
• Uses 1998 data as this incorporated working proprietors (not measured in 2004 survey)
• May not capture total pool of seasonal labour; no measure of unpaid working family members (35,000 across livestock & horticulture in 1985 survey)
• Does not include flowers/plant nursery employment (8,100). Avocados included in Other fruit nec
Total = 23,510 people
FARM EMPLOYMENT - ORCHARDSApples and kiwifruit account for 61% of orchard employment
Source: SNZ Agriculture Business Demographics survey (unpublished); Coriolis analysis

39
Mapping
Arable and Horticulture
2,380
9,420
580
1,230
546
1,090
5,914
5,020
1,474
2,190
1,406
1,850
1,684
2,710
1985 1998
Change in number of people employed in fruit & nut horticulture by type(people, actual, 1985-1998)
Discussion Points
• Why the huge growth in apple and pear orchard employment?
Notes
• Total people not FTE
• Farm employment survey conducted only twice in last 18 years (1998, 2004)
• Uses 1998 data as this incorporated working proprietors (not measured in 2004 survey)
• May not capture total pool of seasonal labour
• No measure of unpaid working family members (35,000 across livestock & horticulture in 1985 survey)
Apples & Pears +7.040 11.2%
Stone fruit +650 6.0%Citrus +544 5.5%
Kiwifruit -894 -1.3%
Grapes +716 3.1%
Berry fruit +444 2.1%
Other +1,026 3.7%
Absolute
CHANGE IN FRUIT & NUT EMPLOYMENTOverall employment in fruit & nut horticulture is up slightly
Change(85-98)
CAGR(85-98)
13,984
23,510 +9,526 4.1%
Source: SNZ Agriculture Business Demographics survey (unpublished); Coriolis analysis

40
Mapping
Arable and Horticulture
$338$428
$49
$53$38
$48
$331
$392
$134
$279
$54
$67
$96
$150
1999 2003
Total fruit orchard turnover by type(dollars, millions, 1999-2003)
Apples & Pears
Stone fruitCitrus
Kiwifruit
Grapes
Berry fruit
Other fruit/nuts nec
6.1%
2.0%6.0%
4.3%
20.1%
5.5%
CAGR
ORCHARD TURNOVER GROWTH – FRUIT & NUTSOrchard turnover is up in the past four years, especially in grapes and other fruit
98-03
11.8%
Source: SNZ Annual Enterprise Survey; Coriolis analysis
Discussion Points
• Strong growth of grapes and other fruit
Notes
• AES 2004 data not yet available
• Comparable data not available for prior periods
• Methodology defines farm by primary income source
• Actual dollars; not inflation adjusted
8.0%
$1,040
$1,417

41
Mapping
Arable and Horticulture
$48$61 $55
$8
$9$12$19
$19 $23
$40
$43 $42$8
$16 $25
$15
$22$27
$10
$18
$23
1994 1999 2004
$147
$207
Bananas
Pineapples
Nuts
Fruit & nut imports by segment(dollars, millions, 1994-2004)
1.4%
4.5%
6.2%
CAGR(94-04)
3.5%
+$7
+$4
+$12
AbsoluteChange(94-04)
+$60
FRUIT & NUT IMPORTS BY SEGMENT Fruit and nut imports are primarily tropical or counter-seasonal
Dried/preserved fruit & nuts 8.3% +$13
Source: WTA; SNZ; Coriolis analysis
Discussion Points
• Growth of nuts and preserved f
Notes
• Classification:• Bananas (HS0803)• Pineapples (HS0804) includes a sm
amount of dates and figs• Citrus (HS0805)• Grapes (HS0806)• Other fresh fruit (HS0807-0810• Nuts (US0801-0802)• Dried/preserved fruit & fruit/
(HS0811-0814)• Does not include processed pr
muesli bars)
Citrus 1.9% +$4
Grapes 0.6% +$2
Other fresh fruit 12.3% +$17
$188 ruit
all
)
nut mixtures
oducts (e.g.

42
Mapping
Arable and Horticulture
Supermarkets $920 63%
Greengrocers $175 12%
Other retail $102 7%
Foodservice $270 18%
Discussion Points
• Relative importance of non-supermarket channels
Notes
• Aggregate market is 47% fruit and 53% vegetables
• Represents wholesale purchases of fruit & vegetables (only
DOMESTIC MARKET – FRUIT & VEGETABLESThe domestic market for fruit & vegetables has wholesale purchases of $1,468 million, of which $690m is fruitWholesale purchases of fruit & vegetables by segment(dollars, millions, 2004)
) at cost to segment not retail sales to consumers (e.g. Greengrocers have turnover of $283m of which 75.6% is f&v on which they took an average gross margin of 22% for a wholesale cost of $175m)
• Excludes ingredient purchases (e.g. by soup manufacturers)
OutsideSupermarkets
37%
Total = $1,468 millionof which 47% fruit = $690m
Source: SNZ HHES; SNZ RTS; interviews; Coriolis Foodservice in New Zealand; Coriolis analysis & estimates

43
Mapping
Arable and Horticulture
Fruit exports by segment(dollars, millions, 1994-2004)
$327
$517 $473
$392
$464
$808
$8
$29
$30
$27
$86
$80
$36
$32
$38
1994 1999 2004
$790
$1,129
$1,428
Apples
Kiwifruit
Avocados
3.8%
7.5%
14.0%
CAGR(94-04)
6.1%
+$146
+$416
+$22
AbsoluteChange(94-04)
+$639
FRUIT EXPORTS BY SEGMENT Fruit exports are still highly reliant on apples and kiwifruit
Other fruit & nuts 11.5% +$53
Fruit jam /Preserved fruit 0.4% +$1
Source: WTA; SNZ; Coriolis analysis
Discussion Points
• Reliance on apples & kiwifruit
• Decline of apples
Notes
• Revised classifications from draft document• Fruit & vegetables now includes
preserved f&v (HS2001-2008), but excludes Wine (HS2204-2206)

44
Mapping
Arable and Horticulture
5,770 5,454 4,672
18,435 17,902 19,359
307 334 326481 545 5503,227 3,955 4,099563 631 714
4,195 4,540 5,0731,839 1,799
1,779
13,393
22,878 22,394
1994 1999 2004
USA/Canada
Europe/Russia
AustraliaNew ZealandLatin AmericaSub-Saharan Africa
Indian Subcont.
NA/ME/CA
E/SE Asia48,210
58,039 58,967 2.0%
5.3%
-0.3%
-2.1%
1.9%
APPLE PRODUCTION VOLUME BY REGIONNew Zealand is a relatively minor apple producer losing global market share to Asian fruit
Global apple production by super-region (t, m, 1994-2004)
CAGR(94-04)
2.4%2.4%1.4%0.6%
0.5%
Discussion Points
• What capacity does China have to export apples? What quality is the fruit?

45
Mapping
Arable and Horticulture
219 285 329
2,9323,076
3,892
65
7
393426
419
4256
76
336400
394
730
81
470
600
717
1994 1999 2003
Global apple imports by super-region (t, m, 1994-2003)
USA/Canada
Europe/Russia
OceaniaLatin AmericaSub-Saharan Africa
Indian Subcont.NA/ME/CA
E/SE Asia
4,404
4,878
5,914 3.3%
4.8%
31.8%
4.6%
1.8%
CAGR
APPLE IMPORT VOLUME BY REGIONEurope is the major global apple importer
(94-03)
6.9%0.7%2.1%
3.2%
Discussion Points
• What is the long term outlook for apple consumption in Europe?
Source: MAF; SONZAF; UN; FAO; Coriolis analysis

46
Mapping
Arable and Horticulture
$60$108 $90
$224
$344$329
$4
$4
$6
$2
$0
$1
$0
$1
$0
$1
$3$4
$45
$69
$49
1994 1999 2004
New Zealand apple export value by destination(NZ$, m, 1994-2004)
Source: NZ Customs data; NZTE; Coriolis Research
$336
$530
$480 3.6%
0.9%14.0%
CAGR
NEW ZEALAND APPLE EXPORT VALUE BY DESTINATIONWhile apple export sales are up over the past decade, they have declined in the past five years
(94-04)
Discussion Points
• Why are apple sales falling?
USA/Canada
Europe/Russia
NA/ME/CAE/SE Asia
3.7%Oceania
4.0%
4.1%

47
Mapping
Arable and Horticulture
NEW ZEALAND APPLE EXPORT VALUE PER KILO BY DESTINATIONNew Zealand export apple prices are falling around the world
New Zealand apple export value per kg by destination(NZ$, 1994-2004)
Source: NZ Customs data; NZTE; Coriolis Research
$-
$0.20
$0.40
$0.60
$0.80
$1.00
$1.20
$1.40
$1.60
$1.80
$2.00
USA/Canada Europe E/SE Asia
Discussion Points
• Why are apple prices falling?
94 98 04

48
Mapping
Arable and Horticulture
36 25 24
486 485 504
5 3 4
221 217270
116 105
1252 22
22102219
462
1994 1999 2004
Global kiwifruit production by super-region (t, 000, 1994-2004)
USA/Canada
Europe/Russia
Australia
New Zealand
Latin AmericaNA/ME/CA
966
1,076
1,412 3.9%
-3.9%
27.8%
CAGR
KIWIFRUIT PRODUCTION VOLUME BY REGIONWhile New Zealand created the kiwifruit industry, it is now the third largest producing region
(94-04)
0.8%
2.0%
-1.2%
0.4%
Discussion Points
• China is the home of the Chinese Gooseberry (57,500ha vs. 12,357ha in NZ); at what production volume will China export significant quantities?
• Why isn’t kiwifruit production growing significantly outside China given its low global per capita consumption?
• Why isn’t fruit production growing in Europe? or Latin America?
Notes
• There are multiple different sources and estimates of global kiwifruit production which do not always agree
• Zespri believes Asian (specifically Chinese) production is lower (~300Mt)
E/SE Asia 16.4%
Source: MAF; SONZAF; UN; FAO; Huang & Ferguson; Coriolis estimates and analysis

49
Mapping
Arable and Horticulture
129
223 19623813
212218
259
9
85 101
111
31
155 141
137
1987 1994 1999 2003
NewZealand
Italy
Other
181
657
Discussion Points
• Have we reached a stable state?
Notes
• There are multiple different sources and estimates of global kiwifruit exports which do not always agree; we welcome revised data
Source: MAF; SONZAF; UN; FAO; Huang & Ferguson; Coriolis estimates and analysis
675
744Volume
KIWIFRUIT EXPORTS REGIONThree countries account for over 80% of kiwifruit exports
Global kiwifruit export volume by select country(t, 000, 1987-2003)
% of volume
71%
33% 30% 32%
7%
31%33%
35%
5%
13% 15%15%
17%23% 21% 18%
1987 1994 1999 2003
Chile

50
Mapping
Arable and Horticulture
33 60 47
390
478
605
11
17
4
31
17
1
1
3
16
59
72
93
1994 1999 2003
Global kiwifruit imports by super-region (t, 000, 1994-2003)
USA/Canada
Europe/Russia
OceaniaLatin AmericaNA/ME/CA
E/SE Asia
486
656
796 5.6%
5.3%
50.7%
CAGR
KIWIFRUIT IMPORT VOLUME BY REGIONEurope is the major global kiwifruit importer
4.0%
(94-03)
16.6%11.2%
Discussion Points
• What is driving the growth of imports in the Arabic world and Latin America?
Source: MAF; SONZAF; UN; FAO; Coriolis analysis
5.0%

51
Mapping
Arable and Horticulture
$14 $25 $24
$204$257
$393$16
$17
$32
$12
$1
$3
$5
$6
$5
$142
$157
$349
1996 1999 2004
New Zealand kiwifruit export value by destination(NZ$, m, 1996-2004)
Source: NZ Customs data; NZTE; Coriolis Research
$392
$464
$808 9.4%
11.9%
0.3%
CAGR
NEW ZEALAND KIWIFRUIT EXPORT VALUE BY DESTINATIONThe value of New Zealand kiwifruit exports are growing strongly, with Europe and Asia accounting for the bulk of sales
(96-04) Discussion Points
• How sustainable is the recent value growth? Will this rate of growth continue?
Notes
• Uses 1996-2004 data as prior to 1996 customs data classifies kiwifruit within “fruit nesoi, fresh”
USA/Canada
Europe/Russia
NA/ME/CA
E/SE Asia
Oceania 8.9%Latin America -16.1%
8.6%
7.1%

52
Mapping
Arable and Horticulture
NEW ZEALAND KIWIFRUIT EXPORT VALUE PER KILO BY DESTINATIONNew Zealand gets dramatically better returns for kiwifruit in Asia than the rest of the world
New Zealand kiwifruit export value per kg by destination(NZ$, 1996-2004)
Source: NZ Customs data; NZTE; Coriolis Research
$-
$0.50
$1.00
$1.50
$2.00
$2.50
$3.00
$3.50
$4.00
USA/Canada Europe Oceania Latin America NA/ME/CA E/SE Asia
Discussion Points
• Why does Asia (Japan) pay significantly more than anywhere else for fruit?
• Why is the relative gap widening (vs. Europe)? How sustainable is this situation?
Notes
• Uses 1996-2004 data as prior to 1996 customs data classifies kiwifruit within “fruit nesoi, fresh”
96 98 04
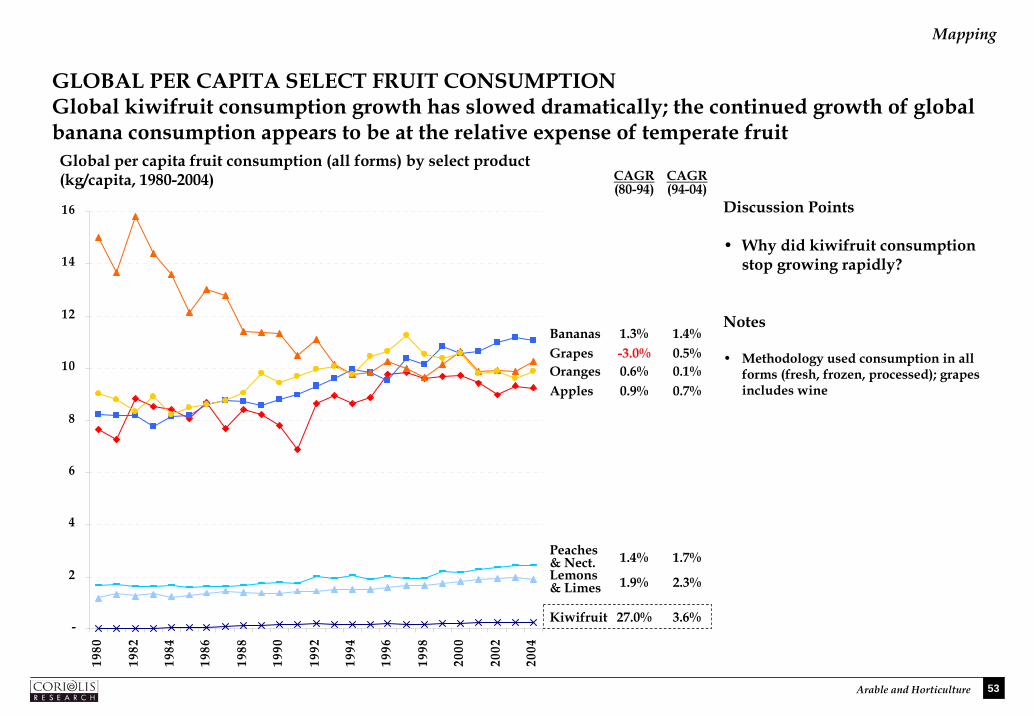
53
Mapping
Arable and Horticulture
GLOBAL PER CAPITA SELECT FRUIT CONSUMPTIONGlobal kiwifruit consumption growth has slowed dramatically; the continued growth of global banana consumption appears to be at the relative expense of temperate fruit Global per capita fruit consumption (all forms) by select product (kg/capita, 1980-2004)
GrapesOrangesApples
Peaches& Nect.
CAGR
Discussion Points
• Why did kiwifruit consumption stop growing rapidly?
Notes
• Methodology used consumption in all forms (fresh, frozen, processed); grapes includes wine
-3.0%0.6%0.9%
1.4%
(80-94)
Lemons& Limes 1.9%
Kiwifruit 27.0%
0.5%0.1%0.7%
CAGR
1.7%
(94-04)
2.3%
3.6%-
2
4
6
8
10
12
14
16
1980
1982
1984
1986
1988
1990
1992
1994
1996
1998
2000
2002
2004
Bananas 1.3% 1.4%

54
Mapping
Arable and Horticulture
AVOCADO OPPORTUNITYThe experience of Chile – a country that shares our seasonal window – indicates avocados are a major opportunity
0
5,000
10,000
15,000
20,000
25,000
1961
1965
1969
1973
1977
1981
1985
1989
1993
1997
2001
Avocado area: Chile vs. New Zealand(hectare, actual, 1961-2004)
Source: MAF; SONZAF; UN; FAO; Huang & Ferguson; Coriolis estimates and analysis
New Zealand
Chile Discussion Points
• Why has Chile been more successful than New Zealand at avocados to date?
• Can we apply our skills at plant breeding to develop new varieties?

55
Mapping
Arable and Horticulture
DIRECTIONAL TREND – VEGETABLESFrom the limited data available, the vegetable industry does not look healthy
Directional trends in vegetable farming(growth or decline)
Discussion Points
• Why?
Notes
• Limited data available
• Differing time periods (e.g. turnover 5 years vs. land use 17 years)
• Use with caution; should be treated as directional; different surveys; different methods; different definitions
• Details available on specific pages
Source: various (see detail pages); Coriolis analysis
Land Use(82-02 (95-02)
Prod-uction(94-04)
# of Growers(97-04)
Employ-ment(85-98
Turnover(98-03)
Overall ▲ ▼ ▼ ▼ ▼ ▲Potatoes ▲ = ▲ ▼ n/a n/a
Onions ▲ ▼ ▼ ▼ n/a n/a
Squash ▲ ▼ ▼ ▼ n/a n/a
Carrots ▲ ▼ ▼ ▼ n/a n/a
Other ▲ ▼ ▲ ▼ n/a n/a
Peas & beans ▼ ▼ ▼ ▼ n/a n/a
Sweetcorn ▲ ▼ ▲ ▼ n/a n/a
Broc/Cab/Cauli ▲ ▼ ▲ ▲ n/a n/a
Asparagus ▼ ▼ ▼ ▼ n/a n/a

56
Mapping
Arable and Horticulture
8,991 10,588 10,611
2,5335,697 5,488
12,143
11,6679,108
2,404
7,383
6,3842,196
3,954
3,746
2,271
2,868
2,015
997
2,403
1,831
-
7,509
6,560
6,146
9,367
7,144
1982 1995 2002
Onions
Peas & beans
Sweetcorn
Squash
Broc/Cab/CauliAsparagus
37,681
61,436
52,887
Change in vegetable land use(hectares, 1985-2002)
CHANGE IN LAND USE – VEGETABLES Land used in vegetable production is declining significantly
+2,955
AbsoluteChange
-209
-2,559
-999
-949
-208-853
20 years 10 years
+15,206 -8,549
Source: SNZ Agricultural Production survey; MAF; Vegfed; Hort Research; Coriolis analysis
Discussion Points
• Competition from China in vegetables
Notes
• No data or additional breakdown available for 1985
• Sweetcorn (as opposed to maize silage) is classified as a vegetable by Vegfed
• No olive or nut data available for prior periods; data included in other fruit nec
Potatoes
Other vegetables -2,223
Carrots -572
+1,550-256+834
+1,620 +23
-3,035
+3,980
n/a
+998

57
Mapping
Arable and Horticulture
1,722
2,915
2,300
11
25
20
1985 1995 2002
Number of vegetable farms(farms, actual, 1985-2002)
Vegetables
Mushrooms
1,733
2,940
2,320
+578
+9
Absolute
CHANGE IN NUMBER OF FARMS BY TYPE – VEGETABLESAfter a period of growth between 1985 and 1995, the number of vegetable farms has declined recently
Change
-615
-5
17 years 10 years
Source: SNZ Agricultural Production survey; MAF; Coriolis analysis
Discussion Points
• Why is this happening? Will it continue?
• What is the role of economies of scale?
Notes
• No by type breakout available from this source; see later page for breakout from a different source
• Excludes plant nurseries (1,400) and cut flower and flower seed growing (1,100) as these are not food
• Mushrooms are not technically a vegetable

58
Mapping
Arable and Horticulture
666
336
304
216
77 60 51
18 4 1
293
273
190
95 95
140
90
32
1,11
5
Under 5 5-9 10-19 20-39 40-59 60-99 100-199 200-399 400-799 800+
Number of vegetable farms by size(#of farms, by size of farm, hectare, 1985-2002)
Note: total does not add exactly to number of farms given previously due to rounding at SNZ source Source: SNZ Agricultural Production survey; MAF; Coriolis analysis
Discussion Points
• Is polarisation taking place?
• Role and impact of lifestyle farms
• Relative impact of economies of scale by farm type
Notes
• Defined as farms registered for GST purposes (+$30,000pa)
• Excludes flowers/plant nurseries (2,500)
NUMBER OF FARMS BY SIZE - VEGETABLESThe overall growth in the number of vegetable farms over the past two decades has been at either end of the spectrum
ProbablyLifestyle
+241
+449
1985
2002
0

59
Mapping
Arable and Horticulture
470 321 292
183150 139
1,080
748 681
400
326282
203
181181
252
277270
390
201149
170
139120
2,735
1,425
485
1997 2002 2004
Number of vegetable growers(farms, actual, 1985-2002)
5,883
3,768
2,599
Absolute
CHANGE IN NUMBER OF GROWERS BY TYPE – VEGETABLESThe number of vegetable growers has declined sharply recently
Change97-04
Source: Hort Research/Vegfed; Coriolis analysis
Discussion Points
• Why is this happening? Will it continue?
• What is the role of economies of scale?
Notes
• Note different definition and time period than previous
• This source (Hort Research) varies significantly from previous source (SNZ); may count multiple crops by a single farm?
Onions
Peas & beans
SweetcornSquashBroc/Cab/CauliAsparagus
-44
-399
-118-22+18-241
Potatoes -178
Other vegetables -2,250Carrots -50
-3,284

60
Mapping
Arable and Horticulture
418500 500
307220 242
883820 808
1994 1999 2004
Vegetable production by type(tonnes, thousands, 1994-2004)
Source: MAF; FAO; Coriolis analysis
Discussion Points
• Flat production from declining land and farms implies strong productivity increase (?)
Notes
• Data based on MAF estimates and is not robust
Potatoes
Onions
1,6081,540 1,550
1.8%
-2.3%
0.2%
CAGR
PRODUCTION - VEGETABLESVegetable production is flat
(94-04)
Other vegetables -0.9%
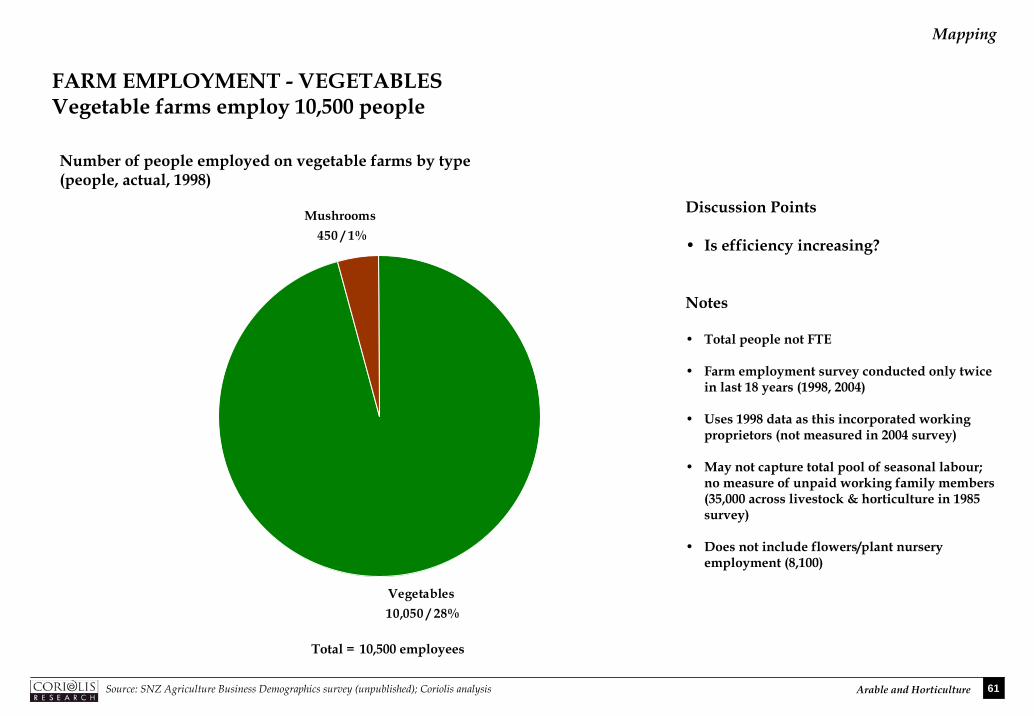
61
Mapping
Arable and Horticulture
Mushrooms 450 / 1%
Vegetables 10,050 / 28%
Number of people employed on vegetable farms by type(people, actual, 1998)
Discussion Points
• Is efficiency increasing?
Notes
• Total people not FTE
• Farm employment survey conducted only twice in last 18 years (1998, 2004)
• Uses 1998 data as this incorporated working proprietors (not measured in 2004 survey)
• May not capture total pool of seasonal labour; no measure of unpaid working family members (35,000 across livestock & horticulture in 1985 survey)
• Does not include flowers/plant nursery employment (8,100)
Total = 10,500 employees
FARM EMPLOYMENT - VEGETABLESVegetable farms employ 10,500 people
Source: SNZ Agriculture Business Demographics survey (unpublished); Coriolis analysis

62
Mapping
Arable and Horticulture
$664
$886
1999 2003
Total vegetable farm turnover(dollars, millions, 1999-2003)
7.5%
CAGR
FARM TURNOVER GROWTH – VEGETABLES Total vegetable farm turnover has grown at a compound rate of 7.5% in the past four years
98-03
Source: SNZ Annual Enterprise Survey; Coriolis analysis
Discussion Points
• What is driving turnover growth?
Notes
• Actual dollars; not inflation adjusted
• No additional breakdown available at source
• AES 2004 data not yet available
• Comparable data not available for prior periods
• Methodology defines farm by primary income source

63
Mapping
Arable and Horticulture
$7 $6$9
$8$16
$22
$19
$31
$39
1994 1999 2004
Vegetable imports by segment(dollars, millions, 1994-2004)
$34
$71
Tomatoes
Other fresh vegetables
Processedvegetables
2.5%
11.0%
7.6%
CAGR(94-04)
7.7%
+$2
+$14
+$20
AbsoluteChange(94-04)
+$37
Source: WTA; SNZ; Coriolis analysis
Discussion Points
• Drivers of growth of processed vegetables
Notes
• Classification:• Tomatoes (HS0702)• Other fresh vegetables (HS0701, 0703-
0709)• Processed/frozen/etc. (HS0710-0714)
$53
VEGETABLE IMPORTS BY SEGMENT Vegetable imports are showing strong growth

64
Mapping
Arable and Horticulture
Supermarkets $920 63%
Greengrocers $175 12%
Other retail $102 7%
Foodservice $270 18%
Discussion Points
• Relative importance of non-supermarket channels
Notes
• Excludes highly processed products (i.e. primarily fresh) and ingredient purchases by manufacturers
• Aggregate market is 47% fruit and 53% vegetables
• Represents wholesale purchases of fruit & vegetables (only
DOMESTIC MARKET – FRUIT & VEGETABLESThe domestic market for fruit & vegetables has wholesale purchases of $1,468 million, of which $778m is vegetablesWholesale purchases of fruit & vegetables by segment(dollars, millions, 2004)
Source: SNZ HHES; SNZ RTS; Coriolis Foodservice in New Zealand; Coriolis analysis
) at cost to segment not retail sales to consumers (e.g. Greengrocers have turnover of $283m of which 75.6% is f&v on which they took an average gross margin of 22% for a wholesale cost of $175m)
OutsideSupermarkets
37%
Total = $1,468 millionof which 53% vegetables = $778m

65
Mapping
Arable and Horticulture
$84 $105 $93
$13$18
$13$1
$12$24
$94
$100$84
$4
$9 $33$36
$38 $35
$7
$15$56
$88
$118
$126
$33
$15
$23
$58
$83
$91
1994 1999 2004
Vegetable exports by segment(dollars, millions, 1994-2004)
$419
$513
$579
Onions
Other fresh vegetables
Shelled beans
1.0%
-1.1%
22.8%
CAGR(94-04)3.3%
+$9
-$10
+$29
AbsoluteChange(94-04)+$160
Other preservedvegetables -3.8% -$11
Source: WTA; SNZ; Coriolis analysis
Discussion Points
• Growth of frozen french fries
• Shelled beans?
Notes
• Revised classifications from earlier document• Includes misc grains, seeds (HS12),
Potatoes -0.02% -$0.03Capsicums 40.2% +$23
Dried vegetables -0.2% -$1
Frozen french fries 22.7% +$49
Frozen vegetables 3.6% +$38
Oils, seeds & misc. grains 4.7% +$33
VEGETABLE EXPORTS BY SEGMENT While vegetables are showing below average growth, there are some stars

66
Mapping
Arable and Horticulture
INDUSTRY STRUCTURE – FRUIT & VEGETABLE PROCESSING & WHOLESALINGThe fruit and vegetable sector is composed of three distinct segments
– Three distinct segments:
– Fresh fruit primarily for export (Zespri, T&G/Enza)
• Structure are products of historic government-mandated monopsonies (producer boards)
• Built on historical new product development (Gala & Braeburn Apples, Kiwifruit)
• Highly focused on exports to a small number of high income countries
• Large players have a narrow focus (kiwifruit, apples) unlike global fruit companies (e.g. Dole)
– Fresh fruit & vegetable wholesale for domestic consumption (T&G, MG Marketing, Freshmax)
• Ongoing evolution away from market floor to integrated wholesalers
• Three key customer segments: supermarket chains, greengrocers and foodservice
– Processed/frozen vegetables (Heinz Watties, McCain)
• Strong role of global multinational leaders (Heinz, McCain)
• Significant value-added through processing/packaging

67
Mapping
Arable and Horticulture
KEY COMPANIES – FRUIT & VEGETABLE PROCESSING & WHOLESALINGThere are a small number of large players
CompanyTurnover(NZ$; m) Employees Ownership Activities
Heinz Watties (NZ) $1,025 600 +1,000 seasonal
United StatesPublic Listed
– Production of a range of vegetable-based and other grocery items (incl. Tegel $598m in total)
New ZealandCooperative
Turners & Growers $563 1,449 New ZealandPublic Listed
– Fruit wholesaling and processing– 78% owned by GPG; 10% by Noboa of Ecuador
McCain Foods (NZ) $263 400 CanadaPrivate
– Frozen vegetables processing
MG Marketing $90 325 New ZealandCooperative
– Fruit & vegetable wholesaling, importing and exporting
New ZealandPrivate
Zespri Group $920 135 – Kiwifruit processing and marketing
Freshmax ? 300 – Fruit & vegetable wholesaling, importing and exporting
Key companies in the fruit & vegetable manufacturing and wholesaling sector
Source: Management magazine Top 200; NZ Companies Office returns; press reports; interviews; Coriolis analysis

68
Mapping
Arable and Horticulture
MARKET SHARE – FRUIT & VEGETABLE PROCESSING & WHOLESALINGWhile there are strong players in fruit & vegetable processing and wholesaling, there are also a lot of smaller companiesNew Zealand fruit & vegetable processing and wholesaling turnover market share(% of sales; 2004)
Discussion Points
• Implications of large size of “other”
Notes
• Combines processing and wholesaling
• Market share represents New Zealand wholesale domestic sales and export sales (at border); does not include international sales or margins
• Excludes wine (which was included in previous draft report)
Source: Hort Research; SNZ AES; company annual reports; various published articles; Coriolis analysis and estimates
Zespri $920 20%
Heinz Watties $598 13%
Turners & Growers
$563 12%
McCain $263 6%
Other $2,356
49%

69
Mapping
Arable and Horticulture
ACQUISITIONS – FRUIT & VEGETABLEThere have been a number of acquisitions recently in the fruit and vegetable sector
Acquiror Acquiree Date Notes
Turners & Growers
Enza Dec 2002 Merger engineered by GPG of a domestic wholesaler and a apple exporter
Guinness Peat Group
Turners & Growers GPG acquired 46% of wholesale fruit & vegetable wholesale market business
SK Foods Cedenco May 2001 Commodity vegetable processor bids initially for 54.8% for $12.5m (bids in 2003 for remainder shares)
Guinness Peat Group
Enza May 2002 GPG acquired former Apple and Pear Marketing Board from farmer shareholders on deregulation for $72m
Turners & Growers
Status Produce Ltd. May 2002 Acquires tomato grower and wholesaler
McCain Heinz Fielding frenchfries and vegetable operations
May 2001 Frozen potatoes & vegetables business for $51m
Cedenco Heinz Gisborne frozen food operations
Oct 1999 Cedenco acquires Heinz Gisbourne frozen food operations with turnover of approximately $7m
Source: various published articles

70
Mapping
Arable and Horticulture
FRUIT & VEGETABLE PROCESSING TURNOVER GROWTHFruit & vegetable processing has show good growth, albeit with up and downs
Fruit & vegetable processing turnover(dollars, millions, 1996-2003)
CAGR(96-03)
5.4%
Discussion Points
• Reasons for recent decline?
Notes
• Processing turnover only; no separate data availability in AES on f&v wholesale; No data available prior to 1996 (AES); 2004 data not yet available
Source: SNZ AES, company annual reports; various published articles; Coriolis analysis and estimates
$0.80
$1.24
$1.16
1996 1999 2003

71
Mapping
Arable and Horticulture
3,8104,300 4,570
1,8601,560
2,480
1994 1999 2003
Discussion Points
• Cause of recent jump in food proemployment
Source: SNZ Business Demographics survey; Coriolis analysis
FRUIT & VEGETABLE PROCESSINGThe number of enterprises and employment in the sector is growing
cessing
Fruit & vegetable processing statistics(enterprises, employees, actual, 1994-2003)
Enterprises Employees
5,670
7291 106
183
192
242
1994 1999 2003
Processing
Wholesaling
255
283
348
5,860
7,050
AbsoluteChange(94-03)
+93 3.5%
CAGR(94-03)
+59
+34
3.2%
4.4%
AbsoluteChange(94-03)
+1,380 2.4%
CAGR(94-03)
+620
+760
3.2%
2.0%

72
Mapping
Arable and Horticulture
0
10
20
30
40
50
60
1994 1999 2003
Processing
Wholesaling
Absolute
FRUIT & VEGETABLE PROCESSINGEmployment per enterprise is flat in wholesaling and declining in processing
Discussion Points
• What is driving more, smaller f&vprocessing enterprises?
Source: SNZ Business Demographics survey; Coriolis analysis
Fruit & vegetable employees/enterprise(employees, actual, 1994-2003)
Change(94-03)
CAGR(94-03)
-9.8
+0.1
-2.3%
0.1%
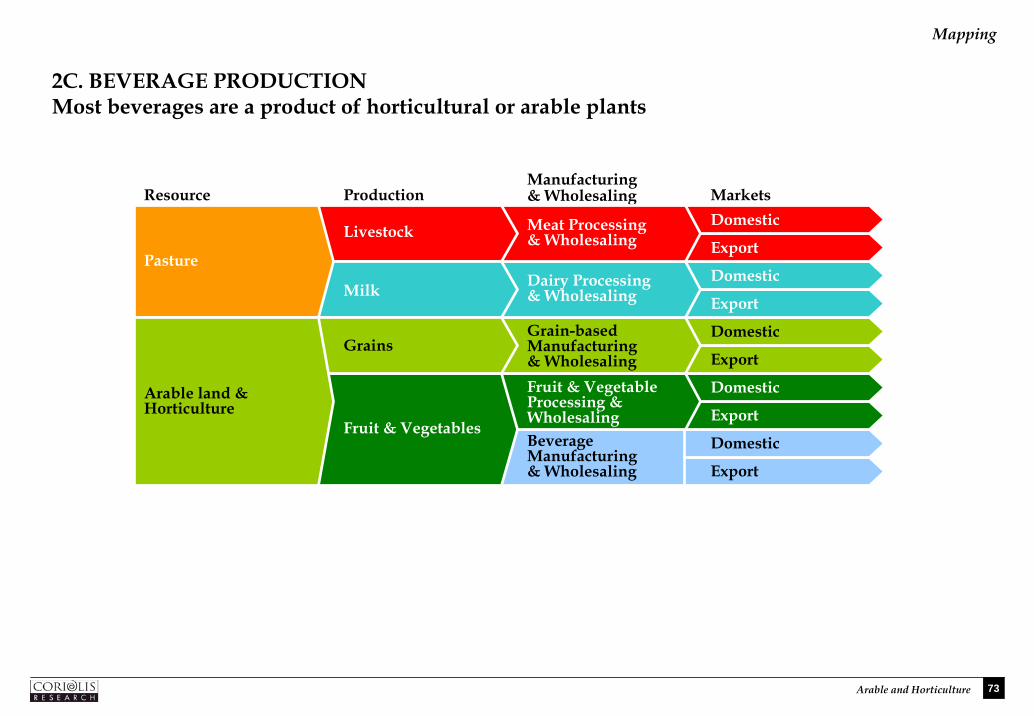
73
Mapping
Arable and Horticulture
2C. BEVERAGE PRODUCTION Most beverages are a product of horticultural or arable plants
Resource ProductionManufacturing& Wholesaling Markets
Domestic
Export
Domestic
Export
Fruit & Vegetable Processing &WholesalingFruit & Vegetables
Domestic
Export
Grain-basedManufacturing& Wholesaling
Domestic
Export
Pasture
Livestock Meat Processing& Wholesaling
Domestic
Export
Milk Dairy Processing& Wholesaling
Arable land & Horticulture
Grains
Beverage Manufacturing& Wholesaling

74
Mapping
Arable and Horticulture
INDUSTRY STRUCTURE – BEVERAGESThe beverage industry is now primarily controlled by international players
Three alcoholic segments and non-alcoholic:
– Beer brewing is a low growth duopoly controlled by two international companies
– Lion Nathan, founded in New Zealand, listed/based in Australia since 2000, 46% owned by Kirin (Japan)
– Dominion Breweries, founded in New Zealand, now owned by Asia-Pacific Breweries (Heineken/F&N)
– Wine production is a fast growing industry for New Zealand with a number of large players
– Many wineries are now foreign owned (Montana, Nobilo); ongoing acquisitions are occurring
– Large group of small-to-medium sized New Zealand owned wineries who are capital constrained
– Spirits consists of Independent Liquor and a number of wholesalers of international brands
– Non-alcoholic beverages is a duopoly controlled by two international companies
– Coca-Cola Amatil, Australian-listed Asia-Pacific licensee of Coca-Cola
– Frucor, former Apple & Pear Marketing Board Juice Business, now a division of Danone
– Smaller innovators emerging outside soft-drinks/water (e.g. Phoenix, Charlie’s)

75
Mapping
Arable and Horticulture
KEY COMPANIES – BEVERAGESThe beverage industry is a mixture of local operations of international players and local companies
CompanyTurnover
(NZ$; m; 2004) Employees1 Ownership ActivitiesNew Zealand Breweries $611 ? Australia
Public ListedIndependent Liquor $500 ? New Zealand
Private– Produces RTD spirits, beer and wine– Operations in NZ, AU, Europe and Asia (incl. in sales)
Negociants (NZ) $33.2 ? AustraliaPrivate
– Wine importer– Owned by Yalumba Australia
Coca-Cola Amatil (NZ) $433 980 AustralianPublic Listed
– Soft drink production
Pernod Ricard $397 1,300 FrancePublic Listed
– Wine production– Formerly Allied Domecq Wines / Montana Wines– Diageo option to buy most of business
Tasman Liquor Company $170 140 AustralianPublic Listed
– Liquor wholesaler– Subsidiary of ALM/Metcash
DB Breweries $318 408 NL/SingPublic
– Beer production– Owned by Asia-Pacific (38% F&N; 62% Heineken)
NZ Wines and Spirits $188 ? AustraliaPublic Listed
– Wine production– Lion Nathan subsidiary
FrancePublic Listed
AustraliaPublic Listed
Villa Maria ? 280 New ZealandPrivate
– Wine production
Delegats $32 refused New ZealandPrivate
– Wine production
AustralianPublic Listed
– Produced beer; Lion Nathan subsidiary– Lion is 46% owned by Kirin Breweries (Japan)
Frucor Beverages $303 450 – Soft drink production– Owned by Danone
Nobilo Wines A$89 230 – Subsidiary of Hardys– Owns National Liquor Distributors
Southcorp NZ $28 52 – Australian wine producer– Southcorp Australia recently acquired by Fosters
Key companies in the beverage manufacturing and wholesaling sector
1. Excludes seasonal employees; Source: Management magazine Top 200; NZ Companies Office returns; press reports; interviews; Coriolis analysis

76
Mapping
Arable and Horticulture
MARKET SHARE - BEVERAGES Six companies control about 90% of the New Zealand beverage industry
New Zealand beverage sales market share(% of sales; 2004)
Source: company annual reports; various published articles; Coriolis analysis and estimates
NZ Breweries $611 22%
DB Breweries $318 11%
Independent $500 17%
Pernod Ricard $397 14%
Coca-Cola NZ $433 15%
Frucor $303 10%
Other $325 11%
Discussion Points
• Why is this dominated by global multinationals? What are the implications of your answer to the overall New Zealand food industry?
Notes
• No data available on size of wholesale sector
• Market share represents New Zealand wholesale domestic sales and export sales (at border); does not include international sales or margins
• Attempts to remove tobacco data by removing BAT turnover ($1,027m in 2003)

77
Mapping
Arable and Horticulture
ACQUISITIONS – BEVERAGES (NON-WINE)There have been a number of significant acquisitions in the non-wine beverages sector
Acquiror Acquiree Date Notes
Asia-Pacific Breweries
DB Breweries Sept 2004 Major shareholder acquired remainder of company; delisted
Coca-Cola AmatilNZ
Rio Beverages Nov 2002 Rio Gold, Keri, Thextons, Kiwi Blue with turnover of $22m
Kirin Japan 46% of Lion Nathan April 1998 Kirin Japan (US$15.5b); Japan #1; acquires 45% (later 46%) of Lion Nathan
Just Water Aqua-Cool Apr 2004 Water delivery business
Fosters Appletiser(distribution)
Feb 2004 From Coca-Cola Amatyl
Danone Group Frucor Beverages Feb 2002 Production of V energy drink, Freshup, Just Juice, and NZ license for Pepsi for $294m
Source: various published articles

78
Mapping
Arable and Horticulture
ACQUISITIONS – BEVERAGES (WINE)The New Zealand wine sector has attracted significant international investment…
Acquiror Acquiree Date Notes
Delegat’s Oyster Bay July 2005 Following takeover battle
Villa Maria Estate
Thornbury Wine July 2005 Marlborough winery with 1 contract growers and 1,200 litres of fruit
Aster Family De Redcliffe Winery Apr 2002 Aster family of Oregon purchases De Redcliffe
Rangitira Te Kairanga 2002 Rangitira (JR Mckenzie Trust) acquires 25% share of Te Kairanga Wines
Lion Nathan Wither Hills 2002 For $52m; produced 80,000 cases in 2002
Fosters (Au) Ponder Estate 2002 Fosters/Beringer Blass acquires Ponder Estate in Marlborough; producing 28,000 cases on 23 ha for $11.1m
Fosters (Au) Hawkesbridge 2002 Matua Wines purchases Hawkesbridge, including 16ha in Marlborough, producing 10,000 cases Sauvignon Blanc
Pernod Ricard Allied Domecq NZ companies
July 2005 $7.5b dealPernod seeking to split business between Fortune Brands and Diageo (Montana Wines for $834m)
Vincor International (CAN)
Kim Crawford 2003 For $18m; aiming to process 4,000 T grapes in 2005
Pernod Ricard(Orlando Wyndham)
Framingham Wine Co. Apr 2004 Established 1991; includes Tylers Stream brand
Allied Domecq Montana Wines 2001 For ~$1b
Source: various published articles

79
Mapping
Arable and Horticulture
ACQUISITIONS – BEVERAGES (WINE)… continued
Acquiror Acquiree Date Notes
Fosters (Au) Matua Valley 2001 Foster’s subsidiary Beringer Blass acquires 43%; raised to 100% in 2004
Montana Wines Corbans Wines Sept 2000 Montana buys Corbans, then a subsidiary of DB Breweries for $154m
BRL Hardy Nobilo Wines 2000 Acquires additional shares; now part of Constellation Brands
Nobilo Wines Selaks Wines Sept 1998 -
BRL Hardy Nobilo Wines 1998 BRL Hardy acquires 33% of newly listed Nobilo Wines
Source: various published articles

80
Mapping
Arable and Horticulture
$1.5
$3.1
$3.9
1996 1999 2003
CAGR
BEVERAGE/TOBACCO PROCESSING TURNOVER GROWTHThe beverages/tobacco sector is showing strong growth
Beverage/Tobacco manufacturing turnover(dollars, millions, 1996-2003)
(96-03)14.7%
Source: SNZ AES, Coriolis analysis and estimates
Discussion Points
• Drivers of growth – why are we succeeding in beverages?
Notes
• Unable to separate Beverage and Tobacco data, refer all queries/complaints to Statistics New Zealand
• Processing turnover only; no separate data availability in AES on wholesale; no data available prior to 1996 (AES); 2004 data not yet available

81
Mapping
Arable and Horticulture
21 29 37
3345
46
108
139
1796
10
16
1994 1999 2003
Discussion Points
• What is needed to encourage cogrowth
Source: SNZ Business Demographics survey; Coriolis analysis
Beverage manufacturing enterprises by sub-sector(enterprises, actual, 1994-2003)
168
223
278
+16
+13
+71
Absolute
BEVERAGE MANUFACTURING ENTERPRISESThe number of beverage enterprises is growing across the board
ntinued
Change(94-03)
+110 5.2%
5.2%
3.4%
CAGR(94-03)
5.8%
Wine
Beer & malt
Soft drink, cordial & syrup
+10 10.3%Spirits

82
Mapping
Arable and Horticulture
7301,040
1,450
1,110
1,460
1,470700
1,160
2,020
75
50
55
1994 1999 2003
Source: SNZ Business Demographics survey; Coriolis analysis
2,615
3,710
4,995 Notes
• Includes working proprietors
• Total employees not FTE
BEVERAGE MANUFACTURING EMPLOYMENTEmployment in beverage manufacturing is growing
Beverage manufacturing employees by sector(people, actual, 1994-2003)
+720
+360
+1,320
AbsoluteChange(94-03)
+2,380 6.7%
11.2%
2.8%
CAGR(94-03)
7.1%
-20 -3.1%
Wine
Beer & malt
Soft drink, cordial & syrup
Spirits

83
Mapping
Arable and Horticulture
BEVERAGE MANUFACTURING EMPLOYMENT PER ENTERPRISEEmployment per enterprise is growing in wine and soft drinks, but declining in beer and spirits
Source: SNZ Business Demographics survey; Coriolis analysis
AbsoluteChange(94-03)
CAGR(94-03)
Beverage manufacturing employees per enterprise by sector(people, actual, 1994-2003)
Notes
• Includes working proprietors
• Total employees not FTE
-
5
10
15
20
25
30
35
40
1994 1999 2003
+4
-2
+5 5.7%
-0.5%
1.2%
-9 -12.1%
Wine
Beer & malt
Soft drink, cordial & syrup
Spirits
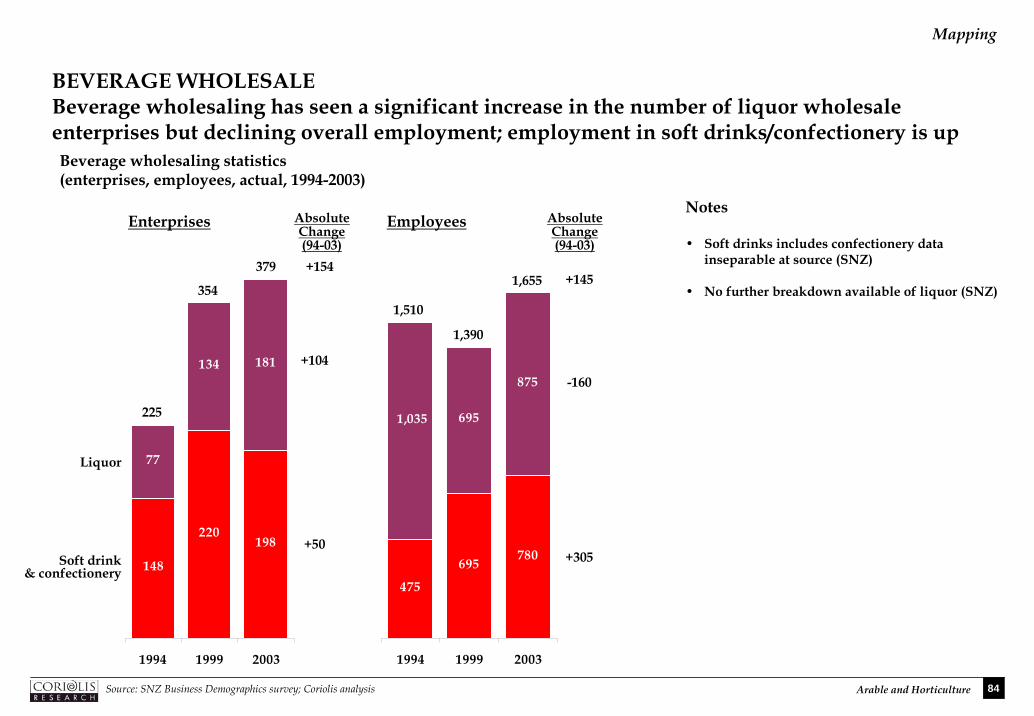
84
Mapping
Arable and Horticulture
475
695780
1,035 695
875
1994 1999 2003
148
220198
77
134 181
1994 1999 2003
Source: SNZ Business Demographics survey; Coriolis analysis
BEVERAGE WHOLESALEBeverage wholesaling has seen a significant increase in the number of liquor wholesale enterprises but declining overall employment; employment in soft drinks/confectionery is up
Notes
• Soft drinks includes confectionery data inseparable at source (SNZ)
• No further breakdown available of liquor (SNZ)
Beverage wholesaling statistics(enterprises, employees, actual, 1994-2003)
Enterprises
225
354
379 +154
AbsoluteChange(94-03)
Liquor
Soft drink& confectionery
Employees
1,510
1,390
1,655
+104
+50
+145
-160
+305
AbsoluteChange(94-03)

85
Mapping
Arable and Horticulture
$15 $27$54$24
$38
$48
$16
$24
$31
$80
$132
$156
$74
$88
$124
1994 1999 2004
Beverage imports by segment(dollars, millions, 1994-2004)
$210
$413
Source: WTA; SNZ; Coriolis analysis
Discussion Points
• Why are beverage imports growing so rapidly?
Notes
• Classification:• Soft drinks/water (HS2201-2202)• Fruit juice (HS2009)• Beer (HS2203)• Wine (HS2204-2205)• Liquor (HS2206-2209) includes very small
amount of vinegar
$309
Soft drinks/water
Fruit juice
Beer
13.4%
7.2%
6.4%
CAGR
BEVERAGE IMPORTS BY SEGMENT Beverage imports are showing strong growth
(94-04)7.0%
+$39
+$24
+$14
AbsoluteChange(94-04)+$203
Wine 6.9% +$76
5.2% +$49Liquor

86
Mapping
Arable and Horticulture
Supermarkets $1,020
36%
Liquor stores $820 28%
Other retail $210 7%
Bars, Taverns, Pubs & Clubs
$680 23%
Foodservice $180 6%
Discussion Points
• Relative importance of non-supermarket channels
Notes
• Represents wholesale purchases of beverages at cost to channel not retail sales to consumers
• Includes soft drinks, mineral water, fruit juices and other retail beverages
Total = $2,910 million
DOMESTIC MARKET – BEVERAGESThe domestic market for beverages has wholesale turnover of $2,910 million
Wholesale purchases of beverages by channel(dollars, millions, 2004)
Source: SNZ HHES; SNZ RTS; interviews; Coriolis Foodservice in New Zealand; ACNielsen; Coriolis analysis & estimates

87
Mapping
Arable and Horticulture
$8 $19$72$37 $29
$48
$24 $16
$19
$44
$146
$370
$26
$44
$62
1994 1999 2004
Beverage exports by segment(dollars, millions, 1994-2004)
$139
$254
$570
Soft drinks/water
Fruit juice
Beer
25.2%
2.7%
-2.4%
CAGR(94-04)
15.2%
+$64
+$11
-$5
AbsoluteChange(94-04)
+$431
BEVERAGE EXPORTS BY SEGMENT While wine is the undisputed star of the beverages segment, soft drinks/water and liquor are also showing strong growth
Wine 23.6% +$325
9.0% +$36
Source: WTA; SNZ; Coriolis analysis
Liquor
Discussion Points
• How can we facilitate the continued growth of wine?
• Potential for soft drinks/water and liquor
• Why are countries as diverse as Germany and Mexico able to export lots of beer but we can’t?
• Relatively low net exports of beverages (exports – imports)
Notes
• Fruit juice primarily apple
• Revised classifications from earlier document• Beverages includes HS22 (all), fruit juices
(HS2009) and Wine (HS2204-2206)

88
Mapping
Arable and Horticulture
17,850 21,203 20,769
183,333203,021
180,970
5,874
8,511
11,509405
602
87027,634
26,589
23,4637,972
8,059
7,2785,050
4,718
3,6624,321
6,528
12,310
1994 1999 2002
Global wine production by super-region (t, m, 1994-2002)
USA/Canada
Europe/Russia
AustraliaNew ZealandLatin America
NA/ME/CA252,439
279,231
260,8310.4%
1.9%
-3.9%
CAGR
WINE PRODUCTION VOLUME BY REGIONAustralia, Asia and New Zealand are all increasing wine production in a flat overall market
(94-02)
-2.0%10.0%8.8%
-0.2%
Discussion Points
• How sustainable is New Zealand’s recent growth rate over the next decade?
Notes
• Uses 1994-2002 data as no more recent data by country is currently available
E/SE Asia 14.0%
Sub-Saharan Africa -1.1%
Source: OIV; Coriolis analysis

89
Mapping
Arable and Horticulture
417 627 878
4,171
4,527
5,246
51
70
75
139
122
168
74
102
133
86
47
81
0
1
2
115
286
273
1994 1999 2003
WINE IMPORT VOLUME BY REGIONWhile Europe is the world’s largest importer of wine, the US/Canada and Asia are showing good growth Global wine imports by super-region (t, m, 1994-2003)
USA/Canada
Europe/Russia
OceaniaLatin AmericaSub-Saharan Africa
E/SE Asia
5,053
5,781
6,857 3.5%10.1%
8.6%
6.8%
CAGR(94-03)
2.2%4.5%
2.6%
Discussion Points
• Europe dominates world wine imports (including interregional trade)
Notes
• Includes interregional trade (e.g. France to Germany)
Source: MAF; SONZAF; UN; FAO; Coriolis analysis
NA/ME/CA -0.6%

90
Mapping
Arable and Horticulture
$3$25
$103
$36
$95
$169
$4
$20
$81
$2
$7
$14
1994 1999 2004
Source: NZ Customs data; NZTE; Coriolis Research
Discussion Points
• What lessons can the New Zealand food industry learn from the success of wine?
• How sustainable is export sales growth to Australia given it is a major producer?
• Why do we export more wine to Fiji than to France?
Notes
• ~$3m exports to rest of world in 2004 not shown
$44
$146
$367 23.6%
21.9%
CAGR
NEW ZEALAND WINE EXPORT VALUE BY DESTINATIONNew Zealand wine exports are up massively in the past decade
New Zealand wine export value by destination(NZ$, m, 1994-2004)
(94-04)
16.8%
USA/Canada
Europe/Russia
E/SE Asia
35.6%Oceania
43.5%

91
Mapping
Arable and Horticulture
NEW ZEALAND WINE EXPORT VALUE PER LITRE BY DESTINATIONNew Zealand export sales value per litre has shown very strong growth
New Zealand wine export value per lt by destination(NZ$, 1994-2002)
Source: NZ Customs data; NZTE; Coriolis Research
$-
$2
$4
$6
$8
$10
$12
$14
$16
USA/Canada Europe Oceania E/SE Asia
Discussion Points
• Why does Asia (Japan) pay significantly more than anywhere else for our wine?
• Why do we get less for our wine in Europe than in the US/Canada or Oceania?
Notes
• Uses 2002 data as 2003/04 wine volume data is not available
96 98 02

1
Mapping
Seafood
3. OCEAN BASED PRODUCTIONThe third section of this report looks at ocean based production
Resource ProductionManufacturing& Wholesaling Markets
Domestic
Export
Domestic
Export
Fruit & Vegetable Processing &WholesalingFruit & Vegetables
Domestic
Export
Grain-basedManufacturing& Wholesaling
Domestic
Export
Pasture
Livestock Meat Processing& Wholesaling
Domestic
Export
Milk Dairy Processing& Wholesaling
Arable land & Horticulture
Grains
Domestic
ExportSeafood Processing& WholesalingFish & Other SeafoodSeafood
Beverage Manufacturing& Wholesaling

2
Mapping
Seafood
SWOT ANALYSIS – SEAFOOD INDUSTRYThe era of increasing production has ended; the era of increasing value needs to begin
Strengths Weaknesses
General– Unsubsidised industry – Clean waters and generally healthy aquatic environmentWild fisheries– Quota management system providing incentives for sustainability
and industry efficiency– Stocks are generally sustainable or rebuildingAquaculture– Predictable supply– Track record of innovation and sustained growth
General– High business compliance costs– Relatively high labour costs/low labour availability – Small producer on global scaleWild fisheries– Incomplete management regime for non-commercial fisheries– Supply fluctuates with availability of fish Aquaculture– Hiatus in development caused by moratorium – New regulatory regime contains barriers to development– Reliance on small number of species
Opportunities Threats
General– Gradual removal of global fishing subsidies– Health benefits of seafood– Over half of the fish body currently going to meal and waste– Considerable opportunity to move from commodity trading to
added value products– Ecolabelling & environmental certificationWild fisheries– Opportunities beyond New Zealand watersAquaculture– Removal of aquaculture moratorium– Potential development in new species– Static global production from wild fisheries
General– Land-based activities & recreational boating threaten water
quality for aquaculture & inshore fisheriesWild fisheries– Threat to sustainability of fish stocks from unmanaged non-
commercial fishing (including amateur fishing and poaching)– Spatial erosion of access to fishing grounds (eg, marine reserves,
cable protection zones, non-commercial fishing areas)– Changing societal expectations of environmental performance Aquaculture– Biotoxin and biosecurity events– Uncertainty & high cost of obtaining access to new water space– Competition from low-cost countries (Asia, South America)
SWOT analysis of New Zealand in global seafood
Source: Seafood Industry Council not Coriolis; we differ significantly with their analysis in a number of places

3
Mapping
Seafood
DRIVERS OF INCREASED SEAFOOD OUTPUTThere are a limited number of drivers of increased seafood output
More seafood output
Morewildcatch
More farms
Key drivers of change in seafood output (model)
More ocean
Moreaquaculture New species
New species
Improved management
Improved management

4
Mapping
Seafood
POTENTIAL FOR TRANSFORMATIVE CHANGEWhile New Zealand will struggle to increase wild catch, aquaculture has excellent potential
Objective Key Driver
Potential for transformative
change Key Issues
None
Low
Medium
High
New species Medium – Contstraints on new species importation/development (e.g. carp)
Improved management
Medium – More efficient production systems
– 200 nautical mile limit already largest in world
– Potential to develop new species?
– Most quotas trending down not up indicating continued overfishing
– Measurement systems still primitive/basic– Limited scientific understanding/modeling
Improved management
More aquaculture
More farms – Ending of moratorium– Unclear long-term environmental impact
More wild catch
More ocean
New species
Potential for transformative change in seafood output (model)

5
Mapping
Seafood
RECOMMENDATIONSBased on our research, we make the following recommendations to the Taskforce
Objective Issue Recommendations
1. Focus on increasing sustainable yield over long-term time horizon
1. Investigate/develop potential markets for currently undervalued fish
1. Streamline/simplify regulations for development of marine farms
1. Review Hazardous Substances and New Organisms Act to enable free and open access to non-indigenous species required for continued innovation (no new commercial plant species imported since act introduced (ie 7 years))
Improved management
1. Ensure we have the best initial aquaculture management training program2. Explore aquaculture extension program to disseminate best practice
New species
New species
More wild catch
Better quota management
More aquaculture
Less regulation
Recommendations to Food and Beverage Taskforce to increase seafood output

6
Mapping
Seafood
OVERVIEW – MARINE FISHING & AQUACULTUREMany of the indicators for the seafood industry are not healthy
Source: various (see detail pages); Coriolis analysis
Discussion Points
• Industry undergoing consolidation?
Notes
• n/a = not available or not applicable
• Definitions and details available on relevant pages
• Differing time periods
• Use with caution; should be treated as directional; different surveys; different methods; different definitions
• Details available on specific pages
WildFishing Aquaculture
SeafoodProcessing
Number of vessels ▼ n/a n/a
Number of enterprises ▲ ▲ ▼Employment ▼ ▼ ▲Catch/Production ▼ ▲ n/a
Turnover = ▲ ▲
Directional trends in marine fishing & aquaculture(growth or decline)

7
Mapping
Seafood
NEW ZEALAND FISHERIES AREAThe New Zealand Exclusive Economic Zone (EEZ) encompasses 2.2 million square kilometres; unfortunately much of this is relatively unproductive deep water over 1,000mLimit of Exclusive Economic Zone (EEZ)(area, depth, 2004)
Area of EEZ by depth(% of area, km2, 2004)
Total = 2.2 million square kilometres
Defined as 200 nautical miles from coastline
Note: a nautical mile is 1,852 metresSource: Sealord; Ministry of Fisheries
Less than 200m
0.16%
200 to 1,000m0.5
22%
1,000m+1.6
72%

8
Mapping
Seafood
2,258
1,679
1,410
1994 1999 2004
Number of active fishing permits(permits, actual, 1994-2004)
Source: MOF data (custom job); Coriolis analysis
Discussion Points
• Drivers of consolidation
Notes
• Only those fishing permits that submitted an actual commercial catch return
CAGR
NUMBER OF ACTIVE FISHING PERMITSThe number of active fishing permits has declined sharply
(94-04)-4.6%

9
Mapping
Seafood
120 108 79
297 278 281
2,177
1,524
1,185
8863
46
38
167 32
10
2,519
1985 1994 1999 2004
1. Domestic vessel size data not available for 1985Source: SNZ Yearbook (85); MOF data (custom job); Coriolis analysis
2,7742,689
Domestic1
Foreign charteredForeign licensed
1,966
1,583
NUMBER OF COMMERCIAL FISHING VESSELSThe number of commercial fishing vessels has declined sharply in the past decade
Number of commercial fishing vessels by size and/or origin(vessels, actual, 1985-2004)
Discussion Points
• Drivers of consolidation
Notes
• Data was restricted to vessels that reported fishing by submitting a commercial catch return during the calendar year, excluding the monthly nil returns.
• The vessels overall length comes from the latest record in the MOF vessel database for the vessel for that year.
AbsoluteChange(85-04)-1,191

10
Mapping
Seafood
211
312233
239
312
206
28
28
3617
21
1237
79
32
1994 1999 2004
Total catch by fishing method(tonnes, m, 1994-2004)
Source: MOF data (custom job); Coriolis analysis
Discussion Points
• Strengths and weaknesses of trawling (85%+ of catch)
Notes
• Recognised data variation with other sources
• Represents at sea estimate (not on shore estimate of greenweight) and is not comparable with other data (i.e. landed catch)
531
752
519
Bottom trawl - single
Bottom longlining
Midwater trawl - single
Purse seining
Other
1.0%
-3.1%
-1.5%
2.4%
-1.3%
CAGR
CATCH BY FISHING METHOD Most fish are caught with two fishing methods, bottom and midwater trawling
(94-04)-0.2%

11
Mapping
Seafood
321 291 290
488 503591
385569
523
139
156178298
303
401
1994 1999 2003
Rock Lobster
Finfish Trawling
Line Fishing
Aquaculture1,631
1,822
1,983
NUMBER OF MARINE FISHING ENTERPRISES The number of marine fishing enterprises is increasing
Number of marine fishing enterprises by type(enterprises, actual, 1994-2003) Absolute
Change
-31
+103
+138
+103
Source: SNZ Business Demographics survey (custom tabulation); Coriolis analysis
Other Marine fishing nec +39
+352 Discussion Points
• Are these quota holders rather than actual fishermen?
Notes
• Enterprises registered for GST purposes (over $30,000 turnover)

12
Mapping
Seafood
NUMBER OF ENTERPRISES BY NUMBER OF EMPLOYEESMost marine fishing enterprises are run by working proprietors and have no employees
Number of marine fishing enterprises by employment size(enterprises, actual, 2004)
Source: SNZ Business Demographics survey (custom tabulation); Coriolis analysis
Discussion Points
• Why?
• Quota holders or contractors?
Notes
• Uses 2004 data which does not capture working proprietor (i.e. including # employees = none)
• Enterprises registered for GST purposes (over $30,000 turnover)
1,476
376
31 19 8 1 1
None 1 to 5 6 to 9 10 to 19 20 to 49 50 to 99 100+

13
Mapping
Seafood
NUMBER OF PEOPLE WORKING IN MARINE FISHING Marine fishing employs under 5,000 people
Rock Lobster 695 15%
Finfish Trawling 1,640 34%
Line Fishing 1,040 22%
Other Marine Fishing
323 7%
Aquaculture 1,070 22%
Discussion Points
• Relative productivity by sector
Notes
• Uses 2003 data as this includes working proprietors
• Total employees not FTE
• May not totally account for seasonal workers
Total = 4,768 people
Number of marine fishing employees by type(people, actual, 2003)
Source: SNZ Business Demographics survey (custom tabulation); Coriolis analysis

14
Mapping
Seafood
840 785 695
1,8001,450 1,640
930
1,090 1,040
281320 323
1,110
9601,070
1994 1999 2003
Rock Lobster
Finfish Trawling
Line Fishing
Aquaculture
4,961
4,6054,786
NUMBER OF PEOPLE WORKING IN MARINE FISHING The total number of people employed in marine fishing is going nowhere
Number of marine fishing employees by type(people, actual, 1994-2003) Absolute
Change
-65
-160
+110
-40
Source: SNZ Business Demographics survey (custom tabulation); Coriolis analysis
Other marine fishing nec +42
-193
Discussion Points
• Expectations of future levels of employment
Notes
• Includes working proprietors
• Total employees not FTE
• May not totally account for seasonal workers

15
Mapping
Seafood
467.1
559.1
445.9
73.3
48.8
95.4
4.9
5.5
3.9
1994 1999 2004
Source: MOF data rep log 5956 (custom job); Coriolis analysis
Fish
Molluscs
CrustaceaOther
-0.5%
2.7%
-2.3%-1.4%
546.2
616.2
546.01.0
2.7
0.8
CAGR
TOTAL LANDED SEAFOOD CATCHThe total seafood catch is no higher than it was a decade ago, with only molluscs showing growthTotal landed catch by species class(tonnes, thousands, 1994-2004)
Discussion Points
• Is this it? Is 546,000 tonnes all the fish we can ever catch in New Zealand waters?
• Implications
(94-04)0.0%

16
Mapping
Seafood
189229
135
39
36
43
33
23
17
2321
19
19
40
20
18
22
19
17
21
22
11
13
10
8
15
15
8
9
11
3
6
12
6
12
11
6
9
9
87
104
102
1994 1999 2004
TOTAL LANDED FISH CATCHTotal fish catch is down, driven by declining quotas on previously overfished species (e.g. orange roughy)Total landed fish catch by species(tonnes, thousands, 1994-2004)
Source: MOF data rep log 5956 (custom job); Coriolis analysis
Discussion Points
• Cause of decline since 1999
Notes
• Greenweight (i.e. the weight of the whole fish back calculated from the weight of the fish product when it was landed)
Hoki -3.3%
467
559
446
CAGR(94-04)
-0.5%
Jack mackerel 1.1%
Orange roughy -6.2%Oreos -2.0%Sth blue whiting 0.5%Ling 0.1%Barracouta 2.7%Red cod -1.6%Hake 6.7%Silver warehou 3.2%Skipjack tuna 14.3%Blue mackerel 7.0%Spiny dogfish 4.1%
Other 1.6%

17
Mapping
Seafood
LANDED CATCH FOR SELECT MAJOR SPECIESHoki and Orange Roughy demonstrate the boom and bust cycle of overfishing
-
50
100
150
200
250
1972
1977
1982
1986
/87
1991
/92
1996
/97
2001
/02
Source: MOF data rep log 5956 (custom job); Coriolis analysis
Discussion Points
• Lessons learned
• Prognosis?
Notes
• Greenweight (i.e. the weight of the whole fish back calculated from the weight of the fish product when it was landed)
Hoki
Total landed fish catch by select species(tonnes, thousands, 1972-2004)
Orange Roughy
-
10
20
30
40
50
1972
1977
1982
1986
/87
1991
/92
1996
/97
2001
/02

18
Mapping
Seafood
67.8
27.0
83.8
0.6
16.3
7.6
1.2
1.5
1.5
1.0
1.8
1.0
0.1
0.3
0.4
2.6
1.9
1.1
1994 1999 2004
Total landed mollusc catch by species(tonnes, thousands, 1994-2004)
Note: dredge oysters uses codes OYS + OYUSource: MOF data rep log 5956 (custom job); Coriolis analysis
Discussion Points
• Causes of variation in squid catch; long term sustainable catch
Notes
• Greenweight (i.e. the weight of the whole fish back calculated from the weight of the fish product when it was landed)
Squid 2.1%
73.3
48.8
95.4
CAGR
TOTAL LANDED MOLLUSCS CATCHSquid is the primary mollusc caught, however the catch varies significantly
(94-04)2.7%
Other -8.1%
Dredge oysters 29.0%
Greenlipped mussel 18.5%Paua -0.3%Cockle 1.8%

19
Mapping
Seafood
3,280
4,108
2,394
1,067
925
582
494
459
351
20
39
542
1994 1999 2004
Total landed crustacea catch by species(tonnes, actual, 1994-2004)
Note: dredge oysters uses codes OYS + OYUSource: MOF data rep log 5956 (custom job); Coriolis analysis
Discussion Points
• Cause of decline since 1999
Notes
• Greenweight (i.e. the weight of the whole fish back calculated from the weight of the fish product when it was landed)
Spiny red rock lobster -3.1%
4,860
5,532
3,870
CAGR
TOTAL LANDED CRUSTACEA CATCHThe crustacea catch is down
(94-04)-2.3%
Scampi -5.9%
Paddle crab -3.3%
Other crustacea 39.0%
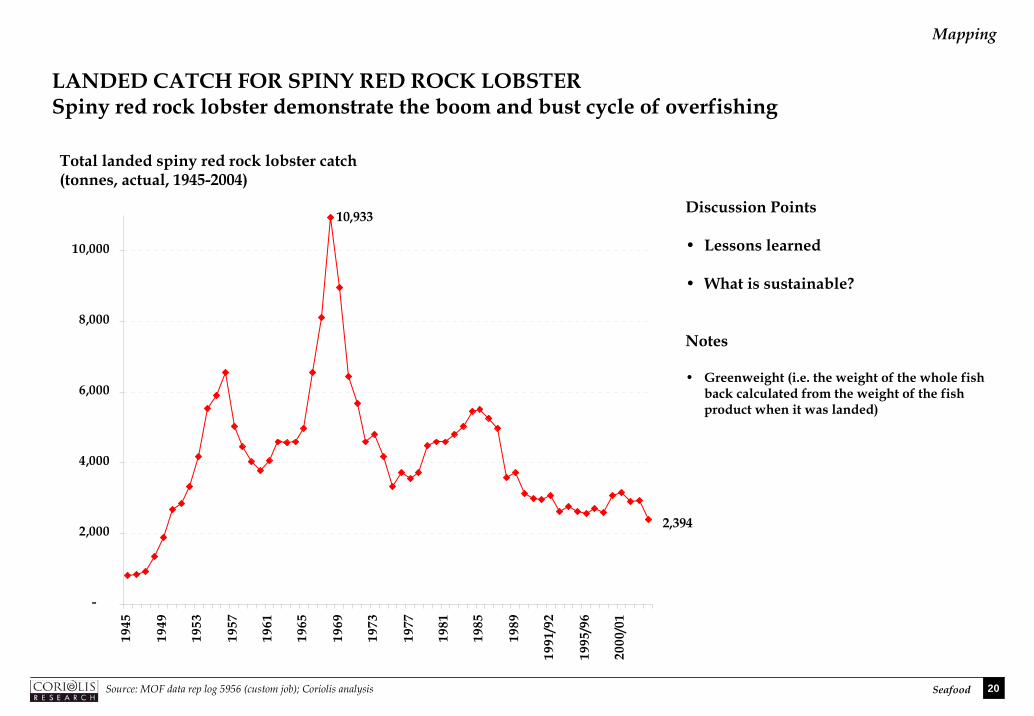
20
Mapping
Seafood
-
2,000
4,000
6,000
8,000
10,000
1945
1949
1953
1957
1961
1965
1969
1973
1977
1981
1985
1989
1991
/92
1995
/96
2000
/01
Total landed spiny red rock lobster catch(tonnes, actual, 1945-2004)
Source: MOF data rep log 5956 (custom job); Coriolis analysis
Discussion Points
• Lessons learned
• What is sustainable?
Notes
• Greenweight (i.e. the weight of the whole fish back calculated from the weight of the fish product when it was landed)
10,933
2,394
LANDED CATCH FOR SPINY RED ROCK LOBSTERSpiny red rock lobster demonstrate the boom and bust cycle of overfishing

21
Mapping
Seafood
0.6 4.6 6.5 10.010.5
40.0
72.0
85.0
4.0
4.0
4.0
4.0
1985 1994 1999 2004
Commercial aquaculture harvest(tonnes, thousands, 1985-2004)
Source: SNZ; NZMFA; NZSFA; Coriolis analysis
Discussion Points
• Ultimate potential of aquaculture
• Role of moratorium in slowing growth recently
• Limits on growth
Salmon
Mussels
Oysters
15.1
48.6
82.5
99.0
COMMERCIAL AQUACULTURE HARVESTAquaculture is the shining star of the seafood industry, however growth has slowed recently

22
Mapping
Seafood
Total fishing enterprise turnover(dollars, millions, 1997-2003)
CAGR
TURNOVER GROWTH - FISHINGFishing enterprise turnover hasn’t shown any real growth since 1997
97-03
Source: SNZ Annual Enterprise Survey; Coriolis analysis
Discussion Points
• Why?
Notes
• AES 2004 data not yet available
• Actual dollars; not inflation adjusted (i.e. decline in real terms)
• Defined as ANZSIC A04 Fishing
1.5%
$886
$963 $954$930
$998 $1,016$970
1997 1998 1999 2000 2001 2002 2003

23
Mapping
Seafood
$11$21 $21
$8
$12 $13
$45
$45$49
1994 1999 2004
Seafood imports(dollars, millions, 1994-2004)
Source: SNZ Business Demographics survey; Coriolis analysis
CAGR
SEAFOOD IMPORTSSeafood imports are showing minimal growth, primarily frozen shrimp
(94-04)
2.6%Discussion Points
• Growth of shrimp
Notes
• Definitions− Crustacean (HS0306)− Other frozen fish (remainder of HS03)− Processed seafood (HS1603-1605)
• Actual NZ dollars; not inflation adjusted
Shrimp & other frozen crustacean
Other frozen seafood
Canned & other processed seafood
$64
$77
$83
0.8%
2.6%
6.5%

24
Mapping
Seafood
INDUSTRY STRUCTURE – SEAFOOD PROCESSINGThe structure of the seafood processing sector is different
– Mixed ownership structure of key players:
– Aotearoa Fisheries, a government-created mega-holding of Maori fishing interests
• established to maximise the value of Māori fisheries assets for the benefit of its iwi and Māorishareholders; Te Ohu Kaimoana is the sole voting shareholder
• established under the Māori Fisheries Act 2004 - holds around half the total value of the Māori fisheries assets and is estimated to be worth at least $350 million
– Sealord, half owned by Nippon Suisan Kaisha (Japan; sales US$4.7b) and half owned by Aotearoa
– Sanford, a publicly listed company controlled by Amalgamated Dairies (NZ)
– Five large-to-medium private, family-owned companies (Talley’s, Independent, United, Solander, Vela)
– Inputs (catch) is highly government regulated and controlled
– Individual Transferable Quota (ITQ), the right to catch certain fish, were assigned in the past by Government in perpetuity to various individuals and entities for various reasons. Many of the owners of ITQ do not themselves fish. The Ministry of Fisheries generates the Total Allowable Commercial Catch (TACC) for all quota species by Fishery Management Areas (FMAs) within the Exclusive Economic Zone (EEZ) for the year. The TACC, crossed with the ITQ, which is tradable, generates Annual Catch Entitlement (ACE), which is also tradable. Commercial fishing requires a fishing permit, but you can fish without ACE, by buying ACE after you have caught fish. If you don’t have ACE to cover your catch by the end of the year, you pay a monetary penalty to the government.
– Growing direct ownership of mussel farms and other aquaculture by major players (vertical integration)

25
Mapping
Seafood
KEY COMPANIES – SEAFOODThe major players in seafood processing are an Iwi-owned mega-group (Aotearoa/Sealord), a publicly listed company (Sanford) and five family-owned private companies
CompanyTurnover
(NZ$; m; 2004) Employees Ownership Activities
Aotearoa Fisheries ~$600 3,000 New ZealandIwi/Te OhuKaimoana
– Aotearoa Fisheries has a 50% shareholding in Sealord and Prepared Foods; and 100% ownership of MoanaPacific Fisheries, Chatham Processing, Pacific Marine Farms and Prepared Foods Processing
– Equity value=$350m
NZ/JapanIwi/Public
Sanford $350 1,287 New ZealandPublic Listed
– Processing and marketing of seafood– 38% owned by Amalgamated Dairies (NZ)
Talley’s ? 500+250 New ZealandPrivate
– Processing and marketing of seafood, ice cream and frozen vegetables
– 85,000t; 10 trawlers/vessels; 4 fish factories; 3 other
United Fisheries ? 2001 New ZealandPrivate
– Processing and marketing of seafood– Trawlers; 1 factory; owns mussel farms
New ZealandPrivate
New ZealandPrivate
Vela Fishing ? 81 New ZealandPrivate
– Processing and marketing of seafood
Sealord Group $634 1,600 – Processing and marketing of seafood– 50% owned by Aotearoa Fisheries; 50% Nippon Suisan
(Japan; also 25% of Anzco meat)
Independent Fisheries ? 400 – Processing and marketing of seafood– 25,000t; 6 deep-sea trawlers; 1 plant (3 processing lines)
Solander Fisheries ? 101 – Processing and marketing of seafood– 20% owned by Talley’s
Key companies in the seafood processing and wholesaling sector
1. Excludes contractors; Source: Management magazine Top 200; NZ Companies Office returns; press reports; interviews; Coriolis analysis

26
Mapping
Seafood
SEAFOOD - MARKET SHARETwo companies, Sealord and Sanford, account for 54% of seafood processing
New Zealand seafood sales market share(% of sales; 2004)
Discussion Points
• Who is driving product innovation?
Notes
• Sealord is 50% owned by Aotearoa Fisheries and 50% Nippon Suisa Kaisha (Japan)
• Aotearoa Fisheries control an additional ~$136m in sales outside Sealord
Source: Company annual reports; various published articles; Coriolis analysis and estimates
Sealord $634 35%
Sanford $350 19%
Others $851 46%
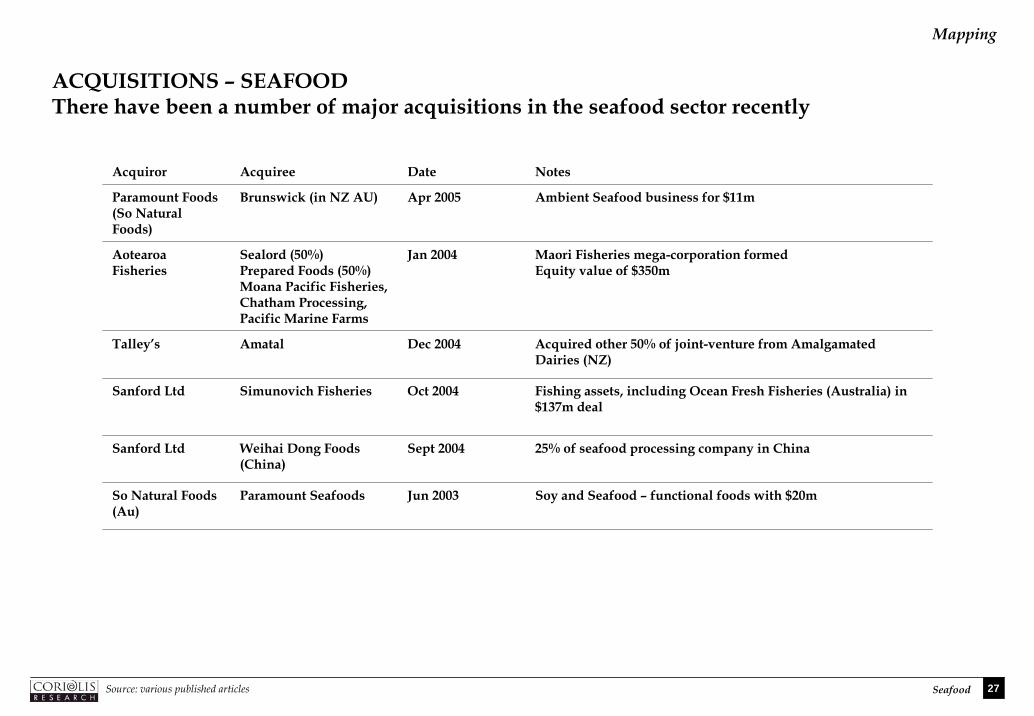
27
Mapping
Seafood
ACQUISITIONS – SEAFOODThere have been a number of major acquisitions in the seafood sector recently
Acquiror Acquiree Date Notes
Paramount Foods (So Natural Foods)
Brunswick (in NZ AU) Apr 2005 Ambient Seafood business for $11m
AotearoaFisheries
Sealord (50%)Prepared Foods (50%)Moana Pacific Fisheries, Chatham Processing, Pacific Marine Farms
Jan 2004 Maori Fisheries mega-corporation formedEquity value of $350m
Talley’s Amatal Dec 2004 Acquired other 50% of joint-venture from Amalgamated Dairies (NZ)
Sanford Ltd Simunovich Fisheries Oct 2004 Fishing assets, including Ocean Fresh Fisheries (Australia) in $137m deal
Sanford Ltd Weihai Dong Foods (China)
Sept 2004 25% of seafood processing company in China
So Natural Foods (Au)
Paramount Seafoods Jun 2003 Soy and Seafood – functional foods with $20m
Source: various published articles

28
Mapping
Seafood
$1.41$1.35
$1.84
1996 1999 2003
CAGR
SEAFOOD PROCESSING TURNOVER GROWTHThe seafood processing sector is not delivering on significant growth
Seafood processing turnover(dollars, millions, 1996-2003)
(96-03)3.8%
Source: SNZ AES, Coriolis analysis and estimates
Discussion Points
• How to achieve growth significantly in excess of inflation
Notes
• Processing turnover only; no separate data availability in AES on seafood wholesale; No data available prior to 1996 (AES); 2004 data not yet available

29
Mapping
Seafood
SEAFOOD MANUFACTURINGWhile the number of seafood manufacturing enterprises is flat, employment is up
133 132 131
1994 1999 2003
Discussion Points
• What is driving employment growth?
Source: SNZ Business Demographics survey; Coriolis analysis
Seafood manufacturing statistics(enterprises, employees, actual, 1994-2003)
6,230
6,9807,200
1994 1999 2003
47
5355
1994 1999 2003
Enterprises Employees Employees/Enterprise
-1 +970+8

30
Mapping
Seafood
7.1
5.7
6.4
1994 1999 2003
Discussion Points
• Role of wholesalers going forward
Source: SNZ Business Demographics survey; Coriolis analysis
SEAFOOD WHOLESALINGThere has been no significant growth or decline in seafood wholesaling over the past decade
Seafood wholesaling statistics(enterprises, employees, actual, 1994-2003)
Enterprises Employees Employees/Enterprise
+16 +5 -0.7
137 136
153
1994 1999 2003
970
770
975
1994 1999 2003

31
Mapping
Seafood
Supermarket $120 54%
Fishmongers $30 14%
Other retail $10 5%
Foodservice $60 27%
Wholesale purchases of seafood by channel(dollars, millions, 2004)
Discussion Points
• Relative strength of supermarket channel
Notes
• Represents wholesale purchases of seafood at cost to channel not retail sales to consumers
• Includes domestic and imported canned and frozen products
Total = $220 million
DOMESTIC MARKET – SEAFOODThe domestic market for seafood has wholesale purchases of $220 million
Source: SNZ HHES; SNZ RTS; interviews; Coriolis Foodservice in New Zealand; Coriolis analysis & estimates

32
Mapping
Seafood
$89 $82 $81
$615
$795
$588
$131
$144
$114
$120
$41
$172
$66
$113
$136$53
$48
$40$85
$95
$108
1994 1999 2004
Seafood exports by segment(dollars, millions, 1994-2004)
$1,158
$1,318
$1,238
Fresh fish
Frozen fish
Crustaceans
-1.0%
-0.4%
-1.4%
CAGR(94-04)
0.7%
-$8
-$27
-$17
AbsoluteChange(94-04)
+$80
EXPORTS MARKETS – SEAFOOD BY TYPE Mussels from aquaculture are the only real bright spot in seafood exports
Squid 3.7% +$52
7.5% +$70
Source: WTA; SNZ; Coriolis analysis
Mussels
Discussion Points
• Ultimate potential of aquaculture
• Why so little fresh fish?
• Why is frozen fish declining?
Notes
• Details of classification:• Fresh fish (HS0302)• Frozen fish (HS0303-0304)• Crustacean (HS0306)• Squid (HS030741 & HS030749)• Other seafood (remainder of HS03)• Canned/processed (HS1603-1605)
• Revised classifications from earlier draft• Seafood now includes canned/preserved
seafood (HS1603-1605)
-2.8% -$13Other seafood
2.5% $23Canned/processedseafood

33
Mapping
Seafood
$261 $276$215
$141$230
$262
$104
$140 $1631$4
$4 $9
$6
$7 $13
$535
$552$453
1994 1999 2004
New Zealand seafood export value by destination(NZ$, m, 1994-2004)
$1,074
$1,223
$1,130 0.5%
-1.7%
7.6%
CAGR
NEW ZEALAND SEAFOOD EXPORT VALUE BY DESTINATIONWith declining production and limited moves to value added products, the total export value of the New Zealand seafood is in decline
(94-04)
9.2%
6.4%
-1.9%
Discussion Points
• Why has value fallen in the past 5 years?
• Will the decline continue or has the situation stabilised?
• Why are sales to Europe growing but sales to Asia and the US/Canada falling?
Notes
• Different classifications from previous pagsimplify analysis: does not includes canned/preserved seafood (HS1603-1
USA/Canada
Europe/Russia
Sub-Saharan AfricaNA/ME/CA
E/SE Asia
Oceania 4.6%
Note: excludes minor meats (e.g. duck, horse, ostrich); Source: NZ Customs data; NZTE; Coriolis Research
e to
605)

34
Mapping
Seafood
$3.88
$48.81
$16.59
$3.70$3.57
$39.14
$14.33
$3.74$3.28
$47.82
$17.00
$3.75
Finfish Rock Lobster Other Crustacea Molluscs
-1.7%
CAGR
NEW ZEALAND SEAFOOD EXPORT UNIT VALUE The export value per kilo of New Zealand’s seafood is down or flat
New Zealand seafood export value by destination(US$/kg, 1994-2003)
(94-03)
94 98 03
Source: MAF; SONZAF; UN; FAO; Coriolis analysis
Discussion Points
• Why is the value of finfish exports declining?
• Is it possible to farm crustacea?
Notes
• Data on this page in $US
-0.2%
CAGR(94-03)
0.2%
CAGR(94-03)
0.1%
CAGR(94-03)

35
Mapping
Seafood
7,129 6,533 6,827
17,900 18,839 17,845
514 690 709
24,499 18,961 19,234
4,2735,012 5,307
2,3152,663 3,016
6,6058,147 8,806
49,05365,468
70,260
135
214338
646691501
1994 1999 2002
Global seafood catch by super-region (t, m, 1994-2002)
USA/Canada
Europe/RussiaAustralia/OceaniaNew Zealand
Latin America
Sub-Saharan Africa
Indian Subcont.NA/ME/CA
E/SE Asia
112,924
127,217132,987
12.2%
4.6%
3.7%
-0.5%
3.4%
CAGR
SEAFOOD PRODUCTION VOLUME BY REGIONAsia is both the fastest growing and largest seafood producer
(94-02)
2.7%
-3.0%
3.2%4.1%
-0.04%
Discussion Points
• What is E/SE Asia’s ultimate potential for seafood production? What are the limiting factors?
Unspecified2.1%

36
Mapping
Seafood
CAPTURE VS. AQUACULTUREAny future growth in global seafood production (or consumption) will come from aquaculture
0
20
40
60
80
100
120
140
1950
1955
1960
1965
1970
1975
1980
1985
1990
1995
2000
2003
Global seafood production by type (t, m, 1950-2003)
Aquaculture
Capture
Discussion Points
• With the end of the moratorium, what is the ultimate potential for aquaculture in New Zealand?

37
Mapping
Seafood
GLOBAL PER CAPITA SEAFOOD CONSUMPTIONOn a global basis, marine fish consumption is declining, while other fish and seafood is growing
Global per capita seafood consumption by type (kg/capita, 1970-2004)
Marine Fishes
Freshwater Fish
Molluscs
Crustaceans
Diadromous FishesMisc Aquatic
Discussion Points
• Why is marine fish consumption declining? Will this continue?
• Growth coming from aquaculture-0.7%
3.8%
3.5%
3.1%
1.5%3.2%
CAGR(70-04)
-
2
4
6
8
10
12
14
1970
1973
1976
1979
1982
1985
1988
1991
1994
1997
2000
Source: MAF; SONZAF; UN; FAO; Coriolis analysis

1
Mapping
Other Food
4. OTHER FOOD MANUFACTURING & WHOLESALING The fourth section of this report looks at other food manufacturing and wholesaling
Resource ProductionManufacturing& Wholesaling Markets
Domestic
Export
Domestic
Export
Fruit & Vegetable Processing &WholesalingFruit & Vegetables
Domestic
Export
Grain-basedManufacturing& Wholesaling
Domestic
Export
Pasture
Livestock Meat Processing& Wholesaling
Domestic
Export
Milk Dairy Processing& Wholesaling
Arable land & Horticulture
Grains
Domestic
ExportSeafood Processing& WholesalingFish & Other SeafoodSeafood
Beverage Manufacturing& Wholesaling
Domestic
Export
Other Food Manufacturing& Wholesaling
Food Imports

2
Mapping
Other Food
INDUSTRY STRUCTURE – OTHER FOOD MANUFACTURING & WHOLESALING The “other food” segment contains a range of business of all sizes making and importing a range of products
– Three distinct segments:
– New Zealand operations of global (or Australian) category leaders (Nestle, Unilever)
• Key distinction: those that manufacture (e.g. Cadbury) and those that only import (e.g. Kellogg)
• Most are implementing on a global plan rather than innovating here
• Highly focused on a small number of categories; few generate significant exports
• Trans-Tasman integration increasing pressure to “run it out of Sydney”
– Few New Zealand owned manufacturers of significant scale (Hansells, Healtheries)
• Most are number 3 or 4 players in mature categories against global players
• No significant Trans-Tasman integration or leadership
• None are publicly listed
– Emerging small and medium size manufacturers and wholesalers/importers (numerous)
• Key distinction: those that manufacture and those that only import
• Manufacturers struggle to achieve scale and struggle to make the leap to Australia
• Importers are threatened by parallel imports and trans-Tasman integration

3
Mapping
Other Food
KEY COMPANIES – OTHER FOODThe large players in the “other food” sector are largely the New Zealand operations of global or Australian category leaders
CompanyTurnover
(NZ$; m; 2004) Employees Ownership Activities
Nestle New Zealand $361 750 SwitzerlandPublic Listed
– Manufacturer and importer of grocery products
Effem Foods / Masterfoods(NZ)
$209 350 United StatesPrivate
– Production of confectionery and grocery products
New Zealand Sugar Limited $190 160 AustraliaPublic/Private
– Processing of sugar
Cerebos Pacific $150 275 SingaporePublic Listed
– Manufacturer and importer of grocery products
Hansells NZ $68 286 New ZealandPrivate
– Manufacturer of grocery products
Healtheries NZ $50 250 New Zealand Private
– Manufacturer of grocery products– Growing presence in Australia not included in totals
Wrigley (NZ) $37 28 United StatesPublic Listed
– Importer/Wholesaler of gum and confectionery
Kerry Ingredients $30 270 IrelandPublic Listed
– Manufacturer/Importer/wholesaler of ingredients, flavours and additives
General Mills $24 95 United StatesPublic Listed
– Importer/wholesaler of grocery products
Unilever New Zealand $290 400 United KingdomPublic Listed
– Manufacturer and importer of grocery products– Also has significant non-foods activities in this total
Cadbury Confectionery $213 1,100 United KingdomPublic Listed
– Production of confectionery
Key companies in the ‘other food’ manufacturing and wholesaling sector
Source: Management magazine Top 200; NZ Companies Office returns; press reports; interviews; Coriolis analysis

4
Mapping
Other Food
Nestle NZ $361 16%
Unilever NZ $290 13%
Cadbury $213 10%
Masterfoods $209 9%
NZ Sugar $190 9%
Cerebos Pacific $150 7%
Other $791 36%
New Zealand ‘other food’ sales market share(% of sales; 2004)
Discussion Points
• Why is this dominated by global multinationals? What are the implications of your answer to the overall New Zealand food industry?
Notes
• No available data on wholesale turnover leading to the potential that the size of “other”is understated due to methodology
• Market share represents New Zealand wholesale domestic sales and export sales (at border); does not include international sales or margins
Source: Company annual reports; various published articles; Coriolis analysis and estimates
Total = $2,204
MARKET SHARE – OTHER FOODThe “other food” category is dominated by global category leaders

5
Mapping
Other Food
ACQUISITIONS – OTHER FOODThere have been numerous acquisitions, many of these have been by smaller local companies
Acquiror Acquiree Date Notes
Prolife Foods Australasian Bulk Foods
Oct 2004 Confectionery Imports
Sure as Eggs Marketing
Hen House Northern Oct 2004 Merged to form – Independent Egg Producers Checkout-op
The Aintree Food Gp
Merger of Real Foods, William Aitken & Co, Strikeforce NZ
Feb 2004 Importers, dried fruit, oil, Vitasoy
Sanitarium Lisa’s Foods Mar 2003 Dips and Spreads business
Sweetline Richard Hislop April 2002 Importer and distributor
Cadbury Snack bars business of Mother Earth
Feb 2002 Snack bar production
Source: various published articles

6
Mapping
Other Food
MANUFACTURING TURNOVER GROWTH – OTHER FOOD“Other food” is showing reasonable growth
Other food manufacturing turnover(dollars, billions, 1996-2003)
CAGR(96-03)
Discussion Points
• Drivers of growth
Notes
• No data available prior to 1996 (AES); 2004 data not yet available
Source: SNZ AES, company annual reports; various published articles; Coriolis analysis and estimates
$1.6
$1.4
$2.2
1996 1999 2003
5.0%

7
Mapping
Other Food
410 390 240230 190 210
1,8201,250
1,920
880
610
740
4,220
4,5404,230
520
530470
1994 1999 2003
31 28 393 3
464 64
75
59 5565
197 218
283
32
2
1994 1999 2003
Discussion Points
• Employment drop in confectionery in 1999
Notes
• Nec is “not elsewhere classified”
• Tobacco left in to show relative scale as later wholesaling turnover data includes tobacco (inseparable at source)
Source: SNZ Business Demographics survey; Coriolis analysis
Other food manufacturing statistics(enterprises, employees, actual, 1994-2003)
Enterprises
ENTERPRISES & EMPLOYEES - OTHER FOOD Food nec is creating more enterprises, but confectionery is the main segment creating more employment
357 370
+111
AbsoluteChange(94-03)
SugarOil & fat
Employees
7,8108,080
7,510
+8
Confectionery
Food nec
Tobacco
468
+1
+11
+6
-1
-50
AbsoluteChange(94-03)
-170-20
+100
-140
+10
Animal feed
+86
-270

8
Mapping
Other Food
0
20
40
60
80
100
120
140
1994 1999 2003
Source: SNZ Business Demographics survey; Coriolis analysis
MANUFACTURING EMPLOYMENT PER ENTERPRISE – OTHER FOODOnly confectionery is increasing employment per enterprise
-2
AbsoluteChange(94-03)
-1.0%
CAGR(94-03)
Other food manufacturing employees per enterprise by sector(people, actual, 1994-2003)
Notes
• Includes working proprietors
• Total employees not FTE
+3 0.5%
-5 -5.2%
-5 -1.7%
- 0%
TobaccoOil & fat
Confectionery
Food nec
Animal feed
-1 -0.9%Sugar

9
Mapping
Other Food
211 116 124
6,100
7,550
9,690
1994 1999 2003
14 14 13
619
792
1004
1994 1999 2003
Source: SNZ Business Demographics survey; Coriolis analysis
Enterprises
WHOLESALING – OTHER GROCERYGeneral grocery wholesalers are showing strong enterprise and employment growth
Discussion Points
• Why is this happening?
Notes
• Will likely include some part of Foodstuffs wholesale activities
• May reflect a shift to more part-time employees
Grocery wholesaling statistics(enterprises, employees, actual, 1994-2003)
633
806
1,017 +384
AbsoluteChange(94-03)
Other Grocerynec
Tobacco
Employees
6,311
7,666
9,814
+385
-1
+3,503
+3,590
-87
AbsoluteChange(94-03)

10
Mapping
Other Food
$60 $67 $54$47 $47 $65
$95$133 $164
$150$144
$151$60
$95$131
$96
$150
$188
$166
$256
$353
1994 1999 2004
IMPORTS – OTHER FOODNew Zealand’s imports of all other foods captures a range of food ingredients and products
Details of “other food” imports by type(dollars, millions, 1994-2004)
Source: SNZ Business Demographics survey; Coriolis analysis
Spices, coffee & tea
Misc grain, seed prep
Miscellaneous food
-1.1%
3.2%
7.9%
CAGR(94-04)5.1% Discussion Points
• Growth of cocoa imports to be used in dairy exports
Notes
• Uses HS2 codes
Fats & oils 5.6%
Sugars, confectionery 0.0%
Cocoa 8.1%
Preserved foods 6.9%$674
$892
$1,106

11
Mapping
Other Food
Supermarkets $2,000
59%
Other retail $760 23%
Foodservice $590 18%
Discussion Points
• Relative strength of supermarket channel
Notes
• Represents wholesale purchases of grain-based foods at cost to segment not retail sales to consumers
Total = $3,350 million
DOMESTIC MARKET – OTHER FOODSThe domestic market for other foods has wholesale turnover of $3.35 billion
Wholesale purchases of other food by channel(dollars, millions, 2004)
Source: SNZ HHES; SNZ RTS; interviews; Coriolis Foodservice in New Zealand; Coriolis analysis & estimates

12
Mapping
Other Food
$9 $10$28$2 $6
$8
$1 $1
$6$76 $74
$97$10 $13
$22
$52$25
$61
$19
$22
$35
$10$23
$46
$19$9
$11
1994 1999 2004
‘Other food’ exports by segment(dollars, millions, 1994-2004)
$198$184
$314
Honey 12.5%
CAGR(94-04)4.7%
+$20
AbsoluteChange(94-04)+$116
Source: WTA; SNZ; Coriolis analysis
Other oils & fats 8.4% +$12
Confectionery/sugar 1.7% +$10
Spices/coffee/tea 15.8% +$4Eggs 13.6% +$6
Cocoa/Chocolate 6.5% +$16
Soups 16.5% +$36
Other misc. food -5.7% -$8
Discussion Points
• What need to happen to encourage more growth of other food?
Notes
• Details of classification:• Eggs (HS0407-0408)• Honey (HS0409)• Cow & sheep fat (HS1502)• Oils & fats (remainder HS15 less dairy
fats)• Confectionery/sugar (HS17 less lactose)• Cocoa (HS18 less dairy cocoa),
coffee/tea/spices (HS09)• Soups (HS2104• Other misc food (rest of HS21 less dairy)Cow & sheep fat 2.4% +$21
EXPORTS – OTHER FOOD There are a number of stars in ‘other food’

1
Mapping
Retailing
5. NEW ZEALAND DOMESTIC MARKET – FOOD RETAILING & FOODSERVICE The importance of the domestic market to the food industry should not be underestimated
Resource ProductionManufacturing& Wholesaling Markets
Domestic
Export
Domestic
Export
Fruit & Vegetable Processing &WholesalingFruit & Vegetables
DomesticGrain-basedManufacturing& Wholesaling
Domestic
Export
Pasture
Livestock Meat Processing& Wholesaling
Domestic
Export
Milk Dairy Processing& Wholesaling
Arable land & Horticulture
Grains
ExportSeafood Processing& WholesalingFish & Other SeafoodSeafood
Beverage Manufacturing& Wholesaling
Domestic
Export
Other Food Manufacturing& Wholesaling
Food Imports

2
Mapping
Retailing
INDUSTRY STRUCTURE – FOOD RETAILINGWhile the supermarket segment is now highly consolidated into two groups, there is a vibrant and growing specialist sector outside this duopoly
– Supermarket sector now highly consolidated into two groups
– Foodstuffs NZ, a cooperative of independent store owners
• made up of three legally separate regional cooperatives (Auckland, Wellington, South Island)
• operate supermarkets (New World, Pak’N Save), grocers/dairies (Four Square) and cash & carry
– Progressive Enterprises, a chain of corporate owned supermarkets
• operate supermarkets (Woolworths, Foodtown, Countdown)
• in the process of being sold by FAL Australia to Woolworths Australia (not related to Woolworths in NZ)
– However, a growing presence of independent Asian supermarkets serving the growing Asian population (and others)
– Specialist segment (butchers, bakers and greengrocers) is consolidating and growing as it transitions from being primarily independents to primarily chains (e.g. Bakers Delight)
– Likely entrance of new players into the market
– The Warehouse has announced plans to open hypermarkets which would combine their existing general merchandise with a food offer
– Aldi, a German owned supermarket group with operations in Australia, appears to be preparing to enter the market at some point in the near future
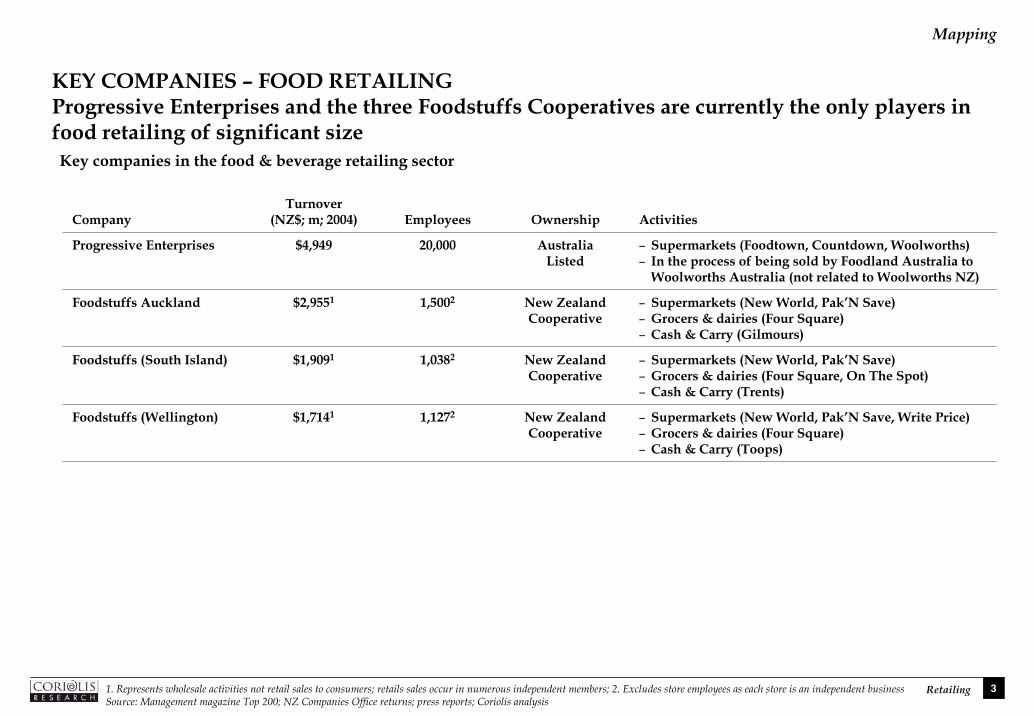
3
Mapping
Retailing
KEY COMPANIES – FOOD RETAILINGProgressive Enterprises and the three Foodstuffs Cooperatives are currently the only players in food retailing of significant size
CompanyTurnover
(NZ$; m; 2004) Employees Ownership Activities
Progressive Enterprises $4,949 20,000 AustraliaListed
Foodstuffs Auckland $2,9551 1,5002 New ZealandCooperative
– Supermarkets (New World, Pak’N Save)– Grocers & dairies (Four Square)– Cash & Carry (Gilmours)
Foodstuffs (South Island) $1,9091 1,0382 New ZealandCooperative
– Supermarkets (New World, Pak’N Save)– Grocers & dairies (Four Square, On The Spot)– Cash & Carry (Trents)
Foodstuffs (Wellington) $1,7141 1,1272 New ZealandCooperative
– Supermarkets (New World, Pak’N Save, Write Price)– Grocers & dairies (Four Square)– Cash & Carry (Toops)
– Supermarkets (Foodtown, Countdown, Woolworths)– In the process of being sold by Foodland Australia to
Woolworths Australia (not related to Woolworths NZ)
Key companies in the food & beverage retailing sector
1. Represents wholesale activities not retail sales to consumers; retails sales occur in numerous independent members; 2. Excludes store employees as each store is an independent businessSource: Management magazine Top 200; NZ Companies Office returns; press reports; Coriolis analysis
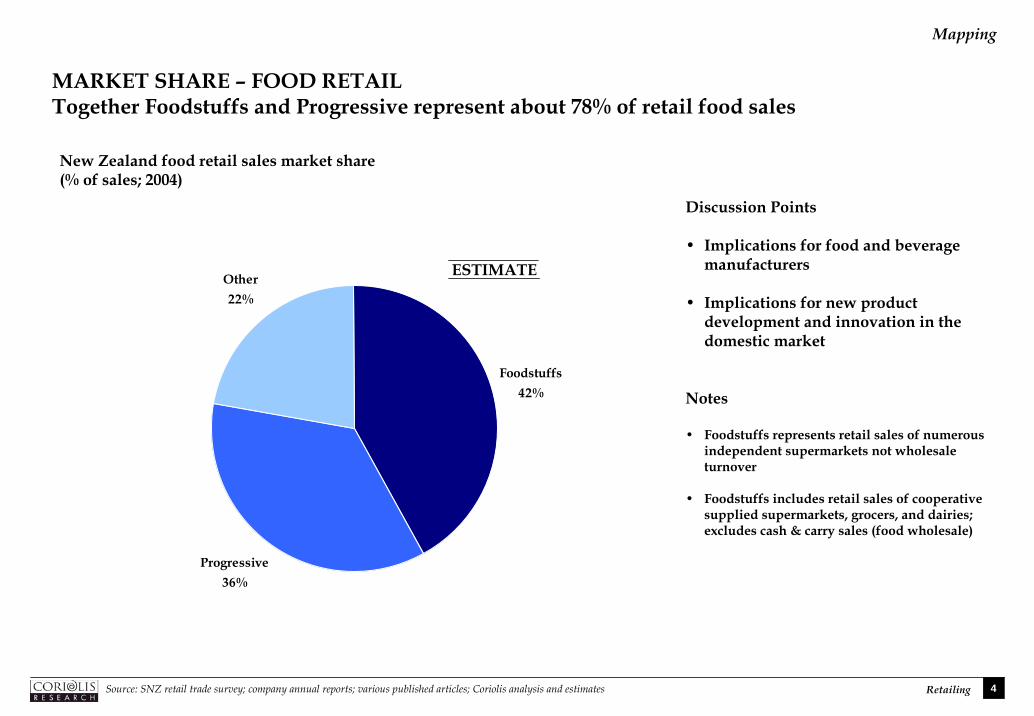
4
Mapping
Retailing
Foodstuffs42%
Progressive36%
Other22%
Discussion Points
• Implications for food and beverage manufacturers
• Implications for new product development and innovation in the domestic market
Notes
• Foodstuffs represents retail sales of numerous independent supermarkets not wholesale turnover
• Foodstuffs includes retail sales of cooperative supplied supermarkets, grocers, and dairies; excludes cash & carry sales (food wholesale)
ESTIMATE
MARKET SHARE – FOOD RETAILTogether Foodstuffs and Progressive represent about 78% of retail food sales
New Zealand food retail sales market share(% of sales; 2004)
Source: SNZ retail trade survey; company annual reports; various published articles; Coriolis analysis and estimates

5
Mapping
Retailing
ACQUISITIONS – FOOD RETAILINGProgressive Enterprises has been the focus of the two major recent acquisitions in food retailing
Acquiror Acquiree Date Notes
Woolworths Australia
Progressive Enterprises In progress (Oct 2005?)
Largest supermarket retailer in Australia in the process of acquiring Progressive Enterprises from Foodland Associated of Australia
Progressive Enterprises
Woolworths New Zealand
2002 Progressive Enterprises (owned by Foodland Associated of Australia) purchased Woolworths New Zealand from Dairy Farm International of Hong Kong
Source: various published articles; Coriolis analysis and estimates

6
Mapping
Retailing
$5,551$6,846
$9,636
$1,348
$1,419
$1,619
$235
$277
$434
$479
$555
$736
$174
$204
$379
$786
$938
$986
1995 1999 2004
Food & Beverage retail sales by sector(dollars, millions, 1995-2003)
Source: SNZ Retail Trade survey; Coriolis analysis
Discussion Points
• Reasons for growth of specialists
• Supermarkets adding non-foods to diversify away from low growth food
Notes
• Fruit & vegetable, milk vending and other food retail combined at source to preserve data quality (margin of error); decline of milk delivery probably hiding growth of fruit & vegetable retailing
• Uses 1995 data due to methodology change in Q2/95; Q1/1995 extrapolated from other data
• Actual dollars; not inflation adjusted
• Excludes petrol stations and their food sales (impacting dairies)
$8,573
$10,239
$13,789
Supermarkets
Grocers & Dairies
Fruit & vegetables, milk delivery and other foodBread & cake
Liquor
6.3%
2.1%
4.9%9.0%
2.6%
CAGR
RETAIL SALES GROWTHWhile the retail food industry overall is growing at 5.4%, this masks significant variation among segments
(95-03)
5.4%
Meat, fish & poultry 7.0%

7
Mapping
Retailing
232 229 260
2,383 2,236 2,327
907666 645
444
359 302
545
471 456
618
753 868
425
458561
263420
493
1994 1999 2003
Source: SNZ Business Demographics survey; Coriolis analysis
Supermarkets
Grocers & Dairies
Milk delivery
Fruit & vegetables
Bread & cake
Other food retail
Liquor
5,8175,592
5,912
NUMBER OF FOOD RETAIL ENTERPRISESIn terms of enterprise numbers, most retail food outlets are not supermarkets
Food & Beverage retail enterprises by sector(enterprises, actual, 1994-2003)
+28
-56
-142
-89
+250
+136
+230
AbsoluteChange(94-03)
+95 Discussion Points
• Chains vs. Independents
Notes
• Recent growth of supermarket numbers almost totally Asian supermarkets
• Defined as businesses registered for GST purposes (+$30,000pa)
Meat, fish & poultry -262
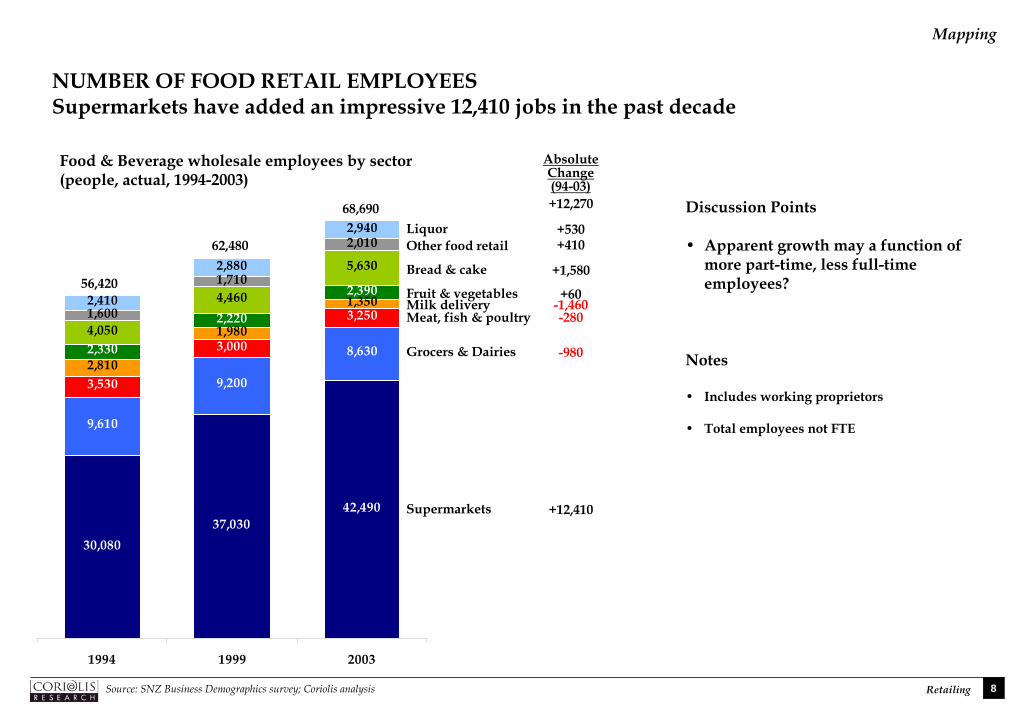
8
Mapping
Retailing
Meat, fish & poultry
30,08037,030
42,490
9,610
9,200
8,630
3,530
3,000
3,250
2,810
1,980
1,350
2,330
2,220
2,390
4,050
4,460
5,630
1,600
1,710
2,010
2,410
2,880
2,940
1994 1999 2003
Source: SNZ Business Demographics survey; Coriolis analysis
56,420
62,480
68,690
Supermarkets
Grocers & Dairies
Milk deliveryFruit & vegetables
Bread & cake
Other food retailLiquor
+12,410
-980
-1,460+60
+1,580
+410+530
Absolute
NUMBER OF FOOD RETAIL EMPLOYEESSupermarkets have added an impressive 12,410 jobs in the past decade
Food & Beverage wholesale employees by sector(people, actual, 1994-2003)
Discussion Points
• Apparent growth may a function of more part-time, less full-time employees?
Notes
• Includes working proprietors
• Total employees not FTE
Change(94-03)+12,270
-280

9
Mapping
Retailing
INDUSTRY STRUCTURE – FOODSERVICEThe foodservice sector is highly fragmented, with little chain or corporate presence, except in the takeaway/fast food sector
– Industry can be segmented into three sectors:
– Takeaway made up of local franchisees of global fast food chains (McDonalds, Burger King, Wendy’s, Pizza Hut, Subway, Domino’s) and numerous independents
– Cafes and restaurants which serve food and beverages and are almost exclusively independently owned and operated; increasing sales of alcohol due to liquor deregulation
– Pubs, taverns, bars and clubs which serve primarily alcohol
– Strong industry growth (espc. cafes & restaurants) driven by increased tourist arrivals and growing domestic expenditure on food away from home
– Grocery wholesale into the segment is consolidated into Crean’s and the Foodstuffs Cash & Carry operations (Gilmours, Toops & Trents), however perishables wholesaling is fragmented
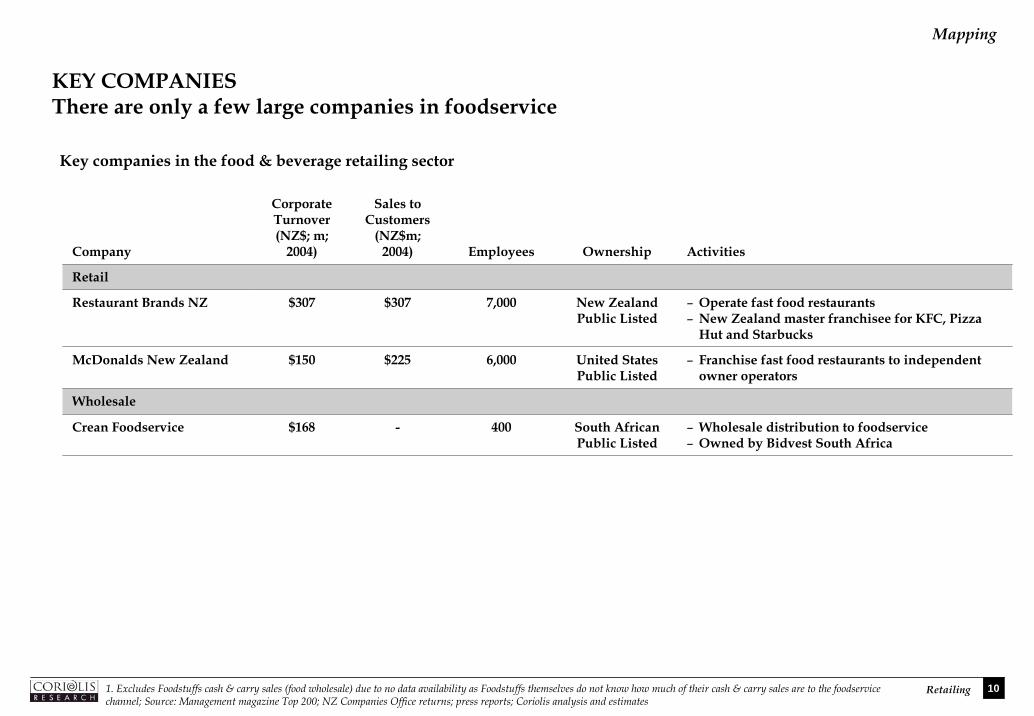
10
Mapping
Retailing
KEY COMPANIESThere are only a few large companies in foodservice
Company
CorporateTurnover(NZ$; m;
2004)
Sales to Customers
(NZ$m; 2004) Employees Ownership Activities
Retail
$307
$225
Wholesale
-
New Zealand Public Listed
McDonalds New Zealand $150 6,000 United StatesPublic Listed
– Franchise fast food restaurants to independent owner operators
Crean Foodservice $168 400 South AfricanPublic Listed
– Wholesale distribution to foodservice– Owned by Bidvest South Africa
Restaurant Brands NZ $307 7,000 – Operate fast food restaurants– New Zealand master franchisee for KFC, Pizza
Hut and Starbucks
Key companies in the food & beverage retailing sector
1. Excludes Foodstuffs cash & carry sales (food wholesale) due to no data availability as Foodstuffs themselves do not know how much of their cash & carry sales are to the foodservice channel; Source: Management magazine Top 200; NZ Companies Office returns; press reports; Coriolis analysis and estimates

11
Mapping
Retailing
Café & restaurant $3,042
61%
Pubs, bars, taverns & clubs
$1,091 22%
Restaurant Brands $307 / 6%
Other takeaway $354 / 7%
McDonalds $225 / 4%
New Zealand foodservice sales market share(% of sales; 2004)
Discussion Points
• Implications for food and beverage manufacturers
Notes
• Excludes non-retail foodservice (e.g. schools, prisons, airplanes, cruise lines, retirement homes, hospitals, etc)
MARKET SHARE – FOODSERVICECafes and restaurants are the largest foodservice segment
Source: SNZ retail trade survey; Coriolis analysis and estimates

12
Mapping
Retailing
ACQUISITIONS – FOODSERVICEOther than the arrival of Domino’s, the major deals in the foodservice sector have been on the wholesale/distribution side
Acquiror Acquiree Date Notes
Domino’s Pizza Australia
Mad Dog Pizza May 2005 Australian franchisee of Domino’s six store chain in Christchurch
Domino’s Pizza Australia
Pizza Haven Jan 2005 Australian franchisee of Domino’s acquires 35 store chain
Creans Foodservice
Chef Direct Oct 2004 Foodservice distributor in Taupo (primarily fresh supply)
Creans Foodservice
Oceanic Foods Oct 2003 Frozen and chilled foodservice distributors,
Creans Foodservice
R&S Distributors Dec 2003 Foodservice distributors in Hawke’s Bay
Delmaine Fine Foods
EuroPacific Foods June 2003 Foodservice and gourmet foods distributor
Sharon Hunter Tenby Powell
Continental Distributors
Nov 1999 Foodservice and gourmet foods importer/distributor
Source: various published articles; Coriolis analysis

13
Mapping
Retailing
$626 $618$886
$1,569
$2,140
$3,042
$1,101
$994
$1,091
1995 1999 2004
Food & Beverage retail sales by sector(dollars, millions, 1995-2004)
Source: SNZ Retail Trade survey; Coriolis analysis
Discussion Points
• Food requirements of restaurants vs. supermarkets
Notes
• Defined as businesses registered for GST purposes (+$30,000pa)
• Pubs, taverns & bars and clubs (hospitality) combined at source to preserve data quality (margin of error)
• Uses 1995 data due to methodology change in Q2/95; Q1/1995 extrapolated from other data
• Actual dollars; not inflation adjusted
$3,296
$3,751
$5,019
Takeaway food
Cafes & restaurants
Pubs, taverns, bars and clubs
3.9%
7.6%
-0.1%
CAGR
FOODSERVICE SALES GROWTHThe foodservice industry has shown strong turnover growth in the past decade, especially in the cafes & restaurants segment
(95-04)4.8%
+$455
+$1,268

14
Mapping
Retailing
2,674 2,799 3,016
3,5434,180
5,118
822
1,028
1,326
418
401
389
1994 1999 2003
Source: SNZ Business Demographics survey; Coriolis analysis
Takeaway food
Cafes & restaurants
Clubs (hospitality)
7,475
8,408
9,849
NUMBER OF FOODSERVICE ENTERPRISESThe number of foodservice enterprises is growing almost across the board
Foodservice enterprises by sector(enterprises, actual, 1994-2003)
+342
+1,575
-29
AbsoluteChange(94-03)+2,392 Discussion Points
• Cost-to-serve a fragmented customer base increasing power of wholesalers
Notes
• Defined as businesses registered for GST purposes (+$30,000pa)
Pubs, taverns & bars +504

15
Mapping
Retailing
12,19016,230 16,580
31,250
42,510
51,860
12,550
11,570
14,060
3,110
3,500
3,530
1994 1999 2003
Foodservice employees by sector(people, actual, 1994-2003)
Source: SNZ Business Demographics survey; Coriolis analysis
59,100
73,810
86,030 Discussion Points
• Role of industry employees in food decision making
• Training requirements
Notes
• Includes working proprietors
• Total employees not FTE
Takeaway food
Cafes & restaurants
Clubs (hospitality)
+4,390
+20,610
+420
Absolute
NUMBER OF FOODSERVICE EMPLOYEESThe café and restaurant segment has added over 20,000 employees in the past decade
Change(94-03)+26,930
Pubs, taverns & bars +1,510