Embed Size (px)
Citation preview
/
sins oo STRCTURES AND MATERIALS RESEARCHE9 D A TEPAfTMENT OF CIVIL ENGINE!H3NO
THE STRESS DISTRIBUTIONOF NORFORK DAM
RAY W. CLOUGH
FINAL REPORT TOU.S. ENGINEER DISTRICT, LIITrLE ROCKCORPS OF ENGINEERS
MARCH 1962 INSTITUTE OF ENGINEERING RESEARCH
RSEDAUGUST1962 UNIVERSITY OF C AL FORN IA
BERKELEY CALIFORNIA
L
STRUCTURES AND MATERIALS RESEARCHDEPARTMENT OF CIVIL ENGINEERING i
SERIES 100 ISSUE 19
THE STRESS DISTRIBUTION OF NORFORK DAM
A Report of an-Investigation
by
Ray W. Clough
Professor of Civil Engineering
to IU. S. ARMY ENGINEER DISTRICT, LITTLE ROCK
CORPS OF ENGINEERS /
Under Contract DA-03-050-Civeng-62-511
Institute of Engineering ResearchUniversity of California
Berkeley, California
March, 1962
Revised August 1962

~TA= . CF COMMTNTS
PageSUMMARY .. ;;; .: :1 .................. a
=_ROUCTION . . . . . . . . . . . . 2
Origin of the Problem . . ... 0.. . .. . . 2
Analytical Procedure .. . . . .. 3
Scope of the Investigation ...... *e..** 4
METHOD OF ANALYSIS ........... ............ 5
The Finite Element Approximation ...... * • • o * * a 5
The Matrix Analysis Procedure ........... 7
Element Stiffnesses ...... .......... * i
Isotropic Elasticity 6 C 0 0 11
Orthotropic Elasticity ..... * * * * ' a * * * * a 13
Complete Element Stiffness Matrix .......... ' 17
Element Stress Matrix .. . .•. . . . . 17
Displacement Transformation Matrix . .. . . . . 18
Load Matrix . . .. . . . . . . . . . . .. . . . .. . 23
Dead Loads a * o - e * * * * * * .. a ...... . 23
Live Loads . . . . ... . . . . ... . . . . . .. 23
Thermal Loads .................... 25
Boundary Displacements . . .. *. ...... 26
COMPUTER PROGRAM .... .................. 29
Numerical Procedure 0...o....... . 29
Over-Relaxation Factor ... e. . . . a 30
Physical Interpretation of Method ........ • 31
Boundary Condition a....0. @ • aaa 32
5
pageSequence of Opeations .. . . . . . . . . 33
Input Data .. . . . . . . . . . 33
Output information . . . . . 36
TiHE mi FNg LSE . . . . . . ., . . . . . . . . . . . . . 36
t-
Cases Considered . .. . . . . . . . .*******41
AnalsisProcedure .................... 43
Foundation Displacements .... ...... 43
Uplift Pressures . . .... .. .. .... 46
RESULTS OF ANALYSES .4.7..... . ...... 47
Stress Contours . ................ 48
Uncracked Section: Cases A, B, C ...... ... 48
Two-ThirdsCrack: CasesD, E,......... 50
Seven-Ninths Crack: Cases I, J, K, L, M, N ***** 55
Comparison with PCA: Cases 0-1, 0-2 ...... 59
Static Checks of Force Resultants .*.....*.... 65
BlockAboveCrack ................. 68
Effect of Crack on Base Stress Distribution *.,. 68
Boundary Displacements ............. 70
Uncracked Section *ass *A*BC . ... ... 70
Two-Thirds Crack . 70
Seven-Ninths Crack *. . . .K .. 74
Crack Opening ............. ... . 74

iii
PageCONCLUSIONS . .. .. .. .. .. .. .. .. .. . . 78
ACKNOWI-EDG MEFTS .. .. .. ... ... .. .. . 8317
REFERENCES . . . . . . . . . . . . . . . . 84
SUPPLEMENTARY INVESTIGATION ................. 5
APPENDIX: STRESS VECTORS FOR ALL CASES . . . . . . . . . 108
LIST OF ILLUSTRATIONS
Rmber Title Pass
I The Triangular Eleent Idealization 6
2 Triangular Plate Element DimeLnms 11
3 Assumed Orthotropic .Mterial 14
4 Typical Displacemtnt Transformation Analysis 19
5 Simple Trianpular Elemeut Systea 22
6 Representation of Hydr6static Pre3sures by Nodal orCees 24
7 tumbering System for Nodal Point" and Plate Elments 34
8 Cawputer Output 37
9 Basic Gecmetry of Monolith 16 40
10 Finite Element Idealization 44
11 Representation of Crack Using Pairs of Nodal Poiuts 45
12 Hydroatatic Uplift Acting in Crack at Rasl of Dm 45
13 Stress Contours - Cast A 51
14 Stress Contours - Case B 53s
15 Stress Contours - Cane C 52
16 Stress Contours - Case D 52a
17 Stress Contours - Cas E 56
18 Stress Contours - Cast F 56a
19 Stress Contours - Case G 57
20 Stress Contours o Case H 37a
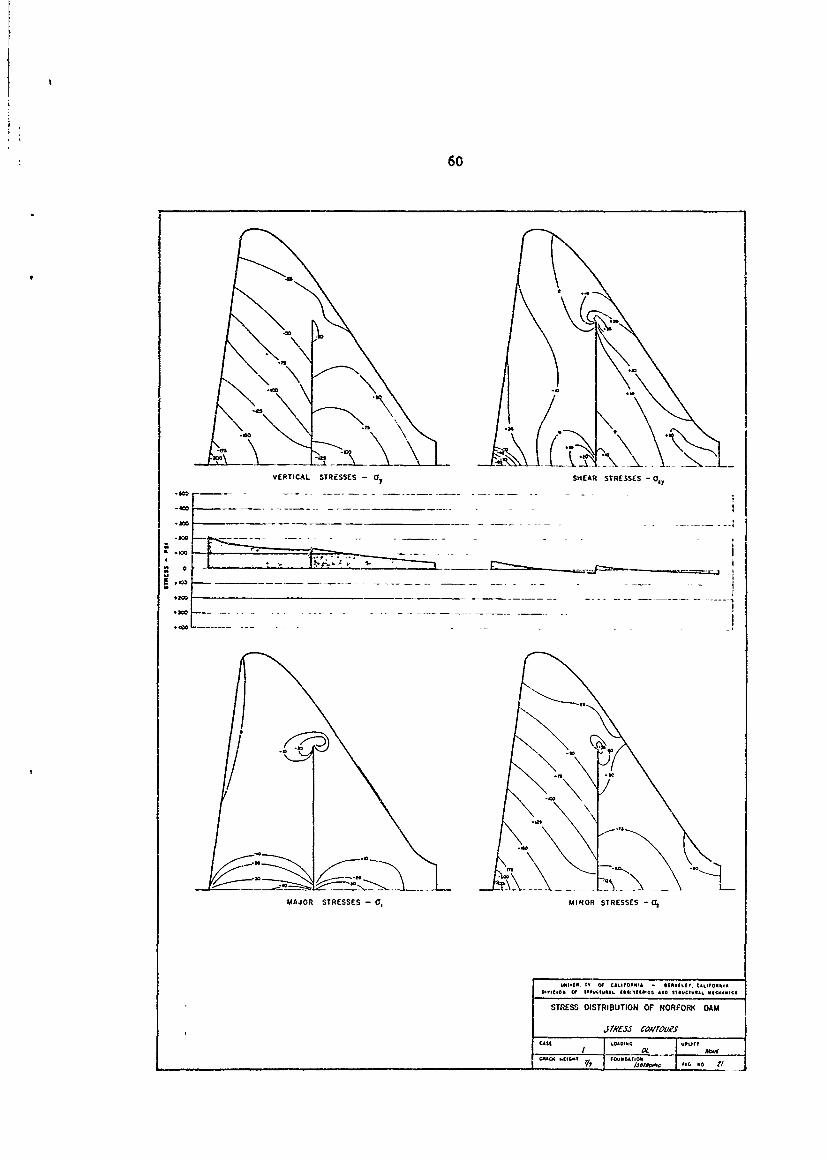
21, Stress Contours - Case I 60
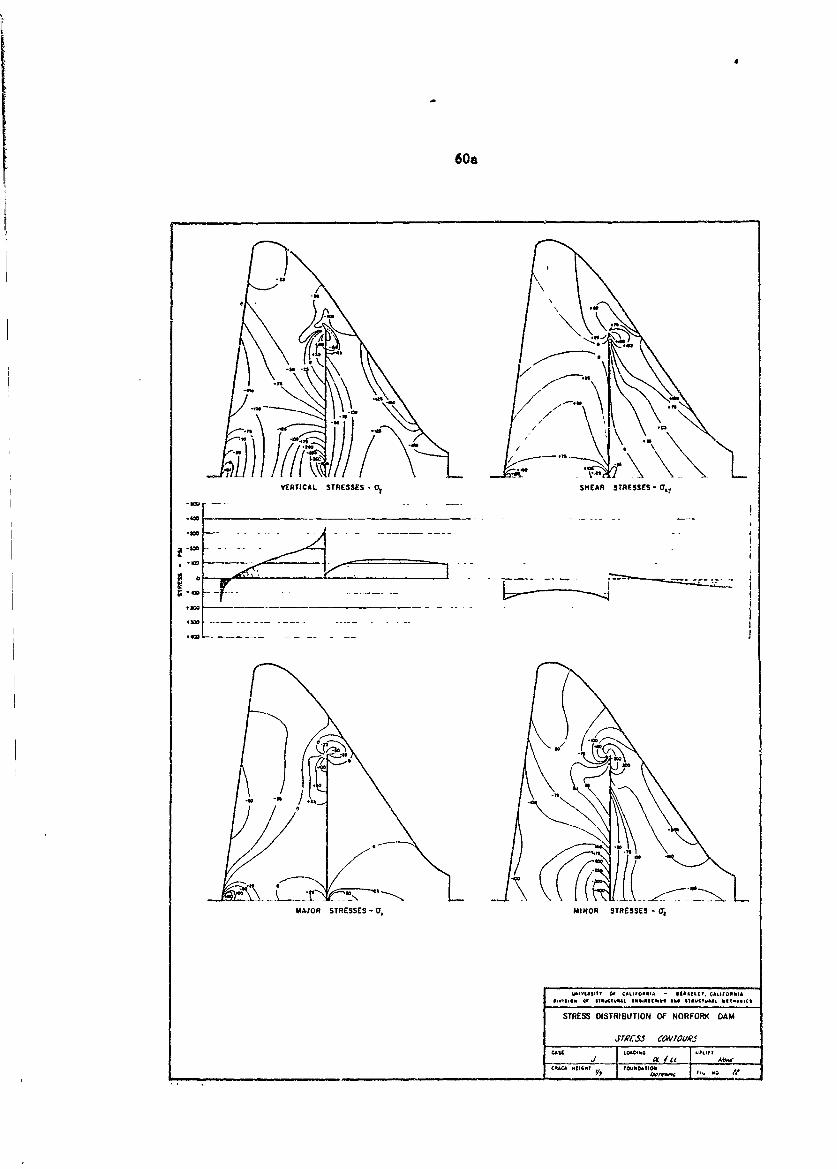
22 Stress Contours - Case J 60a
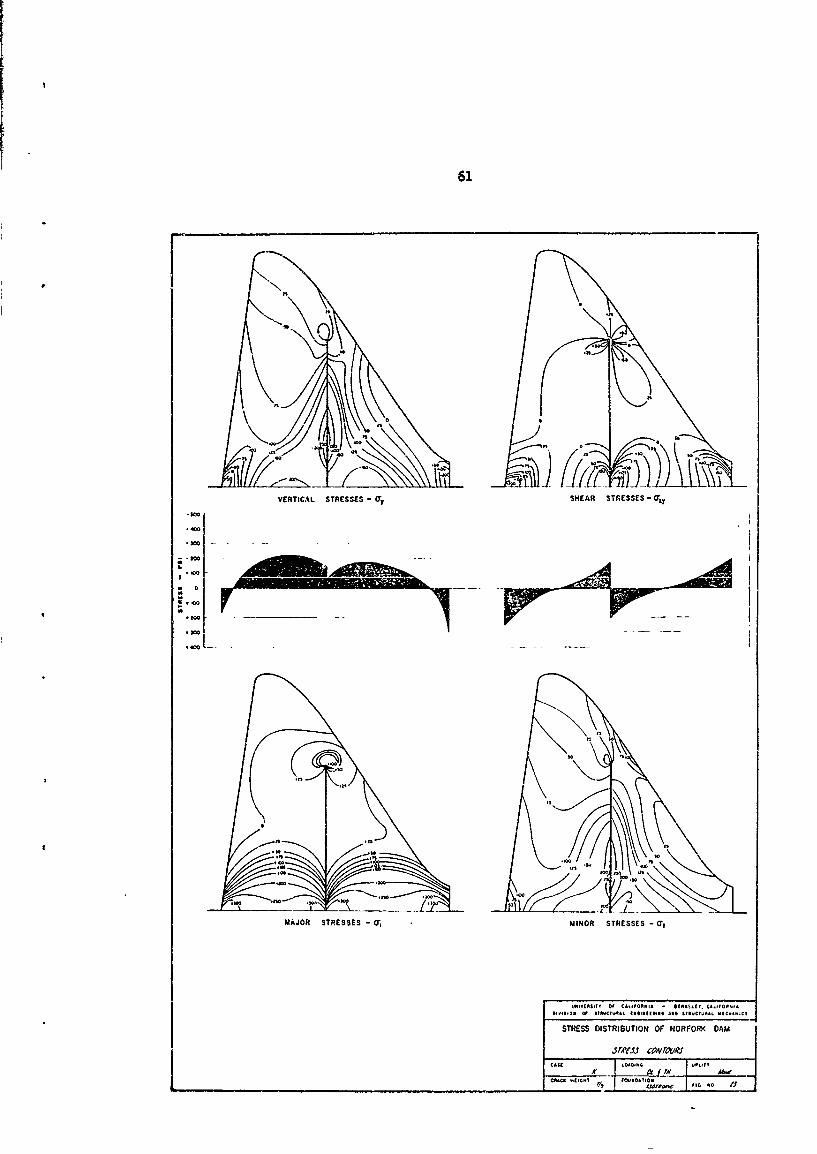
23 Stress Contours - Cane K 61
24 Stress Contours - Case L-1 61a
LIST W ILLUMT IONS (Contd)
Number Title Pqe
25 Stress Contours - Cae L-2 62
26 Stress Contours - Case M 62a
27 Stress Contours - CaBe N 63
28 Stress. Coatours - Case 0-1 63a
29 Stress Contours - Case 0-2 66
30 Equilibrium of Block at Top of Crack 69
31 Effect of Crack on Base Stresses 71
32. Boundary Displacemants - No Crack 72
33 Boundary Displaceents - 2/3 Crack 73 I34 Bound ry Displacements - 7/9 Crack 75
35 Crack Displacements
vi
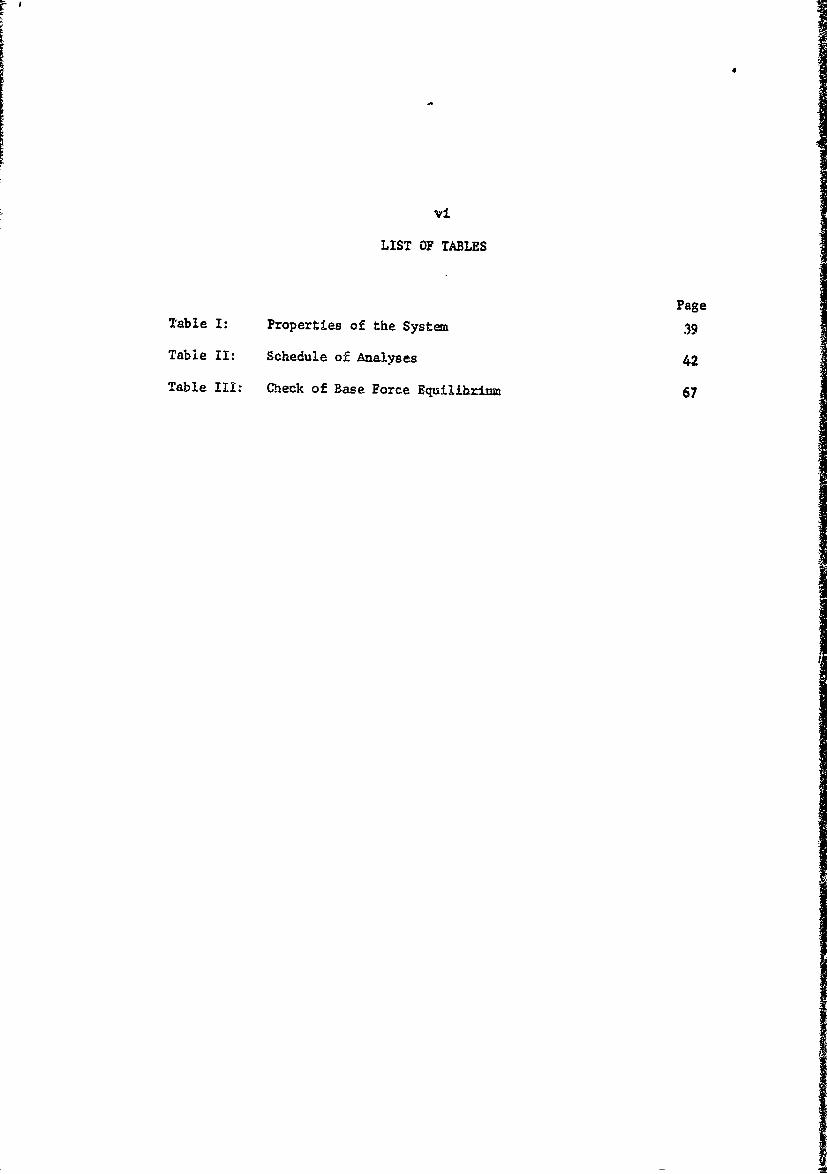
LIST OF TABLES
PageTable I: Properties of the System 39
Table II: Schedule of Analyses 42
Table III: Check of Base Force Equilibri=m 67
vii
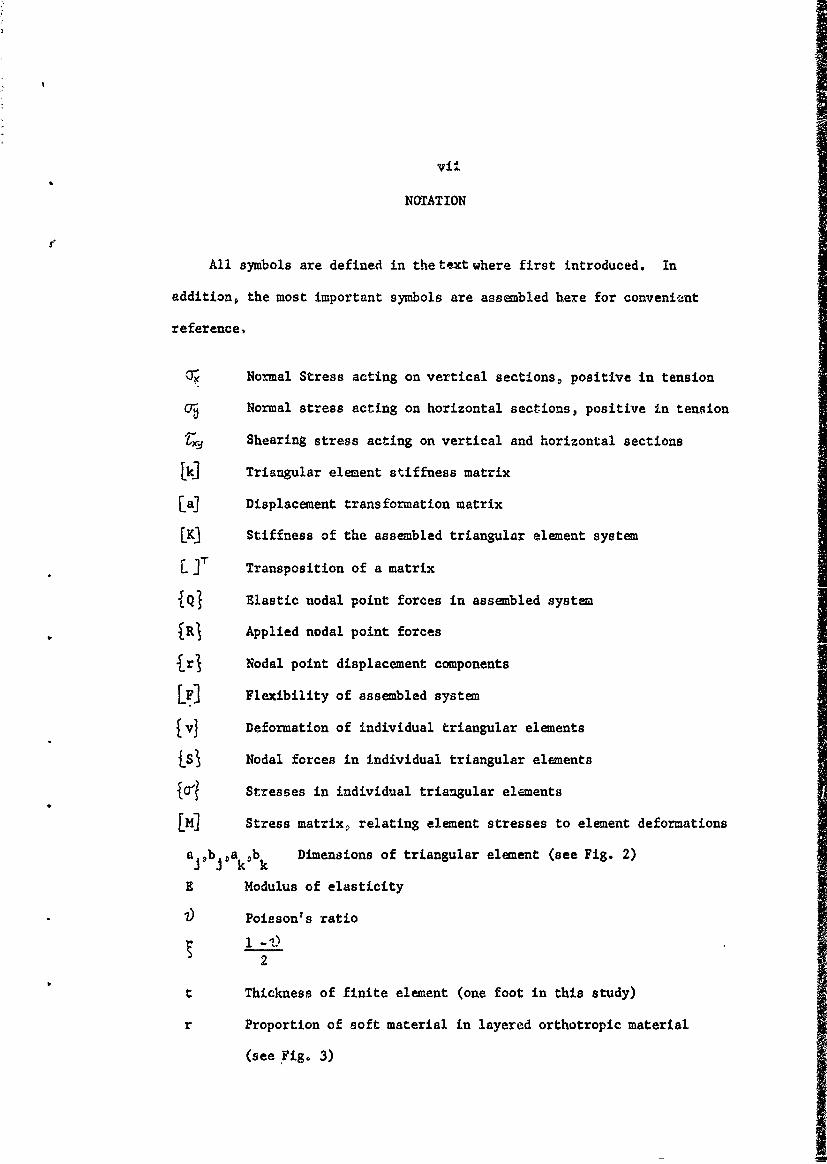
NOTATION
All symbols are defined in the text where first introduced. In
addition, the most important symbols are assembled here for convenient
reference,
Normal Stress acting on vertical sections, positive in tension
Normal stress acting on horizontal sections, positive in tension
Shearing stress acting on vertical and horizontal sections
lk] Triangular element stiffness matrix
[a] Displacement transformation matrix
[K3 Stiffness of the assembled triangular element system
T Transposition of a matrix
{Q1 Elastic nodal point forces in assembled system
JRJ Applied nodal point forces
Irl Nodal point displacement components
[F] Flexibility of assembled system
{V} Deformation of individual triangular elements
tS Nodal forces in individual triangular elements
{C ' Stresses in individual triangular elements
[M] Stress matrix, relating element stresses to element deformations
ajabja kbk Dimensions of triangular element (see Fig. 2)
H Modulus of elasticity
) Poisson's ratio
2
t Thickness of finite element (one foot in this study)
r Proportion of soft material in layered orthotropic material
(see Fig. 3)
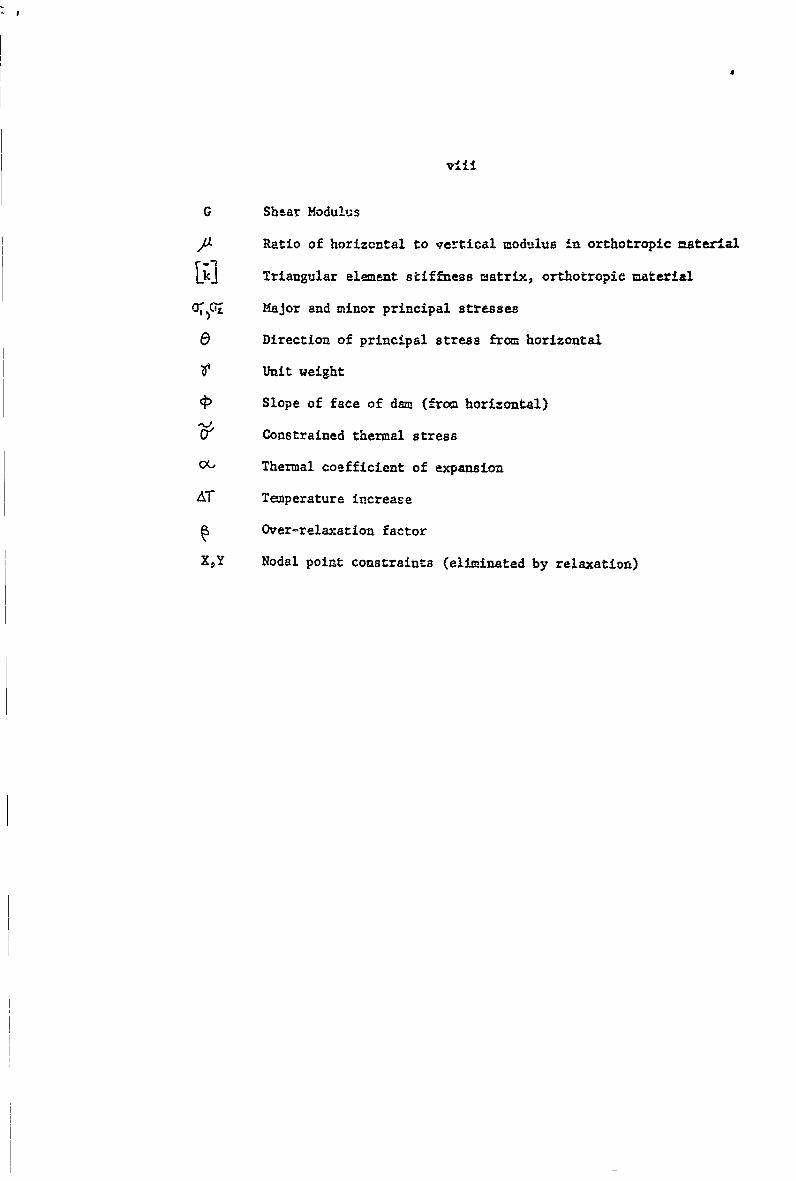
G Shear Modulus
'A Ratio of horizontal to vertical modulus in orthotropic material
kJi Triangular element stiffness matrix, orthotropic material
0O1l0 Major and minor principal stresses
Direction of principal stress from horizontal
Unit weight
Slope of face of dam (from horizontal)
Constrained thermal stress
CU Thermal coefficient of expansion
AT Temperature increase
Over-relaxation factor
XY Nodal point constraints (eliminated by relaxation)
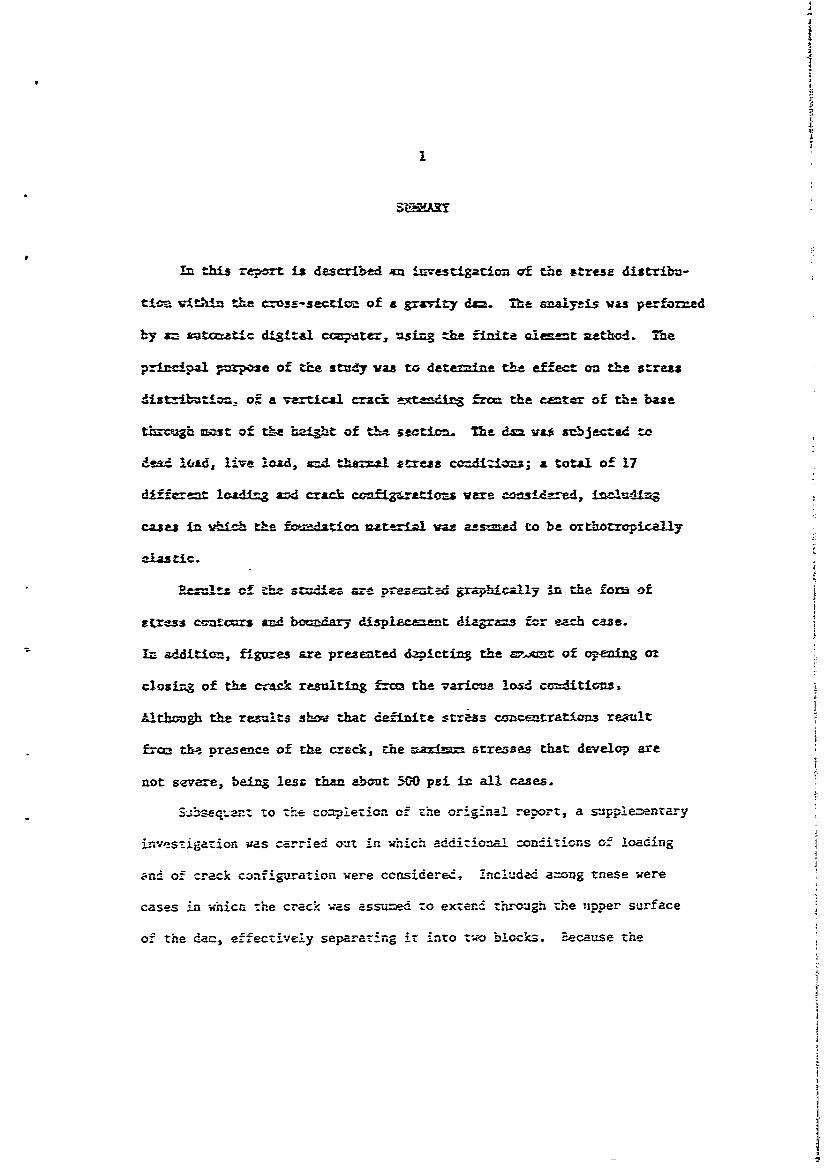
in this re-prt is described iminvestigaticn af the *tresa distribu-
tici.. vlthtn the cross-sectica of a gravity dz--. 7Ahe v&3yi w- perfonzed
by am- s'~tc~tIc digital ccmwretex, usirS the finite aciesent nethed. The
prizeipal prpose of the study vas tro date~thIe the effect on tta stress
dis--btin o.;: a vertical czat-ct_ Ii from the cmtcr of the base
threugh mcst of the hegh of -the stetica. Me dsm vs* stbJ acted wo
Z4.Z I&Ld, live lomad, =nd thsn.-*l stress c=.diziozs; a total of 17
dIfcreat loadingZ szd crack ccni j-rton wee osieed l ig
cae in vh '4.ot fotrdatien =aterizl vas ass--ed to be oxthatropically
R-"- of the s--e arz emeae gapialyIn thefom o
Stress' CIcntc~rs and boundary displacement diagrans far ezac case.
Im addition, figures are presented dzpicting the o,=_ of o~ening o0z
closing of the crack resulting f--= the- varicus losd cc~ditions
Although the rersults show1 that definite stress concentrationa remlt
from~ th-- Dresence of the crack, the axm stresses that develop are
not severe, being less than about SO0 psi in all cases.
S se, zzto the cc=_Iezt:.n c: the origi-nal rep~ort, a supplenentary
in'sxaricn was carr-*ed ouat in which addiz~ioa- cad -Aso odn
;nd of crack czaiguration were ccasidered, Imcludea a~ang tnese were
cases in whict t-he crack was assumed to extend- tnrough the :zpper surface
of the darm, ef-fectively separating it i;nto two blocks. Because the
Ia
f::!!ng of the reservoir behind such a section causes the crack to close
graduallY from the top downwards, it was necessary to develop an in-
crezental anelysis procedure for the full crack height cases. The results
of this supplezen:ary investigation are presented here as a supplement
to tne origina_ report (see p. 85). They show that, although the
presenct, of a crack extending through the full height of the section
leacs :o a moderate increase of st'ress concentration at the base, the
stresses still are not severe--only about 600 psi maximum.
2
THE STRESS DISTRIBUTION OF NORFORK DAM
INTRODUCTION
Origin of the Problem
The distribution of stress which actually exists in massive concrete
gravity dams has long been the subject of conjecture. A number of
experimental studies have been carried out (1'2,3both in the laboratory
and in the field, in a* attempt to establish the order of magnitude of
the errors inherent in the simplified assumptions which form the basis
for design. The results of these investigations have shed considerable
light on the problem and bear out the adequacy of the design assumptions
in normal cases. However, little is known about the distribution of
stress in dams in which conditions differ radically from the normal.
One condition which is known to exist in a number of structures,
but the effect of which has not been studied previously, is the presence
of a vertical crack or system of cracks, extending in planes parallel
to the longitudinal axis of the dam. Such a crack, if it extended
through a major portion of the height of the dam, obviously could have
a significant effect on its structural action in resisting water loads,
and conceivably could reduce materially its overall factor of safety.
The purpose of the investigation described in this report was to
determine the influence of such a vertical crack on the stress distribu-
tion and deformations of an actual concrete gravity dam. The subject of
the study was the Norfork Dam, a 230 foot high structure built on the
North Fork River in Arkansas by the United States Army Corps of Engineers.
Extensive cracking was noticed in this structure during its construction,
*Numbers in parentheses refer to similarly numbered References listed atthe end of this report.
3
and a rather extensive survey of the distribution and sise of the principal
cracks has been carried out during the 18 years since its coaqletion. On
the basis of this study it was apparent that Nonolith 16 was one of the
moat severely cracked portions of the structure and it was selected at a
subject for mathematical anaiycis.
Within this monolith was one principal crack, located approximtely
in aid-vidth and exteuding vertically cvr most of its height. The
specific objective of this study was to determine how such a single crack
in an otherwise solid section would affect the distribution of stress
within the section. The vertical eztent of the crack could not be
established with great reliability, thus this factor was selected as one
of the principal variables of the study.
Analytcal Procedur
A second, and also very valuable, pvrpose of the investigation was
the wvluation of a recntly developed method of plane stress analysis ( 4)
This method, which Ls nown as the "finite element method", takes ad-
vantage of the trmnndous computational capacity of modern high-speed
digital computers. It had been tested previously in relatively inor
academic problems, but its effectiveness in solving a full scale practical
problem had not yet been demonstrated.
The fundamental concept of the finite elauent method was developed
originally( 5 ) in an attempt to extend and ganeralize the "lattice analoty"
Which had been proposed as a method of plane stress analysis by
(6) (7)rornnikoff (6)nd .Mc~enry over twenty years ago. An interesting side
issue of this investigation was the offer of Mr. MHenry* now working
with the Portland Cement Association, to uak a similar analysis by theDirector of Development, Portland Cement Association Research and Development
Laboratories, Skokie, Illinois.
4A
lattice analogy procedure (which had not previously been programmed for
the digital computer), This analyais provided an independent check on
the results obtained by the finite element method, and also made possible
a comparison of the relative merits of the two procedures.
Scope of the Investigation
The geometry of the cross-section considered in the investigation
and the properties of the concrete and foundation rock were specified by
the Contracting Office. Loadings which were considered included dead
load, live load (hydrostatic pressure), and the effects of temperature
changes. Stress distributions and deformations were calculated due to
these load conditions applied in various combinations, as agreed upon by
the investigators and the Contracting Office. The initial width of crack
opening was defined under a combined temperature change and dead load
condition. The additional influence of the live load in closing the
crack and stressing the structure was then evaluated. Because the
foundation rock appeared to have a considerable amount of jointing in
horizontal planes, it seemed probable that its effective modulus of
elasticity in the vertical direction was considerably less than in the
horizontal direction. Therefore, the effects of an orthotropic foundation
was studied in two cases.
All of the analyses were performed on the IBM 704 electronic digital
computer operated by the University of California Computer Center. The
principal computer program used in the analyses was developed by the
investigators, prior to the initiation of this contract, on a research
grant from the National Scieice Foundation. However, a few minor program
modifications and extensions were made during the course of this study.
Stress distribution and displacement results were printed by the computer in tab-
ular form, but were subsequently portrayed graphically for easier compreheasion.
I
5
METHOD OF ANALYSIS
The basic problem to be solved in this investigation was the
determination of the stresses and displacements in a plane-stress system
of arbitrary dimensions and properties, due to the application of tempera-
ture changes, external loads, and its own dead weight. The finite element(4)
method which was employed in the analysis has been described previously
so the basic principles of the procedure will be reviewed here only briefly,
However, several aspects of the present problem required the development
of new concepts and techniques which will be described in full.
The Finite Element Approximation
The basic approximation introduced in this method of analysis
is the representation of the actual plane-stress system as an assemblage
of triangular plate elements, interconnected only at the corners or
nodal points, and each subjected to a state of plane stress. This
idealization replaces the actual elasticity problem by a structural
analysis problem. The advantage of the substitution is that the conditions
of compatibility and equilibrium, which must be represented by partial
differential equations in the elasticity problem, may be expressed by a
set of simultaneous algebraic equations in the structural problem. This
problem may then be solved by standard methods of structural analysis.
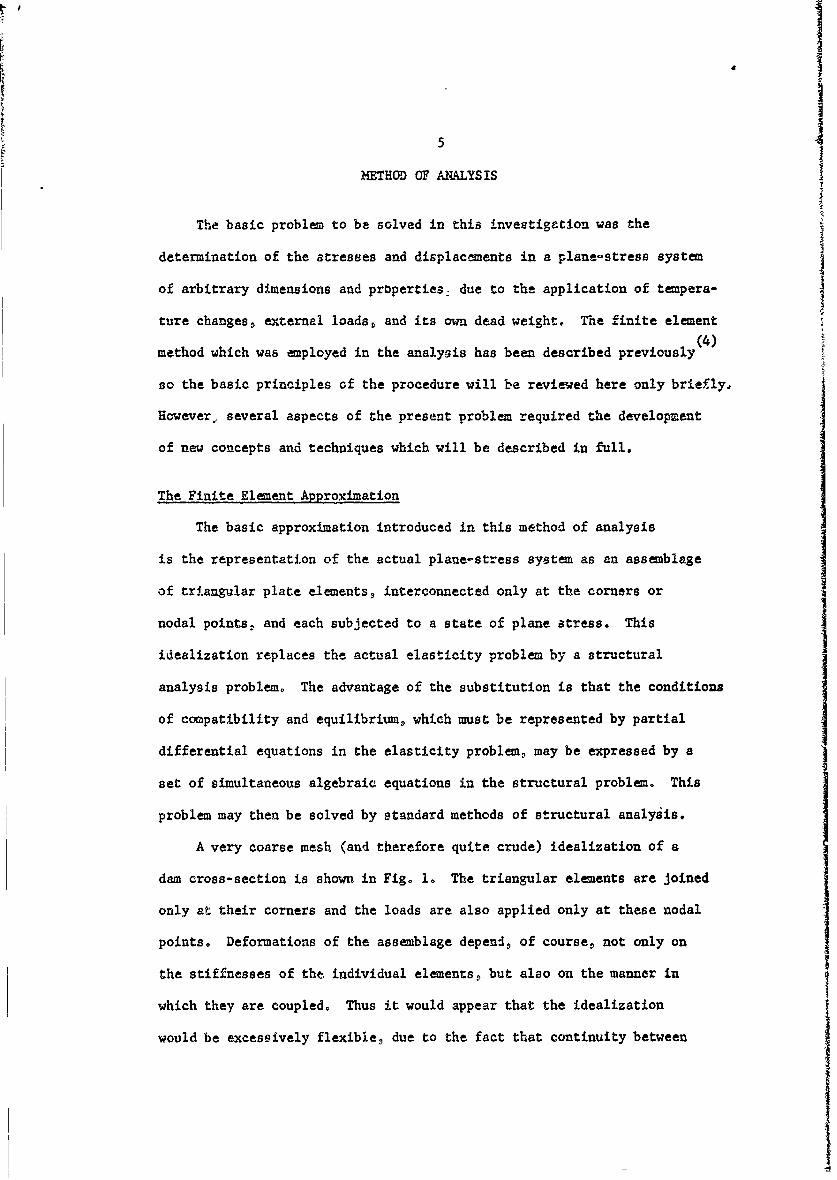
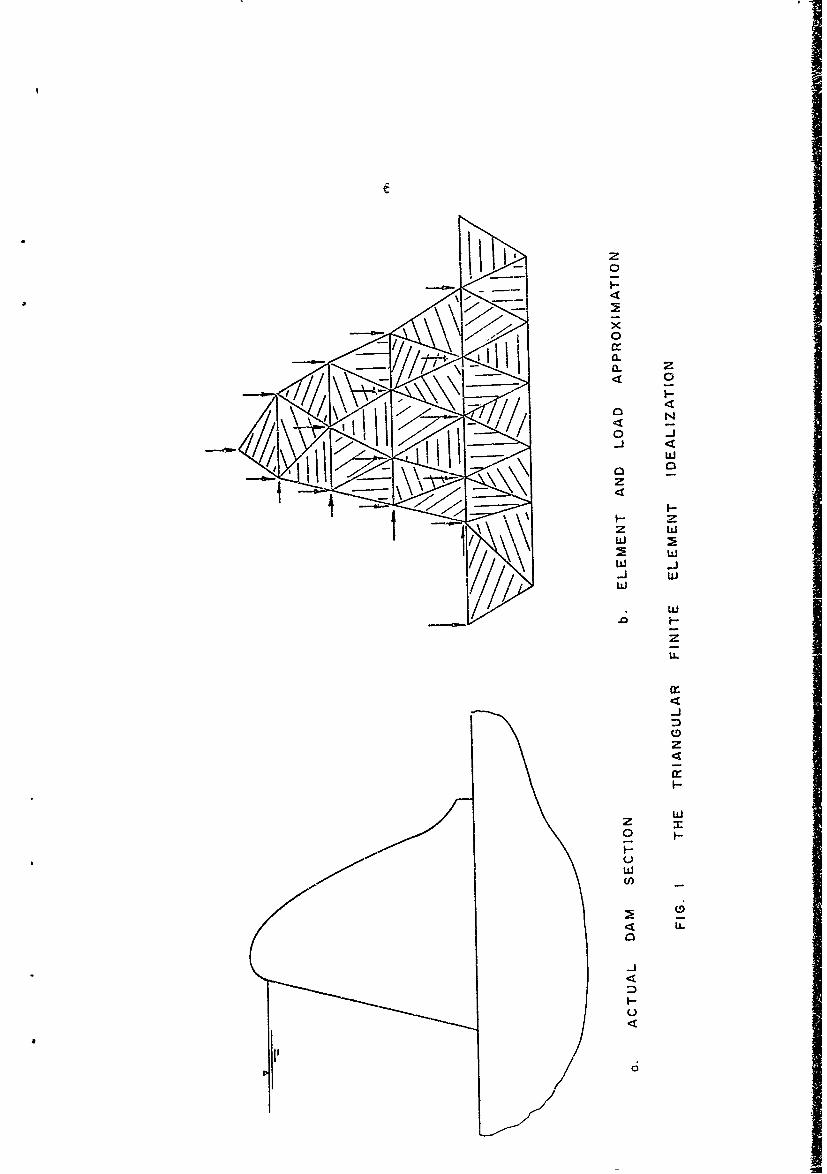
A very coarse mesh (and therefore quite crude) idealization of a
dam cross-section is shown in Fig. 1. The triangular elements are joined
only at their corners and the loads are also applied only at these nodal
points. Deformations of the assemblage depend, of course, not only on Ithe stiffnesses of the individual elements, but also on the manner in
which they are coupled. Thus it would appear that the idealization
would be excessively flexible, due to the fact that continuity between
e
* Ii 0
0
0~z
4 0
I-.4N
o4~{hj~%1 IlnL \ wz4
w-Jw
w.0
wzIL
4-J
0z4
I-
wI
o HI-C-)wU)
04 LL0
-J4
HC.,4
II0
the elements is imposed at so few points. However, this incomplete
continuity condition is compensated by the assumption that the stresses
within each element must be uniform; i.e., the normal streasas in the
horizontal ( or ) and ver- ..' ,) directions, and shearing stress ('V)
are constant within each element. As a result of this assumption, the;
edges of each element remain straight under load, and therefore continuity
is achieved not only at the nodal points but also along the element
boundaries as well.
It should be noted that one of the major advantages of the finite
element approximation is that the properties of each element may be
selected independently. Thus different moduli of elasticity, Poisson's
ratios, unit weights, thermal changes, etc., can be imposed in each
element without increasing the complexity of the analysis. This Icharacteristic of thi method is particularly advantageous in the analysis
of dams where a definite discontinuity of properties is likely to exist
between the foundation rock and the concrete of the structure.
The Matrix Analysis Procedure
The finite element idealization of a plane stress problem constitutes
a highly interconnected structural system. For such systems, the displace-
ment method of structural analysis has proven to be most effective; and
for large systems, the use of matrix algebra leads to the most efficient
computational processes. A general description of the displacement method
formulated as a sequence of matrix operations has been published previous-
ly( , but the principles will be reviewed here for the convenience of
the reader,
The analysis begins with a description of the structure and its
loading expressed in matrix form. The properties of the structure are
defined in two matrices; one, called the element stiffness matrix, expresse3
the elastic properties of each of the triangular elements making up the
structure; the second, called the diaplacemout transformation matrix, de-
fines the geometry of the assemblage. In addition, the listing of the
vertical and horizontal load components applied to each nodal point compriseu
the load matrix. These three matrices, which will be designated [k] 9
Lai , fnd {RJ respectively, are discussed further in the following aections
of this chapter.
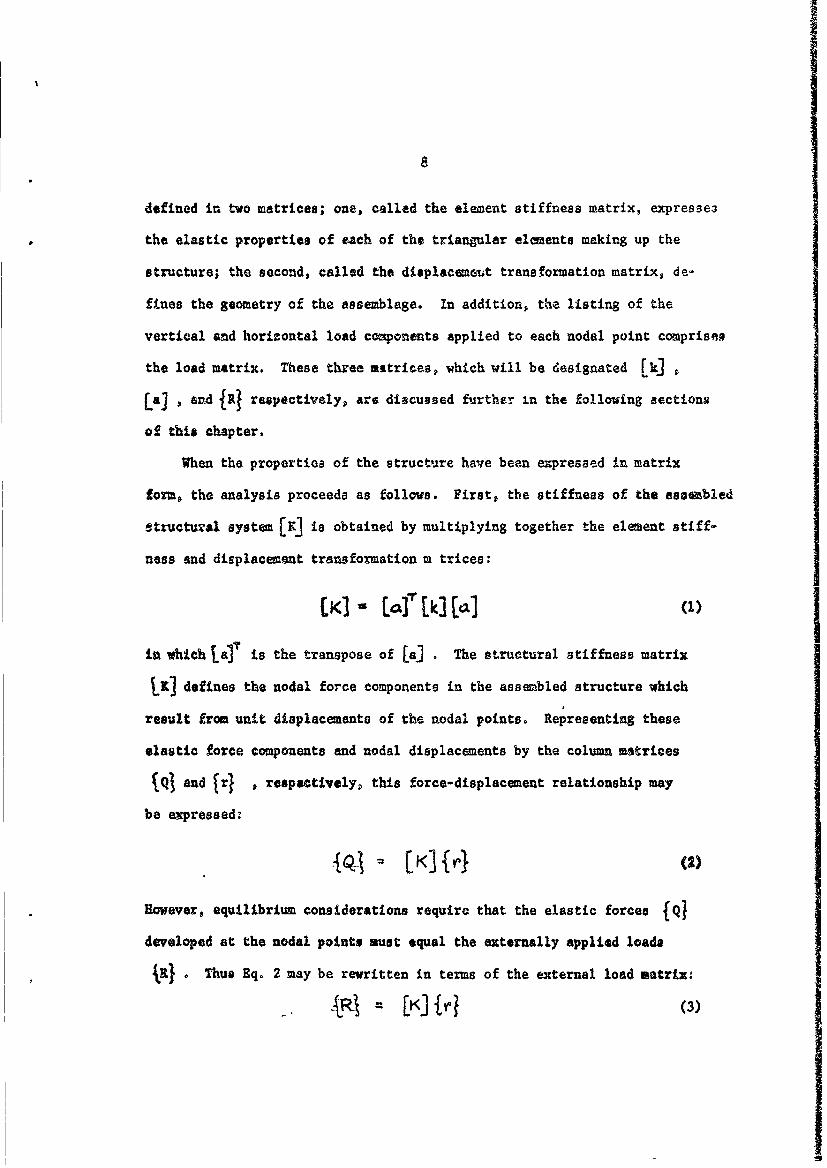
When the properties of the structure have been expressed in matrix
form, the analysis proceeds as follows. First, the stiffness of the asaenbled
etructursl system LKJ is obtained by multiplying together the element stiff-
ness and displacement transformation m trices:
(K] m (1)
in which [af is the transpose of [a] .The structural stiffness matrix
[it] defines the nodal force components in the assembled structure which
result from unit displacements of the nodal points. Representing these
elastic force components and nodal displacements by the column matrices
( and ir} , respectively, this force-displacement relationship may
be expressed:
[K] (2)
However, equilibrium considerations require that the elastic forces {Q)
developed at the nodal points ust equal the externally applied loads
Thus Eq. 2 may be rewritten in terms of the external load matrix:
[K (3)
9
IA r typical problem the loads {RI are given, while the displace-
ments frl are to be determined, thus the next step in the analysis is
the inversion of the stiffness matrix to obtain the flexibility of
the structure 1FJI
[FI - 1KT (4)
Multiplying both sides of Eq. 3 by the flexibility matrix then yields
an expression for the displacements in terms of the loads,
Eq. 5 thus provides one part of the final analytical results which were
required: the deformations of the structure.
After the nodal displacements have been determined, the dekormations
of the individual plate elements: denoted by the column matrix {t }
can be determined by applying the displacement transformation matrix,
j{r 1 (6)
M4ultiplying these element deformations by the element stiffness matrix
then yields the nodal point forces jS1 in each element,
r- [k]{j = [r3j?(7)
(It may be noted that Eqs. 6 and 7 essentially constitute definitions
of the matrixes [a] and [k] ).
In the, analysis of a structural system which is composed of bar type
elements, the nodal point forces would represent the final results. How-
ever, in the plane stress problem considered here, the distributed stresses
10
within the elements, Jo% , rather than the resultant nodal forces, are
of primary interest. Thus one final step is needed, the transformati:n
from nodal forces to element stresses, Designating the stress transfor.-
iation matrix by the symbol [rn] , this operation is performed as follcros
{o-} = [Vqts}= [rjk{: 8
Finally, representing the above matrix product by a single symbol
LM Lrn][k] (9)
Eq. 8 may be written
L~j~cPir ~(10)
in which M] performs the function of transforming from element
deformations to element streeses. The entire analytic procedure is now
contained in Eqa. 1, 4, 5, and 10.
Although the procedure described above is straight-forward, and
provides a convenient method for the analysis of small to moderate-size
systems, the inversion of the stiffness matrix (Eq. 4) is a tremendous
task whep large systems (involving over perhaps 100 nodal points) are to
be analyzed. In order to avoid this problem, an iterative solution of
Eq. 3 for the nodal point displacements was substituted for the inversion
process. Using this approach the procedure is capable of treating systems
having as many as 600 nodal points.
Element Stiffnesses
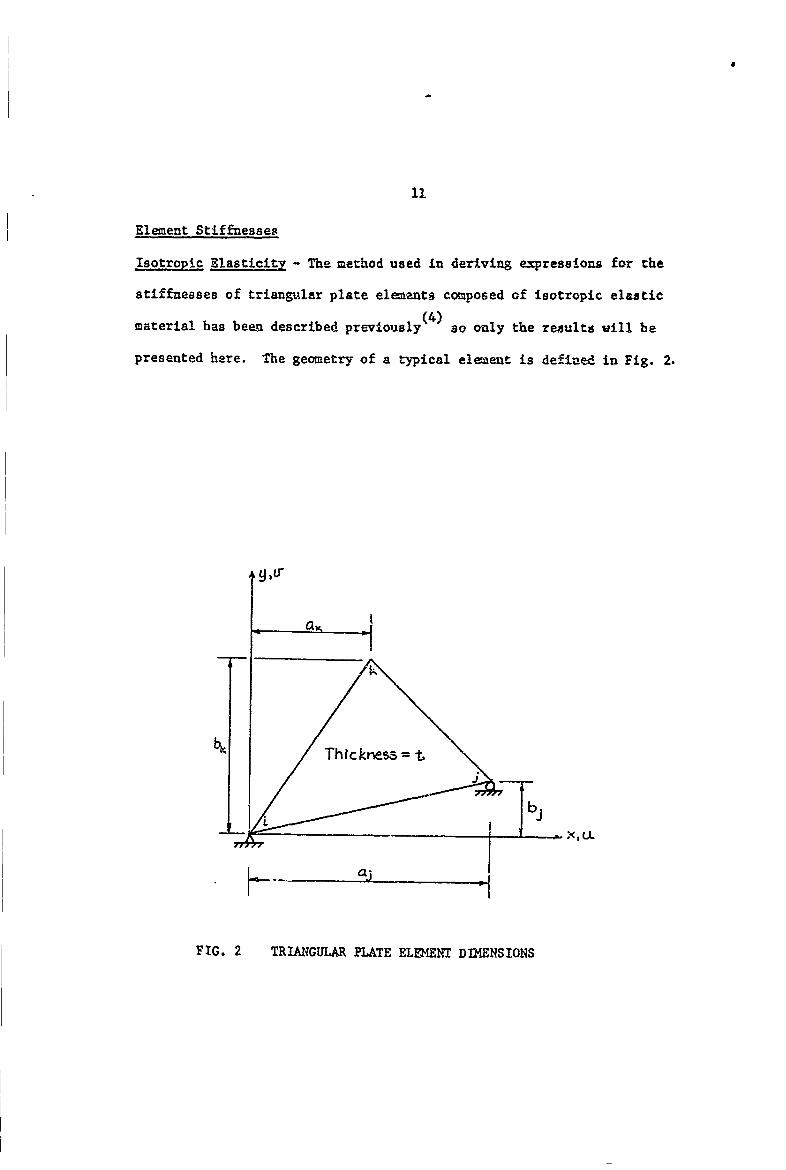
Isotropic Elasticity - The method used in deriving expressions for the
stiffnesses of triangular plate elemants composed of isotropic elastic
material has been described previously (4 0s only the results wili be
presented here. The geometry of a typical element is defined in Fig. 2.
a.
Thickness
FIG. 2 TRIANGULAR PLATE ELEMENT DIM4ENSIONS
U-
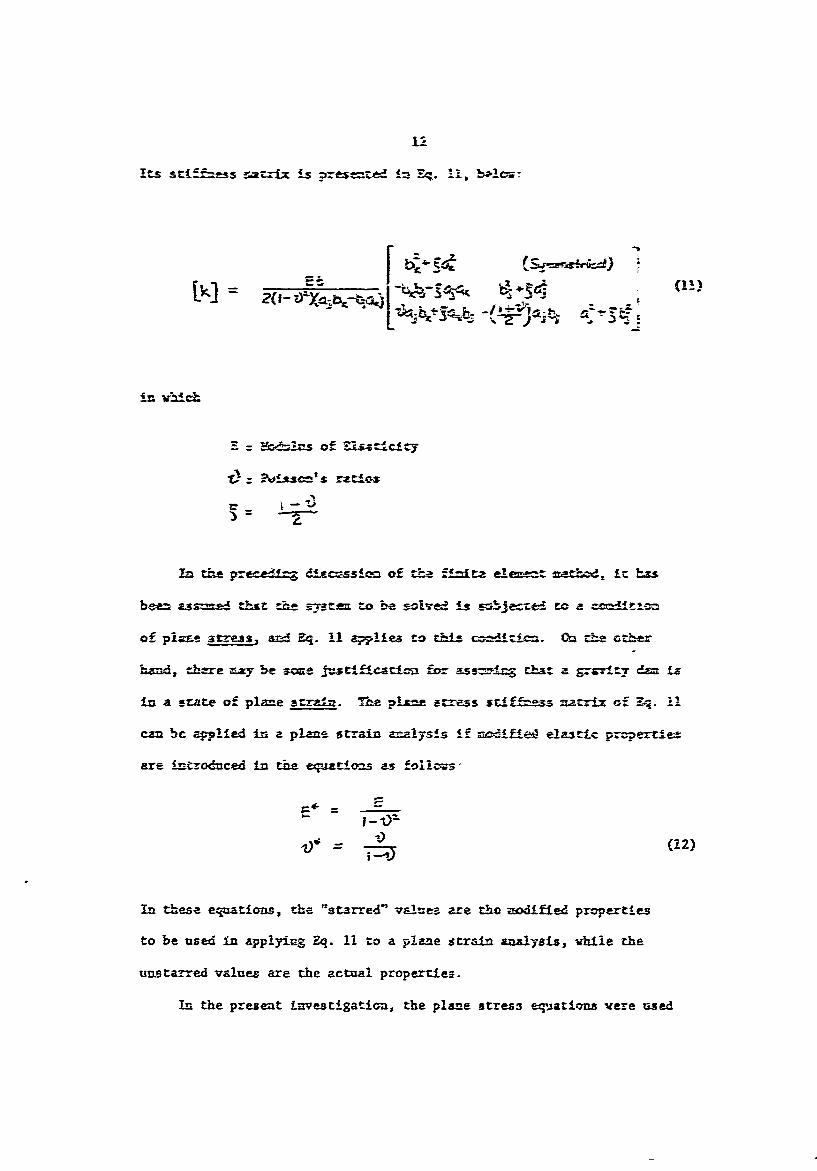
its sti!:f-es r.2zzix is =.esen-""d in Eq. II b-cr-
la -1ss s raie
Imm the preedi=& dixczssicm of the ftiir. eemr- izezcx4 ic has
bte assted thst ta~e -- ste to b-- s--ved is jte3wa camricten
of pla-me gtres am-A Zq. 11 applies to t c rien Cm c!; ortr
h~and, there m.ay be sze ustiftcatice for as--In that a Srzw~r' da= !x
in a etate of plzne raim. The plzn-e stress srlff.ess nz-arix of Sol. 11
can bc applied in a plane strain an-lysis if mciftceg elzsric proc-ertie±
are "n-croduced in th~e e*gatioas as follor-s-
In these equations, the "at-arred" value-- are the uodiffied properties
to be used in applying Eq. 11 to a plane strain analysis, while the
uns tarr.ed values are the actual properties.
In the present inergtothe plane stress equations vere used
exclt~stely bt--a-se it wa sr.ed rbat the m~t-d :) ;-ntz-.tcton
it na so be at-3 that far th~e valaes- -,f -L -11t:
at-* (I)= G.17), the differeazebeteen zze pz~ic : rpe-
t'!es C E*= 1.03E: i3'2O) s iell wijhin 1the -=t--
accztrzc vicA whbith cheie valtzes can 6e estoated ThsAs Lc- ., as
to vlhethr a c~dtzc- of plane strea-A or plan~e stra1in e~ists is only
of &:sdac ilttec3c.
*rborcic BlS.3ticitvl - n o-der to establish the !fluerzze 3f ezi
othar-ct fo &tisscn =aertai m -:he stress dist riti i~n the den.-, it
va~s nezesszary to deselop the stiffomes6 satelx for an orthorrpic, triangular
elm___ 7he derivatica of the- arthotropic stiffness --ecrt-L fallaried
ea;ythe s=-a procedure used in deriving the isotr.,opir au fneas Matrix
exce,t tbhat th:e stress-szcafr relationabip for the orthotropic material
vas scb!stirtited for the isotropic stress-strain relationship used In
Relarence &. Th'ais the first req~arezent gaS the deriv~tlof3 the ortho-
tropic stress-strain relatinsbip.
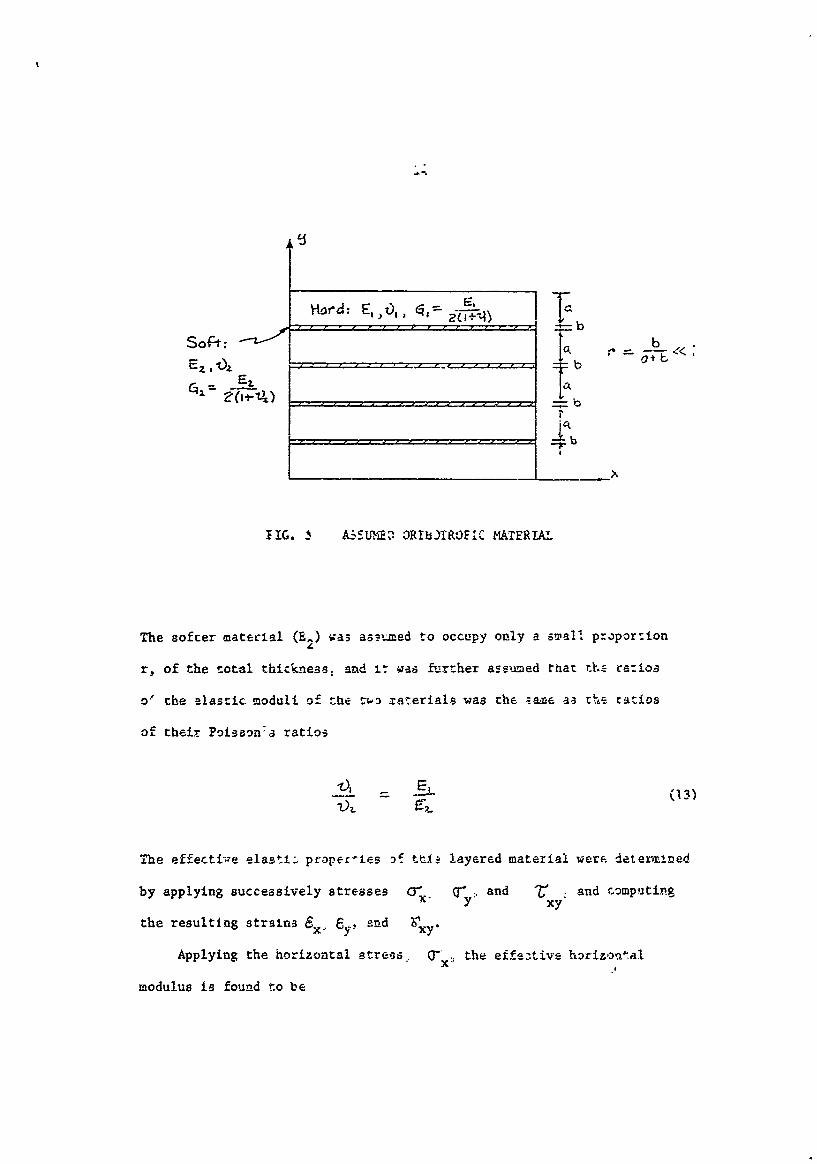
For this purpose, ir was ass-xed that the orthotropic m~aterial w~as
actuislly a layered sytr= caris±iring of two isotr:?pic materials of
different eiffnesses, E1 and E2 , as shcon in Figure 3.
Hari: E,,O,, O82-(-i.1 : TaSort: ...
Ezb
i"
1IG. &:-SUb,12' ORIh)1ROFIC MATERIAL
The softer material (E2 wa) s as.tmed to occupy only a small proportion
r, of the total thickness, and it- was fur-her assumed that oth.= ca:ios
o' the elastic moduli of --e m iaterials was the -ame as 0.a ratios
of their Poisson:a ratios
The effecti-ie elasti; proper-Les D ttiS layered material wert. detezined
by applying successively stresses G. q-y, and Vx y and computing
the resulting strains 6x, and rx.
Applying the horizontal stress, 1X , the effe.'tive horizontal
modulus is found to be
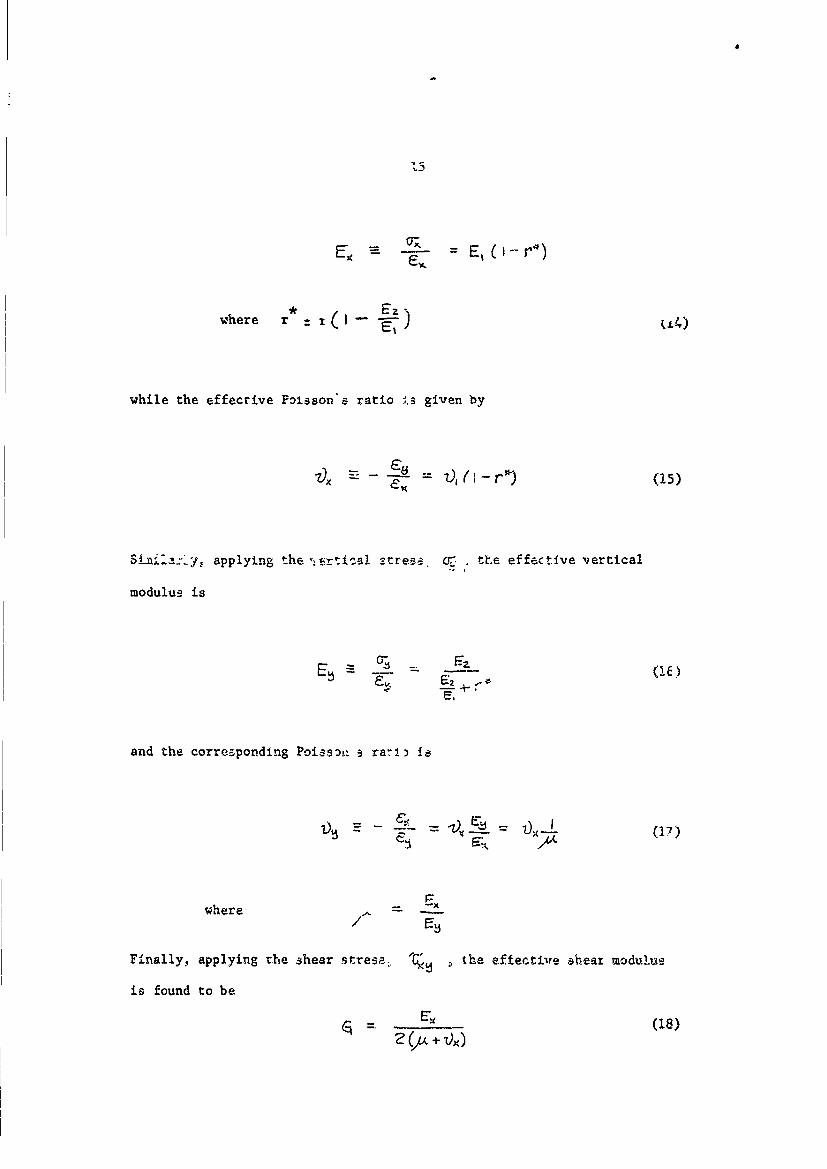
* E,
where r - -4)
while the effecrive PDIsson's ratio As given by
S~ia-Ly, applying the%, rtisl srre=s- ic t.e effective vertical
modulus is
E! =; - - F- (if)F-=,)
and the corresponding Poi~ss, a rarl) !a
(17)
E,where "
Finally, applying the shear stress, TY the eftective sheax modulus
is found to be
G -E (18)
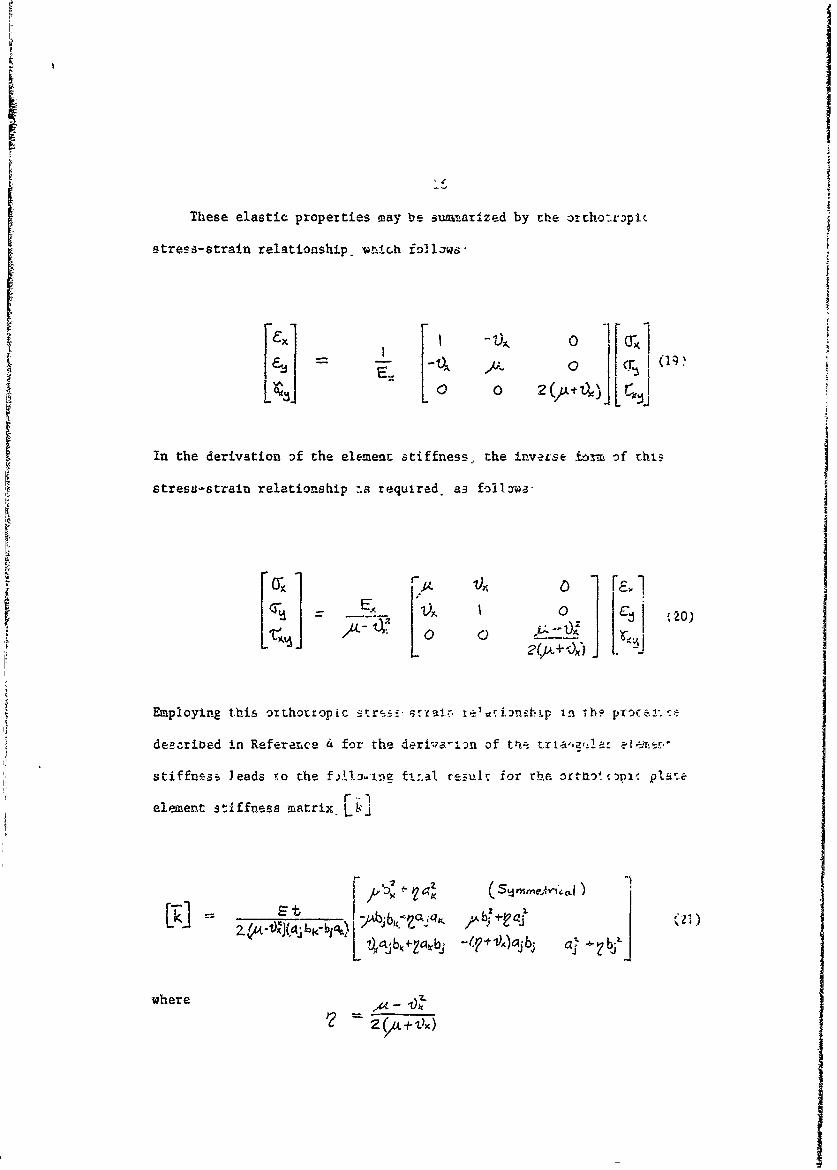
These elastic properties may be summarized by the oztho- r.plc
stres -strain relationship. 'nich fola]lws
L I J L 0 C,
in the derivation :f the element stiffness, the inverse iorm of tht.-
stress-strain relationship '.a required. a3 follaoa-
I I
Employing t.his olthotropic itr :sz', srtai.. re.1.i:nsb,_p In the p
described in Reference 4 for the deriwa-:in of t t rie'.A, el'-:r.°
stiffness leads to the fA!:--'ine fttal reslt ior the pi: pia .
element stIffness matrix. r
where
i
I
E4
-7
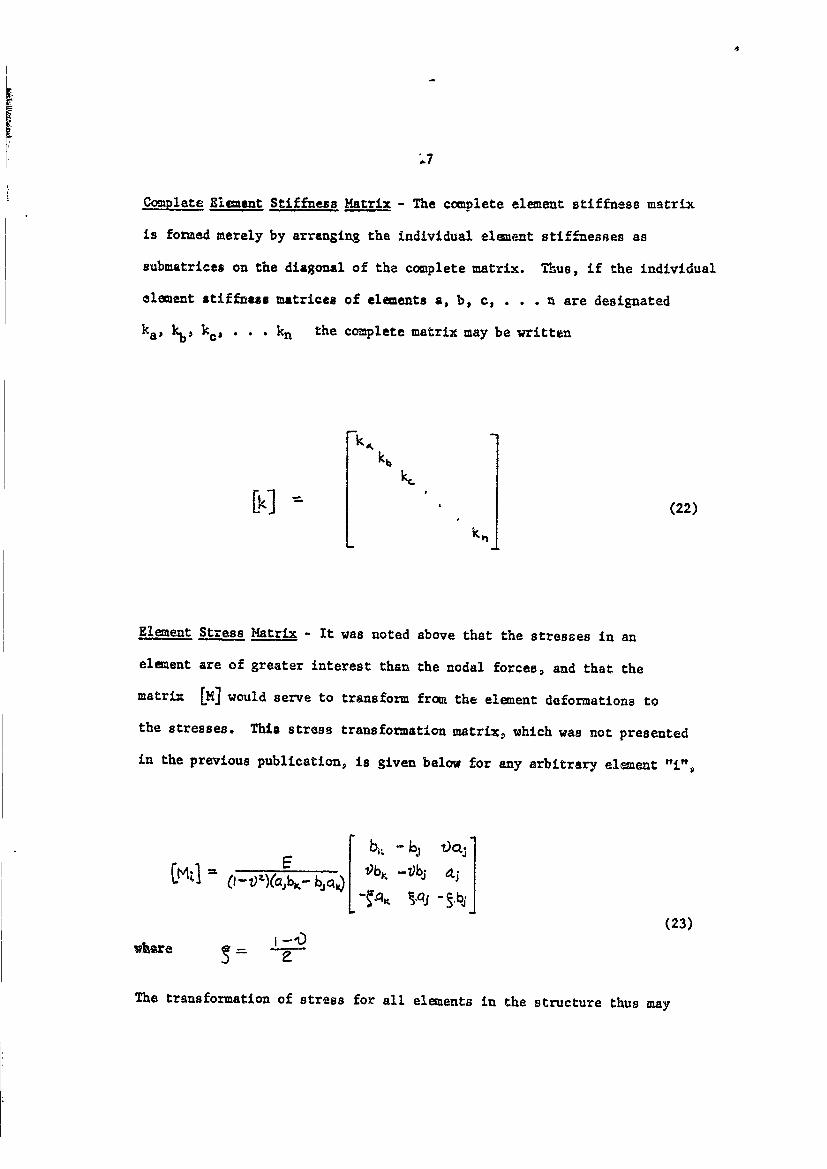
Complete Element Stiffness Matrix - The complete element stiffness matrix
is formed merely by arranging the individual element stiffnesses as
submatrices on the diagonal of the complete matrix. Thus, if the individual
element stiffneass matrices of elements a, b, C, . . . n are designated
ka, kb, kc. . . . kn the complete matrix may be written
kb[kk]
, (22)kri
Element Stress Matrix - It was noted above that the stresses in an
element are of greater interest than the nodal forces, and that the
matrix [M] would serve to transform from the element deformations to
the stresses. This stress transformation matrix, which was not presented
in the previous publication, is given below for any arbitrary element "i".
EF~ bi, -~ OQ 1-O -b
(23)
I-ot
The transformation of stress for all elements in the structure thus may
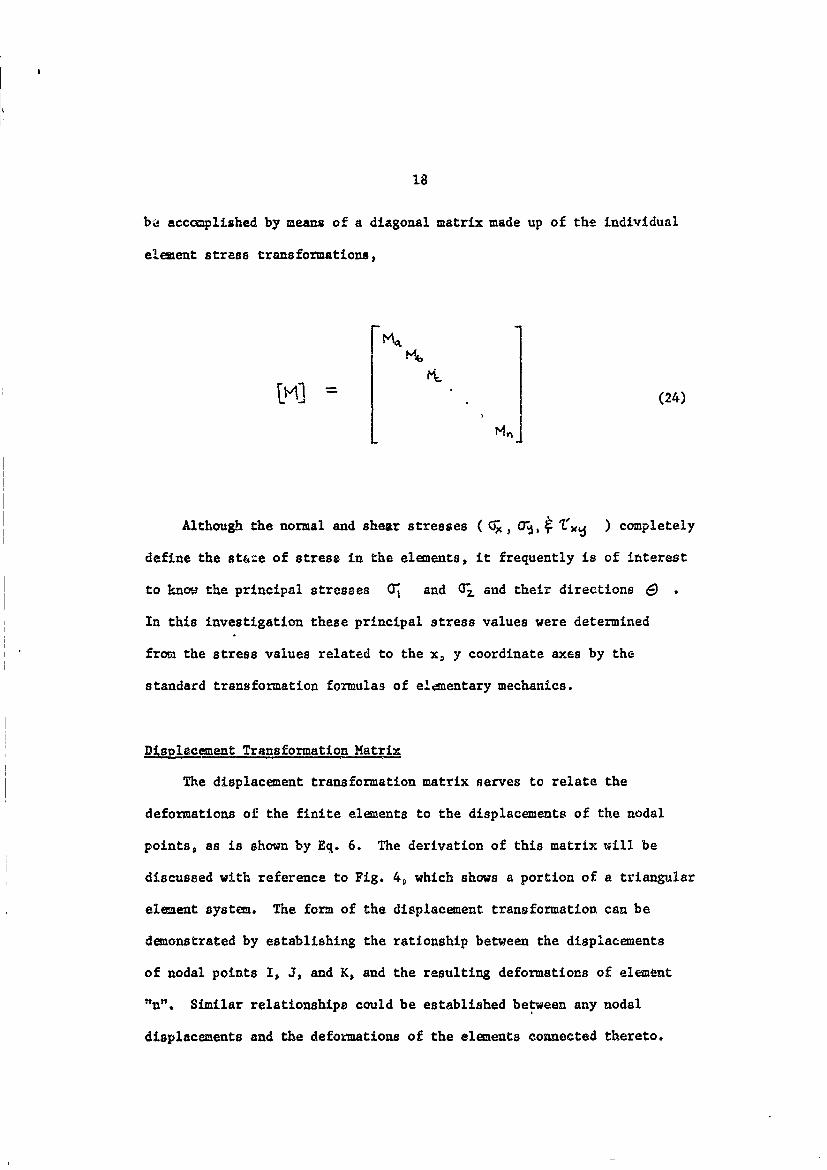
18
be accomplished by means of a diagonal matrix made up of the individual
element stress transformations,
M1
1(24)
Although the normal and shear stresses (Tx, 0"Z j ) completely
define the st&-:e of stress in the elements, it frequently is of interest
to know the principal stresses T, and zi and their directions .
In this investigation these principal stress values were determined
from the stress values related to the x, y coordinate axes by the
standard transformation formulas of elenentary mechanics.
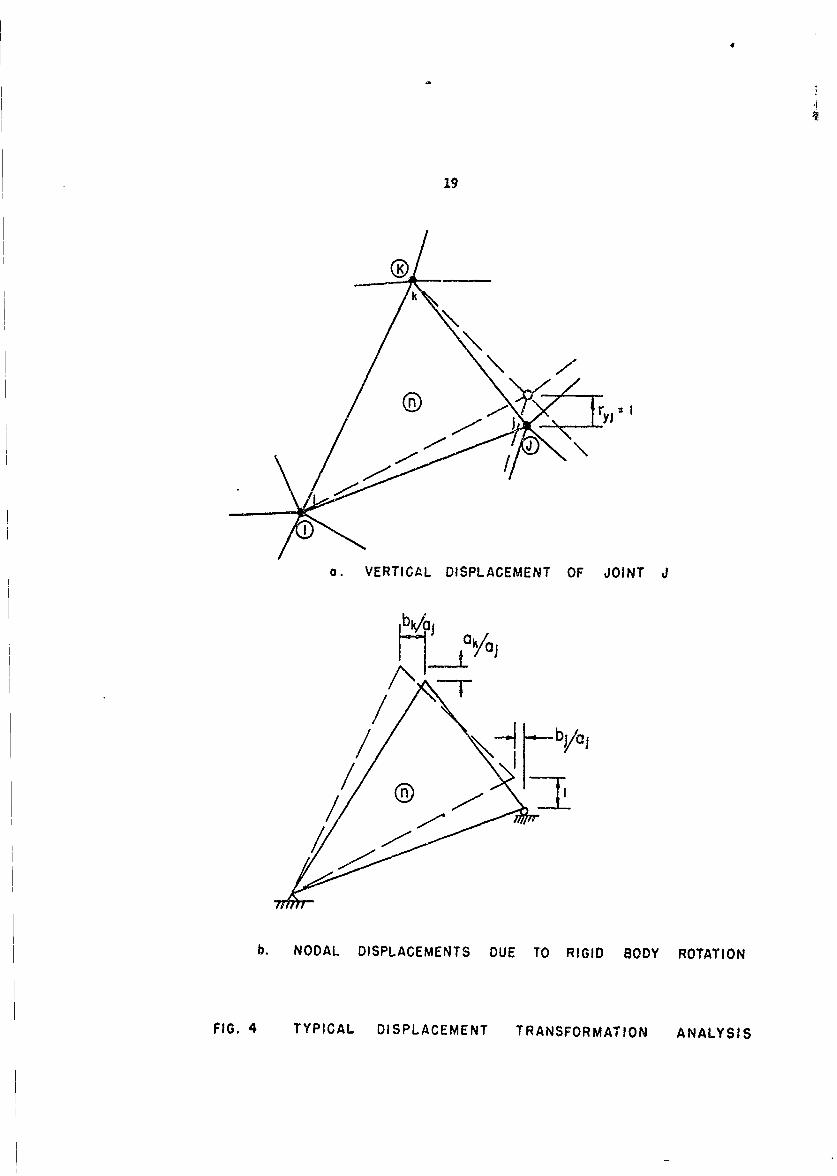
Displacement Transformation Matrix
The displacement transformation matrix serves to relate the
deformations of the finite elements to the displacements of the nodal
points, as is shown by Eq. 6. The derivation of this matrix will be
discussed with reference to Fig. 4, which shows a portion of a triangular
element system. The form of the displacement transformation can be
demonstrated by establishing the rationship between the displacements
of nodal points I, J, and K, and the resulting deformations of element
n Similar relationships could be established between any nodal
displacements and the deformations of the elements connected thereto.
19
k
I j
O. VERTICAL DISPLACEMENT OF JOINT J
b. NODAL DISPLACEMENTS DUE TO RIGID BODY ROTATION
FIG. 4 TYPICAL DISPLACEMENT TRANSFORMATION ANALYSIS
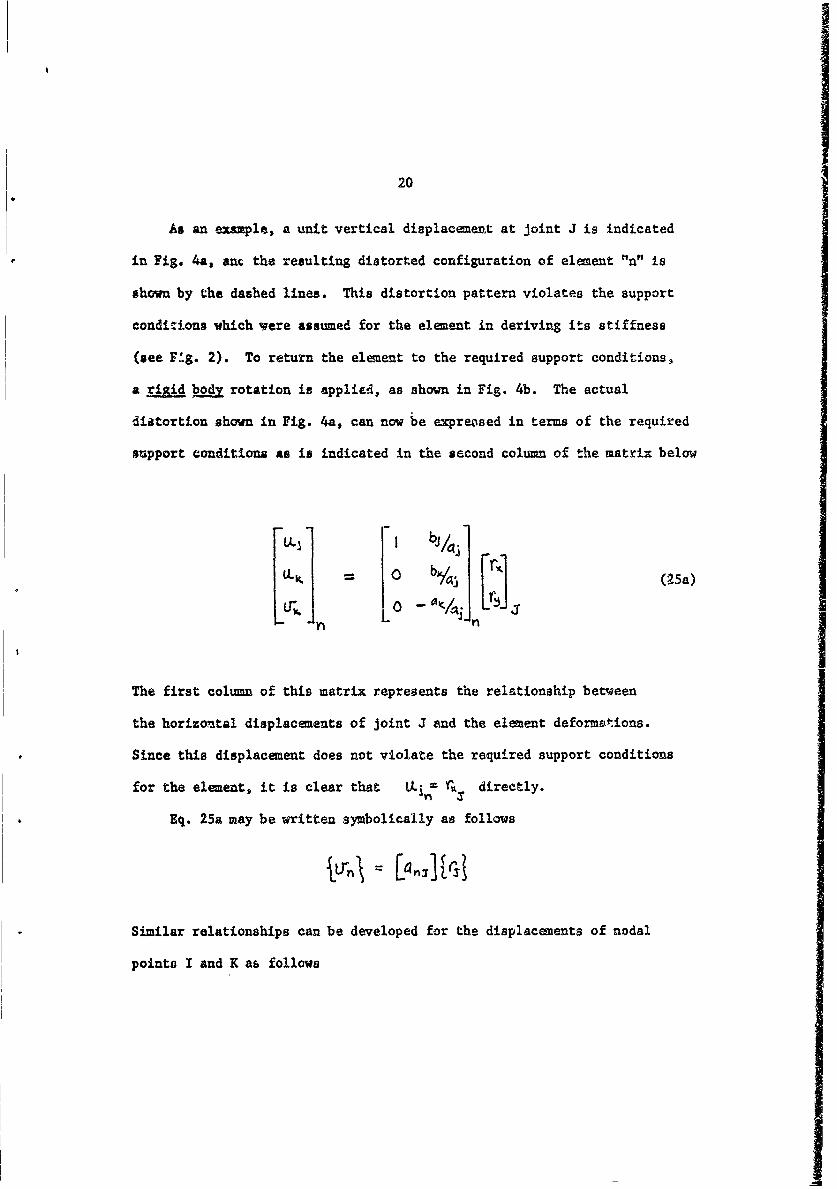
20
As an example, a unit vertical displacement at joint J is indicated
in Fig. 4a, anc the resulting distorted configuration of element "n" is
shown by the dashed lines. This distortion pattern violates the support
conditI.ons which were assumed for the element in deriving its stiffness
(see Fig. 2). To return the element to the required support conditions,
a Sigid bodZ rotation is applied, as shown in Fig. 4b. The actual
distortion shown in Fig. 4a, can now be expreosed in terms of the required
support conditions as is indicated in the second column of the matrix below
a jy 1L b%. l (25a)
The first column of this matrix represents the relationship between
the horizontal displacements of joint J and the element deformations.
Since this displacement does not violate the required support conditions
for the element, it is clear that LLj = Y,, directly.
Eq. 25a may be written symbolically as follows
j~n =[a,]Jryj
Similar relationships can be developed for the displacements of nodal
points I and K as follows
I4
21
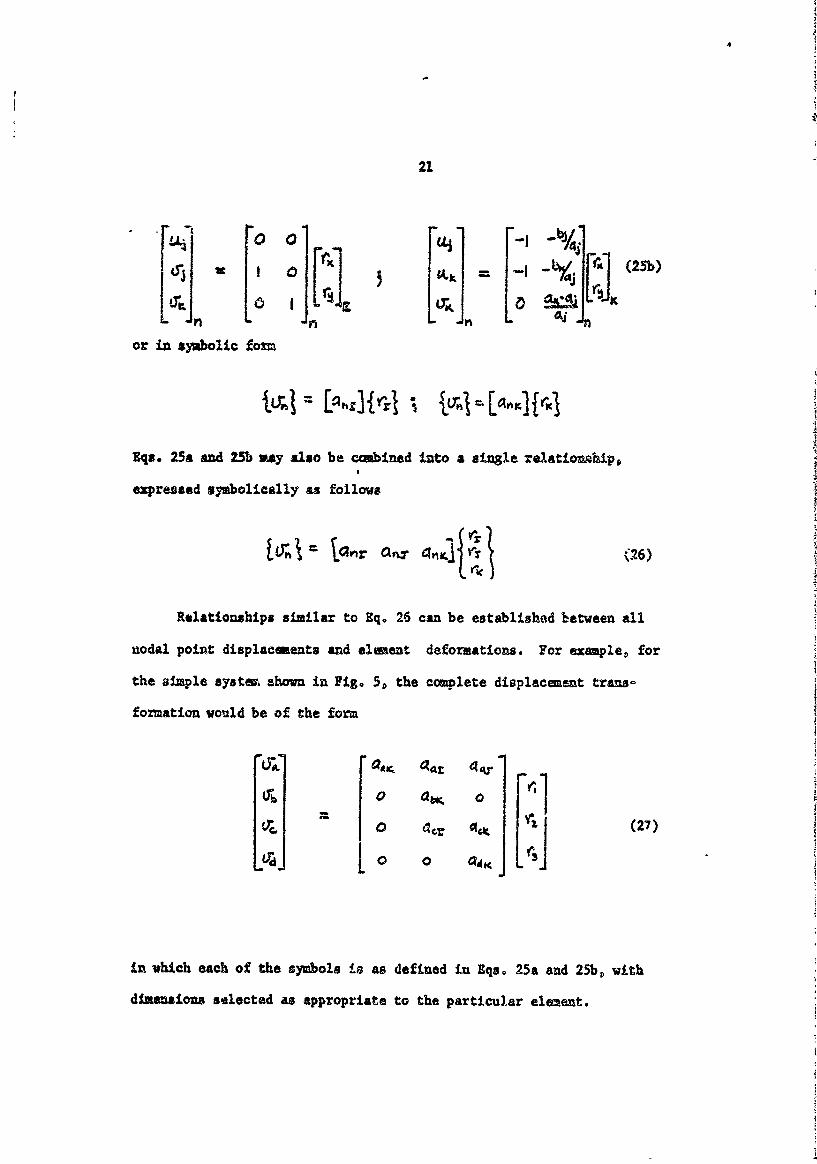
(25b)L& 1 ]z [..K L.bi/j
L n L n L -,n L" -
or in symbolic fo
Eqs. 25a and 25b may also be ,ombined into a single relatiozghip,
expressed symbolically as follows
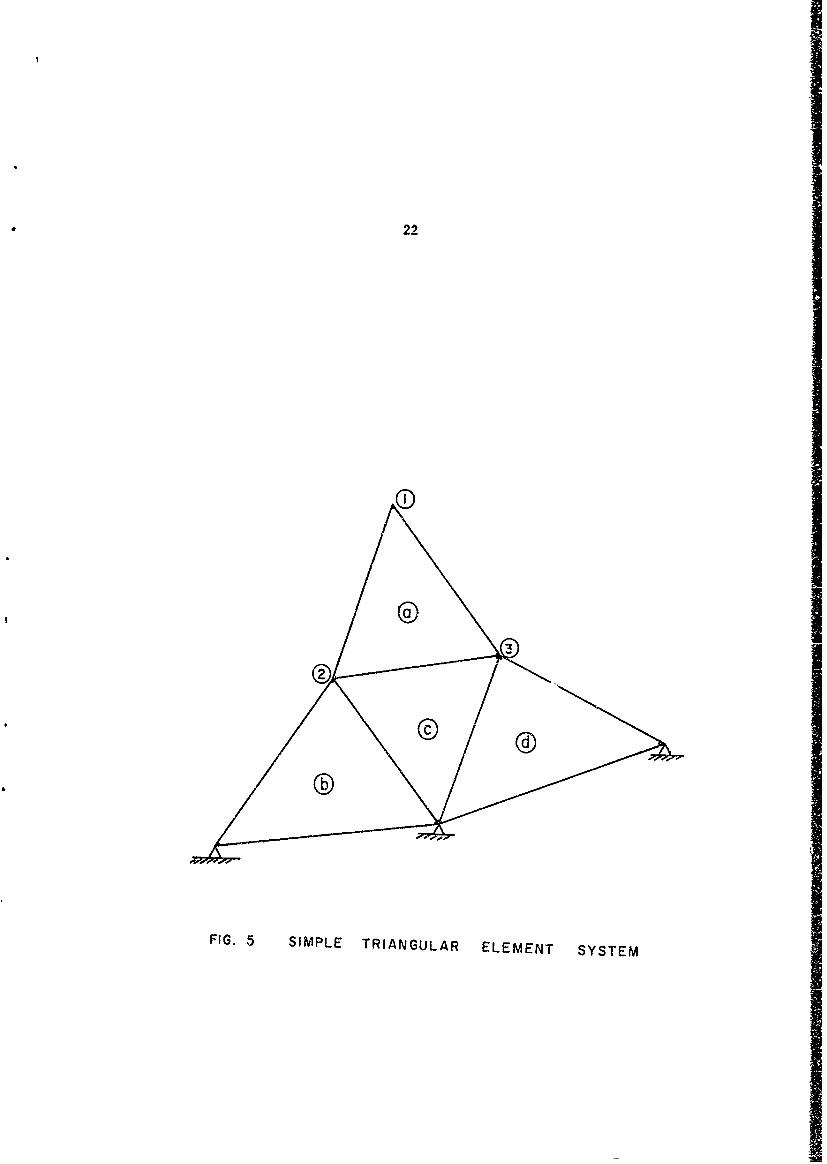
Relationships similar to Eq. 26 can be established between all
nodal point displacements and element deformations. For example. for
the simple systew, shown in Fig. 59 the complete displacemnet trans-
formation would be of the form
T6 0 aw0"Q 0 t Az (27)
in which each of the symbols is as defined in Eqs. 25a and 25b, with
dimensions selected as appropriate to the particular element.
22
oA E
FIG. 5 SIMPLE TRIANGULAR ELEMENT SYSTEM
23
Load Matrlx
The load matrix is merely a listing .Rj of the load components
applied to the nodal points of the plat* aliment asas.blage, presented
in the sme sequence as ware the displa2cc t cau4onants {rl in the
develoment of the displeceast transformation matrix. Three types. of
loadings wvere considered in tbis investigation, dead loads, live loads,
and therwal loads, each of which will be dircused separately below.
Ded Loads - The dead weight of each plate element is given, of course,
by the product of its area, its thickness (which was taket as one foot)
and its unit weight, Irt . One third of the total element weight was
applied at each of the three nodal pok41.- to which it was attached. I=
the total dead lod at any nodal point was taken as one-third of the
weights of all elements attached at that point, applied in a dowruard, or
negative "y" direction.
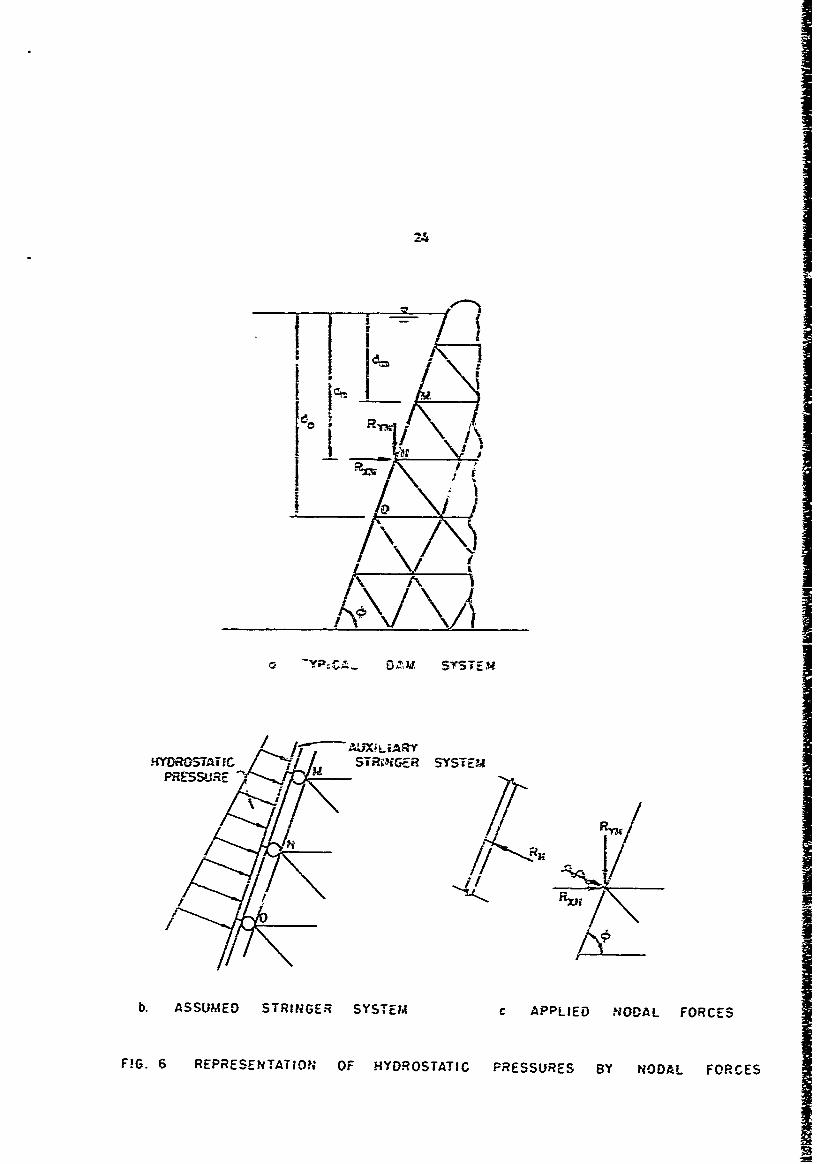
Live Loads - :: calculating the hydrostatic water load acting at each
nodal point, ic was assumed that the pressure was distributed against
an auxiliary arringer system, as shown in Fig. 6b. The reactions at the
ends of the Atriners, resolved into vertical and horizontal components
as shown in Fig. 6c, then constituted the live loads. For any given
nodal point, the live load depends not only on the depth of water at
that level, but also upon the depths at the points above and below. Where
the slopes of succeasive elemeut faces are the same, as is the case in
Fig. 6, the live load components at an arbitrary nodal point N are given by
ct--
. ST
I J
jj
I tI
!I
// // /r l
b. ASSUED STEM c APPLIED ODAL FORCES
FIG. 6 REPRESENTATION OF HYDROSTATIC PRESSURES BY NODAL FORCES
25
= ~ '28)
in wthi,+ L, is tlhe- =nit weight of water and the other symbol are
deflned im ?fg. 6a.
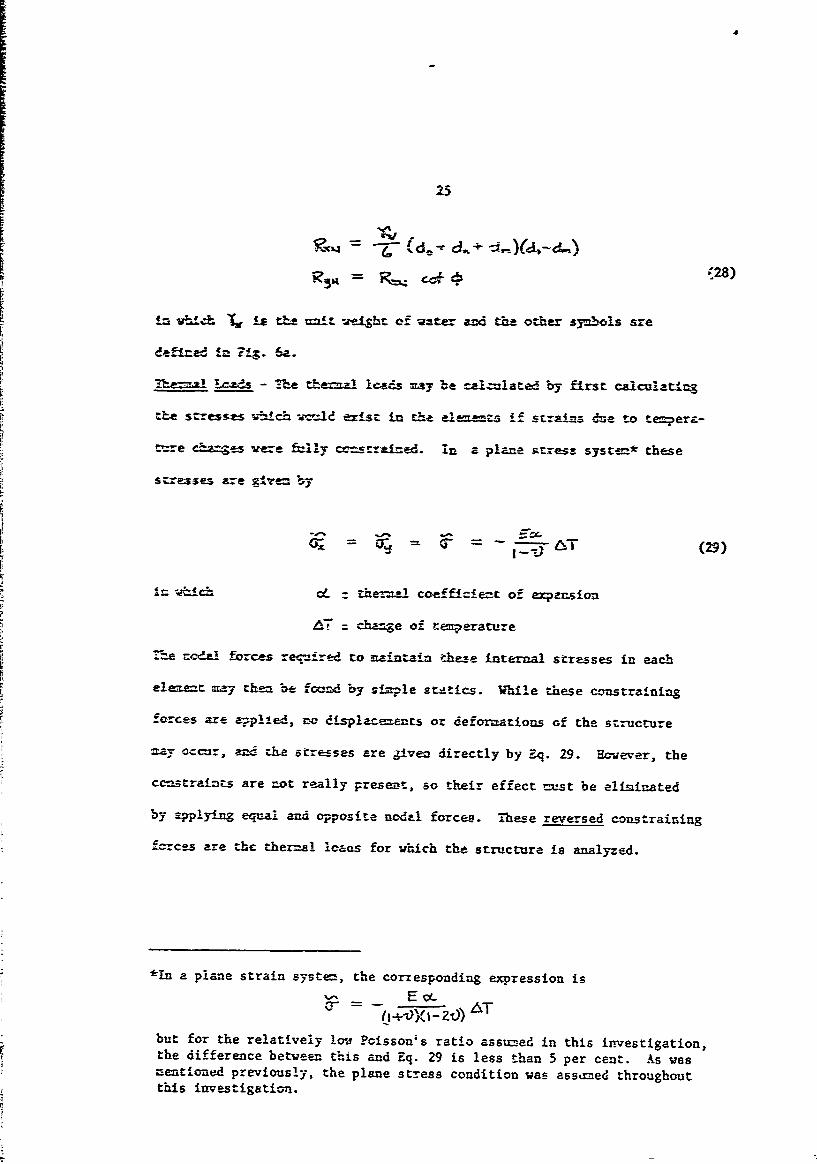
7haz=ai lzds - The theal 1ads =ay be cazulated by first calculating
th-e sresses which ~l exist in the ele=x--za~ if strains dzue to tezmperz-
t-e cha=,es e fully a--ces=a&ied. In a plane stress system* these
stresses are 9t're- bJy
= = c 1 (29)
I-- W lch c heznal coefficient of expnsion
AT cbange of tenpereture
T-e rea forces required to esaintain these internal stresses in each
elemnt may the be fcaw by sin-ple st.Atics. While these constraining
forces are applied, ne displac.ents or deformations of the structure
=ay occur, amd the stresses are given directly by Eq. 29. However, the
celstraints are .ot really Fresent, so their effect =st be eliminated
by applying equal and opposite nodal forces. These reversed constraining
f--rces are the ther-al laaos for which the structure is analyzed.
*in a plane strain system, the corresponding expression is
-_zo ) AT
but for the relatively loa Poisson's ratio assumed in this investigation,the difference between this and Eq. 29 is less than 5 per cent. As wasmentioned previously, the plane stress condition was assamed throughoutthis investigation.
26
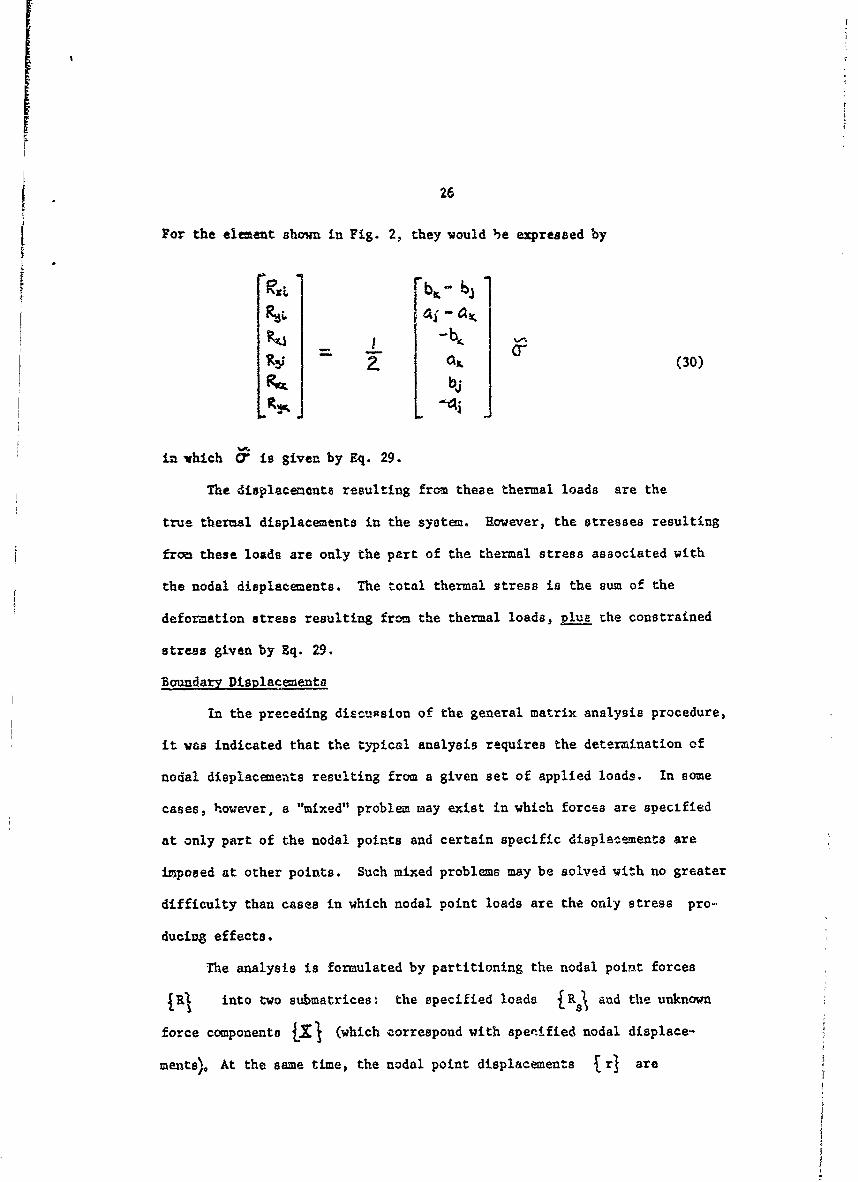
For the element shown in Fig. 2, they would be expressed by
r
gt L?- 2 L (Ai0)
in hich 0' is given by Eq. 29.
The displacements resulting from these thermal loads are the
true thermal displacements in the system. However, the stresses resulting
from these loads are only the part of the thermal stress associated with
the nodal displacements. The total thermal stress is the sum of the
deformation stress resulting from the thermal loads, plue the constrained
stress given by Eq. 29.
Boundary Displacements
In the preceding discusion of the general matrix analysis procedure,
it was indicated that the typical analysis requires the determination of
nodal displacements resulting from a given set of applied loads. In some
cases, however, a "mixed" problem may exist in which forces are specified
at only part of the nodal points and certain specific displaeements are
imposed at other points. Such mixed problems may be solved with no greater
difficulty than cases in which nodal point loads are the only stress pro-
ducing effects.
The analysis is formulated by partitioning the nodal point forces
IR into two submatrices: the specified loads {R5\ and the unknown
force components tX1 (which correspond with sperified nodal displace-
ments) At the same time, the nodal point displacements I rj are
27
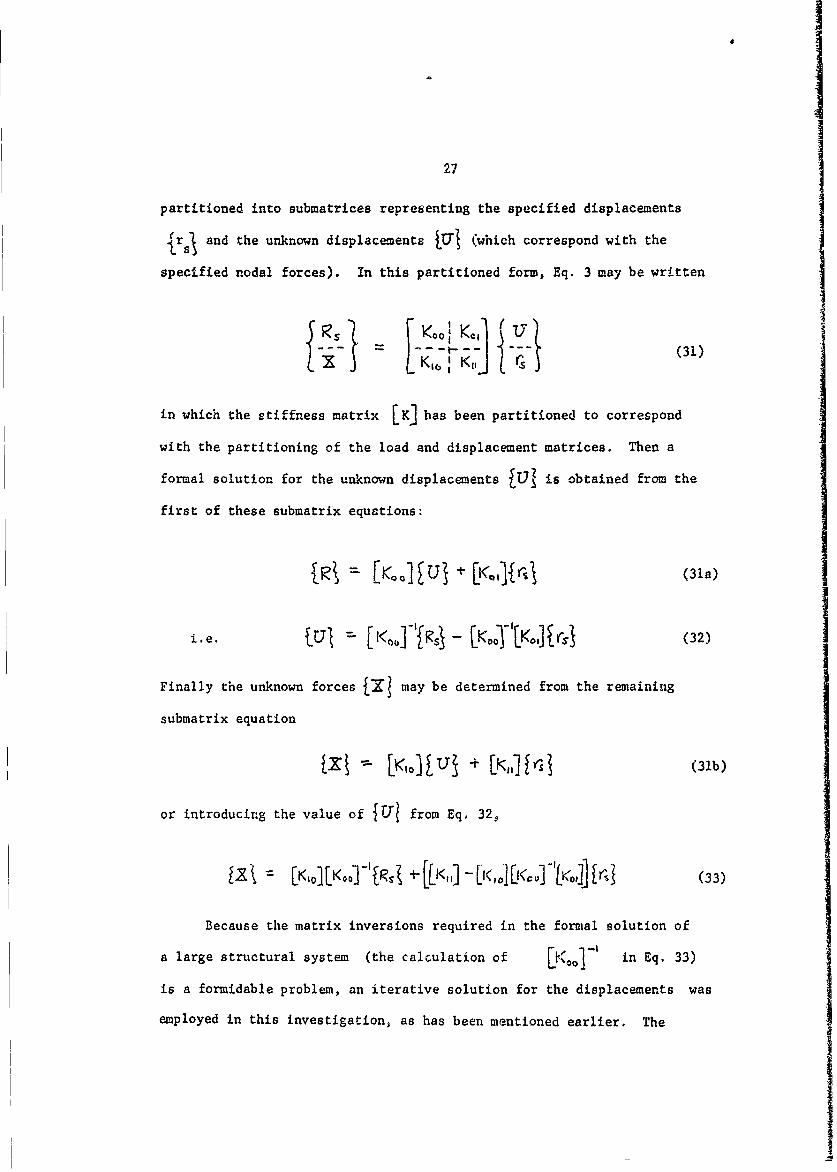
partitioned into submatrices representing the specified displacements
sl and the unknown displacements lul (which correspond with the
specified nodal forces). In this partitioned form, Eq. 3 may be written
= [ 4, {I K,,](31)
in which the stiffness matrix LK] has been partitioned to correspond
with the partitioning of the load and displacement matrices. Then a
formal solution for the unknown displacements IT-7 is obtained from the
first of these submatrix equations:
t (31a)
i.e. ['fR" - [Kj Koi].r s (32)
Finally the unknown forces jX may be determined from the remaining
submatrix equation
ix K' u + LK1 f- (31b)
or introducing the value of {U[ from Eq. 32,
{X ':= [K10 Ko,]-1fRs7 -[[K,,I-i-[1<,,] (so]oIr;} (33)
Because the matrix inversions required in the formal solution of
a large structural system (the calculation of [Kjj' in Eq. 33)
is a formidable problem, an iterative solution for the displacements was
employed in this investigation, as has been mentioned earlier. The
i

28
solution of a mixed problem in which certain displacements r are specified,
does not require any modification of the iterative process. No iteration is
required at these points because a reaction is available to support any
unbalanced forces which develop.
29
COMPUTER PROGRAM.
The digital computer program performs three major tasks in the
complete analysis of a plane stress system. First the stiffness, displace-
ment transformation, and load matrices are formed from a basic numerical
description of the system. Second, Equation 3 is solved for the displace-
ments of the nodal points by an iteration procedure. Third, the internal
element stresses are determined from these displacements. The general
features of the program which carries out these operations will be described
in this chapter.
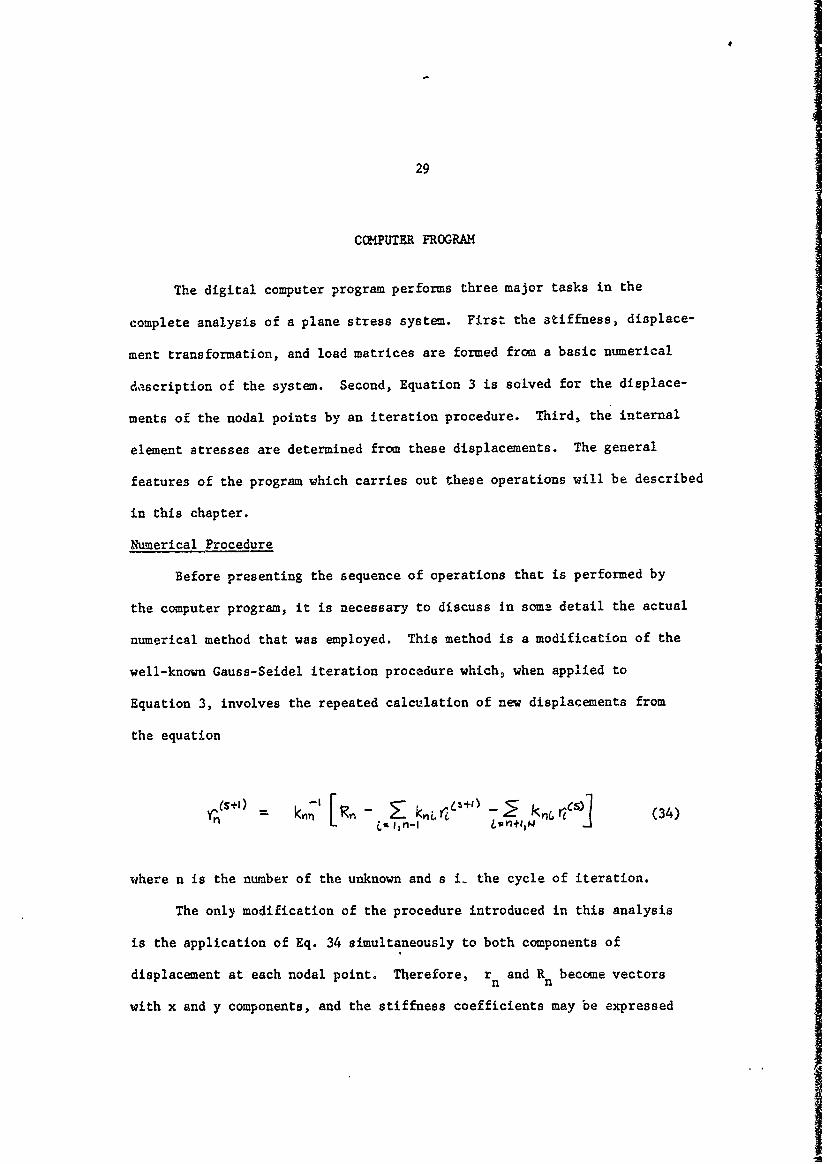
Numerical Procedure
Before presenting the sequence of operations that is performed by
the computer program, it is necessary to discuss in some detail the actual
numerical method that was employed. This method is a modification of the
well-known Gauss-Seidel iteration procedure which, when applied to
Equation 3, involves the repeated calculation of new displacements from
the equation
where n is the number of the unknown and s i- the cycle of iteration.
The only modification of the procedure introduced in this analysis
is the application of Eq. 34 simultaneously to both components of
displacement at each nodal point. Therefore, rn and Rn become vectors
with x and y components, and the stiffness coefficients may be expressed
li
30
in the form
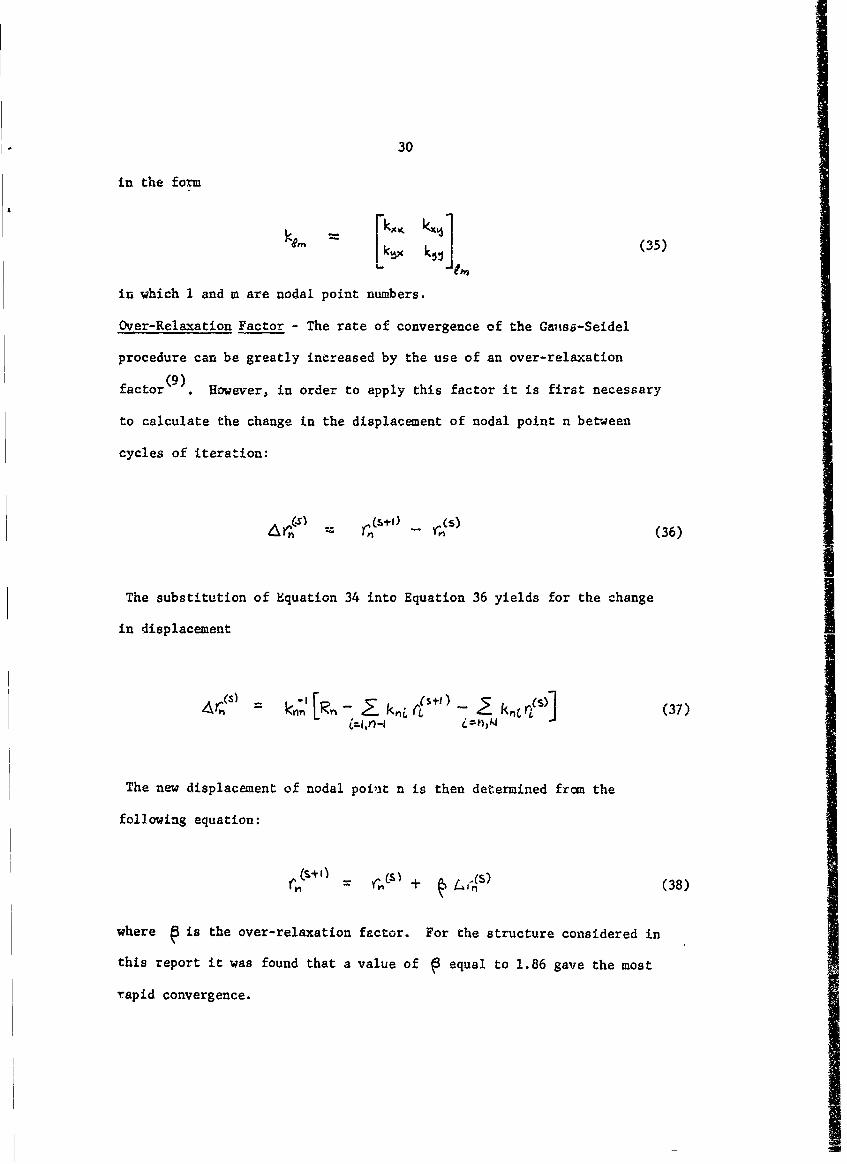
kQL[kg k5 J (35)
in which I and m are nodal point numbers.
Over-Relaxation Factor - The rate of convergence of the Gansa-Seidel
procedure can be greatly increased by the use of an over-relaxation
factor . However, in order to apply this factor it is first necessary
to calculate the change in the displacement of nodal point n between
cycles of iteration:
(36)
The substitution of Equation 34 into Equation 36 yields for the change
in displacement
(S) -r(S+0)T- k -Lkn-,.kCn ( W rS)j (37)
The new displacement of nodal poiut n is then determined from the
following equation:
CS) (S)= I y + Lin (38)
where is the over-relaxation factor. For the structure considered in
this report it was found that a value of @ equal to 1.86 gave the most
rapid convergence.
31
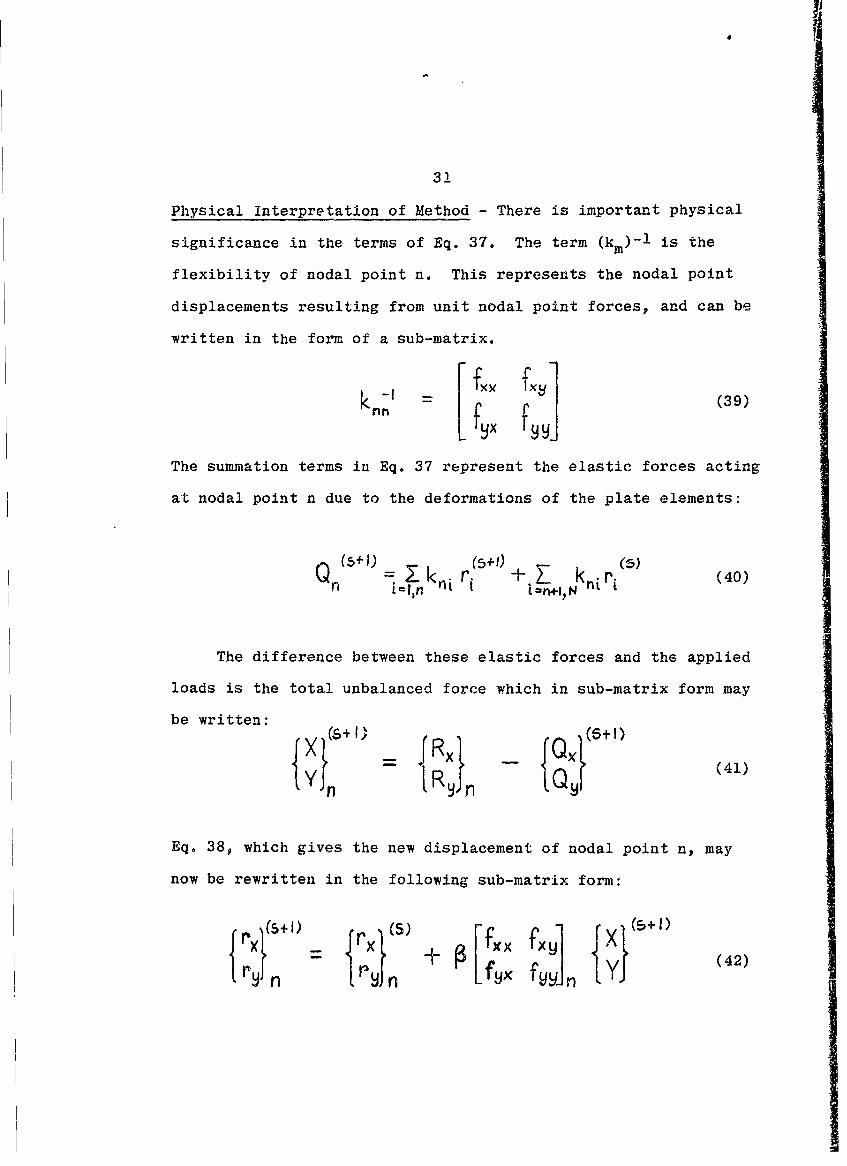
Physical Interpretation of Method - There is important physical
significance in the terms of Eq. 37. The term (km)-l is the
flexibility of nodal point n. This represents the nodal point
displacements resulting from unit nodal point forces, and can be
written in the form of a sub-matrix.
k - X f (39)
The summation terms in Eq. 37 represent the elastic forces acting
at nodal point n due to the deformations of the plate elements:
Q(5+1) ,, )
The difference between these elastic forces and the applied
loads is the total unbalanced force which in sub-matrix form may
be written:(s+I -R)l__
X 4RX Qul{Y~ntR 4(41)YnIjn
Eq. 38, which gives the new displacement of nodal point n, may
now be rewritten in the following sub-matrix form:
r I P I lY (42)n i rxj + A fVVn
32
It is important to note that any desired nodal point displacement r(0)
may be assumed for the first cycle of iteration. A good choice of these
displacements will greatly speed the convergence of the solution. In
fact, if all displacements were assumed correctly, the unbalanced
forces given by Eq. 41 would be zero and no iteration would be necessary.
However, in a practical case there always will be unbalanced forces in
the system at first, and the iteration process continually riducee them
toward zero.
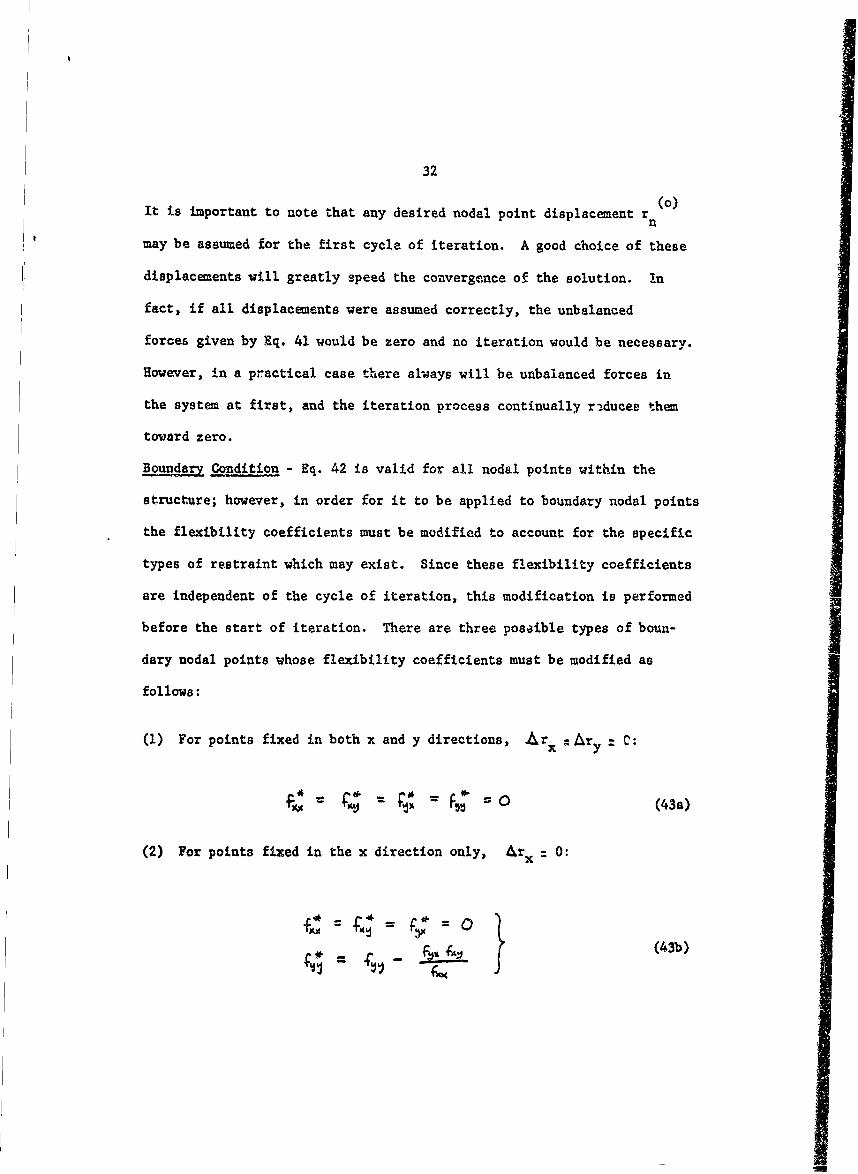
B Condition - Eq. 42 is valid for all nodal points within the
structure; however, in order for it to be applied to boundary nodal points
the flexibility coefficients must be modified to account for the specific
types of restraint which may exist. Since these flexibility coefficients
are independent of the cycle of iteration, this modification is performed
before the start of iteration. There are three possible types of boun-
dary nodal points whose flexibility coefficients must be modified as
follows:
(1) For points fixed in both x and y directions, rx -Ar y C:
(2) AV pn fe (43a)
(2) For points fixed in the x direction only, Ar 0:
(43b)
33
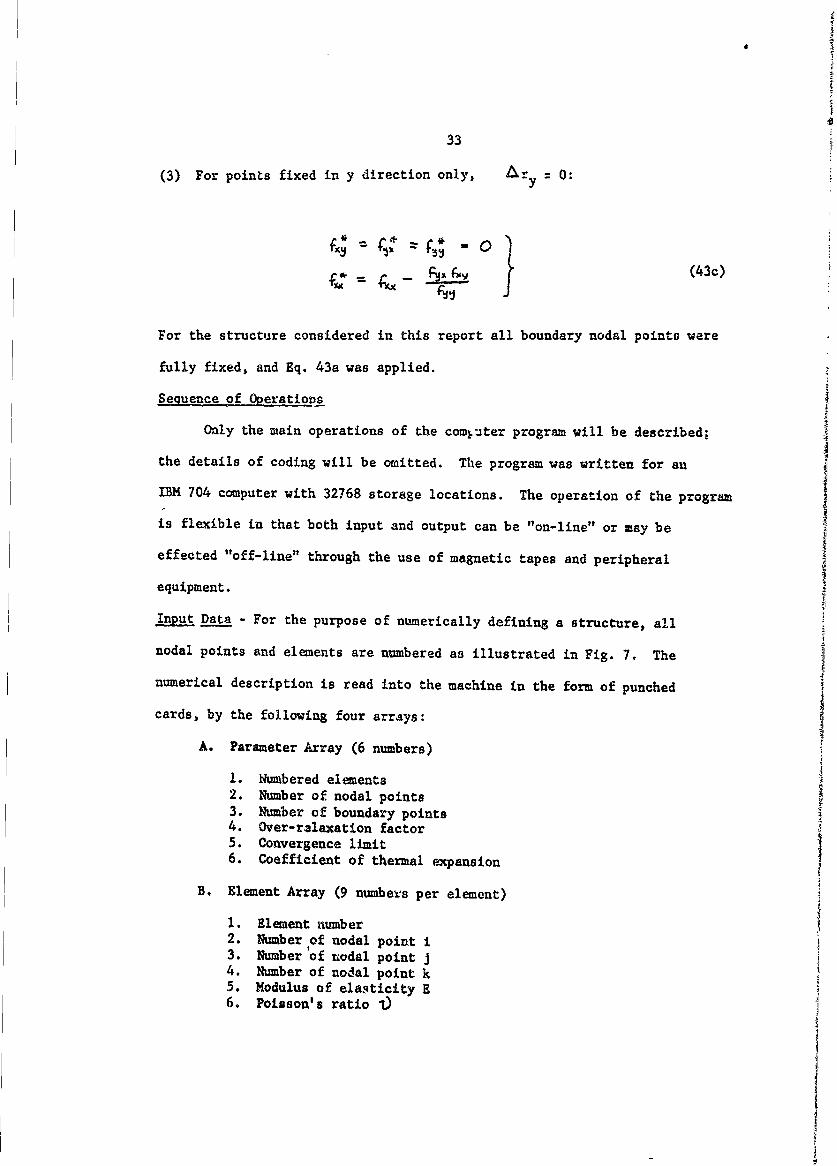
(3) For points fixed in y direction only, 4r 0:y
W 0
F % Gy(430)
For the structure considered in this report all boundary nodal points were
fully fixed, and Eq. 43a was applied.
Sequence of Operatiovs
Only the main operations of the combuter program will be described;
the details of coding will be omitted. The program was written for an
IBM 704 computer with 32768 storage locations. The operation of the program
is flexible in that both input and output can be "on-line" or may be
effected "off-line" through the use of magnetic tapes and peripheral
equipment.
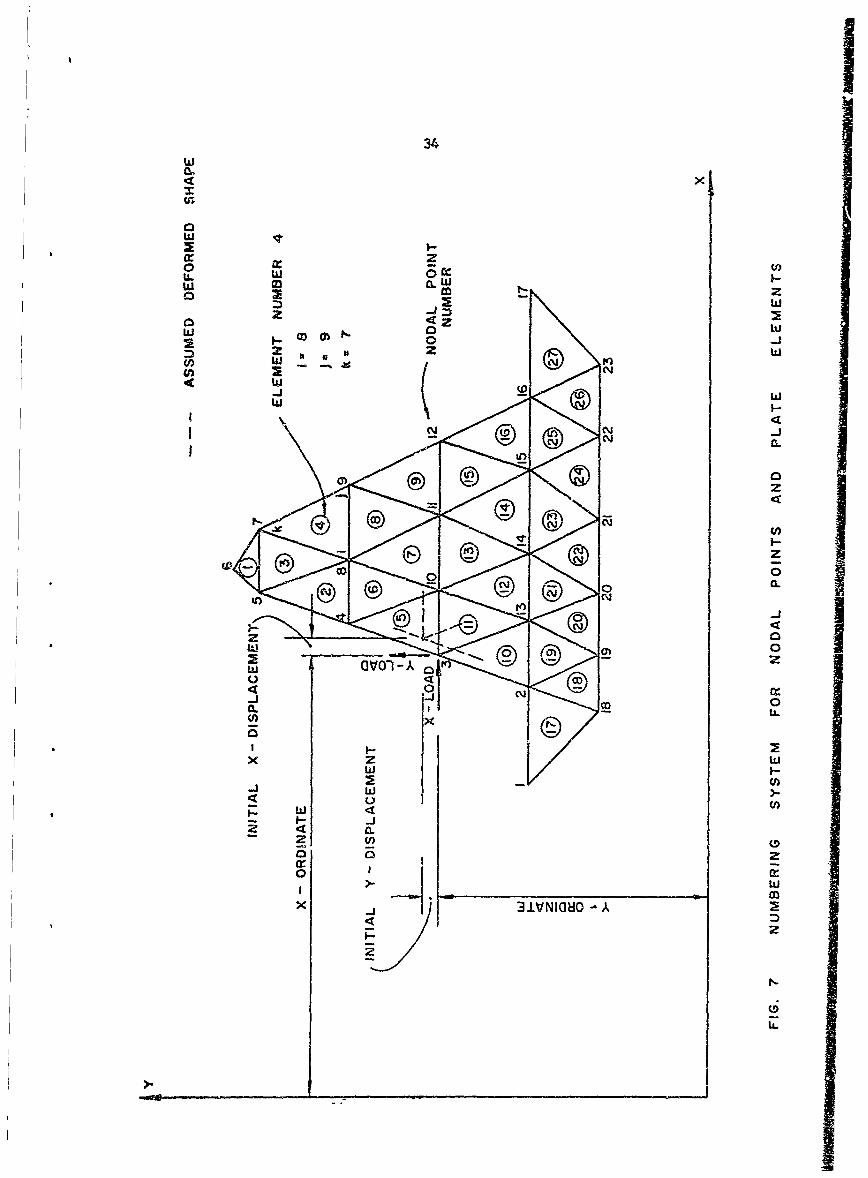
Input Data - For the purpose of numerically defining a structure, all
nodal points and elements are numbered as illustrated in Fig. 7. The
numerical description is read into the machine in the form of punched
cards, by the following four arrays:
A. Parameter Array (6 numbers)
1. Numbered elements2. Number of nodal points3. Number of boundary points4. Over-ralaxation factor5. Convergence limit6. Coefficient of thermal expansion
B. Element Array (9 numbers per element)
1. Element number2. Number of nodal point i3. Number'of nodal point j4. Number of nodal point k5. Modulus of elasticity E6. Poisson's ratio i)
34
0
w LU
0o 0 -
LU 2 cm
-j -
Iw
z
On,
z
!2 -1
OTc0 C~0
-1 0-CL I)
2 -- 2 fl C
(L0
I wL
_ __ m
35
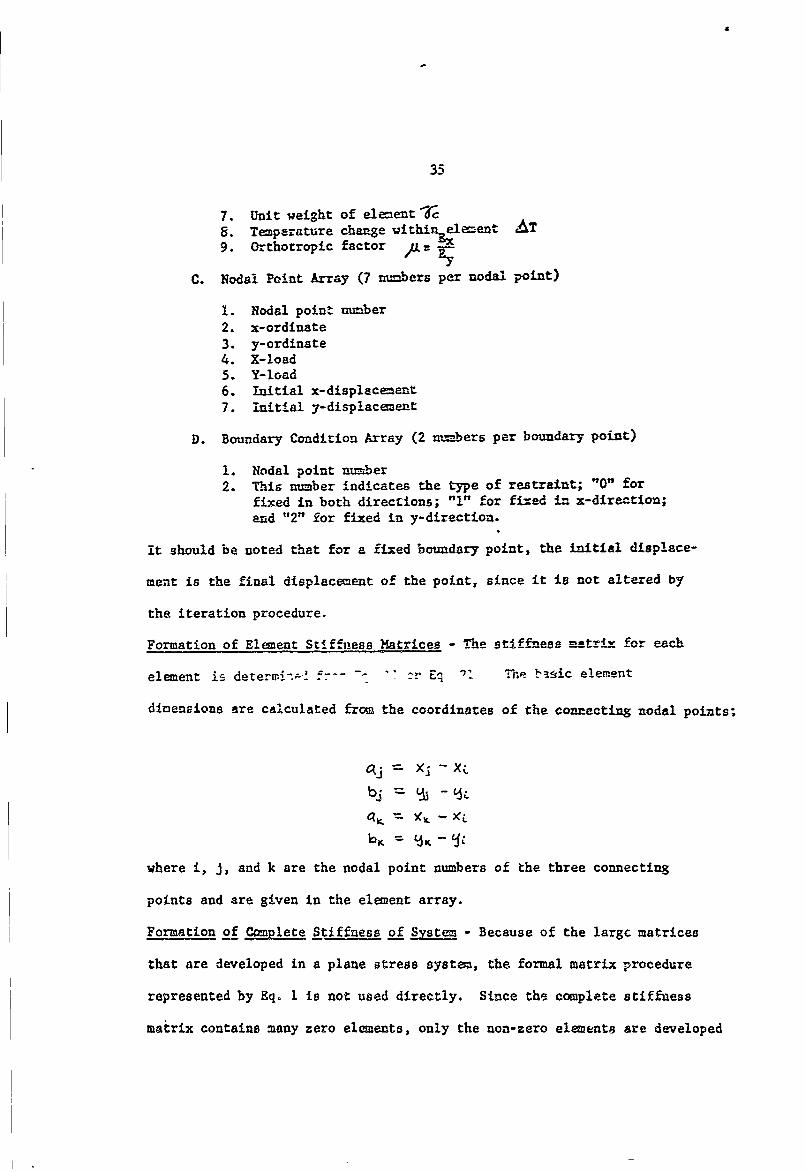
7. Unit weight of element rc8. Temperature change within1e ment AT9. Orthotropic factor An -
C. Nodal Point Array (7 numbers per nodal point)
I. Nodal point number2. x-ordinate3. y-ordinate4. X-load5. Y-load6. Initial x-displacement7. Initial y-displacement
D. Boundary Condition Array (2 nm.bers per boundary point)
1. Nodal point number2. This number indicates the type of restraint; "0" for
fixed in both directions; "1" for fixed in x-direction;and "2" for fixed in y-direction.
it should be noted that for a fixed boundary point, the initial displace-
ment is the final displacement of the point, since it is not altered by
the iteration procedure.
Formation of Element Stiffness Matrices - The stff-nese matrix for each
element is deteri.A-! f:- - "r Eq The tsic element
dimensions are calculated from the coordinates of the connecting nodal points;
bj = u.i
where i, J, and k are the nodal point numbers of the three connecting
points and are given in the element array.
Formation of Complete Stiffness of System - Because of the largc matrices
that are developed in a plane stress system, the formal matrix procedure
represented by Eq. 1 is not used directly. Since the complete stiffness
matrix contains many zero elements, only the non-zero elements are developed
and~ rezzizefa by :he tlczz. I: is psible to tzt 12rge plz-
Z=C*Ss sysc w.drb= --ctzdig t!10 5scz-.e cpc-ty cf t!:
TC=ZZic-- of !.czzi !he-~ - d =-: R! 4, on,-ae OfUwe LLzeJ,
dea mc rc =6 tc44s - The e=.aticms u" ch are =sed tc detex-
'-J- tbase leads 5=~e bi-- p--e~sezed !- the pre%zicms s~i~2f ch'.!s 7e,-~
FcMzt1ig- of --lFeii~e h cdlpi feibl~isae ee-=
mrze r-5 e t icarsi detel-ed stli-4es cff~Icets - The fie--:!-
:-ze ass .- td vitl :!- bc==dx= mz-dI ;=t~s =re =Oc ,ftfedz by t':
spli-s-Rm f Eqs. 4.3 -E ezie
ire-atire ScOI=c=~ - Mhe 4-2~e lcec f q ?& a ZIP f.Ll :;fr.±
cc=UrreS the M~-Zt-;e pr~ao.The r= 0-of ze abcka-e zgiie
th =-za f~r--as at all' podf!~is (gie Fb q. -441) Is &15,0 C=L-
_Ze for- eaezcycl CT :S3 wz c=;%aad to t-2C;reg= fat
se=rTes as a chEc,, = cm :Se eez f tbe- 'ccre &_" all zyeSI
?resovated iz lI-r-- t hla-l~ i~t 1;s- re t z-
Calc-let~ of .~rStresses - Fr=o th.e zcd-fel indj-le.s
vihthe aid of~ 23, the 0el=tmt stresses =i. - 4c
cz~=Itz-- s aee the pr-ip- sesses -, and =4
61 reCtlC-~ S re also Ate
~.it~o Iooz~ric -At _j poinss im the i-erai-=o prcccei: re, odal
dispceme=-=z a ld o scresses are printed. Fig. 8 i-I-Istrares the
foz= of the capuer ca'nr-nt, in a ypical case.
Vic copuytatiomal1 time rec'-ired by the progr= is a-pr:oxfzzaely
equel to 0.1-7 niy- seconds, where =equals the n=ober zoi nodai- points nI
3 .. 4 :4.i:-'%'7
2;.3~J .4j* 114".t -ltd
f. n-3.04 -29.0* ~ 4 -;4 _j-_:1 ")s5z-1. . -S..
1. -1- TsL.? IIli a"2 'S5 : Lii. --, .5
-3'.) -ZS -7..
-35.3 -U.S
I ' I -. I~$ . . .- 4 . . 1 345 i 3 4 -3.1a .I--3
-3C Vt--
.5151 135. -is.&P1-. P tv $5.125 . 3.
-1. l. " _g -_*)a vt a .4-73.1I1 S.I.%
M- -4 ~ '3i.2-,. .. 44.7 34.? -as.)In.-'s 4?Izr-jo-U X
-121 tl-t -2.MS2
-2M. 1.42
-: .21 73 &75
33- -2.-
.144443
$3AT I rl Il= 4I
'5 2.2V52..
FIG 8 CCYPUTER OUTPUT
38
m equals the w--ber of cycles of iteration. The number of cycles required
depends on the accuracy of the initially essumed displacements and on the
desired degree of convergence. For the structure considered in this report,
the ccaputer tine per solution was approxiately 7 ninutes for the coarse
ehab and 17 q!inutes for the fine ash idealization. Between 70 and 100
cycles of iteratiou were used i.n typical cases.
!I
J4
39
SCHEDULE OF AHALYSES
The Structural System
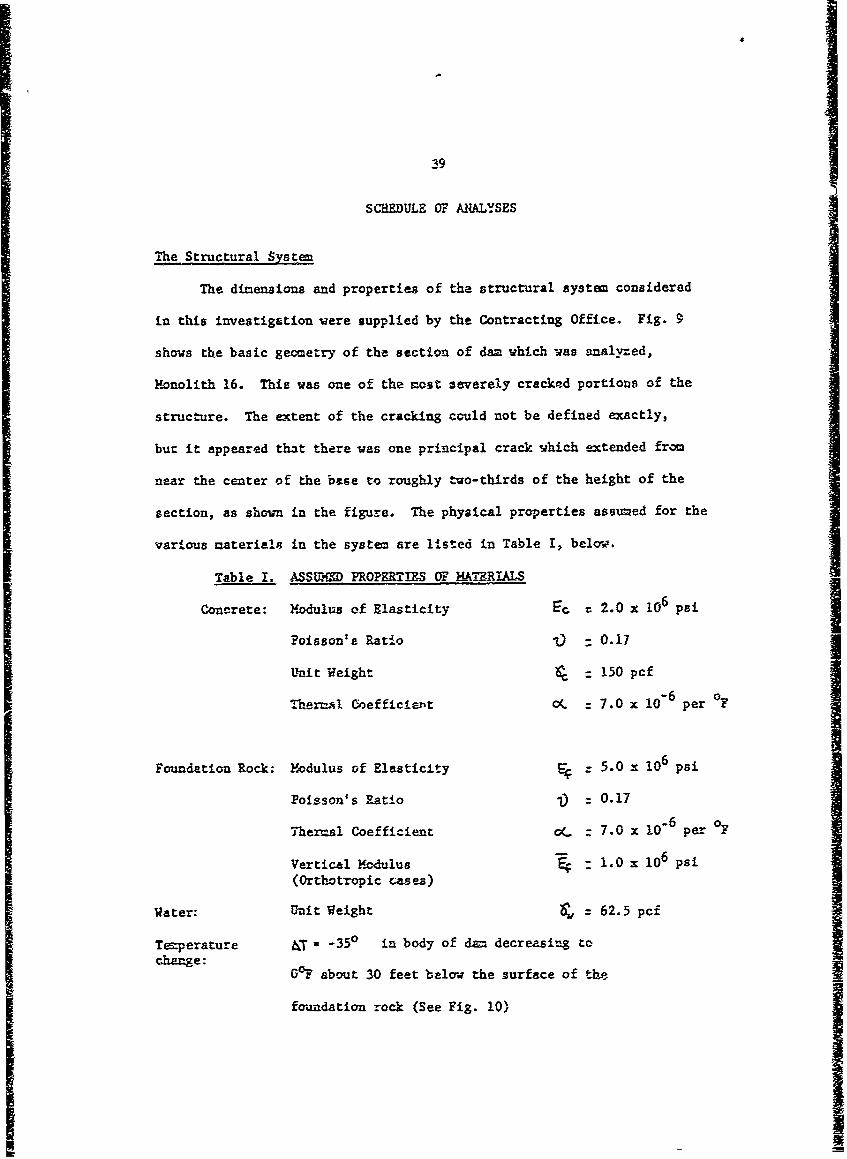
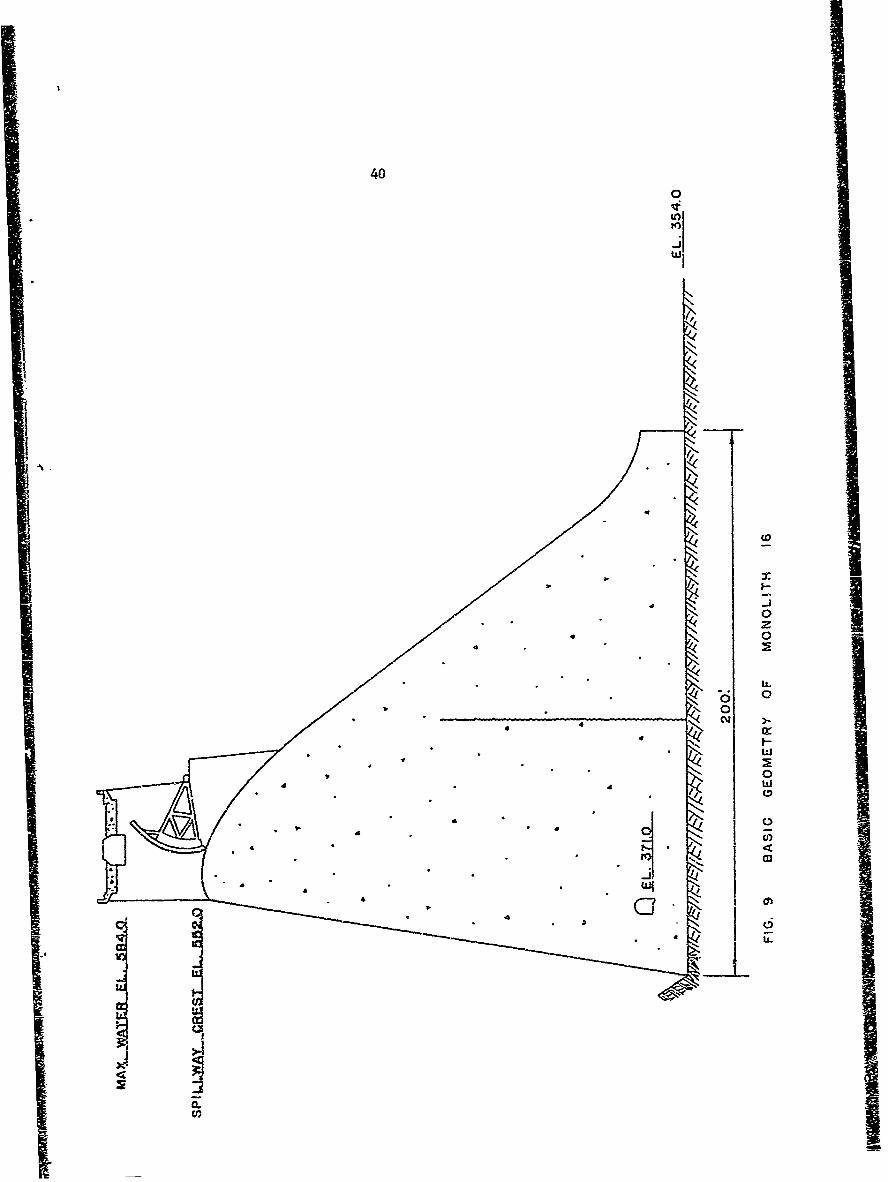
The dimensions and properties of the structural system considered
in this investigation were supplied by the Contracting Office. Fig. 9
shows the basic gecmetry of the section of dam which was analyzed,
Yxnolith 16. This was one of the most 3everely cracked portions of the
structure. The extent of the cracking could not be defined exactly,
but it appeared that there was one principal crack which extended from
near the center of the base to roughly two-thirds of the height of the
section, as shown in the figure. The physical properties assumed for the
various caterials in the system are lIsted in Table I, belov.
Table I. ASSM D PROPEREES OF MATERLALS
Concrete: Modulus of Elasticity c 2.0 x 10⁶ psi IPoisson's Ratio 1) 0.17
Unit Weight 1 150 pcf
_nerml Coefficient 0 7.0 x 10 per OF
Foundation Rock: Modulus of Elasticity = 5.0 X 10⁶ psi
Poisson's Ratio = 0.17
Thermal Coefficient cc 7.0 x 10⁻⁶ per OF
Vertical Modulus 1.0 x 10⁶ psi(Orthotropic cases)
Water: Unit Weight 62.5 pcf
Temperature bT a -350 in body of d= decreasing tochange: vOF about 30 feet below the surface of the
foundation rock (See Fig. 10)
400
VVN 0
19 4
co
41
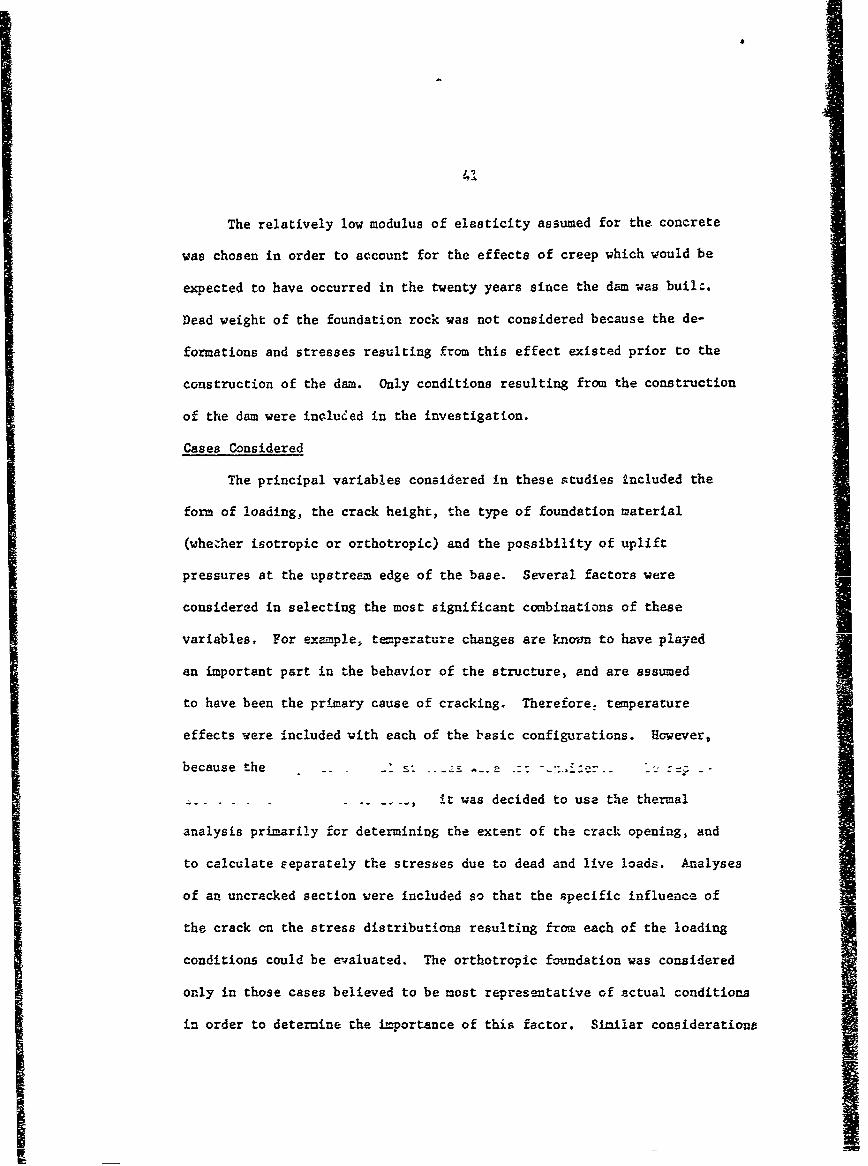
The relatively low modulus of elasticity assumed for the concrete
was chosen in order to account for the effects of creep which would be
expected to have occurred in the twenty years since the dam was builc.
Dead weight of the foundation rock was not considered because the de-
formations and stresses resulting from this effect existed prior to the
construction of the dam. Only conditions resulting from the construction
of the dam were inaluded in the investigation.
Cases Considered
The principal variables considered in these studies Included the
form of loading, the crack height, the type of foundation material
(whether isotropic or orthotropic) and the possibility of uplift
pressures at the upstream edge of the base. Several factors were
considered in selecting the most significant combinations of these avariables. For example, temperature changes are knovn to have played
an important part in the behavior of the structure, and are assumed
to have been the primary cause of cracking. Therefore: temperature
effects were included with each of the basic configurations. However,
because the _ s. .. s .. e .::--e..i-
.... , it was decided to use the thermal
analysis primarily for determining the extent of the crach opening, and
to calculate Peparately the stresses due to dead and live loads. Analyses
of an uncracked section were included so that the specific influence of
the crack on the stress distributions resulting from each of the loading
conditions could be evaluated. The orthotropic foundation was considered
only in those cases believed to be most representative of actual conditions
in order to determine the importance of this factor. Similar considerationt
4je
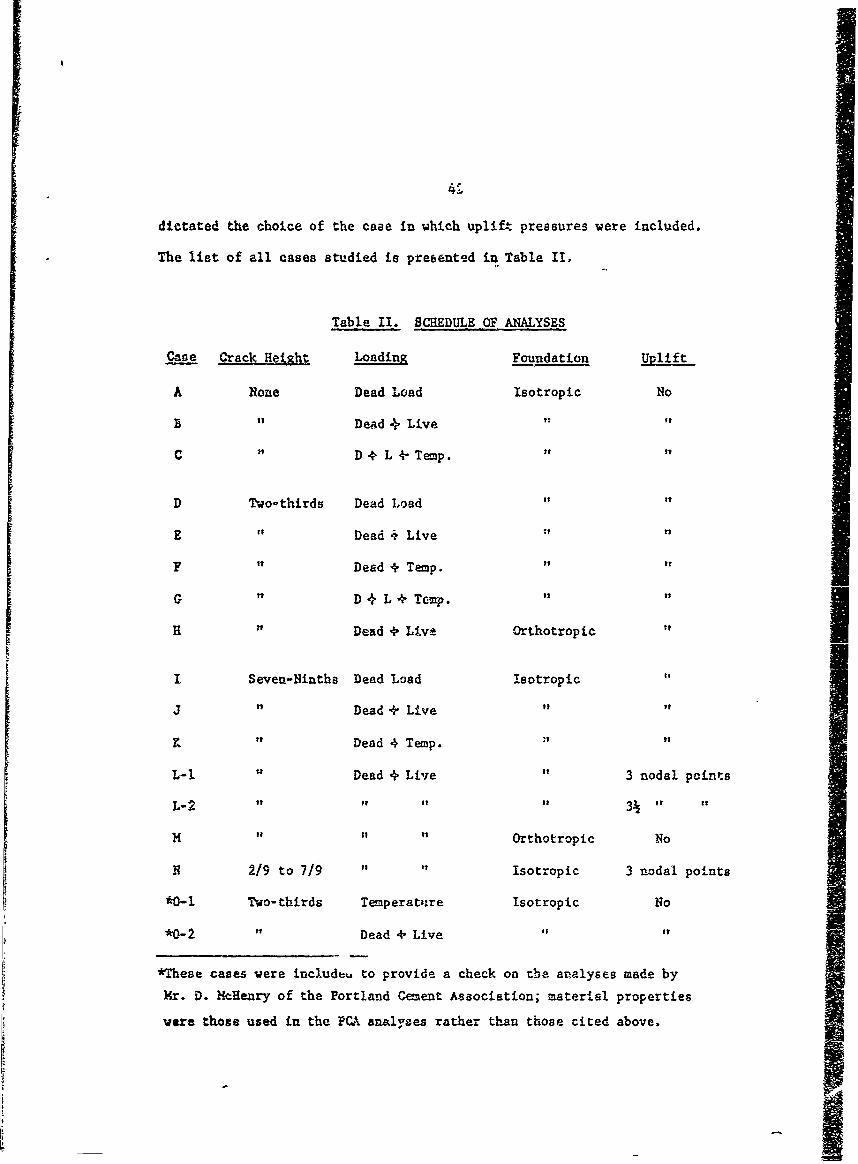
dictated the choice of the case in which uplift pressures were included.
The list of all cases studied is presented in Table II,
Table II. SCHEDULE OF ANALYSES
Case r LoadinM Foundation Uplift
A None Dead Load Isotropic No
B Dead 4 Live f"
C D + L i" Temp.
D Two-thirds Dead Load "
E "Dead , Live
F Dead + Temp.
G D L + Tmp.
H " Dead + Live Orthotropic "
I Seven-Ninths Dead Load isotropic
J "t Dead + Live "t
K " Dead 4 Temp.
L-l Dead + Live 3 nodal points
L-2 i " 3 " t
H " Orthotropic No
N 2/9 to 7/9 isotropic 3 nodal points
*0_- Two-thirds Teperattre Isotropic No
*0-2 Dead + Live of
*These cases were includeu to provide a check on tbe analyses made by
Mr. D. McHenry of the Portland Cement Association; material properties
were those used in the PC& analyses rather than those cited above.
43
Analysis Procedure
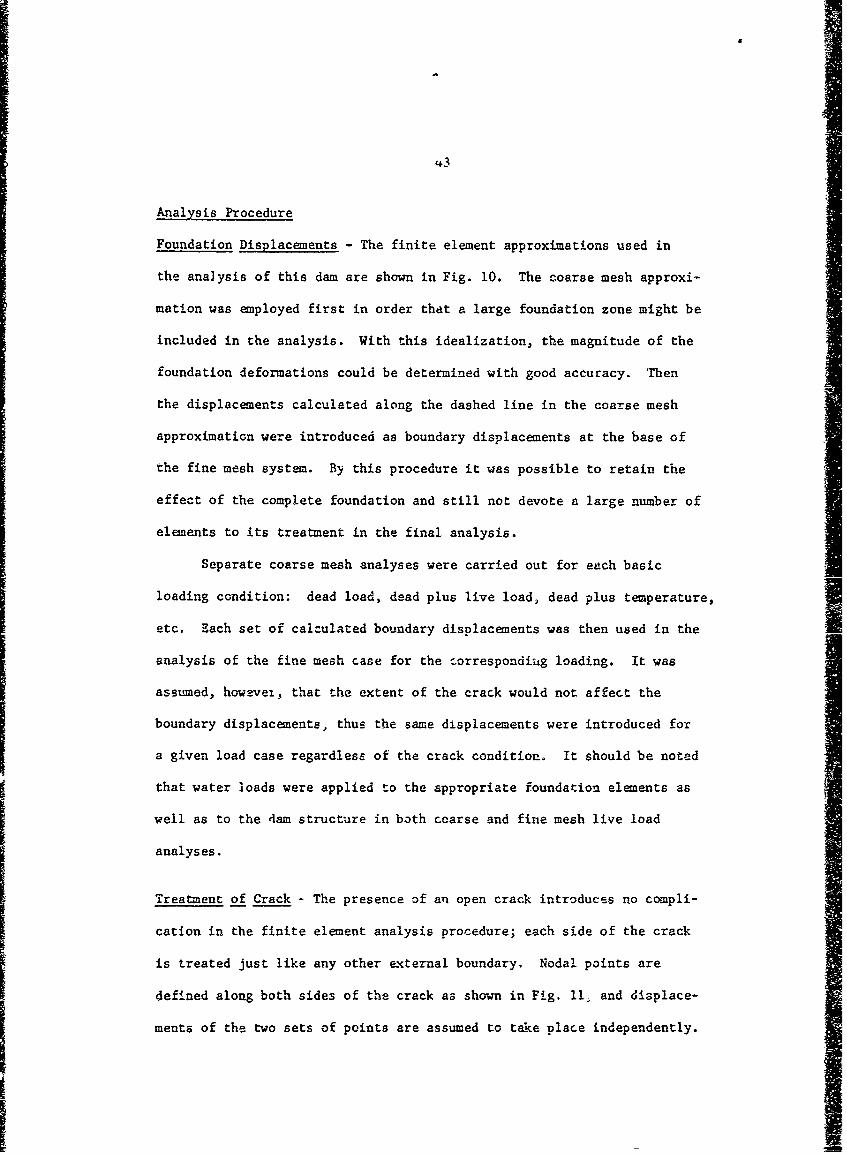
Foundation Displacements - The finite element approximations used in
the analysis of this dam are shown in Fig. 10. The coarse mesh approxi-
mation was employed first in order that a large foundation zone might be
included in the analysis. With this idealization, the magnitude of the
foundation deformations could be determined with good accuracy. Then
the displacements calculated along the dashed line in the coarse mesh
approximation were introduced as boundary displacements at the base of
the fine mesh system. By this procedure it was possible to retain the
effect of the complete foundation and still not devote a large number of
elements to its treatment in the final analysis.
Separate coarse mesh analyses were carried out for each basic
loading condition: dead load, dead plus live load, dead plus temperature,
etc. Each set of calculated boundary displacements was then used in the
analysis of the fine mesh case for the corresponding loading. It was
assumed, how-evet, that the extent of the crack would not affect the
boundary displacements, thus the same displacements were introduced for
a given load case regardless of the crack condition. It should be noted
that water loads were applied to the appropriate foundation elements as
well as to the dam structure in both coarse and fine mesh live load
analyses.
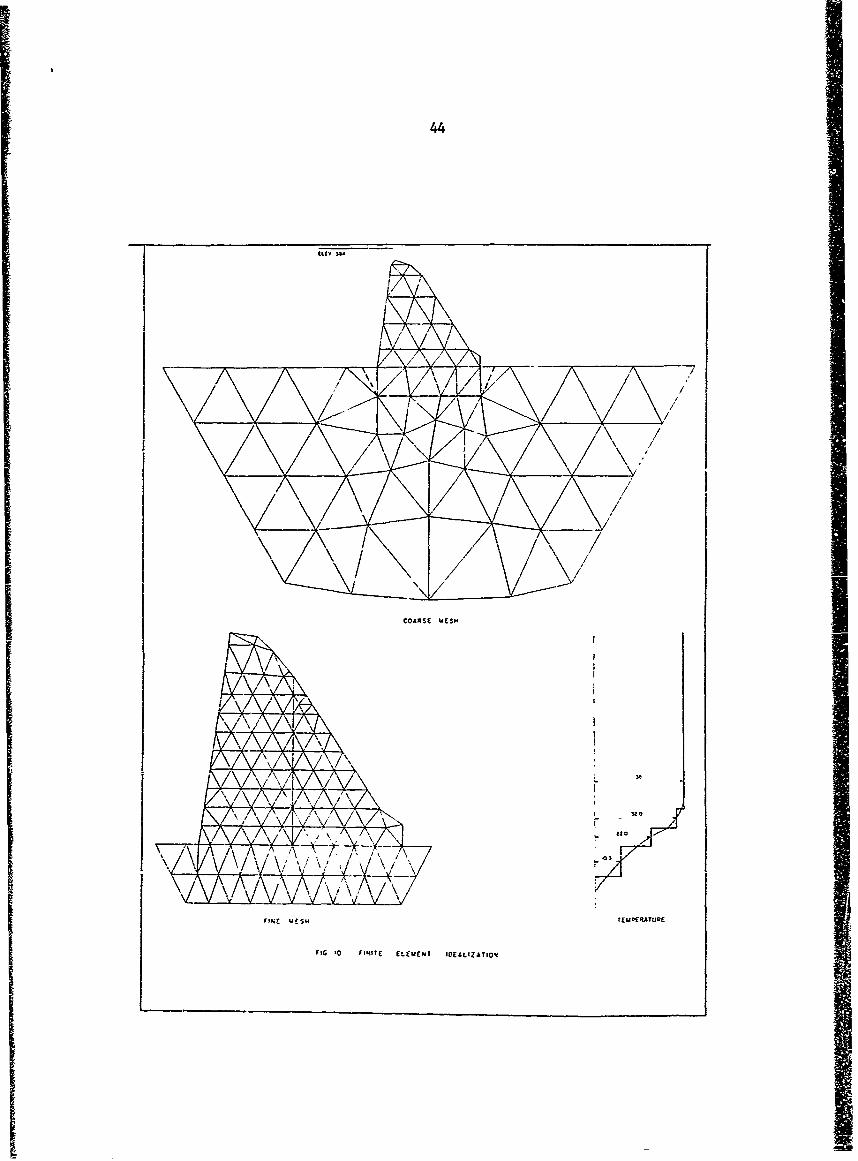
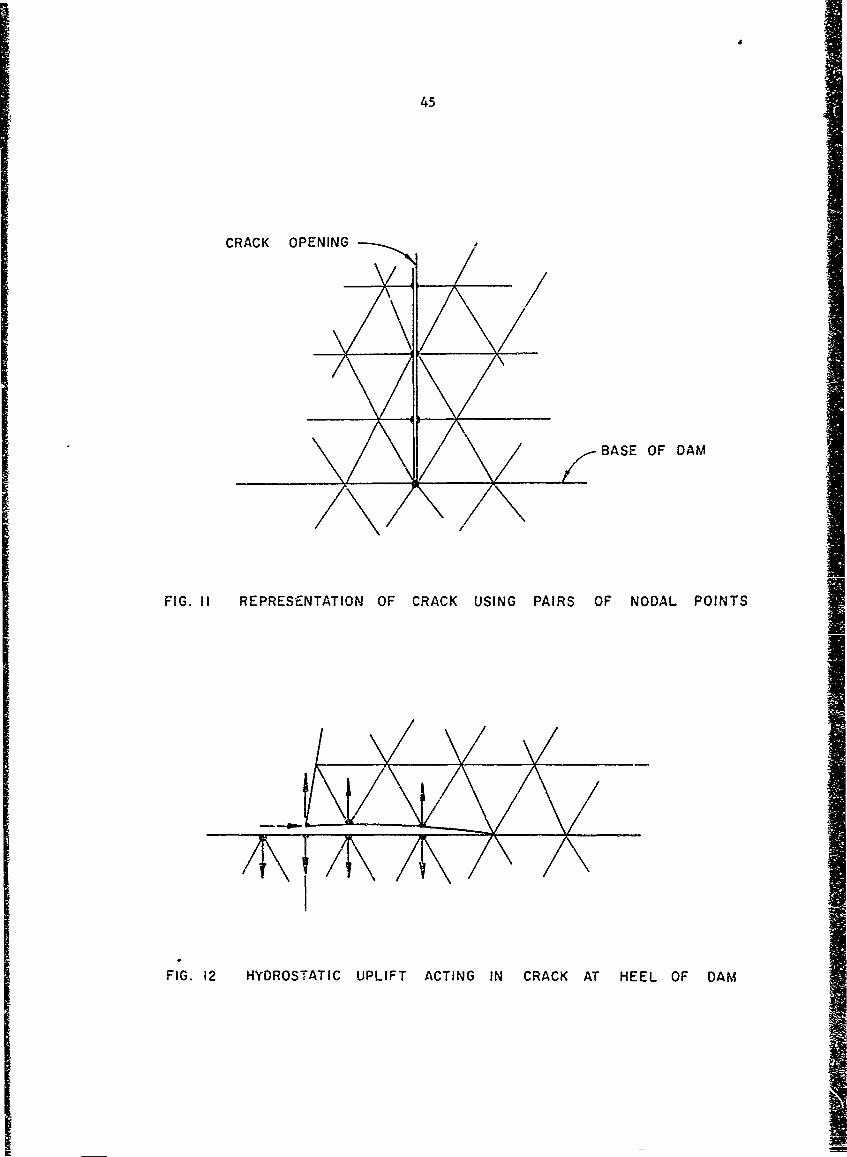
Treatment of Crack - The presence of an open crack introduces no compli-
cation in the finite element analysis procedure; each side of the crack
is treated just like any other external boundary. Nodal points are
defined along both sides of the crack as shown in Fig. 11, and displace-
ments of the two sets of points are assumed to take place independently.
I
44
COARSE WES"
/L 4
F54E WES. [UPRATURE
FIG -0 FINITE ELEMENT IDELLIZATIO-1
45
CRACK OPENING
BASE OF DAM
FIG. II REPRESENTATION OF CRACK USING PAIRS OF NODAL POINTS
FIG. 12 HYDROSTATIC UPLIFT ACTING IN CRACK AT HEEL OF DAM
46
In order that this assumption be reasonable, it is necessary, of course,
that each pair of pcints move apart rather than toward each other. Thus
it was assumed that the dam was subjected first to the dead load plus
temperature change conditions, which resulted in an opening of the crack.
Then if the subsequent live loading did not completely eliminate the
separation at any pair of nodal points it is clear that the two sides
would continue to act independently as assumed.
Uplift Pressures - It was recognized at the outset of this investigation
that there might be a tendency for tensile stresses to develop at the
upstream edge of the base of the dam. Because the tensile strength at
this point is essentially nil, it would be expected to crack open under
any loading condition for which tensile stresses were indicated. Further-
more, since this crack would be exposed to the full hydrostatic pressure
at the base of the dam (in live load conditions), uplift pressures would
be developed over the full extent of the crack.
The uplift pressure analyses were treated in exactly the same
manner as were the vertical crack analyses, with separate nodal points
being located along the base of the dam and in the foundation rock, as
shown in Fig. 12. The only difference was that hydrostatic live load
forces were applied at the nodal points of this crack, acting normal to
both the upper and lower surfaces, as shown. It was assumed that the
crack extended downstream a nistance of three nodal points (about 32 feet)
because a grout curtain and relief drain system located in this vicicity
would prevent the uplift pressure from extending further. (One analysis
was made in which the uplift pressure was applied over a distance of
about 42 feet, but this condition was not considered realistic).
47
RESULTS OF AMLIYSES
The stress components in each element and the displacement components
of each nodal point, which were calculated by the digital computer and
printed in tabular form (see Fig. 8), constituted the direct results of
the analysis procedure. However, the mass of rumerical data was too bulky
to be digested readily in this form, and a considerable effort was
expended in representing the most significant of the data in graphical
plots.
Stress data were presented in two different forms. stress vectors
and stress contours. The stress vectors are merely direct graphical plots
of the princip-l stresses in each elemant. They are plotted from the
center of the element, and consist of arrows showing the sense and
direction of the stresses, the length of the arrow representing the
magnitude. Study of the stress vector diagrams, which are compiled in
the Appendix, reveals a great deal of detailed information about tha
state of stress in the structure. However, a more easily interpreted
representation is provided by the atress contours which are presented
and discussed in the first section of this chapter.
Displacement data are also presented in two different sets of
figures. The boundary displacements are merely figures depicting the
deformed shrape of the cross-section under load. These are of qualitative
interest, but have no great significance with regard to the performance
of the structure. The crack displacements are shown in these figures,
but in order to provide a clearer impression of the extent of the crack
opaning, and of the effect on it of the various load combinations,
separate figures have been construzted showing only the crack displacements.
The displacement figures are presented and discussed in the latter part
of this chapter.
II
48
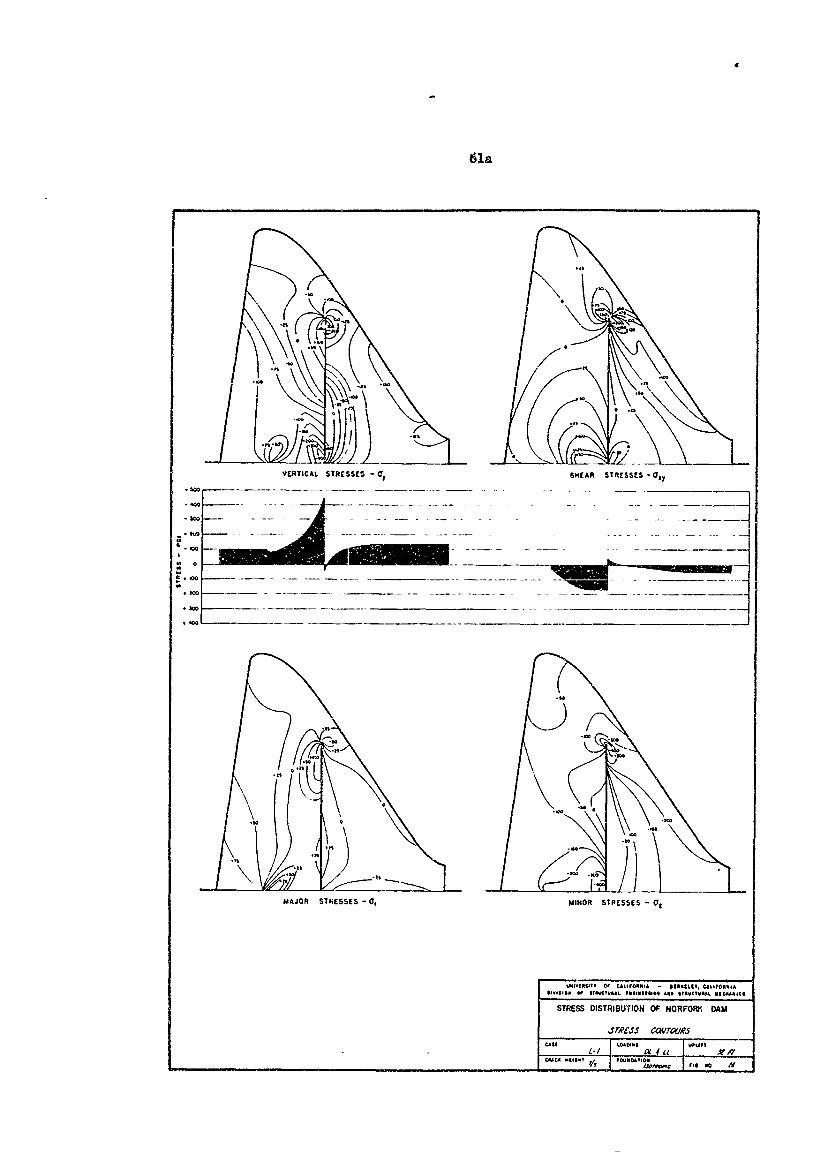
Str~ess, Contours
Liuses connecting points of equal stress intensity in the cross-section
are called iso-static, lines or stress contours. Such contours were drawn
in each case for the vertical normal stress q , the shear stress TX'J
and for the principal stresses G-1 and T2. The major principal stress,
Q'i is defined as the maximum tensile (or minimum compressive) stress,
while the minor principal stress, a 2, is the maximum ccmpressive compenent.
In constructing the stress contours, it was assumed that the stress values
computed for each element existed at the centroid of the element, and the
contours were based on these controls. However, a certain amount of
smoothing was required in converting the discontinuous finite element
results into a representation of the actual continuous system.
Also presented for each case are plots of the 0and Z stress
distributions across the base section of the dam. These curvep were
defined by the intersections of the stress contours with the base line,
The resultant forces represented by these base stress distributions were
evaluated directly from the graphs by means of planimeters. Comparisons
of the calculated force resultants with the applied loads for all cases
are presented in Table III, at the end of this section.
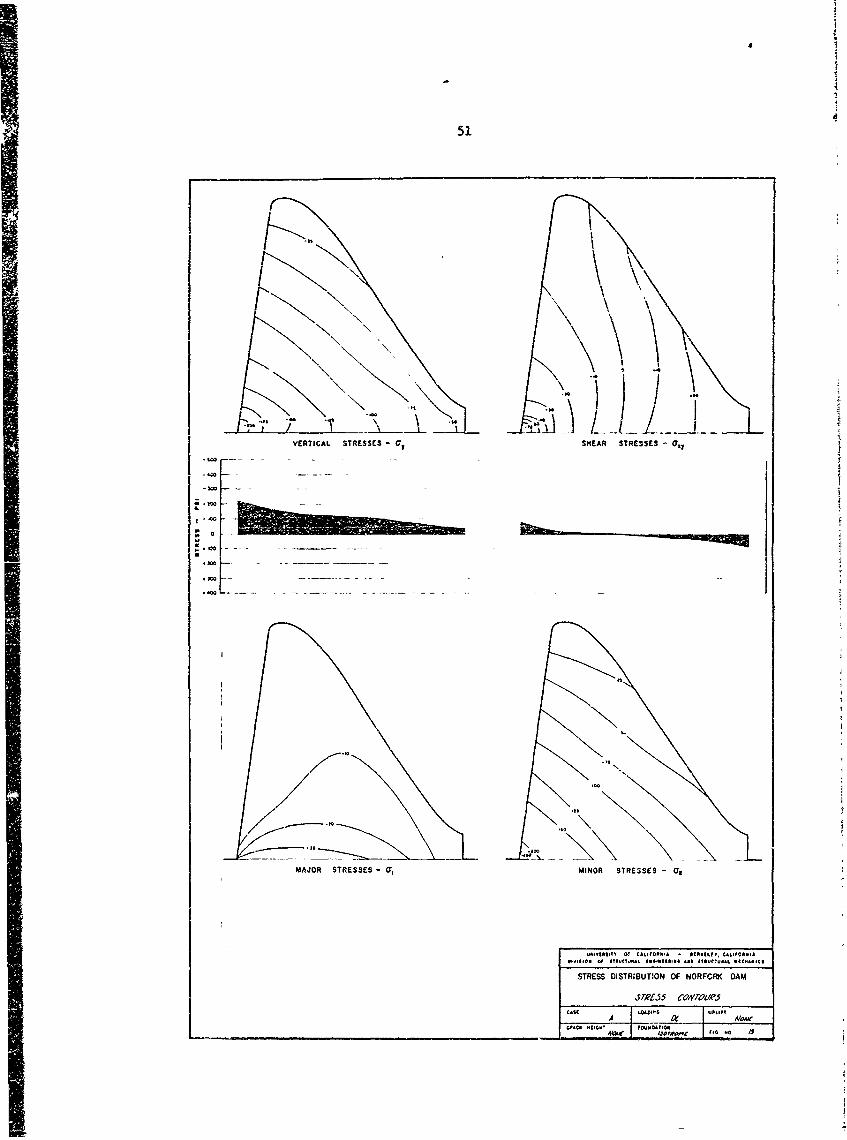
Case A (Fig. 13)-- The base stress distribution computed in this uncracked
section is very nearly of the simple trapezoidal form assumed by the
elementary theory, although a slight tendency toward stress concentration
is evident at the heel of the dam (the expected effect of foundation
elasticity). The shear stress distribution across the base for this
simple, dead load condition merely represents the resistance provided
by the foundation rock to the Poissones ratio expansion tendencies in theI i
concrete. The principal stress plots show that no tensile stress is
49
developed at any point in the section, and that the maximum compressive
stress is about 250 psi, only slightly more than would have been predicted
by elementary theory.
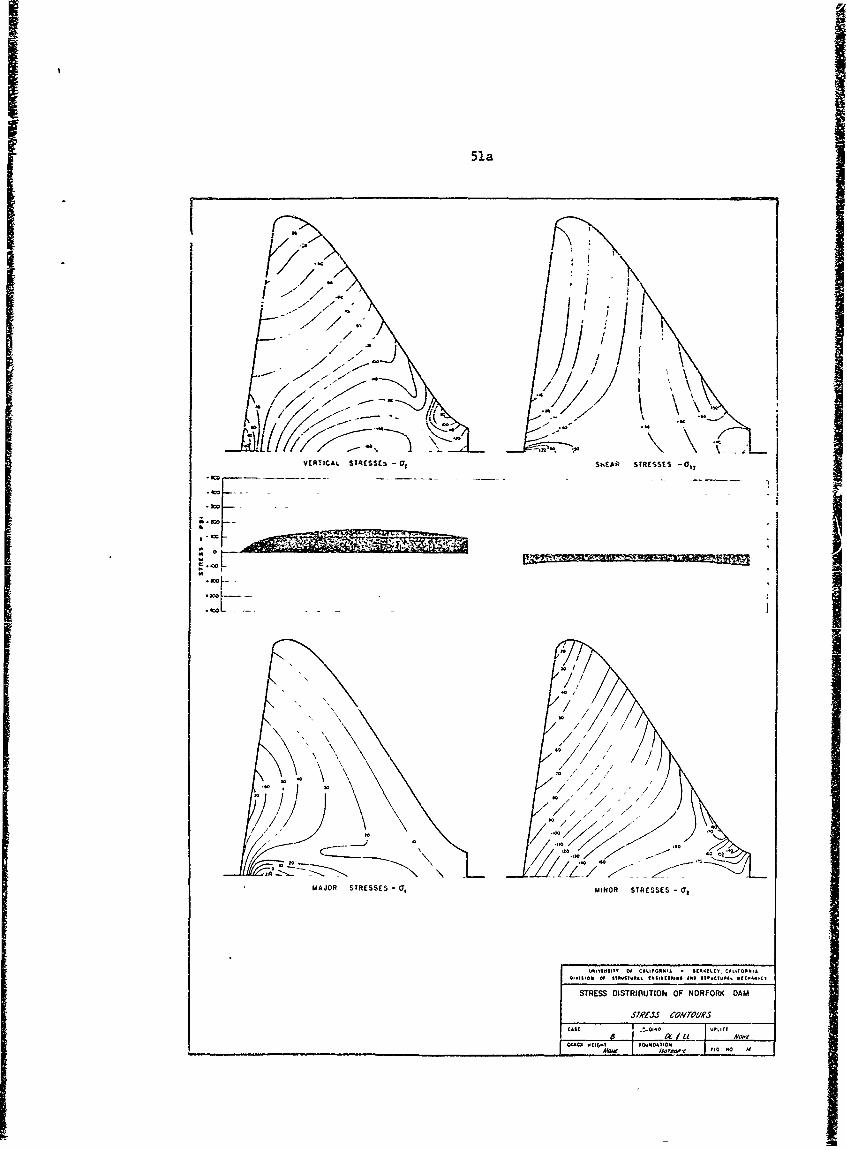
Case B (Fig. 14)-- Comparison of thts case with Case A shows the influence
of the live load on the stresses. Some definite shifts in the distributions
are evident, due to the change in location atid direction of the resultant
applied forces, but no significant change has occurred in the maximum stress
values; actually the maximum stresses have been reduced slightly by the
live load. The most notable change from Case A is the reversal of the base
shear stress direction in the region of the heel. This is a direct xult
of the lateral hydrostatic force, which in this case must be balanced
by the base shear stresses.
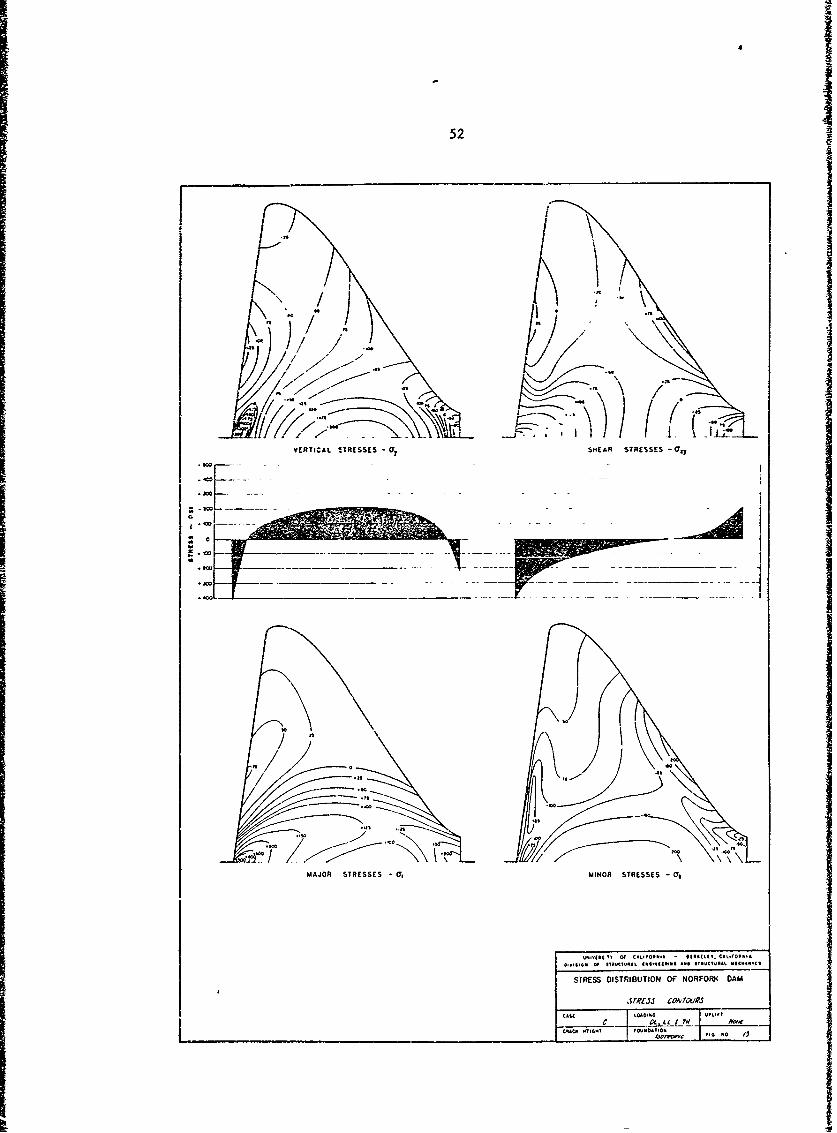
Case C (Fig. 15)-- In this figure it is seen that the addition of the
thermal loads causes very substantial changes in the stress magnitudes and
directions, especially near the base where the foundation resist. the thermal
strains. The primary thermal effect is a lateral contraction of the con-
crete together with the restraint to this contraction which is provided
by the foundation rock. Although the assumed thermal gradient in the
vertical direction tends to distribute this ccnstraining effect over a
fairly deep portion of the dam near the base, the stresses which result
are quite large.
The direct consequence of the base restraint is a system of tensile
stresses a. in the horizontal direction (near the base) accompanied by
shear stresses ( t, ) on horizontal planes. These shear stresses oppos'e
those due to dead load, but when combined with live load effects they
produce a maximum shear stress of nearly 400 psi near the heel. At the
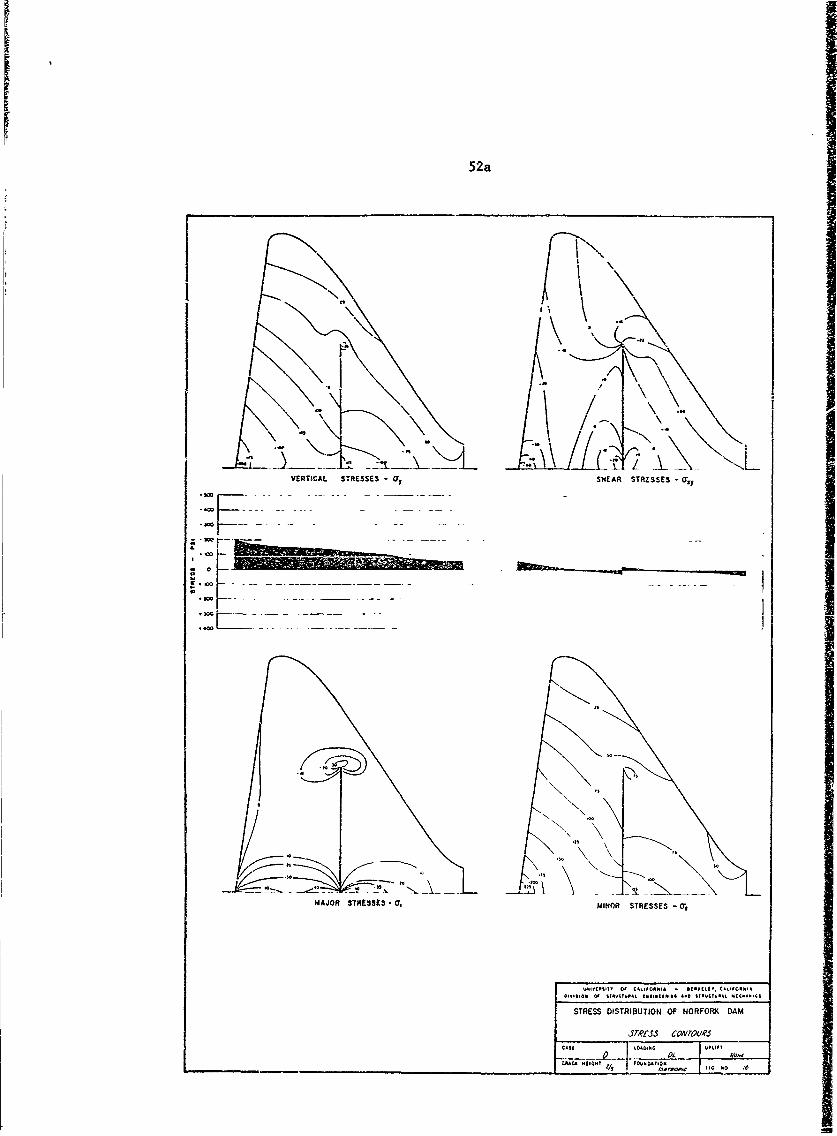
same time, the tensile normal stresses ( Tx ) in the base zone tend to
I
50
cause a rounding of the base plane (convex dowrward), and this rounding
tendency is resisted by vertical normal stresses ( ).
The &asulting tensile stress of 400 psi (as well as the major
principal stress of over 500 psi) in the vicinity ot the heel demonstrates
the severity of the loading produced by the temperature changes. Th..h
the fact that the structure cracked is not surprising.
On the other hand, it should be recognized that the assumed theimal
stresses probably are considerably more severe than those which actually
occurred, at least in the vicinity of the faces of the dam. These zones
probably never achieved the high temperatures which developed in the
mid-section, thus the j thermal stresses near the faces would have been
considerably less than the computed values. The assumed conditions,
probably are quite realistic in the mid-section, however, and the computed
tendency for cracking in this area should be representative of actual
conditions.
Case D (Fig. 16)-- The comparison of this case with Case A demonstrates
the relatively minor influence which the crack had on the stresses due
to dead load alone. The only notable effect is with respect to the
stresses resulting from Poisson's ratio expansion. The lateral stresses
due to this effect are greatly relieved by the vertical crack through the
center of the section, thus the corresponding shear stresses at the base
of the section are also reduced. Minor normal stress concentrations appear
at both upper and lower enud of the crack, but the maximum stresses
associated with these are negligible.
Case E (Fig. 17)-- The influence of the crack on the stress distribution
due to live load is much greater than on that due to dead load, as is
indicated by a comparison of Cases E and B. The cracked section tends to
51
VERTICAL STRESSES a, SHEAR STRESSES a,
300
1400
ot10.. . . .
. - - .-- 40
MAJOR STRESSES- 0r MINOR STRESSES - a,
I MP It10 06 C1L1100-A - OIMtI I, CAZ.FOWA
0Wlo I f *y y101 IL 0i*iIlI lI606 lI..f II ¢011,1I
STRESS OISTR;BUTION OF NORFORK DAM
I JTA'A5 C04'OL/f
CILL00'
51a
- / - I-
/" I /
VM!IAO STR[SSt 5 - (ar SMINO STRESSES (r
- ,. ,, -
- F IGN
52
b//// ,s .0'
METIALO STRESSES - S"hEiNR STRESSES -G l
i~l [l$
1 O €~l#~llii - I~lll, ¢i~f~ikt
.0 I C :,. 5 I -
52a
-. "
VERTICAL STRESSES - -a, SHEAR STRZSSES - 0,
1r _
MAJOR 37ES*T 3 -U(, MINOR STRESSES -Ore
-. V1T 01 C.LI FO.NA- WIWI.~f ¢iCRO A
STRESS DISTRIBUTION OF NORFORK DAM
CIS( IoAoI1 . ,I I'I1
- _ 1 ., ; 0
53
resiut the lateral load as two separate systems, connected only at the top.
Thus the normal stresses ( GO) associated with overturning are much
greater in the upstream block than they were for the solid dexreaching
a value of about 400 psi. Similarly, thi shear force is resisted only by
the upstream block, causing a significant increase in shear stress as
compared with the uncracked case.
Sizeable stress concentrcaions also were developed at the upper end
of the crack in this case, due to the action of the zone above the crack
in forcing continuity of displacement between the two blocks. Two
distinct actions were involved in maintaining continuity. The lateral
force acting on the upstream block pressed it against the restraint of
the dounstream block, causing horizontal compressive stresses ( 3) to
develop above the crack. At the same times the bending of the two blocks
tended to cause the contact surface of the left block to move downward
while the corresponding surface of the right block tended to move up.
The resulting shearing stresses in the zone above the crack put the
upsz.eam face of the crack in vertical tension (G, ) and the downstream
face in vertical compression. This T tensile zone in the upstream
block near the tip of the crack is of considerable interest, in that
horizontal cracking was observed at this location in the prototype.
The corresponding compressive stress in the downstream block is consider-
able larger in magnitude, of course, because the dead weight stress in
this case is an additive rather than a reducing influence. The maximum
compressive stress in this zone is no larger than the maximum base stress,
however, and thus is not of particular interest.
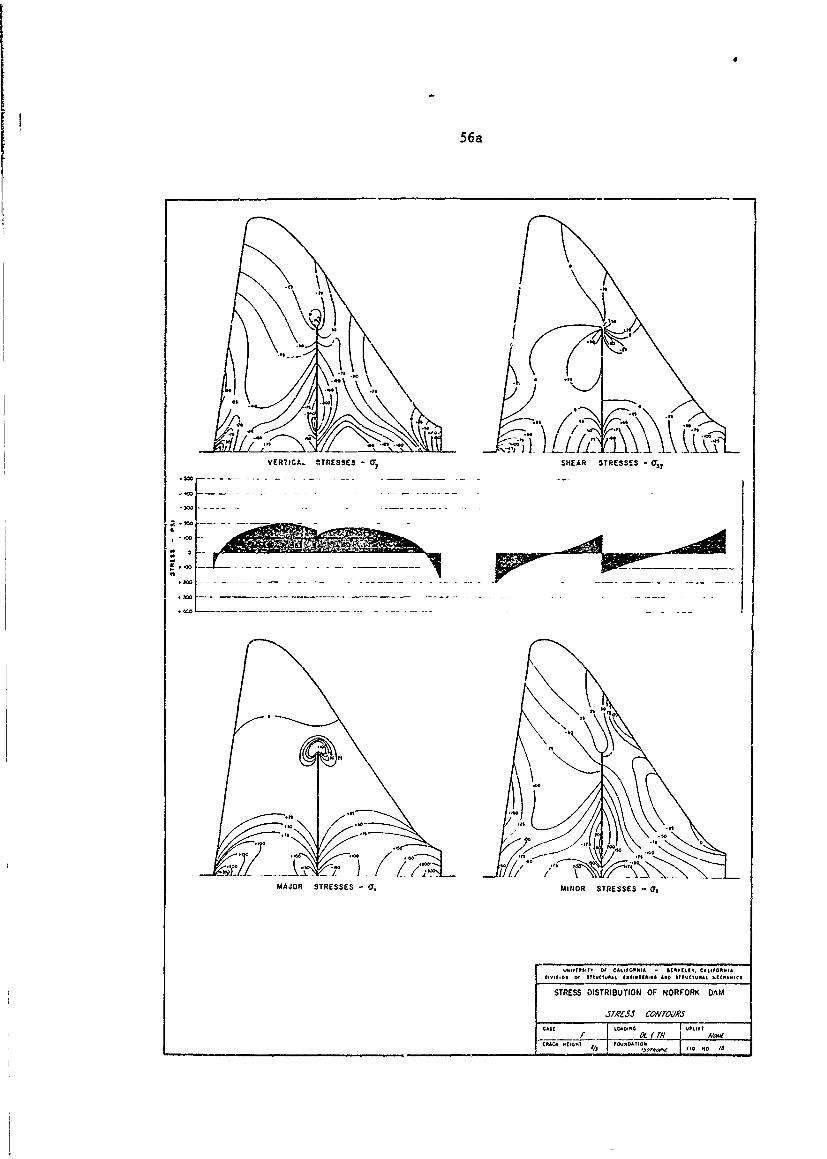
Case F (Fig. 18)-- Comparison of this case with Case D shows the relative
importance of the thermal loads on the cracked section. The thermal
I
I54
effects everywhere are similar to those otbserved for the uncracked
section (see the comparison between Cases B and C) when due allowance
has been made for the fact that the crack has converted the system into
two practically. independent structures. As was noted in the discussion
of Case C, however, the assumed thermal conditions are not entirely
realistic, and a better impression of the importance of the crack
is provided by the comparison of Cases E and B, in which only live and
dead loads are considered.
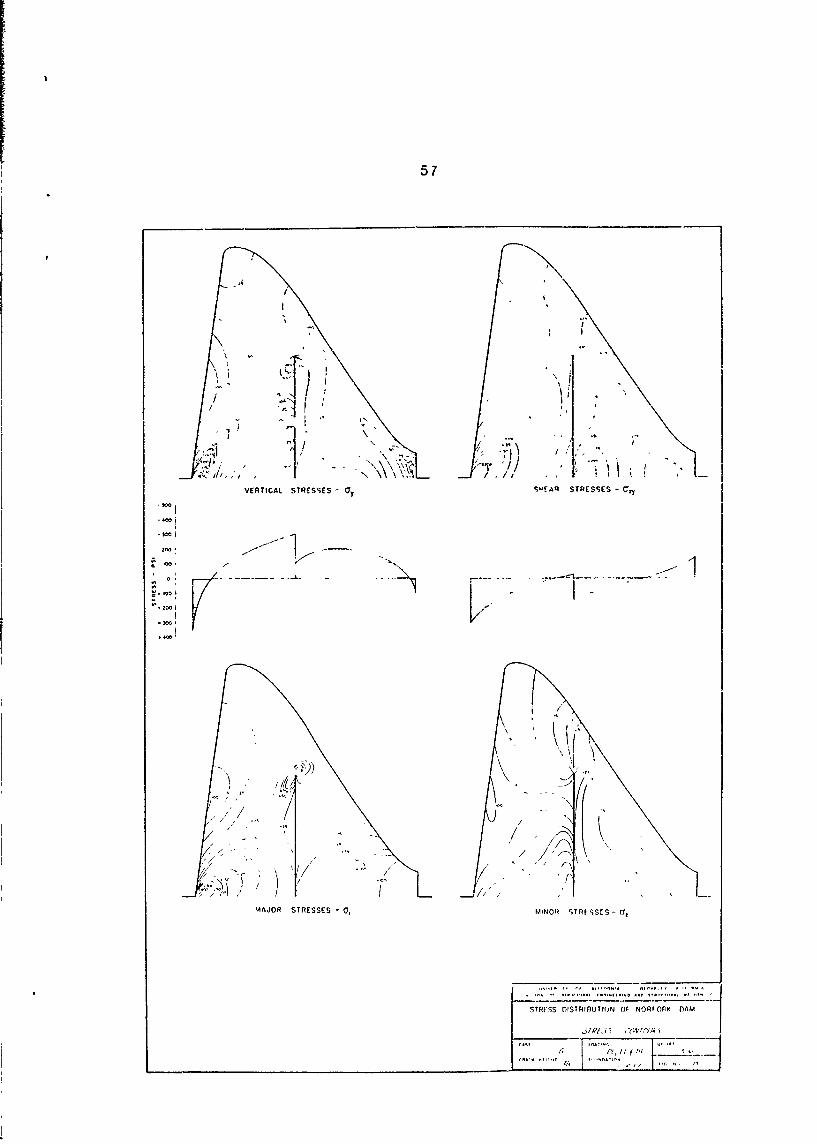
Case G (Fig. 19)-- The differences observed between Cases G and E are
equivalent to the differences between Cases F and D, in that in each
case the differences represent the effect of the thermal load on the
cracked section. On the other hand, the comparison of Cases G and C
demonstrates the influence of the crack on the stress distributions
due to identical load conditions. However, because the stresses resulting
from the temperature changes are quite large, and because the assumed
thermal conditions are a rather crude approximation of the actual
conditions, this comparison is considered to be less significant than
that discussed above for live and dead loads only (Cases E and B).
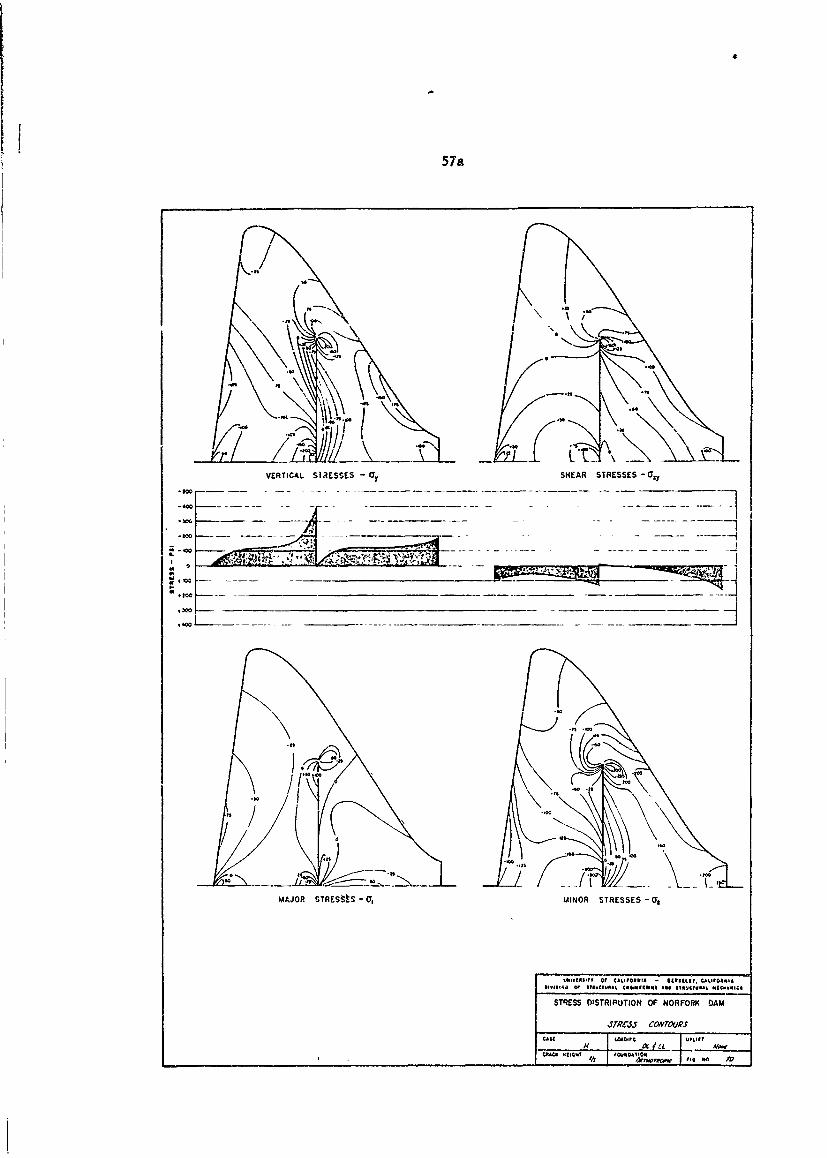
Cpse HI (Fig. 20)-- The influence of the orthotropic foundation is indicated
by a comparison of Cases H and E, since otherwise these two cases were
identical. It is apparent from the similarity of the stress contours for
the two cases that the vertical foundation flexibility has very little
effect on the distribution of stress in the upper regions of the structure.
The only noticeable effect is observed near the base, and is most evident
in the T and 4 values plotted for that section. The reduced vertical
foundation modulus considered in this case makes the dam behave relatively
55
more like a rigid b^dy. Thus the computed strec distribution is more
like that associated with a rigid dam on a flexible base, in which stress
concentrations tend to develop at toe and heel, However, it will be
noted that these increased stress concentration tendencies in Case H as
compared with Case E are not great; in fact they are almost within the
range of accuracy of the method of analysis.
Case I (Fig. 21)-- This c&se corresponds exactly with Case D, the only
difference being that the crack has been extended upward for one more
nodal point to 7/, height. Comparison of these cases demonstrates that
the additional crack height has a negligible influence on all aspectsof
the stress distribution due to dead load alone.
Case J (Fig. 22)-- The relationship between Cases I and D, which wasIdscussed above, applies also to Cases J and E, except that in these
latter cases the live load also is acting. Although the effect is not
large, it is apparent that the increased crack height does result in
a definite increase in certain critical live load stress values. Over
most of the cross-section, the similarities between the two cases are
quite remarkable; but th4 maximum tensile and compressive stresses at
the base show a significant increase in the 7/9 crack case, as does the
maximum tensile stress at the upst-eam face of the crack. This finding
is not surprising, of course; since these critical stress values are a
direct consequence of the crack, it iz to be expected that extending
the crack would result in an increase in their magnitude.
Case K (Fig. 23)-- Another indication of the effect of extending the crack
height is shown by the comparison of cases K and F. As would be expected
in the absence of live load, the difference shown by this comparison (for
dead and thermal loads) is negligible.

56
is~V ARTIA STRESSES -Y MINOAR STRESSES CFO
16 -
C.. I.0 -- 1.1o w
56a
.....:" / I
VERTICA. -TRESSES -y SHEAR STRESSES -ay
-. ".
.,, -it
MAJOR STRESSES - 0, MINOR STRESSES - O7,
ut.,tti- itit 1, OLin -. itt .tY, CA.LIORN IAF tVrtOtSIi o leCtgt&t It*III¢Alh i * tkUCTUt*L ttt ¢*C~IC
STRESS DISTRIBUTION OF NORFORK DAM
,.TA'(55 CON TO dA,.,iASt I tPotC ~rtt LOamNj . ... o
57
" I ,,
VERTICAL STR .S"ES - 0 Sw 'A, STRESSES - C
I/ I I
t ! I
7 \/ '/0
\ i / I " . •,, ) // " " N
' '
MAJOR STRESSES -0, MINORt STRtSSCS -
STR'SSD/S I[UToN r NORFORK {OAM
.... !~ j ....... t .....a 1'/,lII(YU
57a
"N
VERTICAL SIAESSES a, SHEAR STRESSES -G%
MAJOR-TR_-tS -cr MINO STRESES_-U
MOVE IT fCA'4 SOC l Im:I50 [L_ CA RE
It 5 0 0 Io *00
58
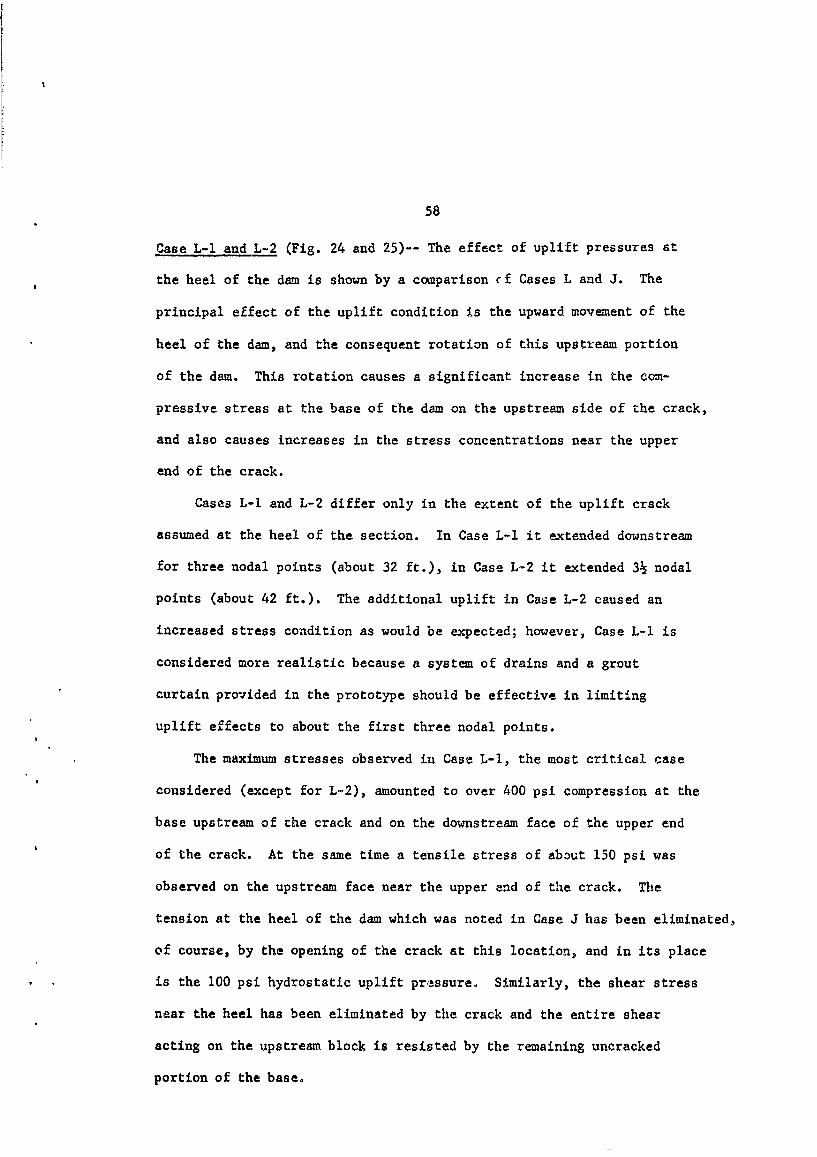
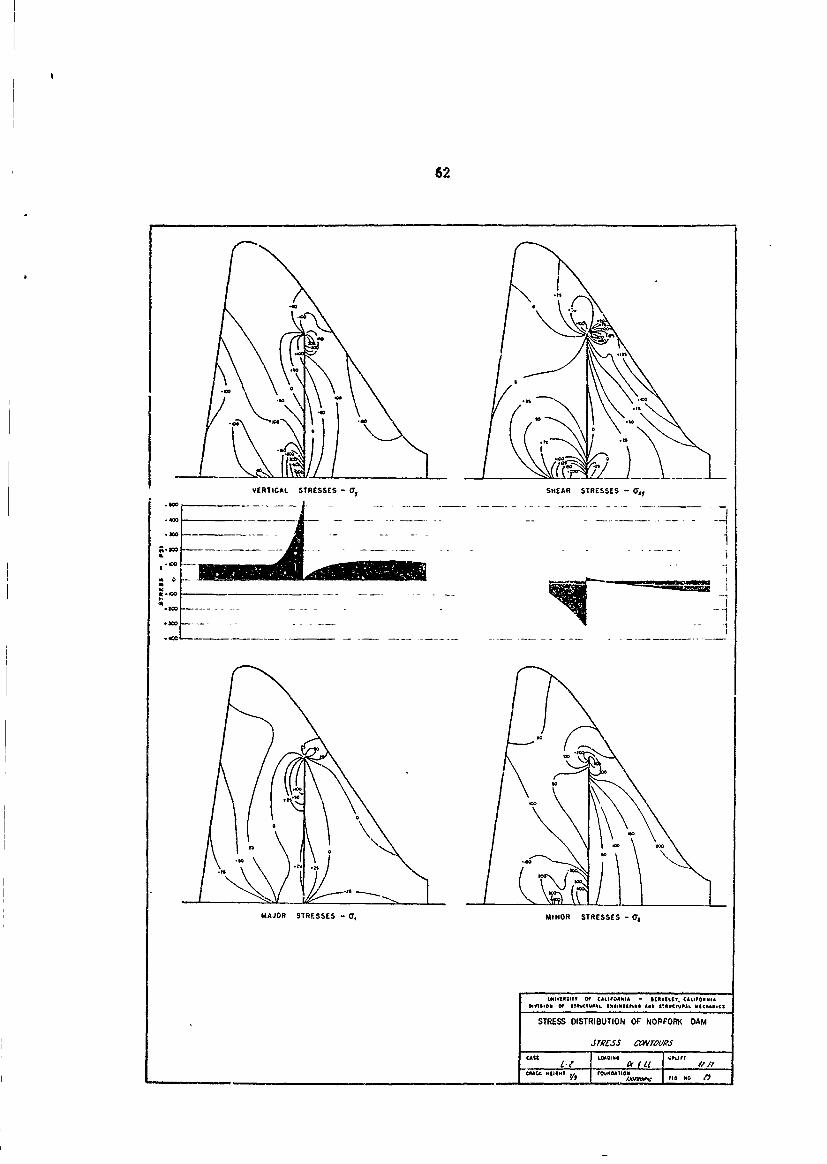
Case L-l and L-2 (Fig. 24 and 25)-- The effect of uplift pressures at
the heel of the dam is shown by a comparison cf Cases L and J. The
principal effect of the uplift condition is the upward movement of the
heel of the dam, and the consequent rotation of this upstream portion
of the dam. This rotation causes a significant increase in the com-
pressive stress at the base of the dam on the upstream side of the crack,
and also causes increases in the stress concentrations near the upper
end of the crack.
Cases L-1 and L-2 differ only in the extent of the uplift crack
assumed at the heel of the section. In Case L-1 it extended downstream
for three nodal points (about 32 ft.), in Case L-2 it extended 3 nodal
points (about 42 ft.). The additional uplift in Case L-2 caused an
increased stress condition as would be expected; however, Case L-1 is
considered more realistic because a system of drains and a grout
curtain provided in the prototype should be effective in limiting
uplift effects to about the first three nodal points.
The maximum stresses observed in Case L-l, the most critical case
considered (except for L-2), amounted to over 400 psi compression at the
base upstream of the crack and on the downstream face of the upper end
of the crack. At the same time a tensile stress of about 150 psi was
observed on the upstream face near the upper end of the crack. The
tension at the heel of the dam which was noted in Case J has been eliminated,
of course, by the opening of the crack at this location, and in its place
is the 100 psi hydrostatic uplift pr,!ssure. Similarly, the shear stress
near the heel has been eliminated by the crack and the entire shear
acting on the upstream block is resisted by the remaining uncracked
portion of the base.
59
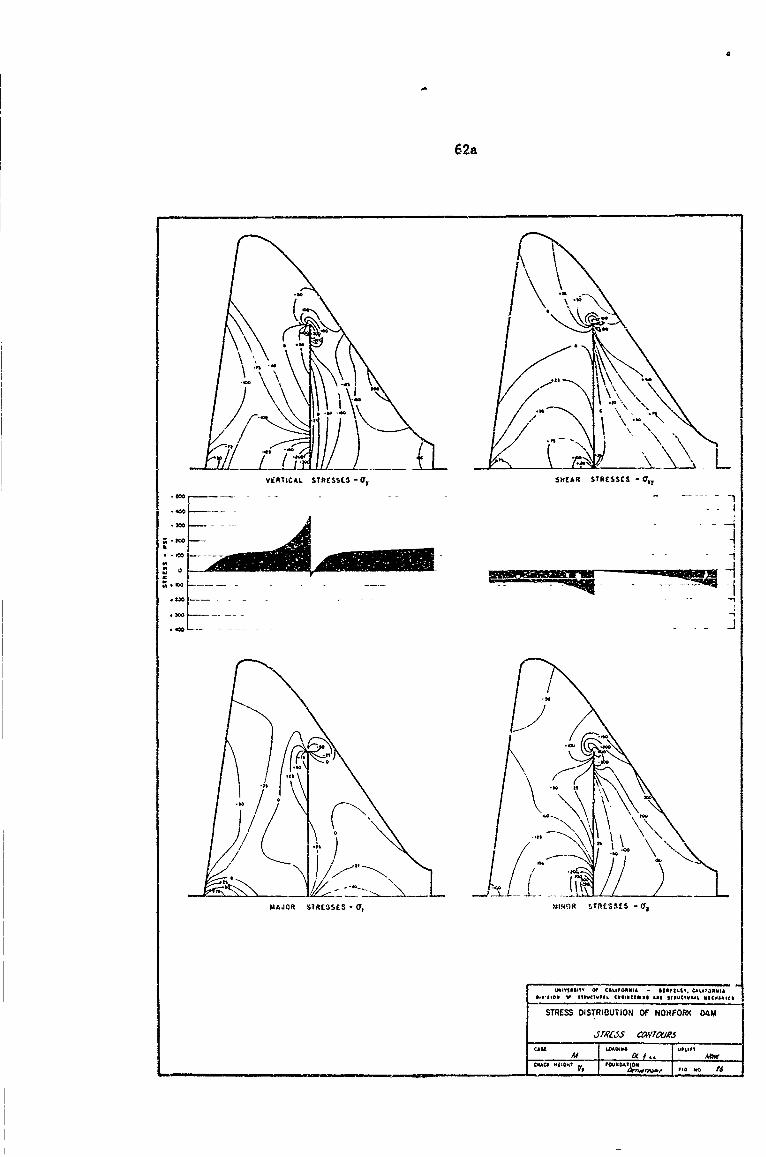
Case (Fig. 26)-- This case is comparable with Case H in that it represents
the condition of dead plus live load acting on the system with the ortho-
tropic foundation. The only difference between this and Case H is the
extension of the crack to the 7/9 height. As might be expected, the result
of this extension is a slight increase of the stress values at all points
of concentration. Of greater interest is the comparison with Case J,
which demonstrates the effect of the orthotropic foundation. In this
comparison it is quite evident chat the softening of the foundation
tends to reduce the bending constraint acting at the base of the blocks,
upstream and downstream of the crack. Thus thel stress gradient across
the base in Case M is considerably less than in Case J. This softening
affect of the orthotropic foundation is considerably more evident here
in the 7/9 crack height case than it was with the 2/3 crack height
(Case H).
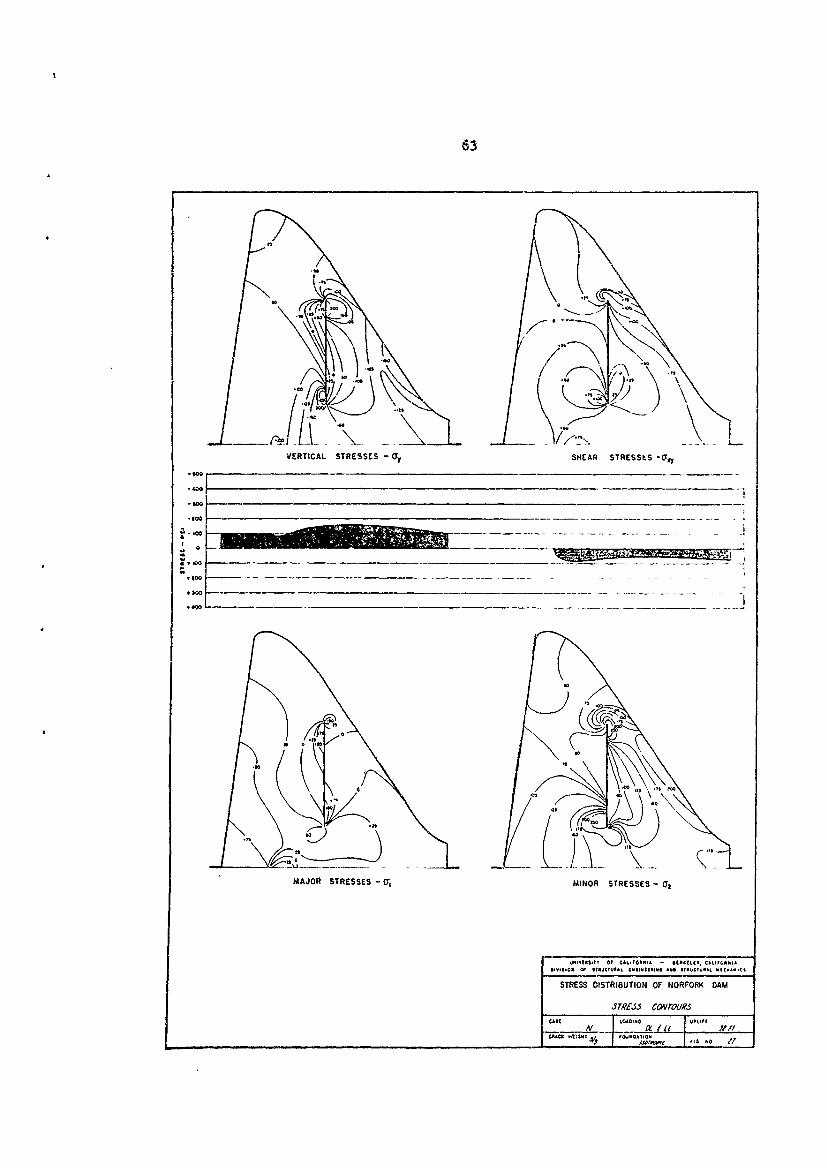
Case N (Fig. 27)-- In this case, the crack has been assumed to extend
upward from 2/9 height rather than from the base. Otherwise conditions
are identical with Case L-1. As would be expected, the stress concen-
trations here are greatly reduced, with maximum compressive normal
stresses of vaily about 250 psi rather than AOO psi as in Case L-1. In
effect, the portion of the dam up ro the hase of the crack acts in crm-
bination with the foundation as a single unit. The remaining portion
which is subject to the crack effect is considerably smaller and there-
fore is stressed less. The form of the stress distribution, however, is
entirely consistent with that observed before.
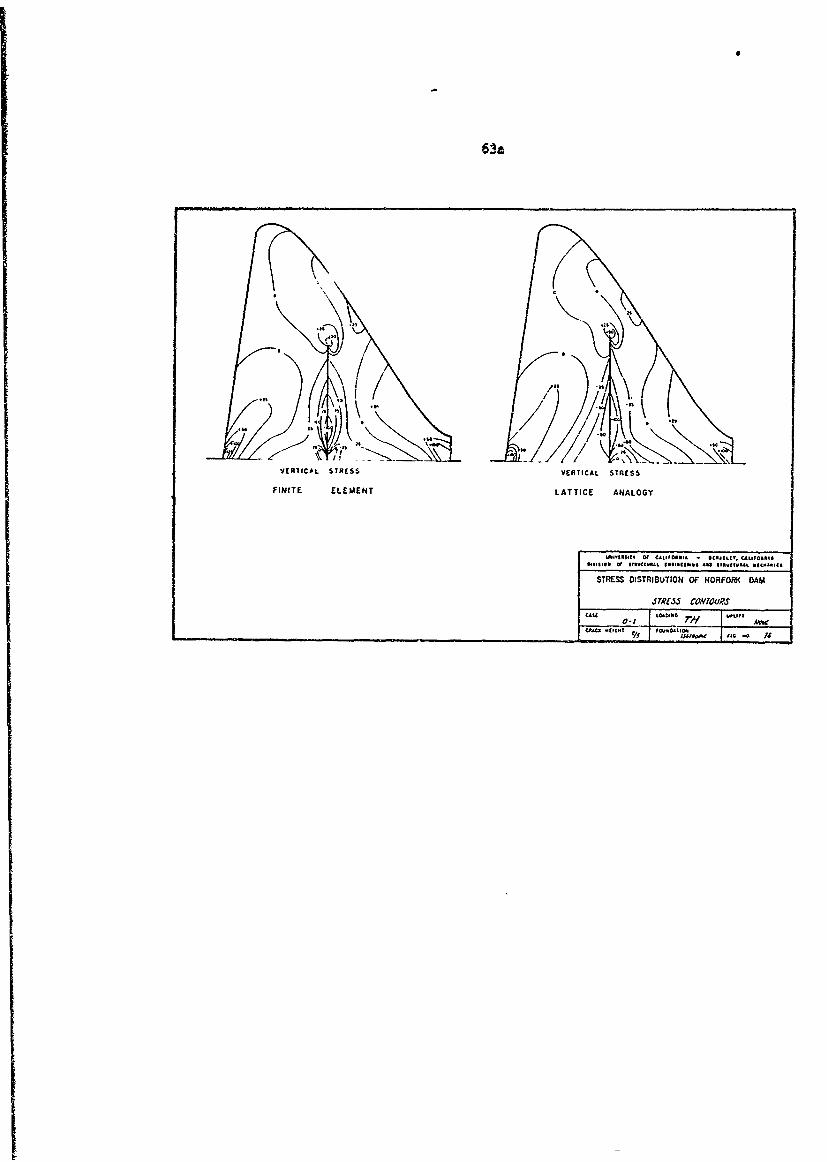
Cases 0-1 and 0-2 (Figs. 28 and 29)-- As was noted previously, thcse
cases were included to provide a direct comparison between results obtained
by the finite element method and those computed by D. McHenry of the
60
VERTICAL STRESS -, SHEAR STRE3SE5 -0,,
.- 00
MAJOR STRESSES -a MINOR STRESSES - 0
M TT Of. -L1 o0 A -- , -0l - SI&KII L Il.ltft- --- I-CIVIAL M 1
STRESS DISTRIBUTION OF flORFORW D)AM
*R..O -,
4- -40 KO11 fiG 0
60a
--
VERTICAL STRESSES - G, SHEAR STRESSES- a.
-1
.. -
MAJOR STRESSES - O, MINOR STRESSES - O
tair[lalf 0 SLI11O14rA -0Ill .L, to1kaa
o*nVI, U I gcTAL UhsSub4nlalNe A u I Mt W gCI
STRESS DISTRIBUTION OF NORFORK DAM
C'TA',5, CO//TOURS
CAAC .IaGY V0~C~I iCICA IG £ so,e 0,. 40 at
61
VERTICAL STRESSES -y SHEAR STRESSES - all
--300
MAJOR STRESSES - MINOR STRESSES -as"
~10.1 lo0lattame 3SfavCIAL [m'SC
STRESS DISTRIUTION OF NORFORK DM
J.T,'JJ CON TOI$
...cC . 10 "m
F, ~on~*c 'o .
61a
F-m
MAJRT~A STRESSES -0,EINR STflESSES 0I
tkOt* TV Of-- -- -A1041 -- -1AU T - ---
STAEOR STSESSESTIONIOOR ORFESS.SDA
~SIR~I 5 ALDS. -auss.asvms
kV:. f *WCLISMEa* iS*SCTM Itt
62
VERICAL STRESSES - Oy SHEAR STRESSES -U1
-00
0 A
_ I I
it- - 00
MAJOR STRESSES - 0, MINOR STRESSES - as
wl4VtasIV 0 CALlFOANIA - SLRK~.(y" C*LtO.A
5 so GN OF llCTO5OL Im 401 .w 0 ame 2?0 UC'0 L &C ....s0
STRESS DISTRIBUTION OF NOPFORK DAM
JTRtS,, CNTOURS
CAUt SI .....€ € NIG.V FOUN ' FI, 5.0
62a
/k \\\
ViRTICAL STRE~SSES -0y SWE1AR STRESSES-,
.3001
r-
30_ __0
o
MAJO STRSSES U, 111ESES Or
I y ltv O A FRI - 9F tT kl3I
(;''v . soc.. iI..2
STRESS SISUINO NFRDA
CA" .our
CmC .1W \ \c.%CT*
63
VERTICAL STRESSrs (Ty SHEAR STRESStS -Cr,
S100
. -. .
g.xo
.44K
MAJOR STRESSES -" MINOR STRESSES - 9,
N 11151l5 O CAL FO1 I ." - $gA-tl(y. C.IFOSW AIi1i5i05 05 555005055L AAiANISAIA ASS *SAUCIUI0&ICSli~
STRESS DISTRIBUTION OF NORFORK DAM
3TA'IJS CtTOUR'
N L LLSI
63a
VR IC AL STRESS VERTICAL SRSS
FINITE ELEMENT LATTICE ANALOGY
,Vt2I.IS P U VA MOaA - *tIILCT, CAL,2O8NI2
.vM,4 2# 0, *.rc ,t 2.,. l.. s 2v222M& *gcosam2.
STRESS DISTRIBUTION OF NORFORK DAM
STRi., CONTOURS
C1 ICPA" .9~
_____________________________________________________________________ ~rA "~-.
64
Portland Canent Association using the lattice anology. The properties
assumaed by McHenry differed significantly from those employed in the
analyses described above, due in part to certain limitations in his
lattice analogy. Consequently it was considered desirable to employ
these same property assumptions in a finite element analysis for the
purpose of making this comparison. Different properties were assumed
in each of the comparison cases, and each is discussed separately.
Case 0-i (Thermal leading only):
Temperature change: T - 230 F (uniform in dam, no change infoundation)
Moduli of Elasticity: Foundation E = 5.0 x 10⁶ psi
Dam EJ 1.90 x 10⁶ psi
Poisson's Ratio: 1/ a 0.33
The C', stresses computed by the two methods are seen in Fig. 28
to be equivalent for all practical purposes. The stress contours are
Senerally the same, and show appreciable differences only at the points
of stress concentration along the base of the dam. At the toe and the
heel of the section, these differences are due primarily to the boundary
approximations imposed by the lattice analogy used by McHenry. The
structure actually analyzed by that approach is one in which the sloping
surfaces of the dam are represented by steps in the rectangular mesh.
Thus at each step a stress concentration is found which is not represen-
tative of the prototype system. The minor differences which may be
seen in the base stress concentrations upstream and downstream from the
crack may be due to differences in the methods of representing the
crack, In any case, the substantial agreement between results obtained
by methods as different as these is good evidence of the reliability of
both methods.
65
Case 0-2 (dead and live load):
Modulus of Elasticity: Dam and foundation E = 4.0 x 10⁶ psi
Poisson's Ratio: 1= 0.33
Unit Weight: Concrete c= 150 pcf
The principal szress distributions for this loading (Fig. 29) are
seen to be remarkably similar, with only very slight differences to be
noted in the stress concentrations at the toe and the heel. These are
due undoubtedly to the step-wise approximation of the sloping faces
which was used in the lattice analogy, and are of no practical importance.
Static Checks of Force Resultants
In applying the finite element method, the digital computer
automatically satisfies the equilibrium requirements imposed on zhe
structure; in other words, internal forces are determined which exactly
balance the external loads acting at each nodal point. Thus, there is
no question that each portion of the finite element idealization is in
equilibrium. However, a further stage of approximation is involved in
establishing the element stresses, and particularly in constructing the
stress contours representing these element stresses. Thus it is of some
interest to compare the resultant forces represented by the calculated
stress distributions with the external load resultants applied across the
same sections. Such checks were made at the base of the dam section for
all cases considered, and also with respect tc the small triangular block
above the tip of the crack for one case.
Base Force Resultants- A comparison of the resultant forces, determined
from the calculated base normal and shear stress distributions, with
the total vertical and horizontal applied load components, Fy and Fx
respectively, is presented in Table III
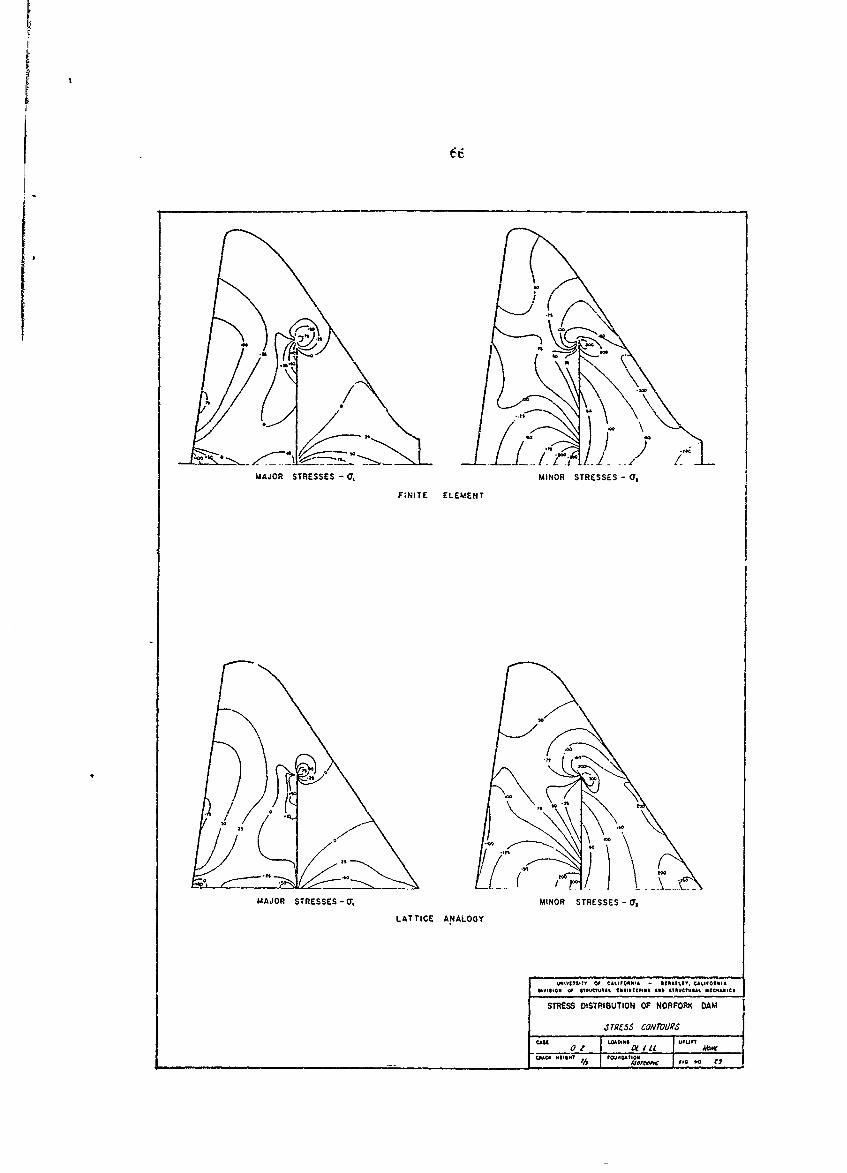
F•FIITEi
MAJOR STRESSES - , MINOR STRESSES - 0,
FINITE ELEMENT
MAJOR STRESSES-9, MINOR STRESSES -a,
LATTICE ANALOGY
UIVCOSIV OP CILIPOPM* - BItutti'. -111OwgQ
STRESS DISTRIBUTION OF NORFORN DAM
JSTRSS CONTOURS
__ __ _ __ _ _ _ _ _ou__o__o¢li~ .iili ! I~ l Ill F.0 I
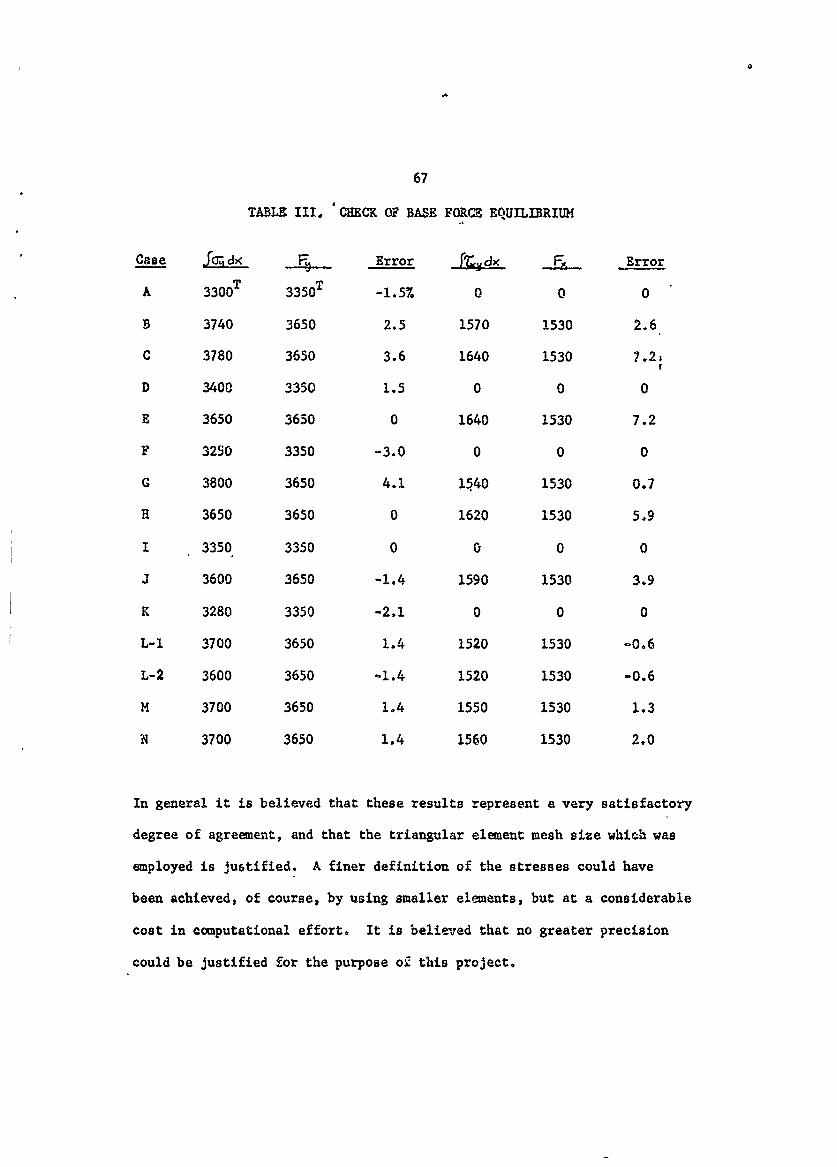
Oa
67
TABLE III. CHECK OF BASE FORCE EQUILIBRIUM
Case fq,-dx Error ____ rorrror CI rrorA 3300T 3350T -1.sz 0 0 0
B 3740 3650 2.5 1570 1530 2.6
C 3780 3650 3.6 1640 1530 7.2;
D 3400 3350 1.5 0 0 0
E 3650 3650 0 1640 1530 7.2
F 3250 3350 -3.0 0 0 0
G 3800 3650 4.1 1540 1530 0.7
a 3650 3650 0 1620 1530 5.9
I 3350 3350 0 0 0 0
J 3600 3650 -1.4 1590 1530 3.9
K 3280 3350 -2.1 0 0 0
L-1 3700 3650 1.4 1520 1530 -0.6
L-2 3600 3650 -1.4 1520 1530 -0.6
M 3700 3650 1.4 1550 1530 1.3
N 3700 3650 1.4 1560 1530 2.0
In general it is believed that these results represent a very satisfactory
degree of agreement, and that the triangular element mesh size which was
employed is justified. A finer definition of the stresses could have
been achieved, of course, by using smaller elements, but at a considerable
cost in computational effort. It is believed that no greater precision
could be justified for the purpose o2 this project.
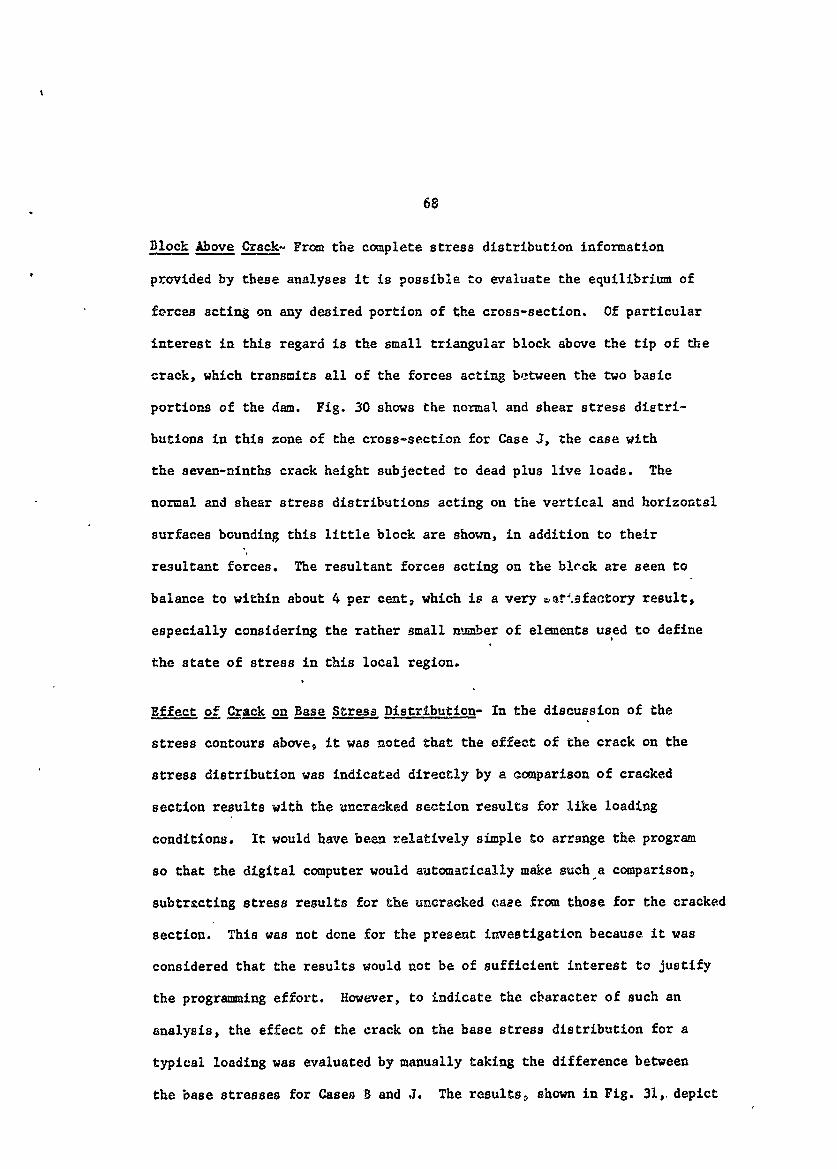
68
Block Above Crack- From the complete stress distribution information
provided by these analyses it is possible to evaluate the equilibrium of
forces acting on any desired portion of the cross-section. Of particular
interest in this regard is the small triangular block above the tip of the
crack, which transmits all of the forces acting between the two basic
portions of the dam. Fig. 30 shows the normal and shear stress distri-
butions in this zone of the cross-section for Case J, the case with
the seven-ninths crack height subjected to dead plus live loads. The
normal and shear stress distributions acting on the vertical and horizontal
surfaces bounding this little block are shown, in addition to their
resultant forces. The resultant forces acting on the blrck are seen to
balance to within about 4 per cent, which is a very ,atr.afactory result,
especially considering the rather small number of elements used to define
the state of stress in this local region.
Effect of Crack on Base Stress Distribution- In the discussion of the
stress contours above, it was noted that the effect of the crack on the
stress distribution was indicated directly by a comparison of cracked
section results with the uncracked section results for like loading
conditions. It would have been relatively simple to arrange the program
so that the digital computer would automatically make such a comparison,
subtracting stress results for the uncracked case from those for the cracked
section. This was not done for the present investigation because it was
considered that the results would not be of sufficient interest to justify
the programming effort. However, to indicate the character of such an
analysis, the effect of the crack on the base stress distribution for a
typical loading was evaluated by manually taking the difference between
the base stresses for Cases B and J. The results, shown in Fig. 31, depict
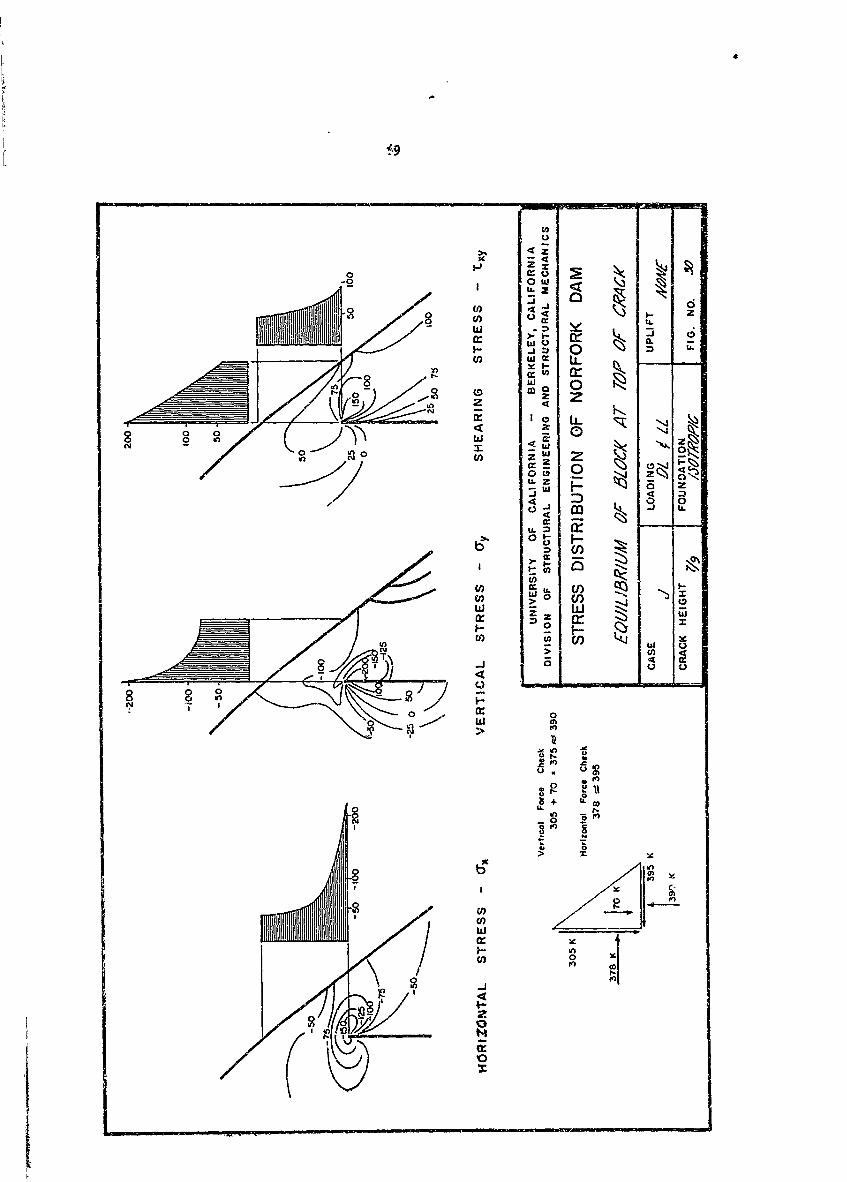
4.9)
(I0 00
U4
I .
LLJ I. -
'0 0 z
-L 4 04
no (n z w
trU F l)
U:
00
')
n>. m
01
(I)
0 00
w (
>Ir
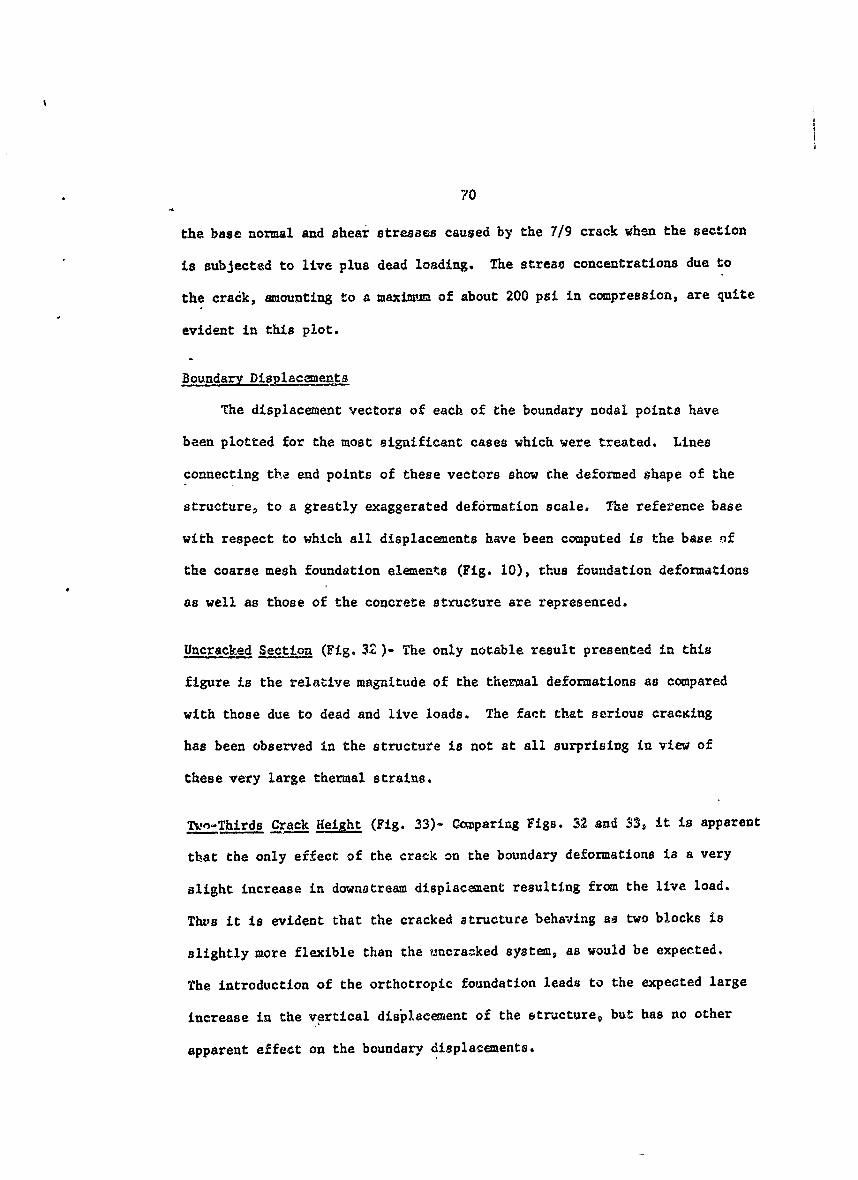
70
the base normal and shear stresses caused by the 7/9 crack when the section
is subjected to live plus dead loading. The strese concentrations due to
the crack, amounting to a maximum of about 200 psi in compression, are quite
evident in this plot.
Boundary Displacements
The displacement vectors of each of the boundary nodal points have
been plotted for the most significant cases which were treated. Lines
connecting the end points of these vectors show the deformed shape of the
structure, to a greatly exaggerated deformation scale. The reference base
with respect to which all displacements have been computed is the base nf
the coarse mesh foundation elements (Fig. 10), thus foundation deformations
as well as those of the concrete structure are represented.
Uncracked Section (Fig. 3& )- The only notable result presented in this
figure is the relative magnitude of the thermal deformations as compared
with those due to dead and live loads. The fact that serious cracking
has been observed in the structure is not at all surprising in view of
these very large thermal strains.
T,-Thirds Crack Height (Fig. 33)- Comparing Figs. 32 and 33, it is apparent
that the only effect of the crack on the boundary deformations is a very
slight increase in downstream displacement resulting from the live load.
Th's it is evident that the cracked structure behaving as two blocks is
slightly more flexible than the uncra-ked system, as would be expected.
The introduction of the orthotropic foundation leads to the expected large
increase in the vertical displacement of the structure, but has no other
apparent effect on the boundary displacements.
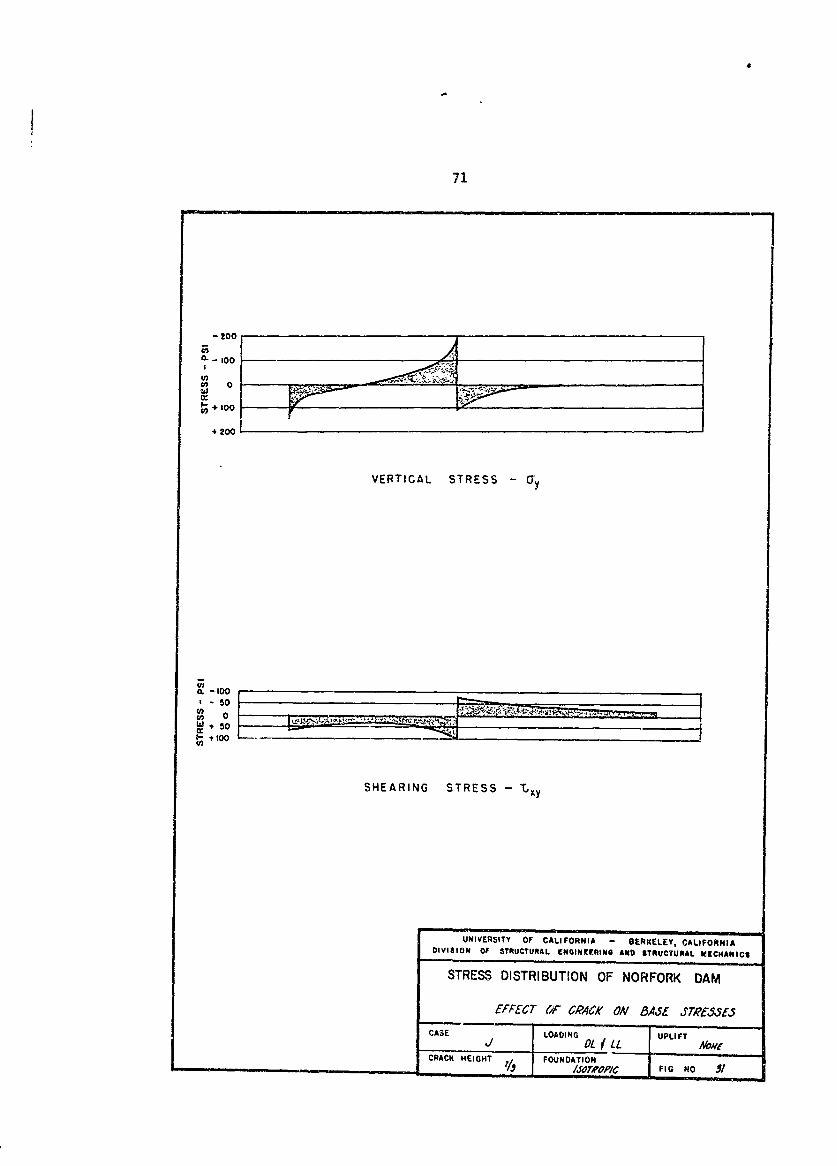
Ia
71
- 200
- 100
a,n 0
+'0
VERTICAL STRESS -9y
1.- 00
SHEARING STRESS - %xy
UNIVERSITY OF CALIFORNIA - BERIKELEY, CALIFORNIADIVISION OF STRUCTURAL ENOINEERING AND STRUCTURAL 19ECHANICS
STRESS DISTRIBUTION OF NORFORK DAM
EFFECT (6F CACA' ON BASE STMEML53
CASE LOADING UPLIFT
CRACK HEIGHT FOUNDATION
/JorraOP/c FIG NO 51
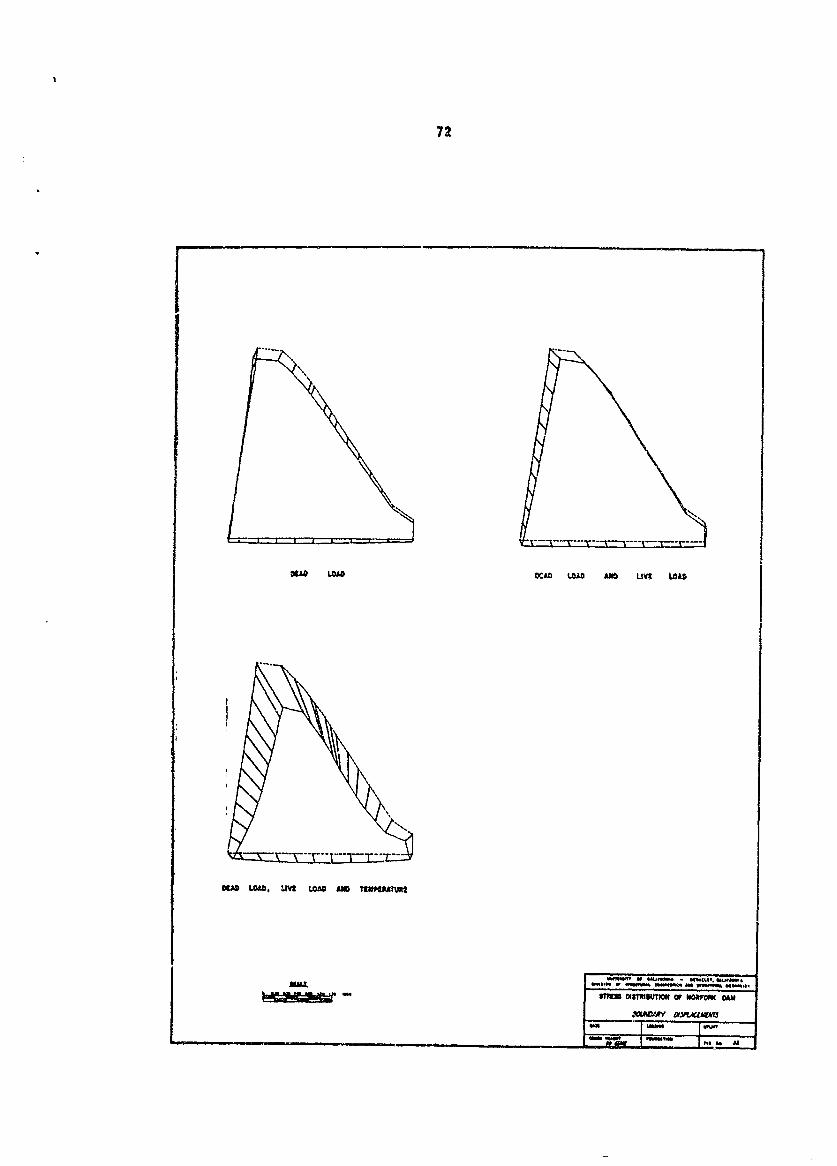
72
01*0 LAW OCAD LOAD £AM LIVII LOAD
01*0 LO. LM LOAD AM0 ?IWKMMWJ
-e% ASTsaU olamrIUom OF WOATFM DAM
XAOY WMA"MM£
- q.
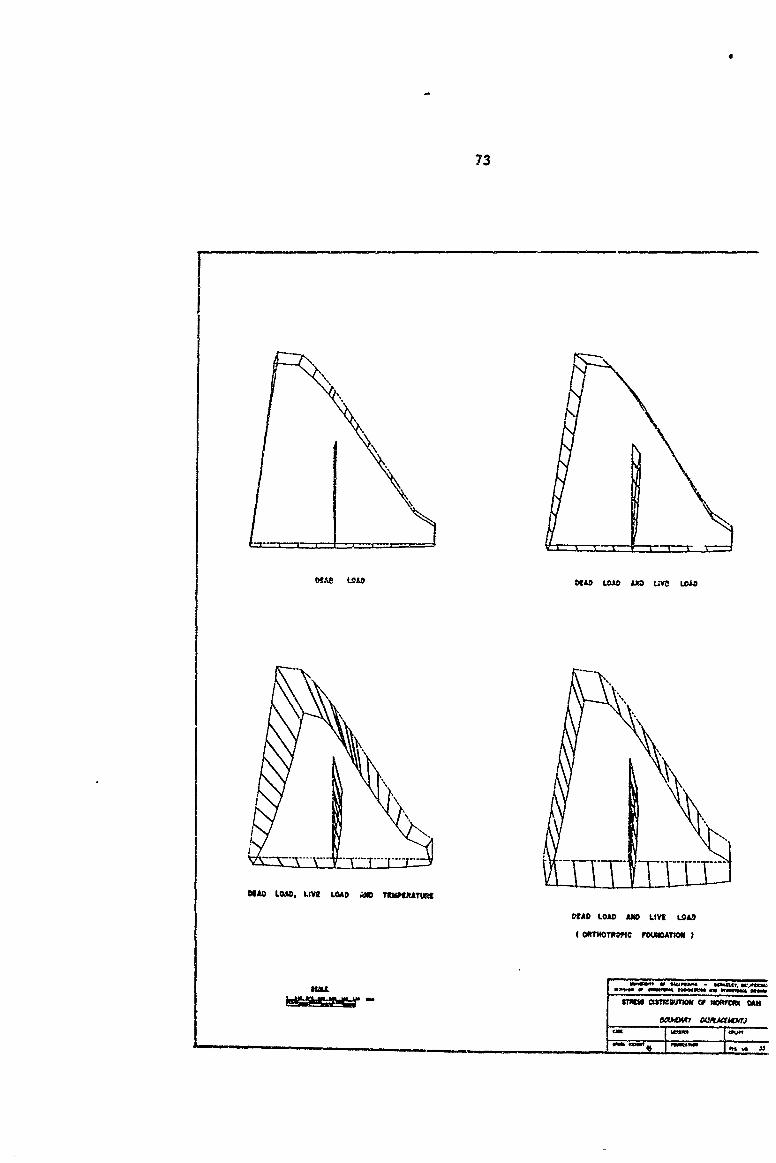
73
cc" ouLV LD mEA LOA £O UOOA
.- A LOAD AN IE LA
I mom ~~
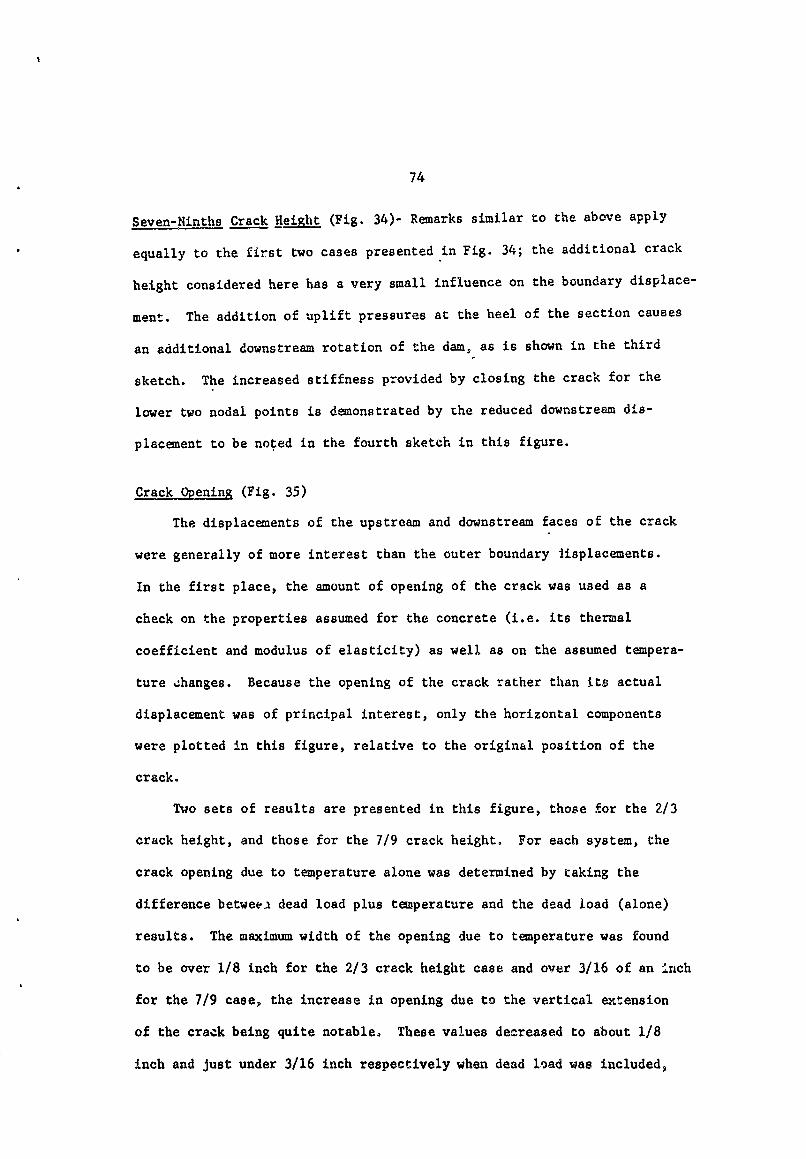
74
Seven-Ninths Crack Height (Fig. 34)- Remarks similar to the above apply
equally to the first two cases presented in Fig. 34; the additional crack
height considered here has a very small influence on the boundary displace-
ment. The addition of uplift pressures at the heel of the section causes
an additional downstream rotation of the dam, as is shown in the third
sketch. The increased stiffness provided by closing the crack for the
lower two nodal points is demonstrated by the reduced downstream dis-
placement to be noted in the fourth sketch in this figure.
Crack Opening (Fig. 35)
The displacements of the upstream and downstream faces of the crack
were generally of more interest than the outer boundary lisplacements.
In the first place, the amount of opening of the crack was used as a
check on the properties assumed for the concrete (i.e. its thermal
coefficient and modulus of elasticity) as well as on the assumed tempera-
ture changes. Because the opening of the crack rather than its actual
displacement was of principal interest, only the horizontal components
were plotted in this figure, relative to the original position of the
crack.
Two sets of results are presented in this figure, those for the 2/3
crack height, and those for the 7/9 crack height. For each system, the
crack opening due to temperature alone was determined by taking the
difference betweei dead load plus temperature and the dead load (alone)
results. The maximum width of the opening due to temperature was found
to be over 1/8 inch for the 2/3 crack height case and over 3/16 of an Inch
for the 7/9 case, the increase in opening due to the vertical extension
of the crack being quite notable. These values decreased to about 1/8
inch and just under 3/16 inch respectively when dead load was included,
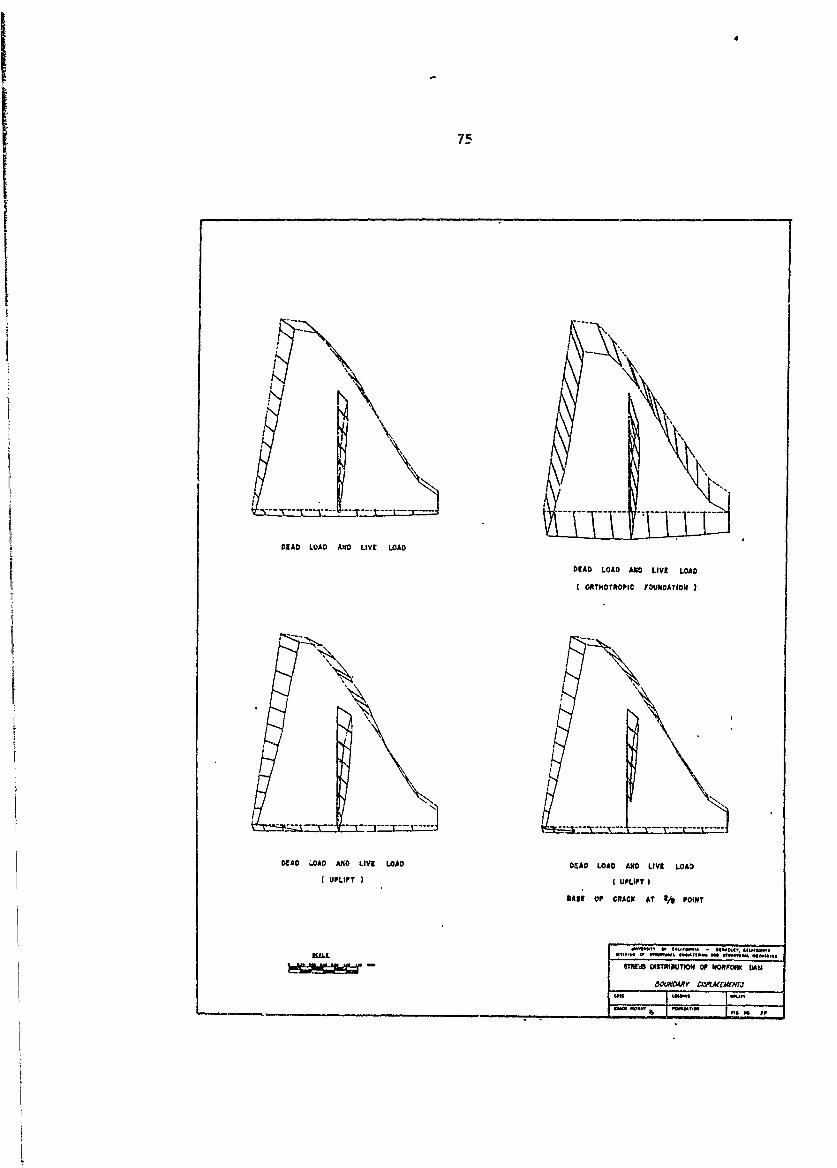
75
DEAD LOAD A'O LIVE LOAD
DEAD LOAD AJ LIVE LOAD
ORTHOTROPIC FOUIOATION )
DEAD LOAD ANO LIVE LOAD DIAD LOAD AND LIVE LOA3
UPLIFT ) ( UPLIFT )
BAlE OF CRACK AT 2/9 POINT
STMP DISTRIUT OF WRFOW (UM
60~OAY AtwMErT
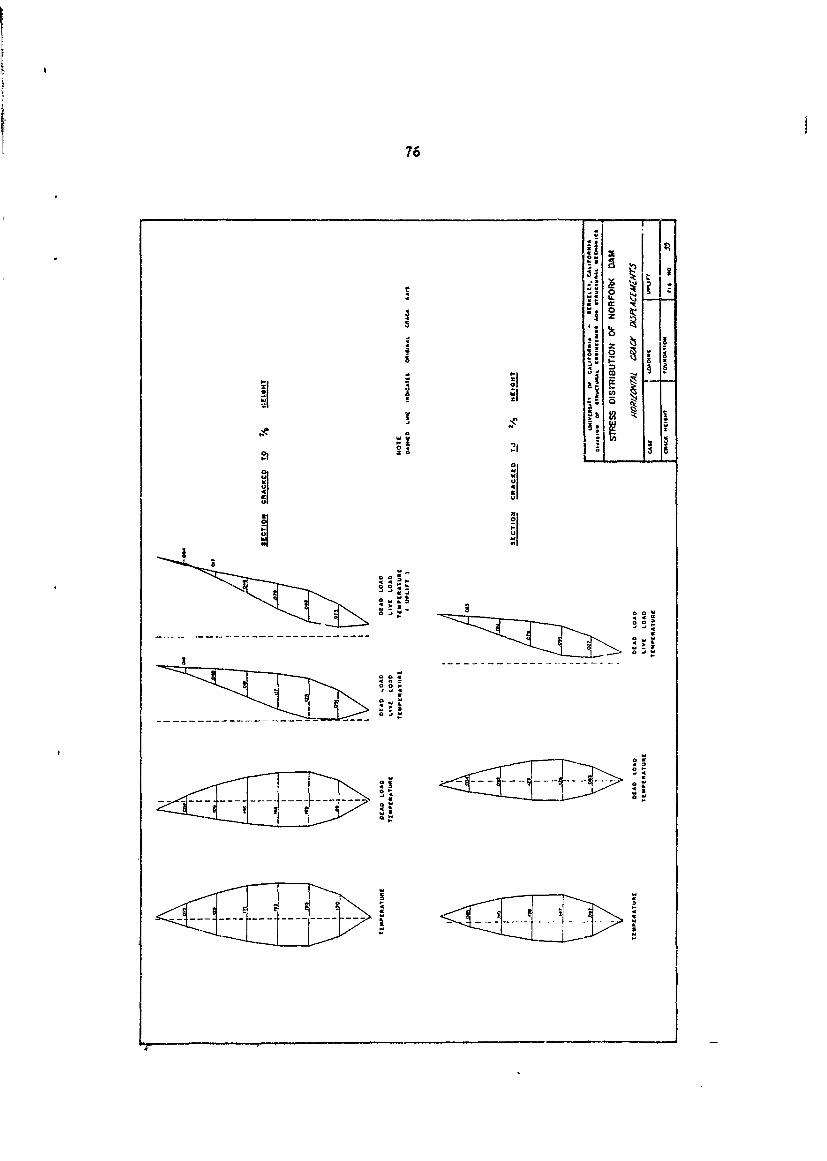
76
* Ii--, 0 ~ -
a .~I- 8 =
a I a$
a
II
ac-if0*
o * a00'
4 hi~hi~1
a
C hi4~thi~aCa-
4*
ci - --------------- if
-hi
-if0"
4 -if - 1
hitS- ii
77
a more realistic condition, of course. Addition of the live load then
caused both a large downstream displacement of the crack, as well as
tendencies toward closing near the upper end (where the base constraint
was less effective). The amount oi closure was somewhat greater in the
7/9 case, but even here it did not completely close at any point.
However, when the uplift pressures were added, it was found that
the crack did actually close at the top nodal point in the 7/9 case.
The calculations show an excess of closure of 0.004 inches, thus the
displacements actually would have been slightly less than these computed
values, and results obtained in this case may be considered slightly
conservative. In other words, contact pressures across the upper nodal
point of the crack would have carried some of the stress, and results
would revert back slightly toward those obtained for the 2/3 crack
height case.
It should be noted, however, that only in the most severe conditions
assumed did auy crack closing develop, and since the crack probably
does not extend all the way from the base to 7/9 height, it is probable
that no closure actually has been produced on the prototype structure.
78
CONCLUS IONS
The results obtained in this investigation permit several conclusions
to be drawn with regard to a number of different aspects of the study.
It should be pointed out that the investigators were not requested to
establish the adequacy of the structure and no conclusions of this type
will be reported (though it should also be mentioned that none of the
results indicate an overstressed or unsafe condition). Specific conclusions
are discussed consecutively, below.
Method of Analysis
One of the most important results derived from the study was the
dmonstration of the effectiveness and versatility of the finite element
method and of the digital computer program which was developed to
implement the method. Stress distributions and deformations were obtained
for a variety of complex plane stress systems ,subjected to some rather
awkward loading conditions. The input data required to define any
problem is easily prepared; the most time consuming part of the task is
the choice of the most suitable finite element mesh and the evaluation
of the coordinates of the nodal points of the system. When the input data
has been prepared properly, the operation of the program is automatic
and the analysis can be carried to any suitable degree of convergence.
Computer time requirements are quite reasonable, even for the treatment
of complex cases such as these.
The comparison of this method with the lattice analogy employed by
D. McHenry demonstrated that both methods givs reliable results. The
lattice analogy idealization utilized a much finer mesh than was considered
desirable in the finite element system. In any analysis of this type it
79
is necessary to weigh the advantage of increased precision of the results
against the cost in computer time, which increases rapidly with the
number of elements. In general, it is best to use only enough elements
to obtain the necessary accuracy; this is particularly true when a
large number of cases are to be treated. Comparisons of the computer
time requirements of the two methods are relatively meaningless because
the IBM 704 used in this study is a much faster and more powerful machine
than the LGP30 used by McHenry, though it may be noted that the analysis
of a single case by McHenry took about 200 times as long as to do a
similar problem on the IBM 704.
The most obvious advantage of the finite element method over the
lattice analogy is the ease with which it can account for arbitrary
boundary conditions(e.g. sloping surfaces), arbitrary material properties
(Poissons' ratio must be taken as 1/3 in the lattice analogy) and
arbitrary thermal variations. Such special conditions as the orthotropic
foundation, which would be quite difficult to represent in the lattice
analogy, also may be included without difficulty.
Effect of Crack
The principal reason for initiating this investigation was thi question
as to how a centrally located crack would affect the stress behavior of a
gravity dam. These studies showed clearly that, although several rather
significant stress concentrations might be associated with the crack,
the magnitudes of the total stresses were not excessive for the section
geometry considered here, being less than 500 psi in all cases. The
principal stress concentration zones were at the upper and lower ends
of the crack and at the heel of the dam. Tensile stress was developed at
80
the heel of the cracked section, and at the upstream face of the crack
near its upper end. It is of interest to note that cracking was observed
in the prototype at this latter location, and it is presumed to be
present in the vicinity of the heel also.
Thermal Loading
The finite element analysis described in this report ind'.c es stresses
due to thermal changes which are consistent with the assumed behavior of
the structure. However, it is believed that the magnitude of the com-
puted stresses, which exceeds 500 psi near the heel of the cracked section
or 350 psi at the base of the section with the crack extending to 7/9 height,
is considerably greater than the actual thermal stresses developed in
these initial zones because several of the assumptions on which the analysis
is based are not satisfied.
The principal differences between the assumed and the actual conditions
are as follows:
1) It was assumed that there was no horizontal temperature giaedient,
whereas it is known that the temperature rise (and subsequent
cooling) must be significantly smaller near the exposed surface
of the section. Tensile stresses near the surface therefore
would be significantly less than computed.
2) It was assumed that the entire section was subjected to dead
weight and cooling effects as a unit, whereas the structure
actually was built over an extended period of time, and cooling
deformations of the earliest construction took place before the
81
final sections were built. Resistance to thermal deformation
(thermal stress) must therefore be less than computed.
3) it was assumed that the section acted as a homogeneous, isotropic
elastic system except for the specified vertical and uplift
cracks, whereas it is known that many additional smaller cracks
developed in the structure, particularly near the base. These
additional cracks woulu have the effect of relieving tensile
stresses wherever the computed tensile stresses were high
enough to induce cracking. Specifically, it would be expected
that the horizontal (0x) tensile stress over the entire base
section, and the vertical (Cy) tensile stress near the heel
would be reduced by this effect.
Because of these several factors tending to reduce thermal stess,
it is believed that the computed thermal stresses are significantly
higher than the actual values in the critical stress regions. Therefore
it was deemed advisable to base the principal stress analysis conclusions
of the study on dead and live load effects, and to take account of the
thermal analysis with regard to its deformation effects only. This is.
equivalent to assuming that all thermal stress was dissipated by creep
and cracking.
Orthotropic Foundation
Although the orthotropic foundation was found to contribute to large
vertical displacements of the section, the effect of the orthotropy
on the stress distribution was inconsequential. Thus any question as to

82
whether the assumed foundation properties are correct or realistic is
of little importance; it seems clear that the results don't depend upon
this factor.
83
ACKNWdLEDGMENTS
A number of individuals 'nd groups of people made significant
contributions to the work described in this report, and the author wishes
to thank them all for their participation. Most important were
Messrs. Edward L. Wilson and Ian King, graduate students of the University
of California, who actually carried out all of the analyses discussed
herein--from the initial preparation of data to the plotting of the final
results. In addition, Mr. Wilson was responsible for the development of
the digital computer program which made the investigation possible.
The Little Rock District Office of the Corps of Enginaers, under
Mr. E. F. Rutt, and its Board of Consultants: Messrs. R. W. Carlson,
R. E. Davis, and Byram Steele were very helpful in establishing the
properties of the system and in selecting the loading conditions to be
considered. It was particularly convenient to have Prof. Davis and
Dr. Carlson available locally for consultation at various intervals
during the course of the study, and their continued interest and
cooperation is greatly appreciated.
Finally, acknowledgment is due the University of California Computer
Center which provided the computer on which the com=tstie-s were carried
out, and to the National Science Foundation whost research grant supported
the original development of the finite element computer program, prior to
the initiation of this study.
84
REPERENCES
1. Zienkiewicz, 0. C., "The Stress Distribution in Gravity Dams",
Journal, Institution of Civil Engineers, Vol. 27, 1946-47.
2. Raphael, J. M., "The Davelepment of Stresses in Shasta Dam",
Trans. AS(Z, Vol. 118, 1953.
3. Boulder Canyon Project, Final Reports; Part V, Technical Investigations;
U.S. luean of Reclamation, Denver, Colorado, 1938-1940.
4. Clough, R. W., 'The Finite Element Method in Plane Stress Ana.. ses"
Proceedings, ASCE 2nd Conference on Electronic Computation,
Pittsburgh, Pa., September 1960.
5. Turner, M. J., Clough, R. W., Martin, H. C., and Topp, L. J.,
"Stiffneass and Deflection Analyses of Complex Structures", Journal
of the Aeronautical Sciences, Vol. 23, No. 9, September 1956, p. 805.
6. Erennikoff, A., "Solution of Problems of Elasticity by the Fraework
Mthod", Journal of Applied Mechanics, December 1941.
7. McHenry, D., "A Lattice Analogy for the Solution of Stress Problems",
Jouwl, Institati of ivl SO, Decber 1943, pp. 59-82.
8, Clough, R. W., "Structural Analysis by Means of a Matrix Algebra
Prgr m%", Proceedings, ASCE Conference on Electrmic Cmputation,
Kansas City, Novber 1958.
9. Lehman, F. G., "Simuitaneous Equations Solved by Over-Relaxation",
Procvoings, ASCE 2nd Confe om Elctrotc Computation, Pittsburgh,
Pa., September 1960.
85
SUPPLEMENTARY INVESTIGATION
INTRODUCTION
Objectives of the Supplementary Investigation
During the course of the original investigation regarding
the stress distribution in Norfork Dan, a number of topics
came up which were of interest, but were beyond the scope of
the contract. Accordingly, the contract was modified to permit
the extension of the investigation into two of these areas,
and this supplementary report describes the work done under
the extended contract. This supplement is intended merely
as an addition to the original report and is not complete in
itself.
One of the topics considered here involves a simple
extension of the analyses performed in the original work, to
include a case not previously treated. In this new case,
which is designated N-2, the central crack is assumed to ex-
tend from the first to the seventh nodal points (i.e., from
1/9 to 7/9 height). Thus it lies midway between cases L-1
and N of the original investigation. It is now believed that
this new case is closer to the actual conditions in the dam
than any of the previous cases. Case N-3 is identical with
N-2 except that the reservoir level has been set at 573 ft.
elev. rather than 584 ft as was assumed for all other live
load cases, It represents the state of stress develored by
86
the maximum water level yet permitted in the reservoir.
The other subject of this supplementary study is the case
of a crack extending through to the upper surface of the damn.
Examination of the dam indicates that no such crack exists;
however, this condition is of interest as a limiting case as
well as a subject of scientific curiosity. The physical
properties of the dam were assumed the same for this case as
before, and a similar finite element idealization was adopted.
As before, the thermal changes were used merely to establish th&
initial crack opening (under dead load plus thermal conditions).
The thermal stresses were considered to be unrealistic, due
to creep effects, and were not included in the final stress
distributions. Isotropic foundation conditions were assumed
in all of the new analyses, and the calculations were carried
out both with and without uplift pressures.
The princi3)al difference between these new cases and the
previous analyses is that, with the crack extending to the
surface, the section becomes so flexible that addition of the
live load causes the upstream block to deflect into contact
with the downstream block. This "crack closing" condition
makes the structure non-linear and requires a majcr modi-
fication of the analysis procedure in order to account for it.
Thus, an additional result of this supplementary study was the
demonstration of a procedure for the analysis of non-linear
problems by the finite element method.
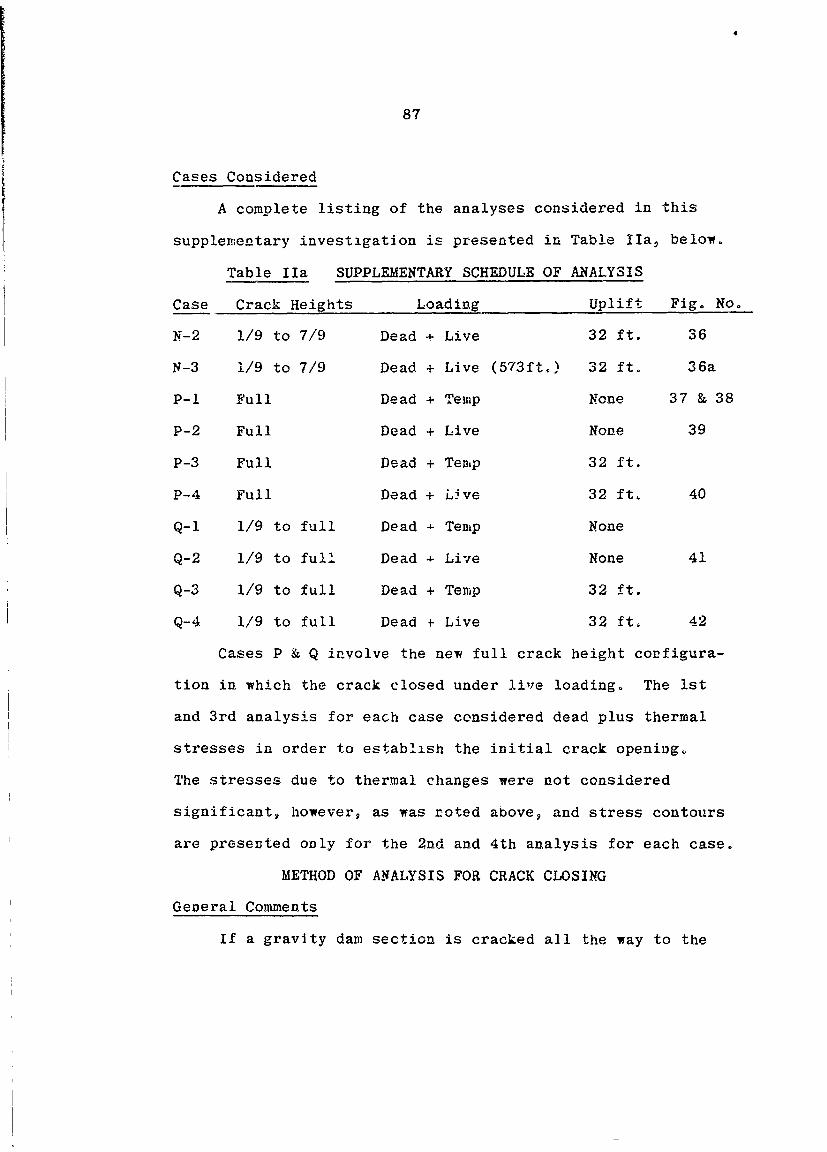
87
Cases Considered
A complete listing of the analyses considered in this
supplementary investigation is presented in Table IIa below.
Table IIa SUPPLEMENTARY SCHEDULE OF ANALYSIS
Case Crack Heights Loading Uplift Fig. No.
N-2 1/9 to 7/9 Dead + Live 32 ft. 36
N-3 1/9 to 7/9 Dead + Live (573ft.) 32 ft. 36a
P-I Full Dead + Temp None 37 & 38
P-2 Full Dead + Live None 39
P-3 Full Dead + Temp 32 ft.
P-4 Full Dead + Live 32 ft. 40
Q-1 1/9 to full Dead - Temp None
Q-2 1/9 to full Dead * Live None 41
Q-3 1/9 to full Dead + Temp 32 ft.
Q-4 1/9 to full Dead f Live 32 ft, 42
Cases P & Q involve the new full crack height configura-
tion in which the crack closed under live loading. The 1st
and 3rd analysis for each case considered dead plus thermal
stresses in order to establish the initial crack opening
The stresses due to thermal changes were not considered
significant, however, as was noted above9 and stress contours
are presented only for the 2nd and 4th analysis for each case.
METHOD OF ANALYSIS FOR CRACK CLOSING
General Comments
If a gravity dam section is cracked all the way to the
88
surface, the crack will open over its entire length under the
action of gravity leads and thermal changes. As the reservoir
is filled, however, the increasing hydrostatic pressures will
gradually force the crack closed at the top; and as more water
is added the crack will close further and further down, As
the crack closes and contact is made between the two sides,
the behaviour of the dam changes. Opposite sides of the
crack are no longer free to move independently; in fact, because
of the roughness of the crack surface, it may be assumed that
the two sides lock together upon contact and subsequently
displace as a continuous medium.
This changing character of the structure with crack
closing makes it infinitely non-linear in reality. However,
in the finite element idealization only a finite number of
nodal points can come into contact along the crack surface.
Thus an incremental approach to the non-linear problem
becomes feasible. The reservoir is filled by increments and
each time a nodal poiDt closes, they are locked together and
the modified structure is subjected to further increments
of load. For the purpose of this analysis, a pair of nodal
points facing each cther across the crack (see Fig. 11, Final
Report) is assumed to have closed when their relative horizontal
displacement under live load just equals their Initial hori-
zontal displacement due to dead load plus thermal changes.
89
The st-resses and displaceiients developed in each element
of the dam due to each increment of loading may be super-
iyLposed to obtai the total stress in the non-linear syste.,
at any stage of loading, Thus the treatment cf the crack
closing problen. reduces to the analysis of a succession of
varyin structures due to load increments and the super-
position of the stresses rand displacemeLts) calculated for
each irncre,,eat.
Uplift press,;res, where considered in these ar.alyses, were
assumed to act cver the first 3 nodal pcints cf the base '32
feet) and were applied at the full hydrostatic pressure
appropriate to ea-h load ircrement. It should be noted that
the extent cf opening of the uplift pressure crack was not
assii.ed to increase incrementally, it was active over its
full extent throLGhout the Icading.
Because of the icremental n:ature of the loading applied
to the dam in these stuides, it vas not feasibls. to establish
,itial foundat.on displacements with a coarse meish system as
has been done previously, For this reason a larger foundaticn
zone was included -th the dam sectiov ir, order that the
fourdaticn defor',atic:s :iiight be t.ented realistical]ly
As was ncted earliei, the theia] stresses ccmputed it
establishing the initlal crack d'splacement conditicr of the
structure were not considered t,. be realistic. Thus these
stresses were stored during the -incremental live load analysis
90
and then subtracted off prior to printing the final stress dis-
tribution. This is equivalent to assuming that the thermal
stresses were eliminated by creep and plastic flow,
The Computer Program
The plane stress program used in all the previous analyses
formed the basis of the crack-closing analysis rrogramo How-
ever, it was modified by the addition of sub-routines which
accomplished the incremental loading and structural mn;difica-
tion operations described above. The basac flow sequence of
the modified analysis is as follows'
1) The dead plus thermal loading case is solved, for the
section cracked to the surface.
2) The displacements and stresses due to this loading
are stored and the loadirg is erased.
3) After checking that the water level is not at the
prescribed maximum, the loads due to a specified
increment of water level are computed.
4) The structure, in its existing crack configuration, is
analyzed for the incremental water loads.
5) The resulting horizctal crack displacemer.ts are checked
against the previously existing crack cpenings to
see if closure develops at any nodal point,
6a) If no closure occurs, the stresses and displacements
are superposed on the previously existing results, the
loads are erased, and the procedure is repeated from
91
Step 3.
6b) If exact closure occurs at any nodal point, the struct-
ure is modified by altering element connections so
that the structural form is that of a section with
the crack height lowered. Then stresses and displace-
ments are superposed into storage, the loads are
erased, and the procedure is repeated from Step 3.
6c) If overclosing occurs at any nodal point, the loads
are scaled so as to cause exact closing* and the
structure is modified as above. The remaining pro-
portion of the loads is saved for superposing with the
new load increment. The scaled stresses and displace-
ments are superposed into storage, and the procedure
is repeated from Step 3.
7) When the maximum water level is reached, the prevailing
stresses and displacements in storage are printed.
8) Finally the stresses due to thermal changes are sub-
tracted and the residual stresses (due to dead plus
live load) are printed.
Because essentially the same basic program was used for
each increment of loading, the analysis of a single case
*It will be noted that this scaling of loads is not exactly
equivalent to taking a smaller water level increment. However,
for small increments of water level, the difference is negligible.
92
involving crack closing was equivalent to approximately 10
analyses of the previous type. However, the high speed IBM
7090 digital computer became available for these analyses,
and in addition certain modifications were made in the basic
plane stress program which permitted faster operation. As a
result, a complete crack closing case - involving approximately
1200 cycles of iterations in all - could be solved in about 12
minutes.
RESULTS AND DISCUSSION
Cases N-2 and N-3
As was noted earlier these cases are intermediate between
Cases L-1 and N of the original investigation report, in that
the crack extends from 1/9 height to 7/9 height rather than
from the base and from 2/9 height respectively in the previous
studies. The stress contours for Case N-2, presented in Fig. 36,
show that the maximum stresses fall between the values given
for the previous studies in Fig. 24 and 27 respectively. Thus
the compressive stresses at the upstream side of the base of
the crack are reduced from L-1 but are greater than N, while
similar effects are observed with respect to the tensile
stresses near the top of the crack.
The stress contours for Case N-3 (shown in Fig. 36a) are
so similar to Fig. 36 that differences can be noted only by
careful scrutiny. The loading for this case is reduced by about
10 per cent from Case N-2, and the apparent changes in stress
93
are of this order of magnitude.
Crack Closing Cases (P and Q)
Because the stress distribution of the systems subjected
to crack closing depends so directly upon the extent of crack
closing, 4 t is advantageous to consider just the crack dis-
placement history during the incremental loading. These results
are presented in Fig. 37 for Case P (cracked to the base) and
in Fig. 38 for Case Q (cracked to 1/9 above the base).
Case P-2, in which no uplift is considered, shows a
regular relative displacement effect of the two sides of the
crack as the load is increased, with a final condition in which
the crack is closed from the top to 7/9 height. Thus its
final configuration is quite similar to Case J (Fig. 22).
Case P-4, which includes the uplift crack is considerably
more flexible (due to the redirection of base constraint). In
fact, in the initial dead load plus thermal change condition,
the analysis indicates that the uplift crack would develop
negative displacements, which accounts for the wide opening of
the vertical crack for this condition. This is an impossible
situation, of course, but as live load is added the upstream
block tilts rapidly and long before the top of the vertical
crack closes, the uplift crack has opened. Thus the analysis
is correct for an initial condition consisting of dead plus
thermal plus partial water loading, and is valid for all sub-
sequent stages of loading. The greater flexibility of the P-4
94
case (as compared with P-2) is indicated by tne fact that closure
developed from the top to 5/9 height of the crack.
The principal difference in crack displacements shown for
Case Q in Fig. 38 is due to the increased stiffness caused by the
base of the crack starting at 1/9 height. This additional
connection at the base of the crack inhibits its initial opening
under dead plus thermal loading. Subsequent live loading then
is able to cause greater closure than developed in Case P-2, i.e.
from the top to 6/9 height. The uplift crack produced approxi-
mately the same result in Case Q-4 as in Case P-4, including
both the overclosing effect of the uplift crack before live
loading (to a reduced degree) and the closing of the vertical
crack from the top to 5/9 height under full live load.
The stress contours for Cases P-2, P-4, Q-2,and Q-4 are
shown in Figs. 39, 40, 41 and 42 respectively. Comparison of
the results for Case P-2 with Case J (Fig. 22) is of consider-
able interest in that the final crack configuration is the same
in both cases but vertical adjustment took place in Case P-2
before the crack closed at the top. Consequently the shearing
forces transmitted across the crack from 7/9 height to the top
are much less in this case than for the corresponding zone in
Case J. As a result, the live load is carried more by the
upstream block in Case P-2 ith corresponding increases in
the stress concentrations at the base of the block (exceeding
95
600 psi compression and 300 psi tension).
Addition of the uplift pressures in Case P-4 eliminates
the tensile stress concentrations at the heel of the section,
of course, and permits a greater part of the live load to
be transferred to the downstream block. The compressive
stress concentration at the base is seen to be reduced from
Case P-2 (to less than 600 psi).
Similar results are evident in Cases Q-2 and Q-4, except
that having the crack closed to the first nodal point causes
a much more favorable distribution of load between the two
segments of the structure. In Case Q-2, the maximum tensile
and compressive stresses at the critical horizontal section
are only about 150 and 450 psi respectively. Addition of the
uplift forces in Case Q-4 again reduces the maximum compressive
stress at the critical section to only about 350 psi.
One of the basic assumptions made in the "crack closing"
analyses was that the two sides of the crack locked together
upon contact, and that no relative sliding of the two surfaces
was permitted. This assumption is valid, of course, only if
the coefficient of friction between the surfaces is sufficient
to prevent slip. In order to assess these frictional force
requirements the shear and normal stresses developed along
the part of the crack which had closed were evaluated for Cases
P-4 and Q-4. The results, shown in Fig. 43, demonstrate that
the normal and shear stresses average about 50 psi in Case P-4
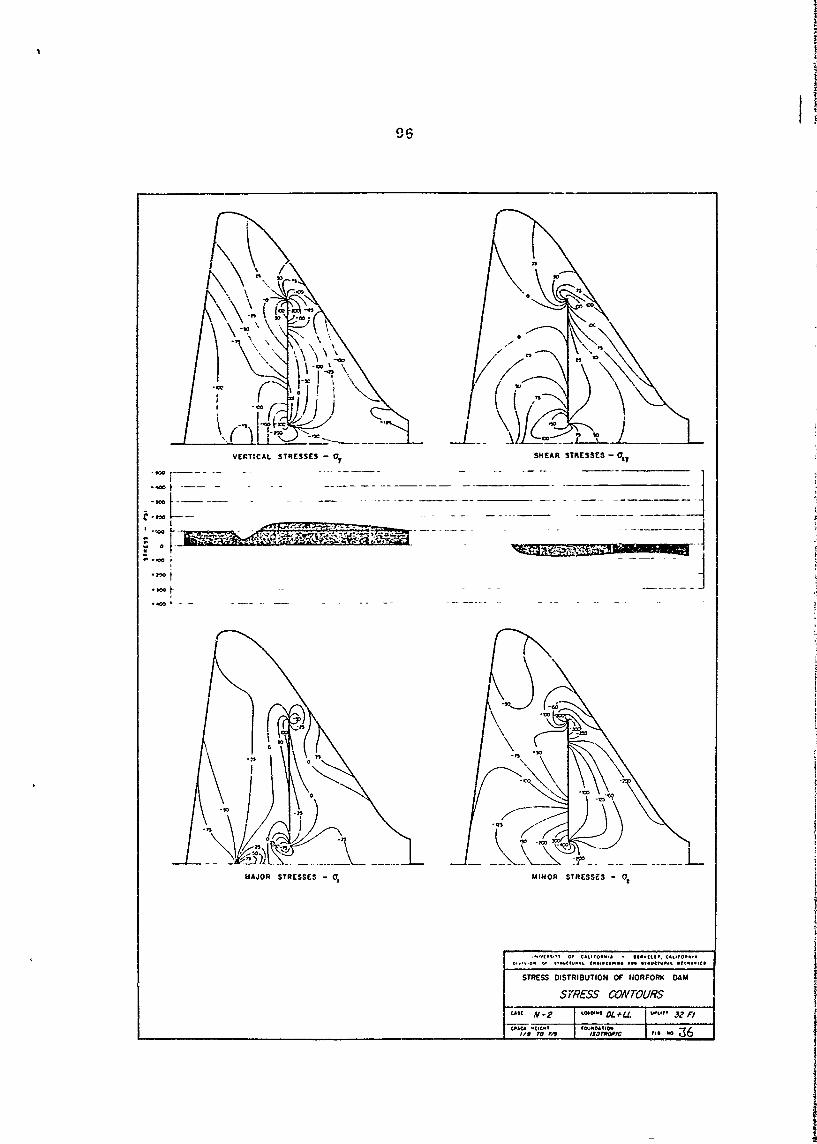
96
\\
VERTICAL STRESSES - 0,r SHIEAR STRESSESt - 0,y
z L _~~~ ~~ . . . .. ..--_-. ... .. ..
II
C LJ~x . L- -
STREASS STRDSSEU - DAM
$SMESS ONTOURS-DL- -
°. .
-. ololt - - -- ,- _ _ _ _ __IOi_-
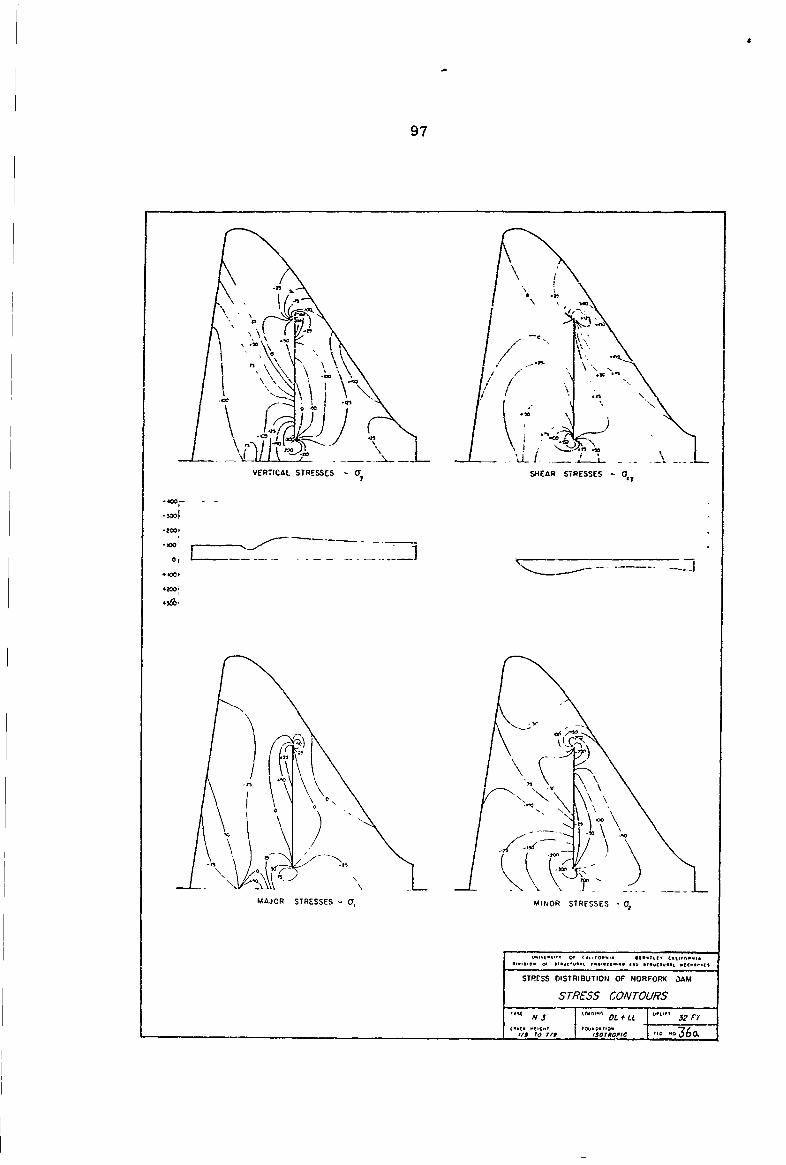
97
Q-
.2~ .ILL
MAO TESE ,K1O STRESSES a
STRESSA D-~ ITI BU~IONO NFR DAM
'sa~oic --36o
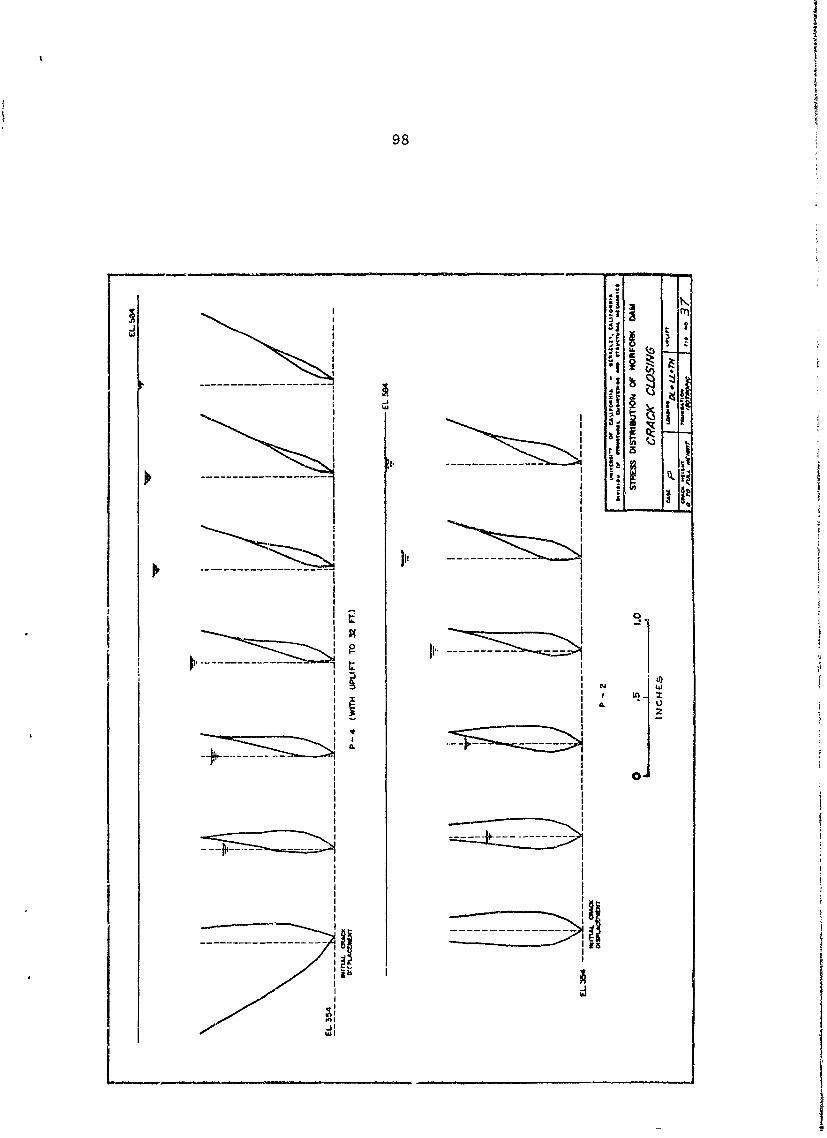
98
----------- - - -
K~48
-t. I -
I 1'
I' £
* I°--- -- --- --- ---
IL
I O"J
II ~I
-- - - -
us
IJ
I '~
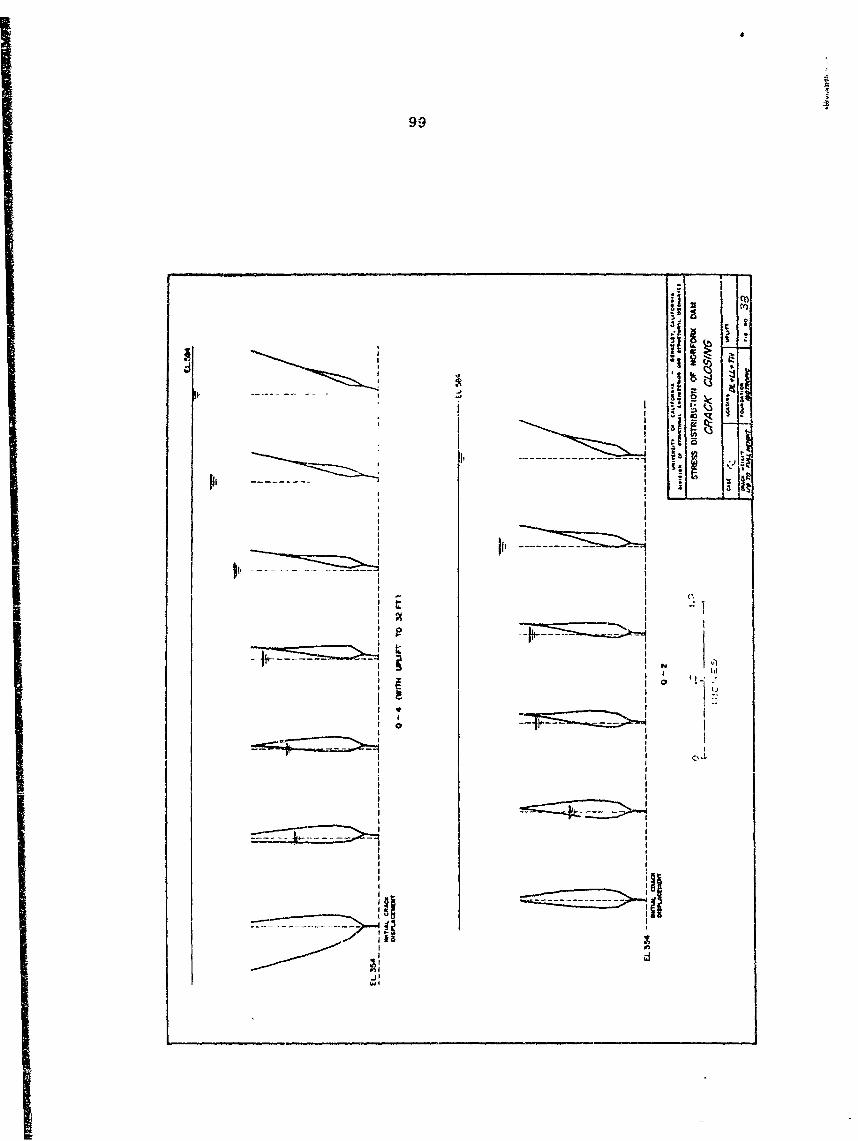
99
I -I
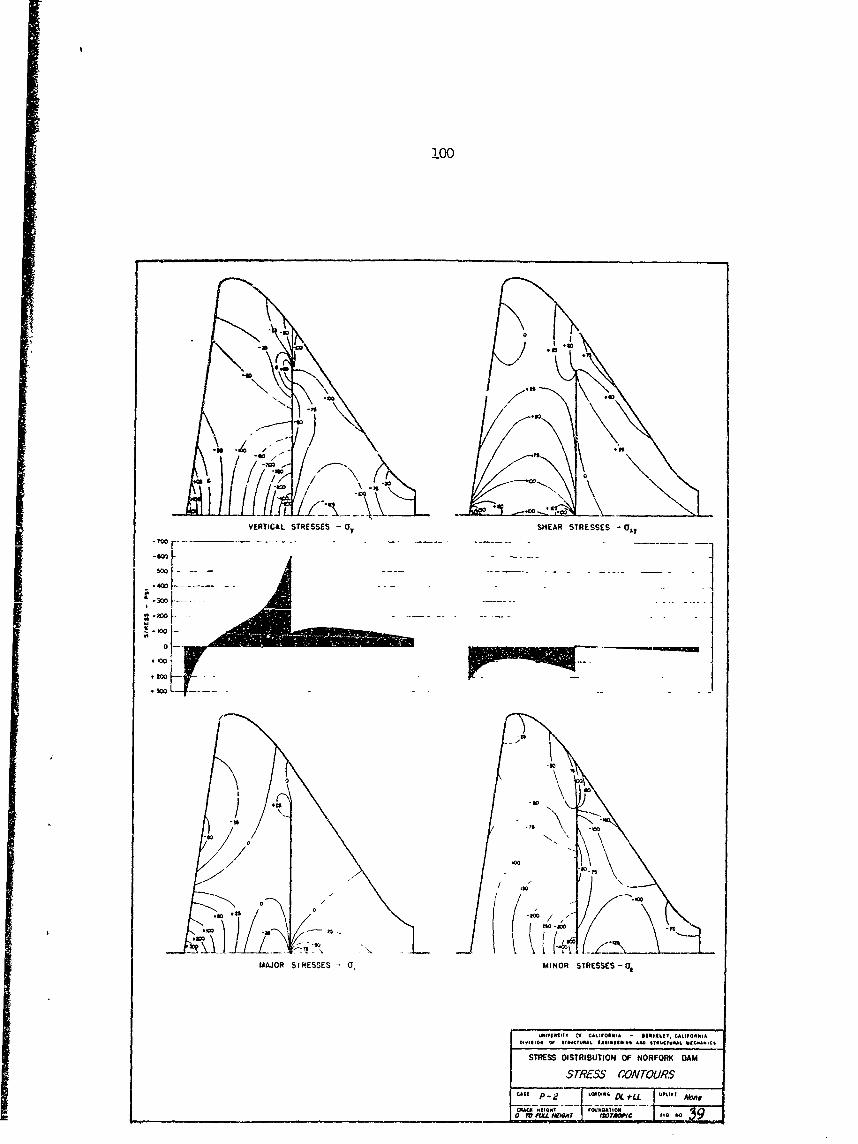
100
awa
,< \ . \
VERTICAL STRESSES OIF SHEAR STRESSES -Gy
oo
~-400
-9,
t0 -- too
oN
0 /(+MAJOR SrHESSES- 07 MINOR STRESSES -0,
~9.9l1 11Ir C l CUFOtNI& - * lLWS CAL.UOlSlAMIwllSS V V0 W ~ FAL IM40l810b A"S *tfCjASAU LIC M ICS
STRESS DISTRIBUTION OF NORFOR DAM
STRESS CONTOURS
P - 2 ACACI" * iLL. VOly Ab
01tLP ,G~Vt I Fr ' rRPC ft ... 9i i, '4m. ,
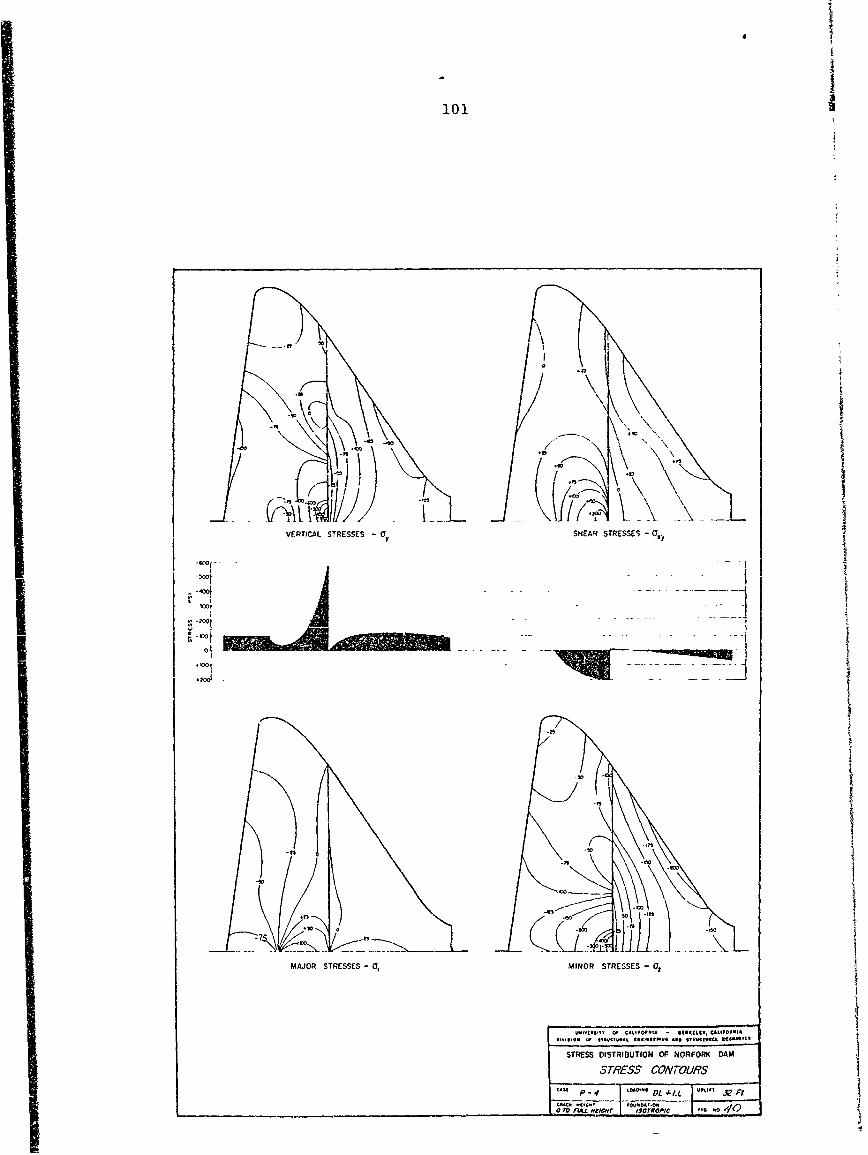
1011
100
VERTICAL STRESSES 'IV SHEAR STRESSES -(T,
-20]
Iw 1
MAJOR STRESSES CF, MINOR STRESSES -0,
CAR7 P-4 ' o 'AL fII~C.C. -I n~w~IL.0 0 ft NfI~r Iljo'/0/
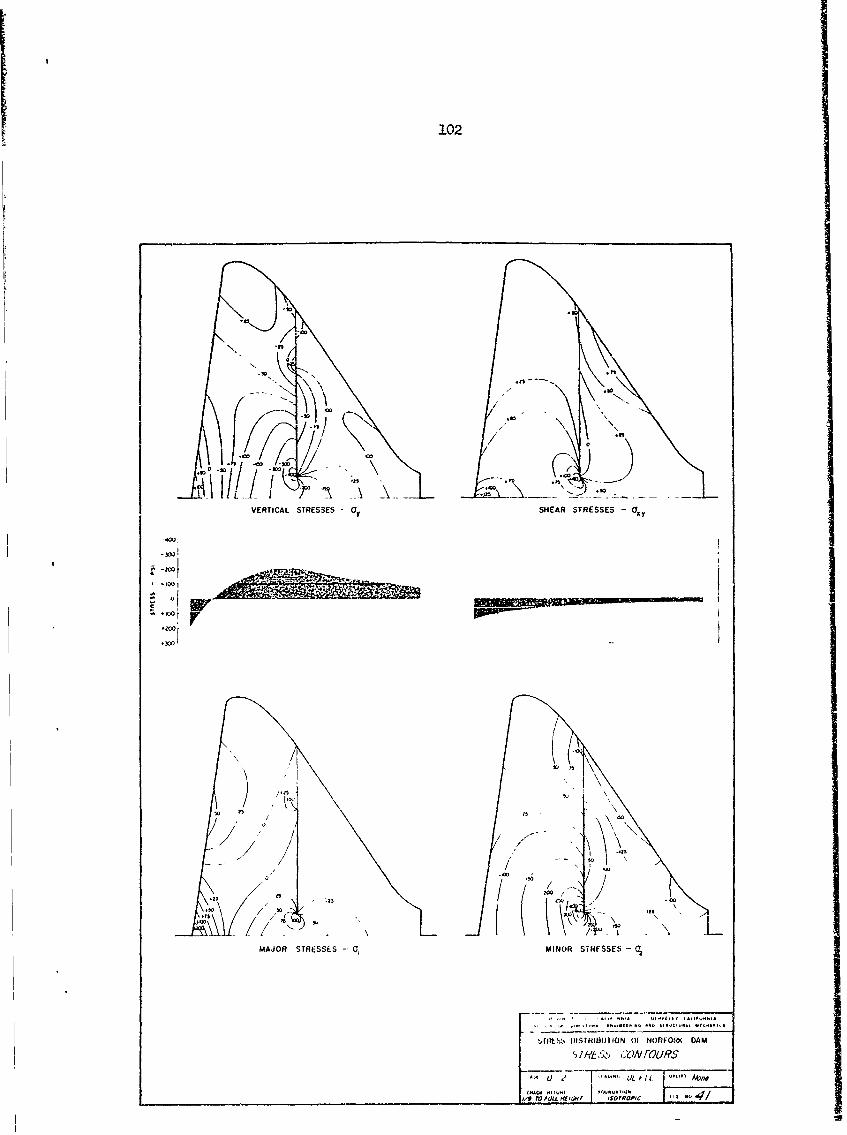
102
to
MARTIA STRESSES 0, MINSR STESSES - z
A II tx
I1/0 'o u mc w l50 '25
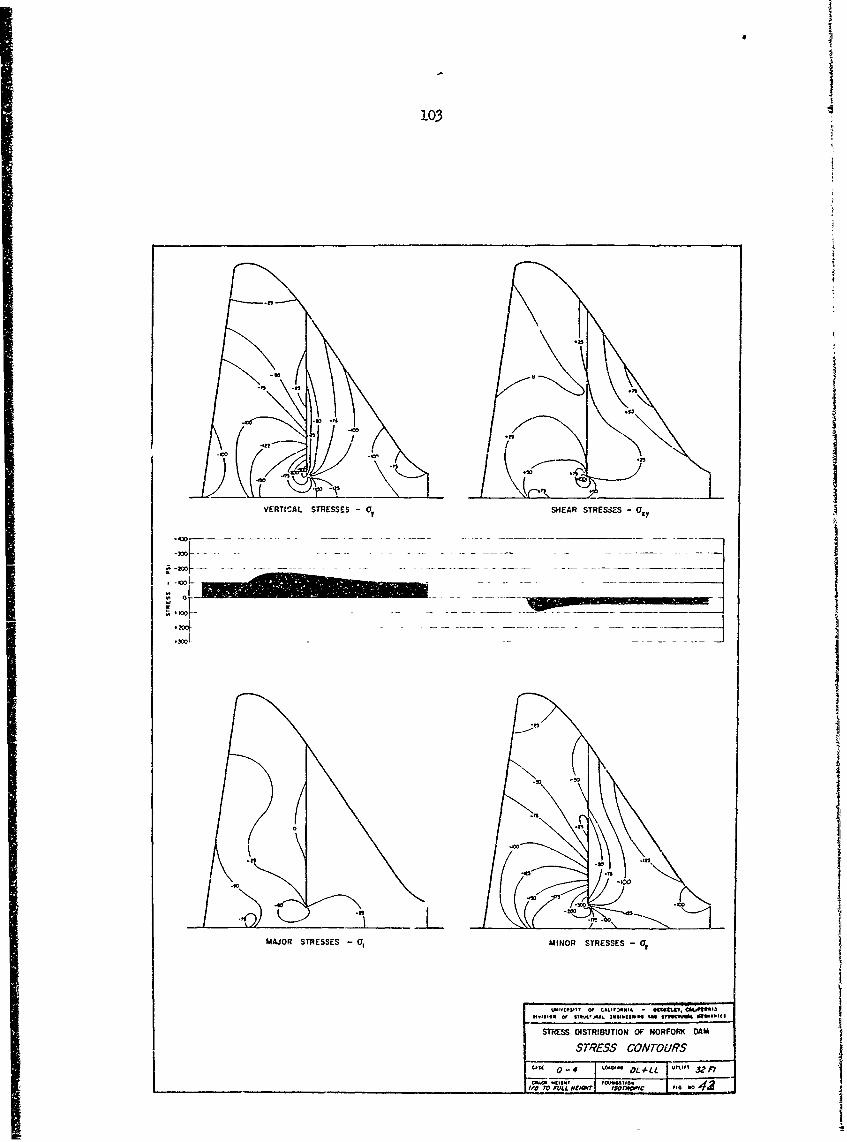
103
VERTICAL STRESSES -y SHEAR STRESSES -y
.- '7--
-00n
MAJOR STRESSES - O MINOR STRESSES - (,
M11,11 O C ,0 - s . .Cl ul l
STRESS DISTRIBUTION OF NORFORK DAIM
STESS4 CONTOURS
USA 0-4 - OL tL_ 5z F
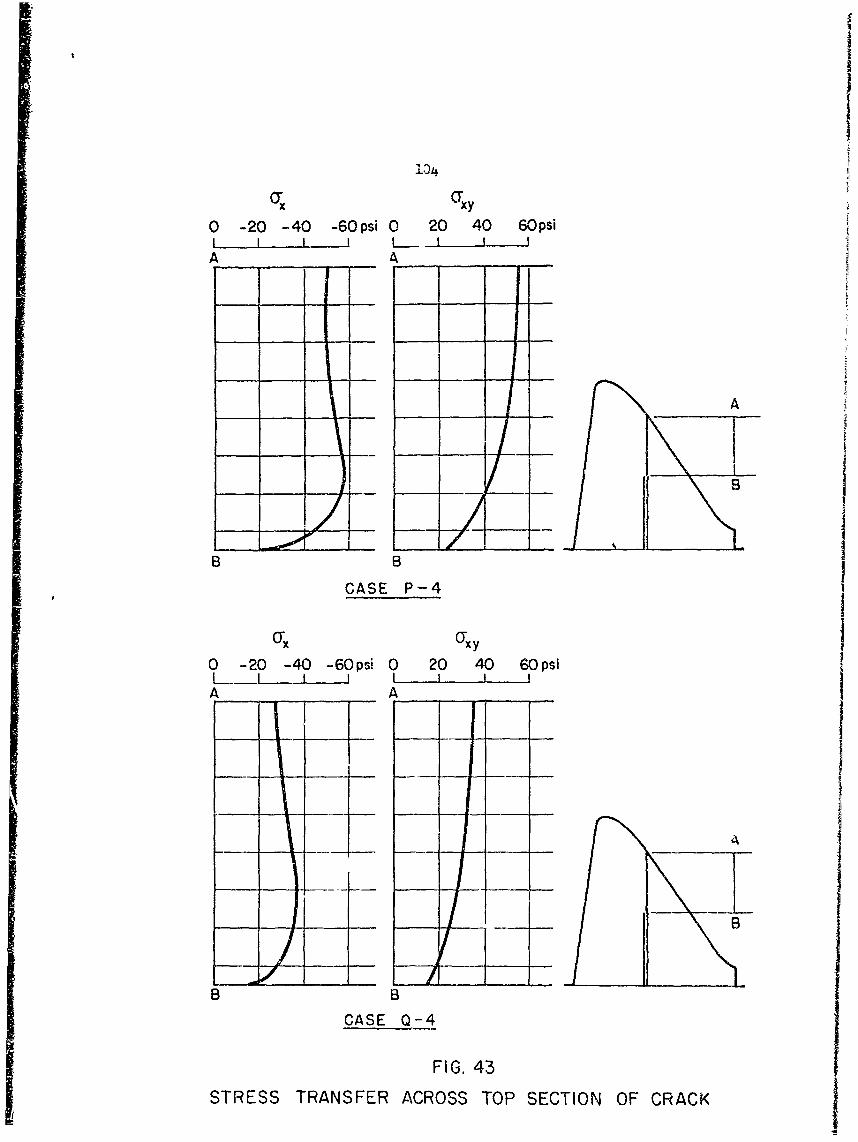
104
0 -20 -40 -60psi 0 20 40 60psiI I I ! L 1 L J
A A
A
B B
CASE P-4
icrx0 -20 -40 -60psi 0 20 40 60psiL - I 1 I I I . I I
A A
B B~CASE Q-4
FIG. 43STRESS TRANSFER ACROSS TOP SECTION OF CRACK
105
and about 30 psi in Case Q-4. In both cases the shear and
normal stresses are nearly of equal value thus the required
coefficient of friction is about 1. For the low stress values
and rough concrete surface involved here this seems quite
reasonable and the assumed behavior is believed justified.
CONCLUSIONS
The principal contribution of this supplementary investi-
gation was the development of the incremental analysis procedure
which made possible the treatment of crack closing conditions.
Although the incremental loading increases the computational
effort by a factor of about 10, with the present high speed
program and digital computer such kroblems may be handled easily.
Data preparation for an incremental analysis is not much more
complicated than for a simple plane stress analysis, and it is
expected that this new program may find application in future
investigptions on other aspects of gravity dam behavior.
The results obtained from the crack closing analysis of the
Norfork Dam do not indicate extremely severe stress values,
although the maximum stresses are increased somewhat over
corresponding cases which do not have the full crack height.
In general9 redistribution of stress which might result from
cracking or creep effects in regions of overstress has a favor-
able influence on the stress distribution. Deformation adjust-
ments tend to distribute the stress more uniformly to the
entire system, and since the structure is very massive, those

106
average stresses are quite safe. Even the addition of uplift
pressures tends to have a favorable effect on the system as
a result of eliminating the region of tensile overstress.
I
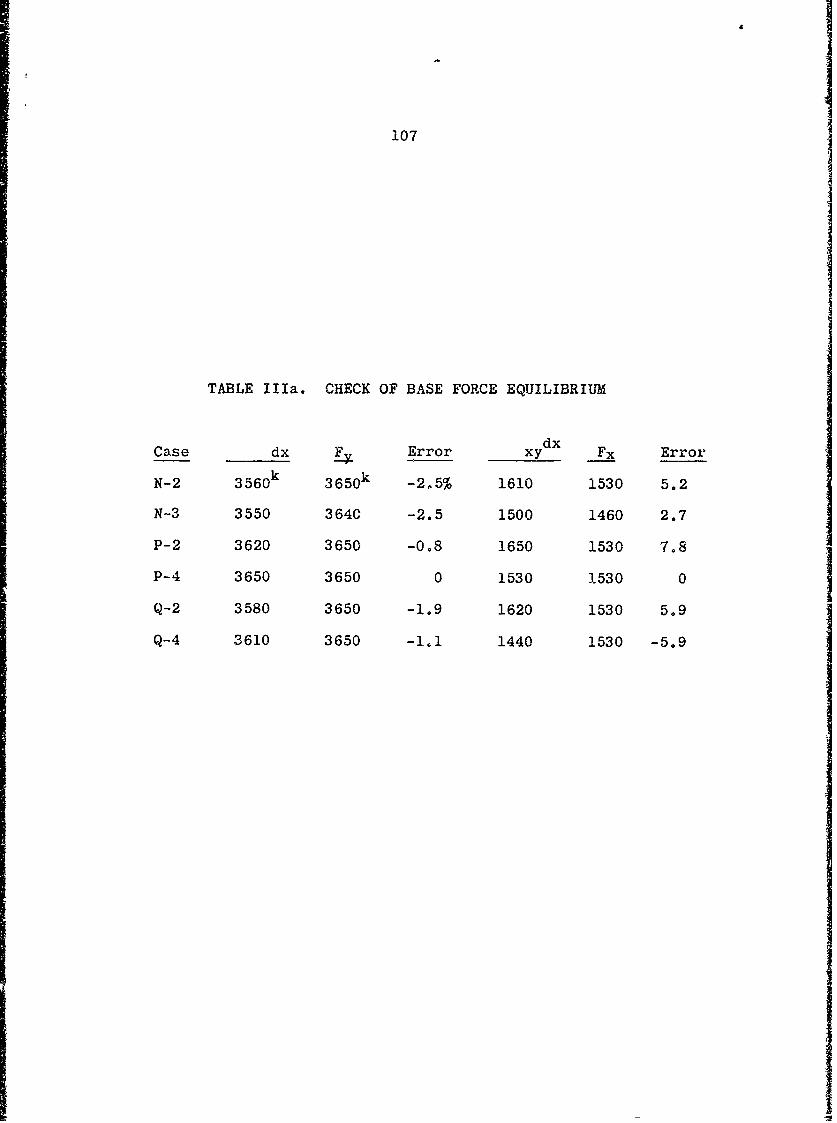
107
TABLE Ila. CHECK OF BASE FORCE EQUILIBRIUM
Case - dx F Error xy dx Fx Error
N-2 3 56 0 k 3650k -2.5% 1610 1530 5.2
N3 3550 364C -2.5 1500 1460 2.7
P-2 3620 3650 -0.8 1650 1530 7.8
P-4 3650 3650 0 1530 15300
Q-2 3580 3650 -1.9 1620 1530 5.9
Q-4 31610 3650 -1.1 1440 1530 -5.9

1081
APPENDIX ISTRESS VECTORS FOR All CASESj
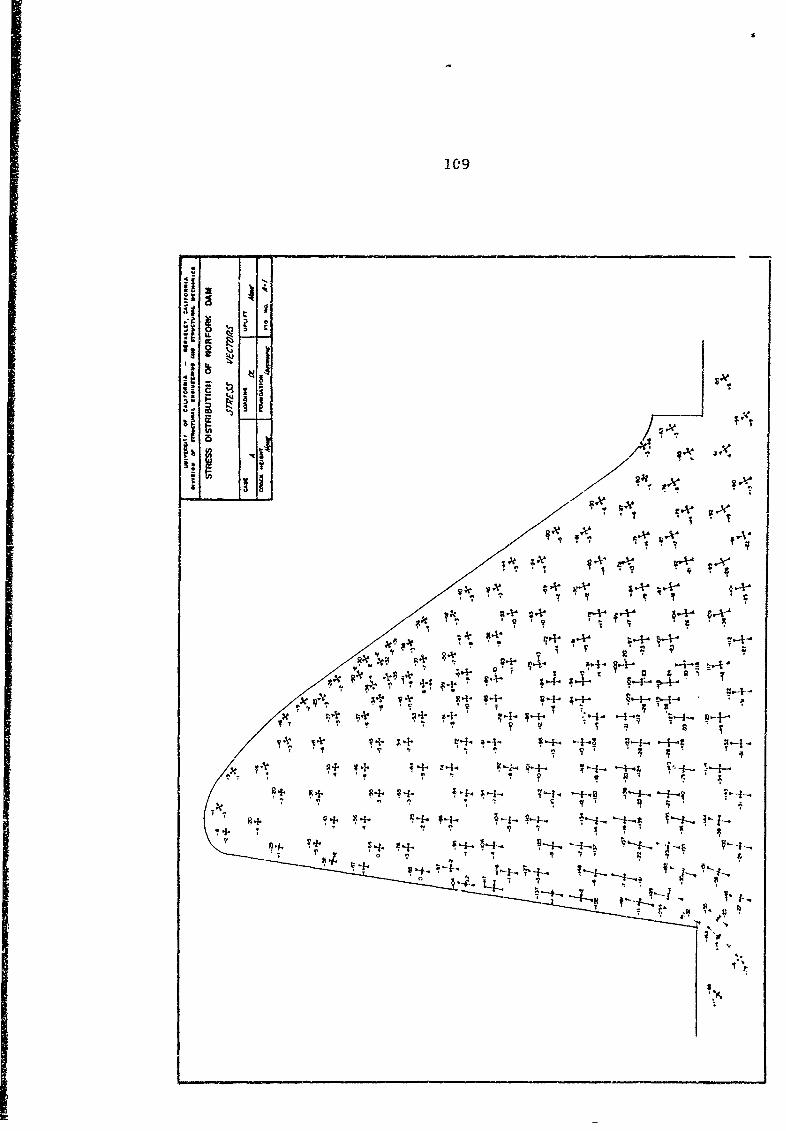
2_09
it a
I JV
"II +
A ' r T r'
, , .' */ .
r'4-
TT~
+.,
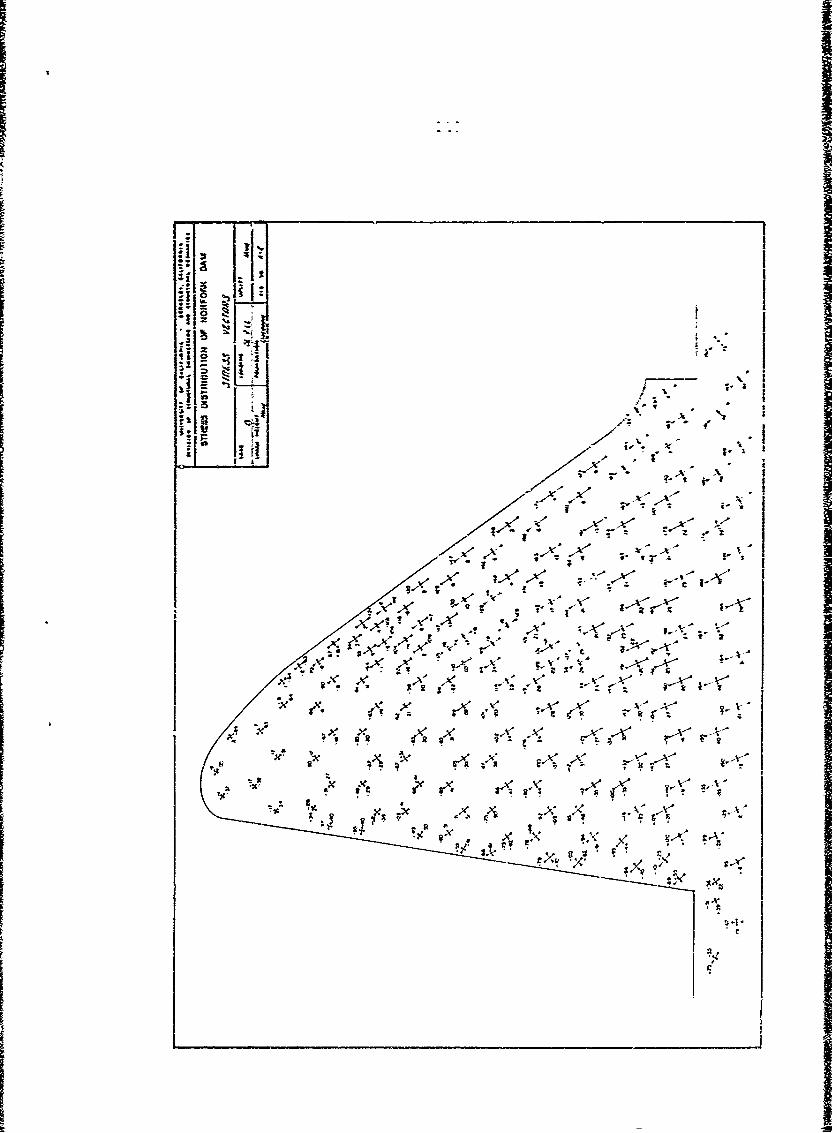
III
-.
-, ~ U?g~ ~±j
~ ~IJII ~:11 ~ :1
~ - -
-
S
A - A-~4-A ~,N
1< f U
I - - ~ t I
~" ~ ~A S I-- ~ -~~2 17. Kx x .x ,~- -
-. Z!g...,A ~
.9 X x'Y x~>A< 2 .A <
x. ~ 32 ~
2 ~X' ~'c~ -R ~X N~ 11 -~ -;
* 3 1 -~ g~ -~ ..
* *1
\' ~, ~ ~* .4
-. rXsi ~~ #1
~~~~~1
2
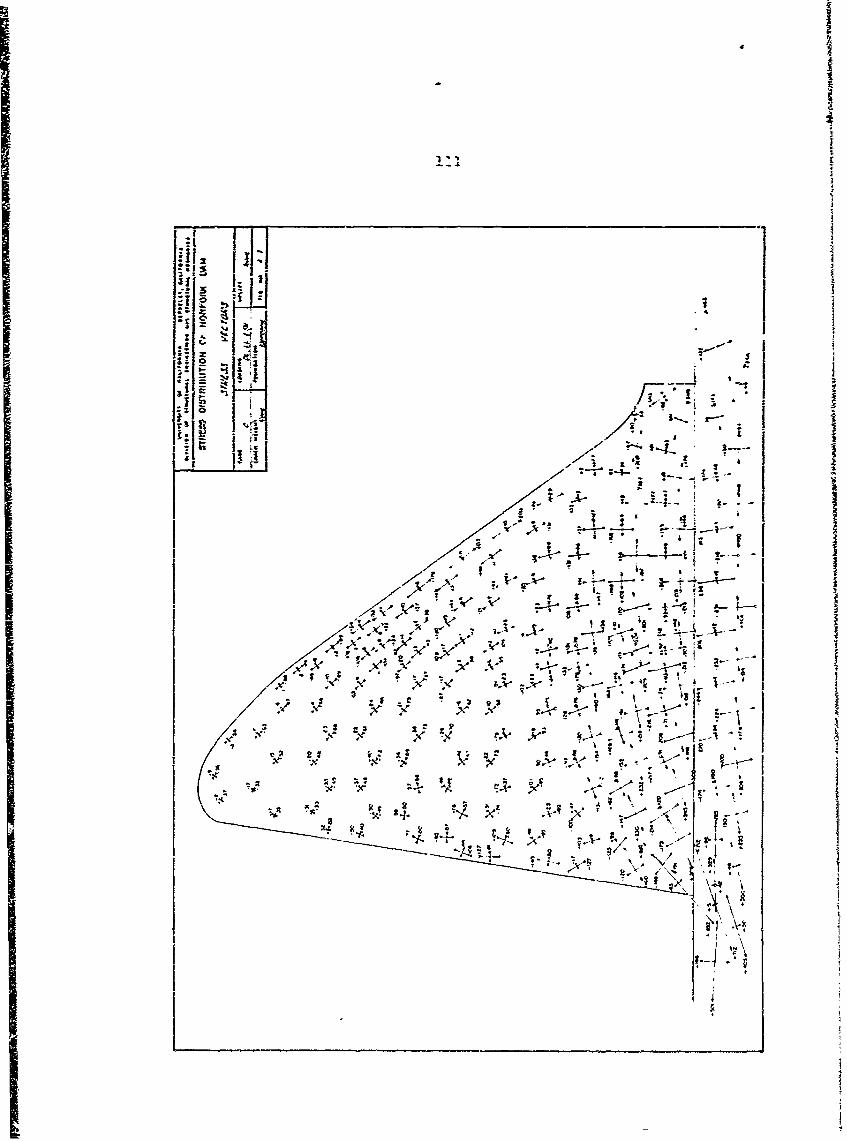
II
i:' i iI
I, J" * io **
i : t :[= ~ . i
/, - L IlI" t• i . 4 I 1* 3
--
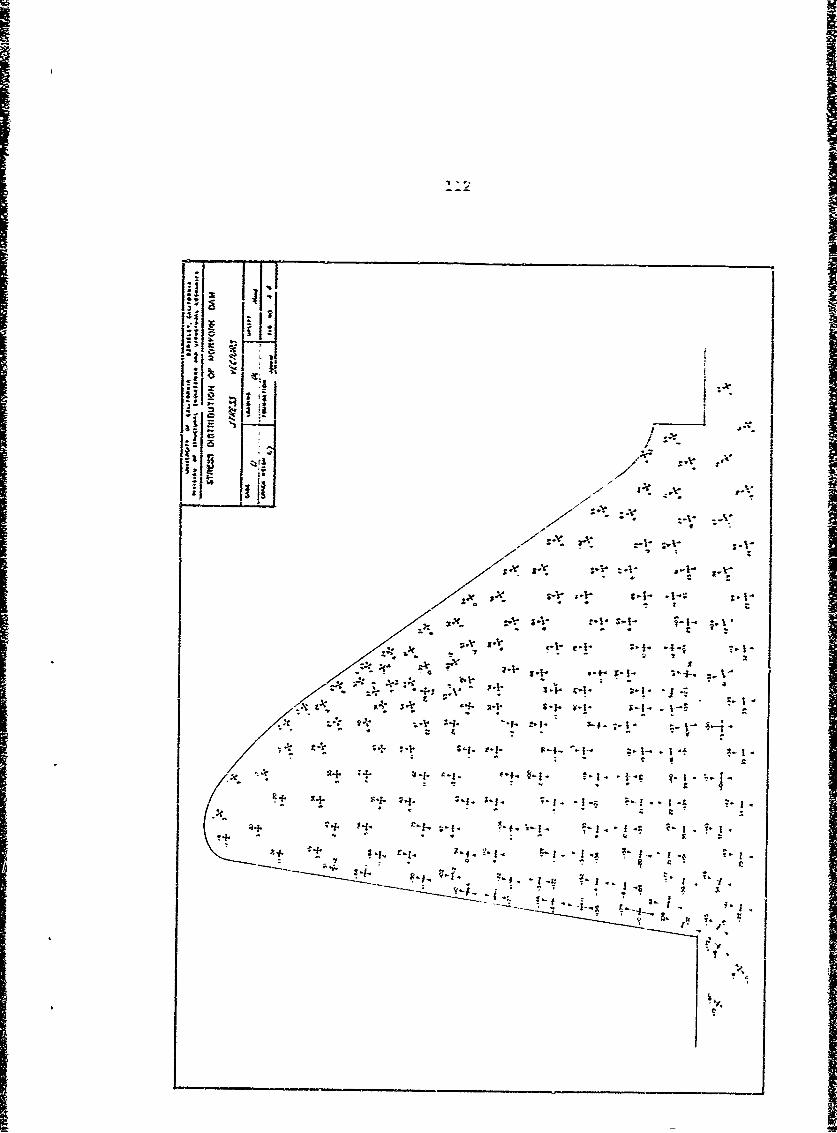
.111..12 ~I
V.. 014- IA
:A -va+1 :j
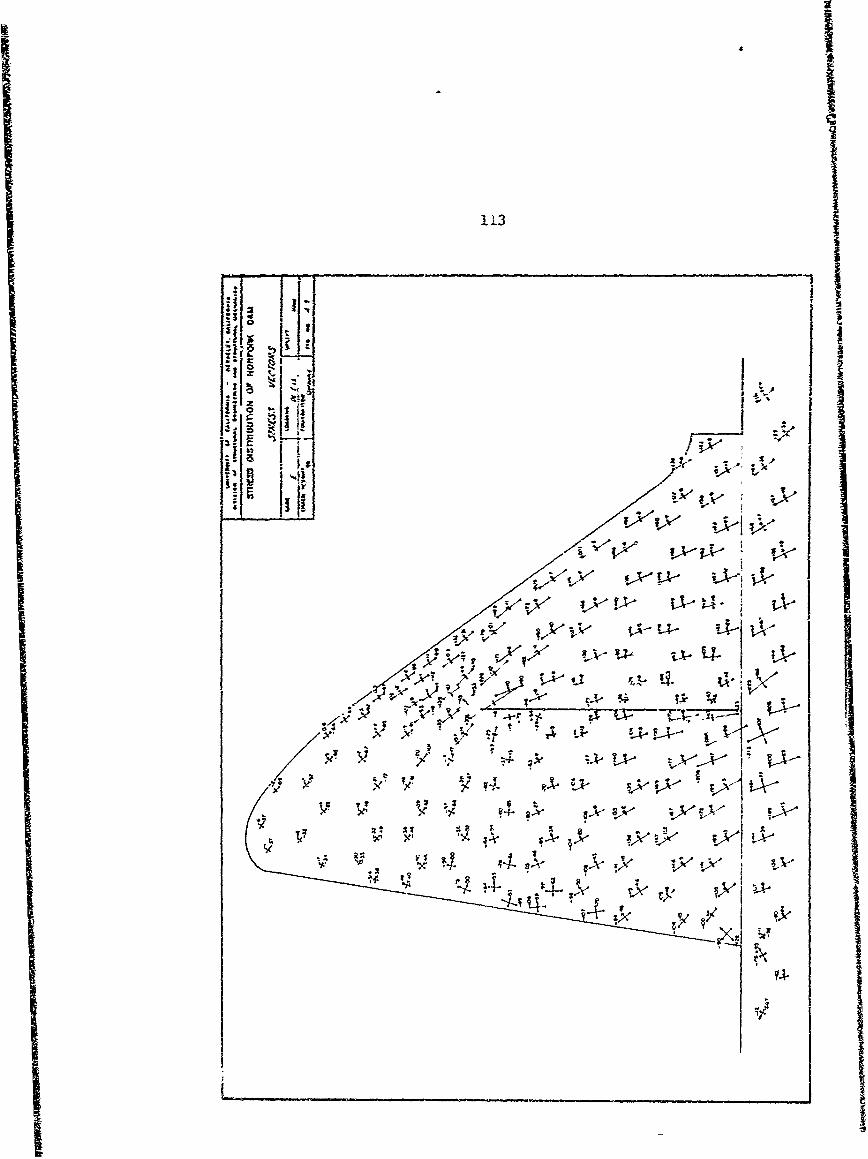
£ -3
IjI*6113
r~ Iy
' v AlIi o 'ivj
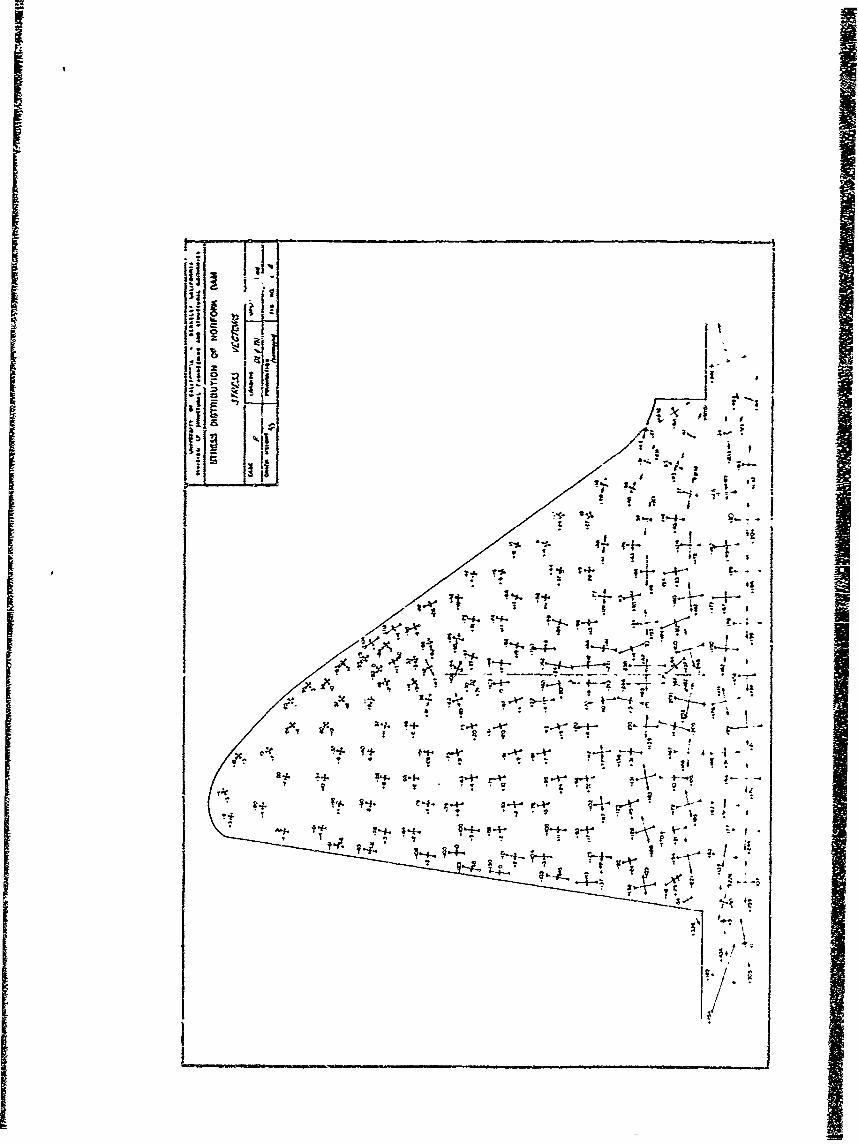
~~(I ?I''2
'3 LX.1I~
~-
b. 4 (1 - j-3
~
ii ta. V II
*~ j
I ~ ~-$' v: £
?~- 'A. I f
':4.'
9-
-3
~ -- -9- . . .
2 . -____ Al
~c *~. L. ~ -~
. S ,S * ~ 2
,* 4.
0 *
9 9 4. ~L
S4~ ~*j~ ~ 24. :'-~r-e ~ .- ~ :- -
3 ~ *'*-k-*'- ~1 *
9
* -2 I)I
~ ~-reL 4 J ~ A
~'-r ~p..9' I
17.
I ~
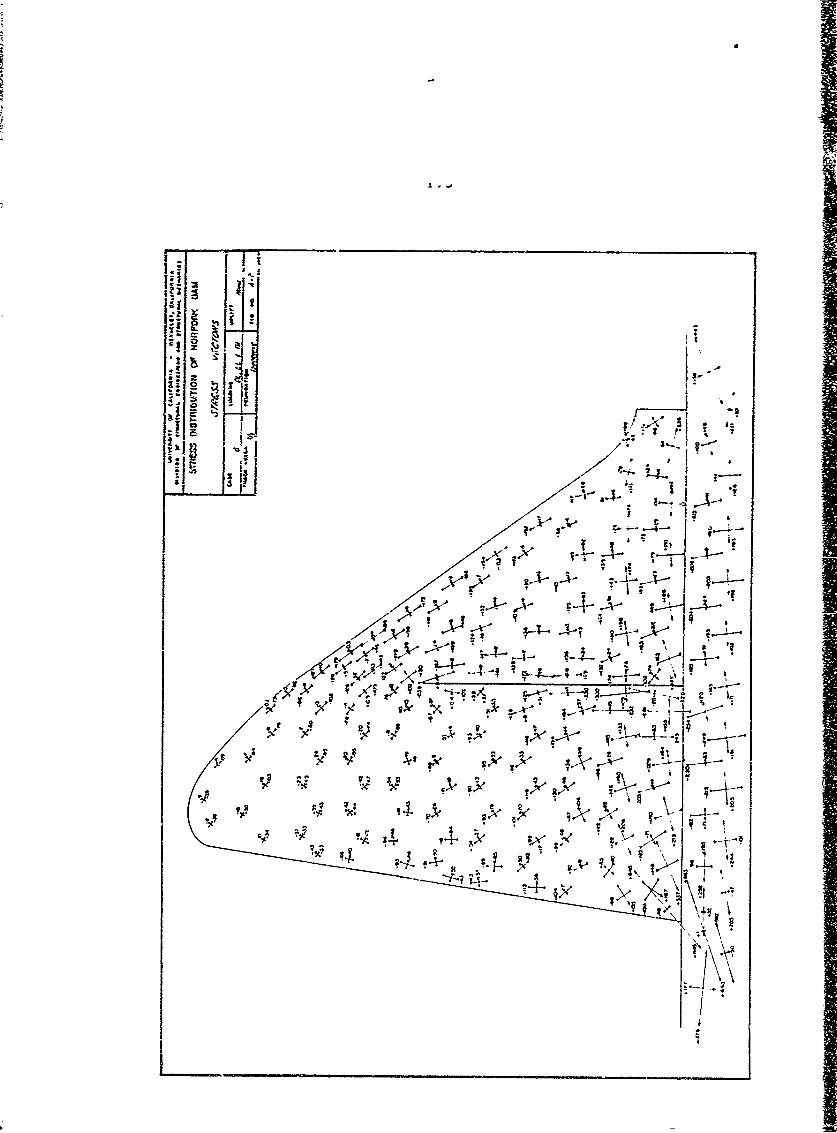
1
A- i
't e
lie
I
I .
I; ii ;
v,'s,"' ! Y "4 A - A.
: x .7 , p * ', I ,
------... 'f- :+",, , /- -. -. o', -'
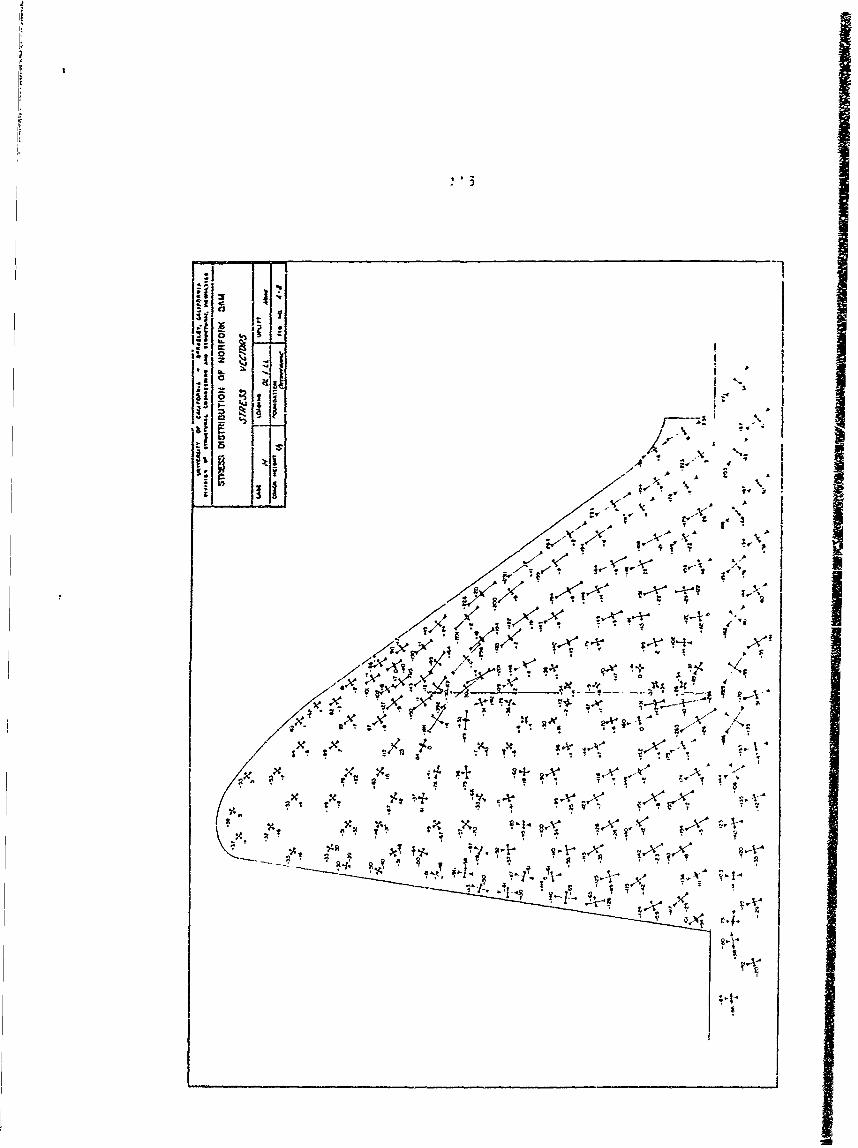
- 3
II-
I,.0
• 3.0,.-
I • )A -_ . ;
'SI
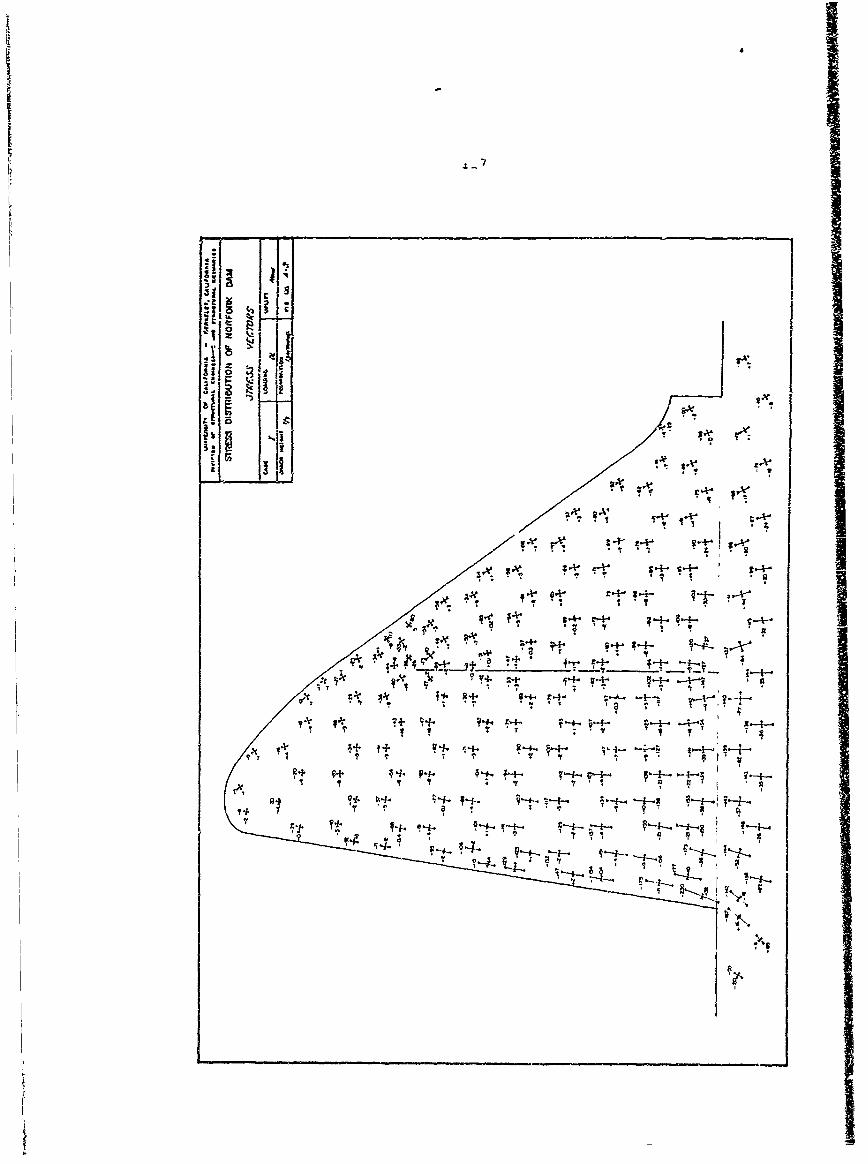
Y4
I IF 1t044
9 It~
all
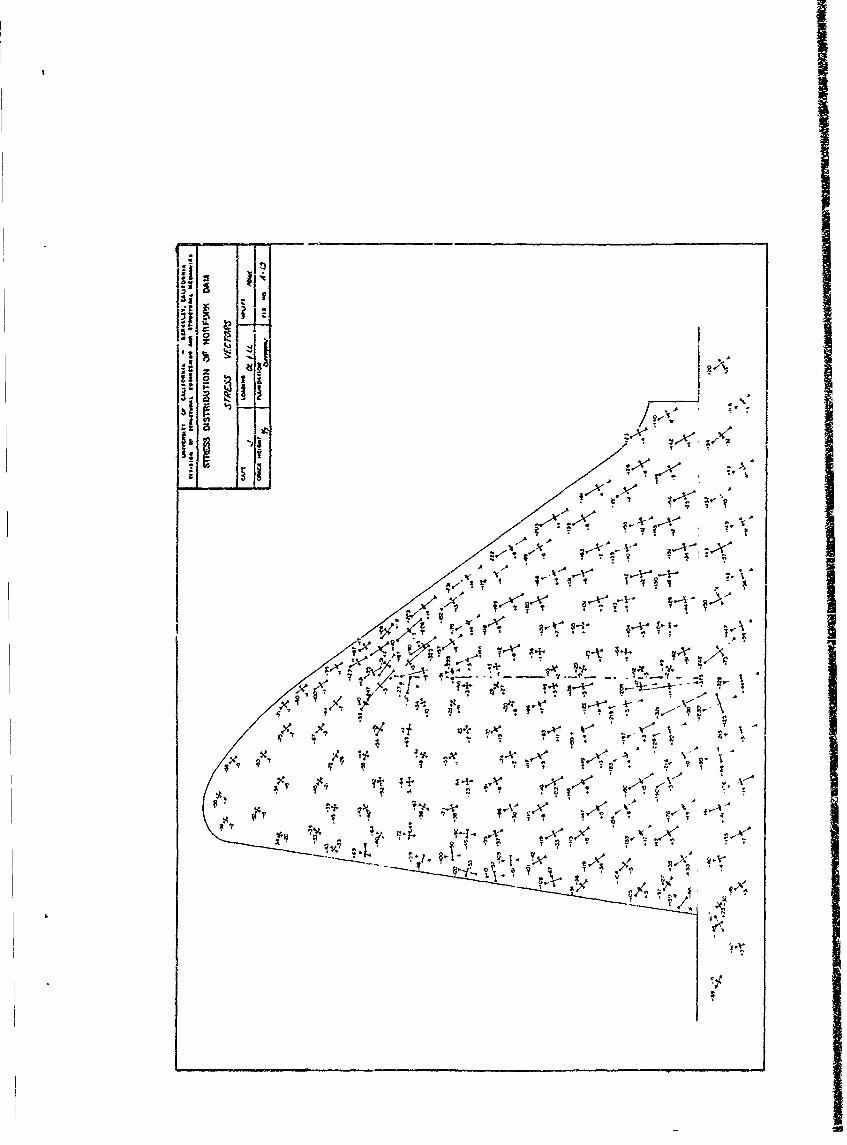
25I2ps
Si liI
IA 11
-AA
A .A
T A
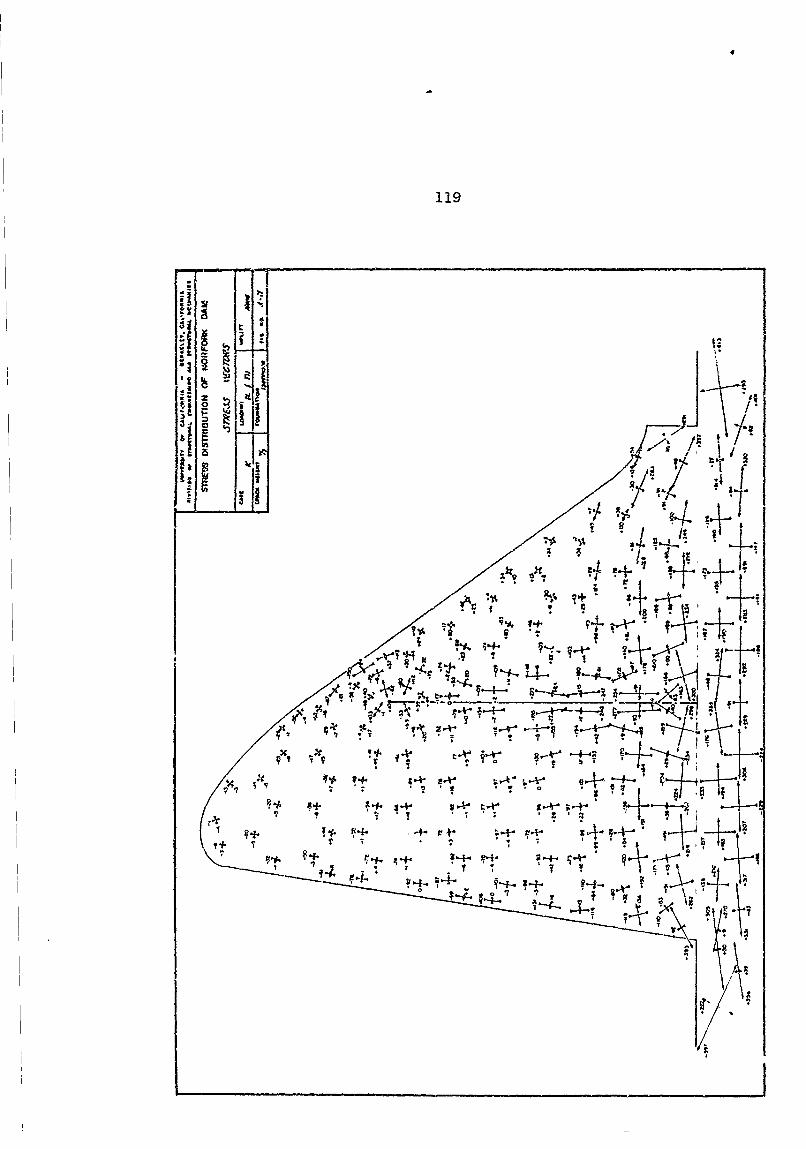
119
:1~ o0jIt
8L 7
T*l T4 -+
£~-4-0~
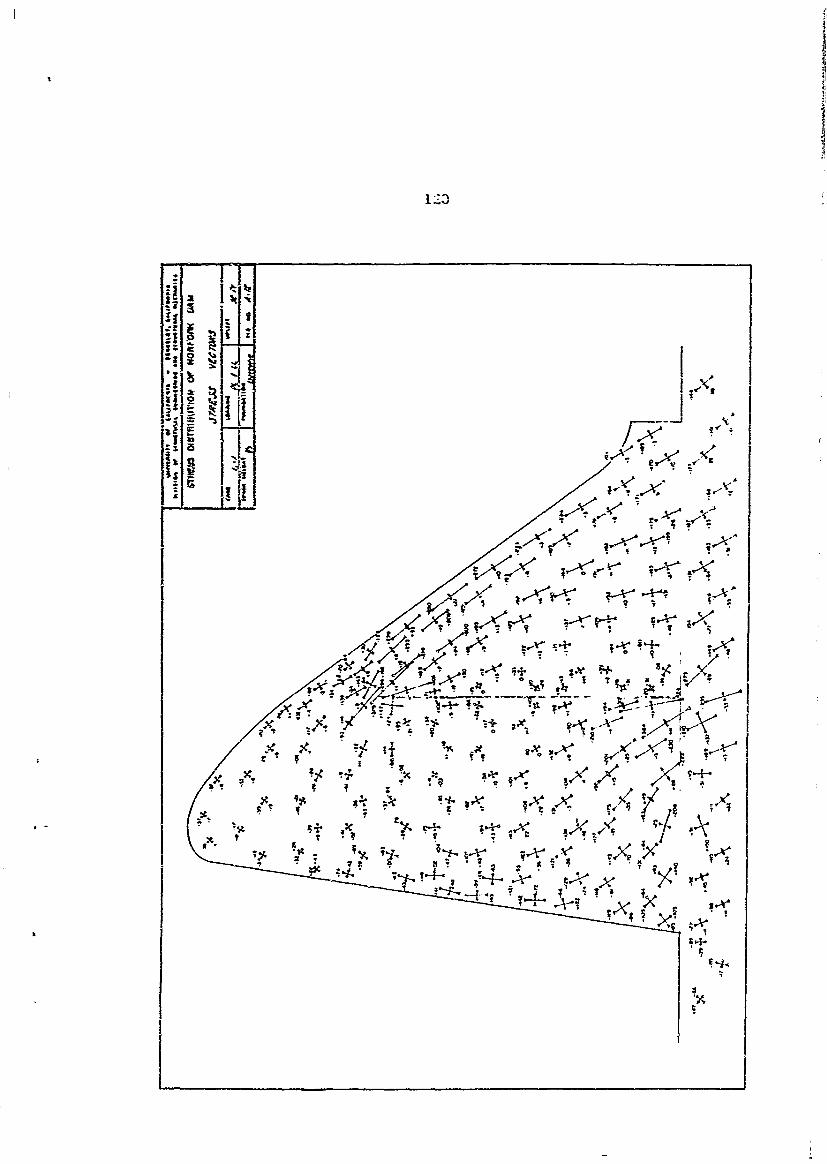
12 3
zT
v er
X, x
It it
hi
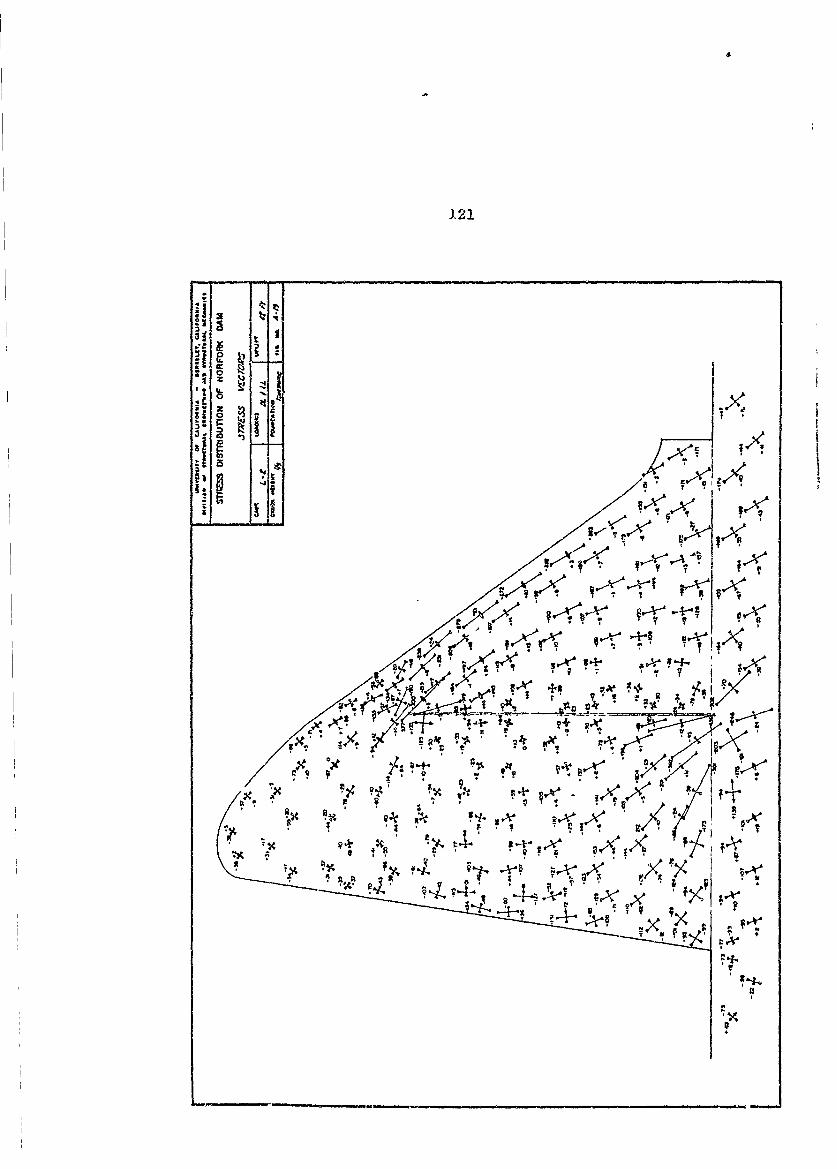
4
J.2 1
ii~. 1 ~t 1
4
~ II
~
U'-
~-~A1
* ~A ( ~- '-vi ~< ~-v~-~
v~r~x&~ ~ ~±~A +3 :A ~
- 1~
e ~t ~Z* e *o ,~
~g ~
-3
A ~ ?9i >&~E S ~
,&44-* ,~ rp.
I 9~ vx 4
4 ~ k
S
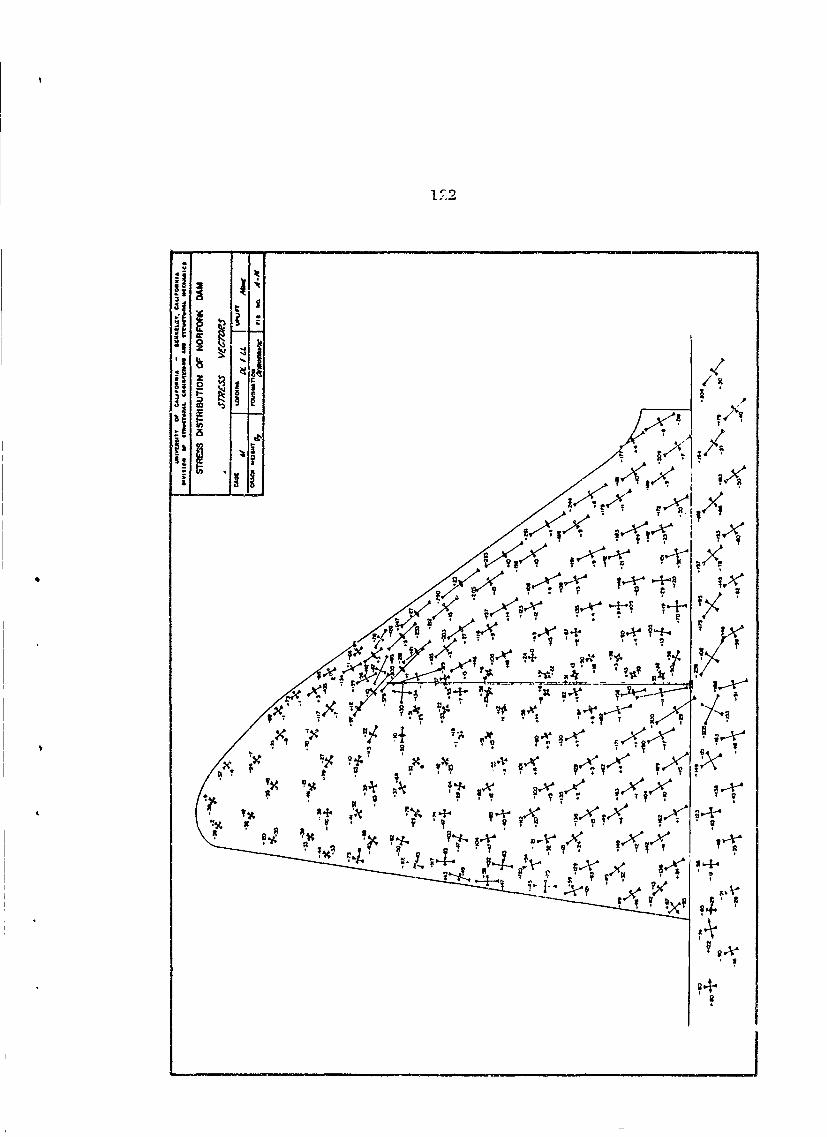
152
, N;
'-ae :t
AA
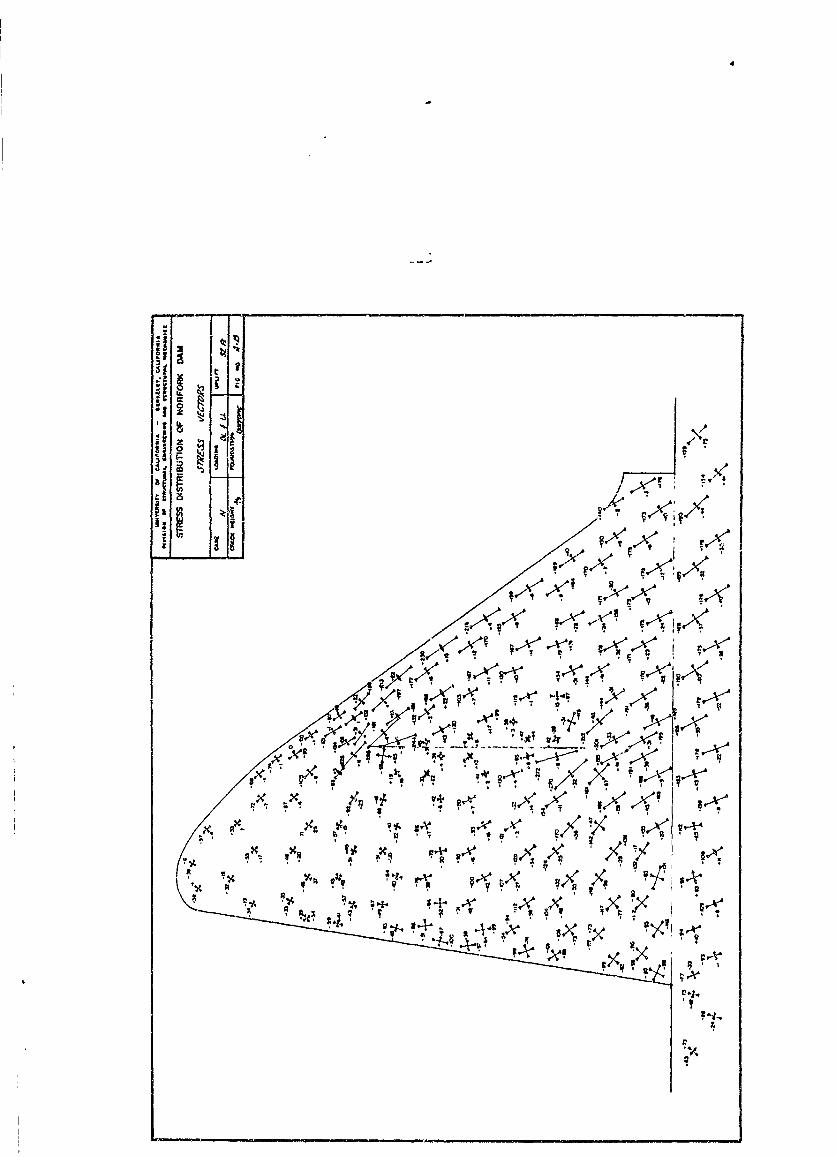
4
- S
~
'1 ~
~0 fi~~
~
AI
~A i
~~<r~A ~XX~
AAZ ~Yr2(A1 /
;~,x; e A-'U ~ ~ ~ 1'~ q- rV
U 8*
AX?; R~w 81~.uAA
V .4?..
e.)% ~ "xx~ A ~ ~-~:-
a ~ Xe-k' g
S.A
.7~ *7I~
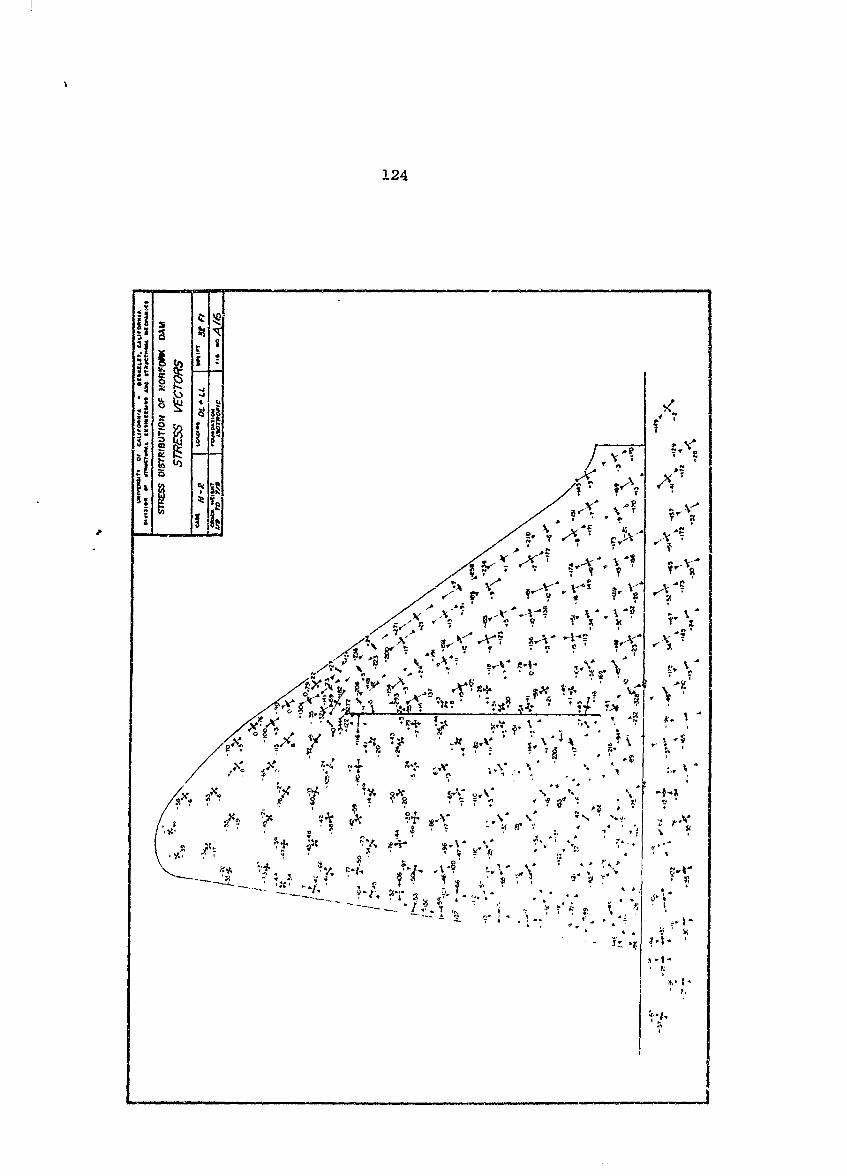
124
Alsr
I:V
*vl 'X-'' -
1to
a A
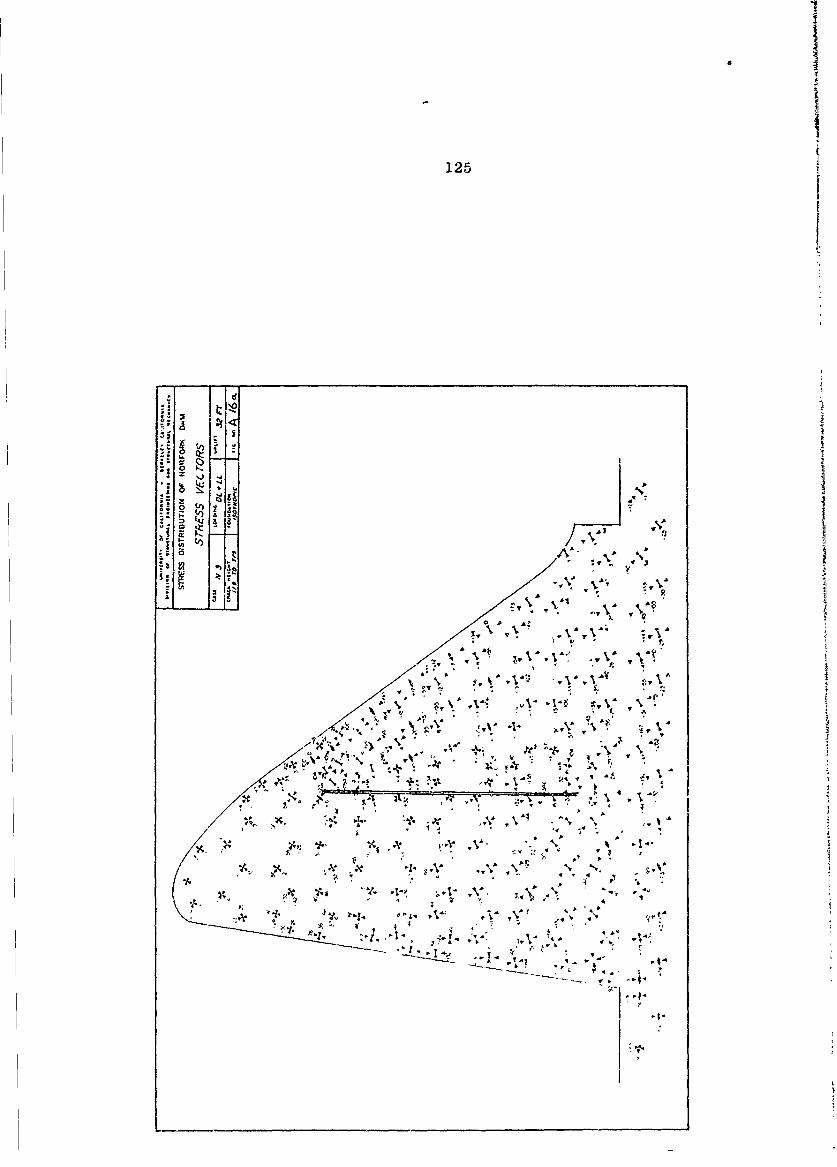
*1U
4
125
I
IA
.1 4
- 0
b
4.,-- 4
Lu Al 4'
- .- I I~,4
V)
A ~,A ~'' 4,a, I * *A '4,
A
CA ' '-.
A' S A
A
\AIV ,~,V -x VA~~;
1 :' *
4~4 - ~ *v ~~. N -~ ~f -- A- ~A A'
.,V.a .$; **
~e ~ ;4k * * PA,
, ,A
* 14 * 'I *~ -* A A4A *~ IA, 4,, -
-A'- ,,~, ~
*1. ~,\A *.A
4
4 -
~- ~ ,r a '.4
a .. 4
I, 4 .1k.t
4$.
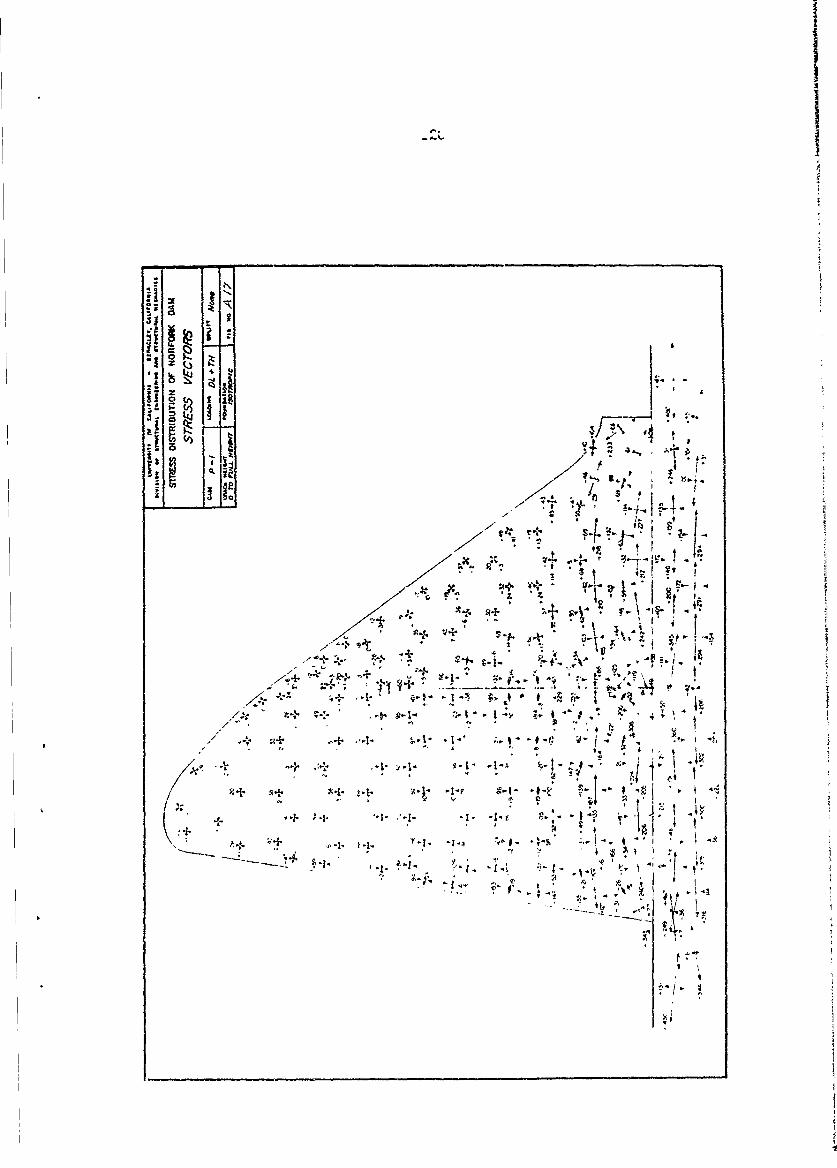
I- a
- -1 - . -
8
I ~ $
4
,.
i~
I -~
*~:~
4
I ~',~7 ~ ~ 4.~.4. ~7 t~ r~'I
~ ~IA
t
~c. ~'T 4. ~--1:-I
4. 4
I
4. A. I
4- $~..1. :~ ~\-4 4 I4 1
,'4.*..4. 1~.4. . . V ~ :
- 4-..- ~' r :-1- 2~*.* ..$V* ; ~ ~-- 4- - 44
4~4* - ., -. -~ 4- 4,
*4 t'.-!-~~,'
44, . - 4- 14
/44 44 4-
p 4 4.
-. 4- 4- p ~
- .4 . 4 -
~ ~ji~i44 -'
4 '4 4 4 9
I
- 4 44 '4
.4-
I *
----- ,~~ ;
4-'1-
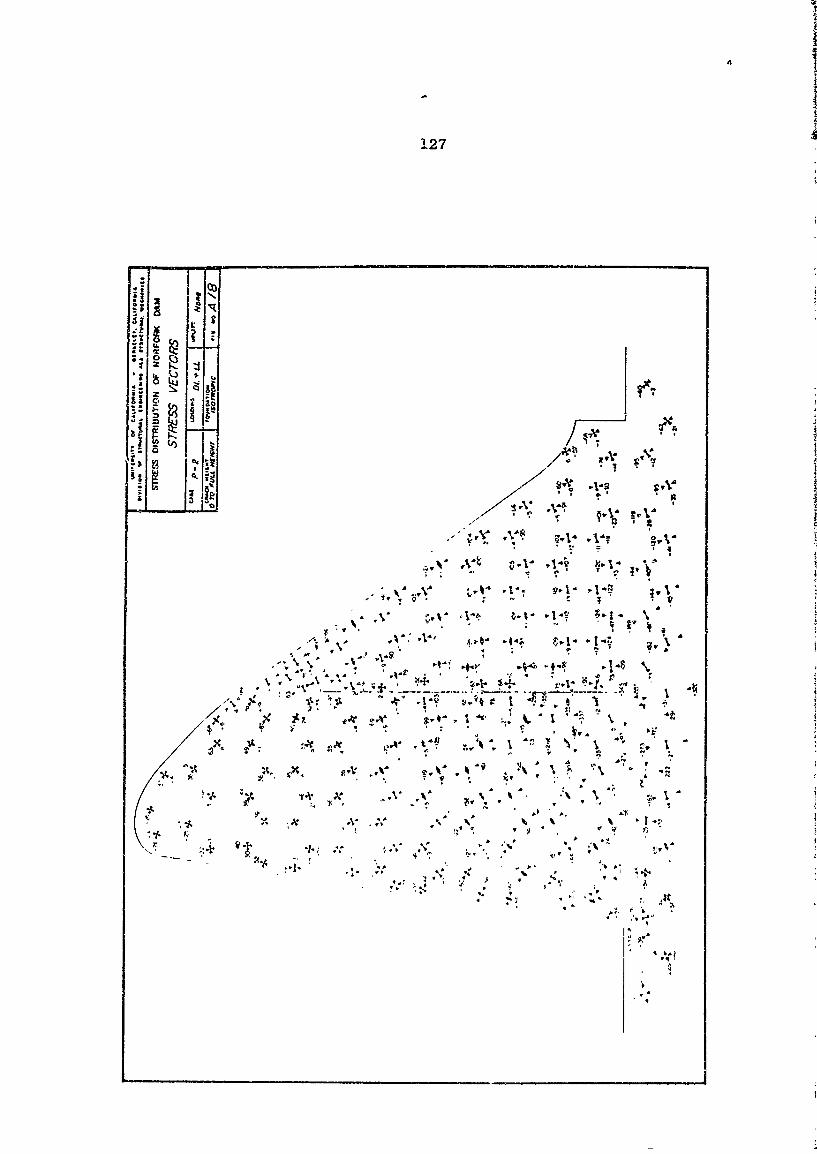
127
if
4k v"~Q
-~ V L
~I
~a
v~ J
ItI
~x
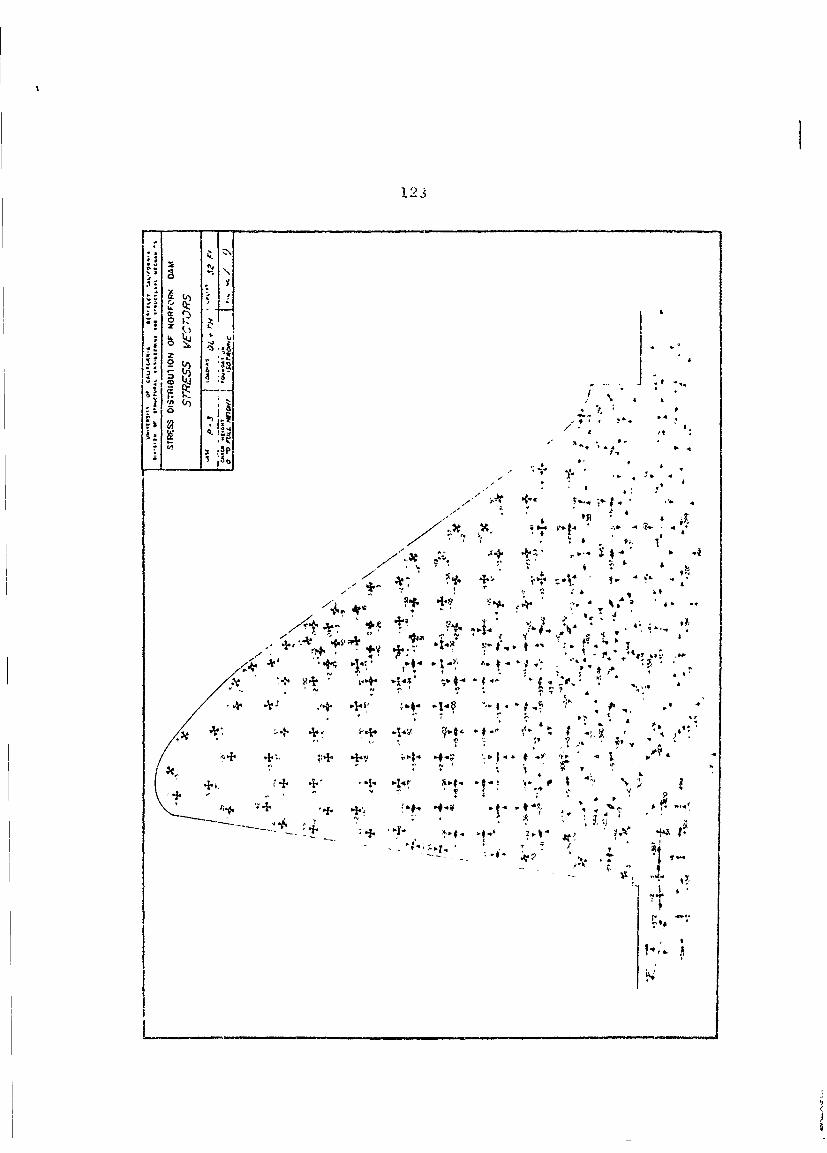
123
;.10 . / '
"I J I. uPl ", I "
' 1
.o.
U5 . .i ' ,*., .* 4, ":,.. ,
. ,, ,?: " ,, ,1* , " " ", -- - ' ,-' 4- " 4 a;
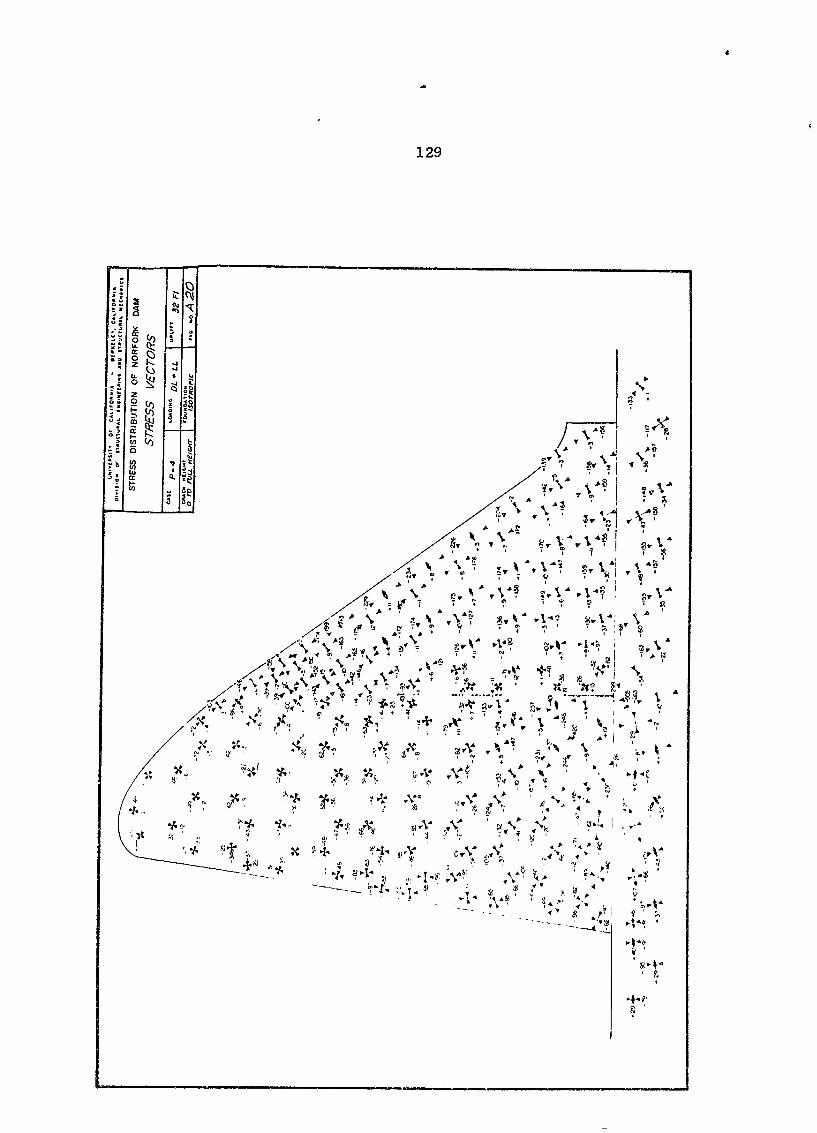
129
4.
aA.
SO 7,I.
* '44 'T
A +.
ItI
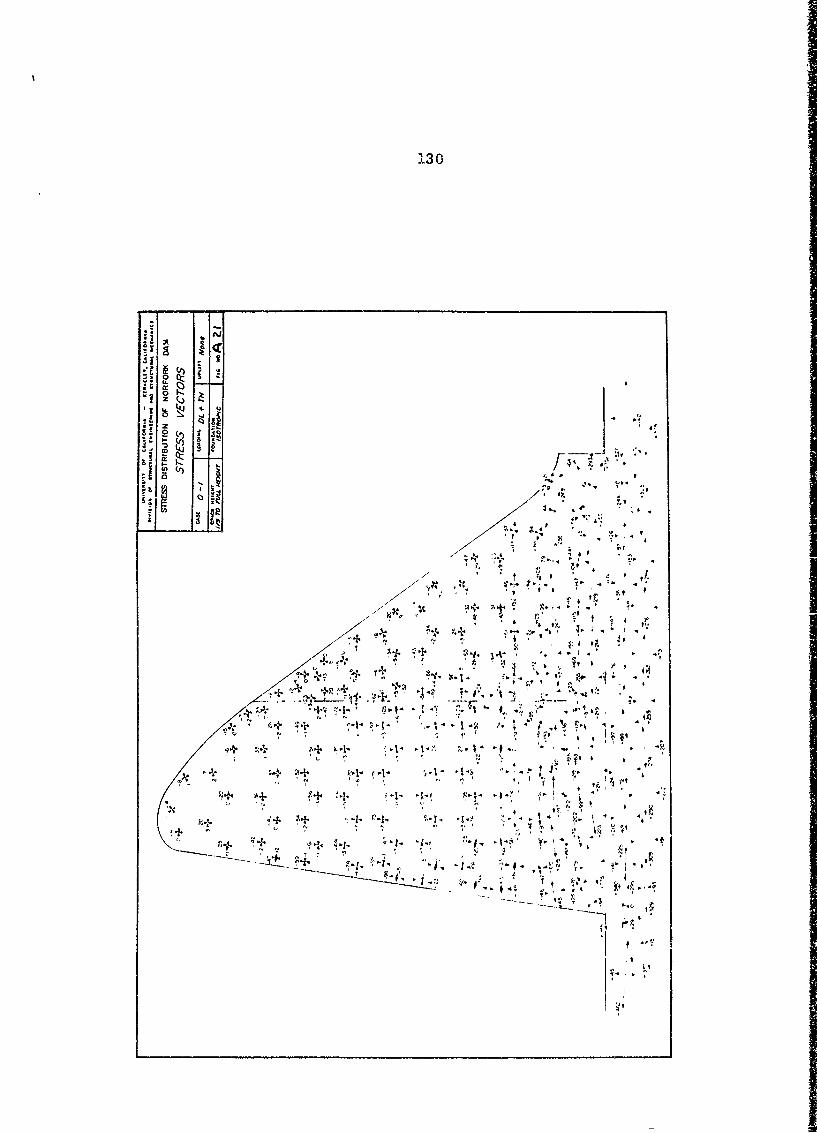
130
j{ I
;-1% - S '
.*1 ~ (I)
o/ , • , , 't t l t, ;.
0, '
/
4. ,t
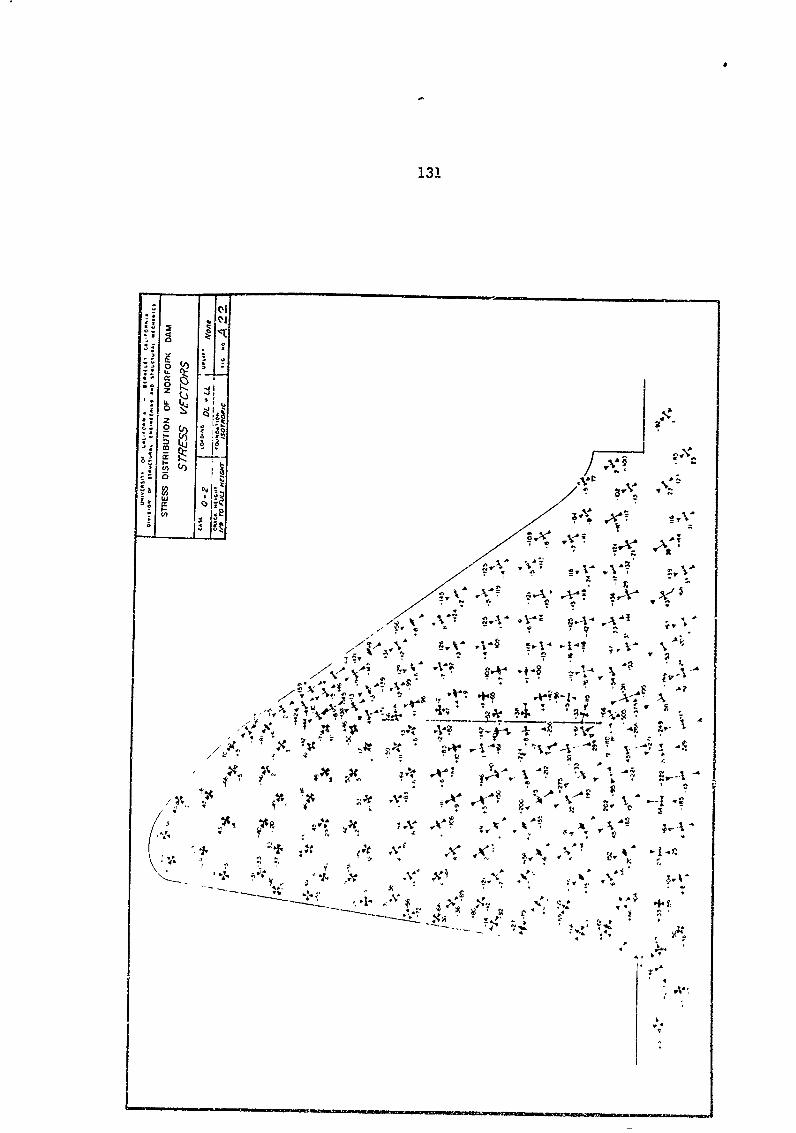
E
131
('I
-4 "1Ta 0
0 , -
K 41
La. t.j 1%44
Ca-,
a [. -
'a
C~j~ / z 1 ~ -'ray~..v ~.7
.~A~ *~ =~- * e ~
3~A .A~' ~A A-'
V
~ A ay~r A A-~ i:~.A- V'~ - *
- ~r * *~ - , r* a~
- 4 A 4 ,V' ~ 44 ~ *.-I-- V \
7 ,A aA; ~ '.A-'k..2- ~' 1~a 'a. Q~~'4~*~ . -~
,= ~,. ~' 44 .- V £21 (9'
.a.-'~ ~ - ~ *$4~ ~ ~ -A * AA\ i.-%. ira' ,1. 4 - "4 U
7 V ~*r ~ £4. ~ AU~ N ~ aa4~ ~1I4A; -4L Z'
Ia , 1.-A
x a~ L~k* V'42 * - N ~.-'*al %
~e~4 /~a4 ~JC1 ~ ~ ~ .~,; ~ 9' b
\A~ ~A .~. A-'a ~, ~ - g.~ fr -~ -~- I * NV '~a ~* 3
i.4V A Aa- -'2~a ~ *1* V~a. a .a V Na4 * at 4,-~I.. *-a*I' 3:c ~c *v~ .X-* V~( * Al
* ~k '-~-~a N 4 4- ~~'? v.a.; ~ -
Na - -
~ ~'C ~Zat ,..7~* Va4~a ~A A. ~4.- - 4, -
21 a -- I, *t~*;a - a -a
~~~*~*4~~.~~. 4, *~ A, A Pa
£ ~ 4-a'4. a,~ a p-a
.7.4a., *,a~ N - 4
_ 4 a~a ~ *~4 ~ a.
4 a -
-a A'*
V.I
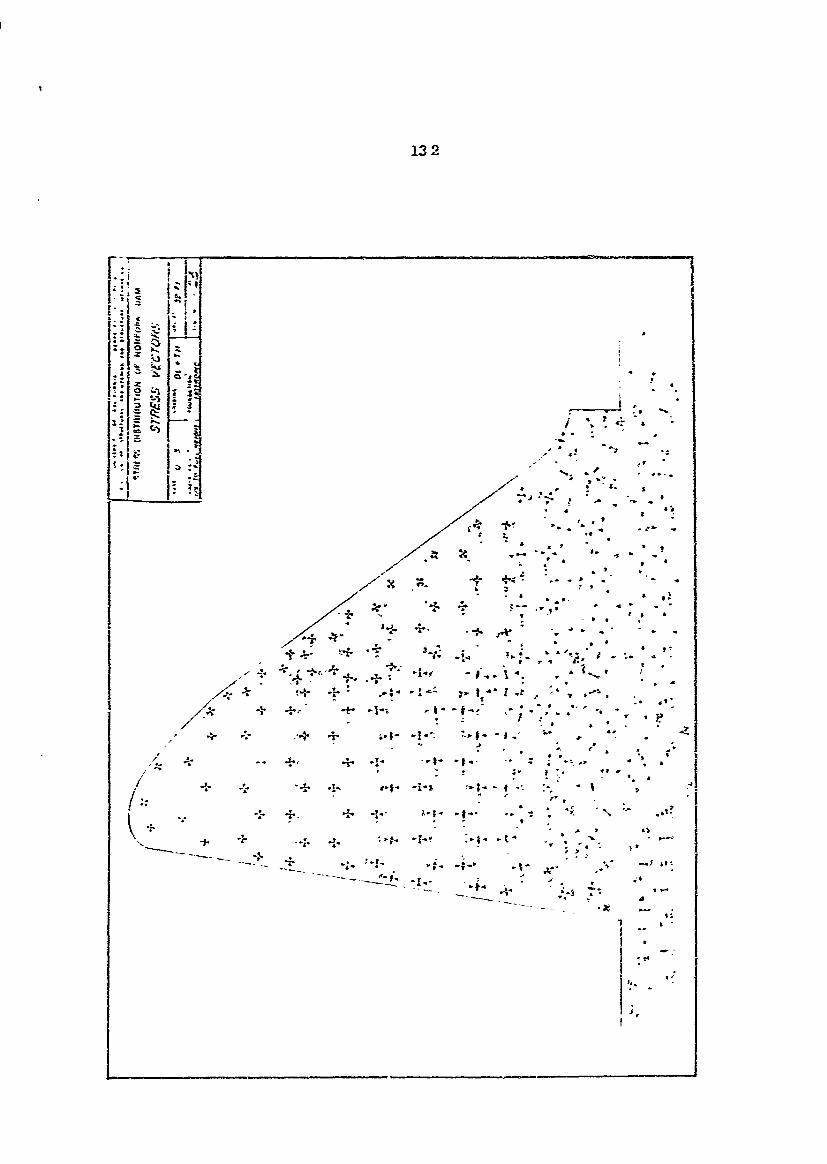
132
L~
:~
D <A ~ I ~ *
i - &
-. w' '
1. :~:S
4. .~..~J 4 ~ t4
I
7 .~ ~5.4~44
~C45
* S ~ S
--
S C
- -~ ; ; S
1 * S -5- * - .4
~ - * a
6 *4 a..-C
* '4. - - ~I *. C* -C * -I d.$4 -Iz ~ - 4
*.?.* ~i.*. Ni. r. . *
- A S
-- ~- C --, -..- C *~ * C-si &?~44 4 **~~C
*.I. .i- S... -. * *
-. 1~
-, . a
-J 5.
C"
C,
4 -
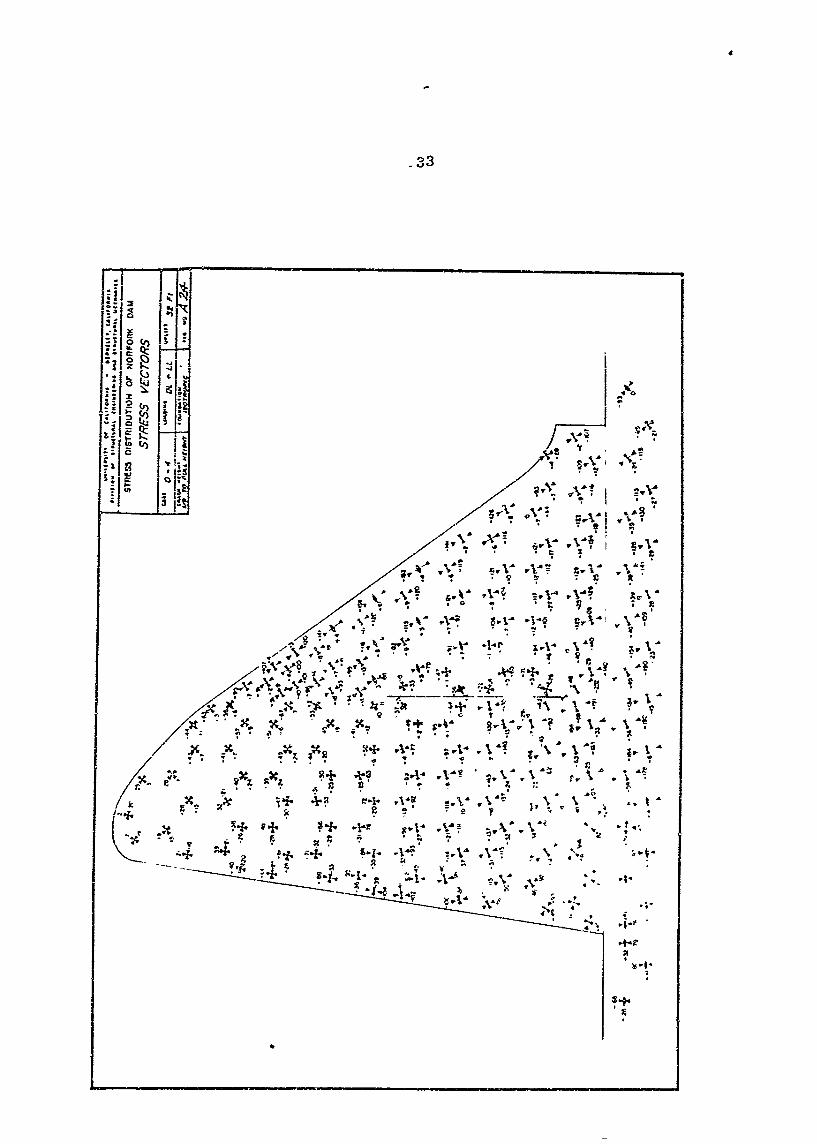
-3
z~ X
VIA A ,IVAI
I