Embed Size (px)
Citation preview
Article
The Strategy of Visual Inspection for Non-Geometric Parts by using Screen Display Techniques Phonsak Lerthiranphanya1,a, Sumalee Chanchalor2,b,*, and Anucha Watanapa3,c
1 Learning Innovation and Technology, Faculty of Industrial Education and Technology, King Mongkut’s University of Technology Thonburi, Bang Mod, Thung Khru, Bangkok 10140, Thailand 2 Department of Electrical Technology Education, Faculty of Industrial Education and Technology, King Mongkut’s University of Technology Thonburi, Bang Mod, Thung Khru, Bangkok 10140, Thailand 3 Department of Production Technology Education, Faculty of Industrial Education and Technology, King Mongkut’s University of Technology Thonburi, Bang Mod, Thung Khru, Bangkok 10140, Thailand E-mail: [email protected], [email protected] (Corresponding author) Abstract. The objective of this research is to determine the effectiveness of visual inspection strategies with different screen display techniques for non-geometric parts in terms of inspector performance measures to identify an effective inspection strategy. The study is divided into three experimental phases. Phase I and Phase II compare the effectiveness of defect search patterns and training patterns respectively, to determine the best effective search and training patterns. The results of both studies were integrated into screen display techniques to study and determine the most effective visual inspection strategy by using a visual inspection program in the final phase. Phase III compares the effectiveness of visual inspection with the strategy of screen display technique application. The evaluation of the effectiveness of all phases regarding the performance of participants was indicated by speed and accuracy of the visual inspection. The results of the studies found that the visual inspection strategy with a hybrid screen display technique was the best strategy for visual inspection. This strategy will make visual inspection performance 13.40 sec faster per piece and increase accuracy by 50.83%. The application of the visual inspection strategy can be a strategy for practice before performing actual inspections and can have applications for other inspection work, especially for defect inspection of non-
geometric shapes and complex shapes. Keywords: Visual inspection, screen display, non-geometric, inspection task.
ENGINEERING JOURNAL Volume 23 Issue 6 Received 11 March 2019 Accepted 3 October 2019 Published 30 November 2019 Online at http://www.engj.org/ DOI:10.4186/ej.2019.23.6.311
DOI:10.4186/ej.2019.23.6.311
312 ENGINEERING JOURNAL Volume 23 Issue 6, ISSN 0125-8281 (http://www.engj.org/)
1. Introduction Product inspection, including the inspection of shapes, dimensions, defects, etc., is an important step in the production process. The inspection process prevents waste from production and ensures a quality product because product reliability and product quality are of the utmost importance in most production [1 ]. The product reliability reflects the quality of the manufacturing process. Therefore, quality control with inspection is an important step and a key factor in the production processes [1 , 2]. Inspection is a major quality control component for many industrial tasks [3] such as aircraft maintenance, printed circuit board assembly, and work pieces from the die casting process, as well as across industries including the textile industry and the food and beverage industry [ 4 , 5 ] . In general, after privatization or production and assembly, the work pieces must be inspected to discover defects. Specifically, the use of a visual inspection method is an important task in many fields, including quality control, security surveillance and medical diagnosis [6]. Visual inspection is a simple, most basic method and can be achieved by humans immediately. Visual inspection is a process of eye movements for identifying a defect within the area of interest for processing and deciding whether the defect or target discovered will be categorized as a defect or unacceptable [7, 8, 9]. The two skills critical to effective visual inspection are the ability to do a visual scan or search and the ability to make determinations about the suitability of the product given the results of the visual scan [10, 11, 12]. The criticality of inspection in manufacturing becomes evident when the potential consequences of missed defects are inspected. In some cases, defective products or defects may affect the next process in manufacturing and/or have a direct negative impact on customer satisfaction. The defective products or defects may be classified as defective and must be reworked or scrapped, resulting in unnecessary expenses for materials, time, and labor. For example, the problem of surface defects in the die casting process was widespread throughout the foundry industry [ 1 3 , 1 4 ] . Therefore, inspection is of paramount importance in maintaining product quality.
A complex item is presented in piece; it encompasses a total number of components and many parts and subcomponents that must be inspected for a wide range of defects [15]. For example, the complexity of printed circuit boards can be measured in terms of the number of solder joints [16]. Complexity in terms of shape does not reflect the specific shape of the item being inspected but rather if it is clear or a non-geometric shape. Mostly, the non-geometric shape complexity is a matter of parts in terms of the structured products. The details are complex, with multiple shapes or work pieces that are not a specific shape or have an irregular shape. For a further example, the complexity of the auto parts from the die casting process reveals auto parts that are of non-geometric shapes and complex structures. The results of previous research indicate that complexity had a significant negative effect on inspection performance [3 , 17]. The inspector affects the efficiency of quality visual inspection, and defect search time depends on the most complicated task [ 2 ] . Visual inspection usually includes three systems for inspection: human systems, computer systems, and hybrid systems [18]. Defect inspection using automated systems by machines are be used widely because the inspection process is easier and faster. The trade-off for the increased speed and consistency of a computer-based inspection system is the high cost associated with designing an automated inspection system for each product type and the high ongoing operational costs of these systems. Therefore, the human system is primarily used as the key visual inspection system in the visual inspection process. Therefore, the inspector must be given the method and inspection practice with the appropriate strategy.
In the case of non-geometric items, humans still outperform machines in attribute and defect inspection and provide more than flexibility in the visual search and decision-making processes [19]. Thus, developing and improving human performance for visual inspection is very important. The inspector should have a technique for defect inspection that will allow visual inspection to be more effective, such as a method of eye movement for defect scanning, work piece rotation, or a method of providing information for use in effective visual inspection, including screen display techniques. Screen display techniques show
directional movement of the eye for practicing defect search, derived from the expert inspectors [8 ]. The
technique can include the study of appropriate eye movements for each work piece and non-geometric work piece shape.
The method of human inspection is used when there are moderately complex requirements in inspection, and this method is relatively slow when compared to electronic inspection methods or inspection with a computer system; however, humans can perform inspection for a greater number of defect types [20 ] or for complicated shapes and non-geometric shapes of work pieces [2]. Therefore, the
DOI:10.4186/ej.2019.23.6.311
ENGINEERING JOURNAL Volume 23 Issue 6, ISSN 0125-8281 (http://www.engj.org/) 313
inspectors should be trained and well-practiced in defect searching to improve the performance of a visual inspection task [ 2 1 , 2 2 ] and to improve search performance. It is interesting to find that a pattern of effective visual search for non-geometric inspection tasks is any pattern. Improving the inspection performance regarding search method can occur via wide range of techniques, including providing information before and after the inspectors performs the visual inspection with each of training pattern to find a pattern that is effective for training as determined by the provided information. Training patterns are especially useful to provide information for visual inspection when the work piece is non-geometric shape. The screen display techniques are special techniques used for the search practice to determine the direction of eye movement, allowing for the adjustment of the inspection behaviour to improve performance.
The complexity in terms of non-geometric shapes influences inspection performance and is the factor that impacts inspection performance. The result of previous research indicated that part complexity has a significant detrimental effect on inspection performance; a defect at a complex position has an influence on both the visual search and decision-making components of the inspection task [3, 17]. This study is focused on determining which strategy of inspection, search pattern, training pattern, and screen display technique for defect inspection practice combination will provide suitable strategies for inspection to improve the performance of a visual inspection; this information is pertinent for complex tasks, such as non-geometric parts. The best pattern of inspection should be more efficient than the other evaluated patterns in terms of performance of visual inspection, as measured by speed and defect detection accuracy. Thus, the main objective of this research was to determine the effectiveness of visual inspection strategies in different screen display techniques for non-geometric parts using a static screen display technique, dynamic screen display technique, hybrid screen display technique, and no screen display technique; these techniques were evaluated in terms of inspector performance and potential to serve as an effective strategy for the inspection of non-geometric parts.
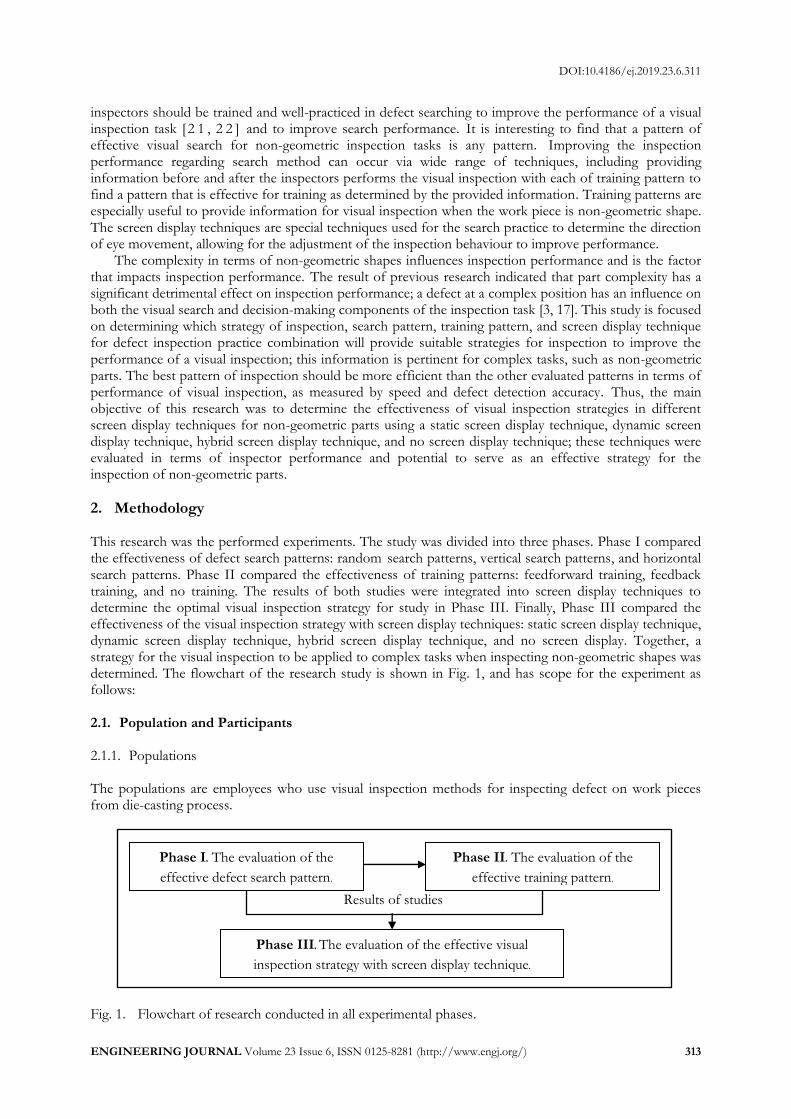
2. Methodology This research was the performed experiments. The study was divided into three phases. Phase I compared the effectiveness of defect search patterns: random search patterns, vertical search patterns, and horizontal search patterns. Phase II compared the effectiveness of training patterns: feedforward training, feedback training, and no training. The results of both studies were integrated into screen display techniques to determine the optimal visual inspection strategy for study in Phase III. Finally, Phase III compared the effectiveness of the visual inspection strategy with screen display techniques: static screen display technique, dynamic screen display technique, hybrid screen display technique, and no screen display. Together, a strategy for the visual inspection to be applied to complex tasks when inspecting non-geometric shapes was determined. The flowchart of the research study is shown in Fig. 1, and has scope for the experiment as follows: 2.1. Population and Participants
2.1.1. Populations The populations are employees who use visual inspection methods for inspecting defect on work pieces from die-casting process.
Fig. 1. Flowchart of research conducted in all experimental phases.
Phase III. The evaluation of the effective visual
inspection strategy with screen display technique.
Results of studies
Phase I. The evaluation of the
effective defect search pattern. Phase II. The evaluation of the
effective training pattern.
DOI:10.4186/ej.2019.23.6.311
314 ENGINEERING JOURNAL Volume 23 Issue 6, ISSN 0125-8281 (http://www.engj.org/)
2.1.2. Participants The participants in all phases were undergraduate students in the field of Production Engineering, consisting of a total of one-hundred participants ranging in age from 21 to 23 years, is a sample group in this research. The participants were selected by a randomly assigned method and passed the normal eye vision test (20/20 vision) using a Snellen chart [10, 11, 16, 23] and a color vision test using Ishihara’s tests [24]. They had normal eye vision and normal color vision, as determined by both tests.
2.2. Variable in the Experimental
2.2.1 Independent variables Independent variables in each phase of experiment with were below.
Phase I. The three patterns of search consisting of Random search, Vertical search, and Horizontal search.
Phase II. The three patterns of training consisting of Feedforward training, Feedback training, and No
training.
Phase III. The four techniques of screen display were independent variables consisting of Static screen, Dynamic screen, Hybrid screen, and No screen. 2.2.2 Dependent variables
Dependent variable in all experimental phases (Phase I, II, and III) were evaluated in terms of inspector performance and potential to serve as an effective strategy for the inspection. Evaluated from the mean search time (Sec) and mean percentage of defects detected (%) for each experiment phases.
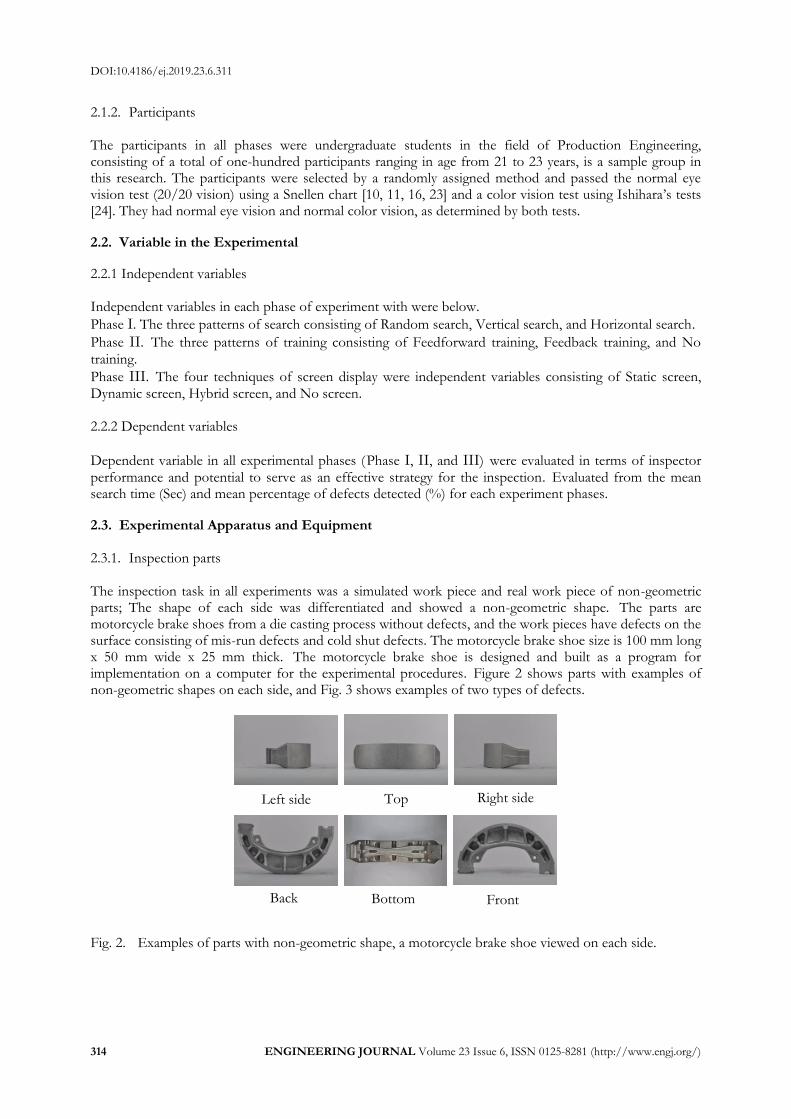
2.3. Experimental Apparatus and Equipment 2.3.1. Inspection parts The inspection task in all experiments was a simulated work piece and real work piece of non-geometric parts; The shape of each side was differentiated and showed a non-geometric shape. The parts are motorcycle brake shoes from a die casting process without defects, and the work pieces have defects on the surface consisting of mis-run defects and cold shut defects. The motorcycle brake shoe size is 100 mm long x 50 mm wide x 25 mm thick. The motorcycle brake shoe is designed and built as a program for implementation on a computer for the experimental procedures. Figure 2 shows parts with examples of non-geometric shapes on each side, and Fig. 3 shows examples of two types of defects.
Fig. 2. Examples of parts with non-geometric shape, a motorcycle brake shoe viewed on each side.
Left side Top Right side
Front Bottom Back
DOI:10.4186/ej.2019.23.6.311
ENGINEERING JOURNAL Volume 23 Issue 6, ISSN 0125-8281 (http://www.engj.org/) 315
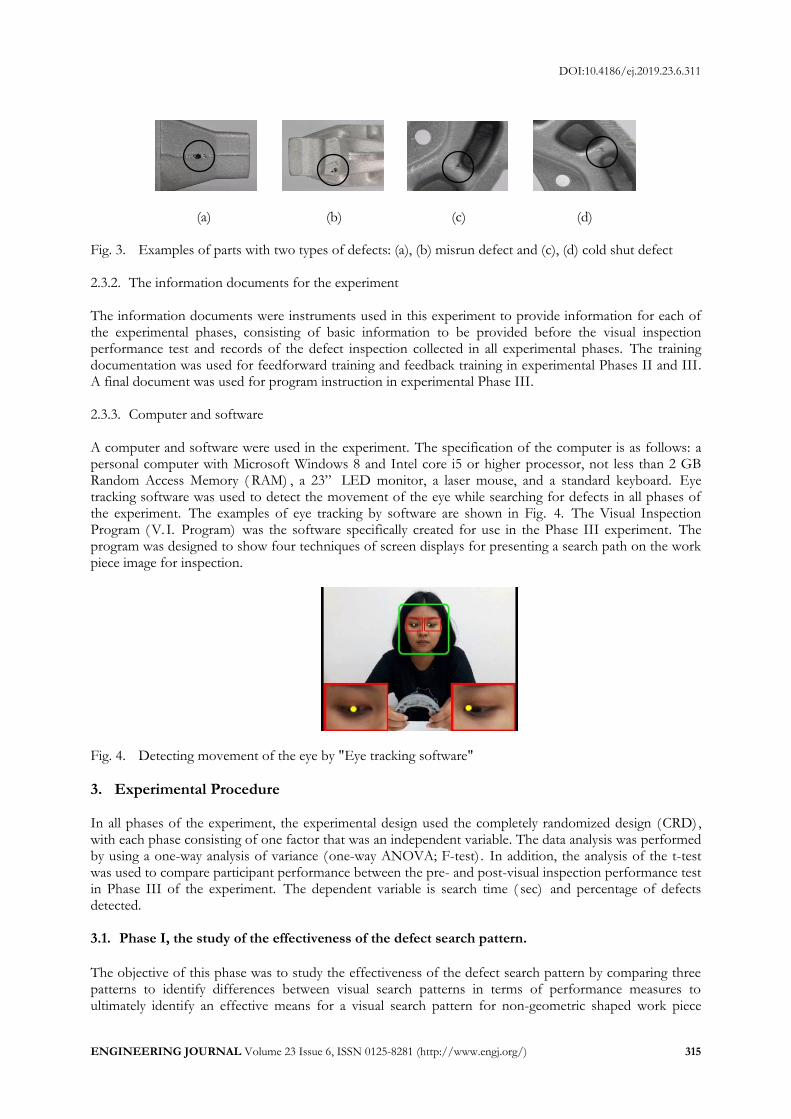
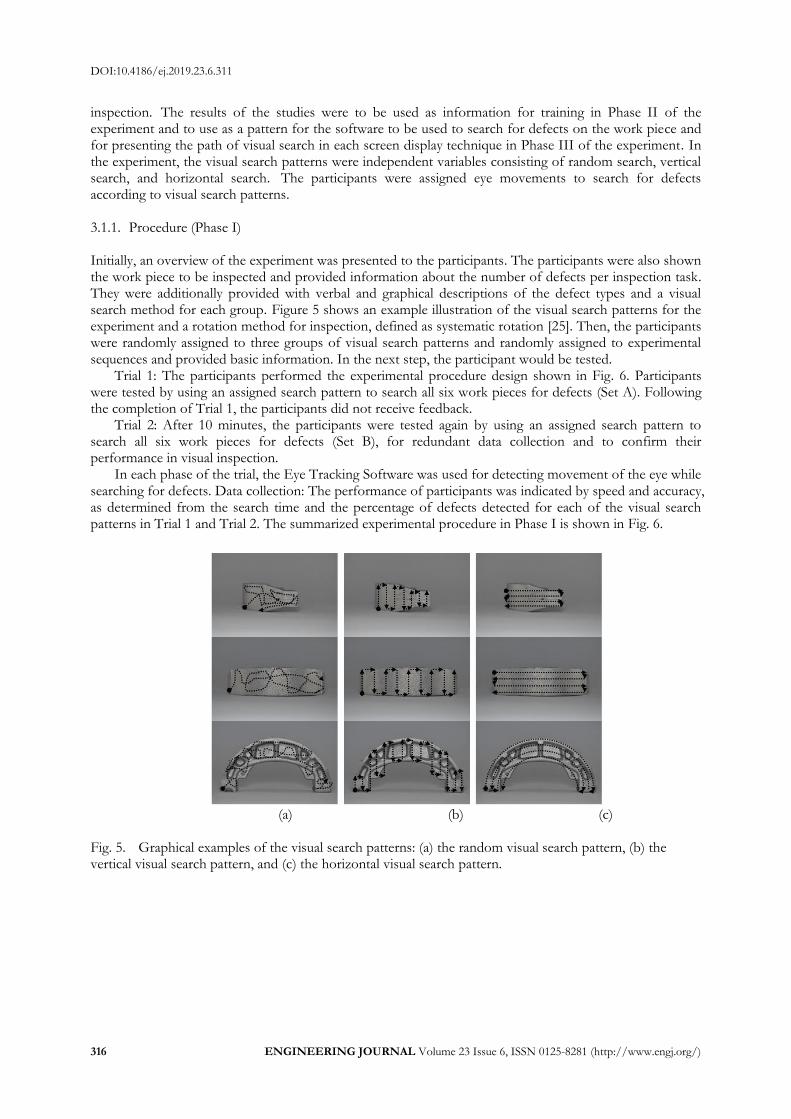
(a) (b) (c) (d) Fig. 3. Examples of parts with two types of defects: (a), (b) misrun defect and (c), (d) cold shut defect 2.3.2. The information documents for the experiment The information documents were instruments used in this experiment to provide information for each of the experimental phases, consisting of basic information to be provided before the visual inspection performance test and records of the defect inspection collected in all experimental phases. The training documentation was used for feedforward training and feedback training in experimental Phases II and III. A final document was used for program instruction in experimental Phase III. 2.3.3. Computer and software A computer and software were used in the experiment. The specification of the computer is as follows: a personal computer with Microsoft Windows 8 and Intel core i5 or higher processor, not less than 2 GB Random Access Memory ( RAM) , a 23” LED monitor, a laser mouse, and a standard keyboard. Eye tracking software was used to detect the movement of the eye while searching for defects in all phases of the experiment. The examples of eye tracking by software are shown in Fig. 4. The Visual Inspection Program ( V. I. Program) was the software specifically created for use in the Phase III experiment. The program was designed to show four techniques of screen displays for presenting a search path on the work piece image for inspection.
Fig. 4. Detecting movement of the eye by "Eye tracking software"
3. Experimental Procedure In all phases of the experiment, the experimental design used the completely randomized design (CRD) , with each phase consisting of one factor that was an independent variable. The data analysis was performed by using a one-way analysis of variance (one-way ANOVA; F-test) . In addition, the analysis of the t-test was used to compare participant performance between the pre- and post-visual inspection performance test in Phase III of the experiment. The dependent variable is search time ( sec) and percentage of defects detected. 3.1. Phase I, the study of the effectiveness of the defect search pattern.
The objective of this phase was to study the effectiveness of the defect search pattern by comparing three patterns to identify differences between visual search patterns in terms of performance measures to ultimately identify an effective means for a visual search pattern for non-geometric shaped work piece
DOI:10.4186/ej.2019.23.6.311
316 ENGINEERING JOURNAL Volume 23 Issue 6, ISSN 0125-8281 (http://www.engj.org/)
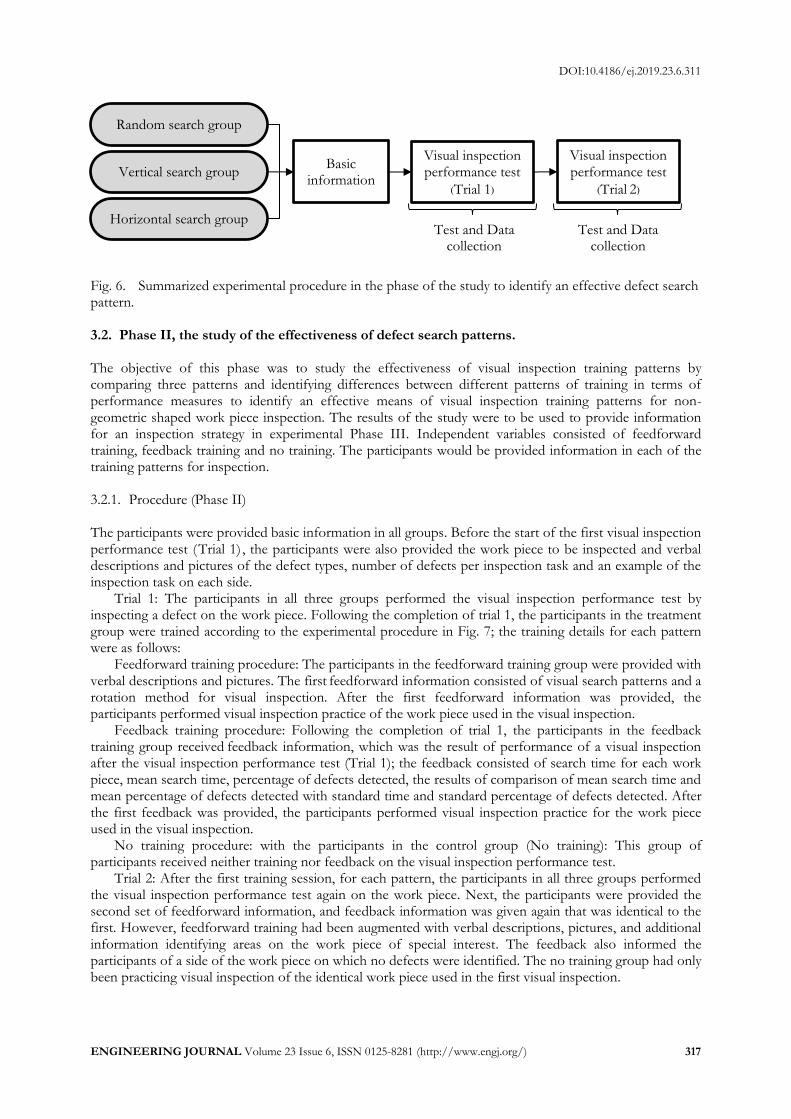
inspection. The results of the studies were to be used as information for training in Phase II of the experiment and to use as a pattern for the software to be used to search for defects on the work piece and for presenting the path of visual search in each screen display technique in Phase III of the experiment. In the experiment, the visual search patterns were independent variables consisting of random search, vertical search, and horizontal search. The participants were assigned eye movements to search for defects according to visual search patterns. 3.1.1. Procedure (Phase I) Initially, an overview of the experiment was presented to the participants. The participants were also shown the work piece to be inspected and provided information about the number of defects per inspection task. They were additionally provided with verbal and graphical descriptions of the defect types and a visual search method for each group. Figure 5 shows an example illustration of the visual search patterns for the experiment and a rotation method for inspection, defined as systematic rotation [25]. Then, the participants were randomly assigned to three groups of visual search patterns and randomly assigned to experimental sequences and provided basic information. In the next step, the participant would be tested.
Trial 1: The participants performed the experimental procedure design shown in Fig. 6. Participants were tested by using an assigned search pattern to search all six work pieces for defects (Set A). Following the completion of Trial 1, the participants did not receive feedback.
Trial 2: After 10 minutes, the participants were tested again by using an assigned search pattern to search all six work pieces for defects (Set B), for redundant data collection and to confirm their performance in visual inspection.
In each phase of the trial, the Eye Tracking Software was used for detecting movement of the eye while searching for defects. Data collection: The performance of participants was indicated by speed and accuracy, as determined from the search time and the percentage of defects detected for each of the visual search patterns in Trial 1 and Trial 2. The summarized experimental procedure in Phase I is shown in Fig. 6.
(a) (b) (c)
Fig. 5. Graphical examples of the visual search patterns: (a) the random visual search pattern, (b) the vertical visual search pattern, and (c) the horizontal visual search pattern.
DOI:10.4186/ej.2019.23.6.311
ENGINEERING JOURNAL Volume 23 Issue 6, ISSN 0125-8281 (http://www.engj.org/) 317
Fig. 6. Summarized experimental procedure in the phase of the study to identify an effective defect search pattern. 3.2. Phase II, the study of the effectiveness of defect search patterns. The objective of this phase was to study the effectiveness of visual inspection training patterns by comparing three patterns and identifying differences between different patterns of training in terms of performance measures to identify an effective means of visual inspection training patterns for non-geometric shaped work piece inspection. The results of the study were to be used to provide information for an inspection strategy in experimental Phase III. Independent variables consisted of feedforward training, feedback training and no training. The participants would be provided information in each of the training patterns for inspection. 3.2.1. Procedure (Phase II) The participants were provided basic information in all groups. Before the start of the first visual inspection performance test (Trial 1) , the participants were also provided the work piece to be inspected and verbal descriptions and pictures of the defect types, number of defects per inspection task and an example of the inspection task on each side.
Trial 1: The participants in all three groups performed the visual inspection performance test by inspecting a defect on the work piece. Following the completion of trial 1, the participants in the treatment group were trained according to the experimental procedure in Fig. 7; the training details for each pattern were as follows:
Feedforward training procedure: The participants in the feedforward training group were provided with verbal descriptions and pictures. The first feedforward information consisted of visual search patterns and a rotation method for visual inspection. After the first feedforward information was provided, the participants performed visual inspection practice of the work piece used in the visual inspection.
Feedback training procedure: Following the completion of trial 1, the participants in the feedback training group received feedback information, which was the result of performance of a visual inspection after the visual inspection performance test (Trial 1); the feedback consisted of search time for each work piece, mean search time, percentage of defects detected, the results of comparison of mean search time and mean percentage of defects detected with standard time and standard percentage of defects detected. After the first feedback was provided, the participants performed visual inspection practice for the work piece used in the visual inspection.
No training procedure: with the participants in the control group (No training): This group of participants received neither training nor feedback on the visual inspection performance test.
Trial 2: After the first training session, for each pattern, the participants in all three groups performed the visual inspection performance test again on the work piece. Next, the participants were provided the second set of feedforward information, and feedback information was given again that was identical to the first. However, feedforward training had been augmented with verbal descriptions, pictures, and additional information identifying areas on the work piece of special interest. The feedback also informed the participants of a side of the work piece on which no defects were identified. The no training group had only been practicing visual inspection of the identical work piece used in the first visual inspection.
Basic information
Visual inspection performance test
(Trial 1)
Visual inspection performance test
(Trial 2)
Test and Data collection
Test and Data collection
Random search group
Vertical search group
Horizontal search group
DOI:10.4186/ej.2019.23.6.311
318 ENGINEERING JOURNAL Volume 23 Issue 6, ISSN 0125-8281 (http://www.engj.org/)
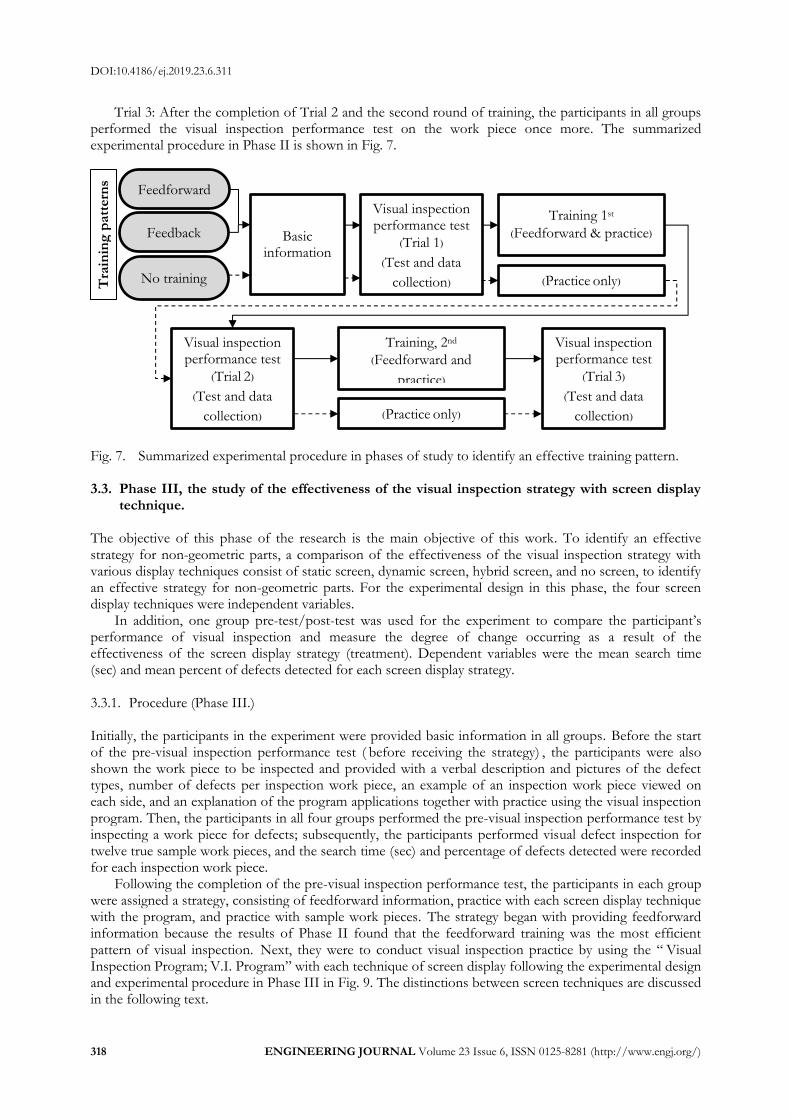
Trial 3: After the completion of Trial 2 and the second round of training, the participants in all groups performed the visual inspection performance test on the work piece once more. The summarized experimental procedure in Phase II is shown in Fig. 7.
Fig. 7. Summarized experimental procedure in phases of study to identify an effective training pattern. 3.3. Phase III, the study of the effectiveness of the visual inspection strategy with screen display
technique. The objective of this phase of the research is the main objective of this work. To identify an effective strategy for non-geometric parts, a comparison of the effectiveness of the visual inspection strategy with various display techniques consist of static screen, dynamic screen, hybrid screen, and no screen, to identify an effective strategy for non-geometric parts. For the experimental design in this phase, the four screen display techniques were independent variables.
In addition, one group pre-test/post-test was used for the experiment to compare the participant’s performance of visual inspection and measure the degree of change occurring as a result of the effectiveness of the screen display strategy (treatment). Dependent variables were the mean search time (sec) and mean percent of defects detected for each screen display strategy. 3.3.1. Procedure (Phase III.) Initially, the participants in the experiment were provided basic information in all groups. Before the start of the pre-visual inspection performance test ( before receiving the strategy) , the participants were also shown the work piece to be inspected and provided with a verbal description and pictures of the defect types, number of defects per inspection work piece, an example of an inspection work piece viewed on each side, and an explanation of the program applications together with practice using the visual inspection program. Then, the participants in all four groups performed the pre-visual inspection performance test by inspecting a work piece for defects; subsequently, the participants performed visual defect inspection for twelve true sample work pieces, and the search time (sec) and percentage of defects detected were recorded for each inspection work piece.
Following the completion of the pre-visual inspection performance test, the participants in each group were assigned a strategy, consisting of feedforward information, practice with each screen display technique with the program, and practice with sample work pieces. The strategy began with providing feedforward information because the results of Phase II found that the feedforward training was the most efficient pattern of visual inspection. Next, they were to conduct visual inspection practice by using the “ Visual Inspection Program; V.I. Program” with each technique of screen display following the experimental design and experimental procedure in Phase III in Fig. 9. The distinctions between screen techniques are discussed in the following text.
Basic information
Visual inspection performance test
(Trial 1) (Test and data
collection)
Visual inspection performance test
(Trial 2) (Test and data
collection)
Feedforward
Feedback
No training
Training 1st (Feedforward & practice)
Visual inspection performance test
(Trial 3) (Test and data
collection)
Tra
inin
g p
att
ern
s
(Practice only)
Training, 2nd (Feedforward and
practice)
(Practice only)
DOI:10.4186/ej.2019.23.6.311
ENGINEERING JOURNAL Volume 23 Issue 6, ISSN 0125-8281 (http://www.engj.org/) 319
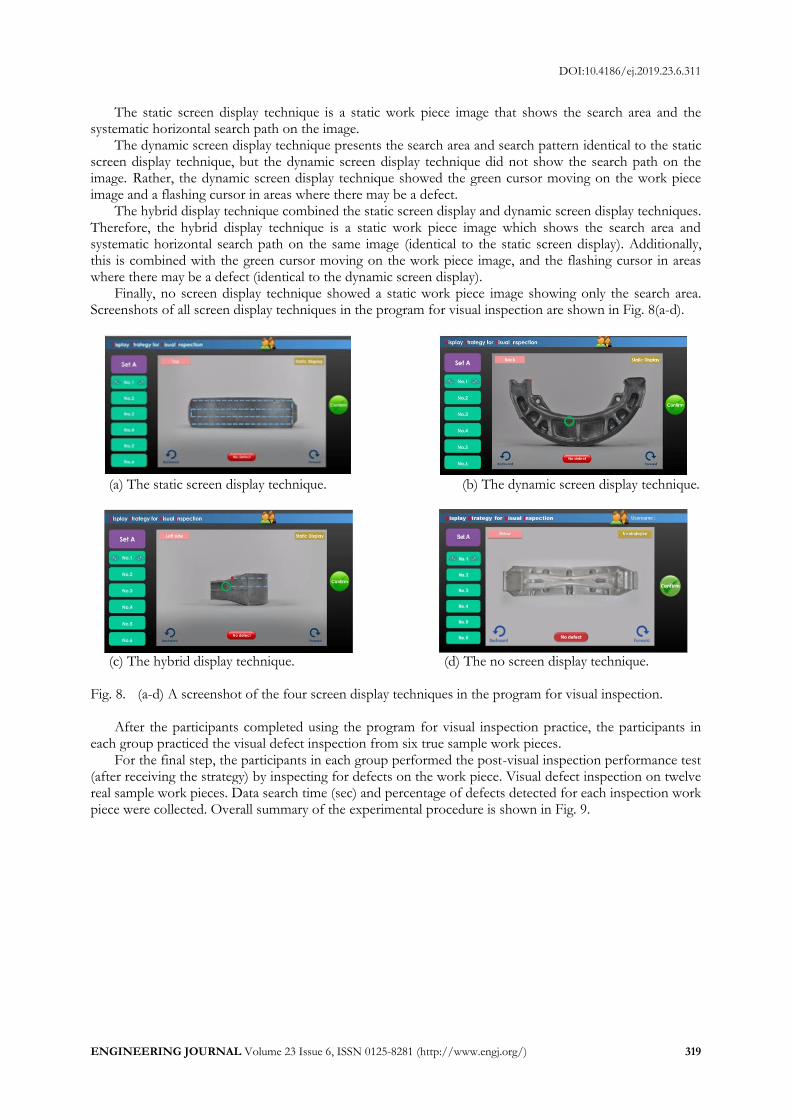
The static screen display technique is a static work piece image that shows the search area and the systematic horizontal search path on the image.
The dynamic screen display technique presents the search area and search pattern identical to the static screen display technique, but the dynamic screen display technique did not show the search path on the image. Rather, the dynamic screen display technique showed the green cursor moving on the work piece image and a flashing cursor in areas where there may be a defect.
The hybrid display technique combined the static screen display and dynamic screen display techniques. Therefore, the hybrid display technique is a static work piece image which shows the search area and systematic horizontal search path on the same image (identical to the static screen display). Additionally, this is combined with the green cursor moving on the work piece image, and the flashing cursor in areas where there may be a defect (identical to the dynamic screen display).
Finally, no screen display technique showed a static work piece image showing only the search area. Screenshots of all screen display techniques in the program for visual inspection are shown in Fig. 8(a-d).
(a) The static screen display technique. (b) The dynamic screen display technique.
(c) The hybrid display technique. (d) The no screen display technique.
Fig. 8. (a-d) A screenshot of the four screen display techniques in the program for visual inspection.
After the participants completed using the program for visual inspection practice, the participants in each group practiced the visual defect inspection from six true sample work pieces.
For the final step, the participants in each group performed the post-visual inspection performance test (after receiving the strategy) by inspecting for defects on the work piece. Visual defect inspection on twelve real sample work pieces. Data search time (sec) and percentage of defects detected for each inspection work piece were collected. Overall summary of the experimental procedure is shown in Fig. 9.
DOI:10.4186/ej.2019.23.6.311
320 ENGINEERING JOURNAL Volume 23 Issue 6, ISSN 0125-8281 (http://www.engj.org/)
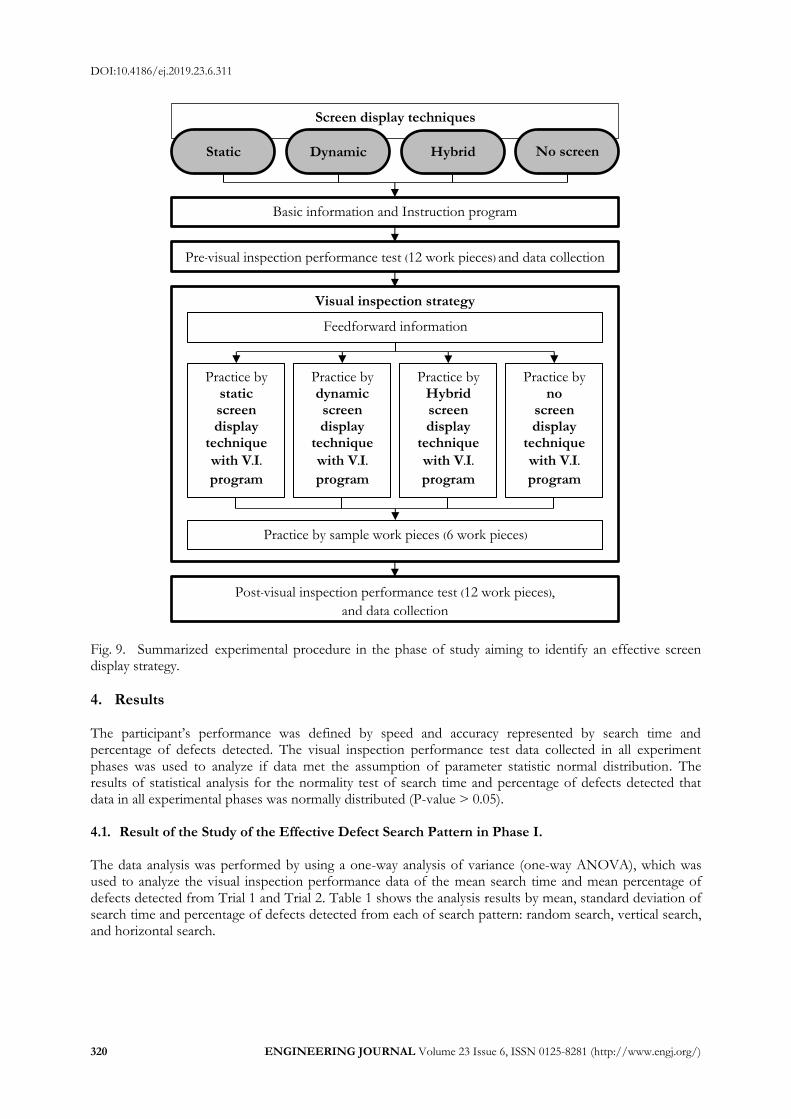
Fig. 9. Summarized experimental procedure in the phase of study aiming to identify an effective screen display strategy.
4. Results The participant’s performance was defined by speed and accuracy represented by search time and percentage of defects detected. The visual inspection performance test data collected in all experiment phases was used to analyze if data met the assumption of parameter statistic normal distribution. The results of statistical analysis for the normality test of search time and percentage of defects detected that data in all experimental phases was normally distributed (P-value > 0.05). 4.1. Result of the Study of the Effective Defect Search Pattern in Phase I. The data analysis was performed by using a one-way analysis of variance (one-way ANOVA), which was used to analyze the visual inspection performance data of the mean search time and mean percentage of defects detected from Trial 1 and Trial 2. Table 1 shows the analysis results by mean, standard deviation of search time and percentage of defects detected from each of search pattern: random search, vertical search, and horizontal search.
Basic information and Instruction program
Pre-visual inspection performance test (12 work pieces) and data collection
Screen display techniques
Static Dynamic Hybrid No screen
Visual inspection strategy
Feedforward information
Practice by sample work pieces (6 work pieces)
Practice by static screen display
technique
with V.I. program
Practice by dynamic screen display
technique
with V.I. program
Practice by Hybrid screen display
technique
with V.I. program
Practice by no
screen display
technique
with V.I. program
Post-visual inspection performance test (12 work pieces), and data collection
DOI:10.4186/ej.2019.23.6.311
ENGINEERING JOURNAL Volume 23 Issue 6, ISSN 0125-8281 (http://www.engj.org/) 321
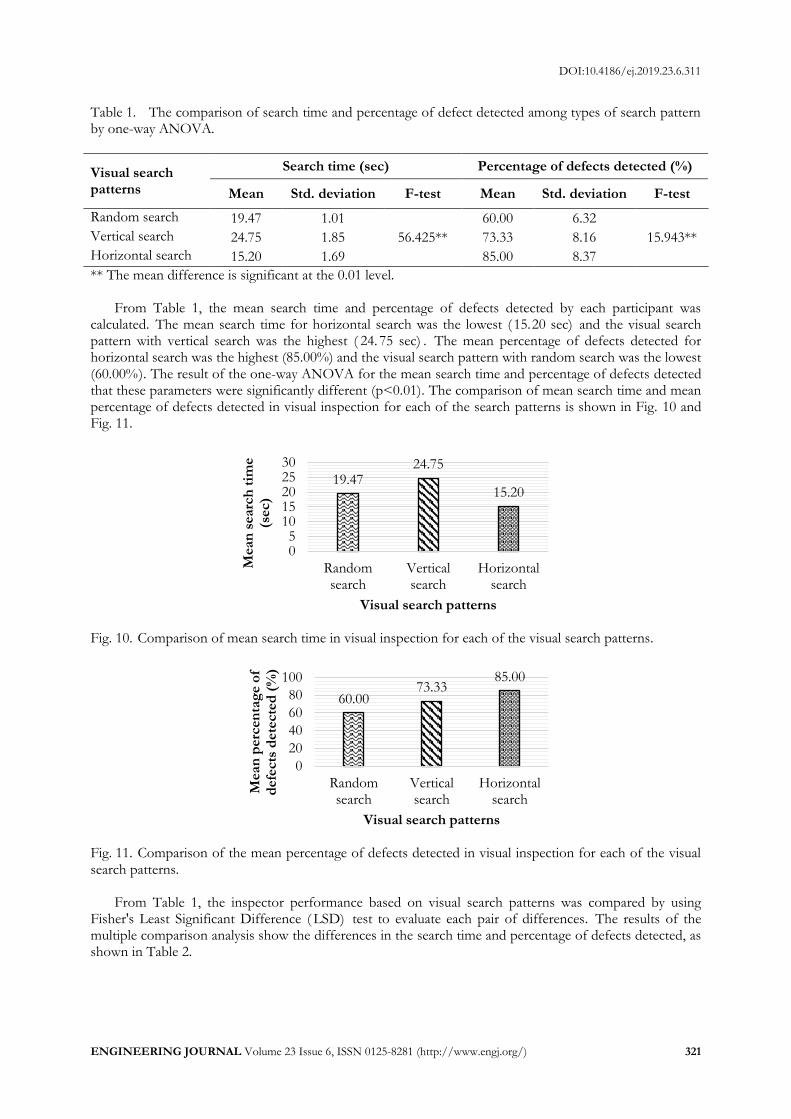
Table 1. The comparison of search time and percentage of defect detected among types of search pattern by one-way ANOVA.
Visual search patterns
Search time (sec) Percentage of defects detected (%)
Mean Std. deviation F-test Mean Std. deviation F-test
Random search 19.47 1.01
56.425**
60.00 6.32
15.943** Vertical search 24.75 1.85 73.33 8.16
Horizontal search 15.20 1.69 85.00 8.37
** The mean difference is significant at the 0.01 level.
From Table 1, the mean search time and percentage of defects detected by each participant was calculated. The mean search time for horizontal search was the lowest (15.20 sec) and the visual search pattern with vertical search was the highest ( 24. 75 sec) . The mean percentage of defects detected for horizontal search was the highest (85.00%) and the visual search pattern with random search was the lowest (60.00%). The result of the one-way ANOVA for the mean search time and percentage of defects detected that these parameters were significantly different (p<0.01). The comparison of mean search time and mean percentage of defects detected in visual inspection for each of the search patterns is shown in Fig. 10 and Fig. 11.
Fig. 10. Comparison of mean search time in visual inspection for each of the visual search patterns.
Fig. 11. Comparison of the mean percentage of defects detected in visual inspection for each of the visual search patterns.
From Table 1, the inspector performance based on visual search patterns was compared by using Fisher's Least Significant Difference ( LSD) test to evaluate each pair of differences. The results of the multiple comparison analysis show the differences in the search time and percentage of defects detected, as shown in Table 2.
19.4724.75
15.20
05
1015202530
Randomsearch
Verticalsearch
Horizontalsearch
Mean
searc
h t
ime
(sec)
Visual search patterns
60.0073.33
85.00
0
20
40
60
80
100
Randomsearch
Verticalsearch
Horizontalsearch
Mean
perc
en
tag
e o
f d
efe
cts
dete
cte
d (
%)
Visual search patterns
DOI:10.4186/ej.2019.23.6.311
322 ENGINEERING JOURNAL Volume 23 Issue 6, ISSN 0125-8281 (http://www.engj.org/)
Table 2. Multiple comparison analysis for search time and percentage of defects detected between visual search patterns by Fisher’s LSD.
Visual search patterns
The difference in search time (sec)
The difference in percentage of defects detected (%)
Random search
Vertical search
Horizontal search
Random search
Vertical search
Horizontal search
Random search - -5.28* 4.27* - -13.33* -25.00*
Vertical search - - 9.55* - - -11.67*
Horizontal search - - - - - -
* The mean difference is significant at the 0.05 level.
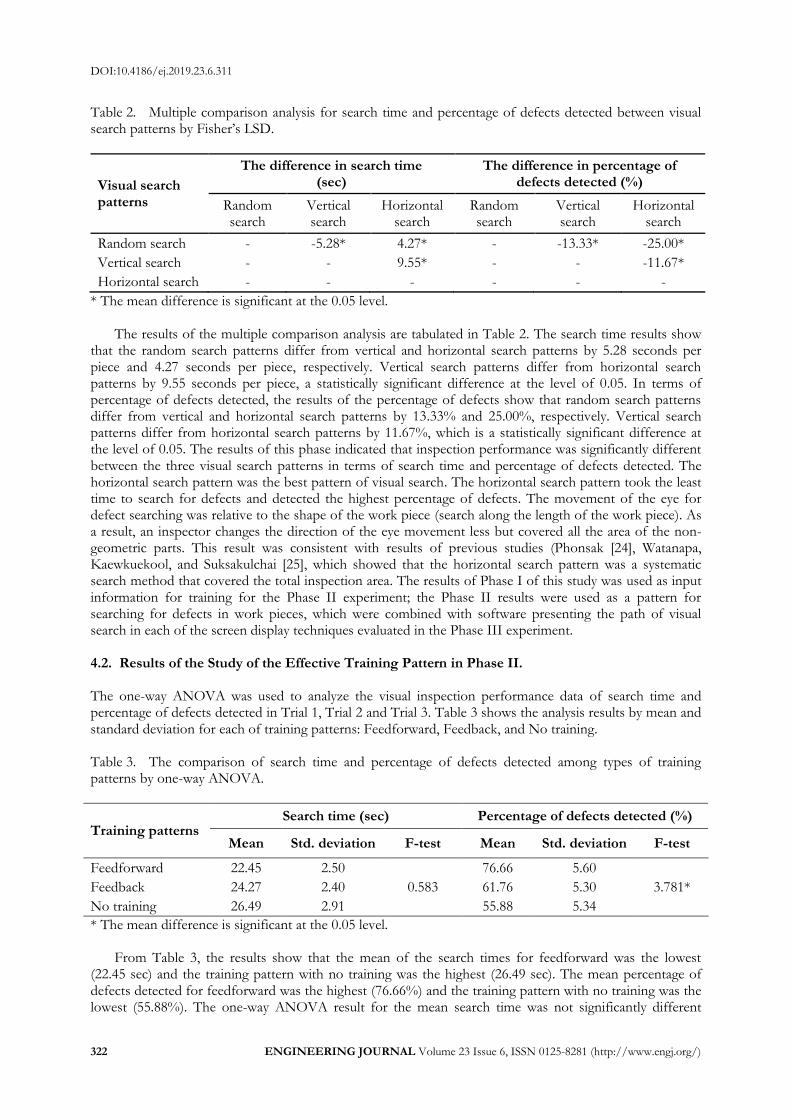
The results of the multiple comparison analysis are tabulated in Table 2. The search time results show that the random search patterns differ from vertical and horizontal search patterns by 5.28 seconds per piece and 4.27 seconds per piece, respectively. Vertical search patterns differ from horizontal search patterns by 9.55 seconds per piece, a statistically significant difference at the level of 0.05. In terms of percentage of defects detected, the results of the percentage of defects show that random search patterns differ from vertical and horizontal search patterns by 13.33% and 25.00%, respectively. Vertical search patterns differ from horizontal search patterns by 11.67%, which is a statistically significant difference at the level of 0.05. The results of this phase indicated that inspection performance was significantly different between the three visual search patterns in terms of search time and percentage of defects detected. The horizontal search pattern was the best pattern of visual search. The horizontal search pattern took the least time to search for defects and detected the highest percentage of defects. The movement of the eye for defect searching was relative to the shape of the work piece (search along the length of the work piece). As a result, an inspector changes the direction of the eye movement less but covered all the area of the non-geometric parts. This result was consistent with results of previous studies (Phonsak [24], Watanapa, Kaewkuekool, and Suksakulchai [25], which showed that the horizontal search pattern was a systematic search method that covered the total inspection area. The results of Phase I of this study was used as input information for training for the Phase II experiment; the Phase II results were used as a pattern for searching for defects in work pieces, which were combined with software presenting the path of visual search in each of the screen display techniques evaluated in the Phase III experiment. 4.2. Results of the Study of the Effective Training Pattern in Phase II. The one-way ANOVA was used to analyze the visual inspection performance data of search time and percentage of defects detected in Trial 1, Trial 2 and Trial 3. Table 3 shows the analysis results by mean and standard deviation for each of training patterns: Feedforward, Feedback, and No training. Table 3. The comparison of search time and percentage of defects detected among types of training patterns by one-way ANOVA.
Training patterns Search time (sec) Percentage of defects detected (%)
Mean Std. deviation F-test Mean Std. deviation F-test
Feedforward 22.45 2.50
0.583
76.66 5.60
3.781* Feedback 24.27 2.40 61.76 5.30
No training 26.49 2.91 55.88 5.34
* The mean difference is significant at the 0.05 level.
From Table 3, the results show that the mean of the search times for feedforward was the lowest (22.45 sec) and the training pattern with no training was the highest (26.49 sec). The mean percentage of defects detected for feedforward was the highest (76.66%) and the training pattern with no training was the lowest (55.88%). The one-way ANOVA result for the mean search time was not significantly different
DOI:10.4186/ej.2019.23.6.311
ENGINEERING JOURNAL Volume 23 Issue 6, ISSN 0125-8281 (http://www.engj.org/) 323
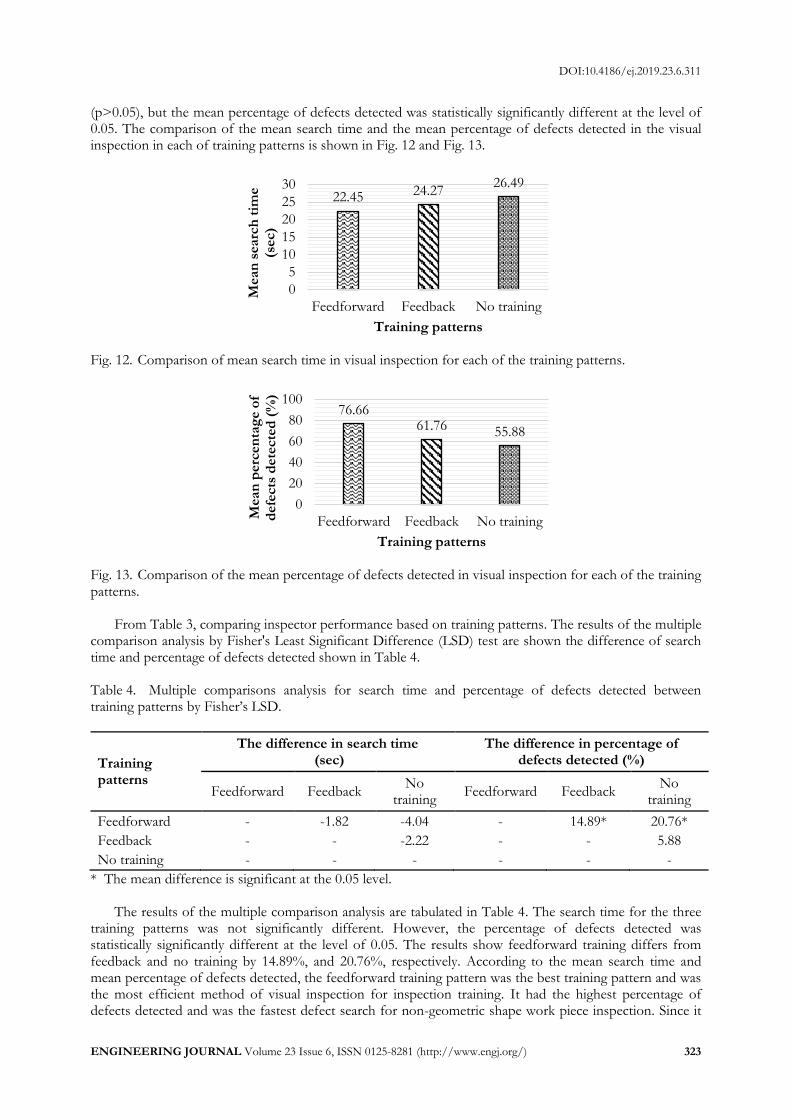
(p>0.05), but the mean percentage of defects detected was statistically significantly different at the level of 0.05. The comparison of the mean search time and the mean percentage of defects detected in the visual inspection in each of training patterns is shown in Fig. 12 and Fig. 13.
Fig. 12. Comparison of mean search time in visual inspection for each of the training patterns.
Fig. 13. Comparison of the mean percentage of defects detected in visual inspection for each of the training patterns.
From Table 3, comparing inspector performance based on training patterns. The results of the multiple comparison analysis by Fisher's Least Significant Difference (LSD) test are shown the difference of search time and percentage of defects detected shown in Table 4.
Table 4. Multiple comparisons analysis for search time and percentage of defects detected between training patterns by Fisher’s LSD.
Training patterns
The difference in search time (sec)
The difference in percentage of defects detected (%)
Feedforward Feedback No
training Feedforward Feedback
No training
Feedforward - -1.82 -4.04 - 14.89* 20.76*
Feedback - - -2.22 - - 5.88
No training - - - - - -
* The mean difference is significant at the 0.05 level.
The results of the multiple comparison analysis are tabulated in Table 4. The search time for the three training patterns was not significantly different. However, the percentage of defects detected was statistically significantly different at the level of 0.05. The results show feedforward training differs from feedback and no training by 14.89%, and 20.76%, respectively. According to the mean search time and mean percentage of defects detected, the feedforward training pattern was the best training pattern and was the most efficient method of visual inspection for inspection training. It had the highest percentage of defects detected and was the fastest defect search for non-geometric shape work piece inspection. Since it
22.45 24.2726.49
0
5
10
15
20
25
30
Feedforward Feedback No training
Mean
searc
h t
ime
(sec)
Training patterns
76.6661.76 55.88
0
20
40
60
80
100
Feedforward Feedback No trainingMean
perc
en
tag
e o
f d
efe
cts
dete
cte
d (
%)
Training patterns
DOI:10.4186/ej.2019.23.6.311
324 ENGINEERING JOURNAL Volume 23 Issue 6, ISSN 0125-8281 (http://www.engj.org/)
provided information before inspection, the information is useful for searching and decision making. Therefore, the speed and accuracy increased in the visual inspection. The result was consistent with those of previous studies (Deepthi, Greenstein, and Gramopadhye [10], and Drury [26]). 4.3. Results of the Study of the Effective Visual Inspection Strategy with Screen Display
Technique in Phase III. The data were collected from the pre- and post-visual inspection performance tests ( search time and percentage of defects detected). One-way ANOVA was used to determine whether participant performance of visual inspection was significantly different by comparing the mean search time and mean percentage of defects detected for each of the screen display techniques: static, dynamic, hybrid, and no screen display. The t-test was used to compare participant performance in visual inspection between pre-and post-visual inspection performance tests to find the effectiveness of the visual inspection strategy.
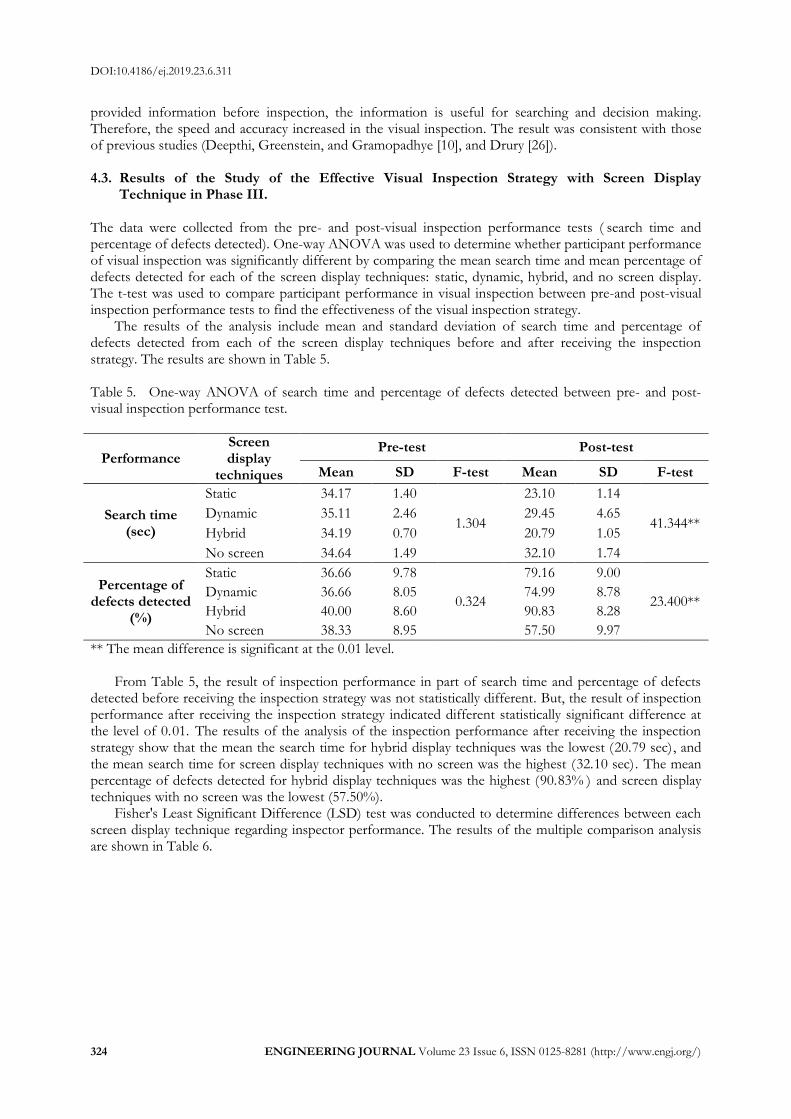
The results of the analysis include mean and standard deviation of search time and percentage of defects detected from each of the screen display techniques before and after receiving the inspection strategy. The results are shown in Table 5. Table 5. One-way ANOVA of search time and percentage of defects detected between pre- and post-visual inspection performance test.
Performance Screen display
techniques
Pre-test Post-test
Mean SD F-test Mean SD F-test
Search time (sec)
Static 34.17 1.40
1.304
23.10 1.14
41.344** Dynamic 35.11 2.46 29.45 4.65
Hybrid 34.19 0.70 20.79 1.05
No screen 34.64 1.49 32.10 1.74
Percentage of defects detected
(%)
Static 36.66 9.78
0.324
79.16 9.00
23.400** Dynamic 36.66 8.05 74.99 8.78
Hybrid 40.00 8.60 90.83 8.28
No screen 38.33 8.95 57.50 9.97
** The mean difference is significant at the 0.01 level.
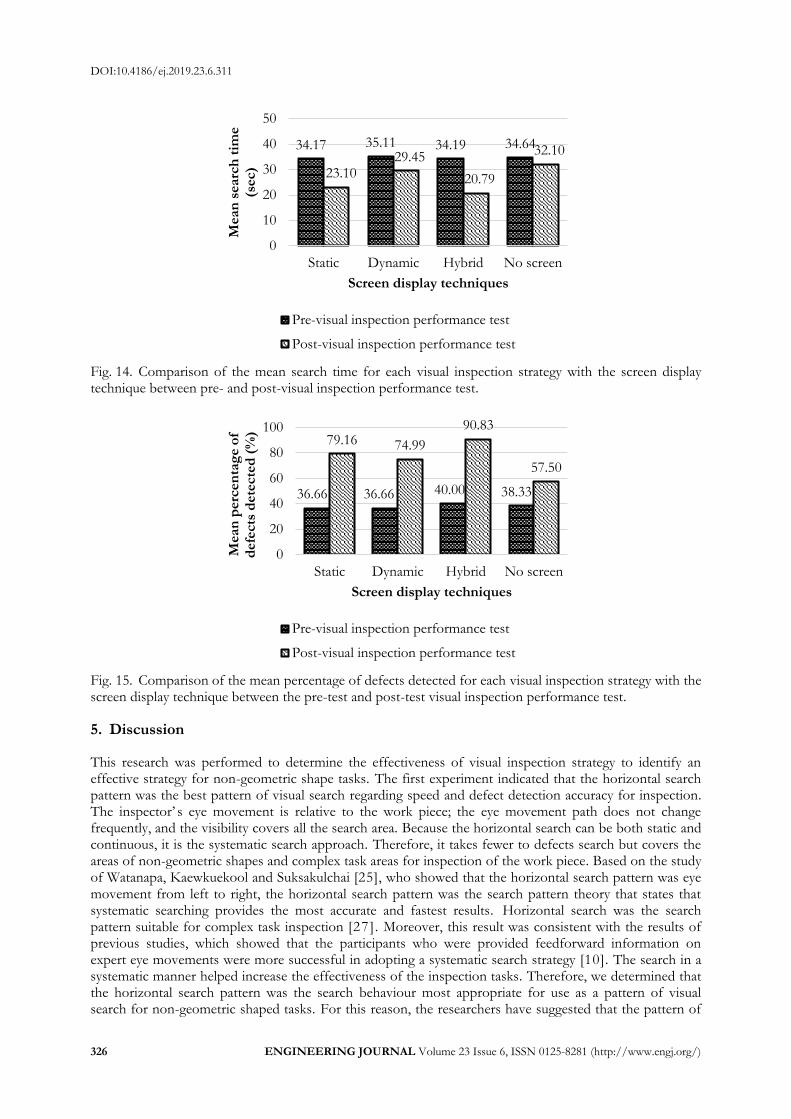
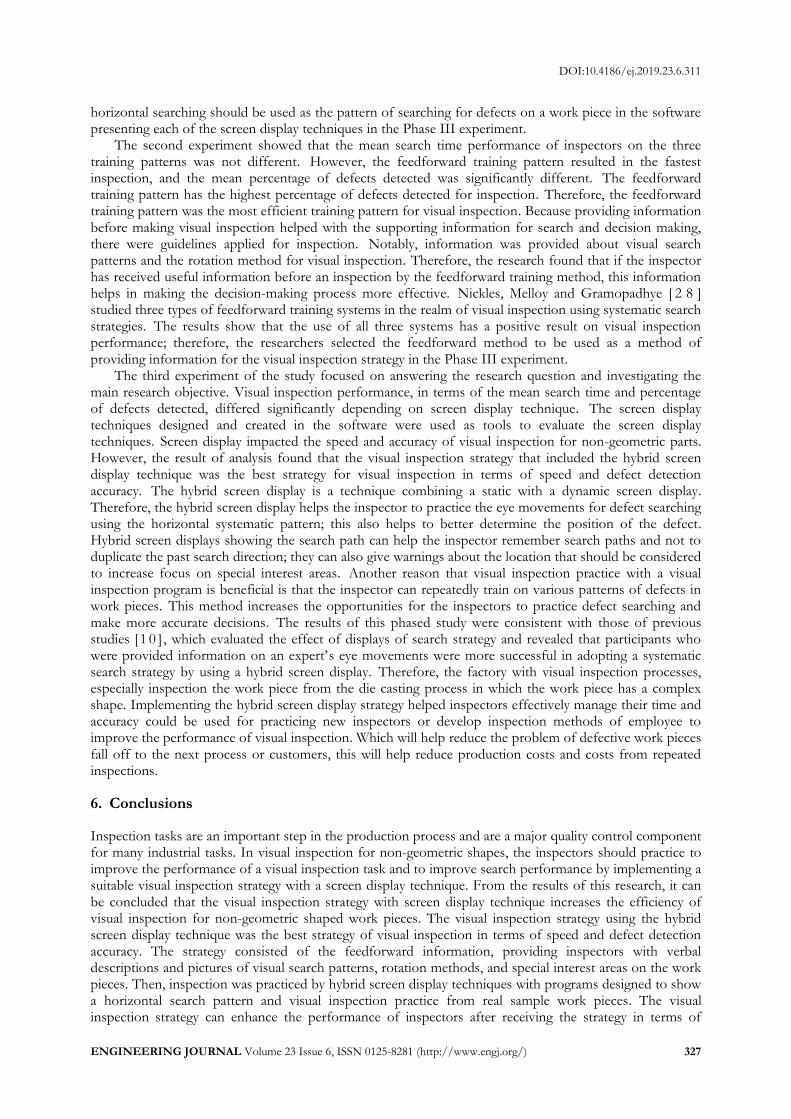
From Table 5, the result of inspection performance in part of search time and percentage of defects detected before receiving the inspection strategy was not statistically different. But, the result of inspection performance after receiving the inspection strategy indicated different statistically significant difference at the level of 0.01. The results of the analysis of the inspection performance after receiving the inspection strategy show that the mean the search time for hybrid display techniques was the lowest (20.79 sec) , and the mean search time for screen display techniques with no screen was the highest (32.10 sec). The mean percentage of defects detected for hybrid display techniques was the highest (90.83% ) and screen display techniques with no screen was the lowest (57.50%).
Fisher's Least Significant Difference (LSD) test was conducted to determine differences between each screen display technique regarding inspector performance. The results of the multiple comparison analysis are shown in Table 6.
DOI:10.4186/ej.2019.23.6.311
ENGINEERING JOURNAL Volume 23 Issue 6, ISSN 0125-8281 (http://www.engj.org/) 325
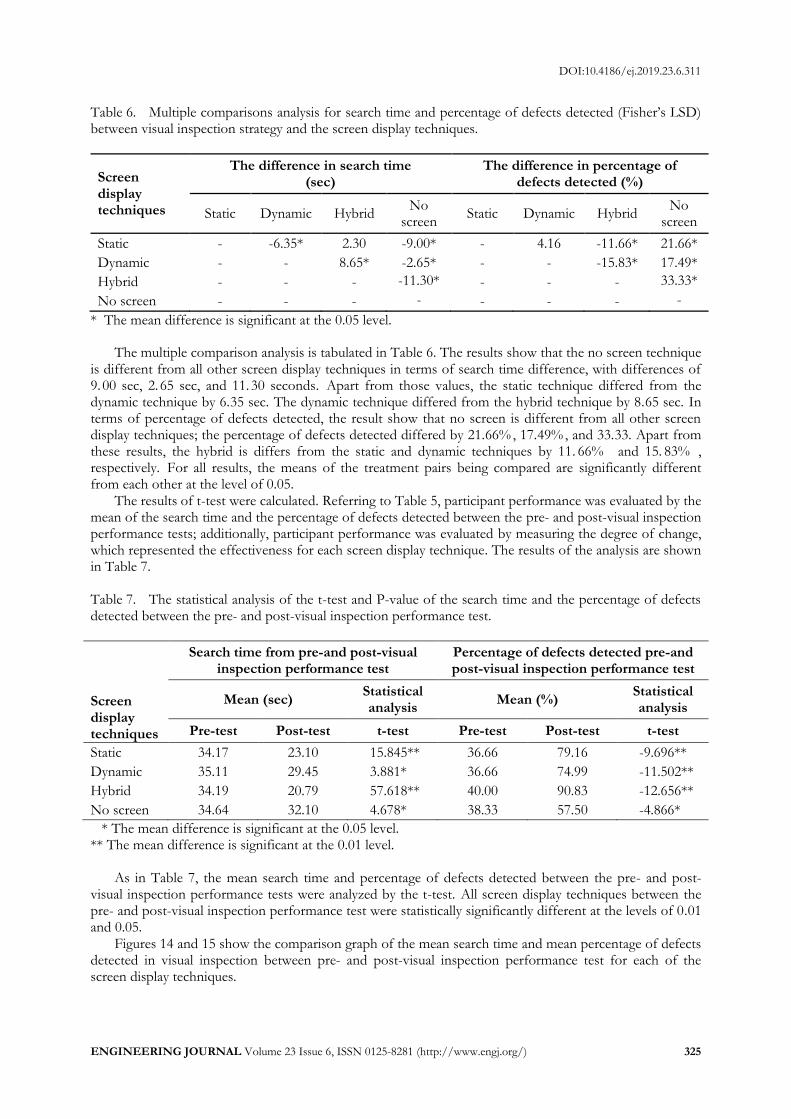
Table 6. Multiple comparisons analysis for search time and percentage of defects detected (Fisher’s LSD) between visual inspection strategy and the screen display techniques.
Screen display techniques
The difference in search time (sec)
The difference in percentage of defects detected (%)
Static Dynamic Hybrid No
screen Static Dynamic Hybrid
No screen
Static - -6.35* 2.30 -9.00* - 4.16 -11.66* 21.66*
Dynamic - - 8.65* -2.65* - - -15.83* 17.49*
Hybrid - - - -11.30* - - - 33.33*
No screen - - - - - - - -
* The mean difference is significant at the 0.05 level.
The multiple comparison analysis is tabulated in Table 6. The results show that the no screen technique is different from all other screen display techniques in terms of search time difference, with differences of 9.00 sec, 2.65 sec, and 11.30 seconds. Apart from those values, the static technique differed from the dynamic technique by 6.35 sec. The dynamic technique differed from the hybrid technique by 8.65 sec. In terms of percentage of defects detected, the result show that no screen is different from all other screen display techniques; the percentage of defects detected differed by 21.66% , 17.49% , and 33.33. Apart from these results, the hybrid is differs from the static and dynamic techniques by 11. 66% and 15. 83% , respectively. For all results, the means of the treatment pairs being compared are significantly different from each other at the level of 0.05.
The results of t-test were calculated. Referring to Table 5, participant performance was evaluated by the mean of the search time and the percentage of defects detected between the pre- and post-visual inspection performance tests; additionally, participant performance was evaluated by measuring the degree of change, which represented the effectiveness for each screen display technique. The results of the analysis are shown in Table 7. Table 7. The statistical analysis of the t-test and P-value of the search time and the percentage of defects detected between the pre- and post-visual inspection performance test.
Screen display techniques
Search time from pre-and post-visual inspection performance test
Percentage of defects detected pre-and post-visual inspection performance test
Mean (sec) Statistical analysis
Mean (%) Statistical analysis
Pre-test Post-test t-test Pre-test Post-test t-test
Static 34.17 23.10 15.845** 36.66 79.16 -9.696**
Dynamic 35.11 29.45 3.881* 36.66 74.99 -11.502**
Hybrid 34.19 20.79 57.618** 40.00 90.83 -12.656**
No screen 34.64 32.10 4.678* 38.33 57.50 -4.866*
* The mean difference is significant at the 0.05 level. ** The mean difference is significant at the 0.01 level.
As in Table 7, the mean search time and percentage of defects detected between the pre- and post-visual inspection performance tests were analyzed by the t-test. All screen display techniques between the pre- and post-visual inspection performance test were statistically significantly different at the levels of 0.01 and 0.05.
Figures 14 and 15 show the comparison graph of the mean search time and mean percentage of defects detected in visual inspection between pre- and post-visual inspection performance test for each of the screen display techniques.
DOI:10.4186/ej.2019.23.6.311
326 ENGINEERING JOURNAL Volume 23 Issue 6, ISSN 0125-8281 (http://www.engj.org/)
Fig. 14. Comparison of the mean search time for each visual inspection strategy with the screen display technique between pre- and post-visual inspection performance test.
Fig. 15. Comparison of the mean percentage of defects detected for each visual inspection strategy with the screen display technique between the pre-test and post-test visual inspection performance test. 5. Discussion This research was performed to determine the effectiveness of visual inspection strategy to identify an effective strategy for non-geometric shape tasks. The first experiment indicated that the horizontal search pattern was the best pattern of visual search regarding speed and defect detection accuracy for inspection. The inspector’ s eye movement is relative to the work piece; the eye movement path does not change frequently, and the visibility covers all the search area. Because the horizontal search can be both static and continuous, it is the systematic search approach. Therefore, it takes fewer to defects search but covers the areas of non-geometric shapes and complex task areas for inspection of the work piece. Based on the study of Watanapa, Kaewkuekool and Suksakulchai [25], who showed that the horizontal search pattern was eye movement from left to right, the horizontal search pattern was the search pattern theory that states that systematic searching provides the most accurate and fastest results. Horizontal search was the search pattern suitable for complex task inspection [27 ]. Moreover, this result was consistent with the results of previous studies, which showed that the participants who were provided feedforward information on expert eye movements were more successful in adopting a systematic search strategy [10]. The search in a systematic manner helped increase the effectiveness of the inspection tasks. Therefore, we determined that the horizontal search pattern was the search behaviour most appropriate for use as a pattern of visual search for non-geometric shaped tasks. For this reason, the researchers have suggested that the pattern of
34.17 35.11 34.19 34.64
23.1029.45
20.79
32.10
0
10
20
30
40
50
Static Dynamic Hybrid No screen
Mean
searc
h t
ime
(sec)
Screen display techniques
Pre-visual inspection performance test
Post-visual inspection performance test
36.66 36.66 40.00 38.33
79.16 74.99
90.83
57.50
0
20
40
60
80
100
Static Dynamic Hybrid No screen
Mean
perc
en
tag
e o
f d
efe
cts
dete
cte
d (
%)
Screen display techniques
Pre-visual inspection performance test
Post-visual inspection performance test
DOI:10.4186/ej.2019.23.6.311
ENGINEERING JOURNAL Volume 23 Issue 6, ISSN 0125-8281 (http://www.engj.org/) 327
horizontal searching should be used as the pattern of searching for defects on a work piece in the software presenting each of the screen display techniques in the Phase III experiment.
The second experiment showed that the mean search time performance of inspectors on the three training patterns was not different. However, the feedforward training pattern resulted in the fastest inspection, and the mean percentage of defects detected was significantly different. The feedforward training pattern has the highest percentage of defects detected for inspection. Therefore, the feedforward training pattern was the most efficient training pattern for visual inspection. Because providing information before making visual inspection helped with the supporting information for search and decision making, there were guidelines applied for inspection. Notably, information was provided about visual search patterns and the rotation method for visual inspection. Therefore, the research found that if the inspector has received useful information before an inspection by the feedforward training method, this information helps in making the decision-making process more effective. Nickles, Melloy and Gramopadhye [ 2 8 ] studied three types of feedforward training systems in the realm of visual inspection using systematic search strategies. The results show that the use of all three systems has a positive result on visual inspection performance; therefore, the researchers selected the feedforward method to be used as a method of providing information for the visual inspection strategy in the Phase III experiment.
The third experiment of the study focused on answering the research question and investigating the main research objective. Visual inspection performance, in terms of the mean search time and percentage of defects detected, differed significantly depending on screen display technique. The screen display techniques designed and created in the software were used as tools to evaluate the screen display techniques. Screen display impacted the speed and accuracy of visual inspection for non-geometric parts. However, the result of analysis found that the visual inspection strategy that included the hybrid screen display technique was the best strategy for visual inspection in terms of speed and defect detection accuracy. The hybrid screen display is a technique combining a static with a dynamic screen display. Therefore, the hybrid screen display helps the inspector to practice the eye movements for defect searching using the horizontal systematic pattern; this also helps to better determine the position of the defect. Hybrid screen displays showing the search path can help the inspector remember search paths and not to duplicate the past search direction; they can also give warnings about the location that should be considered to increase focus on special interest areas. Another reason that visual inspection practice with a visual inspection program is beneficial is that the inspector can repeatedly train on various patterns of defects in work pieces. This method increases the opportunities for the inspectors to practice defect searching and make more accurate decisions. The results of this phased study were consistent with those of previous studies [1 0 ] , which evaluated the effect of displays of search strategy and revealed that participants who were provided information on an expert’s eye movements were more successful in adopting a systematic search strategy by using a hybrid screen display. Therefore, the factory with visual inspection processes, especially inspection the work piece from the die casting process in which the work piece has a complex shape. Implementing the hybrid screen display strategy helped inspectors effectively manage their time and accuracy could be used for practicing new inspectors or develop inspection methods of employee to improve the performance of visual inspection. Which will help reduce the problem of defective work pieces fall off to the next process or customers, this will help reduce production costs and costs from repeated inspections. 6. Conclusions Inspection tasks are an important step in the production process and are a major quality control component for many industrial tasks. In visual inspection for non-geometric shapes, the inspectors should practice to improve the performance of a visual inspection task and to improve search performance by implementing a suitable visual inspection strategy with a screen display technique. From the results of this research, it can be concluded that the visual inspection strategy with screen display technique increases the efficiency of visual inspection for non-geometric shaped work pieces. The visual inspection strategy using the hybrid screen display technique was the best strategy of visual inspection in terms of speed and defect detection accuracy. The strategy consisted of the feedforward information, providing inspectors with verbal descriptions and pictures of visual search patterns, rotation methods, and special interest areas on the work pieces. Then, inspection was practiced by hybrid screen display techniques with programs designed to show a horizontal search pattern and visual inspection practice from real sample work pieces. The visual inspection strategy can enhance the performance of inspectors after receiving the strategy in terms of
DOI:10.4186/ej.2019.23.6.311
328 ENGINEERING JOURNAL Volume 23 Issue 6, ISSN 0125-8281 (http://www.engj.org/)
search time. This strategy will make visual inspection performance 13.40 seconds faster per piece and increase accuracy by 50.83%. In conclusion, we found that the most effective strategy for visual inspection suitable for non-geometric shaped work pieces is the visual inspection strategy with a hybrid screen display technique, which increased the performance of the visual inspection and improved the search and decision-making ability of the inspectors. The results of the study highlight effective strategies for the inspection of defects of non-geometric work pieces, including the software for inspection practices. The applications of the visual inspection strategy with hybrid screen display technique can be used as a guide for practice before the actual inspection to be used as a strategy for training employees to be more effective in inspection for defects, especially defect inspection of non-geometric or complex shapes such as automotive parts, aircraft parts, etc.
Finally, future research should develop the “Visual Inspection Program; V.I. Program”, in order to increase the number of work pieces for visual inspection practice to have inspection parts that are more diverse and more complex shapes. To increase program capabilities and increase the ability to visual inspection of the inspector. Researcher plan to develop the method of data collection of eye movements direction for defect search, in order to measure process of the inspector’s eye movements such as fixation time, numbers of fixations, sequential indices or scan paths and a number and distance of eye movements in the horizontal, vertical or diagonal directions, etc. It is interesting information to be used to develop visual inspection strategies for other complex shapes work piece.
Acknowledgements
The authors wish to thank Sue Industrial Co., Ltd. for valuable data and support for example work pieces for experiment. This research is supported by Department of Learning Innovation and Technology, and Department of Production Technology Education, Faculty of Industrial Education and Technology, King Mongkut’s University of Technology Thonburi for facilitating the data collection.
References [1] R. T. Chin and C. A. Harlow, “Automated visual inspection: A survey,” IEEE Transactions on Pattern
Analysis and Machine Intelligence, vol. 4, no. 6, pp. 57-73, Jun. 1982. [2] T. J. Gallwey and C. G. Drury, “Task complexity in visual inspection,” The Journal of the Human Factors
and Ergonomics, vol. 28, no. 5, pp. 595-606, Oct. 1986. [3] J. E. See, “Visual inspection: A review of the literature,” Sandia National Laboratories, United States
of America, pp. 13, 30, 53, 59, 2012. [4] C. G. Drury, F. W. Spencer, and D. L. Schurman, “Measuring human detection performance in
aircraft visual inspection,” in Proceedings of the Human Factors and Ergonomics Society 41st Annual Meeting, vol. 41, no. 1, pp. 304-308, Oct. 1997.
[5] C. G. Drury and P. Prabhu, “Information requirements of aircraft inspection: Framework and Analysis,” International Journal of Human-Computer Studies, vol. 45, no. 6, pp. 679-695, Dec. 1996.
[6] M. James, “A comparison of image inspection modes for a visual search and rescue task,” Behaviour and Information Technology, vol. 33, no. 9, pp. 905-918, Aug. 2014.
[7] A. Watanapa and S. Kaewkuekool, “A comparison of visual inspection training strategies to improve Thai inspector,” in Proceeding of the HAAMAHA 2007 Managing Enterprise of the Future, Poznan, Poland, 2007, pp. 472-475.
[8] S. Sadasivan, J. S. Greenstein, A. K. Gramopadhye, and A. T. Duchowski, “Use of eye movements as feedforward training for a synthetic aircraft inspection task,” in Proceedings of the SIGCHI Conference on Human Factors in Computing Systems, Apr. 2005, pp. 141-149.
[9] T. J. Gallwey, “Evaluation and control of industrial inspection: Part I-Guidelines for the practitioner,” International Journal of Industrial Ergonomics, vol. 22, pp. 37-49, 1998.
[10] N. Deepthi, J. S. Greenstein, and A. K. Gramopadhye, “Evaluation of the effect of feedforward training displays of Search strategy on visual search performance,” International Journal of Industrial Ergonomics, vol. 36, no. 4, pp. 289-300, Apr. 2006.
[11] G. M. Nickles, B. J. Melloy, and A. K. Gramopadhye, “A comparison of three levels of training designed to promote systematic search behavior in visual inspection,” International Journal of Industrial Ergonomics, vol. 32, no. 5, pp. 139-148, Nov. 2003.

DOI:10.4186/ej.2019.23.6.311
ENGINEERING JOURNAL Volume 23 Issue 6, ISSN 0125-8281 (http://www.engj.org/) 329
[12] C. G. Drury, Sinclair, “Human and machine performance in an inspection task,” Human Factors, vol. 25, no. 4, pp. 391–399, Aug. 1983.
[13] S. J. Swillo and M. Perzyk, “Automatic inspection of surface defects in die castings after Machining,” Archives of Foundry Engineering, vol. 1, no. 3, pp. 231-235, 2011.
[14] B. Zhang, S. L. Cockcroft, D. M. Maijer, J. D. Zhu, and A. B. Phillion, “Casting defects in low-pressure die-cast aluminum alloy wheels,” The Journal of the Minerals, Metals and Materials Society (TMS), vol. 57, no. 11, pp. 36–43, Nov. 2005.
[15] M. A. Jacobs, “Product complexity: A definition and impacts on operations,” MIS/OM/DS Faculty Publications, pp. 1-21, Oct. 2007.
[16] S. Nansaarng, S. Kaewkuekool, and S. Siripattanakunkajorn, “A comparison study of inspector’s performance between regular and complex tasks,” International Journal of Social, Behavioral, Educational, Economic, Business and Industrial Engineering, vol. 3, no. 5, pp. 516-519, 2009.
[17] M. Carrasco, L. Pizarro, and D. Mery, “Visual inspection of glass bottlenecks by multiple-view Analysis,” International Journal of Computer Integrated Manufacturing, vol. 23, no. 10, pp. 925-941, Oct. 2010.
[18] X. Jiang, S. Kaewkuekool, M. T. Khasawneh, S. R. Bowling, A. K. Gramopadhye, and B. J. Melloy, “Communication between Humans and Machines in a Hybrid Inspection System,” in IIE Annual Conference. Proceedings, 2003, pp. 1-6.
[19] J. Xiaochun, J. Bingham, R. Master, and B. J. Melloy, “Visual inspection simulator for hybrid environments,” The International Journal of Industrial Engineering: Theory, Applications and Practice, vol. 9, no. 2, pp. 162-173, Jun. 2002.
[20] P. Rao, S. R. Bowling, M. T. Khasawneh, A. K. Gramopadhye, and B. J. Melloy, “Impact of training standard complexity on inspection performance,” Human Factors and Ergonomics in Manufacturing and Service Industries, vol. 16, no. 2, pp. 109-132, Mar. 2006.
[21] S. Nansaarng, S. Kaewkuekool, A. Watanapa, and P. Lerthiranphanya, “A comparative study of the effectiveness of trained inspectors in different workloads between feed forward and feedback training,” International Journal of Social, Behavioral, Educational, Economic, Business and Industrial Engineering, vol. 3, no. 5, pp. 524-528, 2009.
[22] G. M. Nickles, V. Sacrez, and A. K. Gramopadhye, “Can we train humans to be systematic inspectors,” in Proceedings of the Human Factors and Ergonomics Society 42nd Annual Meeting, Santa Monica, CA, 1998, pp. 1165-1169.
[23] S. Kaewkuekool, “A study of inspector’s behavior for stopping strategies as multiple-target search, WSEAS Transactions on Advances in Engineering Education, vol. 5, no. 3, pp. 152-157, Mar. 2008.
[24] P. Lerthiranphanya, “The effective comparison of feedforward training of visual defect inspection patterns in welding,” in Proceedings of the 10th SEATUC Symposium, Feb. 2016, p. 222.
[25] A. Watanapa, S. Kaewkuekool, and S. Suksakulchai, “Systematic search for visual inspection on a 3-dimensional simulation model,” Journal of Engineering and Applied Sciences, vol. 6, no. 4, pp. 237-241, 2011.
[26] C. G. Drury, “The information environment in inspection,” in Proceedings of the Second International Conference on Human Factors in Aging Aircraft., Biotechnology, Inc., Falls Church, Virginia, 1989.
[27] A. J. Clemons, “Training methods for visual inspection tasks,” Iowa State University Ames, Iowa, pp. 16-19, 2013.
[28] G. M. Nickles, B. J. Melloy, and A. K. Gramopadhye, “A comparison of three levels of training designed to promote systematic search behavior in visual inspection,” International Journal of Industrial Ergonomics, vol. 32, no. 5, pp. 331-339, Nov. 2003.