Embed Size (px)
Citation preview

DOT/FAA/AR-96/65
Office of Aviation ResearchWashington, D.C. 20591
Visual Inspection ResearchProject Report on BenchmarkInspections
September 1996
Final Report
This document is available to the U.S. public through the National Technical Information Service, Springfield, Virginia 22161.

U.S. Department of TransportationFederal Aviation Administration
NOTICE
This document is disseminated under the sponsorship of the U.S.Department of Transportation in the interest of information exchange.The United States Government assumes no liability for the contents oruse thereof. The United States Government does not endorseproducts or manufacturers. Trade or manufacturer's names appearherein solely because they are considered essential to the objective ofthis report.
iv

Technical Report Documentation Page1. Report No.
DOT/FAA/AR-96/65
2. Government AccessionNo.
3. Recipient's Catalog No.
18. Distribution Statement
This documentis available tothe publicthrough theNationalTechnicalInformationService (NTIS),Springfield,Virginia 22161.
19. Security Classif. (of this report)
Unclassified 20. Security Classif. (of thispage)
Unclassified
21. No. of Pages
5922. Price
Form DOT F1700.7 (8-72) Reproduction of completed page authorized

vi
PREFACE
The Aging Aircraft Nondestructive Inspection Validation Center (AANC) was established atSandia National Laboratories by the Federal Aviation Administration (FAA) in August 1991.This center is dedicated to the study and validation of nondestructive inspection techniques andtechnologies and is housed in a hangar at the Albuquerque International Airport. The AANCpossess a number of aircraft, aircraft parts or components, and specially constructed test piecesfor this purpose.
The FAA Interagency Agreement, which established the AANC, provided the followingsummary tasking statement: “The task Assignments will call for Sandia to support technologytransfer, technology assessment, technology validation, data correlation, and automationadaptation as ongoing processes.” In short, Sandia National Laboratories has been asked topursue research to improve nondestructive inspection (NDI) for the aging aircraft program.Recognizing the importance of visual inspection in the maintenance of the civil air fleet, theAANC established a Visual Inspection Reliability Program. This report presents the results ofthe Benchmark phase of that program. The Benchmark consisted of obtaining inspection resultsfrom twelve experienced inspectors on AANC’s Boeing 737. All the inspectors used the samejob cards and inspected the same areas of the test bed at the AANC.
Various organizations have helped the AANC in planning and executing the Benchmark phasereported here. The principle investigator at the AANC was Floyd Spencer. Assisting in theprogram and in the writing of this document was Donald Schurman, formerly of ScienceApplications International Corporation; Colin Drury, State University of New York at Buffalo;Ron Smith and Geoff Worrall, AEA Technology.
We especially thank the Inspection Network members of the Air Transportation of America(ATA) for their assistance and guidance during the planning phases of this Benchmarkexperiment. Special thanks to Steve Erickson, formerly of the ATA; Bob Scoble, UnitedAirlines; Roy Weatherbee, USAir; John Spiciarich, TWA; Mike Guiterrez, Federal Express; andHugh Irving, Delta; for attending meetings and providing direct input. Ward Rummel of MartinMarietta, also contributed to the planning.
Any exercise of this nature would have no hope of success without the willing participation ofthe airline inspectors who not only spent two days performing inspections and answeringquestions but also allowed themselves to be videotaped. A very special thanks to the twelveinspectors that participated in the Benchmark inspections. They were employed at ContinentalAirlines, Delta Airlines, United Airlines, and USAir, and we thank their management for theirassistance in obtaining the services of the inspectors.
Thanks are also extended to John Goglia and the International Association of Machinists andAerospace Workers (IAM) District 141 Flight Safety Committee. Twenty-four members of thecommittee graciously volunteered an hour of their time to participate in a flashlight/crackdetection experiment while touring the AANC. Thanks are also extended to Pat Walter, TexasChristian University, who, at the inception of the program, was the manager of the AANC and

was instrumental in establishing the program. Chris Smith, William J. Hughes Technical Center,was the technical monitor for the project and assisted throughout the project.
viii

TABLE OF CONTENTS
Page
EXECUTIVE SUMMARY
1. INTRODUCTION
1.1 Background1.2 Definition of Visual Inspection1.3 Visual Inspection Research
1.3.1 Visual Search¾General1.3.2 Aircraft Inspection
1.4 Benchmark Research1.5 Flashlight Lens Experiment
2. DESIGN OF BENCHMARK EXPERIMENT
2.1 Test Bed2.2 Flaw Types2.3 Task Types2.4 Job Card Descriptions2.5 Inspectors2.6 Inspection Conditions
2.6.1 Constant Conditions2.6.2 Task and Equipment Conditions
3. IMPLEMENTATION OF BENCHMARK EXPERIMENT
3.1 Schedules and Duration3.2 Environmental Conditions3.3 Data Collection
3.3.1 Inspection Performance Data3.3.2 Inspector Characteristics Data
4. DESIGN AND IMPLEMENTATION OF FLASHLIGHT LENS EXPERIMENT
5. RESULTS
5.1 Job Card Times5.2 Inspection Flaw Findings

5.2.1 EC Panels¾Benchmark5.2.2 EC Panels¾Benchmark Video Analysis5.2.3 EC Panels¾Light Shaping Diffuser Flashlight Lens5.2.4 Tie-Clip Inspections¾On Aircraft5.2.5 Flaws¾On Aircraft5.2.6 Corrosion¾On Aircraft
5.3 Inspector Differences5.4 Job Card Ratings 375.5 Observations of Inspection Techniques
5.5.1 Job Cards and Supporting Materials5.5.2 Systematic Search5.5.3 Knowledge of Chronic Problem Areas5.5.4 Definitions of Boundaries for Inspections5.5.5 Appeal to NDI Instrumentation
5.6 Comparison to Other Studies
6. SUMMARY AND CONCLUSIONS
6.1 Probability of Detection6.2 Search and Decision6.3 Job Card Usage6.4 Visual Inspection Performance Factors
7. REFERENCES
x

LIST OF FIGURES
Figure Page
1 Probability of Detection Curves¾JC 701 by Inspector
2 Ninety Percent Detection Crack Length Versus Time on JC 701
3 Inspection Decision Tree Used in Video Analysis
4 Flashlight Experiment Detection Rates Versus Peripheral Visual Acuity Sort Times
5 Tie-Clip Detects Versus Time to Complete JC 503 26
6 Comparison of JC 701 and Aircraft Flaws Detection Rates 32
7 Tie-Clip Detects Versus Average Job Card Time
8 Inspector Position Versus Peripheral Acuity
9 Inspector Position Versus Years in Aviation
10 Inspection Detail From Service Bulletin Diagram

LIST OF TABLES
Table Page
1 Inspection Times (Minutes) by Job Card and Inspector
2 Summary of Crack Detection in JC 701
3 Probability of Detection Crack Sizes
4 Search and Decision Performance Measures
5 Flashlight Experiment Performance by Job Classification
6 Flashlight Experiment Performance With Lighting and Flashlight Lens Changes
7 JC 503¾Tie-Clip Inspections
8 Aircraft Flaw Detection Performance
9 Report of Major Corrosion Areas by Each Inspector
10 Inspector Background Summary
11 Categorization of Inspector Job Card Perceptions
xii

EXECUTIVE SUMMARY
Visual inspection is the first line of defense for safety-related failures on aircraft and provides theleast expensive and quickest method of assessing the condition of an aircraft and its parts. Assuch, its reliability should be high and well-characterized. This report describes the BenchmarkExperiment of the Visual Inspection Research Program performed at the Federal AviationAdministration’s (FAA’s) Aging Aircraft Nondestructive Inspection Validation Center (AANC)at Sandia Laboratories. The purpose of the experiment was to provide a benchmark measure ofcapability for visual inspections performed under conditions that are realistically similar to thoseusually found in major airline maintenance facilities.
Most of the research related to visual inspection has been in the area of visual search conductedfor industrial products and medical images. This research is reviewed here, but the intent was totarget aircraft specific visual inspections over a variety of tasks. The tasks chosen representdifferent accessibility levels, as well as different visual complexity levels.
The research described here is the first part of a coordinated effort to examine the broad range ofvisual inspection requirements. It is neither completely a laboratory study nor completely fieldobservations. Instead, it provides a link between field and laboratory by using visual inspectiontasks on a real airplane combined with other more controlled tasks. The AANC has a Boeing737 aircraft as a test bed. In addition, the AANC has a sample library of well-characterized flawsin aircraft components or simulated components that allow cross-linking of the aircraft resultswith well understood flaw characteristics. Both of these resources were used for this research.
Twelve inspectors from four different airlines served as the subjects of the experiment. Eachsubject spent two days at the AANC performing 10 different inspection tasks. Data collectionconsisted both of notes taken by monitors and videotaping of the inspection tasks. Performanceresults are summarized and correlated with background variables gathered on each inspector.
Substantial inspector-to-inspector variation in performance was observed. This observation hasdirect bearing on determining sample sizes necessary to study the impact of visual inspectionfactors or the effectiveness of specific interventions. On a specific task of looking for cracksfrom beneath rivet heads the 90 percent detection rate crack length for 11 inspectors ranged from0.16 to 0.36 inch, with the 90 percent detection rate for the twelfth inspector being 0.91 inch.Similar variations were observed in other inspection tasks.
Performance levels were task specific. Thus, an inspector’s good performance (relative to otherinspectors) on one task does not necessarily indicate a relatively good performance on othertasks. The search component, as opposed to the decision component, of visual inspection wasthe larger factor in determining performance levels for most of the inspectors.
Major factors associated with performance in this research were the use of job cards,thoroughness as reflected by total time, peripheral visual acuity, and general aviation experience.Specifically, some of the inspectors used job cards only to define the inspection task area. Othersused the information contained within the job card to direct their attention to likely flawlocations. The inspectors with lower peripheral visual acuity scores showed a decline inperformance on certain tasks. Better performances were observed among inspectors with moreaviation experience as well as those that were more deliberate in their inspections as reflected bythe time taken on all tasks.
ix/x
1. INTRODUCTION.
This report describes a Benchmark visual inspection experiment and a flashlight lens evaluationexperiment. Both of these activities were carried out as part of the Visual Inspection ResearchProgram being conducted at FAA’s Aging Aircraft Nondestructive Inspection Validation Center(AANC) at Sandia Laboratories.
The Benchmark experiment provided a measure of capability for visual inspections performedunder conditions that are realistically similar to those found in major airline maintenancefacilities. The characterization of the visual inspection process from this benchmark serves as ameasure to compare performance under other conditions. The variations observed in theBenchmark experiment also enable an assessment of the amount of testing necessary to measureinspection performance effects due to environments, conditions, and instructions.
The flashlight lens experiment was a follow-on to a flashlight lens development programdescribed by Shagam [1]. The subjects for this experiment were drawn from aircraft inspectorsand mechanics. The test specimens used in the flashlight lens experiment were also used in theBenchmark experiment. The intent of the flashlight lens experiment was to study the len’s effecton subject’s performance. However, due to the similarity of subject populations and thecommonality of test specimens, this experiment complements the larger Benchmark experimentand results are included in this report.
1.1 BACKGROUND.
Over 80 percent of inspections on large transport category aircraft are visual inspections [2].Small transport and general aviation aircraft rely on visual inspection techniques even moreheavily than do large transport aircraft. Visual inspection, then, is the first line of defense forsafety-related failures on aircraft and provides the least expensive and quickest method ofassessing the condition of an aircraft and its parts [3]. Therefore, accurate and proficient visualinspection is crucial to the continued safe operation of the air fleet.
1.2 DEFINITION OF VISUAL INSPECTION.
Visual inspection has been defined in one FAA publication [3] as, “... the process of using theeye, alone or in conjunction with various aids, as the sensing mechanism from which judgmentsmay be made about the condition of a unit to be inspected.” This definition is good¾as far as itgoes, however, experience in visual inspection and discussion with experienced visual inspectorsreveals that this definition falls short. Not only does visual inspection involve the use of the“eye, alone or with various aids” but also involves, shaking, listening, feeling, and sometimeseven smelling the aircraft and its components.
Thus, the definition of visual inspection must include the use of the other senses as well. Visualinspection (and other types of inspection, as well) consists of at least two major processes [4].The first is a search process that, in visual inspection, uses most of the senses of the human body.The second process is a process of combining relevant knowledge, sensory input, and pertinent
1

logical processes to provide an identification that some anomaly or pattern represents a flaw anda decision that this flaw is of the nature to pose a risk to the continued successful operation of theaircraft or aircraft part.
For the Visual Inspection Research Program, we expand the definition of “Visual Inspection” toinclude other sensory and cognitive processes that are used by inspectors. We feel that neglect ofthese other systems provides an artificially narrow picture of the rich range of behaviors involvedin visual inspection. Thus, the Visual Inspection Research Program uses the following definitionof Visual Inspection:
Visual inspection is the process of examination and evaluation of systems andcomponents by use of human sensory systems aided only by such mechanicalenhancements to sensory input as magnifiers, dental picks, stethoscopes, and thelike. The inspection process may be done using such behaviors as looking,listening, feeling, smelling, shaking, and twisting. It includes a cognitivecomponent wherein observations are correlated with knowledge of structure andwith descriptions and diagrams from service literature.
1.3 VISUAL INSPECTION RESEARCH.
This section provides an abbreviated summary of previous research related to visual search ingeneral and to aircraft inspection in particular.
1.3.1 Visual Search ¾ General.
The basis for scientific research applied to visual inspection tasks has been primarily the study ofvisual search. This research has attempted to extrapolate the findings of laboratory-based studiesto visual inspection tasks that are found in the quality assessment systems of most manufacturingindustries.
As a summary of this research, visual search is considered to be a series of short fixations by theeye during which information is gathered. These fixations are interspersed by rapid eyemovements in which the area of fixation is moved to another part of the object being viewed.The area that surrounds the fixation point, and from which the eye collects information, is calledthe visual lobe. (This visual lobe is elliptical but is treated as a circle for convenience.) Theboundary is defined by the angle from the center of fixation which allows a 50 percent detectionrate. The size of the target being searched for, the level of contrast, and the luminance level ofthe background all directly affect the detection rate of a target [5].
If targets are changed to provide a larger surface area (while maintaining aspect ratios), theprobability of detection is improved. Increased edge sharpness also has the same effect. If alarger region is to be searched, in a fixed time, then the probability of detection is reduced. Inaddition, if the prior expectation of a target occurring is increased, so does the probability ofdetection [6].
2

The speed at which visual search (target detection and localization) can take place is affected byfour factors [7]:
· Number of elements to be searched, i.e., as the number of items goes up so does searchtime, relatively independent of element spacing. Wide dispersal of elementsincreases scanning time. However, when items are closely packed the highdensity of nontarget elements also has a retarding influence on search. Thus,scanning and visual clutter trade off as target dispersion is varied.
· Search rate increases as the total amount of information in the display increases.Information is increased by increasing the number of items to be searched, thenumber of variable stimulus dimensions per item, or the number of possibletargets. However, the increase in search rate (items per unit time) with moreitems does not compensate for the increased time needed to search more items.As a result total search time is increased by including more items or more relevantdimensions per item.
· Searching for one of several targets is slower than searching for one. Some laboratorybased results have not shown this effect if extensive training is given. This wouldsuggest a well trained inspector would not be slowed by greater numbers oftargets to search for, but this is not conclusive [8, 9].
· Number of different stimulus dimensions that can be used to define a target does notaffect speed if they are redundant. For example, color is a more salient dimension than isshape, and thus, searching for blue squares and blue circles can be done as quickly as justsearching for blue squares, as long as nontargets are not blue. However, color willinterfere with perception of other dimensions, such as shape, if it varies independently ofthem.
When time is limited for visual search tasks, it has been shown that fixating patterns adopted bysubjects will be altered [10]. Rather than moving from target to target, subjects will attempt toget a larger visual field and not move the eyes. It has also been demonstrated that experiencedinspectors use a different visual search strategy than do inexperienced inspectors [8], althoughthere is also some evidence to suggest that trained inspectors do not perform more effectivelythan untrained subjects on visual search tasks [9]. Limiting the time (increasing the speed) ofindustrial visual search tasks also reduces the probability of accepting good items while raisingthe probability of rejecting bad items [11].
Conscious direction of attention to specific areas is possible based upon the inspector’s previousexperience. However, beyond this conscious direction, within the visual lobe, an automaticmechanism of selective attention seems to apply with salient target characteristics dominatingattention. In addition to these visual factors, there is evidence that the psychological profile ofsubjects will also have an affect on visual search performance [12].
3

A list of the factors that have been tested and concluded to affect inspection tasks has beencompiled [13]. This list does not identify at what stage within the inspection task these factorsare said to affect the inspection performance however. The identified factors can be broadly splitinto four areas: subject factors, task factors, organizational factors, and physical andenvironmental factors. There have been at least two separate descriptions of the components of visual inspection. Splitzand Drury [14] model visual inspection in two separate stages, search and decision making. Themodel proposes that these two stages are separate and additive and goes on to provideexperimental evidence to support this view.
Megaw’s model suggests that there are four separate stages [15]:
· Search: Scanning item via head and eye and hand movements (moving the object).
· Detect: Identify that the item is different from its ideal state.
· Judgment: Decide whether the difference constitutes a fault according to the standards towhich the task is being performed.
· Output decision: Decide whether to accept or reject and take the appropriate action.
It can be argued that this second view is not different from the first, but rather, that it separatesthe two stages of the first model into two subcomponents (that is, “search” into “search” and“detection” and “decision” into “judgment” and “output decision”).
Studies of eye movement during industrial and medical x-ray inspection [15] have shown:
· Inspection time differences reflect the number of fixations needed to search for and find afault rather than differences in the time of each fixation.
· Fixation times are short in tasks without clear fixation points (e.g., inspection of sheetsteel) and that more experienced inspectors use shorter fixation times. Fixationtime with respect to task complexity has not been well-explored.
· In objects which were manipulated, scan paths were fixed and errors occurred as a resultof sticking to these scan paths.
· Peripheral vision is used for scanning moving objects which subtend a large visual angle.
This body of work provides a foundation on which to base the more applied studies carried out inthis program. As stated above, the previously described work has centered around theories ofvisual search. The summarized work largely reflects the nature of the visual inspection taskscarried out by inspectors in the manufacturing industry, which historically has centered aroundthe visual observation of a limited range of items, for example products or x-ray images. Typical
4

aircraft inspection tasks, however, involve a significantly increased use of other senses and levelof manipulation. Consequently the need for a more applied study has arisen for aircraftinspection tasks.
1.3.2 Aircraft Inspection.
There has been some research investigating aircraft inspection tasks specifically as opposed tovisual inspection in general. There have also been a small number of studies which haveinvestigated the sensitivity of inspectors to the types of tactile cues which are found in aircraftinspection [16, 17, 18]. Three distinct types of visual inspection tasks were highlighted by onesource [19]:
· Detection: For example, identification of a warning light or breaks in a seal. In this typeof task the inspector only needs to see an object against a background.
· Recognition: The inspector needs to detect a stimulus and then discriminate against otherpossibilities. This type of task has a cognitive component as it involves acomparison to decide if what has been observed constitutes a flaw. This maynecessitate better sensory conditions to allow an appropriate level of perception.
· Interpretation: Further actions are necessary following the recognition of stimuli.Knowledge of component function and system integration play a role. This task involvesmuch greater cognitive behavior than simply having a sensory system capable of makinga discrimination necessary for judgment. Visual inspection in aircraft maintenance fallsinto this type, as exemplified by the evaluation of “smoking” rivets where an inspectorwill consider numerous factors, including color and location, to determine if a problemexists.
An overview of the research being undertaken in the area of visual inspection in aircraftmaintenance can be found in reference 20. Areas noted specific to aircraft inspectionperformance include training, information systems design, and international differences [20].These are briefly discussed in the following paragraphs.
· Training: The training of inspectors is a major determinant of inspector performance. Atpresent there is an emphasis on either the classroom for imparting knowledge andthe actual job for imparting skills. Little formal training in visual search is givento aircraft inspectors.
· Information systems design: The information presented to the inspectors can occur inseveral ways. Examples are:
• Directive information (from training and job card)
• Feedforward (types and locations of faults expected on this aircraft at this time)
5

• Feedback (from sample quality control checks of inspected aircraft)
• Error control (error taxonomies are being developed and applied to detailedanalysis of the inspection system [21, 22]).
· International differences: Comparisons between the United Kingdom and the UnitedStates systems of aircraft inspection have also been documented [23].Inspection/maintenance system and hangar floor operations were compared. Differenceswere found, with probably more variability between companies than between the twocountries. Both countries’ work forces were found to be highly motivated.
Organizational factors in airline maintenance were described by Taylor [24]. He concluded thatthe communication of a responsible maintenance role (clear mission statement) within a largercompany is usually missing and that maintenance personnel often lack sufficient technicalknowledge and have little opportunity to improve decision making and problem solvingcapabilities. He also concluded that organizational structures within the airline industryemphasized “functional silos,” with individual departments working to their own limited goals.Since that time (1990) there have been a number of organizational developments in aircraftmaintenance and inspection, often applying Crew Resource Management (CRM) ideas [25].
Research specific to the detection of cracks in aircraft structure was reported by Endoh et al. [26].In that study, factors associated with cracks found in routine maintenance and inspectionactivities for aircraft operated by Japanese airlines were documented over a 3-year period.Factors were studied by generating a normalized cumulative frequency with respect to cracklengths for each level of a given factor and graphically comparing these curves. Endoh’s data arecompared to data from the current study in section 5.6 following a discussion of results for theBenchmark experiment.
1.4 BENCHMARK RESEARCH.
The current research program was formulated to carry out an applied investigation of aircraftvisual inspection using the research summarized in sections 1.3.1 and 1.3.2 to ensure thatappropriate variables were controlled and appropriate measures taken. As implied by theexpanded definition of visual inspection (section 1.2), understanding of the process of visualinspection requires research into the use of other sensory systems in addition to just the visualsystem. Also, both the search and the decision-making aspects of visual inspection requireexamination [4].
The research described here is the first part of a coordinated effort to examine the broad range ofvisual inspection requirements. It is neither completely a laboratory study nor completely fieldobservations. Instead, it provides a link between laboratory and field by using visual inspectionson a real airplane combined with other controlled tasks. The FAA Aging Aircraft NondestructiveInspection Validation Center (AANC) at Sandia Laboratories has a Boeing 737 aircraft test bed.In addition, the AANC has a sample library of aircraft components or simulated components with
6

well-characterized flaws that allows cross-linking of aircraft inspection results with wellunderstood flaw characteristics.
This first experiment was planned as a field benchmark. That is, the intent was to provide abenchmark of visual inspection performance under realistic conditions. This study looked at theperformance and general characteristics of a sample of visual inspectors. Their performanceserves as the control, or benchmark, for comparisons to the manipulated or selectedcharacteristics of inspectors in later studies.
Specifically, the study was done using a representative sample of visual inspectors in aircraftmaintenance facilities, who were asked to look for flaws on the Boeing 737 test bed aircraft inselected, specific areas that roughly corresponded to normal inspection task requirements. Theinspectors were asked to inspect the aircraft for about one and one-half shifts. For the other halfshift, the inspectors were asked to look for flaws on a selected set of samples from the AANCsample library. The implementation and logistics are discussed in section 3.
The Benchmark experiment was designed with the assistance and recommendations of anindustry steering committee. The committee was formed to provide input and advice on theVisual Inspection Research Program (VIRP) in general and on the Benchmark experimentspecifically.
The first planning meeting for the Visual Inspection Research Program (VIRP) was attended byhuman factors specialists from several organizations and AANC specialists in research, aircraftinspection, and optics. The AANC specialists also had close familiarity with the Boeing 737 inthe AANC hangar. This group discussed and developed the broad outline of the VIRP. In broadoutline, the VIRP was to start with an experiment to provide a benchmark of visual inspectionperformance under realistic conditions. Later experiments could be used to test the effectivenessof various interventions on inspection reliability. These interventions might include such actionsas improved lighting systems or devices, improved training, improved job card descriptions,improved working conditions and tools, or inspectors with different backgrounds.
The second meeting was also attended by representatives from the Air Transport Association ofAmerica (ATA), who were members of inspection and maintenance organizations for largetransport carrier fleets. These representatives ensured that practical aspects steered the planningprocess as well as providing realistic reports of conditions and problems of visual inspection fortheir organizations’ fleets. The ATA representatives were briefed on the VIRP broad outline andthe design of the Benchmark experiment. They were also asked to provide input and assistancein determining such factors of the Benchmark as standardized tool kits, structure of job cards,and the choice of initial inspectors.
1.5 FLASHLIGHT LENS EXPERIMENT.
In another Visual Inspection Program project conducted by AANC, an improved flashlight lenswhich had a pattern molded into one surface to act as a diffuser was developed [1]. The effect isto enhance the uniformity of illumination across the output beam of the flashlight, eliminating
7

dark and bright spots. This also necessarily reduced the peak brightness. Prior to the experimentpresented here, evaluation of this lens had been through the measurement of its opticalcharacteristics and tests of acceptability to practicing inspectors [1]. While both of these arenecessary first steps to ensure that the new lens can be used by the industry, they do not addressthe question of performance. Does this lens aid (or possibly hinder) detection of defects? Therehave been a number of evaluations of lighting effectiveness in the literature [27]. Typically,changes in lighting must be quite dramatic to achieve significant gains in inspectionperformance. Merely increasing overall illumination on the task rarely produces performanceimprovements, unless the original level of illumination was extremely low [28].
The choice of representative people to perform the inspections is critical to experiment validity.A half-day tour of the AANC facility by a committee of the International Association ofMachinists and Aerospace Workers (IAM) was accompanied by a request for “hands on”demonstrations. One of the planned demonstrations during their visit was of the light shapingdiffuser flashlight lens. Agreement was obtained from the IAM organizing committee that thehands-on experience of the visiting members would be through their participation in a plannedexperiment to study performance levels associated with the lens in a specific task.
2. DESIGN OF BENCHMARK EXPERIMENT.
2.1 TEST BED.
There were two test beds used in the VIRP Benchmark Experiment. The first was a Boeing 737aircraft, mostly intact and stripped for a D-check, had certain avionics and one engine removed.The aircraft was put in service in 1968 and had 46,358 cycles in more than 38,000 hours of flighttime. It was retired from active service in 1991 after a decision that it would not be economicalto bring the aircraft into compliance with safety requirements and airworthiness directives. Aspart of the activities preparing the B-737 as a test bed for AANC programs, a baseline inspection,consisting of a limited D-check by contract inspectors, was performed. These inspections werecompleted prior to the start of the VIRP studies. The result of this baseline experiment was a listof defects and flaws found on the aircraft. This list was used to determine the inspection areas tobe used in the current and future VIRP studies.
The second test bed consisted of selected flawed specimens from the AANC Sample Library.The samples in the AANC library that were selected were cracked specimen panels and couponsas described by Spencer and Schurman [29]. The samples were well characterized so that thesizes, orientation, location, and distribution of cracks are known. Inspection performance onthese samples can be correlated with crack lengths.
2.2 FLAW TYPES.
Although cracks and corrosion are a major concern in aircraft inspection, they are not the onlyfocus of visual inspection. Out-of-tolerance wear or breakage and fraying are also importantdefects to be detected for safe operation. Identifying wear and tear problems requires detectionof a possibly out-of-tolerance condition followed by measurement of dimensions to determinewhether the dimensions are within tolerance or require repair or replacement.
8
The variety of fault types required to be detected is a major factor influencing performance invisual inspection. Another influencing factor is the difficulty of characterization of many faulttypes. In contrast, the use of nondestructive inspection equipment (such as eddy current andultrasonic) is usually defect specific with faults being characterized along one or two dimensions,such as crack length, crack width, or area of delamination.
In order to evaluate performance across a range of visual inspection conditions, various flawsrequiring a range of behaviors are needed. That is wear and tear defects that require shaking andfeeling of components would be required as well as cracks and corrosion. Also, to gradeperformance, flaws should range from minimally detectable to the trained eye to clearlydetectable by a casual observer.
The baseline inspection of the B-737 documented cracks, corrosion, and other types of flaws. Aclassification scheme was developed to characterize the baseline findings with respect to flawtype as well as with respect to aircraft structure containing the flaws. Flaws within majorcategories (missing parts, wear and tear, corrosion, disbonds and delamination, wrong part/badrepair, cracks) were further classified with respect to the visually observed condition. Forexample, flaws within the “wear and tear” category could be further classified in severalcategories such as loose, frayed, and scratched. Major categories of structure (e.g., skin,fasteners, straps, paints/sealants) as well as subcategories (e.g., internal or external for skins,bolts, rivets or screws for fasteners) were also associated with the various flaws discoveredduring the baseline inspection. This information was part of the criteria used for choosing tasksfor the Benchmark experiment.
2.3 TASK TYPES.
A range of defects in several different locations could involve different levels of physical andvisual accessibility. Tasks were selected to cover a range of accessibility (both visual andphysical). As far as possible, accessibility was systematically varied. There is not a universallyaccepted metric for physical or visual accessibility, so we used a post-inspection debrief to getdifficulty ratings on accessibility from the inspectors.
A second question that was addressed is the problem of visual complexity, which is only looselycorrelated with visual accessibility. Visual complexity refers to the fact that a 1/2-inch-longcrack does not have the same detectability when it is located on a lap-splice of the fuselage aswhen it is located on the inside of a door, surrounded by wire bundles, structural members, andother components. Again, since there is no universally accepted metric for specifying thiscomplexity dimension, the inspectors rated each task for visual difficulty in a post-inspectiondebriefing.
These task types are not the only factors of importance. Other factors include whether the task isa straightforward visual search, requires shaking and listening, requires feeling for excessiveplay, etc. That is the flaw type and component type interact with inspection procedures,component location, etc., to determine task type. The Benchmark experiment was planned tosample a range of these task types.
9
2.4 JOB CARD DESCRIPTIONS.
The consideration of flaw types (section 2.2) as well as task types (section 2.3) and theinformation available from the baseline inspection led to the selection of the following toconstitute the job cards (JC) guiding the inspections of the participating inspectors.
· JC 501 ¾ Midsection Floor. Inspection of the midsection fuselage floor beams from bodystation (BS) 520 to the aft side of BS 727. It included web, chord, stiffeners, seattracks, upper flanges of floor beams, and over-wing stub beams at BS 559, 578,597, 616, and 639.
· JC 502 ¾ Main Landing Gear Support. Inspection of the main landing gear supportfittings for left and right main landing gear support beam and side strutattachments at BS 685, 695, and 706 for cracks and corrosion.
· JC 503 ¾ Midsection Crown (Internal). Inspection of the internal midsection crown areastringers and frames from BS 540 to BS 727A from stringer 6L to 6R and tie-clipsfrom stringer 7L to 7R for cracks and corrosion.
· JC ¾ Galley Doors (Internal) Inspection of the galley door frames, hinges, latches, locks,seals, actuating mechanisms, stops and attachments for cracks, corrosion, andgeneral condition (i.e., wear, deterioration). (The galley doors are the two doorson the right side of the aircraft.)
· JC 505 ¾ Rear Bilge (External). Inspection of the rear external belly area from BS 727 toBS 907 between stringers 25R and 25L, including lap-splices, for bulges in skin,skin cracks, dished/deformed or missing rivet heads, and corrosion.
· JC 506 ¾ Left Forward Upper Lobe. Inspection of the interior of the left fuselage upperlobe from BS 277 to BS 540 and from stringer 17L (floor level) to stringer 4L forcorrosion, cracks, and general condition.
· JC 507 ¾ Left Forward Cargo Compartment. Inspection of the interior of the left fuselagelower lobe from BS 380 to BS 520 from stringer 18L to the keel beam (centerline)for corrosion, cracks, and general condition.
· JC 508/509 ¾ Upper and Lower Rear Bulkhead Y-Ring. Inspection of the aft side of theY-ring of the fuselage bulkhead at BS 1016 (aft pressure bulkhead) includingbulkhead outer ring, Y-frame aft chord, steel strap and fastener locations on allstringers for cracks, corrosion, and accidental damage such as dents, tears, nicks,gouges, and scratches.
· JC 510 ¾ Nose Wheel Well Forward Bulkhead. Inspection of the aft and forward side ofthe nose wheel well forward bulkhead at BS 227.8 for cracks.
10

· JC 701 ¾ Simulated Lap-Splice Panels. Inspection of 38.5 feet of simulated Boeing 737lap-splice in two types of specimens. The two types consisted of one large (8.5 feet long)unpainted panel and 18 small panels, each 20 inches long, that were butted against eachother and presented as a continuous lap-splice. A description of the test specimens isgiven in Spencer and Schurman [29].
The job cards were originally numbered 501 through 510 and 701. Job Cards 508 and 509 wereinspection of the top and bottom rim (Y-ring and fittings) of the aft side of the pressure dome.They were separated because it was felt that the physical discomfort and visual complexity levelswere quite different in the two areas. However, it was found that each job card was so short thatit made little sense to do one part of the pressure dome, climb out of the tail cone, and sometimelater climb back in to do the other part of the pressure dome. So, the two job cards werecombined and were always done together as job card 508/509.
Job Card 502 originally called for inspection of the main landing gear (MLG) support on bothsides of the airplane. However, time considerations for the first inspector indicated that thiswould take too long. Therefore, all the inspectors were asked to inspect only the left side MLGsupport structure. The job card was modified accordingly for subsequent subjects.
2.5 INSPECTORS.
The inspectors in the Benchmark experiment were all qualified as visual inspectors by theirrespective airlines (USAir, United Airlines, Delta Airlines, and Continental Airlines) and wereworking as visual inspectors in their respective facilities. The inspectors from one airline werenot always employed at the same facility; seven different maintenance facilities were representedby the 12 inspectors.
2.6 INSPECTION CONDITIONS.
2.6.1 Constant Conditions.
Some conditions that are known or presumed to affect visual inspection performance werestandardized or held constant for the Benchmark experiment. These conditions included theinspection tasks, work environment, and the tools available for use. Conditions such astemperatures and noise levels were not controlled but were recorded during inspections.
The AANC hangar is generally a low-noise environment, with few other concurrent activities.The hangar is clean. The floor is new asphalt. White drop-cloths were spread under the wheelwells and rear belly of the airplane to simulate lighter-colored concrete and/or painted floors.
2.6.2 Task and Equipment Conditions.
The inspectors were asked to finish each job card in the time that they considered normal andusual on similar jobs at their work location. ATA members of the steering committee assistedVIRP personnel in determining typical times expected for the selected job cards. The inspectorswere assigned the inspections by being handed job cards that were similar to those used in the
11

industry. Multiple copies of each job card were printed. For each job card, each inspector wasgiven a clean copy and could make notes directly on the job card.All inspectors received an identical briefing on the flight and maintenance history of the aircraft.The information was presented on videotape to ensure uniformity. The inspectors wererequested to perform the inspections as if they were working as part of a team doing a D-levelcheck on the aircraft. However, no repairs or destructive examination (drilling out rivets,removing or scraping paint, etc.) were to be made. That is, inspectors were asked to use theirnormal inspection procedures except where those procedures would leave marks or alter thenature of the flaw sites. This was done to keep the experiment conditions as fixed as possiblefrom start to finish. Stickers were provided for marking components or areas of the aircraft, andinspectors were asked to mark flaws with these stickers.A standard toolbox was furnished to each inspector. The toolbox contained a flashlight, dental-type mirror, adjustable angle mirror, 5x and 10x magnifiers, 6-inch scale (marked in mm and1/100 of an inch), and a card of 28 numbered stickers (round, colored dots, about 0.75 inch indiameter). The stickers were used to mark areas called out as containing reportablediscrepancies. Additional cards of numbered stickers were provided to the inspectors as needed.Portable fans, heaters, and area lighting were available for use, just as they would be in mostfacilities. Tasks were selected so that minimal scaffolding was required. Scaffolding wasfurnished¾along with footstools. Ambient light levels and temperatures were measured at thetime of each inspection.
3. IMPLEMENTATION OF BENCHMARK EXPERIMENT.
The complete activities for the Benchmark experiment were detailed ahead of time in a set ofprotocols that provided the briefing and debriefing materials and questionnaires and describedmonitor tasks and activities step by step. That is, the protocols provided a fully proceduralizedjob-performance aid for the monitors as well as the questionnaire forms to be completed withinformation from the inspectors.
Data collection consisted both of notes taken by monitors and videotaping of the inspections.Two monitors were used, one took notes and noted times while the other taped the inspection.These activities were alternated between the monitors during the various job cards performed byeach inspector. Video tapes were used to validate questionable entries in the notes as well as toresolve obvious errors or omissions in the notes. Videotapes of the simulated lap-spliceinspection were also used to separate and analyze search and decision behaviors (section 5.2.2).
3.1 SCHEDULES AND DURATION.
Two inspectors were scheduled per week. The experiment began on January 23, 1995. Twoinspectors were observed that week and two more the next week. The final inspections wereperformed the week of March 20, 1995.Each inspector was allowed 2 days to complete the preinspection questionnaires, the 10inspection job cards, the post-inspection questionnaires, and the psychological tests (which tookabout 2 hours). The job cards were randomized in different orders for each inspector prior to the
12

arrival of the inspectors. Time considerations, especially near the end of the last shift, caused aslight change in the ordering of the job cards¾so that, if the inspector was not going to be able tofinish all the job cards, the same job card would not remain uncompleted for more than oneinspector.
On Job Card 701, the first six inspectors inspected the large panel first, then inspected the smallcoupons. The monitors noticed that the inspectors were moving very slowly on this job card.Both discussion with inspectors (after the shifts were completed) and deduction on the part of themonitors led them to the conclusion that the large panel, with its fewer cracks, was leaving theinspectors wondering just what they were supposed to be looking for. Inspectors tended to speedup after they had seen the first large crack on the coupon set. Therefore, the monitors decided tomove the large panels to the end of the row, so that the last six inspectors looked at the smallcoupons first and then inspected the large panel.
3.2 ENVIRONMENTAL CONDITIONS.
The first group of four inspectors were observed in late January and early February. The first twoinspectors worked in cold conditions, although the weather began to moderate in February and,aside from occasional cold days, the temperature remained pleasant for the rest of the inspectionsinto late March.
Lighting was somewhat typical of a hangar environment. Usually the light level was too low tomeasure with the available light meter (below 100 lux or 10 foot-candles). When the hangardoors were open, however, light levels were as high as 400 lux (40 foot-candles) for tasks on theoutside of the aircraft and approached 1500 lux (150 foot-candles) for the inspection of theartificially cracked panels. Inspectors almost always used the furnished flashlight, providing atleast 400 lux of illumination directly in the flashlight beam.
3.3 DATA COLLECTION.
Two primary types of data were collected. The primary data were the activities and accuracy ofthe inspection itself. The secondary data were characteristics of the inspectors, the environment,or the inspectors’ behaviors that might have value in explaining the accuracy of results obtained.
3.3.1 Inspection Performance Data.
Each inspection started by recording the inspector code, date, time, job card number, hangartemperature, light level at the inspection site, and a description of the position of auxiliary lightsas well as the starting location for the inspection.
Each inspection was recorded on a video tape that was labeled with the inspector code, date, timethe tape was started and ended, and the job card numbers that were on the tape. The videotapingalso contained the date and time recorded on the video. In addition to the videotape, anothermonitor recorded reportable flaws (squawks) and comments on a separate sheet.
13

The recording sheet served several purposes. First, as was explained to the inspectors takingpart, the monitors recorded their findings so that the inspectors did not have to take the time to doso. Thus, no time was consumed by the inspectors writing, since accuracy of recording findingsby the inspectors was not part of the experiment. The second purpose of the comment sheets wasto record pertinent comments made by the inspectors (and their times) that were not part of aspecific finding. Such comments included perceived condition of airplane, customary policy orprocedures at the inspector’s work location, comments about repair adequacy, etc. A thirdpurpose of the comment sheets was to record monitors’ comments about unusual or otherwisenoteworthy actions, behaviors, or occurrences that could be germane to the inspection results.The monitors recorded the time of all comments made to correlate them with the videotaperecordings.
The method of recording inspector findings was determined prior to beginning the experimentbut evolved somewhat during the course of the observations. Originally, the monitors intendedto record the inspectors’ statements verbatim. However, this proved unwieldy because someinspectors were wordy. The monitors decided to record only essential data in abbreviatedform¾ensuring that time, flaw type, and location (body station and stringer/body-line) wererecorded for each sticker. Flaw types were coded as cracks, corrosion, defective components(worn, broken, gouged, or missing), or dents. If an inspector thought an area needed to becleaned better, this was also classified as a finding.
3.3.2 Inspector Characteristics Data.
Other factors of interest about visual inspectors in the Benchmark experiment were recorded.These factors were not, however, controlled or used as a basis of selection of the inspectors.These characteristics of the inspectors were recorded during the Benchmark experiment so thatfuture studies can be compared to the Benchmark results. These characteristics are:
· Training· Visual acuity· Age· Previous aircraft experience· Education level· Visual inspection experience· Visual inspection experience by aircraft type· Visual inspection training
In addition to these data, at the beginning of each shift inspectors were asked how well they hadslept and what was their general physical, emotional, and mental condition. At the end of eachshift, inspectors were asked what their physical condition was, whether they felt tired, and forsome general ratings on attitude and attention as well as some questions on the effect ofvideotaping and the presence of the monitors on their work.
Information was also gathered at the end of each job card inspection. The inspectors were askedto rate their perceptions of the ease of tasks within the job cards, whole body exertion required to
14
perform the tasks, body part discomfort while performing the tasks, and their ratings of ease ofphysical access, ease of visual access, and comparability to typical shift conditions. Finally, theinspectors were asked how long since they had done this type of inspection on a B-737 and howlong since they had done this type of inspection on any type of aircraft.
4. DESIGN AND IMPLEMENTATION OF FLASHLIGHT LENS EXPERIMENT.
For the flashlight experiment, sixteen of the eighteen lap-splice panels used in JC 701 were used.They were arranged in sets of four panels under two ambient lighting conditions. “Low”illumination was 90 lux (9 foot-candles) at the rivet level, while “high” illumination was 900 lux(90 foot-candles) at the rivet level. All panels were arranged so that the rivets were at mean(male) eye level of 60 inches (1.5 m) above the floor.
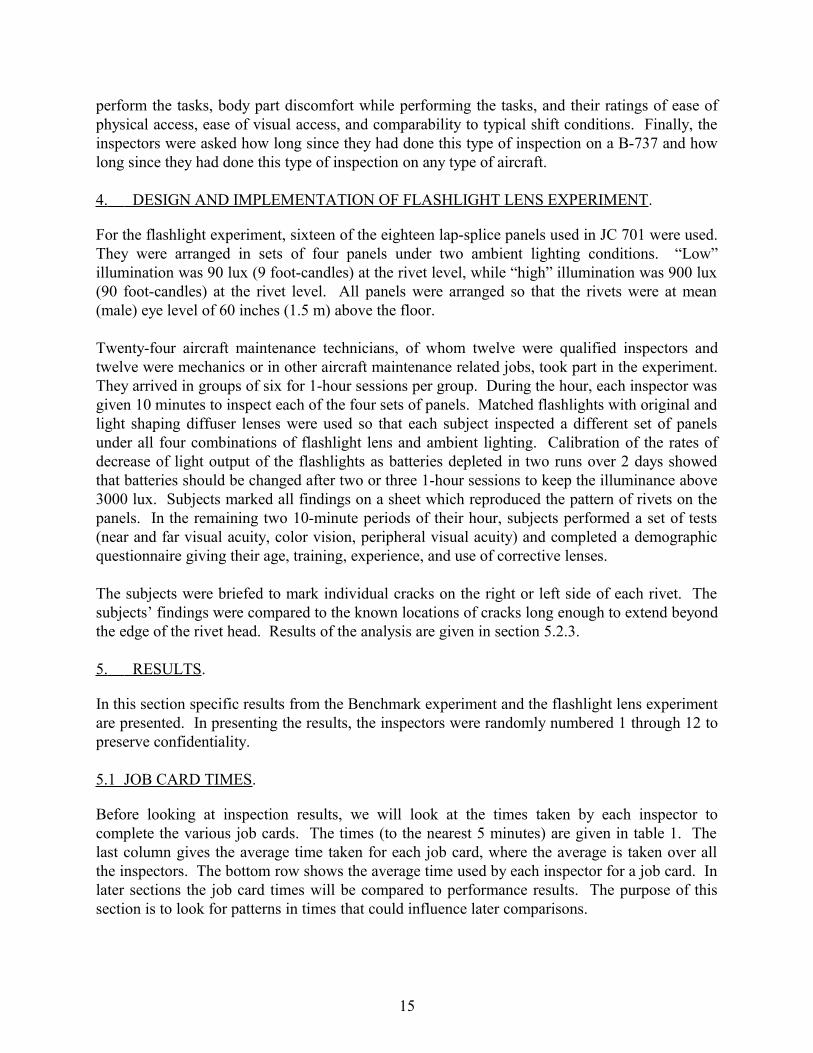
Twenty-four aircraft maintenance technicians, of whom twelve were qualified inspectors andtwelve were mechanics or in other aircraft maintenance related jobs, took part in the experiment.They arrived in groups of six for 1-hour sessions per group. During the hour, each inspector wasgiven 10 minutes to inspect each of the four sets of panels. Matched flashlights with original andlight shaping diffuser lenses were used so that each subject inspected a different set of panelsunder all four combinations of flashlight lens and ambient lighting. Calibration of the rates ofdecrease of light output of the flashlights as batteries depleted in two runs over 2 days showedthat batteries should be changed after two or three 1-hour sessions to keep the illuminance above3000 lux. Subjects marked all findings on a sheet which reproduced the pattern of rivets on thepanels. In the remaining two 10-minute periods of their hour, subjects performed a set of tests(near and far visual acuity, color vision, peripheral visual acuity) and completed a demographicquestionnaire giving their age, training, experience, and use of corrective lenses.
The subjects were briefed to mark individual cracks on the right or left side of each rivet. Thesubjects’ findings were compared to the known locations of cracks long enough to extend beyondthe edge of the rivet head. Results of the analysis are given in section 5.2.3.
5. RESULTS.
In this section specific results from the Benchmark experiment and the flashlight lens experimentare presented. In presenting the results, the inspectors were randomly numbered 1 through 12 topreserve confidentiality.
5.1 JOB CARD TIMES.
Before looking at inspection results, we will look at the times taken by each inspector tocomplete the various job cards. The times (to the nearest 5 minutes) are given in table 1. Thelast column gives the average time taken for each job card, where the average is taken over allthe inspectors. The bottom row shows the average time used by each inspector for a job card. Inlater sections the job card times will be compared to performance results. The purpose of thissection is to look for patterns in times that could influence later comparisons.
15
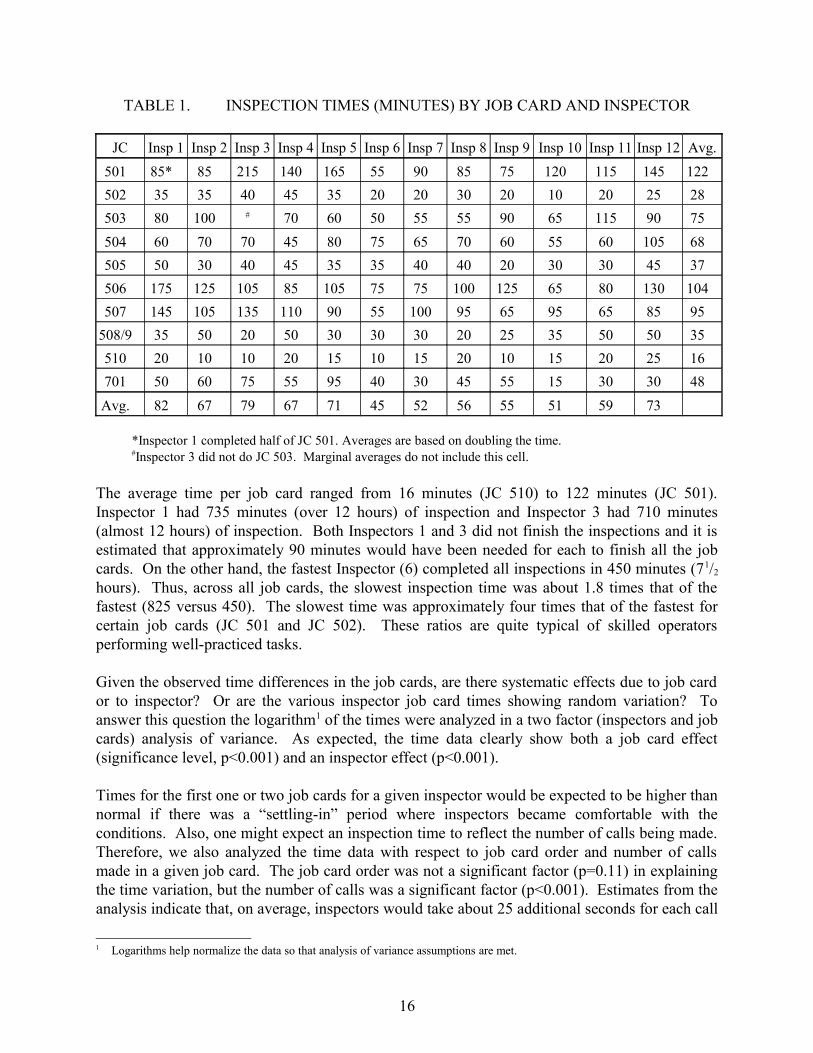
TABLE 1. INSPECTION TIMES (MINUTES) BY JOB CARD AND INSPECTOR
JC Insp 1 Insp 2 Insp 3 Insp 4 Insp 5 Insp 6 Insp 7 Insp 8 Insp 9 Insp 10 Insp 11 Insp 12 Avg.
501 85* 85 215 140 165 55 90 85 75 120 115 145 122
502 35 35 40 45 35 20 20 30 20 10 20 25 28
503 80 100 # 70 60 50 55 55 90 65 115 90 75
504 60 70 70 45 80 75 65 70 60 55 60 105 68
505 50 30 40 45 35 35 40 40 20 30 30 45 37
506 175 125 105 85 105 75 75 100 125 65 80 130 104
507 145 105 135 110 90 55 100 95 65 95 65 85 95
508/9 35 50 20 50 30 30 30 20 25 35 50 50 35
510 20 10 10 20 15 10 15 20 10 15 20 25 16
701 50 60 75 55 95 40 30 45 55 15 30 30 48
Avg. 82 67 79 67 71 45 52 56 55 51 59 73
*Inspector 1 completed half of JC 501. Averages are based on doubling the time.#Inspector 3 did not do JC 503. Marginal averages do not include this cell.
The average time per job card ranged from 16 minutes (JC 510) to 122 minutes (JC 501).Inspector 1 had 735 minutes (over 12 hours) of inspection and Inspector 3 had 710 minutes(almost 12 hours) of inspection. Both Inspectors 1 and 3 did not finish the inspections and it isestimated that approximately 90 minutes would have been needed for each to finish all the jobcards. On the other hand, the fastest Inspector (6) completed all inspections in 450 minutes (71/2
hours). Thus, across all job cards, the slowest inspection time was about 1.8 times that of thefastest (825 versus 450). The slowest time was approximately four times that of the fastest forcertain job cards (JC 501 and JC 502). These ratios are quite typical of skilled operatorsperforming well-practiced tasks.
Given the observed time differences in the job cards, are there systematic effects due to job cardor to inspector? Or are the various inspector job card times showing random variation? Toanswer this question the logarithm1 of the times were analyzed in a two factor (inspectors and jobcards) analysis of variance. As expected, the time data clearly show both a job card effect(significance level, p<0.001) and an inspector effect (p<0.001).
Times for the first one or two job cards for a given inspector would be expected to be higher thannormal if there was a “settling-in” period where inspectors became comfortable with theconditions. Also, one might expect an inspection time to reflect the number of calls being made.Therefore, we also analyzed the time data with respect to job card order and number of callsmade in a given job card. The job card order was not a significant factor (p=0.11) in explainingthe time variation, but the number of calls was a significant factor (p<0.001). Estimates from theanalysis indicate that, on average, inspectors would take about 25 additional seconds for each call
1 Logarithms help normalize the data so that analysis of variance assumptions are met.
16

they made. This estimate is consistent with the general process of removing a sticker, placing itat the called site, and speaking the call for the monitors to record.
An average of 24 calls were made per job card, but the number of calls varied substantially withinspectors as well as with job card. Much of the variation was due to different reporting styles,especially for calls of corrosion.
5.2 INSPECTION FLAW FINDINGS.
In this section we review the results of the inspections. Tables of flaws occurring on the Boeing737 test bed are given. In some cases approximate crack lengths of the flaws are included.These are presented as background information. No attempt was made to analyze theimplications of any particular miss on the ultimate safety of an aircraft flying with that particularflaw. There are a multitude of additional factors that would mitigate inspection misses withrespect to ultimate safety, which are outside the scope of the analysis presented here. Suffice itto say, however, that the size of many of the cracks presented here are less than the size thataircraft manufacturers and airlines treat as detectable in establishing appropriate inspectionschedules. Thus, the question in many cases should not be “Why did so many inspectors missthis crack?” but rather it should be “Why or how were a few inspectors able to detect suchobscure cracks?”
5.2.1 EC Panels ¾ Benchmark.
In this section we will present the results of the visual inspections performed on themanufactured lap-splice panels containing cracks of known length (JC 701). These panels were asubset of those used in an earlier eddy-current experiment [29]. The results of this portion of theBenchmark include the derivations of probability of detection curves that can be compared toprevious eddy-current results.
Table 2 presents a summary of the detected cracks that were at least 0.050 inch in length asmeasured from the rivet shank. Cracks smaller than this would be almost entirely under thecountersink rivet head and would not be visually detectable. Inspectors were asked to identifyany cracks that they detected. Some of the rivets had pairs of cracks. That is, a crack emanatedfrom the right and the left side of the same rivet. Cracks not called but located at a rivet with onethat was called are listed in table 2 separately from the misses of a single occurring crack. Thereasons for missing a crack located at a rivet with another crack may be related to the procedureemployed by the individual inspector. This is best illustrated by Inspector 3 who, for the mostpart, only identified rivets containing cracks and did not specify the number or position of cracksobserved at a particular rivet. The entries in table 2 are as if Inspector 3 called only a singlecrack at the rivets having two cracks.
False calls shown in table 2 are defined as the rivet sites for which the inspectors made a call andit is known that there was no crack. There was a total of 382 sites in the inspection for whichsuch a call could be made. It should be noted that all the inspectors commented about the needfor eddy-current verification or some other form of nondestructive inspection on their calls.
17

Therefore, the false calls represent the number of times that a nondestructive inspection follow-up would likely have found no cracks.
TABLE 2. SUMMARY OF CRACK DETECTION IN JC 701
Inspector
Cracks (117 Total): 1 2 31 4 5 6 7 8 9 10 11 12
Detected 71 22 261 70 57 73 69 53 77 37 45 50
Missed 37 89 741 45 55 41 45 56 35 74 66 63
Colocated Misses* 9 6 171 2 5 3 3 8 5 6 6 4
“False Calls”(382 possible)
9 3 10 15 4 40 2 26 29 6 4 3
*Number of cracks not reported but located at a rivet where another crack was reported.1Inspector 3 called rivet sites - did not identify individual cracks for the most part.
The summary given in table 2 illustrates substantial variation in the inspection results. Missingfrom table 2 is information concerning the size of the detected cracks. The size of the crackinformation is used to fit probability of detection (PoD) curves to each inspector. The probitmethodology (discussed in [29]) was used to fit the curves shown in figure 1. The curves offigure 1 are terminated at 0.050 inch because lengths smaller than this would be under thecountersunk rivet head and would not be visually detectable.
The same lap-splice test specimens were previously used in an eddy-current inspection reliabilityassessment [29]. In these results there was substantial inspector-to-inspector variability, but atypical eddy-current inspection achieved 90 percent detection rate around 0.100 inch.
In fitting the curves of figure 1 the colocated misses in table 2 were not included in the data.That is, the inspector was not given credit for finding the crack, but the crack also did not countas a miss. The effect of this assumption on the fitted probability of detection curves is given intable 3, where the 50th percentile and 90th percentile values of the fitted probability of detectioncurves are given. The effect is quite small for all but Inspector 8. The reason for the smallinfluence is that the cracks that were not called but were located with other cracks had lengthsthat occurred in the middle to upper portion of the fitted PoD curve. This was not the case withInspector 8. Two of the eight misses were extremely large cracks and therefore had a largeimpact on the estimated PoD curve. The two cracks were located on adjacent rivets and cametogether between the rivets.
18

0
0.1
0.2
0.3
0.4
0.5
0.6
0.7
0.8
0.9
1
0 0.05 0.1 0.15 0.2 0.25 0.3 0.35 0.4 0.45 0.5
Crack Length (Inch)
Pro
ba
bili
ty
Note: No penalty for not calling crack located at rivet with crack that was called. Crack lengths are measured fromrivet shank, thus lengths less than 0.05 inch are not visible.
FIGURE 1. PROBABILITY OF DETECTION CURVES¾JC 701 BY INSPECTOR
TABLE 3. PROBABILITY OF DETECTION CRACK SIZES
50% Crack Length (Inch) 90% Crack Length (Inch)
InspectorCurve Fit Using
All CracksCurve Fit WithoutColocated Misses
Curve Fit UsingAll Cracks
Curve Fit WithoutColocated Misses
1 0.10 0.10 0.20 0.17
2 0.32 0.30 0.95 0.91
3 0.18 0.17 0.29 0.26
4 0.10 0.10 0.20 0.20
5 0.13 0.12 0.31 0.28
6 0.10 0.10 0.19 0.19
7 0.11 0.11 0.19 0.18
8 0.15 0.13 0.46 0.26
9 0.09 0.09 0.18 0.16
10 0.18 0.18 0.29 0.29
11 0.16 0.16 0.37 0.36
12 0.14 0.14 0.24 0.24
19

Figure 2 shows the 0.90 probability of detection values (table 3 last column) versus time tocomplete JC 701. It is clear from the graph that over all the inspectors, the time taken to performthe task was not a good predictor of performance.
The inspectors participating in the Benchmark experiment are all active inspectors withsubstantial experience. The variation in the performance, as reflected in the curves of figure 1,can be used to gage the differences that would be statistically detectable in comparing differentpopulations of inspectors. There are many ways to characterize the comparisons between twodifferent (hypothesized) populations. Here, we consider the variation in the 0.90 probability ofdetection values given in table 3 (last column) and the differences that would have to be presentin an additional group of 12 inspectors to deem them as having come from a different population.
The t-test is a standard statistical method for comparing two samples. We used a 90 percentconfidence level t-test on the logarithm of the 0.90-PoD-crack size (written as ln(a.90)). (Thelogarithm is an appropriate choice for transforming positive asymmetrically distributedvariables.) The estimated median 0.90-PoD-crack length from the 12 inspectors is 0.258 inch.Assume another group of 12 inspectors were chosen for comparison and that group would havethe same inspector-to-inspector variation in the response ln(a.90). The estimated a.90 median fromthe second group would need to be smaller than 0.188 inch (a 27 percent drop) or larger than0.353 inch (a 37 percent increase) to be considered statistically different from the original 12 at a90 percent confidence level. Thus we see that fairly substantial differences have to be observedin two samples of size 12 from two different populations if they are to be judged different. Notethat the underlying populations would have to be even further apart in performance levels toensure a high probability of observing the above differences [30].
0
0.1
0.2
0.3
0.4
0.5
0.6
0.7
0.8
0.9
1
0 20 40 60 80 100
Time (Minutes)
Cra
ck L
en
gth
(In
ch)
FIGURE 2. NINETY PERCENT DETECTION CRACK LENGTH VERSUS TIME ON JC701
20
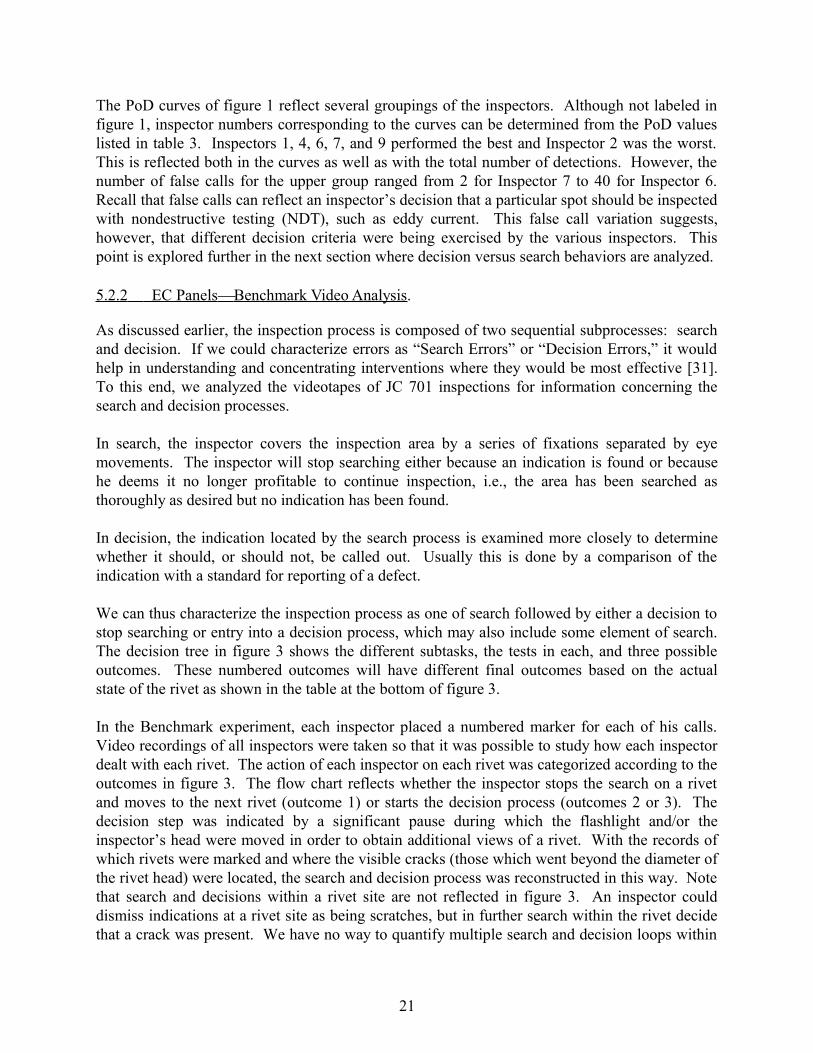
The PoD curves of figure 1 reflect several groupings of the inspectors. Although not labeled infigure 1, inspector numbers corresponding to the curves can be determined from the PoD valueslisted in table 3. Inspectors 1, 4, 6, 7, and 9 performed the best and Inspector 2 was the worst.This is reflected both in the curves as well as with the total number of detections. However, thenumber of false calls for the upper group ranged from 2 for Inspector 7 to 40 for Inspector 6.Recall that false calls can reflect an inspector’s decision that a particular spot should be inspectedwith nondestructive testing (NDT), such as eddy current. This false call variation suggests,however, that different decision criteria were being exercised by the various inspectors. Thispoint is explored further in the next section where decision versus search behaviors are analyzed.
5.2.2 EC Panels ¾ Benchmark Video Analysis.
As discussed earlier, the inspection process is composed of two sequential subprocesses: searchand decision. If we could characterize errors as “Search Errors” or “Decision Errors,” it wouldhelp in understanding and concentrating interventions where they would be most effective [31].To this end, we analyzed the videotapes of JC 701 inspections for information concerning thesearch and decision processes.
In search, the inspector covers the inspection area by a series of fixations separated by eyemovements. The inspector will stop searching either because an indication is found or becausehe deems it no longer profitable to continue inspection, i.e., the area has been searched asthoroughly as desired but no indication has been found.
In decision, the indication located by the search process is examined more closely to determinewhether it should, or should not, be called out. Usually this is done by a comparison of theindication with a standard for reporting of a defect.
We can thus characterize the inspection process as one of search followed by either a decision tostop searching or entry into a decision process, which may also include some element of search.The decision tree in figure 3 shows the different subtasks, the tests in each, and three possibleoutcomes. These numbered outcomes will have different final outcomes based on the actualstate of the rivet as shown in the table at the bottom of figure 3.
In the Benchmark experiment, each inspector placed a numbered marker for each of his calls.Video recordings of all inspectors were taken so that it was possible to study how each inspectordealt with each rivet. The action of each inspector on each rivet was categorized according to theoutcomes in figure 3. The flow chart reflects whether the inspector stops the search on a rivetand moves to the next rivet (outcome 1) or starts the decision process (outcomes 2 or 3). Thedecision step was indicated by a significant pause during which the flashlight and/or theinspector’s head were moved in order to obtain additional views of a rivet. With the records ofwhich rivets were marked and where the visible cracks (those which went beyond the diameter ofthe rivet head) were located, the search and decision process was reconstructed in this way. Notethat search and decisions within a rivet site are not reflected in figure 3. An inspector coulddismiss indications at a rivet site as being scratches, but in further search within the rivet decidethat a crack was present. We have no way to quantify multiple search and decision loops within
21
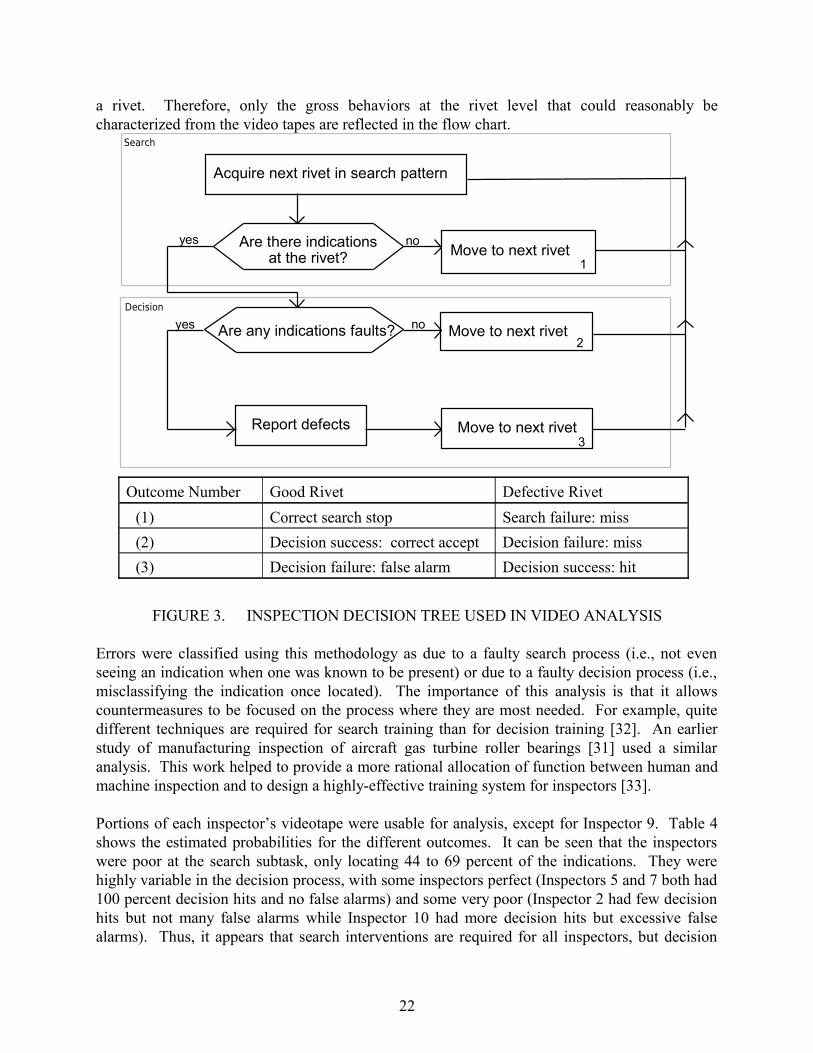
a rivet. Therefore, only the gross behaviors at the rivet level that could reasonably becharacterized from the video tapes are reflected in the flow chart.
Move to next rivet2
Acquire next rivet in search pattern
Are any indications faults?
Report defects
Are there indications no
no
yes
yes
Move to next rivet1
Move to next rivet3
Search
Decision
at the rivet?
Outcome Number Good Rivet Defective Rivet
(1) Correct search stop Search failure: miss
(2) Decision success: correct accept Decision failure: miss
(3) Decision failure: false alarm Decision success: hit
FIGURE 3. INSPECTION DECISION TREE USED IN VIDEO ANALYSIS
Errors were classified using this methodology as due to a faulty search process (i.e., not evenseeing an indication when one was known to be present) or due to a faulty decision process (i.e.,misclassifying the indication once located). The importance of this analysis is that it allowscountermeasures to be focused on the process where they are most needed. For example, quitedifferent techniques are required for search training than for decision training [32]. An earlierstudy of manufacturing inspection of aircraft gas turbine roller bearings [31] used a similaranalysis. This work helped to provide a more rational allocation of function between human andmachine inspection and to design a highly-effective training system for inspectors [33].
Portions of each inspector’s videotape were usable for analysis, except for Inspector 9. Table 4shows the estimated probabilities for the different outcomes. It can be seen that the inspectorswere poor at the search subtask, only locating 44 to 69 percent of the indications. They werehighly variable in the decision process, with some inspectors perfect (Inspectors 5 and 7 both had100 percent decision hits and no false alarms) and some very poor (Inspector 2 had few decisionhits but not many false alarms while Inspector 10 had more decision hits but excessive falsealarms). Thus, it appears that search interventions are required for all inspectors, but decision
22

interventions are only required for a few inspectors. Most notably a decision intervention wouldbe suggested for Inspector 2, whose performance on JC 701 was distinctly lower than the others.That is, the analysis implies that the extreme PoD curve for Inspector 2 was not due primarily tosearch failures, but rather decision or classification failures.
TABLE 4. SEARCH AND DECISION PERFORMANCE MEASURES
InspectorNumber
Prob. Correct Search Stop
Prob. Search Success
Prob. Decision Hit
Prob. Decision False Alarm
Overall Prob. (Hit)
Overall Prob. (False Alarm)
1 0.88 0.69 0.73 0.14 0.51 0.02
2 0.94 0.49 0.44 0.11 0.20 0.01
3 0.86 0.53 0.69 0.26 0.36 0.04
4 0.95 0.56 0.93 0.42 0.52 0.02
5 0.95 0.48 1.00 0.00 0.48 0.00
6 0.95 0.60 1.00 1.00 0.60 0.05
7 0.98 0.53 1.00 0.00 0.53 0.00
8 0.93 0.44 0.97 0.84 0.42 0.07
9 * * * * 0.72 0.31
10 0.98 0.46 0.77 0.80 0.34 0.01
11 0.96 0.46 0.93 0.17 0.43 0.01
12 0.97 0.46 0.83 0.22 0.38 0.01
* indicates video tapes unusable.
5.2.3 EC Panels ¾ Light Shaping Diffuser Flashlight Lens.
As presented in section 4, the eddy-current panels were used in a performance experimentcomparing the use of flashlights with and without a light shaping diffuser lens. Because somerivets in these panels had two cracks, it was possible to measure performance reliability as“correct detection of a crack” or “correct detection of a rivet with a crack.” False alarms could beexpressed as a rate of rivets miscalled or sides of rivets miscalled. By using performance levelskeyed to the rivets rather than the cracks at the rivets we acknowledge that some inspectors mightapproach the task as one of identifying rivets even though they were instructed to mark all cracks.All four performance measures for each combination of subject (24), flashlight lens (2), andambient lighting (2) were examined.
Analysis of the results began by calculating correlations, r, between the performance measures.As expected, there were high correlations between the two measures of correct detections(r = 0.906) and between the two measures of false alarms (r = 0.988). The correlations were
23

much smaller between the other pairs (r = 0.145, r = 0.323). Thus the choice of measures, i.e.,defined by crack or by rivet, made little difference to the results.Three-factor analysis of variance for each measure was performed. All four analyses showedsignificant differences between subjects, but no significant effects of flashlight lens, ambientlighting, or their interaction. Differences between subjects were further explored by correlatingeach of the four performance measures with the pretest and demographic variables. Onlyperipheral visual acuity gave significant correlation with correct detections. The correlation withcorrect crack detections over all flashlight and light conditions was r = -0.61, which wassignificant at a level p < 0.01. See figure 4 for a graph of detection rates versus the peripheralvisual acuity sort time. Recall from section 4 that 12 of the subjects were qualified inspectorsand 12 were mechanics or in other aircraft maintenance related jobs. These two groupings arealso shown in figure 4.
Note that the correlation is negative. The peripheral visual acuity measure was the time tocomplete the peripheral acuity task, so that a negative correlation shows that subjects with betterperipheral visual acuity (i.e., quicker times) were better at detecting defects. As peripheral visualacuity is known to predict search performance [34], this finding suggests that visual search is alimiting performance factor. Note that the video analysis of the Benchmark subjects alsoindicated that the search process was a performance limiting factor. Peripheral visual acuity isdiscussed in more detail in section 5.3.
0
0.1
0.2
0.3
0.4
0.5
0.6
0.7
0.8
40 50 60 70 80 90 100 110 120Peripheral Acuity Sort Times
De
tect
ion
Ra
te
Non-Insp. Rates Insp. Rates
FIGURE 4. FLASHLIGHT EXPERIMENT DETECTION RATES VERSUS PERIPHERALVISUAL ACUITY SORT TIMES
24

Significant differences were observed between subjects, indicating that the experimental designwas sensitive enough to show individual differences in performance. To explore this factorfurther, the background information provided by each of the subjects was used to divide thesubjects into two populations: inspectors or noninspectors. There were 12 subjects in eachcategory. An analysis was performed to test for differences between inspectors and non-inspectors on each of the measures. For the detection measures, these differences weresignificant at p < 0.05. There was no significant difference between the two populations on thefalse call measures. The mean performance of each group on each measure is shown in table 5where it is evident that inspectors detected about 9 percent more flawed rivets (or 5 percent morecracks), a significant difference, and made 1 to 2 percent more false alarms not a significantdifference.
TABLE 5. FLASHLIGHT EXPERIMENT PERFORMANCE BY JOB CLASSIFICATION
GroupCrack DetectRate (%)
Rivet DetectRate (%)
Crack False Alarm Rate (%)
Rivet False Alarm Rate (%)
Noninspectors 45 44 5 9
Inspectors 50 53 6 11
The mean performance under the four visual conditions is shown in table 6. Note that neither theambient light difference nor the lens difference were statistically significant when compared tothe inspector-to-inspector variation. The overall best level of performance was with the lightshaping diffuser lens at the high ambient light conditions but this was not significantly differentfrom the other conditions.
TABLE 6. FLASHLIGHT EXPERIMENT PERFORMANCE WITH LIGHTING ANDFLASHLIGHT LENS CHANGES
AmbientLighting
FlashlightLens
Detections by Crack (%)
Detections by Rivet (%)
False Alarms by Crack (%)
False Alarmsby Rivet (%)
Low (90 lux) original 45 45 5 9
Low (90 lux) light shaping 48 51 5 9
High (900 lux) original 49 48 6 10
High (900 lux) light shaping 49 51 6 11
The finding of no statistically significant difference between ambient lighting conditions wasexpected in that the illumination from the flashlight beam overpowered ambient illuminationwhen the flashlight was held only a few inches from the rivet. Thus overall illumination wasexpected to be high enough for stable performance under high and low ambient lighting.However, the lack of a significant effect due to the flashlight lens was disappointing. While theenhanced flashlight did not increase total illumination, its effect was to provide betterillumination uniformity. One reason for a significant difference not being detected may be due to
25

restricting the test to detection of cracks in a bare metal panel at eye level. It is possible thatdifferent defects (e.g., corrosion) or different surfaces (e.g., painted metal, dirty surfaces,complex structures) would have revealed differences. The relatively small difference betweeninspectors and noninspectors was statistically significant, so we know that if there is a flashlightlens effect it is not a large one. The conclusion is that under the conditions used the enhancedlens did not hinder but did not significantly enhance crack detection performance.
As a tie-in between the IAM inspectors of the flashlight experiment and the Benchmarkexperiment inspectors we compared their overall performances (percent cracks detected andcrack false alarm rates). The IAM inspector group had a slightly higher average detection rate,but an average false alarm rate that was twice as high. Given the inspector-to-inspector variationthat was present in both populations the average detection rates were not significantly different(p = 0.32), nor were the false alarm rates (p = 0.11). Thus there is no reason to believe that thetwo inspector groups represent different populations with respect to ability on this task.
5.2.4 Tie-Clip Inspections ¾ On Aircraft.
In this section we will look at findings specific to JC 503. JC 503 included the inspection of tie-clips in the crown area of the fuselage interior. The tie-clip inspection is mandated by anAirworthiness Directive. The area covered by the job card contained a total of 98 tie-clips to beinspected. Of these, 24 were verified with eddy current to be cracked. Table 7 shows thenumber of detects called by each inspector as well as the number of tie-clips called where theeddy-current inspection did not verify the presence of cracks. (Inspector 3 did not do this job dueto time constraints.)
TABLE 7. JC 503¾TIE-CLIP INSPECTIONS
Inspector 1 2 4 5 6 7 8 9 10 11 12
Number found (of 24) 20 19 21 20 12 15 14 18 12 17 17
False calls made (of 74) 6 1 12 2 1 2 2 4 1 1 1
Inspection time (mins) 80 100 70 60 50 55 55 90 65 115 90
There is no significant correlation of the performance data of table 7 with the performance datain table 2 for JC 701. That is, knowing that one inspector did comparatively well on one of thejob cards did not necessarily mean that he did relatively well on the other. This suggests thatperformance may be task specific.
Figure 5 shows the number of cracked tie-clips detected versus the time taken on inspection. Theobserved correlation is positive, but not significant (Spearman rank correlation = 0.44, p = 0.10,one-sided). It should be noted that the inspection for cracked tie-clips was only one task within ageneral inspection of the area containing the tie-clips.
26

10
12
14
16
18
20
22
40 50 60 70 80 90 100 110 120
Time on Task (Minutes)
Nu
mb
er
of
De
tect
s
FIGURE 5. TIE-CLIP DETECTS VERSUS TIME TO COMPLETE JC 503
5.2.5 Flaws ¾ On Aircraft.
In this section we focus on detection of flaws present in the Boeing test bed. All but one of theflaws were cracks. Table 8 gives the performance statistics on the 64 flaws. In many cases anapproximate crack length is shown in the table. The flaws in table 8 are divided into threesections. The differences are discussed in the following subsections. Exact locations anddescriptions are not given because of the continued use of the B-737 as a test bed.
5.2.5.1 Directed Inspections.
Two job cards contained Special Inspection instructions that identified typical cracks in theinspection area. The B-737 test bed contained the cracks as noted in the inspection instructions.The inspection outcomes for these two are given in table 8 as flaws 1 and 2. Flaw 1 was in asupport structure and could be seen when looking straight up. This crack was missed by two ofthe twelve inspectors. One inspector called a possible crack on a nearby structure, but not thespecific crack.
TABLE 8. AIRCRAFT FLAW DETECTION PERFORMANCESEE NEXT PAGE
27

FlawApproximate Length (Inch) Ins 1 Ins 2 Ins 3 Ins 4 Ins 5 Ins 6 Ins 7 Ins 8 Ins 9 Ins 10 Ins 11 Ins 12
Total No.of Detects
1 1.0 Y Y Y Y Y Y Y Y Y Y 10
2 8 to 11# Y Y Y Y Y 5
3 4.5 Y Y Y Y Y Y Y Y Y Y Y Y 12
4 0.7 Y Y Y 3
5 Y Y Y Y 4
6 0.7 Y Y Y Y Y Y Y Y Y 9
7 1.5 Y Y Y Y Y Y Y 7
8 1.3 Y Y Y Y Y Y Y Y Y Y 10
9 1.5 Y Y Y Y Y Y Y Y Y 9
10 1 Y Y Y Y Y Y Y Y 8
11 .3 Y Y Y Y Y Y Y Y Y 9
12 .3 Y Y Y Y Y Y Y Y Y 9
13 0.8 Y Y Y Y Y Y Y Y Y Y Y 11
14 0.9 Y Y Y Y Y Y Y Y Y Y Y 11
15 NI* Y Y Y Y Y Y Y Y Y 9 (/11)
16 3 Y Y Y Y Y Y 6
17 3.3 NI Y Y Y Y Y 5(/11)
18 0.8 NI Y Y Y Y Y Y Y 7(/11)
19 1.5 NI Y Y Y 3(/11)
20 0.2 NI Y Y Y 3(/11)
21 1.2 NI Y Y Y Y 4(/11)
22 0.5 NI Y Y Y Y Y 5(/11)
23 0.5 NI Y 1(/11)
24 0.2 NI Y 1(/11)
25 0.5 NI Y 1(/11)
26 3.3 NI Y Y Y Y Y 5(/11)
27 0.3 NI Y 1(/11)
28 0.3 NI Y 1(/11)
29 2 NI Y Y Y Y Y Y 6(/11)
30 0.9 Y 1
31 0.4 Y Y Y Y 4
32 0.8 Y 1
33 0.5 NI Y 1(/11)
34 0.5 Y Y 2
35 0.5 Y Y Y Y 4
36 0.3 NI Y Y Y Y Y 5(/11)
37 0.5 NI Y Y 2(/11)
38 0.3 Y Y Y Y 4
39 2.5 NI Y Y Y 3(/11)
40 1.5 Y Y Y Y Y 5
41 0.4 Y Y Y Y Y 5
42 0.4 Y Y 2
28

TABLE 8. AIRCRAFT FLAW DETECTION PERFORMANCE (CONTINUED)
Flaw ApproximateLength (Inch) Ins 1 Ins 2 Ins 3 Ins 4 Ins 5 Ins 6 Ins 7 Ins 8 Ins 9 Ins 10 Ins 11 Ins 12
Total No.of Detects
43 1 Y Y 2
44 0.5 Y 1
45 1.5 NI Y 1(/11)
46 0.3 Y 1
47 1.6 Y Y Y Y Y Y Y Y Y 9
48 0.3 Y Y Y Y Y 5
49 1 Y 1
50 0.7 Y Y Y 3
51 0.6 Y Y 2
52 0.3 Y Y Y Y Y Y 6
53 0.8 Y Y Y Y Y Y Y Y 8
54 0.2 Y 1
55 0.7 Y Y Y Y Y Y Y Y 8
56 0.2 Y Y Y Y Y 5
57 1 Y Y Y Y Y Y Y Y Y 9
58 0.5 Y Y Y Y 4
59 Y Y 2
60 0.5 Y Y Y Y Y 5
61 0.8 Y Y Y 3
62 1 Y Y Y Y Y Y Y Y Y 9
63 0.3 Y Y Y Y Y 5
64 0.5 Y Y 2
Totals 24(/45)
34 22 31 29 22 28 19 10 31 22 34
#Crack not visible for total length*NI - Area with crack not inspected. The n in the margin total (/n) is the reduced sample size.
Flaw 2 was a crack in a bulkhead. The bulkhead is cracked at the point that the specialinspection instructions indicates as a typical crack location. This crack runs along the edge of astiffener on the forward side and is obscured. On the aft side of the bulkhead, the crack runsalong the edge of a flat stiffener backing plate behind a fixture. The crack is thought to be large,but only portions (2 to 3 inches) of it are visible. It is almost impossible to detect with x-ray oreddy current without disassembly of the stiffener. Only five of the twelve inspectors reportedthis crack.
5.2.5.2 Apparent Flaws.
There were flaws in several places on the aircraft that were deemed as “easily detectable.” Theseare shown in table 8 as flaws 3 through 15. Once these flaws are located, they are quite obviousand include cracks that are long and wide. Because of their obvious nature a miss within this setis considered more likely to be a search failure as opposed to a decision failure. Other flawscould arguably be added to this list, but these constitute the most obvious.
29

Crack 3 is in a location where the frame is broken in two by a crack that runs perpendicular to thelength. Not only is the frame cracked but so is the fail-safe attachment (crack 5). Crack 3 is verywide and characterized by the inspectors as a “major break” or “frame severed.” All inspectorssaw and reported this crack. However, only three inspectors reported crack 4¾another, clearlyvisible three-quarter-inch crack that was about five inches above the frame break on the top lip ofthe frame. Interpretation of this finding is difficult. It was clear that once in the area theattention of some inspectors was immediately drawn to the large crack 3. As a result theimmediate surrounding area may have not been inspected as closely. However, at least oneinspector moved on to other areas with the comment, “There’s no sense in looking around hereany more¾the entire frame will be spliced anyhow.” Similarly, only four of the twelveinspectors reported crack 5 at the bottom (skin side) of the broken frame. It is unclear whetherthe other inspectors did not look, did not see, or simply did not report the crack in the fail-safesince it would be replaced during the frame repair.
Crack 6 was located in another frame. Although this crack is not as large, it was gaped fairlywide and was about three-quarters of an inch long in a corroded area. (Corrosion finds arediscussed in next section.) Nine of the inspectors reported this crack. The three inspectors thatdid not report the crack did report the accompanying corrosion (see table 9¾corrosion 5).
Although physically different, cracks 11 and 12 were present in similar structure and wereidentified by most of the nine inspectors who detected the cracks as being in a “chronic” problemarea in the aircraft. Cracks 13 and 14 were in symmetric structure (right side versus left side ofaircraft) and were detected by all but one of the inspectors. Most of the inspectors also identifiedthe area of cracks 13 and 14 as being “typically” cracked or in a “chronic” problem area. In bothof the above pairs, the inspectors detecting one of the cracks also detected its twin. It wasapparent that this is expected as many of the inspectors commented that the twin structure wouldbe cracked once they made the first detection. Several of them stated that there would be cracksin these areas before they even looked.
There are likely many factors contributing to whether an inspector expects problems in an areaand is therefore less likely to miss flaws. One likely factor is the familiarity of the inspector withthe area on the particular model of aircraft. The one inspector that missed cracks 13 and 14 hadrecently inspected a B-737, but had not inspected this area on a B-737 in 2 years. This was thelongest time gap for inspecting that area reported by any of the inspectors. One other inspector(who did make the detection) also reported not having inspected this area in about 2 years.
The time gap in inspecting the area containing flaws 11 and 12 is more varied among theinspectors making the detection as well as among the three that missed the flaws. One of theinspectors making the detection reported that he had never inspected this area of a B-737. Twoother inspectors reported 3 and 4 years since having inspected this area on a B-737. The threeinspectors who missed the flaws reported 6 months, 1 year, and 2 years since having inspectedthe area on a B-737. The above two examples show no clear relationship between the time gapin inspecting an area and the likelihood of missing a flaw.
30

Flaw 15 is not a crack, but rather a popped rivet. It is, however, an obvious flaw. It was missedby two of the inspectors and reported by nine of them. One inspector did not inspect the areacontaining the flaw due to time constraints.
In this group of apparent flaws, Inspector 2 detected all but one flaw and had one of the bestperformances. This is in contrast to his performance in JC 701. The video analysis of that jobcard indicated that Inspector 2 was failing in the decision process. Given his performance on thecracks present on the aircraft and the indication that the decision process was failing on JC 701, itis likely that the look of the cracks in the eddy-current panels was not what Inspector 2 expecteda crack to look like.
5.2.5.3 Other Aircraft Flaws.
Flaws 16 through 64 in table 8 are cracks found by at least 1 of the 12 inspectors. This list doesnot encompass all of the calls made by the inspectors, but does include the majority of the cracksthat were verified by eddy-current inspection. The crack lengths are based on visual information.There was no disassembly or laboratory characterization of the cracks beyond viewing them onthe aircraft. Therefore the lengths should be considered as approximate lengths.
Is there a relationship between the crack lengths and the detection rates for this group of aircraftflaws? Figure 6 shows the detection rate versus flaw length for flaws 16 to 64 from table 8.Also shown in figure 6 are the detection rates for the flaws of JC 701. Probability of detectioncurves were fit to individual JC 701 data in section 5.2.1. The JC 701 cracks are tightly groupedin the scale presented in figure 6 but do exhibit a general increase in detection rates with cracklength. On the other hand, the various cracks found on the aircraft have much more spread inlength characteristics but do not show a strong relationship between detection rates and length ofcrack.
The detection rates for the aircraft cracks across the 12 inspectors have a small, but statisticallysignificant, correlation with crack lengths. Using the same PoD curve fitting techniques as wasused with the 701 data we obtain an estimate of a 50 percent detection crack (a50) of 4.5 inches.
Combining the data from all of the inspectors in JC 701 results in a a50 estimate of 0.13 inch.This difference is not unexpected. JC 701 was a specific task, inspecting for a single fault type,with specific areas to be inspected, all of which were consistent in structure. However, theaircraft flaws come from many areas and from different elements on the aircraft.
More telling than the difference in the a50 estimates is the differences in the statistical variation
for those estimates. The 95 percent confidence interval for a50 in JC 701 is 0.12 to 0.14 inch.The same confidence level interval for the aircraft flaws is 2 to 72 inches. A confidence intervalof this magnitude illustrates the inadequacy of trying to model the probability of detection solelyas a function of crack length for such a varied data set. For a population of cracks fromthroughout the aircraft, crack length explains very little of the variation found in detection rates.This is not surprising in light of what is known about visual search in general, as discussed insection 1.3. The many factors that have been shown to affect probability of detection in searchactivities vary greatly across the various tasks. Thus, it is meaningful to fit probability of
31

detection curves as a function of crack length only within specific inspection tasks and conditionsof inspection.
0
0.1
0.2
0.3
0.4
0.5
0.6
0.7
0.8
0.9
1
0 0.5 1 1.5 2 2.5 3 3.5Length (Inches)
Pro
po
rtio
n D
ete
ctin
g
Aircraft
Task 701
FIGURE 6. COMPARISON OF JC 701 AND AIRCRAFT FLAWS DETECTION RATES
5.2.6 Corrosion ¾ On Aircraft.
Table 9 shows results for major corrosion areas on the B-737. There was an area of corrosion(corrosion area 1) that almost perforated the skin in the bilge. This corrosion could be seen fromboth inside and outside the airplane. Ten out of twelve inspectors reported this corrosion area;one other inspector called an immediately adjacent area. All 12 of the inspectors called theadjacent bulkhead attach angle corrosion (corrosion area 2). It is not clear whether the twoinspectors did not call the specific area of corrosion in the skin because they assumed that otherof their calls would initiate the proper repair.
TABLE 9. REPORT OF MAJOR CORROSION AREAS BY EACH INSPECTOR
Corrosion INSP
Total No.Area 1 2 3 4 5 6 7 8 9 10 11 12 of Detects
1 A1 Y Y Y Y Y Y Y Y Y Y 102 Y Y Y Y Y Y Y Y Y Y Y Y 123 Y Y Y Y Y Y Y Y Y Y Y 114 Y Y Y Y Y A2 Y A2 A2 A2 Y Y 85 Y Y Y Y Y Y Y Y Y Y 106 Y Y Y A1 Y A1 Y Y Y Y Y Y 107 Y Y A3 Y Y Y Y Y Y Y Y Y 11
No. (of 7) 6 6 6 6 7 5 7 6 6 5 5 7
A1-Specific areas not called but adjacent areas were.A2-Skin immediately above lap-splice called as corroded.A3-Did not call specific area but inspector commented from earlier call he “would ask for skin to be opened.”
32

The next two major corrosion areas involved lap-splices (corrosion areas 3 and 4). Corrosionarea 3 consisted of two lap-splices that have been addressed by Service Bulletins. Eleven of thetwelve inspectors called both lap-splices. The single inspector who did not call either lap-splicedid call corrosion on adjacent skin areas. Corrosion area 4 was a lap-splice further down the sideof the airplane. As can be seen in the table, eight of the inspectors called this lap-splice ascontaining corrosion. The other four inspectors did not call corrosion in this lap-splice, but theyall reported corrosion on the upper skin immediately above the lap-splice. In making their calls,the inspectors were not always specific as to the nature of the visual clues. They did not getspecific as to detecting corrosion residue, discoloration, or other signs, but rather just reportedsigns of corrosion.
Corrosion area 5 was on the frame containing crack 6. Both the inspectors that did not callcorrosion did call the crack. Thus, all of the inspectors called at least one of the conditions, withseven of them calling both. It is not clear as to whether the inspectors making only one call didso assuming that any other flaw would be corrected during repair or whether the inspectors’focus on the one flaw resulted in a miss of another.
Corrosion areas 6 and 7 were externally viewed areas on the airplane. In limited areas of theinspection the bulging is enough that rivet heads have pulled through the skin and some crackinghas occurred (corrosion area 6). All inspectors reported flaws in this area, but some reportedcracks; some reported corrosion, and some reported both. The one inspector that did not callcorrosion area 7 did not call anything in the specific location noted. However, signs of corrosionwere reported in neighboring areas and the inspector said that he would “ask for skin to beopened.”
Almost all of the inspectors commented that at the first signs of corrosion as bad as theindications of corrosion areas 6 and 7, their normal procedure would be to write up the wholearea. Since a repair would encompass a skin replacement, there would be no reason to delineateindividual flaw locations. In this sense, the major corrosion areas in table 9 would all have beenadequately addressed in the working facilities of the inspectors. That is, a single callout wouldhave initiated a repair action that would address all flaws in the area.
However, there are implications of a process in which a total delineation of flaws is abbreviatedbecause the inspector believes the nature of the repair makes such a listing unnecessary.Specifically, the inspector has to be correct in his assumption of the nature of necessary repairs.The needed level of flaw delineation, as related to repair actions, is an item that should beaddressed in airline maintenance facility’s training programs for inspectors, if it is not already.
5.3 INSPECTOR DIFFERENCES.
In this section we summarize and discuss the background data collected on each inspector. Wewill also discuss associations of performance with these background variables as well as withdata specific to each inspector, such as times on task.
33

Table 10 gives the minimum, maximum, and median values for several of the backgroundcharacteristics. The “time since B-737 inspections-average all job cards” reflects the time gap inperforming the specific inspections included in the 10 Benchmark job cards. It is calculated foreach inspector by averaging their stated times since last B-737 inspection for each job card. The“time since any B-737 inspection” is the time since an inspector had performed any inspectionson a B-737. Some inspectors had recent experience on a B-737, but not with the specificinspections included in the Benchmark experiment.
TABLE 10. INSPECTOR BACKGROUND SUMMARY
VARIABLE MINIMUM MAXIMUM MEDIAN
Age (years) 32 50 38
Years in aviation 8 27 141/2
Years as visual inspector 4 15 6.5
Time since any B-737 inspection 1 day 0.5 year 1 week
Time since B-737 inspections-average alljob cards 2.5 weeks 3.5 years 8 months
As discussed in section 5.1 there was an inspector effect in the times taken to complete thevarious job cards. This means that over the various job cards included in the Benchmarkexperiment there was a general consistency in the approach of each inspector as reflected in thetime needed to complete the jobs. In addition to the variables related to experience in inspectionand experience on the Boeing 737, the directly measured times taken to perform each job areconsidered here as a reflection of inspector backgrounds.
The performance measures of JC 701 and the tie-clip crack calls of JC 503 did not correlatestrongly with the times taken on each of those job cards. Here, we consider the correlation ofperformances with the times taken on all the job cards. There is little relationship between theaverage job card time and accuracy for JC 701. However for the tie-clip crack calls, there is apositive correlation (Spearman rank correlation = 0.77, p<0.01, one-sided), see figure 7. Thus,the inspectors who took more time (as measured over all the job cards) tended to be moreaccurate in their calls on the tie-clip task.
We can only guess why the association of tie-clip performance is stronger with overall times thanit is with the time taken with the specific job card containing the tie-clip inspection. Onecontributing factor may be that individual job card times were only recorded to the nearest fiveminutes. Another contributing factor is suggested by looking at the top 3 tie-clip performances.They are three of the slowest times (1, 3, and 5 in ranks) in the average job card times over allinspections. They, however, are in the middle of the pack (5, 6, and 8 in ranks) with respect tothe times specific to the tie-clip job card. The same three inspectors are ranked 1, 2, and 3 in thetime (averaged over all job cards) since performing the various B-737 inspections. In general,these three inspectors were the most active in inspecting B-737’s.
34

10
12
14
16
18
20
22
40 50 60 70 80 90Average Task Time (Minutes)
De
tect
ed
Tie
-clip
s
Note: One inspector (Inspector 3) did not do tie-clip JC 503.
FIGURE 7. TIE-CLIP DETECTS VERSUS AVERAGE JOB CARD TIME
Another fairly strong association was noted between tie-clip detection and the measure ofperipheral acuity. Peripheral acuity was not measured directly, but rather the time to complete acard sorting task was measured. Subjects with better peripheral visual acuity have been shown tohave quicker sorting times. The relative position of each inspector (detects as a percentage ofdetects from the top performer) is shown in figure 8 for both the tie-clip detects and the JC 701detects.
0.2
0.3
0.4
0.5
0.6
0.7
0.8
0.9
1
25 35 45 55 65 75 85 95 105 115 125Peripheral Visual Acuity Sort Time
Re
latio
n t
o T
op
In
spe
ctio
n
Tie-Clip Det. 701 Det.
FIGURE 8. INSPECTOR POSITION VERSUS PERIPHERAL ACUITY
35

The peripheral acuity task time was shown to have a negative correlation with the detection ratesof the inspectors in the flashlight lens experiment, as shown in figure 4. However, for the tie-clipjob card in the Benchmark inspections there was a positive correlation, implying that bettervisual acuity was associated with worse performance. Although not statistically significant, thecorrelation of the JC 701 detects with peripheral acuity was negative as it was in the flashlightexperiment data. At first glance these figures seem contradictory¾better peripheral acuity isassociated with better performance in some cases and with worse performance in others.However, the plots in figures 4 and 8 are more informative than the correlation coefficients. Wenote that with sort times between 40 and 80 seconds there seems to be a slight positivecorrelation with the various performance measures and the peripheral acuity sort times (figure 8).When the sort times go beyond 80 seconds, the negative correlation enters. In the IAMinspectors, there were enough subjects with greater than 80 seconds on their sort times that anoverall negative correlation was implied. However among the Benchmark inspectors, there wereonly two whose sort times on the peripheral visual acuity task exceeded 80 seconds and one ofthem did not perform the tie-clip job card. Thus the tie-clip inspections exhibit a positivecorrelation of inspection results over the more limited range of sort times.
Age and the number of years in aviation were other inspector background factors associated withthe performance measures. Of course, these two variables are correlated. In figure 9 the relativeposition of each inspector for the tie-clip inspections and the detections of the cracks in table 8are shown as a function of the number of years in aviation. It is seen from figure 9 that the threeinspectors with the most aviation experience were among the top performers on the aircraft tasks.
0.2
0.3
0.4
0.5
0.6
0.7
0.8
0.9
1
5 10 15 20 25 30Years in Aviation
Re
latio
n t
o T
op
In
spe
ctio
n
Tie-Clip Det. Cracks
FIGURE 9. INSPECTOR POSITION VERSUS YEARS IN AVIATION
36

The inspector variables associated with performance levels that we discussed are time taken toperform all the job cards, peripheral visual acuity sort time, and years in aviation. In summary,worse peripheral visual acuity as measured by longer acuity task times was associated with lesserperformance, but only in the extreme. Experience in the aviation field also was associated withbetter performance. There was a positive association of performance with more deliberate andunhurried behavior as measured by the overall time to perform the inspections.
5.4 JOB CARD RATINGS.
After each job card the inspector was asked to rate the job card as a single task on variousnumbers of standard scales as well as some developed specifically for aircraft inspection. Thefollowing aspects were chosen to cover difficulty, execution, physical discomfort, and physicaland visual access. These were defined as follows:
· Task Difficulty. “How easy or difficult was this task?” Ten point scale (1 = Very Easy/Highly Desirable, to 10 = Impossible).
· Whole Body Exertion. “How much effort did you exert in this task?” Ten point scale(0 = Nothing at All, to 10 = Extremely Strong/Almost Maximum).
· Body Part Discomfort. “How much discomfort/pain do you feel in each body part?” Fivepoint scale (0 = None, to 5 = Intolerable) for each of 19 body parts. This wassummed across body parts for initial analysis.
· Access to Workpoint. “The physical access to get to and from the workpoint was easy.”Five point scale (1 = Strongly Agree, to 5 = Strongly Disagree).
· Access at Workpoint. “The physical access at the workpoint was easy.” Same scale asthe access to workpoint.
· Visibility of Workpoint. “It was easy to see the areas that were to be inspected.” Samescale as previous two scales.
· Freedom from Distractions. “The surface areas to be inspected were free from excessivedistractions with respect to the type of flaws being searched for.” Same scale as previousthree scales.
The analysis of this data considered agreement among the inspectors and the patterns of high orlow values for each job card across inspectors. For each of the scale responses, an analysis ofvariance was performed with inspectors and job cards as factors and using the inspector¾jobcard interaction as an error item. For all seven scales, the effects of both inspectors and job cardswere highly significant (p < 0.0001). Inspectors were different in overall severity or leniency oftheir rating scores specific to a job card but overall they agreed on their relative ratings of eachjob card. In table 11, responses have been categorized as a “+” if the average response for thattask was much higher than the average across all job cards, or a “-” if much lower.
37

TABLE 11. CATEGORIZATION OF INSPECTOR JOB CARD PERCEPTIONS
JOB CARD
RATING SCALE 501 502 503 504 505 506 507 508/9 510 701
Task difficulty + + - - - - + + - -
Whole body exertion + + - - + + - -
Body part discomfort + - - - + + - -
Access to workpoint + - - + -
Access at workpoint + + - - + -
Visibility at workpoint + + - - + -
Freedom from distraction + - + - + + -
Some important patterns emerge from this data. First, the three rating aspects of difficulty,exertion, and discomfort tended to give the same patterns across all job cards. Within thesebroad groupings, there were clearly some job cards which were considered “good” such as 505(Rear Bilge Exterior) and 701 (Lap-Splice Panels) and some as “bad” such as 508/9 (RearBulkhead Y Ring) or 502 (Main Landing Gear Support). Between these were job cards with lowdifficulty but difficult access such as 504 (Galley Doors, Interior) or with high difficulty butneutral access such as 501 (Midsection Floor Beams).
We conclude that inspectors can provide useful data on their perceptions of the different tasks.Also the design of the experiment was successful in achieving a mix of high and low levels ofdifficulty and access across the set of all tasks.
5.5 OBSERVATIONS OF INSPECTION TECHNIQUES.
The monitors recorded the general behavior and techniques that were used by the variousinspectors in their personal log books and in comments on the recording sheets. Theseobservations were supplemented by casual discussions with the inspectors. Techniques that wereprevalent in the inspectors’ facilities and the inspectors’ personal experiences were included inthe discussions.
5.5.1 Job Cards and Supporting Materials.
As part of the Benchmark experiment each inspector was given the set of job cards that he wasexpected to complete during the shift. All job cards contained instructions for generalinspections of an area along with instructions for detailed inspections within the area. Severalcharacteristic techniques for using the job cards were displayed by the inspectors. All of theinspectors glanced over the set of job cards, at the beginning of the shift, to see what they wereexpected to do. At the beginning of each job card several different behaviors were observed.
38
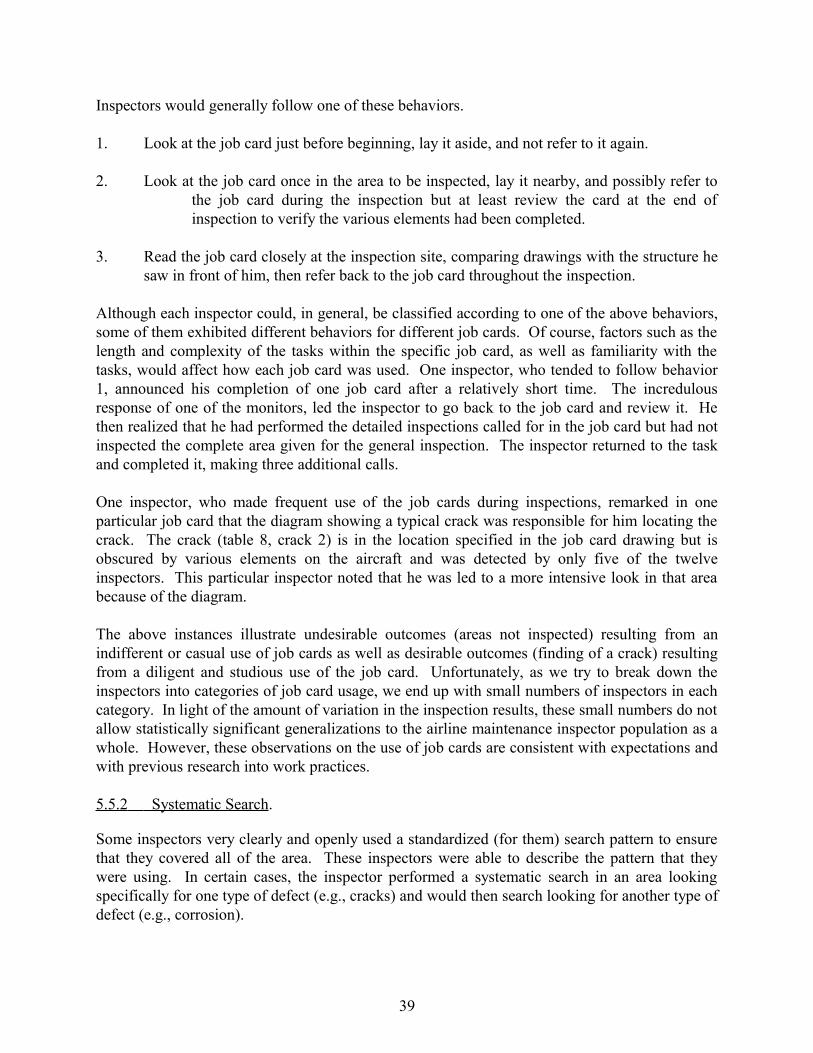
Inspectors would generally follow one of these behaviors.
1. Look at the job card just before beginning, lay it aside, and not refer to it again.
2. Look at the job card once in the area to be inspected, lay it nearby, and possibly refer tothe job card during the inspection but at least review the card at the end ofinspection to verify the various elements had been completed.
3. Read the job card closely at the inspection site, comparing drawings with the structure hesaw in front of him, then refer back to the job card throughout the inspection.
Although each inspector could, in general, be classified according to one of the above behaviors,some of them exhibited different behaviors for different job cards. Of course, factors such as thelength and complexity of the tasks within the specific job card, as well as familiarity with thetasks, would affect how each job card was used. One inspector, who tended to follow behavior1, announced his completion of one job card after a relatively short time. The incredulousresponse of one of the monitors, led the inspector to go back to the job card and review it. Hethen realized that he had performed the detailed inspections called for in the job card but had notinspected the complete area given for the general inspection. The inspector returned to the taskand completed it, making three additional calls.
One inspector, who made frequent use of the job cards during inspections, remarked in oneparticular job card that the diagram showing a typical crack was responsible for him locating thecrack. The crack (table 8, crack 2) is in the location specified in the job card drawing but isobscured by various elements on the aircraft and was detected by only five of the twelveinspectors. This particular inspector noted that he was led to a more intensive look in that areabecause of the diagram.
The above instances illustrate undesirable outcomes (areas not inspected) resulting from anindifferent or casual use of job cards as well as desirable outcomes (finding of a crack) resultingfrom a diligent and studious use of the job card. Unfortunately, as we try to break down theinspectors into categories of job card usage, we end up with small numbers of inspectors in eachcategory. In light of the amount of variation in the inspection results, these small numbers do notallow statistically significant generalizations to the airline maintenance inspector population as awhole. However, these observations on the use of job cards are consistent with expectations andwith previous research into work practices.
5.5.2 Systematic Search.
Some inspectors very clearly and openly used a standardized (for them) search pattern to ensurethat they covered all of the area. These inspectors were able to describe the pattern that theywere using. In certain cases, the inspector performed a systematic search in an area lookingspecifically for one type of defect (e.g., cracks) and would then search looking for another type ofdefect (e.g., corrosion).
39

Systematic search strategies, however, do not guarantee that no area will be missed. Forexample, some inspectors would proceed one bay (area between structural frame members) at atime¾yet they would skip around within this restricted area. This effect appeared to be mostcommon when the inspector’s attention was drawn to a more obvious defect in the area. Theinspector would mark and describe the flaw, then forget where he had been in the search process.
5.5.3 Knowledge of Chronic Problem Areas.
There appeared to be a real advantage for inspectors who were familiar with the model of aircraftthat they were inspecting, especially when this familiarity included knowledge of the chronic ortypical problems for the model. Cracks 11 and 12 in table 8 illustrate the point. These crackswere reported as a chronic problem by most of the nine inspectors that found them. Some of theinspectors even reported that their facility had produced a job card directing an inspectionspecifically to check for these cracks.
More than one inspector noted that they, and their colleagues, often approached specific areas ina confirmatory mode. That is, they were dealing with a chronic problem area and the intention ofthe inspection was to confirm or verify the presence of a flaw. It is likely that the expectation ofa flaw enhances its detection, but this type of familiarity is a mixed blessing. Inspectorsoccasionally became so focused on finding known flaws or the special detailed inspections thatthey missed nearby flaws. For example, we watched one inspector search for a crack that heknew from past experience was at a specific location. He was so focused that he missed a clearlyvisible 1.5-inches crack only 3 inches above that location. (He even went and got a magnifyingglass to search for the crack he knew had to be there.) We observed several more instances ofthis “tunnel vision,” although not always where there were flaws in the immediate area.
On balance, however, intimate knowledge of the chronic or typical problem areas of a particularaircraft model is more help than not. In casual questioning and discussion with the inspectors,the monitors found that the inspectors relied first on personal experience and discussion withother inspectors to gain this knowledge and second, on the chronic problem or “bad actor” listsprovided by their employer. It is not clear if the inspectors assimilate to the same degree thereporting of cracks found by other airlines. General reporting of such finds is often contained inbackground sections of Service Bulletins and is also implied by the inclusion of a typical crack inService Bulletin drawings. This information is intended to provide this kind of familiarity withchronic problems across airlines for the entire fleet. However, this information is far enoughremoved from the personal experience of the inspector that it perhaps does not have the sameimpact, especially considering that some inspectors used the job card to establish the inspectiontask but they did not use it as a reference.
There may be several reasons that the job cards (and the information they reflect) do not appearto be fulfilling a function as vicarious experience. One reason is that they are often difficult tounderstand and apply. This is especially true of drawings. As an example, the special detailedinspection instructions for the main landing gear wheel well show key elements in a constructionstyle drawing (see figure 10). However, the view is from a perspective that cannot be seen in theassembled aircraft. The inspector must mentally reorient the drawing and mentally superimpose
40

other aircraft structure to match what he can see. As decades of research have shown, humans dothis sort of mental task very poorly, with a great deal of effort, and often make mistakes doing so.
Intentionally left blank.
FIGURE 10. INSPECTION DETAIL FROM SERVICE BULLETIN DIAGRAM
41

5.5.4 Definitions of Boundaries for Inspections.
The monitors observed that when an inspection was stated to be from BS639 to BS727 (forexample) different inspectors interpreted this information in different ways. Some inspectorswould inspect from the aft face of the frame at BS639 to the forward face of the frame at BS727,ignoring the edge and other face of the frame. Other inspectors seemed to draw an imaginaryline down the center of the edge of the boundary frames and inspect that edge and the aft andforward faces, respectively. Still other inspectors would examine the entire frame, forward andaft faces and edge on each of the boundary frames.
A procedural question related to what part of the boundary element should be included is theinterpretation of boundary information as meaning “up to, but not including.” That is, someinspectors would inspect an area defined as “from BS277 to BS540 and Stringer 4L to Stringer17L” and inspect everything inside the boundaries but not inspect the frames and stringers citedas boundaries. Although the monitors casually questioned the inspectors, it was never clear as towhether these differences were due to differences in interpretation at different facilities orwhether it was individual differences in interpretation.
It should be noted that to insure adequate inspection coverage and to avoid misinterpreting jobcard boundaries, inspectors often extended the inspection area to encompass adjacent areas.However, several of the inspectors noted that, in the past, they have been questioned by theirsupervisors why they are reporting discrepancies in areas that they were not specifically told toinspect. This observation and the difficulties with diagrams mentioned above reinforce the needto apply good human factors design techniques to job card design [35].
5.5.5 Appeal to NDI Instrumentation.
Although false alarm rates were calculated for the verifiable cracks of Job Card 701 and the tie-clips of Job Card 503, these rates overestimate the number of ultimate false calls as measured byrepair actions taken that are not necessary. The reason that this number is an overestimation isthat, frequently, the inspectors either said, “I would ask for an eddy-current check on this one.” orthey said, “I would grab an eddy-current machine and check this one out.” In these cases, thestickers indicated an area that the inspectors are deferring decision making to other than visualmeans. Thus, they were calls for further examination and would not necessarily lead to needlessrepair or additional down time.
5.6 COMPARISON TO OTHER STUDIES.
A study of field data gathered over three years on the results of inspections of transport aircraftoperated by Japanese airlines concluded that prior information, inspection distance, surfacecondition, and crack origin influenced results [26]. We briefly consider these points as they arerelated to the Benchmark inspections and our observations of those inspections.
Endoh and his colleagues [26] analyzed various factors by constructing normalized cumulativefunctions with respect to crack length for each level of a factor. Thus, for example, to look at theeffect of prior information the field data were separated into two groups. The groups were those
42

finds where prior information was and was not noted. The graphs of the normalized cumulativecount as a function of crack length for each group were then compared. The resultant curveshave the look of probability of detection curves, the ordinate being crack length and the abscissabeing a proportion (0 to 1). They are, however, not PoD curves.
Probability of detection is only one factor of several that could give rise to differences in thesecurves. Another factor that could explain observed differences would be the underlyingpopulation of cracks for each characteristic. For example, directed inspections in a specific areamight be carried out sooner and more often than the general inspections of another area.Therefore, the population of crack lengths at the time of inspection is naturally smaller in thedirected inspections than in the undirected inspection and with no differences in probability ofdetection this would still be reflected in the crack sizes of reported field data.In the current study inspection tasks were constant and differences are reflected by performancelevels as measured over the 12 inspectors. With this introduction we consider the four factorsidentified in reference 27.
· Prior Information. We noted in earlier discussions that specific cracks were reported asbeing in chronic problem areas by the inspectors. Those inspectors expecting tofind cracks found them when they were there. If expectations were high enough,and locations specific enough, the inspectors could be said to be operating in aconfirmatory mode as opposed to a search mode.
· Inspection Distance. There was no specific control on inspection distance in theBenchmark inspections. Most of the inspectors exhibited inspection behaviorswhere they went through great pains to get their eyes close to the area beinginspected. The monitors noted one exception. One inspector seemed to be lessdiscomfort tolerant than the others. He related having devised an inspectionmethod for a task in his facility that allowed him to inspect without having tobend over. The result was that the inspection would be done more removed fromthe area being searched. This same attitude and approach was observed in theBenchmark inspections done by this inspector. This particular inspector was thepoorest performer on finding cracks on the aircraft. It is believed that this wasdue, in part, to not getting close to the inspection.
· Surface Condition. The Japanese reported that the detected crack lengths on dirtysurfaces were longer than on clean surfaces. A common comment for all theBenchmark inspectors was that certain areas were in need of cleaning before aneffective inspection could be done. We have no data on whether there is adifference in detectability for dirty versus clean surfaces, but it is clear that theinspectors expected the surfaces to be clean for them to do an effective inspection.They all reported being able to demand cleanings prior to inspection.
· Crack Origin. The Japanese data showed no differences between cracks emanating fromfastener holes and those from edges. However, they reported a difference between thesetwo categories and the other category. In general, crack length explains very little of the
43

variation seen in detection rates for cracks from all over the aircraft (see discussion insection 5.2.5), but the data have not been fully analyzed with respect to other aspects ofcrack morphology.
6. SUMMARY AND CONCLUSIONS.
There are four broad areas related to visual inspection reliability that will be discussed andsummarized here: quantification of inspection reliability, search and decision aspects of visualinspection, usage of job cards within inspections, and inspector-specific factors affecting visualinspection performance.
It should be re-emphasized that the scope of this program included inspection performance on atransport aircraft. As such, we have looked at inspection performance with respect to naturallyoccurring flaws found on the aircraft. That is, the flaws arise from the stresses and the useconditions of the aircraft. The individual flaws have not been analyzed with respect to ultimatesafety of the aircraft. Any given flaw may be well within the size assumed detectable by themaintenance and inspection programs. We are not raising alarms concerning low detection rateson any particular flaws or set of flaws but rather looking for implications about the inspectionprocess.
It should be emphasized that this program gathered a lot of data related to inspection behaviors.The factors discussed here represent a top level look at that data. We expect that additionalanalysis of the data, including the videotapes of the inspections, is likely to yield additionalinsights into the inspection process.
6.1 PROBABILITY OF DETECTION.
Inspection programs are set using damage tolerance ideas integrated with probability of detectionfor specific types of flaws. The crack characteristic often used to express a probability ofdetection is crack length. In this program we included a set of lap-splice panels with knowncracks from beneath rivets to estimate the probability of detection curves as a function of cracklength for each inspector.
The probability of detection curves estimated for each inspector exhibited substantial inspector-to-inspector variation. Crack lengths at which a 90 percent detection rate is achieved rangedfrom 0.16 to 0.91 inch across the 12 inspectors. False call rates differed substantially even withcomparable performance in detections. False calls in this context indicate that the inspector feltthat the area required further checking with nondestructive testing.
One practical implication of the PoD variability is that any experimental program comparing twopopulations of inspectors (with a modest number of inspectors from each population) will bereliable in detecting only large differences in population means. More exact quantification ofsample size requirements can be found in standard statistical texts and in reference 30.
44
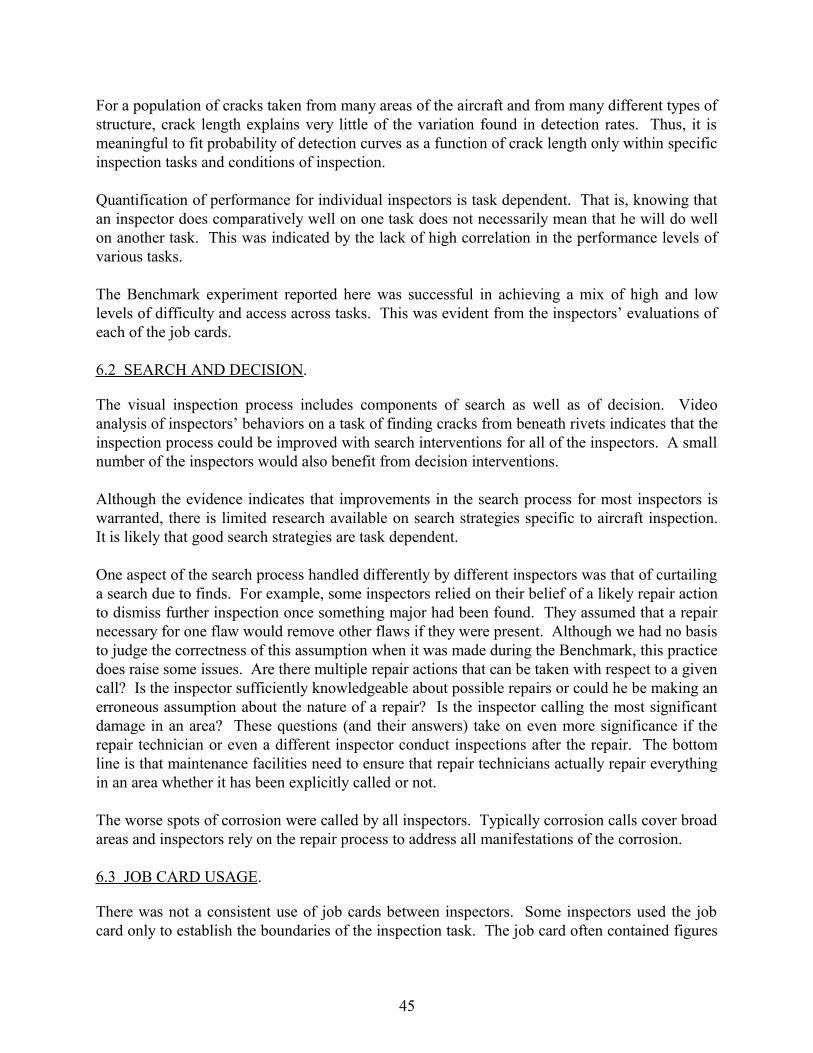
For a population of cracks taken from many areas of the aircraft and from many different types ofstructure, crack length explains very little of the variation found in detection rates. Thus, it ismeaningful to fit probability of detection curves as a function of crack length only within specificinspection tasks and conditions of inspection.
Quantification of performance for individual inspectors is task dependent. That is, knowing thatan inspector does comparatively well on one task does not necessarily mean that he will do wellon another task. This was indicated by the lack of high correlation in the performance levels ofvarious tasks.
The Benchmark experiment reported here was successful in achieving a mix of high and lowlevels of difficulty and access across tasks. This was evident from the inspectors’ evaluations ofeach of the job cards.
6.2 SEARCH AND DECISION.
The visual inspection process includes components of search as well as of decision. Videoanalysis of inspectors’ behaviors on a task of finding cracks from beneath rivets indicates that theinspection process could be improved with search interventions for all of the inspectors. A smallnumber of the inspectors would also benefit from decision interventions.
Although the evidence indicates that improvements in the search process for most inspectors iswarranted, there is limited research available on search strategies specific to aircraft inspection.It is likely that good search strategies are task dependent.
One aspect of the search process handled differently by different inspectors was that of curtailinga search due to finds. For example, some inspectors relied on their belief of a likely repair actionto dismiss further inspection once something major had been found. They assumed that a repairnecessary for one flaw would remove other flaws if they were present. Although we had no basisto judge the correctness of this assumption when it was made during the Benchmark, this practicedoes raise some issues. Are there multiple repair actions that can be taken with respect to a givencall? Is the inspector sufficiently knowledgeable about possible repairs or could he be making anerroneous assumption about the nature of a repair? Is the inspector calling the most significantdamage in an area? These questions (and their answers) take on even more significance if therepair technician or even a different inspector conduct inspections after the repair. The bottomline is that maintenance facilities need to ensure that repair technicians actually repair everythingin an area whether it has been explicitly called or not.
The worse spots of corrosion were called by all inspectors. Typically corrosion calls cover broadareas and inspectors rely on the repair process to address all manifestations of the corrosion.
6.3 JOB CARD USAGE.
There was not a consistent use of job cards between inspectors. Some inspectors used the jobcard only to establish the boundaries of the inspection task. The job card often contained figures
45

giving locations of likely cracks and therefore could be a valuable reference. In one instance of acrack being present at the exact location shown in the job card, five inspectors detected it andseven inspectors did not. The misses are attributed, in part, to poor use of the job card.Reference to the job card during the inspection, or at the very least using it as a final checklist toverify a completed inspection would likely lead to better inspection performance.
Job cards are not without their problems. Typical diagrams of inspection areas often do not lookat all like the area the inspector will be looking at on the aircraft. This can be due to not showingthe structure as it would be viewed by the inspector. The diagrams often do not containsurrounding structure that may partially obscure the elements being presented. They may alsogive an orientation specific to only one side of the aircraft, expecting the inspector to be able tomentally reorient the whole diagram. These problems could be helped by the inclusion ofphotographs of inspection areas as they will appear and better graphical design showing not onlythe structure to be inspected but also, through appropriate shading, the structure that isobstructing a clear view.Job cards also should be clear in defining the boundaries of an inspection. We observed thatwhen an inspection was stated to be from BS639 to BS727 (for example) different inspectorsinterpreted this in different ways. Some inspectors would inspect from the aft face of the frameat BS639 to the forward face of the frame at BS727, ignoring the edge and other frame faces.Other inspectors would examine the entire frame, forward and aft faces and edge on each of theboundary frames.
6.4 VISUAL INSPECTION PERFORMANCE FACTORS.
The inspectors in the Benchmark program were observed on 10 different job cards. The jobcards reflected variations in accessibility and in visual complexity. The times taken for each jobcard reflected both a job card effect as well as an inspector effect. That is, inspectors that werequicker in their inspections tended to be quicker across all the job cards. The time taken for aspecific job card, such as the tie-clip inspections, did not exhibit a strong association withperformance in that task. However, the inspectors who took more time (as measured over all thejob cards) tended to be more accurate in their calls on the tie-clip task.
There were several background factors that were associated with performance. Peripheral visualacuity (as reflected in times to complete a controlled search task) and aviation background wereassociated with performance levels.
The extreme high values of the peripheral visual acuity times (less peripheral acuity) wereassociated with a drop in performance levels. However, over a more limited range of theperipheral acuity time, an increase in performance was noted. The observed association ofperformance with peripheral acuity is consistent with the observation that visual search is a factorlimiting performance.
There was no clear relationship between recent experience in a specific inspection area andperformance in that area. However, there was an association with aviation background and
46
performance levels. The more experienced inspectors, as measured by aviation background (notinspection background), also performed better.
An issue related to the overall experience level is the expectation of finding cracks in specificareas. The Benchmark experiment included areas containing cracks that were expected by manyof the inspectors, but were missed by others. The inspectors expecting to find these crackslooked directly at the area and confirmed their presence. The inspectors missing the cracks wereobserved to search the area (as evidenced by movement of the flashlight beam), but failed in thesearch process.
The down side of expecting to find a flaw in a specific area is a tendency to focus on that areaand possibly alter search patterns in adjacent areas. This behavior was observed both when theexpected flaw was present and when it was not present. In the latter case, the inspector devotedsubstantial time to a thorough inspection in the area he believed would be flawed and neglectedimmediately adjacent areas where flaws were present.
The flashlight is the most used tool in visual inspection. An improvement in the illuminationuniformity of the beam has been suggested by installing a diffuser lens. We looked at inspectionperformance on a task of finding cracks from beneath fasteners where each inspector used aregular and a light shaping diffuser lens in a flashlight under different ambient light conditions.Under the conditions used, the enhanced lens did not hinder, but did not greatly enhance crackdetection performance. It is possible that performances would be enhanced with tasks other thanthe one observed.
7. REFERENCES.
1. Shagam, R.N., Light Shaping Diffusers for Improved Visual Aircraft Inspection,DOT/FAA/AR95/32, October 1995.
2. Goranson, U.F. and Rogers, J.T., “Elements of Damage Tolerance Verification,” 12thSymposium of International Commercial Aeronautical Fatigue, Toulouse, France,May 1983.
3. Bobo, S.N. and Puckett, C.H., Visual Inspection for Aircraft, Draft Advisory CircularAC 43-XX, FAA Aging Aircraft Program, Federal Aviation Administration,Atlantic City International Airport, New Jersey.
4. Latorella, K.A. and Drury, C.G., “A Framework for Human Reliability in AircraftInspection,” 7th Federal Aviation Administration Meeting on Human FactorsIssues in Aircraft Maintenance and Inspection, Atlanta, Georgia, August 1992.
5. Drury, C., “The Speed-Accuracy Tradeoff in Industry,” Ergonomics, Vol 37, No. 4,pp. 747-763, 1994.
6. Drury, C.G. and Addison, J.L., “An Industrial Study of the Effects of Feedback and FaultDensity in Inspection Performance,” Ergonomics, Vol 16, pp. 159-169, 1973.
47

7. Wickens, C., Engineering Psychology and Human Performance, Scott, Foresman andCompany, 1984.
8. Drury, C.G., “Exploring Search Strategies in Aircraft Inspection,” in Brogan, D. (ed)Visual Search, Taylor and Francis Ltd., London, England, 1990.
9. Galwey, T. and Drury, C., “Task Complexity in Visual Inspection,” Human Factors,Vol 28, pp. 595-606, 1986.
10. Noro, K., “A Descriptive Model of Visual Search,” Human Factors, Vol 25, pp. 93-101,1983.
11. Drury, C.G., “The Effect of Speed Working on Industrial Inspection Accuracy,” AppliedErgonomics, Vol 4, pp. 2-7, 1973.
12. Newton, T. et al., “Personality and Performance on a Simple Visual Search Task,”Personality and Individual Differences, Vol 13, pp. 381-382, 1992.
13. Megaw, E.D., “Factors Affecting Inspection Accuracy,” Applied Ergonomics, Vol 10,pp. 27-32, 1979.
14. Splitz, G. and Drury, C., “Inspection of Sheet Materials: Test of Model Predictions,”Human Factors, Vol 20, pp. 521-528, 1978.
15. Megaw, E. D. and Richardson, J., “Eye Movements and Industrial Inspection,” AppliedErgonomics, Vol 10, pp. 145-154, 1979.
16. Kleiner, B., Drury, C., and Christopher, G., “Sensitivity of Human Tactile Inspection,”Human Factors, Vol 29, No. 1, pp. 1-7, 1987.
17. Noro, K., “Analysis of Visual and Tactile Search in Industrial Inspection,” Ergonomics,Vol 27, No. 7, pp. 733-743, 1984.
18. Konz, S. and Desai, S., “Tactile Inspection Performance With and Without Gloves,”Human Factors 27th Annual Meeting: Turning the Tide of Technology, 1983.
19. Wilson, J. R., Corlett, E. N., The Evaluation of Human Work, A Practical ErgonomicsMethodology, Taylor and Francis Ltd, 1990.
20. Drury, C.G. and Lock, M.W.B., “Ergonomics in Civil Aircraft Inspection,” ContemporaryErgonomics¾Proceedings of the Ergonomics Society’s 1992 Annual Conference,Birmingham England, 7-10 April 1992.
21. Drury, C.G., “Errors in Aviation Maintenance: Taxonomy and Control,” Proceedings ofthe Human Factors Society-35th Annual Meeting, 1991.
48

22. Rasmussen, J. and Vicente, K., “Coping with Human Errors Through System Design¾Implications for Ecological Interface Design,” International Journal of ManMachine Studies,Vol 31, No. 5, pp. 517-534, 1989.
23. Drury, C. and Lock, M., Reliability in Aircraft Inspection, UK and USA Perspectives,CAA Paper 94001, 1994.
24. Taylor, J., “Organizational Context for Aircraft Maintenance and Inspection,”Proceedings of the Human Factors Society 34th Annual Meeting, 1990.
25. Proceedings of the 10th FAA/AAM Meeting on Human Factors in Aviation Maintenanceand Inspection, Alexandria, Virginia, January 1996.
26. Endoh, S., Tomita, H., Asada, H., and Sotozaki, T., “Practical Evaluation of CrackDetection Capability for Visual Inspection in Japan,” 17th SymposiumInternational Committee on Aeronautical Fatigue, Stockholm, Sweden, 1993.
27. Drury, C.G., Improving Inspection Performance, Chapter 8.4 of Handbook of IndustrialEngineering, G. Salvendy (ed), Wiley, NY, 1984.
28. Sheehan, J.J. and Drury, C.G., “The Analysis of Industrial Inspection,” Applied Ergonomics,B, pp. 74-78, 1971.
29. Spencer, F.W. and Schurman, D.L., “Reliability Assessment at Airline InspectionFacilities, Vol III: Results of an Eddy-Current Inspection Reliability Experiment,”DOT/FAA/CT-92/12,III, May 1995.
30. Nelson, L.S., “Sample Sizes for Two-Sample Tests on Means,” Journal of QualityTechnology, Vol 24, No. 2, pp. 103-108, 1992.
31. Drury, C.G. and Sinclair, M.A.. “Human and Machine Performance in an InspectionTask,” Human Factors, Vol 25, No. 4, pp. 391-399, 1983.
32. Gramopadhye, A., Drury, C.G., and Prabhu, P.V., “Training for Visual Inspection ofAircraft Structures,” Human Factors in Aviation Maintenance¾Phase 3, Volume 1Progress Report, DOT/FAA/AM-93/15, Springfield, VA, National TechnicalInformation Service, August 1993.
33. Kleiner, B.M. and Drury, C.G., “Design and Evaluation of an Inspection TrainingProgramme,” Applied Ergonomics, Vol 24, No. 2, pp. 75-82, 1993.
34. Courtney, A.J., “A Search Task to Assess Visual Lobe Size,” Human Factors, Vol 26,No. 3, pp. 289-298, 1984.
35. Patel, S., Prabhu, P., and Drury, C.G, “Design of Work Control Cards,” Proceedings of the7th FAA Meeting on Human Factors Issues in Aircraft Maintenance and Inspection, Atlanta,Georgia, August 1992.
49