Embed Size (px)
Citation preview
Astrophys Space SciDOI 10.1007/s10509-013-1551-x
O R I G I NA L A RT I C L E
The Stokes phase portraits of descattered pulse profiles of a fewpulsars
Abdujappar Rusul · Ali Esamdin · Xiao-Ping Zheng ·Jian-Ping Yuan
Received: 26 December 2012 / Accepted: 26 June 2013© Springer Science+Business Media Dordrecht 2013
Abstract The observing signals from pulsar are always in-fluenced by the interstellar medium (ISM) scattering. Inthe lower frequency observation, the intensity profiles arebroadened and the plane of polarization angle (PPA) curvesare flattened by the scattering effect of the ISM. So beforewe analyze the scattered signal, we should take a properapproach to clear scattering effect from it. Observing dataand simulation have shown that the Stokes phase portraitsI–U , I–Q and Q–U are also distorted by the ISM scat-tering. In this paper, a simulation is held to demonstrate ascattering and a descattering of the Stokes phase portraitsof a single pulse profile of a pulsar. As a realization of thesimulation method, this paper has studied the descatteringof Stokes phase portraits of lower frequency observationof PSR B1356−60, PSR B1831−03, PSR B1859+03, PSRB1946+35.
Keywords Stars: pulsar · Interstellar medium
1 Introduction
ISM always cause scintillation and scattering effect to thepulse signals of pulsar (Scheuer 1968) and it may damages
A. Rusul (B)Institute of Astrophysics, Central China Normal University,Wuhan, Chinae-mail: [email protected]
A. Rusul · X.-P. ZhengThe Institute of Astrophysics, Huazhong Normal University,Wuhan 430079, China
A. Esamdin · J.-P. YuanXinjiang Astronomical Observatory, Chinese Academyof Science, Urumqi 830011, China
some of the observing data. The scattering effect of ISMto the pulse profile and the PPA curve have been studiedby many authors (Rankin et al. 1970; Kuzmin and Izvekova1993; Bhat et al. 2003; Li and Han 2003; Rusul et al. 2012).Some of them have put forward a several useful model tointerpret the observing phenomena of pulse broadening andPPA curve flattening (Rankin et al. 1970; Komesaroff et al.1972; Williamson 1972); some of them have studied a modelto recover original pulse shape (Kuzmin and Izvekova 1993;Bhat et al. 2003) and PPA curve of some pulsars from scat-tering effect (Rusul et al. 2012).
As mentioned above, the Stokes parameters are disturbedby a scattering effect when the signal travels in the ISM,so it is natural to think that the ISM scattering can affectthe Stokes phase portraits of I–Q, I–U and Q–U . Un-til now a very few attempts are made to the study of theStokes phase portraits which hold additional information ofthe emission geometry of pulsar. Through frequent observa-tion and studying, researchers put up a several models suchas the Radius-to-frequency mapping (RFM) model (Lorimerand Kramer 2005) and the Rotating-vector model (RVM)(Radhakrishnan and Cooke 1969) which were closely re-lated to the geometry of pulsar emission surface. But, re-cently, researchers (Chung and Melatos 2011a, 2011b) haveanalyzed the observing data of some pulsars in a Stokesphase portraits form and they found that the Stokes phaseportraits of 24 pulsars have shown that the emission heightsinferred from the Stokes tomography technic (Chung andMelatos 2011a) are different from the emission heights de-rived from the RFM model. The Stokes phase portraits ofknown low-latitude emission of 24 pulsars they examinedrevealed that the 60 % of them may well originated fromhigh altitudes (Chung and Melatos 2011a). By consideringthe importance of studying the Stokes phase portraits, wecontinued the previous work (Rusul et al. 2012), in which
Astrophys Space Sci
we mainly examined the descattering of the PPA curve. Inthis paper, we have noted that ISM scattering can damageand distort some of the observed Stokes phase portraits; forsome pulsars, without recovering the data from ISM scat-tering effect would mislead our analysis (see Sect. 3). Wehave recovered pulse intensity and PPA curve shape in pre-vious work (Rusul et al. 2012) by adding simple tricks to themodel of Kuzmin and Izvekova (1993). In this paper, we willstudy the ISM scattering effect to the Stokes phase portraitsof I–Q, I–U and Q–U and will provide the descattering ofStokes phase portraits of four pulsars. The method is simplydescribed in Sect. 2, results of simulation and application aregiven in Sect. 3, discussions and conclusions are presentedin Sect. 4 and in Sect. 5 respectively.
2 A method of compensation for scattering
According to the distribution scale of irregularities of theelectron densities in the ISM, the scattering models arenamed thin screen, thick screen and extended screen model.The formulae of those models and procedure description ofdescattering are given below (see Rusul et al. 2012 for moredetails).
gthin = exp(−t/τs) (t ≥ 0) (1)
gthick =(
πτs
4t3
)1/2
exp
(−π2τs
16t
)(t > 0) (2)
gextend =(
π5τ 3s
8t5
)1/2
exp
(−π2τs
4t
)(t > 0) (3)
where τs is scattering broadening time scale which is de-termined through pulse profile fitting and also from empiri-cal relation between wavelength (λ) and dispersion measure(DM) (Ramachandran et al. 1997). By using above scatter-ing model, we can hold descattering to the scattered pulseprofiles. The frequency spectrum of original pulse x(t) andobserved scattered pulse y(t) are related by the equation
X(f ) = Y(f )/G(f ) (4)
Y(f ) =∫
y(t) exp(−j2πf t)dt (5)
G(f ) =∫
g(t) exp(−j2πf t)dt (6)
G(f ) is the frequency response of ISM, for more details seeKuzmin and Izvekova (1993). The descattered restored totalintensity pulse profile is
x(t) =∫
X(f ) exp(j2πf t)df (7)
The Stokes parameters of Q, U are can be derived byassuming Z(t) = Q + iU ; the descattered complex numberfrom the frequency spectrum of observed Z(t)
L(f ) = Z(f )/G(f ) (8)
after applying an inverse Fourier transform, we can get
L(t) =∫
L(f ) exp(j2πf t)df ; (9)
from Eq. (7) and Eq. (9) one can obtain the descatteredStokes parameters I , Q, U . To get the descattered Stokesphase portraits there maybe tow ways to do the best fit. Thefirst one is a fitting the descattered pulse profile to the in-trinsic one, higher frequency signals which have negligiblescattering effect; the second one is a iterative method to fitthe descattered Stokes phase portraits to the intrinsic one.This paper chosen the first one and has found that the fittingresults of scattering time scales of Rusul et al. (2012) areuseful. So, all the fitting results of τs of Rusul et al. (2012)are applied in this paper. In plotting, Stokes parameter I isplotted on the horizontal axis in all figures of Stokes phaseportraits of I–Q and I–U while the Q and U are plottedon the vertical axis. In Q–U portraits, Q is plotted on hori-zontal axis and U is plotted on vertical axis. All plots fromFig. 1 to Fig. 5 are normalized by their own peak value.
3 Simulation and practical application
3.1 Simulation of scattering and descattering of Stokesphase portraits
The scattering effect and it’s descattering for the intensitypulse profiles and PPA curves are simulated in the work ofRusul et al. (2012). We have mainly simulated scattering anddescattering for Stokes phase portraits of a single pulse pro-files of pulsar with each of the three different models. Foran illustration of the simulation, the thick screen model isapplied here. The simulated pulse profiles have Gaussianshape, with PPA(ψ ) curves following the RVM (Radhakr-ishnan and Cooke 1969). This paper has assumed the rate oflinear intensity in total intensity is 0.7, so that the Stokes pa-rameters Q, U can be expressed in terms of the linear inten-sity rate and PPA by Q = 0.7I cos(2ψ), U = 0.7I sin(2ψ)
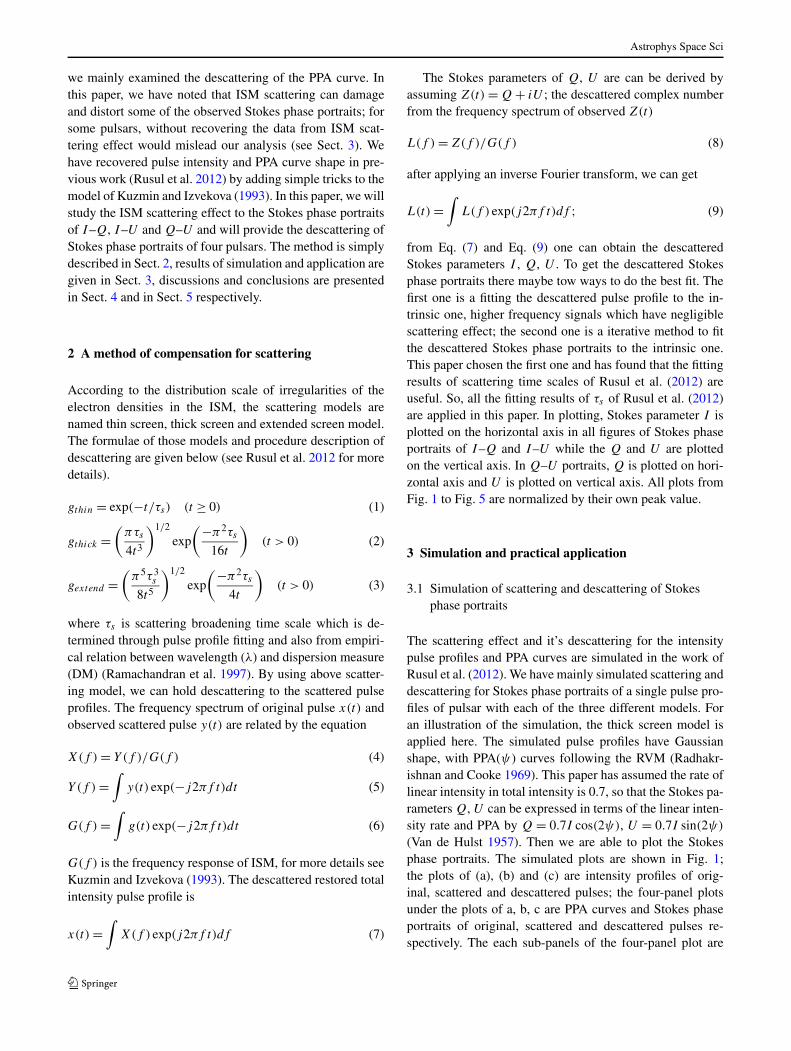
(Van de Hulst 1957). Then we are able to plot the Stokesphase portraits. The simulated plots are shown in Fig. 1;the plots of (a), (b) and (c) are intensity profiles of orig-inal, scattered and descattered pulses; the four-panel plotsunder the plots of a, b, c are PPA curves and Stokes phaseportraits of original, scattered and descattered pulses re-spectively. The each sub-panels of the four-panel plot are
Astrophys Space Sci
Fig. 1 Simulation of Stokes phase portraits of a single pulse for scat-tering and descattering. The plots of (a), (b) and (c) are intensity pro-files of original, scattered and descattered pulses; the four panel plotsunder the plot of (a), (b), (c) are Stokes phase portraits and PPA curves
of original, scattered and descattered pulses. The each sub-panels ofthe four panel plot are PPA curves, Q–U , I–U and I–Q (clockwisefrom top left)
PPA curves, Q–U , I–U and I–Q phase portraits (clock-wise from top left). The simulation shows that ISM scatter-ing causes some sort of changes to the shape of Stokes phaseportraits. For instance it causes Q–U asymmetry, straiteningof I–Q (hockey stick shape becomes stick shape, Chung andMelatos 2011a) and I–U shrunk (see Fig. 1). In this simula-tion we take the scattering time scale 35 ms and noticed thatsome of the Stokes phase portraits are not as susceptible asthe intensity profiles and PPA curves to the scattering effect.For example I–U . The scattering effect to the Stokes phaseportraits seems small, comparing with the pulse profiles andPPA curve, but it is worth to be noted. It can also foundfrom the figures that, in principle, it is possible to eliminatethe scattering effect if the scattering screen is clearly formu-lated.
3.2 Recovering the Stokes phase portraits
The data in this paper are downloaded from European PulsarNetwork (EPN) online database (Lorimer et al. 1998).1 Allthe observed lower frequency pulse profiles of this four pul-sars show obvious pulse profile broadening and PPA curveflattening (see Figs. 2–5, top left). A descattering compensa-tion of the intensity pulse profile and PPA curve of the lower-frequency pulses of those pulsars are completed by Rusul
1http://www.mpifr-bonn.mpg.de/old_mpifr/div/pulsar/data/browser.html.
et al. (2012). The main focus of this section is to present thedescattered Stokes phase portraits and its analysis. Observa-tions showed that ISM scattering have no much effect to thehigh frequency signals than to the lower-frequency one. Sothe higher frequency pulses’s Stokes phase portraits are cho-sen as an intrinsic Stokes phase portrait (it has no obviousscattering effect in itself) for comparison with the descat-tered Stokes phase portraits. The scattering time scales ofthose four pulsars was achieved through fitting the pulseprofile in the work of Rusul et al. (2012). In this paper, wereviewed previous method and derived the same results fordescattering Stokes phase portraits; for brief reference, herewe retabulate few of the τs and relative data of four pulsars(see Table 1).
This paper has tested all τs of the three models for ob-taining the good descattered Stokes phase portraits. For theconvenience of further analysis of the descattered phaseportraits, the intensity profiles and PPA curves are givenalong with Stokes phase portraits in all figures (adoptedfrom Rusul et al. 2012). From Fig. 2 to Fig. 5, the topleft four-panel plots are intensity profiles of observed scat-tered (total intensity profile in (a) and linear intensity pro-file in (b)), descattered (total intensity profile with thick linein (c) and linear intensity profile with thick line in (d)),and intrinsic signals (total intensity profile with dotted linein (c) and linear intensity profile with dotted line in (d))respectively (see Fig. 2); the observed scattered Stokesphase portraits are placed on the top right panel, the bot-
Astrophys Space Sci
Table 1 Parameters of four pulsars and their scattering time scales insome scattering models. The parameters are tabulated from column oneto column eight as pulsar name, period, dispersion measure, observed
higher frequency and lower frequency, empirical value of scatteringtime scale by Eq. (4), time scale for thick-screen, time scale for ex-tended screen
PSR name P (ms) DM (pc cm−3) Freq. (GHz) Freq. (GHz) τem (ms) τthick (ms) τextend (ms)
B1356−60 127.503335 294.133 1.56 0.659594 9.88 0.5
B1831−03 686.676816 235.800 0.610 0.408 29.63 6.5
B1859+03 655.445115 402.900 0.925 0.606 60.97 5.5
B1946+35 717.306765 129.050 0.61 0.408 1.87 6.0
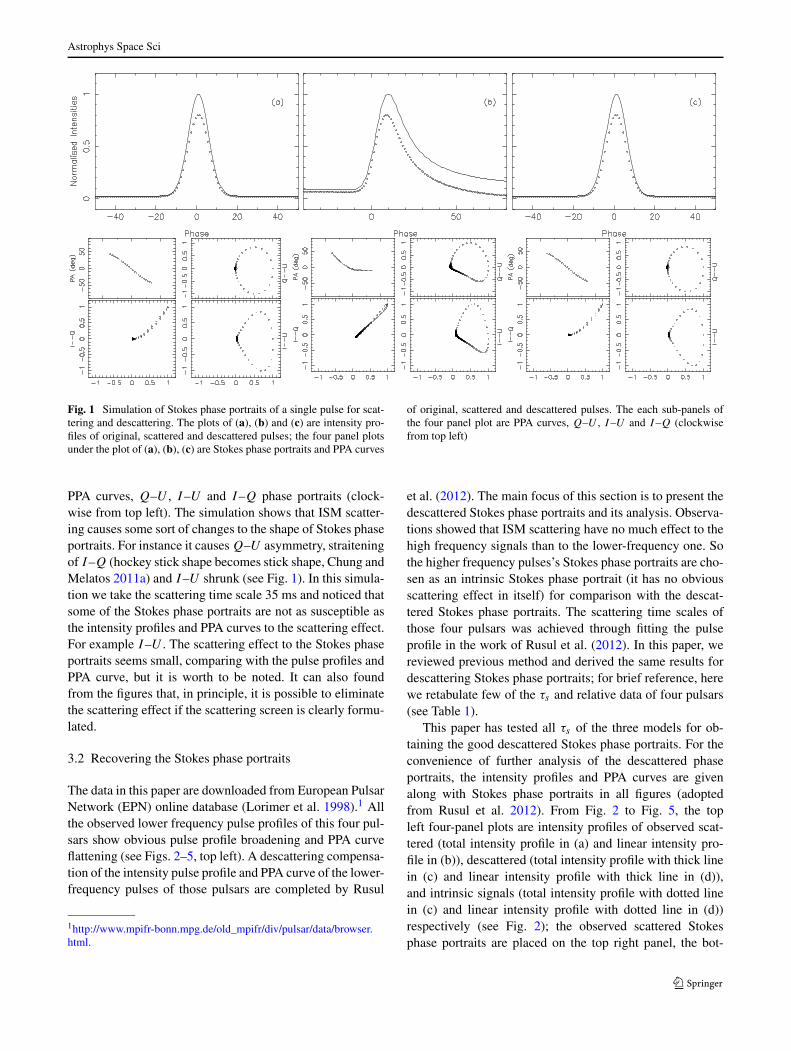
Fig. 2 PSR B1356−60, the top left four panel plots are observed scat-tered total intensity profile (a) and linear intensity profile (b). The thicklines in (c) and (d) are descattered total and linear intensity pulse pro-files respectively and the dotted lines are observed intrinsic total inten-sity pulse profile and linear intensity pulse profile. The observed Stokes
phase portraits are placed on the top right panel, the bottom left panelis descattered Stokes phase portraits, the bottom right panel is intrinsicStokes phase portraits. The sub-panels of the latter three panels (clock-wise from left top) are PPA curves, Q–U , I–U , I–Q
tom left panel is descattered stokes phase portraits, the bot-tom right panel is intrinsic Stokes phase portraits. The sub-four-panels of the latter three panels are PPA curves, Q–U ,I–U , I–Q phase portraits (clockwise from top left). Be-cause, it is hardly possible to construct complete look-uptable of Stokes phase portraits by the formula of RVM,so we used the simulated Stokes phase portraits of look-up tables of Chung and Melatos (2011a) for analyzing thedescattered results. The Stokes parameters of Chung andMelatos (2011a) are generated on the base of similar as-sumption of RVM. They had provided us a large set ofStokes phase portraits with different emission models at dif-ferent emission height, α and i (i = α + β); here α is in-clination angle between rotational axis and magnetic axis, i
observers inclination angel between rotational axis and lineof sight, β is the impact parameter (Lorimer and Kramer2005). After descattering, we have tried to check similarphase portraits from the simulated look-up tables (Chungand Melatos 2011a) to confirm and analyze descatteringphase portraits.
Figure 1 shows that ISM scattering changed the symme-try of balloon shape of Q–U and heart shape of I–U andstraitened the hockey stick shape of I–Q. But after descat-tering, the balloon shape of Q–U and heart shape of I–U
are more symmetric than their scattered one, the scatteredstick shape of I–Q becomes hockey stick shape again af-ter descattering. The main features of single pulse simula-tion of phase portraits are balloon and heart shape of Q–U ,
Astrophys Space Sci
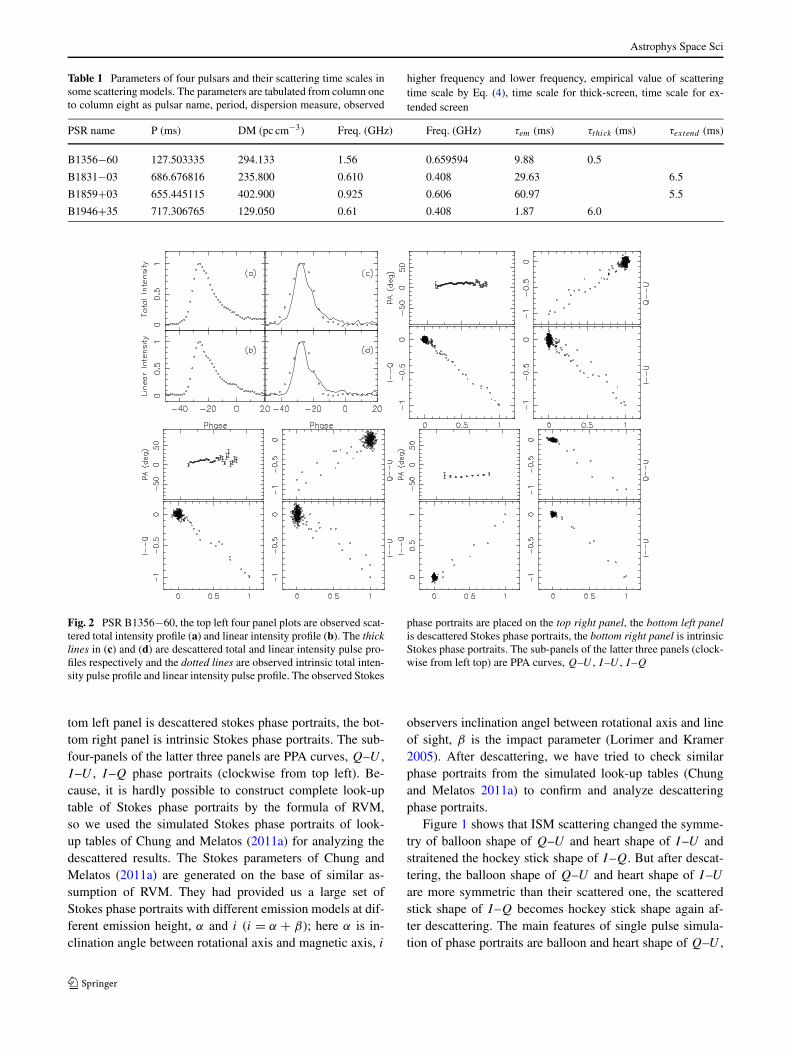
Fig. 3 Descattered pulse profiles and Stokes phase portraits for PSR B1831−03. See Fig. 2 caption for details
heart and banana shape of I–U and hockey stick and bananashape of I–Q (Chung and Melatos 2011a). In this simula-tion, we demonstrated the main effect of ISM scattering tothe Stokes phase portraits as an asymmetric shape of Q–U ,I–U and a stick shape of I–Q. The descattered phase por-traits of Fig. 1 are compared with Fig. 6 of pure dipole fieldat a low emission altitude of Chung and Melatos (2011a). Itis found that the original and descattered Stokes phase por-traits match well with the plots of Fig. 6 to Fig. 9 of Chungand Melatos (2011a) at 40◦ ≤ i ≤ 50◦ and 10◦ ≤ α ≤ 20◦,the scattered one does not match any of the Stokes phaseportraits in the look-up table. This may implies that the ISMscattering affects the Stokes phase portraits.
Figure 2, PSR B1356−60, shows the descattered Stokesphase portraits of a pulse signal observed at 0.659594 GHz;the higher frequency pulse is observed at 1.56 GHz; all threeτs are tested, the application of thick screen model is pre-sented here. Unlike the scattered one, the recovered portraitsof Q–U and I–U show more symmetric shape in most oftheir phase portraits; phase portrait I–Q almost remainedunchanged. The descattered Stokes phase portraits showedsimilarity with Fig. 38 to Fig. 45 of current-modified dipolefield model of Chung and Melatos (2011a) at 70◦ ≤ i ≤ 80◦and 30◦ ≤ α ≤ 40◦. Descattered phase portraits and intrinsicportraits have similar shape; without considering the direc-tion of Stokes phase portraits the two emission frequencymight originated from the same emission height of pulsarsurface (Chung and Melatos 2011a).
Figure 3, PSR B1831−03, shows the descattered Stokesphase portraits of a pulse signal observed at 0.4 GHz; thehigher frequency pulse is observed at 0.61 GHz; all threeτs are tested, the application of extended screen model isgiven here; the descattered Stokes phase portraits Q–U andI–U showed weak symmetry or regular pattern in theirshape. The twisted phase portraits of I–Q is recovered asa hockey stick shape (without considering the orientation).The descattered phase portraits found similarity with Fig. 38to Fig. 41 of current-modified dipole field model of Chungand Melatos (2011a) at i ∼ 50◦ and 10◦ ≤ α ≤ 30◦. Al-though the pulse profiles well matched with the intrinsic one(top left panel in Fig. 3), but the descattered Stokes phaseportraits displayed no similarity with the intrinsic phase por-traits.
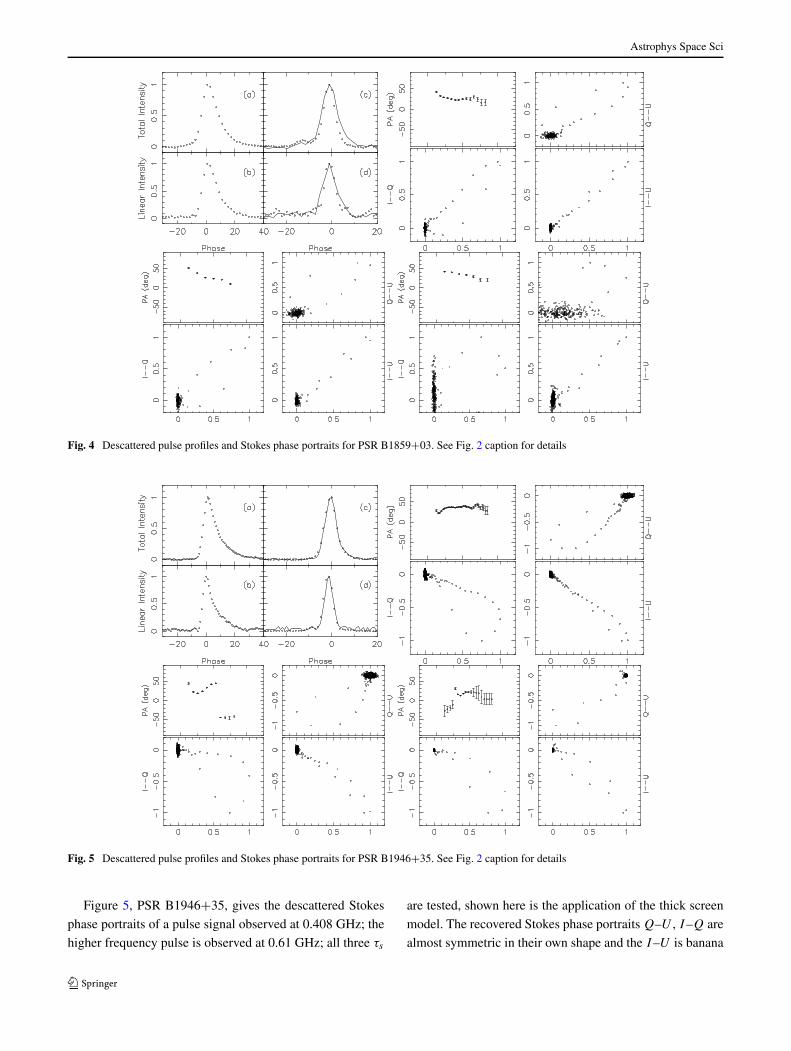
Figure 4, PSR B1859+03, presents the descatteredStokes phase portraits of a pulse signal observed at0.606 GHz; the higher frequency pulse is observed at0.925 GHz; all three τs are tried, the presented plots in Fig. 4are obtained by using extended screen model. The descat-tered phase portraits Q–U showed weak balloon shape,the phase portraits of I–U showed symmetric shape. Thephase portrait of I–Q in scattered and in descattered al-most remain it’s own shape of banana. The recovered Stokesphase portraits are similar with Fig. 53 to Fig. 56 of current-modified dipole field model of Chung and Melatos (2011a)at 70◦ ≤ i ≤ 80◦ and 20◦ ≤ α ≤ 30◦.
Astrophys Space Sci
Fig. 4 Descattered pulse profiles and Stokes phase portraits for PSR B1859+03. See Fig. 2 caption for details
Fig. 5 Descattered pulse profiles and Stokes phase portraits for PSR B1946+35. See Fig. 2 caption for details
Figure 5, PSR B1946+35, gives the descattered Stokes
phase portraits of a pulse signal observed at 0.408 GHz; the
higher frequency pulse is observed at 0.61 GHz; all three τs
are tested, shown here is the application of the thick screen
model. The recovered Stokes phase portraits Q–U , I–Q are
almost symmetric in their own shape and the I–U is banana
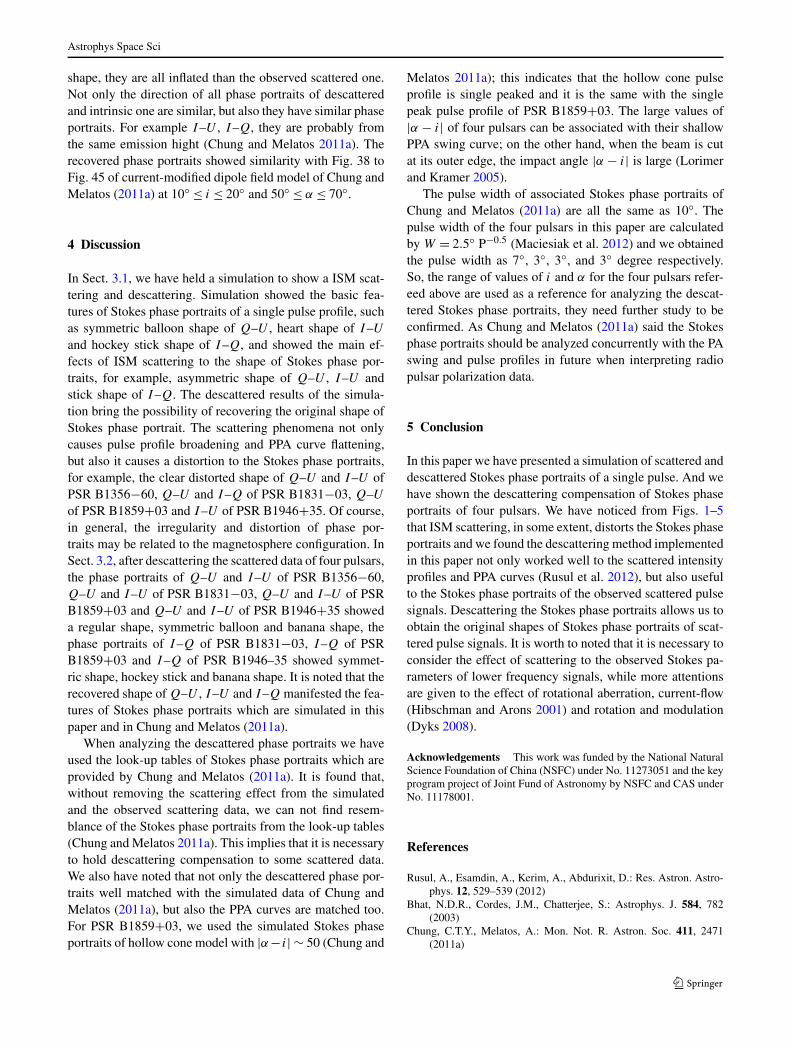
Astrophys Space Sci
shape, they are all inflated than the observed scattered one.Not only the direction of all phase portraits of descatteredand intrinsic one are similar, but also they have similar phaseportraits. For example I–U , I–Q, they are probably fromthe same emission hight (Chung and Melatos 2011a). Therecovered phase portraits showed similarity with Fig. 38 toFig. 45 of current-modified dipole field model of Chung andMelatos (2011a) at 10◦ ≤ i ≤ 20◦ and 50◦ ≤ α ≤ 70◦.
4 Discussion
In Sect. 3.1, we have held a simulation to show a ISM scat-tering and descattering. Simulation showed the basic fea-tures of Stokes phase portraits of a single pulse profile, suchas symmetric balloon shape of Q–U , heart shape of I–U
and hockey stick shape of I–Q, and showed the main ef-fects of ISM scattering to the shape of Stokes phase por-traits, for example, asymmetric shape of Q–U , I–U andstick shape of I–Q. The descattered results of the simula-tion bring the possibility of recovering the original shape ofStokes phase portrait. The scattering phenomena not onlycauses pulse profile broadening and PPA curve flattening,but also it causes a distortion to the Stokes phase portraits,for example, the clear distorted shape of Q–U and I–U ofPSR B1356−60, Q–U and I–Q of PSR B1831−03, Q–U
of PSR B1859+03 and I–U of PSR B1946+35. Of course,in general, the irregularity and distortion of phase por-traits may be related to the magnetosphere configuration. InSect. 3.2, after descattering the scattered data of four pulsars,the phase portraits of Q–U and I–U of PSR B1356−60,Q–U and I–U of PSR B1831−03, Q–U and I–U of PSRB1859+03 and Q–U and I–U of PSR B1946+35 showeda regular shape, symmetric balloon and banana shape, thephase portraits of I–Q of PSR B1831−03, I–Q of PSRB1859+03 and I–Q of PSR B1946–35 showed symmet-ric shape, hockey stick and banana shape. It is noted that therecovered shape of Q–U , I–U and I–Q manifested the fea-tures of Stokes phase portraits which are simulated in thispaper and in Chung and Melatos (2011a).
When analyzing the descattered phase portraits we haveused the look-up tables of Stokes phase portraits which areprovided by Chung and Melatos (2011a). It is found that,without removing the scattering effect from the simulatedand the observed scattering data, we can not find resem-blance of the Stokes phase portraits from the look-up tables(Chung and Melatos 2011a). This implies that it is necessaryto hold descattering compensation to some scattered data.We also have noted that not only the descattered phase por-traits well matched with the simulated data of Chung andMelatos (2011a), but also the PPA curves are matched too.For PSR B1859+03, we used the simulated Stokes phaseportraits of hollow cone model with |α− i| ∼ 50 (Chung and
Melatos 2011a); this indicates that the hollow cone pulseprofile is single peaked and it is the same with the singlepeak pulse profile of PSR B1859+03. The large values of|α − i| of four pulsars can be associated with their shallowPPA swing curve; on the other hand, when the beam is cutat its outer edge, the impact angle |α − i| is large (Lorimerand Kramer 2005).
The pulse width of associated Stokes phase portraits ofChung and Melatos (2011a) are all the same as 10◦. Thepulse width of the four pulsars in this paper are calculatedby W = 2.5◦ P−0.5 (Maciesiak et al. 2012) and we obtainedthe pulse width as 7◦, 3◦, 3◦, and 3◦ degree respectively.So, the range of values of i and α for the four pulsars refer-eed above are used as a reference for analyzing the descat-tered Stokes phase portraits, they need further study to beconfirmed. As Chung and Melatos (2011a) said the Stokesphase portraits should be analyzed concurrently with the PAswing and pulse profiles in future when interpreting radiopulsar polarization data.
5 Conclusion
In this paper we have presented a simulation of scattered anddescattered Stokes phase portraits of a single pulse. And wehave shown the descattering compensation of Stokes phaseportraits of four pulsars. We have noticed from Figs. 1–5that ISM scattering, in some extent, distorts the Stokes phaseportraits and we found the descattering method implementedin this paper not only worked well to the scattered intensityprofiles and PPA curves (Rusul et al. 2012), but also usefulto the Stokes phase portraits of the observed scattered pulsesignals. Descattering the Stokes phase portraits allows us toobtain the original shapes of Stokes phase portraits of scat-tered pulse signals. It is worth to noted that it is necessary toconsider the effect of scattering to the observed Stokes pa-rameters of lower frequency signals, while more attentionsare given to the effect of rotational aberration, current-flow(Hibschman and Arons 2001) and rotation and modulation(Dyks 2008).
Acknowledgements This work was funded by the National NaturalScience Foundation of China (NSFC) under No. 11273051 and the keyprogram project of Joint Fund of Astronomy by NSFC and CAS underNo. 11178001.
References
Rusul, A., Esamdin, A., Kerim, A., Abdurixit, D.: Res. Astron. Astro-phys. 12, 529–539 (2012)
Bhat, N.D.R., Cordes, J.M., Chatterjee, S.: Astrophys. J. 584, 782(2003)
Chung, C.T.Y., Melatos, A.: Mon. Not. R. Astron. Soc. 411, 2471(2011a)

Astrophys Space Sci
Chung, C.T.Y., Melatos, A.: Mon. Not. R. Astron. Soc. 415, 1703(2011b)
Dyks, J.: Mon. Not. R. Astron. Soc. 391, 859 (2008)Hibschman, J.A., Arons, J.: Astrophys. J. 546, 382 (2001)Maciesiak, K., Gil, J., Melikidze, G.: 7 May (2012). arXiv:1205.
1297v1 [astro-ph.GA]Komesaroff, M.M., Hamilton, P.A., Abels, J.G.: Aust. J. Phys. 25, 759
(1972)Kuzmin, A.D., Izvekova, V.A.: Mon. Not. R. Astron. Soc. 260, 724
(1993)Li, X.H., Han, J.L.: Astron. Astrophys. 410, 253 (2003)Lorimer, D.R., Jessner, A., Seiradakis, J.H., et al.: Astron. Astrophys.
Suppl. Ser. 128, 541 (1998)
Lorimer, D.R., Kramer, M.: Handbook of Pulsar Astronomy. Cam-bridge Univ. Press, Cambridge (2005)
Radhakrishnan, V., Cooke, D.J.: Astrophys. J. Lett. 3, 225 (1969)Ramachandran, R., Mitra, D., Deshpande, A.A., McConnell, D.M.,
Ables, J.G.: Mon. Not. R. Astron. Soc. 290, 260 (1997)Rankin, J.M., Comella, J.M., Craft, H.D., Richards, D.W., Campbell,
D.B., Counsellman, C.C.: Astrophys. J. 162, 707 (1970)Scheuer, P.A.G.: Nature 218, 920 (1968)Van de Hulst, H.C.: Light Scattering by Small Particles. Wiley, New
York (1957)Williamson, I.P.: Mon. Not. R. Astron. Soc. 157, 55 (1972)