Embed Size (px)
Citation preview

2017 NAA SURVEY OF OPERATING INCOME & EXPENSES IN RENTAL APARTMENT COMMUNITIES
A Disciplined Industry Still Yielding Moderate Returns
THE STAYING POWER of Apartments
BY PAULA MUNGER
Demographics, societal shifts and sheer econom-ics continue to drive demand for apartments to levels not seen in half a century. While the homeownership rate has stabilized in recent months, it is well below levels seen prior to the Financial Crisis, yet remains above most Euro-
pean countries with similar economic fundamentals.Some 4.6 million new apartments will be needed by
2030 just to keep up with demand, according to recent research commissioned by NAA and the National Multi-family Housing Council and conducted by Hoyt Advisory Services. The main drivers of demand are the aging population, as more and more of the 55+ population join the ranks of renters; immigrants, who rent more than own and are expected to comprise an increasing proportion of U.S. population growth; and actions and attitudes of
younger generations, the Millennials and those who will follow, delaying marriage and children, two life events which tend to trigger the home-owning decision.
Thus far in 2017, “cooling” is one of the more promi-nent adjectives used to describe conditions in the rental housing market. Unsustainably high rental growth, a gap in pricing expectations between buyers and sellers and high levels of new construction combined to temper an industry where double-digit growth was becoming the norm.
Survey Results OverviewThe results of the 2017 NAA Survey of Operating In-come and Expenses in Rental Apartment Communities, based on 2016 data provided by apartment owners and managers nationwide, mirror the somewhat subdued

2
2017 NAA SURVEY OF OPERATING INCOME & EXPENSES IN RENTAL APARTMENT COMMUNITIES
performance occurring in the industry as a whole. Gross potential revenue, the sum total of rent in both occupied and unoccupied apartments, increased 5.5 percent in 2016, after a 6.4 percent increase in the prior year. Total operating expenses increased 5.4 percent, well above the long-term average of 3 percent, taking a bite out of net operating income (NOI). At 3.8 percent, NOI experienced the slowest growth in this cycle, although right in line with the 15-year average. Still, in this long-term, low-in-terest rate environment, returns in the 4-percent range are testament to the health and staying power of the apartment industry.
Other revenue trends that surfaced in this year’s survey include hits to revenue; in particular, con-
cessions. Rent concessions, which comprised 30 percent of apartment properties’ losses through the 00s, are now less than 15 percent. While some of this can be explained by owners’ creativity for luring prospective residents to their properties, e.g. gift cards, which would be recorded as a marketing expense, or waiving security deposits rather than offering free rent, it is most certainly reflective of extremely competitive and tight markets. As construction peaks and competition heats up in 2017, it will be inter-esting to see if this trend begins to reverse itself in next year’s survey results.
For the first time, in 2017, NAA’s survey asked partici-
pants about specific categories under the “other revenue” umbrella. Although data collection in this first year was not robust, parking fees, followed by pet fees, were the largest components of revenue from other sources.
Total operating expenses increased by 5.4 percent, up from a 3.5 percent increase in the prior year. Increases were driven by taxes, contract services, management fees and marketing – all up by 8 percent or more in just one year’s time. In 2013, property taxes surpassed salaries and personnel as the No. 1 cost among our survey respon-dents, and have been rising an average of 10 percent per year since then.
After dipping in 2015, utility costs per unit increased by 4.5 percent for individually metered and recov-
ery system properties and 8.9 percent for master-metered properties. The complete report, available at naahq.org/17ies includes detailed data and categorization of utilities.
Unsurprisingly, newer garden properties (built within the past five years) carry higher operating expenses per unit than their older counterparts in terms of pure dollars spent. During the past five years, average annual increas-es in operating expenses in newer properties were double that of properties older than 20 years. To be sure, owners of older properties spend more on repairs, maintenance, and utilities, but property taxes and marketing dominate more of a newer community’s budget.
Year-over-Year % Change in NOI Per Unit
-8%
-6%
-4%
-2%
0%
2%
4%
6%
8%
10%
12%
14%
2016201520142013201220112010200920082007
15-year average
SOURCE: NAA 2017 SURVEY OF OPERATING INCOME & EXPENSES; MARKET RATE, INDIVIDUALLY METERED PROPERTIESSOURCE: NAA 2017 SURVEY OF OPERATING INCOME & EXPENSES; MARKET RATE, INDIVIDUAL METERED AND RECOVERY SYSTEM PROPERTIES

3
2017 NAA SURVEY OF OPERATING INCOME & EXPENSES IN RENTAL APARTMENT COMMUNITIES
The complete report also breaks down income and expenses by property size. While economies of scale
clearly prevail for larger properties, the dispersion of re-sponses is relatively compact, with the widest gap in total operating expenses being an eight percent differential in properties that have fewer than 100 units versus proper-ties with 250 to 499 units.
The 2017 survey also further segmented both market-
ing expenses as well as contract services. Internet market-ing ranking as the largest component of marketing spend is expected, but the “resident relations” category will bear watching in the coming years as creating experiences through events is becoming more popular and sought-af-ter in communities across the country. Print marketing makes up less than 5 percent of the total marketing bud-get. Under the contracting services category, landscaping
Operating Expenses by Age of Property
SOURCE: NAA 2017 SURVEY OF OPERATING INCOME & EXPENSES; MARKET RATE, INDIVIDUALLY METERED. GARDEN PROPERTIES
20 or more years10 to 19 years5 to 9 yearsLess than 5 years
3,800
4,200
4,600
5,000
5,400
5,800
2016201520142013201220112010200920082007
Dol
lars
per
Uni
t
Operating Expenses Per UnitGarden Apartments
3%5%5%
7%
7%
7%
9%26%
31%
MarketingInsurance
Administration
Utilities Taxes
ContractServices
ManagementFees
Repair andMaintenance Salaries and
Personnel
SOURCE: NAA 2017 SURVEY OF OPERATING INCOME & EXPENSES; MARKET RATEINDIVIDUALLY METERED PROPERTIES
Operating Expenses Per Unit Mid- & High-Rise Apartments
MarketingInsurance
Administration
Utilities Taxes
ContractServices
ManagementFees
Repair andMaintenance Salaries and
Personnel
SOURCE: NAA 2017 SURVEY OF OPERATING INCOME & EXPENSES; MARKET RATEINDIVIDUALLY METERED PROPERTIES
37%
21%
6%
8%
8%
7%
5%4% 4%
SOURCE: NAA 2017 SURVEY OF OPERATING INCOME & EXPENSES; MARKET RATE, INDIVIDUAL METERED AND RECOVERY SYSTEM PROPERTIES
SOURCE: NAA 2017 SURVEY OF OPERATING INCOME & EXPENSES; MARKET RATE, INDIVIDUAL METERED AND RECOVERY SYSTEM GARDEN PROPERTIES

4
2017 NAA SURVEY OF OPERATING INCOME & EXPENSES IN RENTAL APARTMENT COMMUNITIES
is far and away the largest component at 36 percent. Apartment owners and operators are getting leaner,
with a unit to full-time employee ratio of 44, the highest in at least a decade when this metric was first collected. This could be interpreted as higher productivity per employee, or may merely be a function of a tight labor market. Given that many industry leaders consistently express challenges in filling positions, particularly maintenance and property management professionals, this figure may begin to inch back down in the coming years as more-focused recruiting and training initiatives emerge.
Capital expenditures, which has proven to be a vola-tile data series throughout the survey’s history, averaged a 16 percent increase per year since 2011. In 2017, categories were added to the survey, revealing that about one-third of capital expenditures were tied to renovations. With more new product coming on line, owners are finding it necessary to keep their properties competitive as it relates to upgrades, amenities and finishes to attract residents and retain the ones in place.
More and more residents are renewing their leases as the turnover rate dropped to its lowest level (50 percent) since recorded data are available from 2000 onwards. This corroborates recently released data from the U.S. Cen-sus Bureau, which found that Americans are moving at historically low rates. While renters have more choices in those markets delivering new supply, it more than likely is
coming at a higher price tag. Some churn is certainly good for owners in terms of being able to push rents, but high turnover rates not only equal lost rent revenue on empty apartments, but increased costs for marketing, maintenance and potentially capital improvements.
Metro Area SurveyResultsIncome and expenses information on apartment prop-erties in 90 metropolitan areas are covered in the full report. For this analysis, emphasis is placed on the top metro markets forecast for growth over the next 14 years, based on the percent increase in apartments: Raleigh, Orlando, Austin, Charlotte, Las Vegas, Phoenix, Dallas, Mi-ami, Atlanta and Houston. Based on forecasted demand, the number of apartments in these areas will swell by 35 percent or more through 2030.
Total revenue per unit ranged from $10,000 in Las Vegas to $20,000 in Miami. Like Miami, Austin, Atlanta and Orlando reported higher revenues than the national aver-age of $13,900. Orlando and Atlanta also placed well on the other side of the income statement, that is, lower-than-av-erage operating expenses, along with Charlotte, Raleigh, Las Vegas and Phoenix.
In an effort to compare profitability across these mar-kets, understanding that some important financial
components such as debt service are not included in the
Historic Turnover Rates & Renter Mobility Rates
SOURCE: NAA 2017 SURVEY OF OPERATING INCOME & EXPENSES; MARKET RATE, INDIVIDUALLY METERED PROPERTIESU.S. CENSUS BUREAU
20%
22%
24%
26%
28%
30%
2016201520142013201220112010200920082007
60%
58%
56%
54%
52%
50%
48%
Renter Mobility Rate (right axis) Turnover Rate (left axis)
SOURCE: NAA 2017 SURVEY OF OPERATING INCOME & EXPENSES; MARKET RATE, INDIVIDUAL METERED AND RECOVERY SYSTEM PROPERTIES;U.S. CENSUS BUREAU

5
2017 NAA SURVEY OF OPERATING INCOME & EXPENSES IN RENTAL APARTMENT COMMUNITIES
Total Revenue and Operating Expenses Per Unit Top Metros for Projected Growth (2017 – 2030)
SOURCE: NAA 2017 SURVEY OF OPERATING INCOME & EXPENSES; MARKET RATE, INDIVIDUALLY METERED PROPERTIESHOYT ADVISORY SERVICES
0 5,000 10,000 15,000 20,000
Las VegasPhoenixRaleigh
DallasCharlotteHoustonOrlandoAtlantaAustinMiami
Total Revenue Total Operating Expenses
Dollars in Thousands
survey, a ratio of net operating income to total revenue was analyzed. Phoenix, Charlotte and Atlanta came out on top, although the majority of these markets performed better than the national average of 61.5 percent. The higher the ratio, the greater operating efficiencies are being achieved. At the bottom rung are cities in Texas, all of which have one thing in common: the percentage of expenses
due to property taxes is well above the national average. Property taxes comprise more than 50 percent of operating expenses in Austin, compared to 32.4 percent nationally for all apartment types. In 2016, Houston was also plagued on the revenue side, having some of the highest losses to vacancy and concessions as it worked its way through the oil downturn.
Net Operating Income as a Percent of Total RevenueTop Metros for Projected Growth (2017 – 2030)
SOURCE: NAA 2017 SURVEY OF OPERATING INCOME & EXPENSES; MARKET RATE, INDIVIDUALLY METERED PROPERTIESHOYT ADVISORY SERVICES
40%
50%
60%
70%
Austin
Houston
Dallas
Miami
Las Vegas
Orlando
Raleigh
Atlanta
Charlotte
Phoenix
U.S. average
SOURCE: NAA 2017 SURVEY OF OPERATING INCOME & EXPENSES; MARKET RATE, INDIVIDUAL METERED AND RECOVERY SYSTEM PROPERTIES;HOYT ADVISORY SERVICES
SOURCE: NAA 2017 SURVEY OF OPERATING INCOME & EXPENSES; MARKET RATE, INDIVIDUAL METERED AND RECOVERY SYSTEM PROPERTIES;HOYT ADVISORY SERVICES
6
2017 NAA SURVEY OF OPERATING INCOME & EXPENSES IN RENTAL APARTMENT COMMUNITIES
Summary
On the operations and management side, there is much to keep industry leaders awake at night: the velocity and intensity of change, mainly driven
by technology, the aging of the rental housing workforce and its residents, the lack of available talent in the labor market and data security.
The aging of residents raises issues of not only phys-ical design like wider hallways, but larger floor plans as well as targeted amenities. As apartment industry employers, a rigorous focus on training and apprentice programs, partnerships with universities, and succession plans for future leadership roles will be key.
The rise in apartment living as a lifestyle choice has
resulted in an increasingly diversified resident base. Cou-pled with the fact that real estate has always been a local business means operating strategies, including revenue management, often must be implemented at the asset level.
The industry is not without its challenges. But with demand for apartments expected to continue unabated, and a mature, disciplined market that is progressively balanced, the rewards promise to outweigh the obstacles.
Paula Munger is Director of Industry Research and Analysis for NAA. She can be reached at [email protected] or 703-797-0614.
About the SurveyThe survey was conducted, compiled and tabulated
by CEL & Associates, Inc. Special thanks to Janet Gora, Managing Director, CEL & Associates, Inc.; and Paul Yoon, Research Analyst, NAA. A total of 4,286 properties contain-ing 1,082,457 units are represented in this year’s report covering financials from 2016.
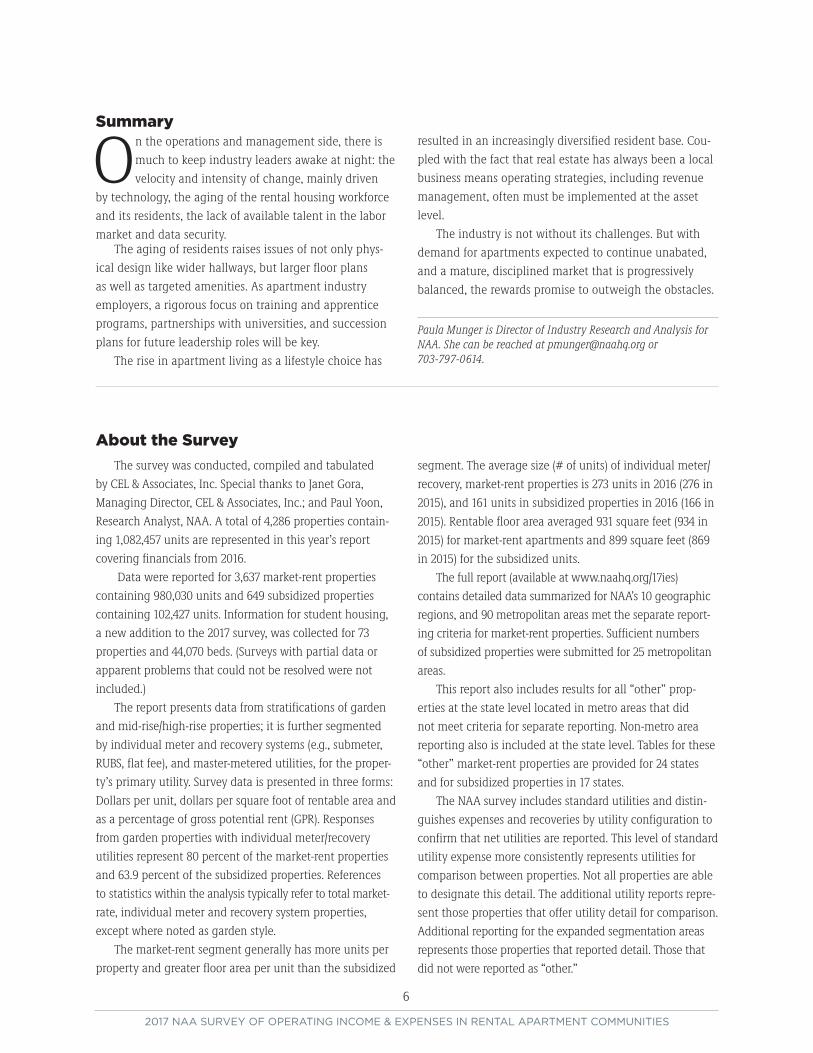
Data were reported for 3,637 market-rent properties containing 980,030 units and 649 subsidized properties containing 102,427 units. Information for student housing, a new addition to the 2017 survey, was collected for 73 properties and 44,070 beds. (Surveys with partial data or apparent problems that could not be resolved were not included.)
The report presents data from stratifications of garden and mid-rise/high-rise properties; it is further segmented by individual meter and recovery systems (e.g., submeter, RUBS, flat fee), and master-metered utilities, for the proper-ty’s primary utility. Survey data is presented in three forms: Dollars per unit, dollars per square foot of rentable area and as a percentage of gross potential rent (GPR). Responses from garden properties with individual meter/recovery utilities represent 80 percent of the market-rent properties and 63.9 percent of the subsidized properties. References to statistics within the analysis typically refer to total market- rate, individual meter and recovery system properties, except where noted as garden style.
The market-rent segment generally has more units per property and greater floor area per unit than the subsidized
segment. The average size (# of units) of individual meter/recovery, market-rent properties is 273 units in 2016 (276 in 2015), and 161 units in subsidized properties in 2016 (166 in 2015). Rentable floor area averaged 931 square feet (934 in 2015) for market-rent apartments and 899 square feet (869 in 2015) for the subsidized units.
The full report (available at www.naahq.org/17ies) contains detailed data summarized for NAA’s 10 geographic regions, and 90 metropolitan areas met the separate report-ing criteria for market-rent properties. Sufficient numbers of subsidized properties were submitted for 25 metropolitan areas.
This report also includes results for all “other” prop-erties at the state level located in metro areas that did not meet criteria for separate reporting. Non-metro area reporting also is included at the state level. Tables for these “other” market-rent properties are provided for 24 states and for subsidized properties in 17 states.
The NAA survey includes standard utilities and distin-guishes expenses and recoveries by utility configuration to confirm that net utilities are reported. This level of standard utility expense more consistently represents utilities for comparison between properties. Not all properties are able to designate this detail. The additional utility reports repre-sent those properties that offer utility detail for comparison. Additional reporting for the expanded segmentation areas represents those properties that reported detail. Those that did not were reported as “other.”

7
2017 NAA SURVEY OF OPERATING INCOME & EXPENSES IN RENTAL APARTMENT COMMUNITIES
Total Garden Mid- & High-Rise
Number of Properties 3,428 2,910 518Number of Units 937,431 799,702 137,729Avg. No. of Units/Property 273 275 266Avg. No. of Square Feet/Unit 931 935 904Turnover rate in % 50% 50% 49% $ Per $ Per % of $ Per $ Per % of $ Per $ Per % of Unit Sq. Ft. GPR Unit Sq. Ft. GPR Unit Sq. Ft. GPR
Revenues Gross Potential Rent 14,260 15.32 100.0% 13,190 14.10 100.0% 20,467 22.64 100.0%Rent Revenue Collected 13,169 14.15 92.4% 12,209 13.05 92.6% 18,743 20.73 91.6%
Losses to Vacancy 852 0.91 6.0% 759 0.81 5.8% 1,387 1.53 6.8% Collection Losses 90 0.10 0.6% 90 0.10 0.7% 88 0.10 0.4%Losses to Concessions 149 0.16 1.0% 132 0.14 1.0% 249 0.28 1.2%
Other Revenue 772 0.83 5.4% 698 0.75 5.3% 1,199 1.33 5.9%Total Revenue 13,941 14.98 97.8% 12,908 13.80 97.9% 19,942 22.06 97.4%
Operating Expenses Salaries and Personnel 1,338 1.44 9.4% 1,278 1.37 9.7% 1,688 1.87 8.2%Insurance 236 0.25 1.7% 226 0.24 1.7% 293 0.32 1.4%Taxes 1,741 1.87 12.2% 1,529 1.64 11.6% 2,968 3.28 14.5%Utilities 345 0.37 2.4% 316 0.34 2.4% 518 0.57 2.5%Management Fees 395 0.42 2.8% 359 0.38 2.7% 603 0.67 2.9%Administrative 272 0.29 1.9% 252 0.27 1.9% 388 0.43 1.9%Marketing 188 0.20 1.3% 160 0.17 1.2% 350 0.39 1.7%Contract Services 392 0.42 2.7% 354 0.38 2.7% 610 0.68 3.0%Repair and Maintenance 462 0.50 3.2% 454 0.49 3.4% 508 0.56 2.5%Total Operating Expenses 5,369 5.77 37.7% 4,929 5.27 37.4% 7,926 8.77 38.7% Net Operating Income 8,572 9.21 60.1% 7,978 8.53 60.5% 12,016 13.29 58.7% Capital Expenditures 1,478 1.59 10.4% 1,473 1.57 11.2% 1,509 1.67 7.4% * Individual Meter and Recovery System (submeter, RUBS, flat fee) for primary utility.
All Market Rent Properties Operating Income & Expense Data
Individual Metered and Recovery System Properties*
Source : National Apartment Association 2017 Survey of Operating Income & Expenses in Rental Apartment Communities
© 2
017
by N
atio
nal A
part
men
t Ass
ocia
tion.
Thi
s tab
le m
ay o
nly
be u
sed,
cop
ied,
and
/or d
istrib
uted
in a
ccor
danc
e w
ith th
e Li
cens
e Ag
reem
ent a
nd m
ay n
ot b
e po
sted
on
the
Inte
rnet
.

8
2017 NAA SURVEY OF OPERATING INCOME & EXPENSES IN RENTAL APARTMENT COMMUNITIES
* Master Meter Owner Paid for primary utility.
Total Garden Mid- & High-Rise
Number of Properties 209 155 54Number of Units 42,599 32,197 10,402Avg. No. of Units/Property 204 208 193Avg. No. of Square Feet/Unit 868 897 779Turnover rate in % 43% 44% 39% $ Per $ Per % of $ Per $ Per % of $ Per $ Per % of Unit Sq. Ft. GPR Unit Sq. Ft. GPR Unit Sq. Ft. GPR
Revenues Gross Potential Rent 14,938 17.21 100.0% 14,045 15.67 100.0% 17,700 22.73 100.0%Rent Revenue Collected 13,916 16.04 93.2% 13,157 14.67 93.7% 16,267 20.89 91.9%
Losses to Vacancy 795 0.92 5.3% 707 0.79 5.0% 1,065 1.37 6.0%Collection Losses 100 0.12 0.7% 88 0.10 0.6% 138 0.18 0.8%Losses to Concessions 127 0.15 0.8% 93 0.10 0.7% 230 0.30 1.3%
Other Revenue 742 0.86 5.0% 695 0.77 4.9% 891 1.14 5.0%Total Revenue 14,659 16.89 98.1% 13,851 15.45 98.6% 17,158 22.03 96.9%
Operating Expenses Salaries and Personnel 1,500 1.73 10.0% 1,390 1.55 9.9% 1,839 2.36 10.4%Insurance 277 0.32 1.9% 230 0.26 1.6% 422 0.54 2.4%Taxes 1,280 1.47 8.6% 1,159 1.29 8.3% 1,653 2.12 9.3%Utilities 963 1.11 6.4% 875 0.98 6.2% 1,234 1.58 7.0%Management Fees 566 0.65 3.8% 522 0.58 3.7% 702 0.90 4.0%Administrative 304 0.35 2.0% 249 0.28 1.8% 471 0.61 2.7%Marketing 171 0.20 1.1% 158 0.18 1.1% 212 0.27 1.2%Contract Services 507 0.58 3.4% 408 0.45 2.9% 814 1.05 4.6%Repair and Maintenance 647 0.75 4.3% 584 0.65 4.2% 843 1.08 4.8%Total Operating Expenses 6,214 7.16 41.6% 5,575 6.22 39.7% 8,191 10.52 46.3% Net Operating Income 8,445 9.73 56.5% 8,276 9.23 58.9% 8,967 11.52 50.7% Capital Expenditures 2,095 2.41 14.0% 2,125 2.37 15.1% 2,001 2.57 11.3%
All Market Rent Properties Operating Income & Expense Data
Master Metered Properties*
Source : National Apartment Association 2017 Survey of Operating Income & Expenses in Rental Apartment Communities
© 2
017
by N
atio
nal A
part
men
t Ass
ocia
tion.
Thi
s tab
le m
ay o
nly
be u
sed,
cop
ied,
and
/or d
istrib
uted
in a
ccor
danc
e w
ith th
e Li
cens
e Ag
reem
ent a
nd m
ay n
ot b
e po
sted
on
the
Inte
rnet
.

9
2017 NAA SURVEY OF OPERATING INCOME & EXPENSES IN RENTAL APARTMENT COMMUNITIES
Total Garden Mid- & High-Rise
Number of Properties 485 415 70 Number of Units 78,113 65,051 13,062 Avg. No. of Units/Property 161 157 187 Avg. No. of Square Feet/Unit 899 909 847 Turnover rate in % 31% 31% 31% $ Per $ Per % of $ Per $ Per % of $ Per $ Per % of Unit Sq. Ft. GPR Unit Sq. Ft. GPR Unit Sq. Ft. GPR
Revenues Gross Potential Rent 12,294 13.68 100.0% 11,635 12.80 100.0% 15,574 18.39 100.0%Rent Revenue Collected 11,594 12.90 94.3% 10,985 12.08 94.4% 14,630 17.27 93.9%
Losses to Vacancy 544 0.60 4.4% 503 0.55 4.3% 747 0.88 4.8% Collection Losses 108 0.12 0.9% 104 0.11 0.9% 124 0.15 0.8% Losses to Concessions 48 0.05 0.4% 43 0.05 0.4% 73 0.09 0.5%
Other Revenue 500 0.56 4.1% 435 0.48 3.7% 826 0.98 5.3%Total Revenue 12,094 13.46 98.4% 11,419 12.56 98.1% 15,456 18.25 99.2%
Operating Expenses Salaries and Personnel 1,437 1.60 11.7% 1,405 1.55 12.1% 1,596 1.88 10.2%Insurance 283 0.31 2.3% 285 0.31 2.4% 272 0.32 1.7%Taxes 881 0.98 7.2% 782 0.86 6.7% 1,375 1.62 8.8%Utilities 694 0.77 5.6% 681 0.75 5.9% 757 0.89 4.9%Management Fees 547 0.61 4.4% 548 0.60 4.7% 541 0.64 3.5%Administrative 430 0.48 3.5% 409 0.45 3.5% 536 0.63 3.4%Marketing 103 0.11 0.8% 95 0.10 0.8% 143 0.17 0.9%Contract Services 437 0.49 3.6% 417 0.46 3.6% 536 0.63 3.4%Repair and Maintenance 564 0.63 4.6% 555 0.61 4.8% 606 0.72 3.9%Total Operating Expenses 5,375 5.98 43.7% 5,177 5.69 44.5% 6,362 7.51 40.8% Net Operating Income 6,719 7.48 54.7% 6,242 6.87 53.7% 9,095 10.74 58.4% Capital Expenditures 962 1.07 7.8% 929 1.02 8.0% 1,127 1.33 7.2%
All Subsidized Properties Operating Income & Expense Data
Individual Metered and Recovery System Properties*
© 2
017
by N
atio
nal A
part
men
t Ass
ocia
tion.
Thi
s tab
le m
ay o
nly
be u
sed,
cop
ied,
and
/or d
istrib
uted
in a
ccor
danc
e w
ith th
e Li
cens
e Ag
reem
ent a
nd m
ay n
ot b
e po
sted
on
the
Inte
rnet
.
Source : National Apartment Association 2017 Survey of Operating Income & Expenses in Rental Apartment Communities
* Individual Meter and Recovery System (submeter, RUBS, flat fee) for primary utility.
10
2017 NAA SURVEY OF OPERATING INCOME & EXPENSES IN RENTAL APARTMENT COMMUNITIES
Source : National Apartment Association 2017 Survey of Operating Income & Expenses in Rental Apartment Communities
Total Garden Mid- & High-Rise
Number of Properties 164 104 60 Number of Units 24,314 14,324 9,990 Avg. No. of Units/Property 148 138 167 Avg. No. of Square Feet/Unit 769 819 698 Turnover rate in % 19% 19% 19% $ Per $ Per % of $ Per $ Per % of $ Per $ Per % of Unit Sq. Ft. GPR Unit Sq. Ft. GPR Unit Sq. Ft. GPR
Revenues Gross Potential Rent 13,406 17.43 100.0% 12,262 14.97 100.0% 15,047 21.56 100.0%Rent Revenue Collected 12,858 16.72 95.9% 11,684 14.27 95.3% 14,541 20.83 96.6%
Losses to Vacancy 407 0.53 3.0% 400 0.49 3.3% 417 0.60 2.8%Collection Losses 98 0.13 0.7% 127 0.16 1.0% 56 0.08 0.4%Losses to Concessions 43 0.06 0.3% 51 0.06 0.4% 33 0.05 0.2%
Other Revenue 508 0.66 3.8% 414 0.51 3.4% 643 0.92 4.3%Total Revenue 13,366 17.38 99.7% 12,098 14.77 98.7% 15,183 21.75 100.9%
Operating Expenses Salaries and Personnel 1,809 2.35 13.5% 1,766 2.16 14.4% 1,871 2.68 12.4%Insurance 287 0.37 2.1% 264 0.32 2.2% 319 0.46 2.1%Taxes 923 1.20 6.9% 807 0.99 6.6% 1,089 1.56 7.2%Utilities 1,347 1.75 10.0% 1,264 1.54 10.3% 1,466 2.10 9.7%Management Fees 648 0.84 4.8% 606 0.74 4.9% 707 1.01 4.7%Administrative 558 0.73 4.2% 534 0.65 4.4% 593 0.85 3.9%Marketing 80 0.10 0.6% 78 0.10 0.6% 81 0.12 0.5%Contract Services 703 0.91 5.2% 656 0.80 5.4% 769 1.10 5.1%Repair and Maintenance 614 0.80 4.6% 582 0.71 4.7% 661 0.95 4.4%Total Operating Expenses 6,968 9.06 52.0% 6,558 8.01 53.5% 7,557 10.83 50.2%
Net Operating Income 6,398 8.32 47.7% 5,541 6.77 45.2% 7,626 10.93 50.7%
Capital Expenditures 948 1.23 7.1% 964 1.18 7.9% 927 1.33 6.2%
All Subsidized Properties Operating Income & Expense Data
Master Metered Properties*
© 2
017
by N
atio
nal A
part
men
t Ass
ocia
tion.
Thi
s tab
le m
ay o
nly
be u
sed,
cop
ied,
and
/or d
istrib
uted
in a
ccor
danc
e w
ith th
e Li
cens
e Ag
reem
ent a
nd m
ay n
ot b
e po
sted
on
the
Inte
rnet
. * Master Meter Owner Paid for primary utility.

11
2017 NAA SURVEY OF OPERATING INCOME & EXPENSES IN RENTAL APARTMENT COMMUNITIES
Net Payroll/ Operating # Units/ # Units/ Net Revenue/ Income/ Full-Time Total Payroll/ Operating Properties Units Payroll Payroll Employees Employees Revenue Income
Less Than 100 Units 188 14,562 $9.54 $5.72 35.9 28.4 10.5% 17.5%100 to 199 Units 688 103,286 $9.15 $5.43 39.9 36.1 10.9% 18.4%200 to 299 Units 941 230,638 $9.89 $6.08 42.6 40.8 10.1% 16.4%300 to 399 Units 643 217,789 $10.33 $6.42 45.4 44.1 9.7% 15.6%400 to 499 Units 276 121,905 $10.55 $6.69 46.3 45.5 9.5% 15.0%500 or More Units 174 111,522 $10.67 $6.66 47.4 46.5 9.4% 15.0%
Total 2,910 799,702 $10.10 $6.24 44.0 42.0 9.9% 16.0%
Apartment Operations MetricsIndividually Metered and Recovery System, Market Rent Garden Properties
Glossary of TermsAdministrative. Total monies spent on
general and administrative items such as answer-ing service, donations, mileage reimbursement, bank charges, legal/eviction charges, postage, telephone/fax/Internet charges, office supplies, uniforms, credit reports, permits, membership dues, subscriptions, data processing, etc. Does not include any payroll-related expenses.
Capital Expenditures. Capital Expendi-tures are separated by the categories listed (ren-ovations, replacements and “other”). All “other” CapEx expenses would include the sum of any items not specifically listed above. A zero on the line meant there were no capital expenditures.
Contract Services. Contract Services are separated by the categories listed (landscaping, pest control, security and “other”). All “other” contract services expenses would include the sum of any items not specifically listed above (ex. snow removal, and other services provided on a contract basis). Trash removal is not included here.
Gross Potential Revenue Residential. Total rents of all occupied units at 2016 lease rates and all vacant units at 2016 market rents (or fiscal year end).
Heating/Cooling Fuel. Type of fuel used in apartment units.
Insurance. Includes property hazard and liability and real property insurance and does not include health/payroll insurance.
Maintenance. Total monies spent on general maintenance, maintenance supplies and uniforms, minor painting/carpeting repairs, plumbing supplies and repairs, security gate repairs, keys/locks, minor roof/window repairs, HVAC repairs, cleaning supplies, etc. Does not include any payroll related expenses or non-re-curring capital expenses. Contract services are reported separately.
Management Fees. Total fees paid to the management agent/company by the owner.
Marketing. Marketing expenses are sepa-rated by the categories listed (internet, print, resi-
dent relations and “other”). All “other” marketing expenses would include the sum of any items not specifically listed above. (ex. locator fees, signage, model expense, etc.) NOTE: rent concessions are not included.
Net Commercial Square Footage. Total rentable square feet of commercial floor space.
Net Rentable Residential Square Feet. Total rentable square feet of floor space in residential units only. Area reported includes only finished space inside four perimeter walls of each unit. Common areas are excluded.
Other Revenue. Monies received are separated by the categories listed (amenity fees, laundry, parking, pet fees, storage and “other”). All “other” would include the sum of any items not specifically listed above. (ex. vending, deposit forfeitures, furniture, late fees, termination fees, application fees, etc.) NOTE: interest income or utility reimbursements are not included. (Utility reimbursement/recovery is subtracted from gross utility costs.)
Payroll Costs. Gross salaries and wages paid to employees assigned to the property in all departments. Includes payroll taxes, group health/life/disability insurance, 401(k), bonus-es, leasing commissions, value of employee apartment allowance, workers’ compensation, retirement contributions, overtime and other cash benefits.
Rent-Controlled Property. A property is subject to rent controls through local or state gov-ernment regulations. This does not apply if rents are controlled through a government program that provides direct subsidies.
Rental Revenue Commercial. Total rent collections for commercial space after vacancy/administrative, bad debt and discount or conces-sion losses.
Rental Revenue Residential. Total rent collections for residential units after vacancy/ administrative, bad debt and discount or conces-sion losses.
Revenue Losses to Collections. Amount of residential rents not received due to collection losses.
Revenue Losses to Concessions. Amounts of gross potential residential rents not received due to concessions.
Revenue Losses to Vacancies. Amount of rental income for residential units not collected because of vacancies and other use of units, such as models and offices.
Subsidized Property. A property has con-trolled rents through a government subsidized program. (low-income housing).
Taxes. Total real estate and personal property taxes only. Does not include payroll or rendering fees related to property taxes or income taxes.
Tax-Exempt Bond or Housing-Credit Property. A property that has received tax-ex-empt bond financing and/or is a low-income tax credit property.
Total Operating Expenses. Sum of all operating costs. The sum of all expense categories must balance with this line, using total net utility expenses only. Does not include debt service or any one-time extraordinary costs.
Turnover. Number of apartment units in which residents moved out of the property during the 12-month reporting period.
Utilities. Total cost of all standard utilities and each listed type, net of any income reim-bursements for or from residents (i.e., submeter, RUBS, flat fee or similar system).
Utility Configuration. Whether electric, gas, oil and water/sewer utilities to individual units in subject property are: Master Metered, Owner Paid; Master Metered with a Resident Recovery System, (submeter, RUBS, flat fee); Indi-vidual Meter, Resident Paid. Report grouping is based on the configuration of the primary utility for the residents.

12
2017 NAA SURVEY OF OPERATING INCOME & EXPENSES IN RENTAL APARTMENT COMMUNITIES
Thank You to Our Participating Companies
NAA sends a special note of appreciation to the over 200 firms who donated their time to accumulate the data necessary to make this survey valuable. The following companies and their officers provided 20 properties or more for the 2017 Survey of Operating Income & Expenses in Rental Apartment Properties.
Adara CommunitiesAdvanced Management Co.ALCO ManagementAllied Orion GroupAMLI ResidentialBeacon CommunitiesBell PartnersBerkshire CommunitiesBeztak PropertiesBH Management ServicesBlue Ridge Property Mgmt.Buckingham CompaniesCamdenConAm Management Corp.
Cortland PartnersCottonwood ResidentialDEI CommunitiesDolbenDrucker & FalkECI ManagementFairway ManagementFogelman Management GroupForest City Gables ResidentialGinkgo ResidentialGreystarHallKeen ManagementHarbor Group International
IntegralIRETJCM PartnersKonover Residential CorporationLegacy PartnersLumaCorpMAAMC ResidentialMEB Management ServicesMG Properties GroupMilestone ManagementMonogram Residential TrustMV Residential Property Mgmt.NALS Apartment Homes
Nolan Real Estate ServicesOlympus PropertyPalms AssociatesPegasus ResidentialPinnacle Prime ResidentialSimpson HousingVan Metre CompaniesVenterra RealtyVillage Green Management Co.WatertonWC SmithWeinstein PropertiesWestern National Property Mgmt.


![January generic naa[1]](https://img.pdfslide.us/doc/110x75/55af80441a28ab26368b4738/january-generic-naa1.jpg)