Embed Size (px)
Citation preview

THE STATUS OF THE PEDUNCULATE AND SESSILE OAKS IN BRITAIN
By J. E. COUSENS
Department 0/ Forestry and Natural Resources, University o/Edinburgh
ABSTRACT
Introgression in the pedunculate oak: (Quereus robur L.) and sessile oak: (Q. petraea (Matt.) Liebl.) in Scotland was known to be so extensive that neither could be defined satisfactorily. Population studies were therefore carried out in Eire to clarify the status of the sessile oak: and in south-east England and in the floodplain oak: forests of Yugoslavia in an attempt to find good pedunculate oak:. Each of these collections revealed some evidence for introgression. A method of analysis has been devised to distinguish between currently active introgression and a condition due either to incomplete evolutionary divergence or to old introgression now largely assimilated into the gene pool. Q. petraea is a relatively good species in Eire and possibly in southern England too. Q. robur is diagnosed as a species, possibly as homogeneous as Q. petraea at one time, but, if so, introgressed by a number of related species during the last glaciations or earlier; it arrived in post-glacial Britain already a very variable species and was subjected to a little secondary introgression by Q. petraea. Introgression of both species increases northwards into Scotland. The much greater introgression of Q. petraea in Scotland has been made possible by the practice of planting Q. robur to maintain the stocking of petraea coppice woods. The observed variation in the selected diagnostic characters in the Yugoslavian and Irish collections is outlined to provide a provisional definition of Q. robur and Q. petraea in Britain.
INTRODUCTION
A study of the partially interfertile Quercus robur and Q. petraea in Scotland revealed considerable reciprocal introgression (Cousens 1963). In a few populations of Q. petraea the selected diagnostic characters were reasonably homogeneous; but even these populations were a little suspect since characters such as 'veins to sinus of leaf' occurred among them. In the absence of satisfactory definitions of either species it was not possible to estimate the extent of introgression. This paper describes subsequent studies to clarify the status of these two species by comparison with populations elsewhere. The methods of sampling and specimen collection have already been described (Cousens 1963).
QUERCUS PETRAEA IN EIRE The forests of Ireland have been more completely destroyed than those of Scotland or
England. By A.D. 1600 about one-eighth of the country still carried forest but during the next two centuries their destruction was greatly accelerated when iron-smelting with charcoal was developed on a large scale (McCracken 1963). Labour costs were relatively low and it became profitable to import iron ore from Wales or Spain and smelt it in or near the woods; when an area of forest was exhausted the smelters moved on to another centre. The only reports of attempts at forestry management come from Co. Wicklow which had exported oak billets to Wales prior to this period. In spite of the acknowledged fact that coppice-oak billets gave best results in smelting, the short-term approach, exploitation of existing woodland, seems to have prevailed. The situation in Ireland was thus very different from that in Scotland or England where there had been a long history of intensive coppice management and by implication a great deal of planting of oak to replace standards and old coppice stools.
Tree planting 0:0- any scale is not recorded in Ireland till the sixteenth century and even then was mostly within the Pale (around Dublin). The Williamite wars discouraged planting through much of the seventeenth century and by the eighteenth century planting was mainly of exotic species, largely larch and pine (McEvoy 1943). All these plantations
161 Watsonia 6 (3), 1965.

162 J. E. COUSENS
were included in the 2 per cent. ofIreland that carried woodland in 1840 (McCracken 1963). At the end of the Napoleonic wars (about 1820) charcoal smelting became unprofitable with the advent of coal smelting and a majority of the stands of oak to be found in Eire today are derived from woodland last felled about that time.
Both Q. petraea and Q. robur occur in Eire today but varying opinions have been expressed about the status of Q. robur. According to McEvoy (1943) it is native and was the main oak of the central limestone area which was not overlain by bog. The only extensive remnants of oak woodland are all peripheral to the central area, mainly on siliceous rocks and of undoubted Q. petraea affinity. The populations sampled include well documented localities for Q. petraea in the Wicklow mountains, in the south-west near Glengariff and Killarney and in the west near Pontoon and Sligo (Praeger 1934). Fig. I shows the location of all the major samples.
.12 DONEGAL
Fig. 1. EIRE-location of populations sampled.
ANALYSIS OF THE IRISH DATA
The main analysis was confined to six diagnostic characters; contrary to opll11ons expressed on p. 283 ofthe previous paper (Cousens 1963) it will be argued later that all are probably under polygene control. Two of these characters, Petiole per cent. of leaf length and Peduncle length to first flower bract, are readily recorded as continuous variables and have been called the Primary Characters. The other four, Auricle type, Abaxial leaf pubescence, Peduncle diameter and Peduncle pubescence, are each classified as nominal Q. robur, indeterminate or nominal Q. petraea on the basis of multiple correlation within the Scottish material: these are the Secondary Characters. The presence of such a correlation in the Scottish material (which exhibited complete intergradation between the species) confirms the diagnostic value of these characters. Specimens in which all four characters were within the nominal Q. robur or Q. petraea range were called the Theoretical Species Types (or TSTs). By definition then the TSTs show less than the normal species variation for the four characters from which they were derived. It follows that specimens differing from the TSTs to a certain degree may still represent only the normal variability of the species. To test this the range of variation of the Primary Characters for TST and non-TST specimens may be compared. The ranges should be similar if both are part of a nonintrogressed population. It has been shown for the Scottish collections that if specimens are classified according to the degree of their difference from the TSTs, then the plotted
Watsonia 6 (3), 1965.

PEDUNCULATE AND SESSILE OAKS 163
mean values of the Primary variables for each class fall on a curve linking the two TSTs. This curve has been called the Introgression Path and is shown in Fig. 2. The degrees of difference from the TST can be compiled as in Hybrid Index scoring but the resultant index indicates only the degree of heterogeneity. Determination of the level at which such an Heterogeneity Index is indicative of hybrid origin requires a knowledge of the normal
9 9
8
7
~6 6
5 5
4 4
3
2 ~----------1~O----------~2~O~--------~30~----------4~O~-
Peduncle Length to first bract- mm
Fig. 2. The INTROGRESSION PATH constructed from the mean peduncle and petiole values for the nine combination classes P(TST), P2, P3, P4, X, R4, R3, R2, R(TST) (Scottish data).
species variability. The Eire data are first presented in this way (Table 1). Note that the percentage of TSTs is uniformly high while, with one exception, the Heterogeneity Indices are uniformly low. The 'B' collection from Croniebyrn in the Wicklow mountains is the exception and it happens to be the only sample from an area known to have been under long-standing coppice management.- The proportion of truly intermediate specimens (i.e. classes P4, X and R4) is less than 2 per cent.
Fig. 3 shows the distribution of the values for the Primary Characters. Note that the index is largely determined by values for TSTs and that there is no obvious trend in the direction of the Introgression Path. The greatest concentration of non-TST values does lie on the Introgression Path, however, indicating the possibility of slight introgression.
DISCUSSION OF THE IRISH RESULTS
It may be objected that the Irish samples, being selective for good Q. petraea, cannot be validly compared with those from Scotland. Table 2 lists the equivalent Scottish aff. Q. petraea samples, i.e. those with no specimens showing more than four degrees of difference from the Q. petraea TST. Note that the proportion of truly intermediate class specimens is higher at 7 per cent. and that the overall Heterogeneity Index is nearly twice that for the Eire collections. That these differences are likely to be very significant can be seen more clearly when the Primary variables are compared in Secondary Character combination classes. Fig. 4 is an enlargement of the Q. petraea end of the Introgression Path (Fig. 2) with the values for the Eire collections and the Scottish equivalents superimposed on it. When individual values are plotted there is extremely wide scatter; means
Watsonia 6 (3), 1965.

164 J. E. COUSENS
TABLE 1. Range and frequency of secondary character combinations in the major Eire population samples.
Degrees of difference from petraea TST Height No. Locality 0 1 2 3 4 5 6 above
P P2 P3 P4 X R4 R3 Total HIt sea-level feet
1. Ballycoyl 15 3 2 1 21 0-52 500 2_ Powerscourt, Deer Park 16 6 1 23 0-35 500 3. Glendalough, Lugduff Wood 13 7 20 0-35 950 4_ Vale of Clara:
Croniebyrn A 11 2 2 15 0-40 450 Croniebyrn B 4 4 3 1 12 1-08 450
5. Shillelagh, Culliton Estate 13 1 1 1* 16 0-20 400 6. Portlaw, Curraghmore Estate 23 4 3 1* 1* 33 0·42 150 7. Glengariff Estate 25 5 2 33 0-39 50 8. Rillarney, TorrriesWood 37 9 6 1 2* 55 0·45 250 9_ Connemara, Ballynahinch 12 4 1 17 0·35 100
10. Lough Conn, Pontoon 20 4 1 25 0·25 150 11. Lough Gill, Cullendra 23 6 30 0·30 200 12. Lough Eske, Ardnamona
Estate 17 7 5 29 0·59 200
Totals .. 229 62 27 4 2 1* 4* 329 0·42 Per cent. 71 19 8 1·2 0·6
* Specimens taken on the margin of the wood in each case; they do not form a continuous series with those in the wood and have been treated as extraneous to the populations sampled.
t Heterogeneity Index.
20
18
16
14
12
10
4
2
TST 5 2
11 5
28 13
45 13 '
'-
41 22
35 13
T\ST Concentration centre for non TST values italicised
TST 1 • _________
.P2
3 2
: 6 : ,L 14 ....... 233 1 L~~
-.. .......... ___ -.. ______ . TST
3 5 .-L.~
..........
._.--==----IST P3 --- ---.. Introgression 12 ,3",,(TST1ST ---..~ -----path
4/·TST ---P2
NB. Marginal values-t Petiole % up - Peduncle Length down
o~~~~~~~~---L--~--~--~--~--~
2 4 6 8 10 12 14 16 18 20
Peduncie Length to first brad - mm
Fig. 3. Distribution of the combined Petiole % and Peduncle Length values for the Eire collections.
Watsonia 6 (3), 1965.
PEDUNCULATE AND SESSILE OAKS 165
TABLE 2. Range and frequency of secondary character combinations in Scottish samples within an equivalent range.
O.S. Serial Locality Degrees of difference from petraea TST Grid No. 0 1 2 3 4 Total HI
P P2 P3 P4 X
NJ 3 Elgin Town Wood 4 3 2 9 0·78 NH 3 Locan a' Chuillin 2 2 2 6 1·67 NM 4-5 Loch Sunart .. 4 3 3 2 1 13 1·46 NN 5 Loch Arkaig 12 10 1 23 0·56 NN 7 Spean Bridge 5 6 4 3 18 1·28 NN 9 Glen Falloch .. 1 2 2 1 6 1·50 NN 23 Glen Goil 3 5 4 1 13 1·31 NR 1 Claonig 4 3 1 8 0·88 NS 1 Menstrie Burn 3 3 6 0·50 NS 7 Ross Wood .. 3 3 3 10 1·20 NT 8 Cheviot 4 2 6 0·33 NT 15 Aikieside Wood 9 2 11 0·18 NT 18 Jedforest remnant 18 8 2 2 1 31 0·71 NT 21 Ettrick remnant 5 2 3 1 11 1·00 NX 1 Burnfoot Wood 8 1 1 1 11 0·55 NX 2 Currarie Glen 11 6 17 0·35 NX 3 Cairnryan 6 2 8 0·25 NX 4 Penkiln Burn 6 2 8 0·25 NX 7, 8, 11 Glentrool 20 6 26 0·23
Totals .. 128 69 26 14 4 241 0·74 Per cent. 53 29 11 6 2 100
13
---- - ---...--'-oTST(e) --..... _____ ...-- '\- -...
---- ---- '\ ______ oP3-x(e) "" "" . 0 ~
12
11
petraea P2(e) oTST(S) )
Concentration ~P / Centre /
" (Scottish Data) . ~" P2(S) 0 ...... ....:' /
" /'~2 " /'./ ~~ Smoothed ........ -... __ /./ P ~ " Introgression
-- 3(8) ~ Y Path
p.K P3
10
~
~ 9 0 ..... ~
8
2 4 6 8 10 12 Peduncle Length to first bract - mm
Fig. 4. The petraea end of the Introgression Path enlarged for comparison of (1) Eire values (e); (2) Values for equivalent Scottish populations (s); (3) Values for all Scottish populations (Fig. 2).
Watsonia 6 (3), 1965.

166 J. E. COUSENS
for the combination classes therefore tend to be erratic unless based on a sufficiently large number of specimens; for this reason classes P3 to X in the Eire data and P4 to X in the Scottish equivalents have been grouped together. Note that all the means for the Irish data lie above and to the left of those for the TST in both sets of Scottish data, i.e. on an extension of the Introgression Path. The Irish means do not give a very clear indication of the Introgression Path while the Scottish means do. Theoretical consideration of the effect of introgression on population statistics of this kind suggest that the following stages might be recognizable:
Stage I-a few hybrids are established and back-crossing has begun-the proportion of TSTs will be high; their mean values will lie at the very end of the Introgression Path but there will be a distinct 'tail' stretching out into the intermediate zone between the two species concentration centres.
Stage Il-hybridization is continuing and introgression is well advanced-the TST Primary Character means will have moved down the Introgression Path and there will be a substantial proportion of the specimens contributing to the 'tail' which will also reach into the intermediate zone.
Stage Ill-hybridization has ceased (between the species) and continuing backcrosses are resulting in a gradual assimilation of the 'alien' genes-the TST Primary Character means will have moved a little further down the Introgression Path and the 'tail' will have contracted.
Stage IV-the process of assimilation is complete-there will be no obvious introgressive trend and its origin will only be apparent if there are data from nonintrogressed populations for comparison.
Stage Ill, if seen in isolation, would not be distinguishable from a similar stage in evolutionary divergence.
Applying this theoretical picture to the Irish and Scottish collections compared above, it is clear that the Irish Q. petraea population is in a late phase of Stage Ill, while the equivalent Scottish woods are clearly in Stage Il (as is confirmed by the full Scottish data).
Analysis of the Irish data therefore indicates either a situation in which a past introgression has been almost entirely assimilated into the Q. petraea gene pool, or, alternatively, one in which evolutionary divergence is not quite complete.
If it be assumed that Scottish and Irish Q. petraea both arrived by migration from southern Britain, then their rather different status today must be due to significant differences in the conditions they encountered in the two countries. Several possibilities suggest themselves: Q. robur may not have been indigenous in Ireland; or many fewer interspecific hybrids may have arisen in Ireland; or the virtual absence of oak planting on any scale in Ireland may be the key factor. These results therefore provide some support for the writer's contention that planting was a major factor in determining the extent of introgression of Q. petraea in Scotland.
QUERCUS ROBUR IN ENGLAND
In 1960 some oakwoods around Doncaster were examined. The data from these collections (Table 3) suggested that sampling in England would give similar results to Scotland. This conclusion conflicted with that of Jones (1959). He had observed great variability in Q. robur populations in situations where the historical and ecological evidence argued strongly against introgression by Q. petraea (Dr. E. W. Jones, personal communication, 1962). Reputed Q. robur woods were therefore sampled in the most 'continental' part of England and on some of the heavy wet clays around Oxford. Fig. 5 shows the location of the population samples which are also listed in Table 4. The intermediate classes, R4, X and P4, include 26 per cent. of the specimens and there appears to be a very considerable hybrid element. Fig. 6 shows the distribution of values of the Primary Characters. The concentration centre for all values lies below the Introgression Path and
Watsonia 6 (3), 1965.

PEDUNCULATE AND SESSILE OAKS 167
TABLE 3. Range and frequency of secondary character combinations in the 1960 population samples.
Degrees of difference from robur or petraea TST Locality 0 1 2 3 4 3 2 1 0
P P2 P3 P4 X R4 R3 R2 R
Peak District: Castleton 14 6 Bamford Edge 5 4 1
Sherwood Forest: Major Oak area 7 3 1 2 2
N. Lincolnshire: Scrawby Estate 1 2 2 3 6 6 4
S. Lincolnshire: Tumby Estate 3 4 5 13 2 Woodhall Spa 1 4 2 1
Total
20 10
17
25
27 9
HI
0'30(p) 0'70(P)
mixed*
3'OO(R)
l'74(R) 1'89(R)
* Heterogeneity Indices have only been calculated when the data were unimodal in their frequency distribution.
Watsonia 6 (3), 1965.
DONCASTER Bamford 0 Scrawby
Cast/eton' 'Sh' d LlNCOl erwoo 0
Wood hall Spa, Tumby
1 , oPETfRBOROUGH .
5, P 4'0 .7
OXFORD
WINDSORo . s·
'2
°CAMBRIDGE
Fig. 5. ENGLAND-location of populations sampled.

168 J. E. COUSENS
TABLE 4. Range and frequency of secondary character combinations in samples of robur affinity from southern England.
Degrees of difference from the robur TST No. Locality 0 1 2 3 4 5 6 Total
1. 2. 3.
4. 5. 6. 7.
8.
9.
10. 11.
R R2 R3 R4 X P4 P3
British Nature Reserves: Castor Hanglands 4 10 8 6 2 30 Monks Wood .. 4 5 9 4 1 23 Hales Wood 9 9 5 1 24
Oxford Area: Wytham Wood .. 6 14 5 4 4 1 34 Blenheim Palace 8 12 11 8 3 1 44 Weston Wood 3 10 3 7 3 1 27 Waterperry 3 4 7 6 3 1 24
Windsor Park: Highstanding Hill 3 4 3 2 2 14
Ashford, Kent: Hoad's Wood .. 4 6 10
Weald: Oakwood Hill 2 4 3 9 Hurtwood 3 4 1 2 10
Totals 45 80 60 39 20 4 1 249 Per cent. 18 32 24 16 8 1·6 0·4 100
Petiole % 12 L' 't f
I,m I 0 Introgression path - broken line Eire -..!
10 petr~eaA . 3 R~ ~ '/ R4 R4/ _____ R2
e ./ \ ~ 00 6 3--2_~2 I P4t,~~· \
6! 7R3. 9 '25.... 25 16 4. 2 ~ T
-"', ·.>::4.<------R2
4 R4.1 8 44 20' 23 4 3 I 2 T~'''''''9 10 9 ~.- 2 ----__ .1
R3~'-TST R3 R2 R2 .
HI
1·73 1'70 0·92
1'68 1·82 2'00 2·21
1'71
1'60
1·11 1·50
1·70
TOTALS
ALL TST No % No % 4 2
27· 11 2
83 33 10 22
103 41 26 58
32 13 8 18
o 10 20 30 40 50 60 70 80 Peduncle Length to first bract -mm
90 100 110 120
ALL No 1 27 81 67 49 11 9 249 % 11 33 27 20 4 4 10.0
TST No 3 14 12 14 2 % 6 31 27 31 4
45 100
Fig. 6. Distribution of combined Petiole % and Peduncle Length values for collections of robur affinity in south-east and central England.
Watsonia 6 (3), 1965.

PEDUNCULATE AND SESSILE OAKS 169
well to the left of the main concentration centre for Q. robur TSTs. Few of the peripheral values are TSTs and as in the Scottish data all the very high peduncle values are from non-TST specimens. These abnormally high values have a marked effect on the means of the combination classes to which they belong. In Fig. 7 their trend, with and without these high values, is shown and related to the Introgression Path. The introgressive trend is >condensed but this might be expected in a series of collections from populations selected as most likely to be good Q. robur. It seemed that it should be possible to find better Q. robur than this somewhere in Europe.
7
6
5
4
Petiole %
P~duncle ~ength to first bract - ·mn;
20 22 24 26 28 30 32 34 36 38.
Fig. 7. Mean values for Petiole % and Peduncle Length by combination classes for (1) the Scottish data (squares); (2) English collections in Table 4 (circles right); (3) the latter with omission of abnormally high
values (circles left).
QUERCUS ROBUR IN YUGOSLAVIA
Enough had been seen of Q. robur on the Continent to know that it could be as variable there as it was in Britain. Q. robur and Q. petraea are almost sympatric in Europe and are thought to have maintained their identity for two reasons (a) partial intersterility and (b) fairly distinct ecological requirements. In particular Q. robur tolerates a considerable degree of waterlogging and even flooding, while Q. petraea is oxyphilic and is excluded from such sites (Jones 1959). Of the flood-plain oak forests of the Danube and its tributaries the ancient Slavonian Forest is possibly the most famous; in it Q. robur is reputed to reach its finest development (see, for example, Silvy-Leligois quoted by Jones on p. 172). Glavac (1961) and Dekanic (1962) provide excellent accounts of the phytosociology and ecology of typical flood-plain Q. robur forest near Lipovljani on the River Sava Ca remnant of the once more extensive Slavonian Oak Forest). The oak-dominated areas belong to the Association Querceto-Genistetum elatae Horv. and the only other oak in the vicinity is Q. cerris L. which belongs to a different Section of the genus Quercus and is not recorded as hybridizing with members of Section Robur. This therefore seemed a promising region in which to look for good robur populations and a visit was arranged in 1963. Fig. 8 shows the location of the popUlation samples which are also listed in Table 5. Vraticna Stara is an oak stand over 300 years old, now very open. Pozeravac is park-like, reputedly remains of the original forest of that part of the River Morava flood-plain, and consists of trees over 250 years old. Of the second-growth stands sampled the youngest was 90 years old
Watsonia 6 (3), 1965.

170
AUSTRIACi----)
(
J. E. COUSENS
r--------/---....... -...
_------------,-------~--() HUN
-.. -~
/--\~~MANIA -.' ..
BELGR~E
Fig. 8. YUGOSLAVIA-location of populations sampled.
TABLE 5. Range and frequency of secondary character combinations in the Yugoslav flood-plain samples.
Degre-es of difference from the robur TST No. Locality 0 1 2 3 Total HI
R R2 R3 R4
1. Strupnicki Lug 4 6 7 3 20 1-45 2. Turopolski Lug 6 3 6 4 19 1·42 3_ Lipovljani .. 6 5 5 2 18 1-16 4. Domoskela 3 4 2 1 10 0·90 5. Vraticna Stara 10 10 2 22 0-64 6. Kljestavica . _ 7 10 2 19 0'74 7. Cret 8 5 5 3 21 1·14 8. Pozeravac .. 18 21 9 6 54 1·06
Totals .. 62 64 38 19 183 1-08 Per cent. 34 35 21 10
(Turopolski Lug) and all were reputed to have been obtained from natural regeneration alone. If the flood-plain is defined as the area regularly inundated each spring then Nos. 1, 2 and 8 were near its margin. Strupni6ki Lug was the only site where Q. petraea occurred nearby-less than a mile away on a low ridge-and Kljestavi6a was the only alkaline site-a pH of about 8 as compared with pH 5-6 in the other areas.
Fig. 9 shows the distribution of the Primary Character values. Note that the concentration centre for all values is here the same as that for the Q. robur TSTs only and that it lies at the end of the Introgression Path.
DISCUSSION OF THE YUGOSLAVIAN RESULTS
The Heterogeneity Indices are high, not because there is a wide range of combination classes (R to R4 only) but because of the small proportion of TSTs (34 per cent.): nevertheless the English indices, ranging from 0·92 to 2'21, were considerably higher on the
Watsonia 6 (3), 1965.

PEDUNCULATE AND SESSILE OAKS 171
Petiole % TOTALS 12 Limit of ALL TST 11 Eire ~I Introgression
10 petr~ea/' 1
9 \.XB2 /~ 8 ./ \I~l~ 1 3~2 7 I R4j " TST "'R 6 i !~j'4" 7 18 13 .~ 2 1 5 R3\ R2 ',~ - ~:rST R
- ~ -------..: 3 ~ Hi" 18 26 35- 21 16 ~ '2~R2
"0 4 5 _-----1h 2 Ri--. .1Q..'~TST 1
TST R3
path -broken line No. % No. %
7 3 2 3
48 23 16 22
127 62 48 65
23 11 8 11
0 10 20 30 40 50 60 70 80 90
All No Peduncle Length to first bract-mm 3 27 44 59 42 18 8 3 2 206
% 1 13 21 28 20 9 4 1 1 100 TSTNo 4 18 20 15 1 J 11 3 74
% 5 24 27 20 15 4 4 100
Fig. 9. Distribution of combined Petiole % and Peduncle Length values for all Yugoslav robur collections.
average (Table 5). Fig. 9 shows a very wide scatter of values but no obvious concentration of values along the robur-petraea introgression line.
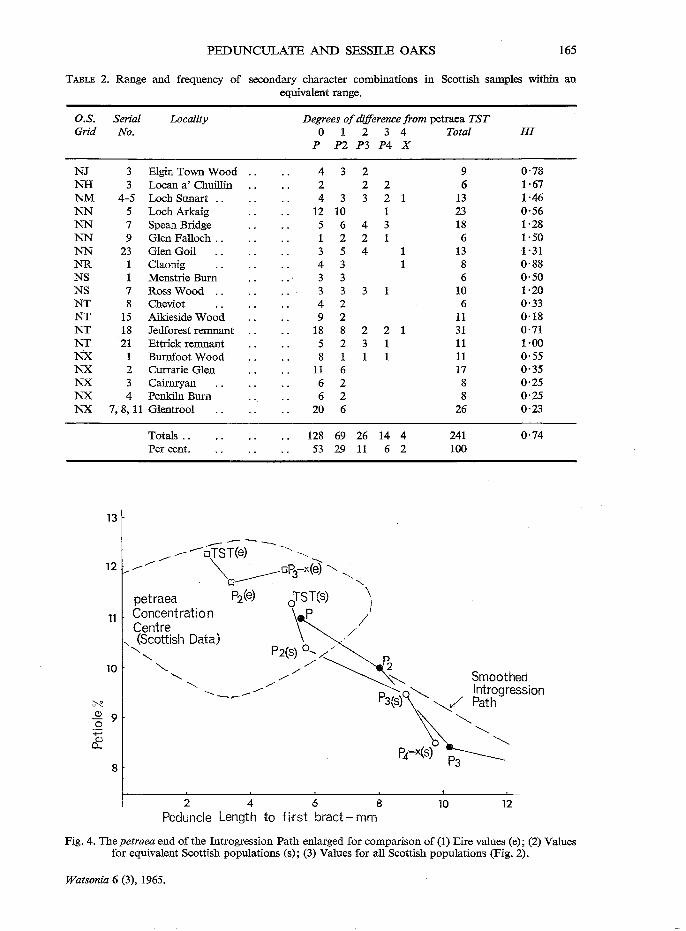
In Fig. 10 the distribution patterns for various components are shown as simplified scatter diagrams. The first four diagrams show that divergence from the Q. robur TST is associated with a reduction in peduncle length but there is no tendency for the petiole per cent. to rise at the same time. The variability cannot therefore be ascribed to introgression by a species like Q. petraea which has high petiole per cent. and low peduncle length values. In the TST diagram there is a suggestion of a lower concentration centre (peduncles 20-25 mm to first bract). A lower concentration centre appears more markedly in the diagram for specimens with pubescent peduncles; but it is now in the 15-20 mm range. Such a pattern could have arisen through introgression by a species with short petioles like Q. robur but with short pubescent peduncles. In the TST diagram there is also the suggestion of an upper concentration centre in the range 55-60 mm for peduncle length to first bract. This could indicate introgression by a species with short petioles like Q. robur but longer peduncles. There are, in fact, two species of oak in this region which conform to these specifications, namely, Q. conferta Kit. and Q. pedunculiflora K. Koch; both belong to Section Robur of the genus and presumptive hybrids of both with Q. robur have been found in Bulgaria (K. Kostov, personal communication, 1964). One explanation of the great variability of Q. robur in Yugoslavia and elsewhere may lie in its introgression by a number of related species. There is no evidence of currently active introgression. If it occurred, the most likely period would be during the enforced migrations caused by the Pleistocene glaciations of northern Europe. The theory is an attractive one in that it could be held to account for several characters which appear occasionally in Q. rabur but more consistently in related species-for example, forms with (a) very long peduncles or secondary leaf lobing (Q. pedunculiflara), (b) very deep regular lobing (Q. conferta), (c) abaxial stellate pubescence (most members of Section Robur).
For the present the Yugoslavian collections merely indicate that Q. rabur is, or has become, an exceedingly variable species.
Watsonia 6 (3), 1965.
172 J. E. COUSENS
Petiole % Totals R -RoburTST 8 1 1 2
6 2 1 344 1 1 16 4 126 5 5 8 2 4 4 6 2 1 2 48 2 121 1 3 8
74
R2-specimens showing one difference 10 1 1 8 1 1 2 4 6 1 42532 1 1 19 4 1 5 5 2 6 8 6 2 3 2 1 1 42 2 1 3 1 1 1 7
73
R3-specimens showing two differences 6 1 3 3 1 8 4 3214343 3 1 24 2 1 2 2 1 6
38
R4--specimens showing three 8 1 1 differences 6 1 1 2 1 5
4 2 412 1 1 12 2 1 1 2
20
All specimens with pubescent peduncles 8 1 1 2 6 1 2 1 1 532 1 16 4 23845586421 1 50 2 215 3 1 12
80
o 10 20 30 40 50 60 70 80 90
Peduncle to first bract-mm.
FIG. 10. Simplified scatter-diagrams for various components of the complete Yugoslav data.
GENERAL DISCUSSION AND CONCLUSIONS
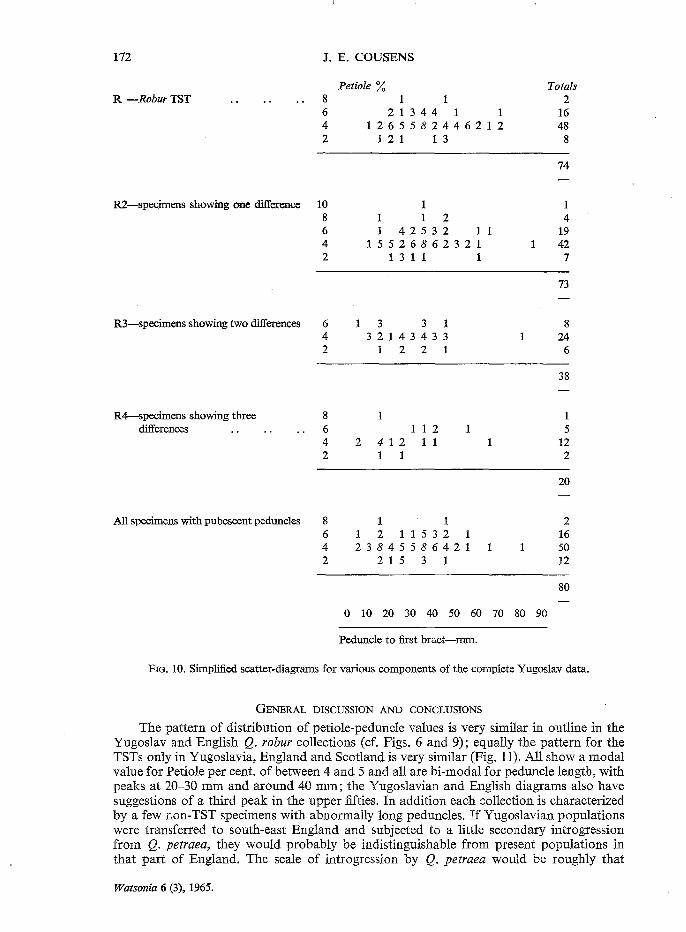
The pattern of distribution of petiole-peduncle values is very similar in outline in the Yugoslav and English Q. rabur collections (cf. Figs. 6 and 9); equally the pattern for the TSTs only in Yugoslavia, England and Scotland is very similar (Fig. 11). All show a modal value for Petiole per cent. of between 4 and 5 and all are bi-modal for peduncle length, with peaks at 20-30 mm and around 40 mm; the Yugoslavian and English diagrams also have suggestions of a third peak in the upper fifties. In addition each collection is characterized by a few non-TST specimens with abnormally long peduncles. If Yugoslavian populations were transferred to south-east England and subjected to a little secondary introgression from Q. petraea, they would probably be indistinguishable from present populations in that part of England. The scale of introgression by Q. petraea would be roughly that
Watsonia 6 (3), 1965.

PEDUNCULATE AND SESSILE OAKS
Yugoslavia
England
Scotland
Petiole % 8 6 4 2
8 6 4 2
8 6 4 2
1 1 2 1 344 1 1
1 2 6 5 5 8 244 621 2 1 2 1 1 3
1 12313 3 141
1 2 5 643 641 1 32322 1
1 1 331 3 1132371
2 2
1 1 1 1 2
2
o 10 20 30 40 50 60 70 80
Peduncle to first bract-millimetres.
Totals 2
16 48
8
74
2 19 33 14
68
1 15 21
6
43
Fig. 11. Scatter diagrams for the robur TST in various collections.
173
suggested by Jones (1959, p. 198) in southern England, with a slight increase northwards into Scotland. It seems reasonable to conclude that the Q. robur that arrived in postglacial Britain was very like present-day Q. robur in Yugoslavia; that it was even then a very variable species; and that it must be accepted now as a species very difficult to define.
In the previous paper the prevalence of Q. petraea forms of pubescence on the leaves and peduncles of Scottish hybrid specimens was tentatively ascribed to partial dominance by Q. petraea. It is now apparent that Q. robur already has some genes for such pubescence and there is no reason to believe that these characters are other than under polygene control.
It should be emphasized that none of these major collections were planned as representative samples of oakwoods in the regions concerned. Generally the aim was either to determine the range of variation in what were thought to be the most 'natural' woodlands (Irish and earlier Scottish collections) or to sample woodland reputed to consist of good Q. robur or Q. petraea (Eire, Yugoslavia, southern England and the later Scottish collections). Infertile specimens, which were ignored in the general analyses, are more likely to be hybrids than fertile specimens in areas where current introgression has been demonstrated (Cousens 1963, Table 6). Mixed populations have also been ignored. Overall there has been a bias against demonstrating the full extent of any introgression.
There seems to be a cline of increasing introgression northwards in England and Scotland. Planting of Q. robur in Scotland may explain the difference between Irish and Scottish Q. petraea populations but planting has been equally prevalent in England and another explanation is required for the increasing introgression northwards. Fig. 12 contrasts the extremes as exemplified by samples from Kent and the Central Highlands of Scotland; both have a long history of intensive forest management.
In Ham Street Nature Reserve Q. robur and Q. petraea are both reasonably good as now redefined (Table 6), while in the Loch Katrine sample a majority of the forms were intermediate and there were no TSTs. It has been suggested, but not demonstrated, that cross-pollination should occur more frequently in Scotland because the growing season is
Watsonia 6 (3), 1965.

174
Petiole %
15
5
o
10
5
•• •
/ -, // cc "\
PETRAEA) , /e ,_/
00
10
®
0 @®
o •
o
0
20
® 0
0
0
J. E. COUSENS
30
® Specimens differing from either TST in
two or more charaders - presumptive hybrids
• aff. petraea 0 aff. rabur
o
o ---, .---"cc \
(ROBUR ) --... _/
o
40
o
o
o
50
o o 0
HAM STREET NATURE RESERVE
KEN T
60
LOCH KATR I NE
70
NORTH SHORE WOODS
CENTRAL HIGHLANDS SCOTLAND o ~ ____ ~~ ____ ~ ______ ~ ______ ~ ______ ~ ______ ~ ______ ~ 10 20 30 40
Peduncle Length to first bract- mm 50 60 70
Fig. 12. Scatter Diagrams for samples from two woods with a long history of intensive forestry management, one from south-east England, the other from Scotland.
shorter and there is greater overlap in the flowering times of Q. robur and Q. petraea. Such an hypothesis is an essential part of any explanation of the increased introgression northwards. By itself it cannot explain the striking increase in the introgression of Q. petraea, considering the low level of interfertility found by Pyatnitski and Dengler under the optimal conditions of artificial cross-pollination. However, their crossing experiments are not necessarily conclusive; a few selected individuals of each species only were con~ cerned and in one year the robur ~ X petraea 6' cross reached a level of 15 per cent. interfertility. If Q. robur is such a variable species, the degree of interfertility with Q. petraea may be very variable too. Crossing trials with a much wider range of parental genotypes would clear up this point. Some indirect evidence might be obtained by comparing the degree ofintrogression of Q. petraea in Devon and Wales with that in Scotland.
Assuming, then, that rather more first generation hybrids are likely to appear in the north wherever Q. robur and Q. petraea occur together, it is obvious that the extensive planting of Q. robur in Q. petraea areas (bringing the species together) and intensive coppice management (shortening the generation time) could have greatly accelerated the introgression of Q. petraea by Q. robur. Q. petraea was seldom used for planting and this factor alone is sufficient to account for the great difference in degree of introgression of
Watsonia 6 (3), 1965.

PEDUNCULATE AND SESSILE OAKS 175
Q. robur and Q. petraea in Scotland. The very considerable introgression of Q. robur by Q. petraea in Scotland previously postulated (Cousens 1963) must now be considered illusory; most of the heterogeneity in Q. robur forms was probably there before the species arrived in Scotland.
The validity of most of these conclusions could be checked by crossing experiments but as the generation time would be of the order of 10 to 20 years at least, it would be a very long time before the genetic basis of variability could be established.
Table 6 shows the range of variation observed in the Yugoslavian Q. robur and Irish Q. petraea populations sampled. Ranges overlap for all the selected diagnostic characters but the species are separate entities in terms of petiole per cent. and peduncle length combined (see Fig. 9). Using these definitions it should be possible to diagnose good populations of either species. Individual trees, however, can only be identified as good Q. robur or Q. petraea when all four secondary characters are typical and petiole and peduncle values lie within the ranges shown in Fig. 9; this means, for example, that only about 25 per cent. of Scotland's oaks can be positively identified.
ACKNOWLEDGMENTS
I am indebted to all those who assisted me in planning or making the collections; to many members of the Forestry Division of the Department of Lands in the Republic of
TABLE 6. The observed range of variation of selected diagnostic characters for Q. robur (yugoslavian collections) and Q. petraea (Irish collections).
Diagnostic character
Peduncle length to first bractmm.
Total Peduncle Length
Petiole % of leaf length
Auricle Type*
Stellate Pubescence abaxially on lamina (small, prostrate) or along midrib (large, erect)
Peduncle Pubescence below first bract-in vicinity of first bract if peduncle very short (recorded from July onwards)
Peduncle Diameter at narrowest point below first bract-if elliptical, mean of two diameters
Q. robur
(6)-15-22-38-60-(88)
14--35-55-80--(123)
(1)-2-4-6-(9)
Medium-Strong
Both types absent 8 %-one or both types represented by a few stellate hairs 1 %-small but obvious amount of both types
Glabrous or with a few scattered hairs (equally common) Forms with general pubescence may reach 30% in some populations
1 mm or less 11 %-c. 1· 5 mm Less than 2 % reaching 2 mm
Notes. Modal values and commonest forms in italics Parentheses indicate fairly isolated extreme values. Peduncle characters from longest peduncle on specimen.
Q.petraea
0-1--4-(20)
1-10-26-(63)
(5t)-9-12-15-(20)
Nil-Weak-{Medium)
Both types well developed 8 %-one or both types deficient
1 %-both absent
At least patches of dense pubescence 4 %-only a trace of pubescence Less than 1 % glabrous
2 mm or more 20%-c. 1'5 mm Less than 7 % as little as 1 mm
Leaf characters from two mid-shoot leaves on a representative sun-shoot taken from the lower crown on the south or south-east side of the tree.
* For a description of auricle types see Cousens (1962).
Watsonia 6 (3), 1965.

176 J. E. COUSENS
Ireland, of the Nature Conservancy in south-east England and of the Forestry Faculties of the Universities of Zagreb and Belgrade in Yugoslavia. I am particularly grateful to Dr. E. W. Jones for his interest, encouragement and advice at critical stages in this work; and to Professor J. N. Black and Dr. J. W. Gregor, who kindly read and criticized the original manuscript, for their many valuable suggestions. The work was carried out with the aid of grants from the Forestry Commission.
REFERENCES
COUSENS, J. A. (1962). Notes on the status of the sessile and pedunculate oaks in Scotland and their identification. Scot. Foy. 16, (3).
COUSENS, J. E. (1963). Variation of some diagnostic characters of the sessile and pedunculate oaks and their hybrids in Scotland. Watsonia 5, 273-86.
DEKANIc, I. (1962). Utjecaj podzemne vode na pridolazak i uspijevanje sumskogdrveca u posavskim sumama, kod Lipobljana. Glasnik za sumske pokuse 15, 5-102.
GLAVAC, V. (1961). 0 vlaznom tipu hrasta luznjaka i obicnog graba. Sum. List 9-10,342-7 Zagreb. JONES, E. W. (1959). Biological Flora of the British Isles. Quercus L. J. Eco!. 47. McCRAcKEN, E. (1963). Irish woodlands, 1600 to 1800. Quart. J. For. 57 (2). McEvoy, T. (1943). Some Irish native woodlands: an ecological study. Thesis M.Agr.Sc., National
University of Ireland, Dublin. PRAEGER, R. LL. (1934). The Botanist in Ireland. Dublin.
Watsonia 6 (3), 1965.