Embed Size (px)
Citation preview
Lecture 3: Describing Populations
FIRST,What are the unique characteristics of sessile organisms?
….Sessile?....
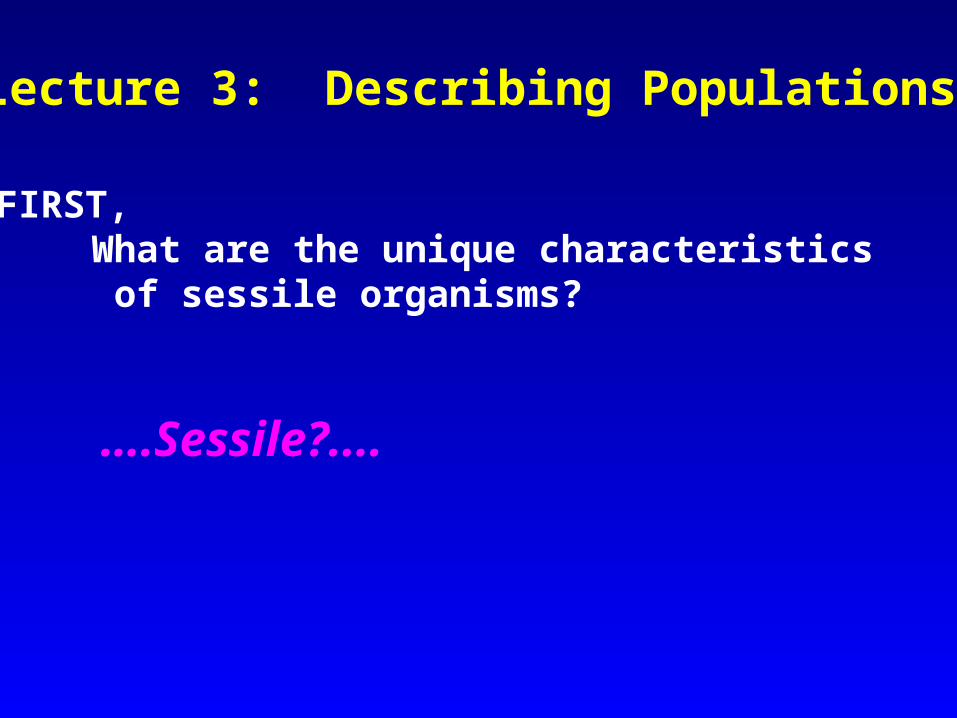
How plants differ from (mobile) animals
•Modular GrowthImportance of meristem tissue
•MovementsHow do plants disperse? Consequences?
•Phenotypic Plasticity
•Resting Stage
•Ecological neighborhoods
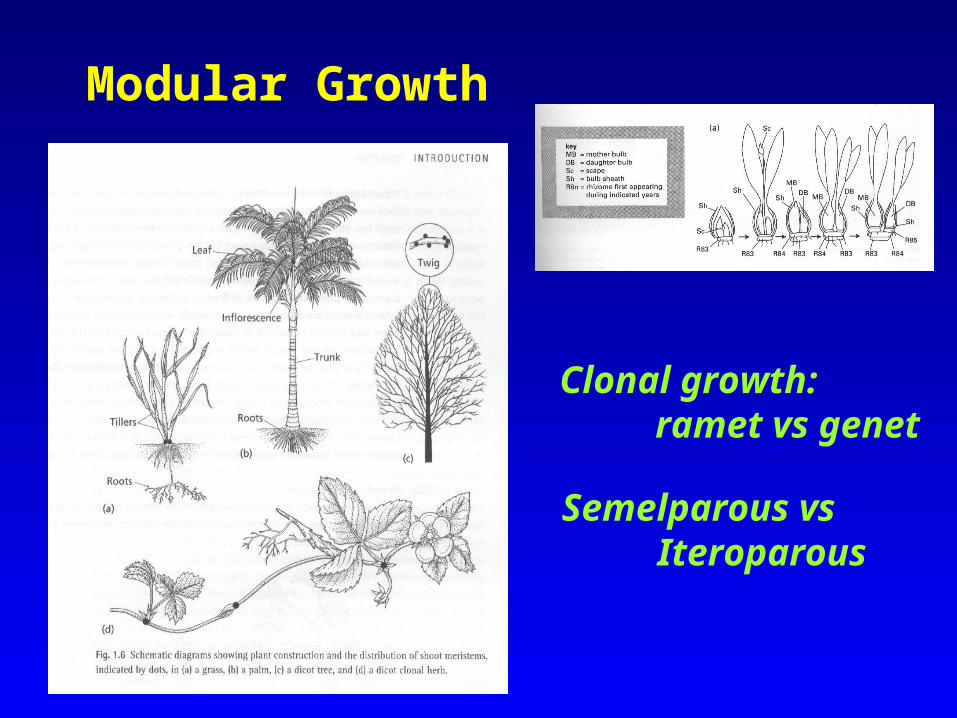
Modular Growth
Semelparous vsIteroparous
Clonal growth:ramet vs genet
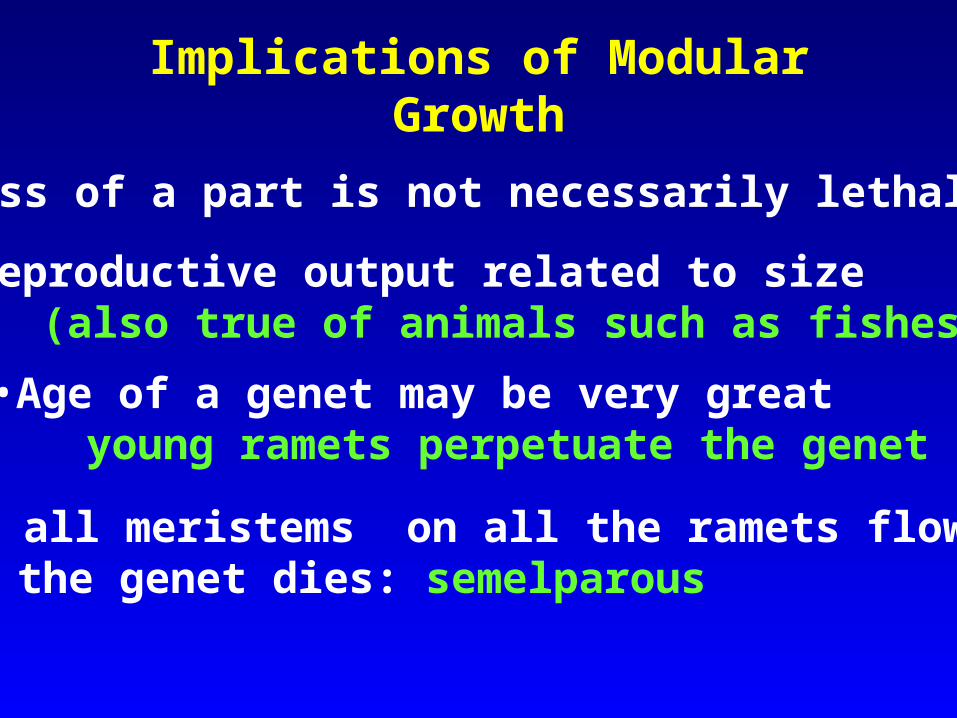
Implications of Modular Growth
•Loss of a part is not necessarily lethal
•Reproductive output related to size(also true of animals such as fishes)
•Age of a genet may be very greatyoung ramets perpetuate the genet
•If all meristems on all the ramets flower,the genet dies: semelparous
Phenotypic plasticity
Allows organisms to respond to local conditions
Can lessen the effects of natural selection on theunderlying genotype
Definition
Examples….
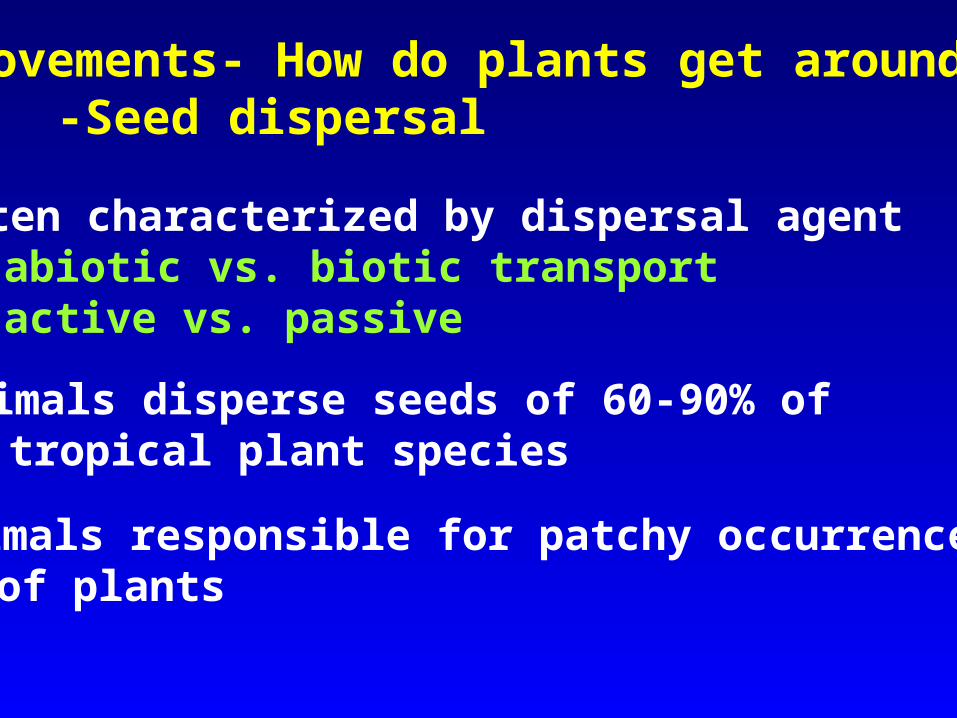
Movements- How do plants get around?-Seed dispersal
•Often characterized by dispersal agentabiotic vs. biotic transportactive vs. passive
•Animals disperse seeds of 60-90% of tropical plant species
•Animals responsible for patchy occurrenceof plants
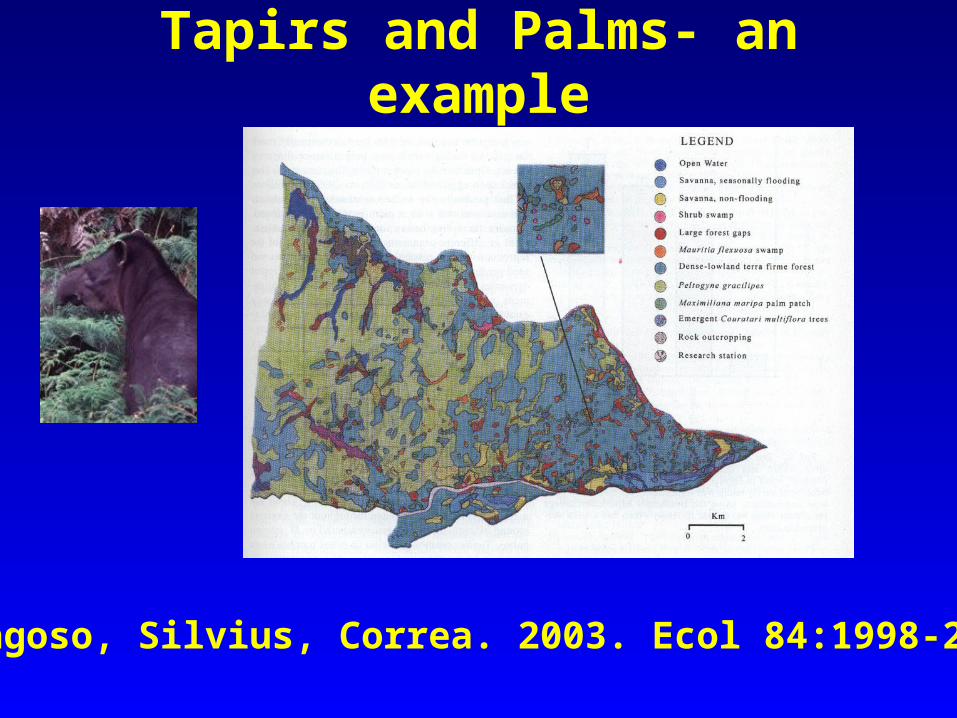
Tapirs and Palms- an example
Fragoso, Silvius, Correa. 2003. Ecol 84:1998-2006
Resting stage- what are the consequencesof reproduction by seeds?
•How long do the seeds survive?
•Dormancy may be broken by environmentalconditions or after some amount of timehas passed
“DISPERSAL THROUGH TIME”
•The seed bank- implications for conservation and evolution
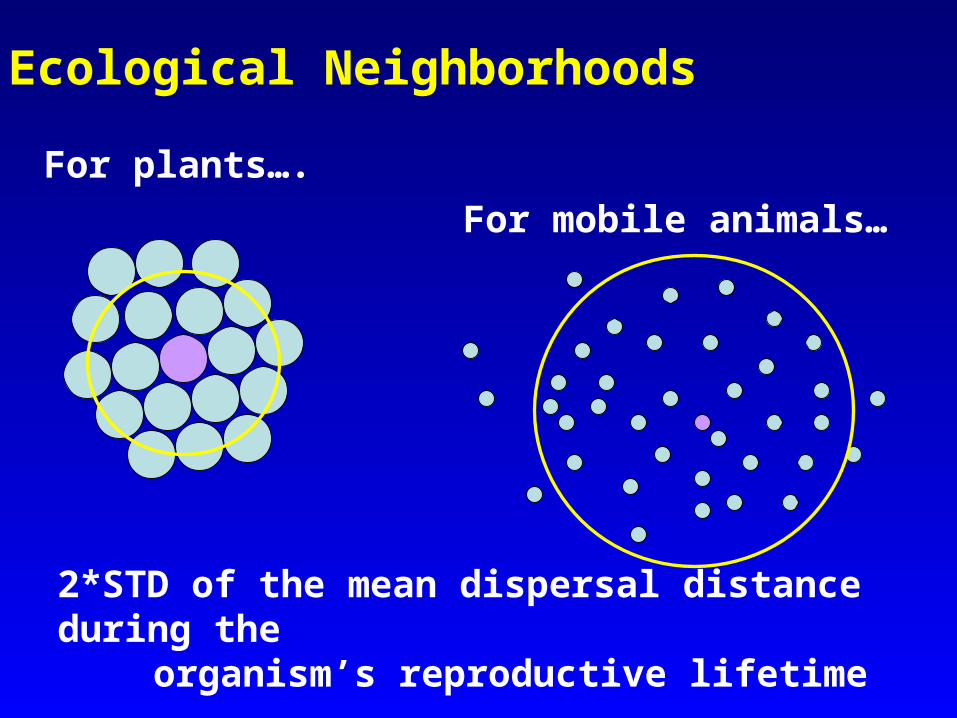
Ecological Neighborhoods
For plants….
For mobile animals…
2*STD of the mean dispersal distance during theorganism’s reproductive lifetime
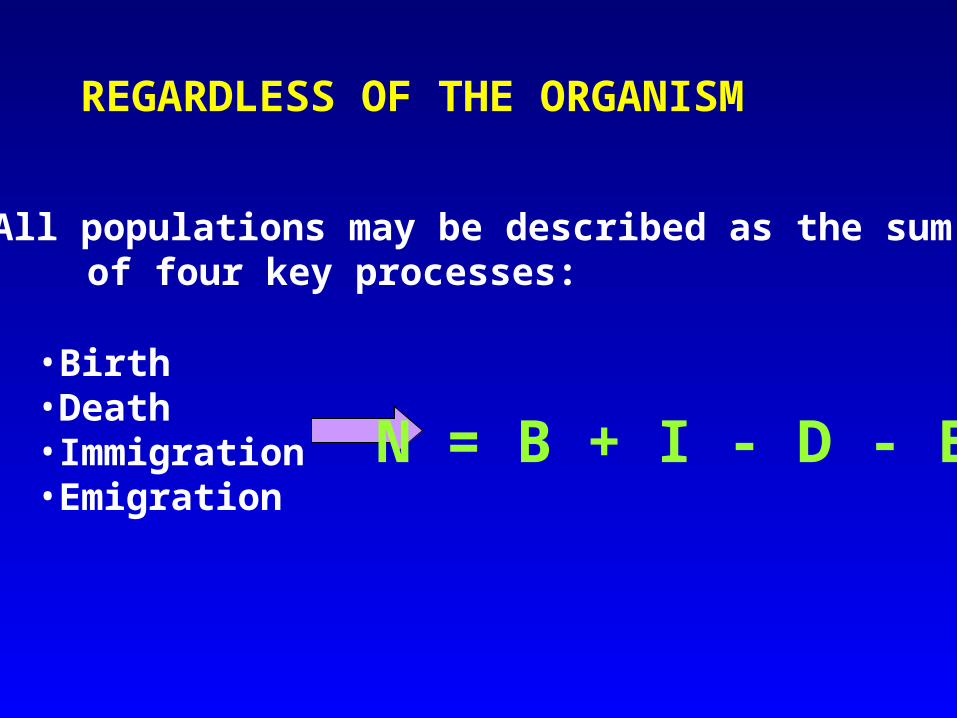
REGARDLESS OF THE ORGANISM
All populations may be described as the sumof four key processes:
•Birth•Death•Immigration•Emigration
N = B + I - D - E
Demographic rates
•Reproduction
•Survival
These processes are common to both plantsand animals.
How many young are produced and recruitinto the population?
What is the probability of not dying inthe current time interval?
Movement
Dispersal- natal vs. post-breeding (adult)
Issues…
Closed Versus Open Populations
Closed populations:
•No immigration or emigration
•Special case: no births or deaths
Population is static: Membership is constant
Most populations are not closed except forvery short periods of time
Life History Strategies
Trade-offs between reproduction and survival
Effects of size or age on reproduction andsurvival
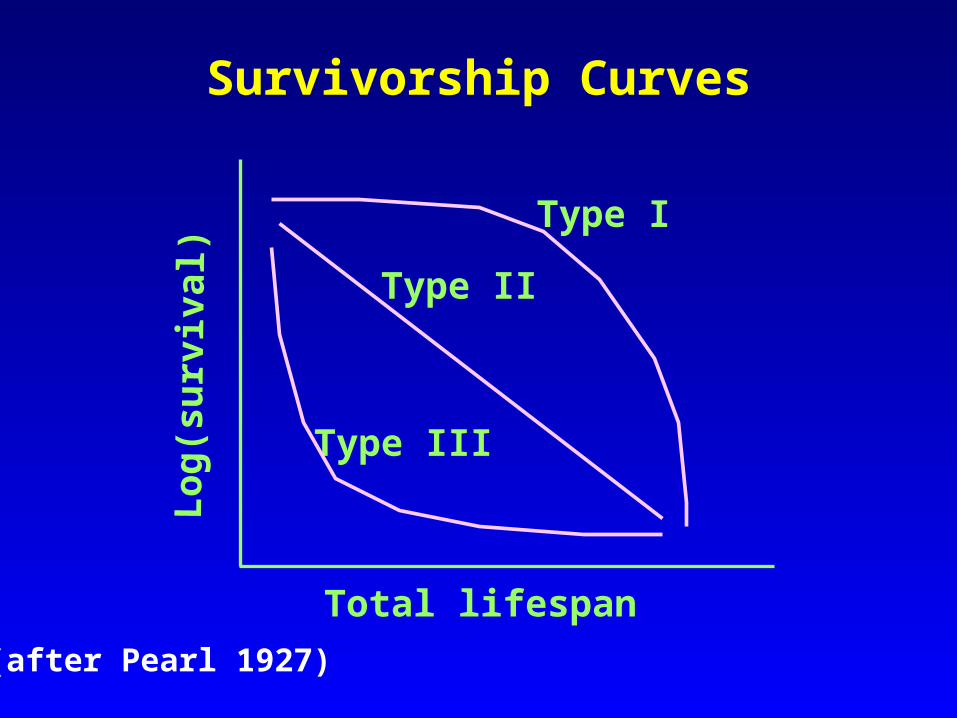
Survivorship Curves
Type III
Type I
Type II
Total lifespan
Log
(su
rviv
al)
(after Pearl 1927)
A conceptual model:
Model: abstract representation that includesonly key features of system
Conceptual models emphasize understandingover mechanistic explanation
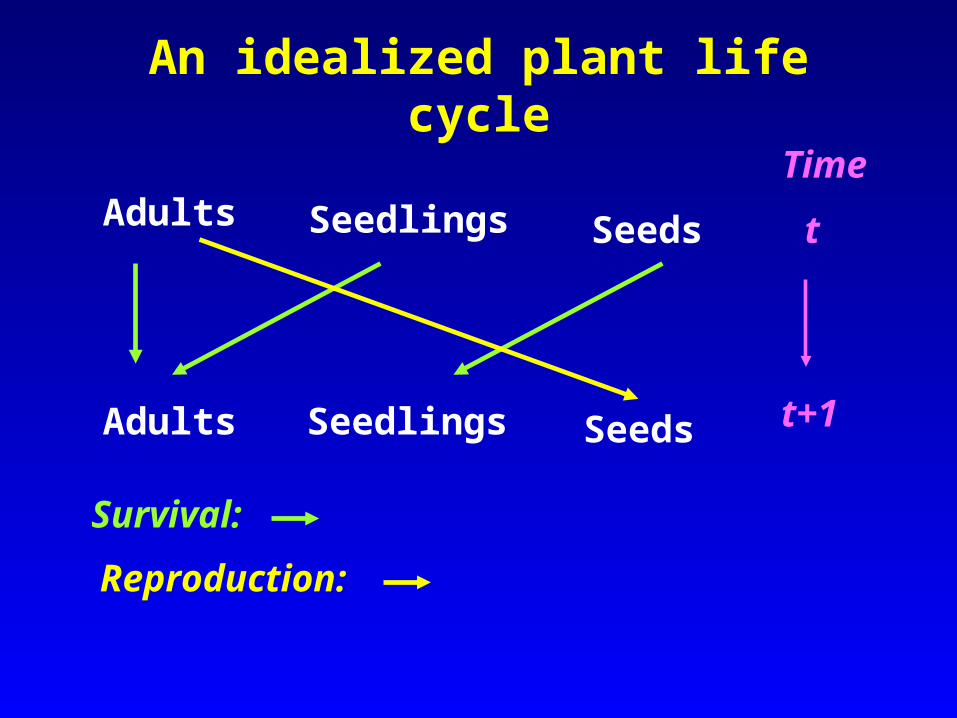
An idealized plant life cycle
Adults Seedlings Seeds
Adults Seedlings Seeds
Time
t
t+1
Survival:
Reproduction:
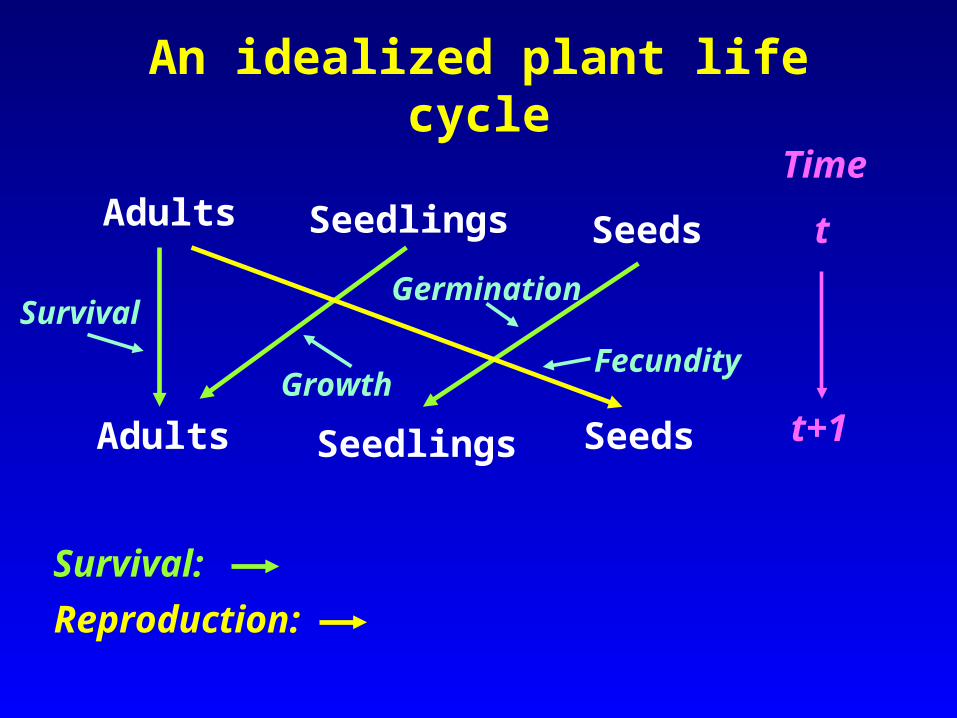
An idealized plant life cycle
Adults Seedlings Seeds
Adults Seedlings Seeds
Time
t
t+1
Survival:
Reproduction:
Survival
Growth
Germination
Fecundity
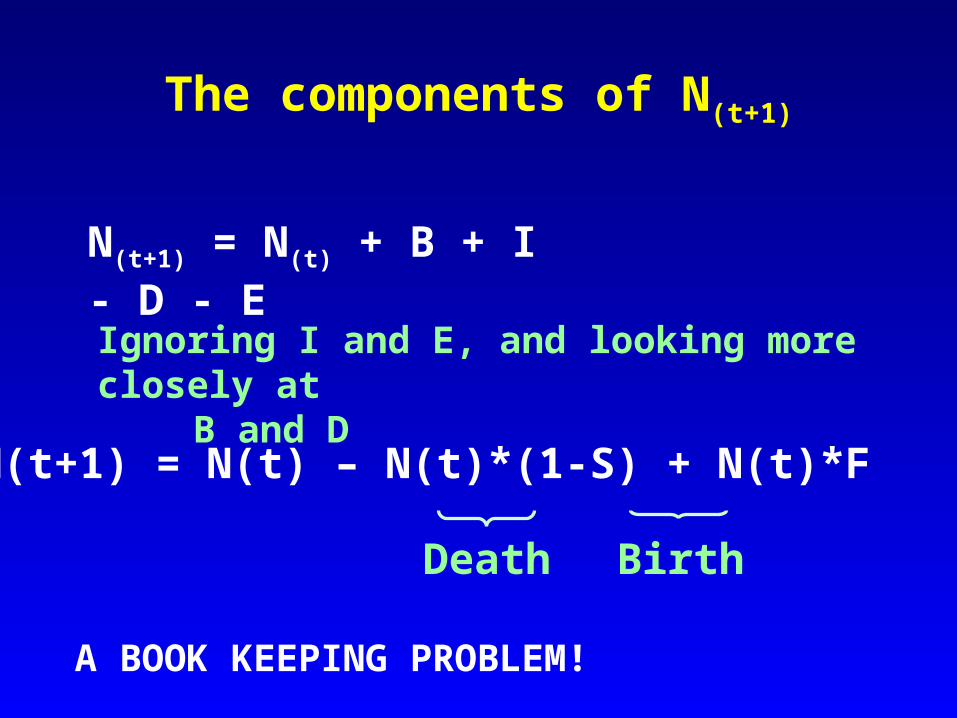
The components of N(t+1)
N(t+1) = N(t) + B + I - D - E
Ignoring I and E, and looking more closely at B and D
N(t+1) = N(t) – N(t)*(1-S) + N(t)*F
BirthDeath
A BOOK KEEPING PROBLEM!
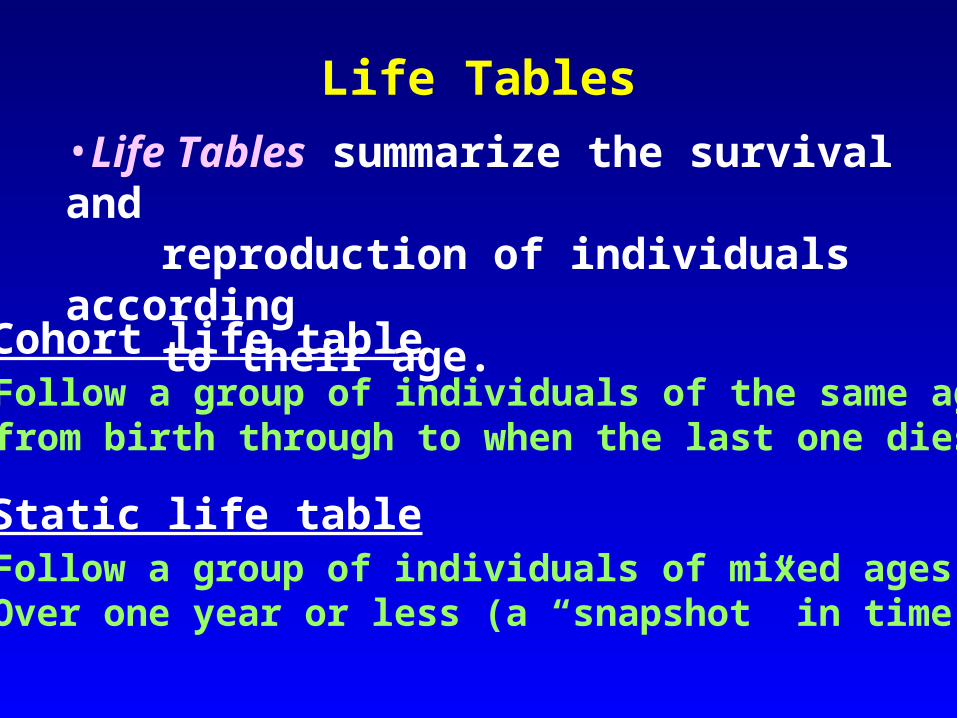
Life Tables
•Life Tables summarize the survival andreproduction of individuals accordingto their age.
Cohort life tableFollow a group of individuals of the same agefrom birth through to when the last one dies
Static life tableFollow a group of individuals of mixed agesOver one year or less (a “snapshot” in time)
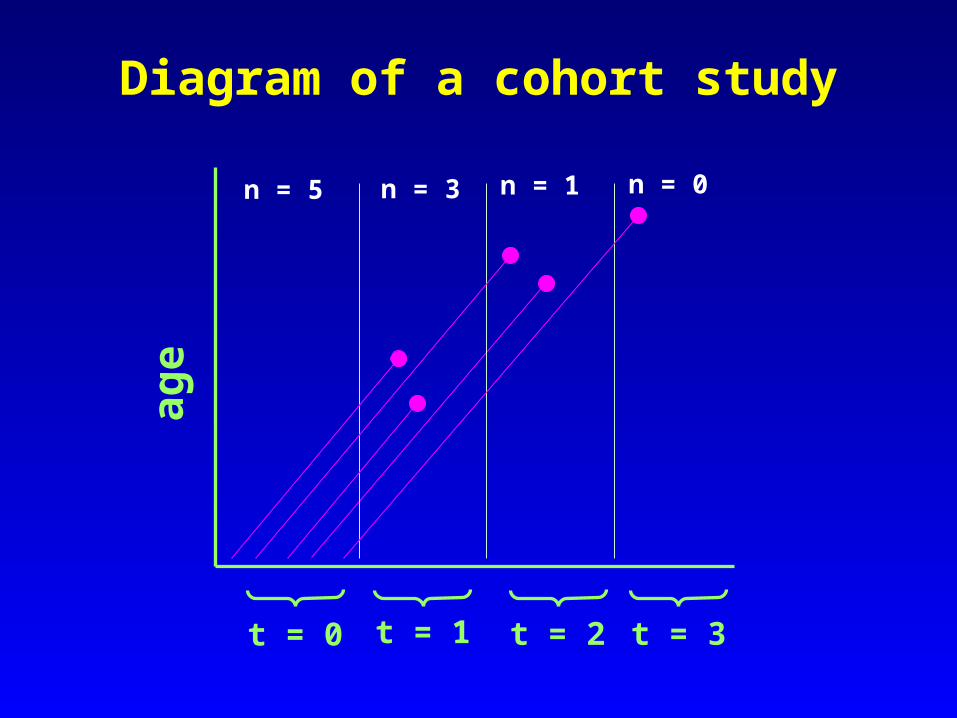
Diagram of a cohort study
age
t = 0 t = 1 t = 2 t = 3
n = 5 n = 3 n = 1 n = 0
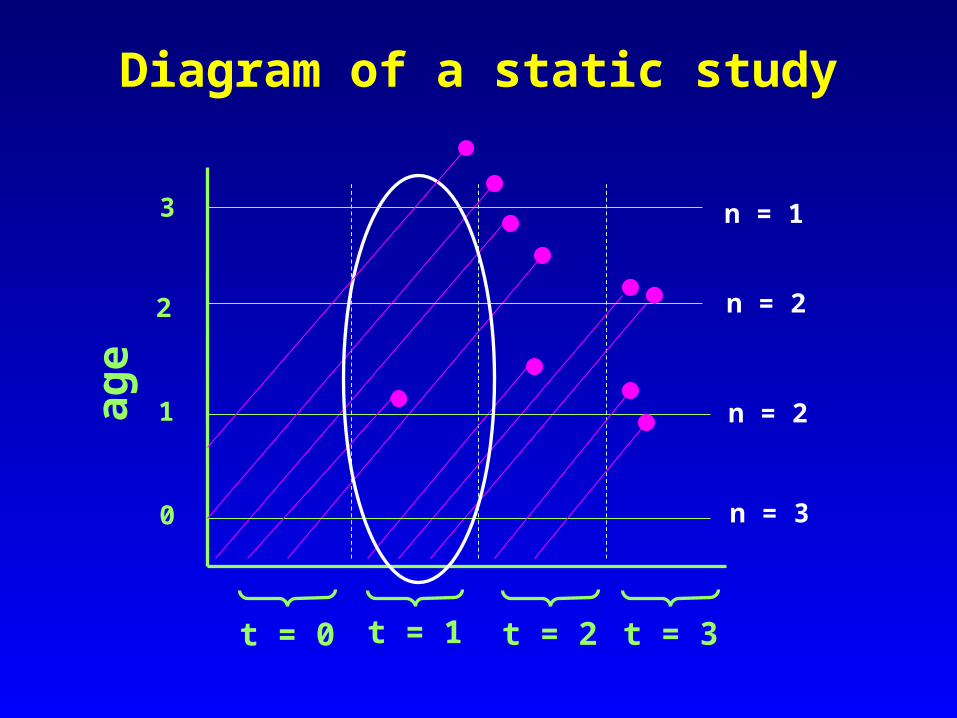
Diagram of a static studyag
e
t = 0 t = 1 t = 2 t = 3
n = 2
n = 3
n = 2
n = 1
0
1
2
3

Problems with life table calculations
•Static: assume that no’s individuals that areborn and that survive do not changefrom year to year
•Both types assume that all individualsthat are alive are counted
•There are now much better ways to calculatesurvival (mark-recapture, for example)that do not depend on these assumptions
Why are they still useful?
Under some conditions, still can be used tocalculate survivorship
Still good for keeping track of individualsand vital rates for groups
Historical perspectives
SUMMARY“Plant” perspectives:
modular growthphenotypic plasticitymovementresting stagesecological neighborhoods
The “BIDE” equationdemographic rates plus movements
Dispersal- types and issues
SUMMARY continued
Open versus closed populations
Life history strategies:survivorship, reproduction
Keeping track: conceptual models and life tables


![Thermodynamics of Abiotic Stress and Stress Tolerance of ... · duced [1]. Since plants are sessile organisms, mechanisms of tolerance (i.e., stress avoidance and stress adaptation)](https://img.pdfslide.us/doc/110x75/5e864cf4d2610b3dcb2ed849/thermodynamics-of-abiotic-stress-and-stress-tolerance-of-duced-1-since-plants.jpg)