Embed Size (px)
Citation preview
2011-11-2
1
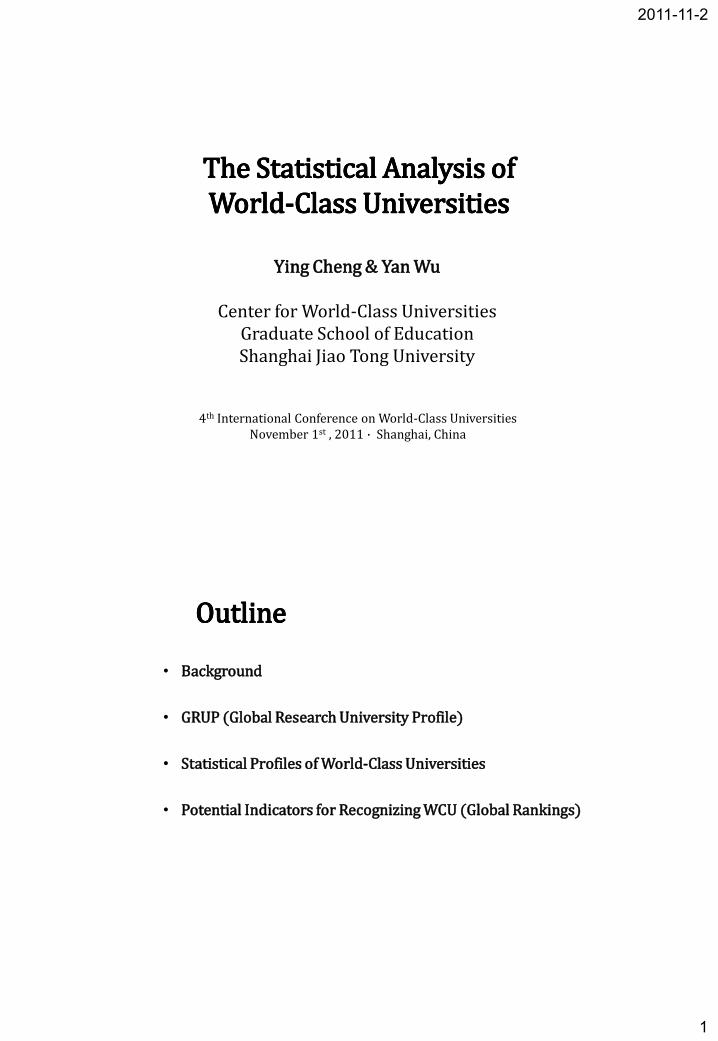
The Statistical Analysis of The Statistical Analysis of WorldWorld--Class UniversitiesClass Universities
4th International Conference on World-Class UniversitiesNovember 1st , 2011 ∙ Shanghai, China
Ying Cheng & Yan Wu
Center for World-Class UniversitiesGraduate School of EducationShanghai Jiao Tong University
OutlineOutline
• Background
• GRUP (Global Research University Profile)
• Statistical Profiles of World-Class Universities
• Potential Indicators for Recognizing WCU (Global Rankings)
2011-11-2
2
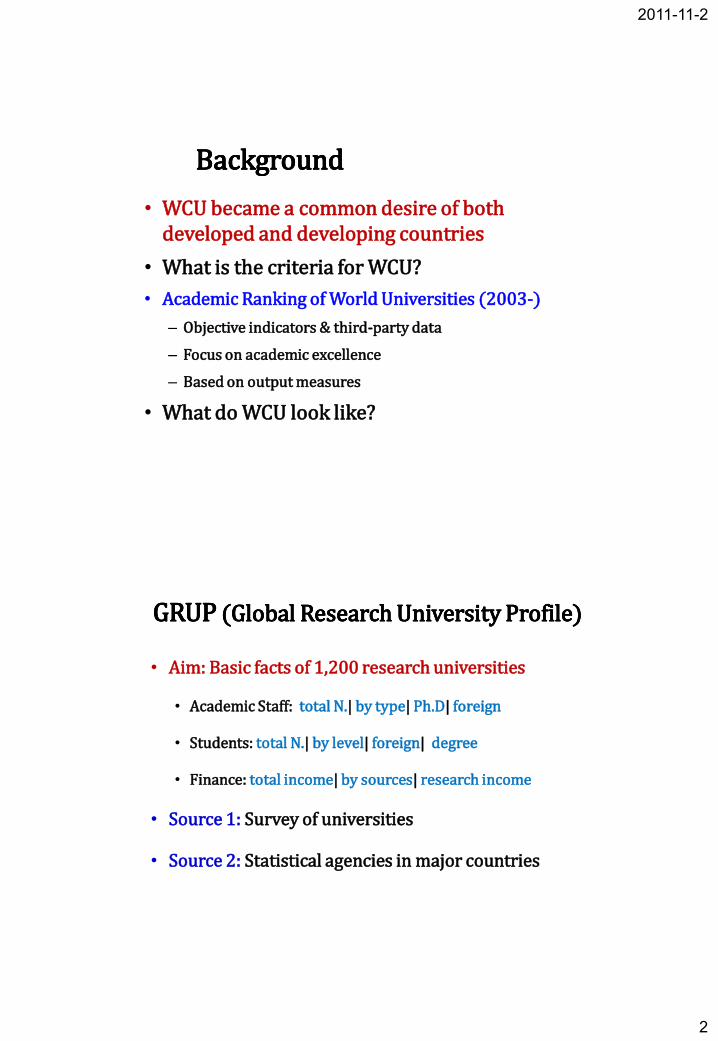
BackgroundBackground
• WCU became a common desire of both developed and developing countries
• What is the criteria for WCU?
• Academic Ranking of World Universities (2003-)
– Objective indicators & third-party data
– Focus on academic excellence
– Based on output measures
• What do WCU look like?
GRUPGRUP (Global Research University Profile)(Global Research University Profile)
• Aim: Basic facts of 1,200 research universities
• Academic Staff: total N.| by type| Ph.D| foreign
• Students: total N.| by level| foreign| degree
• Finance: total income| by sources| research income
• Source 1: Survey of universities
• Source 2: Statistical agencies in major countries
2011-11-2
3
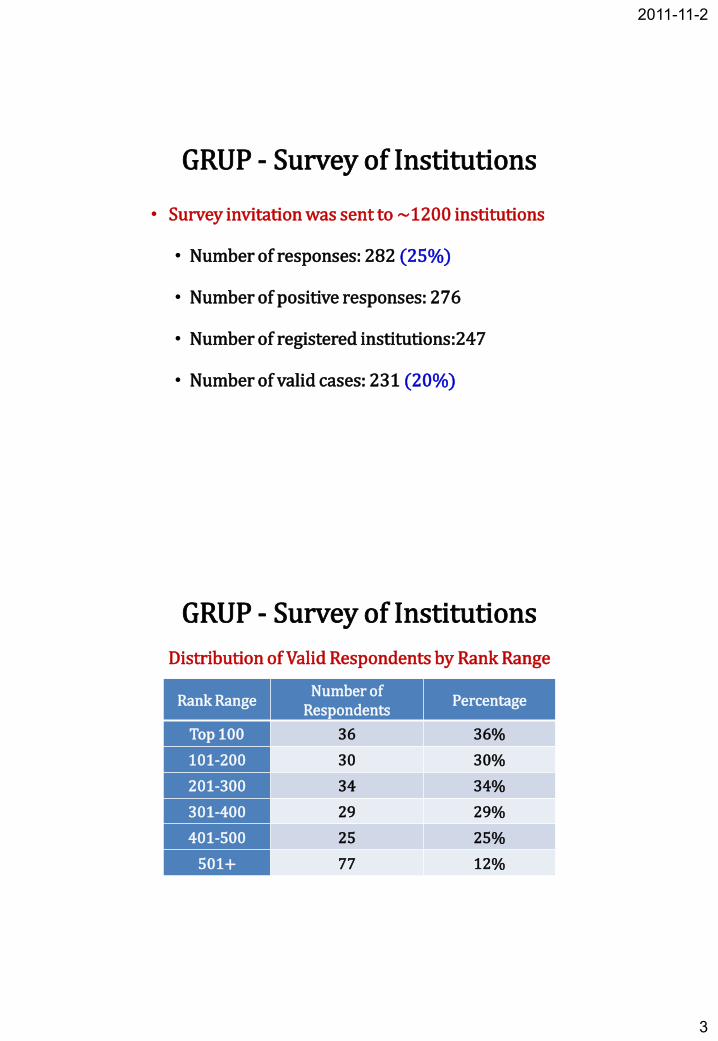
• Survey invitation was sent to ~1200 institutions
• Number of responses: 282 (25%)
• Number of positive responses: 276
• Number of registered institutions:247
• Number of valid cases: 231 (20%)
GRUP - Survey of Institutions
Rank RangeNumber of
RespondentsPercentage
Top 100 36 36%
101-200 30 30%
201-300 34 34%
301-400 29 29%
401-500 25 25%
501+ 77 12%
Distribution of Valid Respondents by Rank Range
GRUP - Survey of Institutions
2011-11-2
4
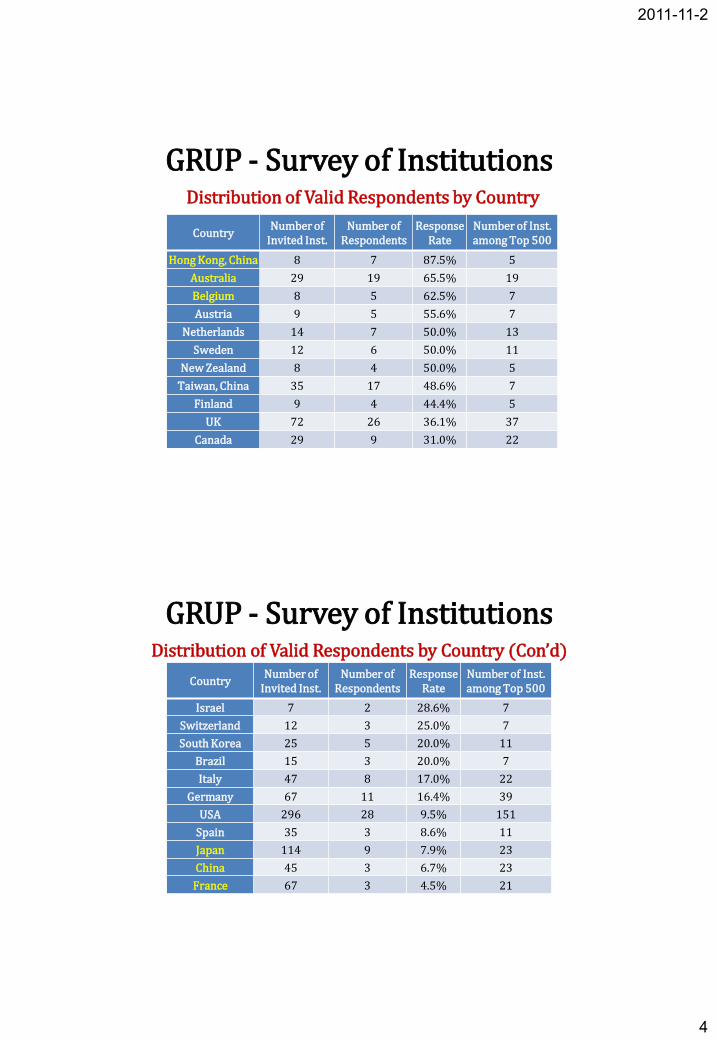
Distribution of Valid Respondents by Country
CountryNumber of
Invited Inst.Number of
RespondentsResponse
RateNumber of Inst. among Top 500
Hong Kong, China 8 7 87.5% 5
Australia 29 19 65.5% 19
Belgium 8 5 62.5% 7
Austria 9 5 55.6% 7
Netherlands 14 7 50.0% 13
Sweden 12 6 50.0% 11
New Zealand 8 4 50.0% 5
Taiwan, China 35 17 48.6% 7
Finland 9 4 44.4% 5
UK 72 26 36.1% 37
Canada 29 9 31.0% 22
GRUP - Survey of Institutions
Distribution of Valid Respondents by Country (Con’d)
CountryNumber of
Invited Inst.Number of
RespondentsResponse
RateNumber of Inst. among Top 500
Israel 7 2 28.6% 7
Switzerland 12 3 25.0% 7
South Korea 25 5 20.0% 11
Brazil 15 3 20.0% 7
Italy 47 8 17.0% 22
Germany 67 11 16.4% 39
USA 296 28 9.5% 151
Spain 35 3 8.6% 11
Japan 114 9 7.9% 23
China 45 3 6.7% 23
France 67 3 4.5% 21
GRUP - Survey of Institutions
2011-11-2
5
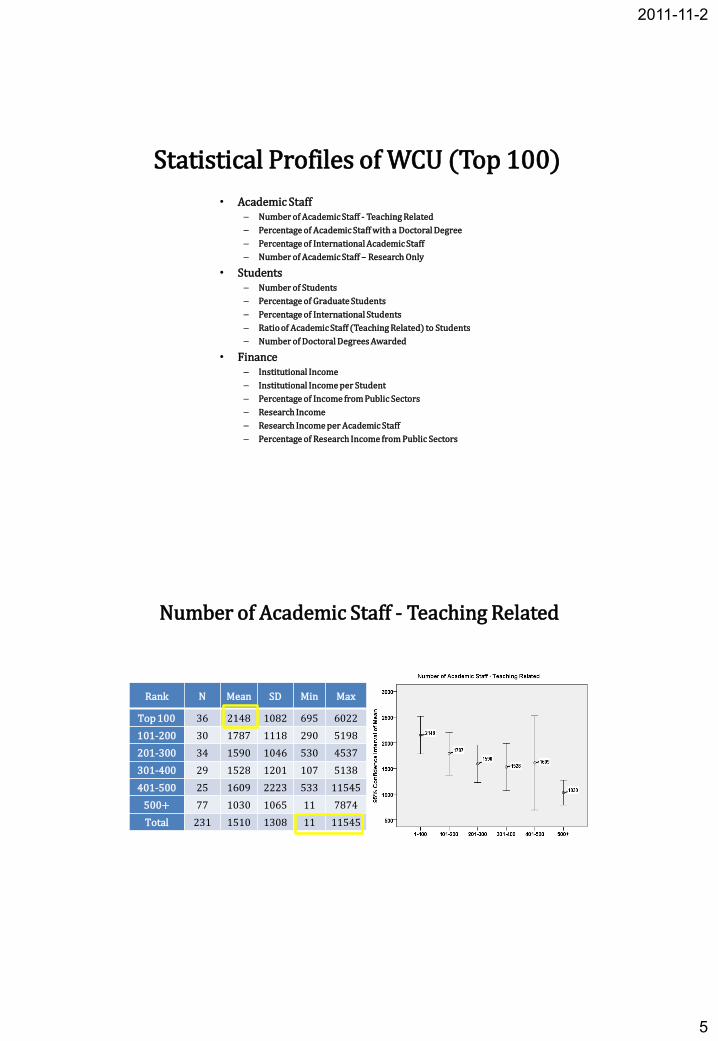
• Academic Staff– Number of Academic Staff - Teaching Related
– Percentage of Academic Staff with a Doctoral Degree
– Percentage of International Academic Staff
– Number of Academic Staff – Research Only
• Students– Number of Students
– Percentage of Graduate Students
– Percentage of International Students
– Ratio of Academic Staff (Teaching Related) to Students
– Number of Doctoral Degrees Awarded
• Finance– Institutional Income
– Institutional Income per Student
– Percentage of Income from Public Sectors
– Research Income
– Research Income per Academic Staff
– Percentage of Research Income from Public Sectors
Statistical Profiles of WCU (Top 100)
Number of Academic Staff - Teaching Related
Rank N Mean SD Min Max
Top 100 36 2148 1082 695 6022
101-200 30 1787 1118 290 5198
201-300 34 1590 1046 530 4537
301-400 29 1528 1201 107 5138
401-500 25 1609 2223 533 11545
500+ 77 1030 1065 11 7874
Total 231 1510 1308 11 11545
2011-11-2
6
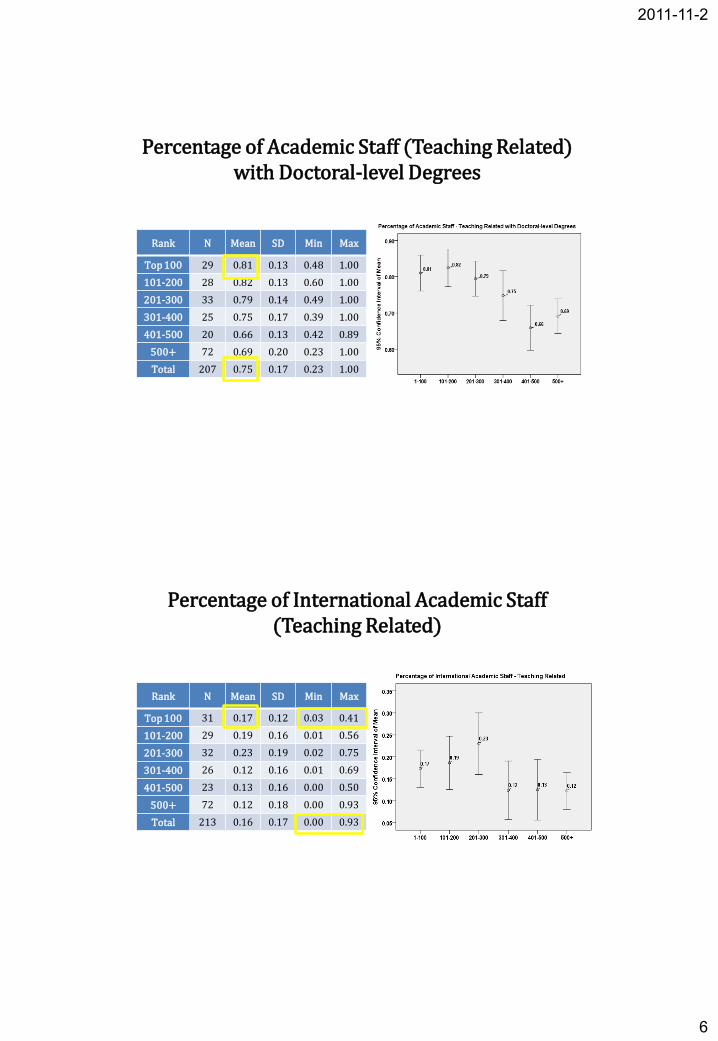
Percentage of Academic Staff (Teaching Related) with Doctoral-level Degrees
Rank N Mean SD Min Max
Top 100 29 0.81 0.13 0.48 1.00
101-200 28 0.82 0.13 0.60 1.00
201-300 33 0.79 0.14 0.49 1.00
301-400 25 0.75 0.17 0.39 1.00
401-500 20 0.66 0.13 0.42 0.89
500+ 72 0.69 0.20 0.23 1.00
Total 207 0.75 0.17 0.23 1.00
Percentage of International Academic Staff (Teaching Related)
Rank N Mean SD Min Max
Top 100 31 0.17 0.12 0.03 0.41
101-200 29 0.19 0.16 0.01 0.56
201-300 32 0.23 0.19 0.02 0.75
301-400 26 0.12 0.16 0.01 0.69
401-500 23 0.13 0.16 0.00 0.50
500+ 72 0.12 0.18 0.00 0.93
Total 213 0.16 0.17 0.00 0.93
2011-11-2
7
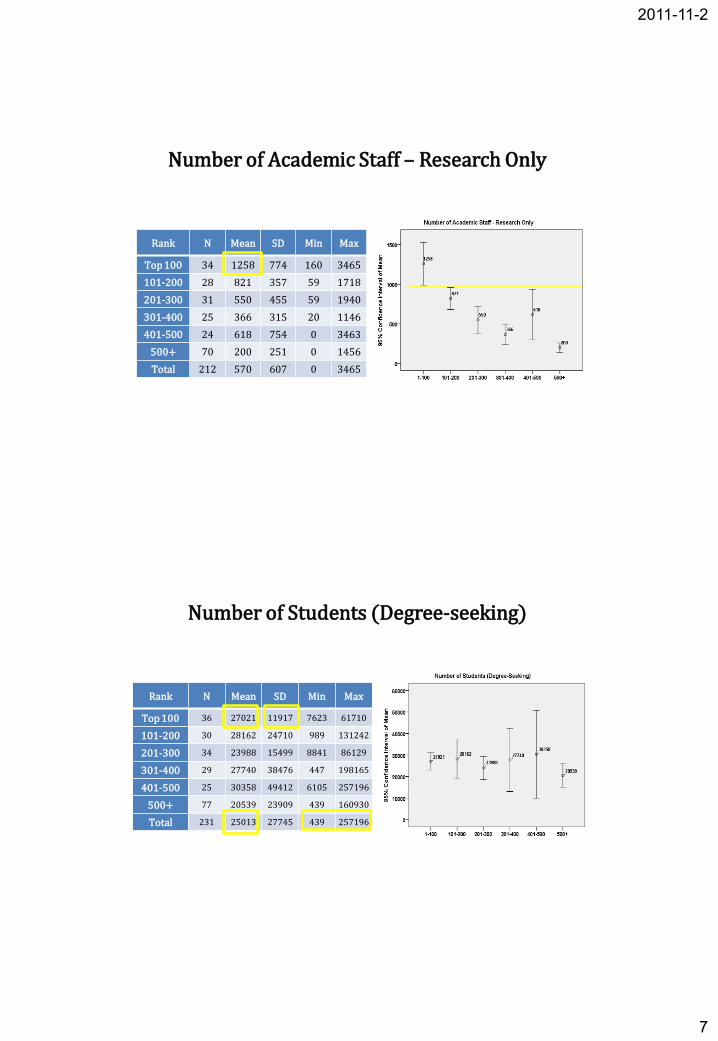
Number of Academic Staff – Research Only
Rank N Mean SD Min Max
Top 100 34 1258 774 160 3465
101-200 28 821 357 59 1718
201-300 31 550 455 59 1940
301-400 25 366 315 20 1146
401-500 24 618 754 0 3463
500+ 70 200 251 0 1456
Total 212 570 607 0 3465
Number of Students (Degree-seeking)
Rank N Mean SD Min Max
Top 100 36 27021 11917 7623 61710
101-200 30 28162 24710 989 131242
201-300 34 23988 15499 8841 86129
301-400 29 27740 38476 447 198165
401-500 25 30358 49412 6105 257196
500+ 77 20539 23909 439 160930
Total 231 25013 27745 439 257196
2011-11-2
8
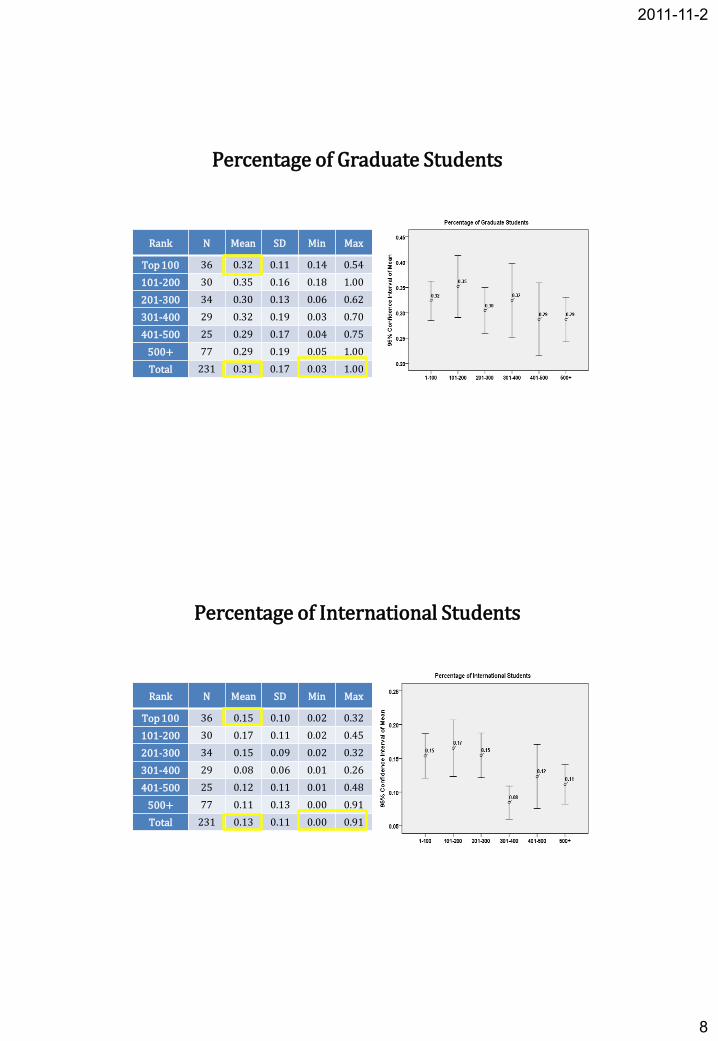
Percentage of Graduate Students
Rank N Mean SD Min Max
Top 100 36 0.32 0.11 0.14 0.54
101-200 30 0.35 0.16 0.18 1.00
201-300 34 0.30 0.13 0.06 0.62
301-400 29 0.32 0.19 0.03 0.70
401-500 25 0.29 0.17 0.04 0.75
500+ 77 0.29 0.19 0.05 1.00
Total 231 0.31 0.17 0.03 1.00
Percentage of International Students
Rank N Mean SD Min Max
Top 100 36 0.15 0.10 0.02 0.32
101-200 30 0.17 0.11 0.02 0.45
201-300 34 0.15 0.09 0.02 0.32
301-400 29 0.08 0.06 0.01 0.26
401-500 25 0.12 0.11 0.01 0.48
500+ 77 0.11 0.13 0.00 0.91
Total 231 0.13 0.11 0.00 0.91
2011-11-2
9
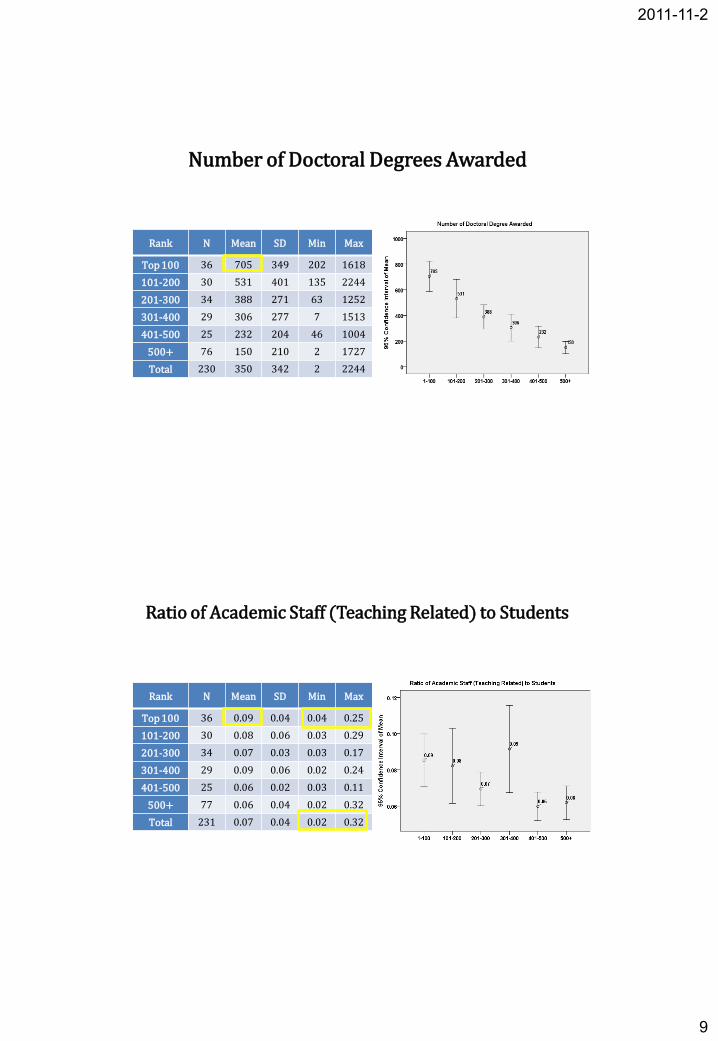
Number of Doctoral Degrees Awarded
Rank N Mean SD Min Max
Top 100 36 705 349 202 1618
101-200 30 531 401 135 2244
201-300 34 388 271 63 1252
301-400 29 306 277 7 1513
401-500 25 232 204 46 1004
500+ 76 150 210 2 1727
Total 230 350 342 2 2244
Ratio of Academic Staff (Teaching Related) to Students
Rank N Mean SD Min Max
Top 100 36 0.09 0.04 0.04 0.25
101-200 30 0.08 0.06 0.03 0.29
201-300 34 0.07 0.03 0.03 0.17
301-400 29 0.09 0.06 0.02 0.24
401-500 25 0.06 0.02 0.03 0.11
500+ 77 0.06 0.04 0.02 0.32
Total 231 0.07 0.04 0.02 0.32
2011-11-2
10
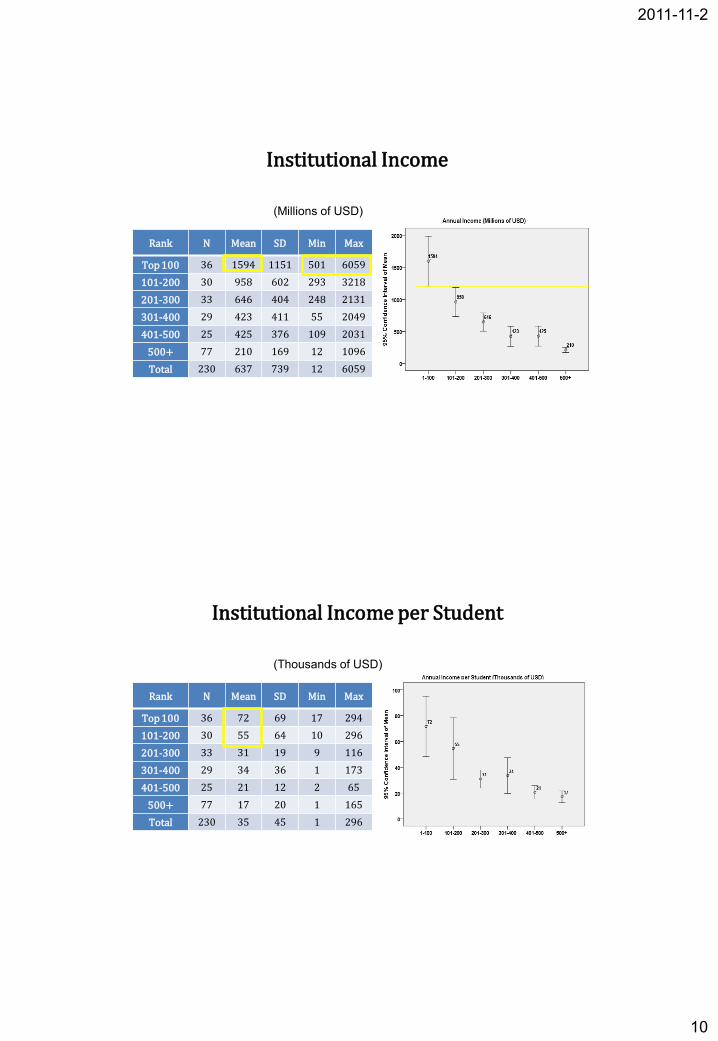
Institutional Income
Rank N Mean SD Min Max
Top 100 36 1594 1151 501 6059
101-200 30 958 602 293 3218
201-300 33 646 404 248 2131
301-400 29 423 411 55 2049
401-500 25 425 376 109 2031
500+ 77 210 169 12 1096
Total 230 637 739 12 6059
(Millions of USD)
Institutional Income per Student
Rank N Mean SD Min Max
Top 100 36 72 69 17 294
101-200 30 55 64 10 296
201-300 33 31 19 9 116
301-400 29 34 36 1 173
401-500 25 21 12 2 65
500+ 77 17 20 1 165
Total 230 35 45 1 296
(Thousands of USD)
2011-11-2
11
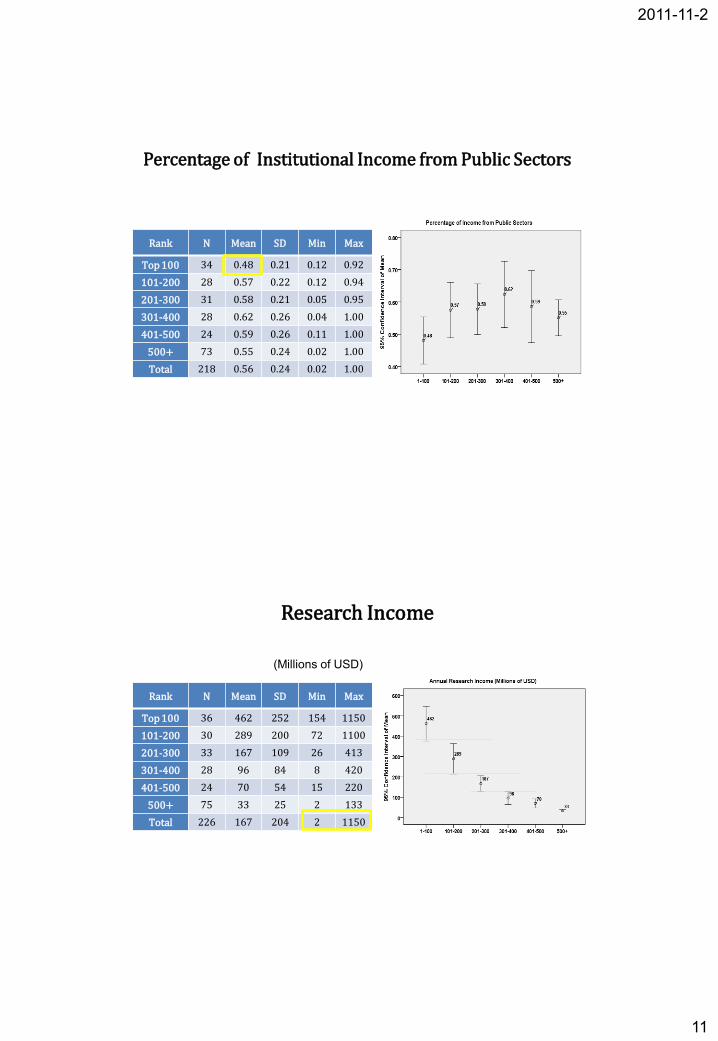
Percentage of Institutional Income from Public Sectors
Rank N Mean SD Min Max
Top 100 34 0.48 0.21 0.12 0.92
101-200 28 0.57 0.22 0.12 0.94
201-300 31 0.58 0.21 0.05 0.95
301-400 28 0.62 0.26 0.04 1.00
401-500 24 0.59 0.26 0.11 1.00
500+ 73 0.55 0.24 0.02 1.00
Total 218 0.56 0.24 0.02 1.00
Research Income
Rank N Mean SD Min Max
Top 100 36 462 252 154 1150
101-200 30 289 200 72 1100
201-300 33 167 109 26 413
301-400 28 96 84 8 420
401-500 24 70 54 15 220
500+ 75 33 25 2 133
Total 226 167 204 2 1150
(Millions of USD)
2011-11-2
12
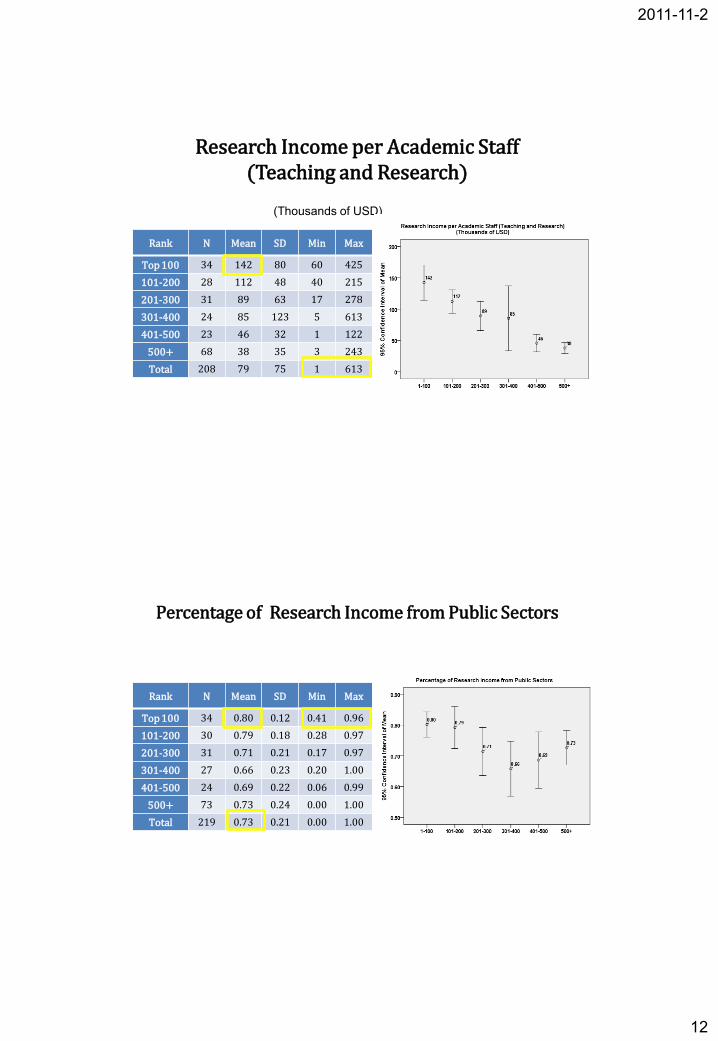
Research Income per Academic Staff (Teaching and Research)
Rank N Mean SD Min Max
Top 100 34 142 80 60 425
101-200 28 112 48 40 215
201-300 31 89 63 17 278
301-400 24 85 123 5 613
401-500 23 46 32 1 122
500+ 68 38 35 3 243
Total 208 79 75 1 613
(Thousands of USD)
Percentage of Research Income from Public Sectors
Rank N Mean SD Min Max
Top 100 34 0.80 0.12 0.41 0.96
101-200 30 0.79 0.18 0.28 0.97
201-300 31 0.71 0.21 0.17 0.97
301-400 27 0.66 0.23 0.20 1.00
401-500 24 0.69 0.22 0.06 0.99
500+ 73 0.73 0.24 0.00 1.00
Total 219 0.73 0.21 0.00 1.00
2011-11-2
13
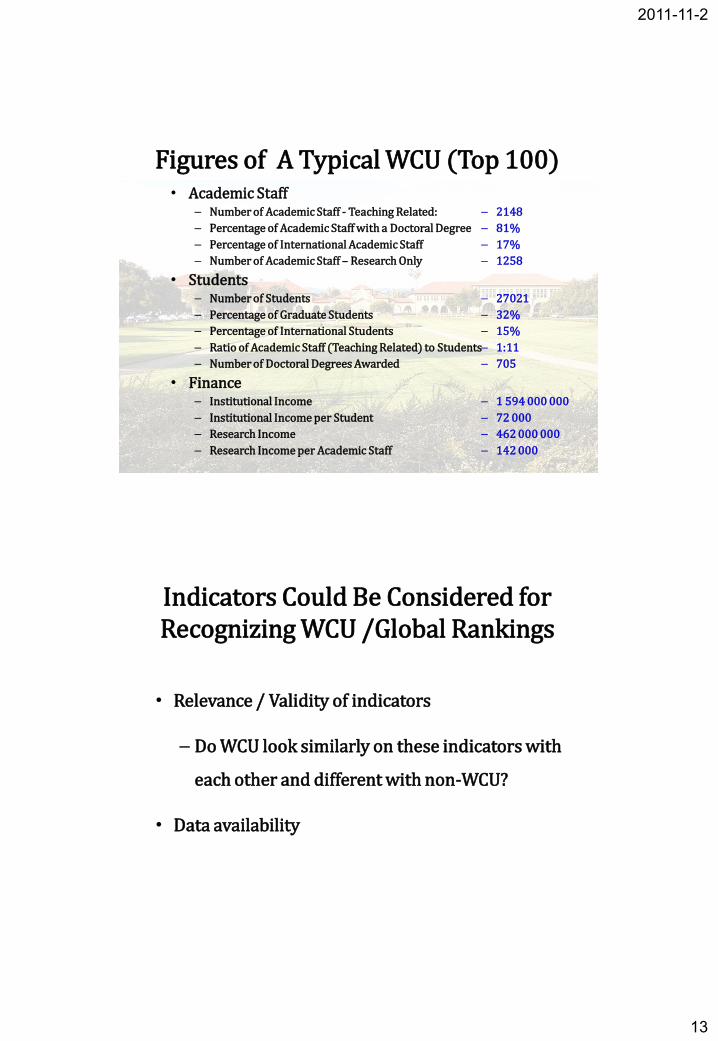
• Academic Staff– Number of Academic Staff - Teaching Related:
– Percentage of Academic Staff with a Doctoral Degree
– Percentage of International Academic Staff
– Number of Academic Staff – Research Only
• Students– Number of Students
– Percentage of Graduate Students
– Percentage of International Students
– Ratio of Academic Staff (Teaching Related) to Students
– Number of Doctoral Degrees Awarded
• Finance– Institutional Income
– Institutional Income per Student
– Research Income
– Research Income per Academic Staff
Figures of A Typical WCU (Top 100)
– 2148
– 81%
– 17%
– 1258
– 27021
– 32%
– 15%
– 1:11
– 705
– 1 594 000 000
– 72 000
– 462 000 000
– 142 000
• Relevance / Validity of indicators
– Do WCU look similarly on these indicators with
each other and different with non-WCU?
• Data availability
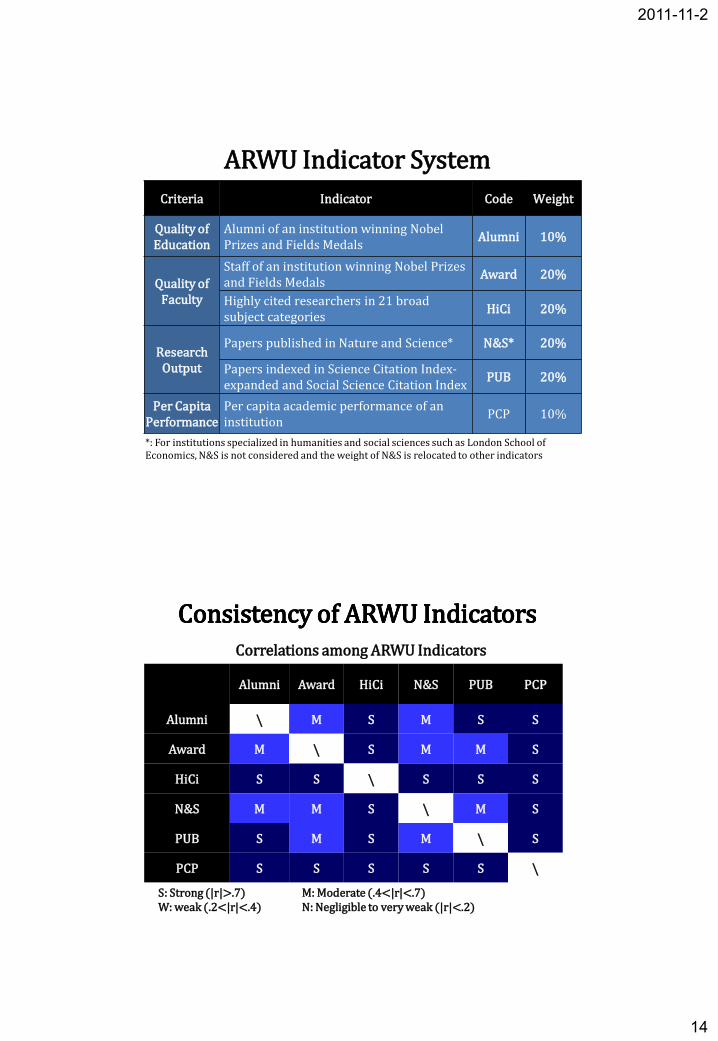
Indicators Could Be Considered for Recognizing WCU /Global Rankings
2011-11-2
14
Criteria Indicator Code Weight
Quality of Education
Alumni of an institution winning Nobel Prizes and Fields Medals
Alumni 10%
Quality of Faculty
Staff of an institution winning Nobel Prizes and Fields Medals
Award 20%
Highly cited researchers in 21 broad subject categories
HiCi 20%
Research Output
Papers published in Nature and Science* N&S* 20%
Papers indexed in Science Citation Index-expanded and Social Science Citation Index
PUB 20%
Per CapitaPerformance
Per capita academic performance of an institution
PCP 10%
*: For institutions specialized in humanities and social sciences such as London School of Economics, N&S is not considered and the weight of N&S is relocated to other indicators
ARWU Indicator System
Consistency of ARWU IndicatorsConsistency of ARWU Indicators
S: Strong (|r|>.7) M: Moderate (.4<|r|<.7)W: weak (.2<|r|<.4) N: Negligible to very weak (|r|<.2)
Alumni Award HiCi N&S PUB PCP
Alumni \ M S M S S
Award M \ S M M S
HiCi S S \ S S S
N&S M M S \ M S
PUB S M S M \ S
PCP S S S S S \
Correlations among ARWU Indicators
2011-11-2
15
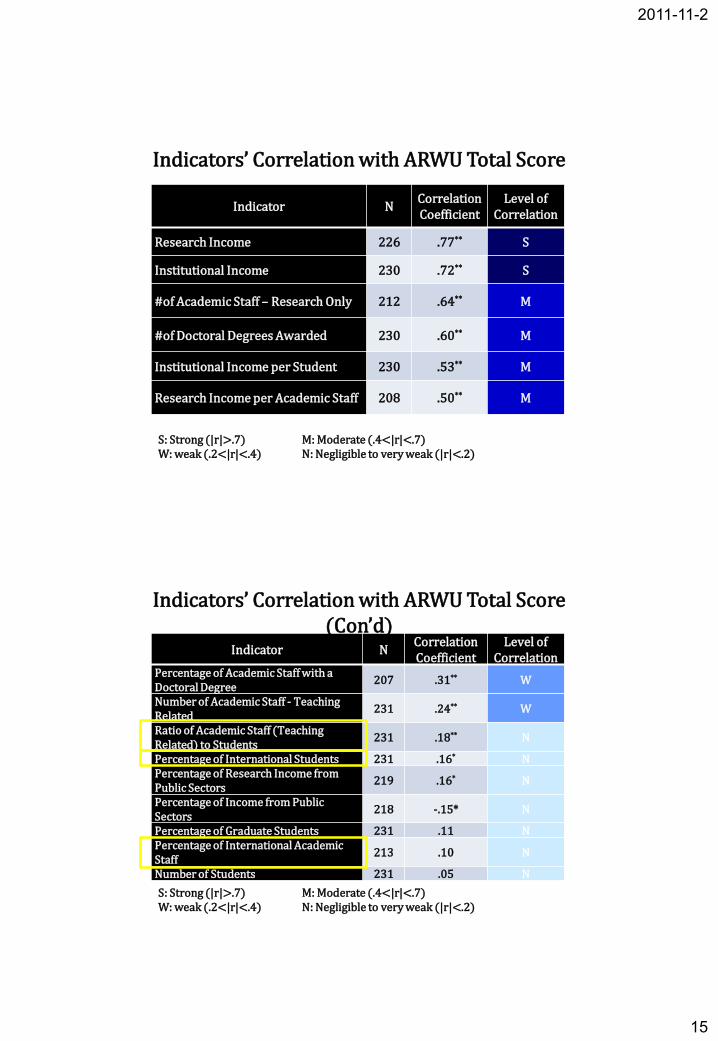
Indicator NCorrelation Coefficient
Level of Correlation
Research Income 226 .77** S
Institutional Income 230 .72** S
#of Academic Staff – Research Only 212 .64** M
#of Doctoral Degrees Awarded 230 .60** M
Institutional Income per Student 230 .53** M
Research Income per Academic Staff 208 .50** M
S: Strong (|r|>.7) M: Moderate (.4<|r|<.7)W: weak (.2<|r|<.4) N: Negligible to very weak (|r|<.2)
Indicators’ Correlation with ARWU Total Score
Indicator NCorrelation Coefficient
Level of Correlation
Percentage of Academic Staff with a Doctoral Degree
207 .31** W
Number of Academic Staff - Teaching Related
231 .24** W
Ratio of Academic Staff (Teaching Related) to Students
231 .18** N
Percentage of International Students 231 .16* NPercentage of Research Income from Public Sectors
219 .16* N
Percentage of Income from Public Sectors
218 -.15* N
Percentage of Graduate Students 231 .11 NPercentage of International Academic Staff
213 .10 N
Number of Students 231 .05 N
S: Strong (|r|>.7) M: Moderate (.4<|r|<.7)W: weak (.2<|r|<.4) N: Negligible to very weak (|r|<.2)
Indicators’ Correlation with ARWU Total Score (Con’d)
2011-11-2
16
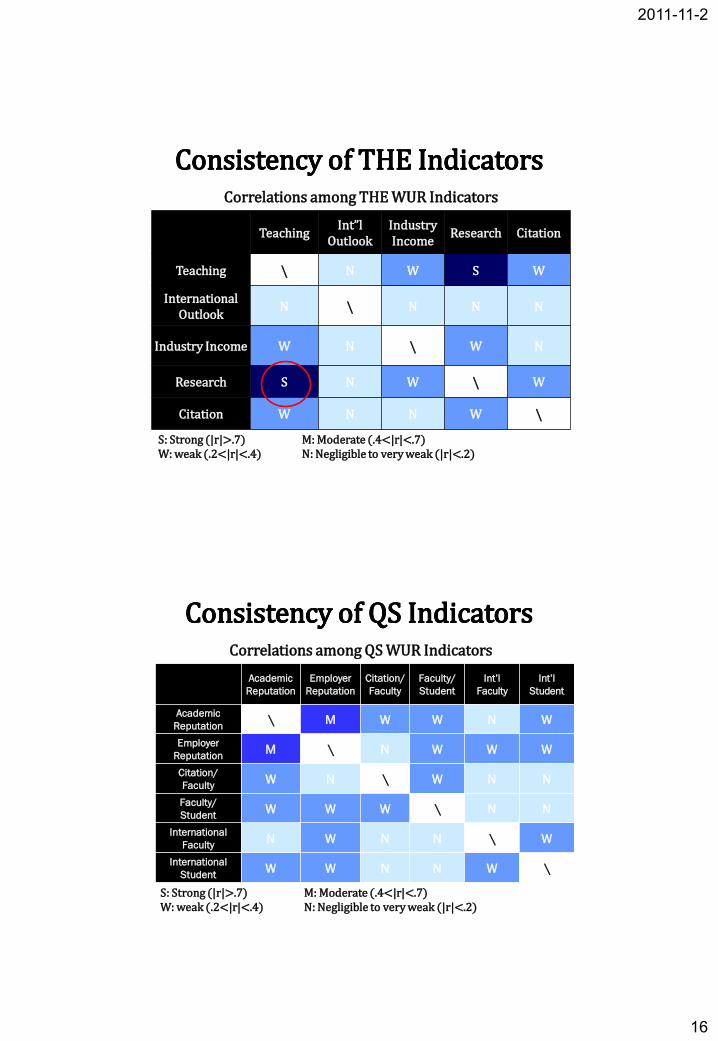
S: Strong (|r|>.7) M: Moderate (.4<|r|<.7)W: weak (.2<|r|<.4) N: Negligible to very weak (|r|<.2)
TeachingInt”l
OutlookIndustry Income
Research Citation
Teaching \ N W S W
International Outlook
N \ N N N
Industry Income W N \ W N
Research S N W \ W
Citation W N N W \
Correlations among THE WUR Indicators
Consistency of Consistency of THE THE IndicatorsIndicators
S: Strong (|r|>.7) M: Moderate (.4<|r|<.7)W: weak (.2<|r|<.4) N: Negligible to very weak (|r|<.2)
Correlations among QS WUR Indicators
Academic
Reputation
Employer
Reputation
Citation/
Faculty
Faculty/
Student
Int’l
Faculty
Int’l
Student
Academic
Reputation\ M W W N W
Employer
ReputationM \ N W W W
Citation/
FacultyW N \ W N N
Faculty/
Student W W W \ N N
International
FacultyN W N N \ W
International
StudentW W N N W \
Consistency of Consistency of QS QS IndicatorsIndicators
2011-11-2
17
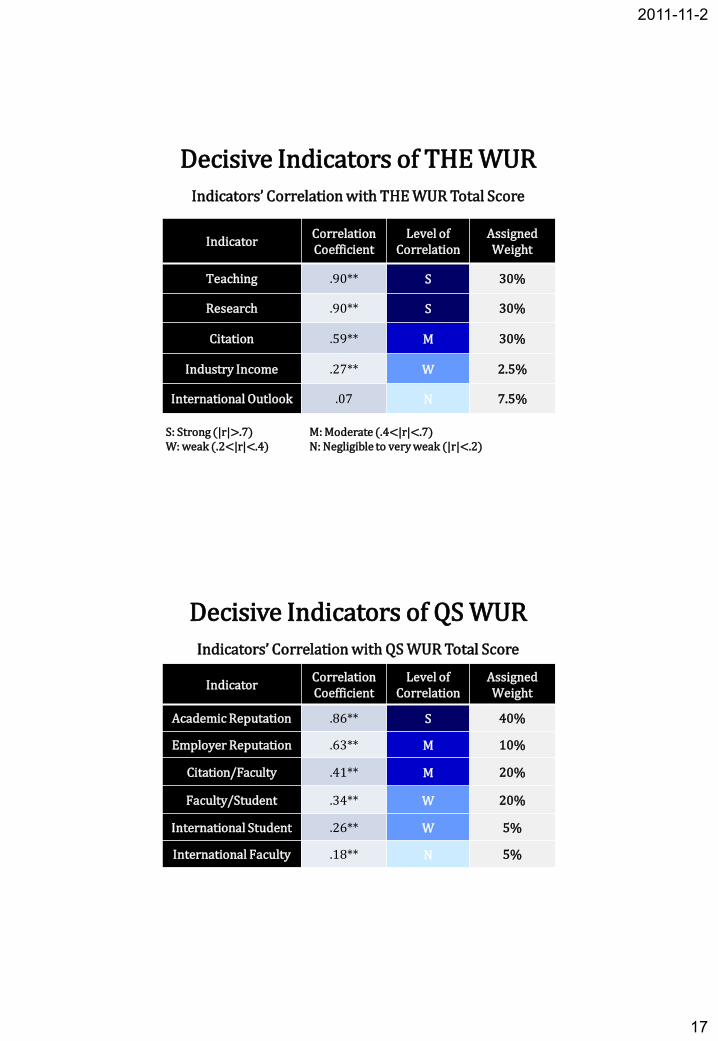
IndicatorCorrelation Coefficient
Level of Correlation
Assigned Weight
Teaching .90** S 30%
Research .90** S 30%
Citation .59** M 30%
Industry Income .27** W 2.5%
International Outlook .07 N 7.5%
S: Strong (|r|>.7) M: Moderate (.4<|r|<.7)W: weak (.2<|r|<.4) N: Negligible to very weak (|r|<.2)
Decisive Indicators of THE WUR
Indicators’ Correlation with THE WUR Total Score
IndicatorCorrelation Coefficient
Level of Correlation
Assigned Weight
Academic Reputation .86** S 40%
Employer Reputation .63** M 10%
Citation/Faculty .41** M 20%
Faculty/Student .34** W 20%
International Student .26** W 5%
International Faculty .18** N 5%
Decisive Indicators of QS WUR
Indicators’ Correlation with QS WUR Total Score
2011-11-2
18
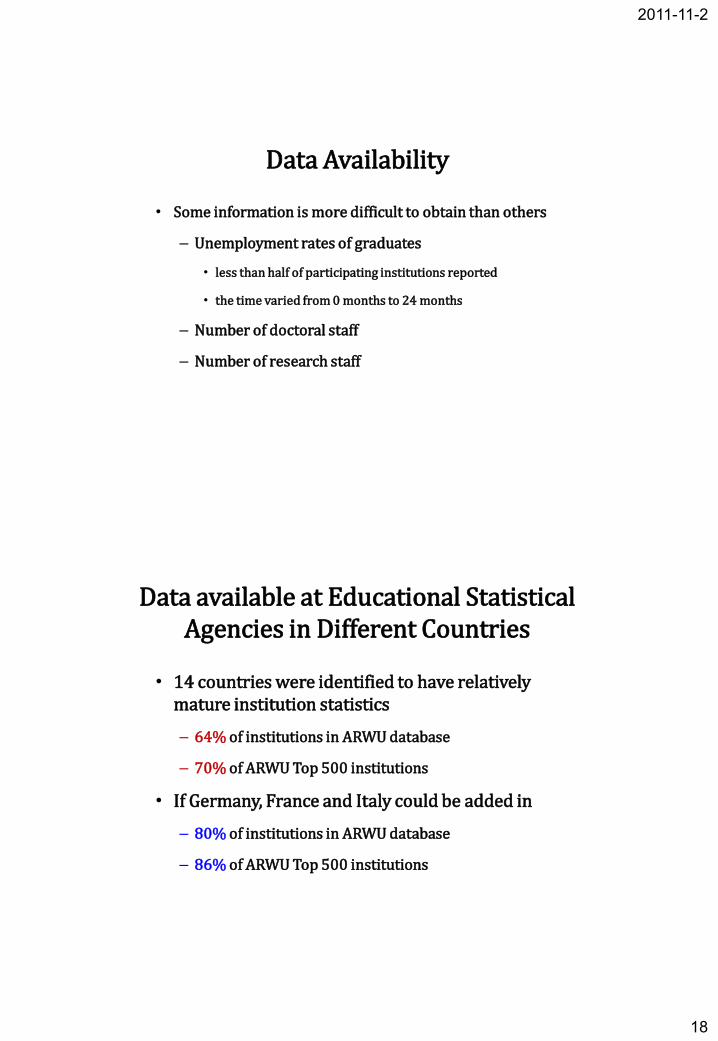
• Some information is more difficult to obtain than others
– Unemployment rates of graduates
• less than half of participating institutions reported
• the time varied from 0 months to 24 months
– Number of doctoral staff
– Number of research staff
Data Availability
• 14 countries were identified to have relatively mature institution statistics
– 64% of institutions in ARWU database
– 70% of ARWU Top 500 institutions
• If Germany, France and Italy could be added in
– 80% of institutions in ARWU database
– 86% of ARWU Top 500 institutions
Data available at Educational Statistical Agencies in Different Countries
2011-11-2
19
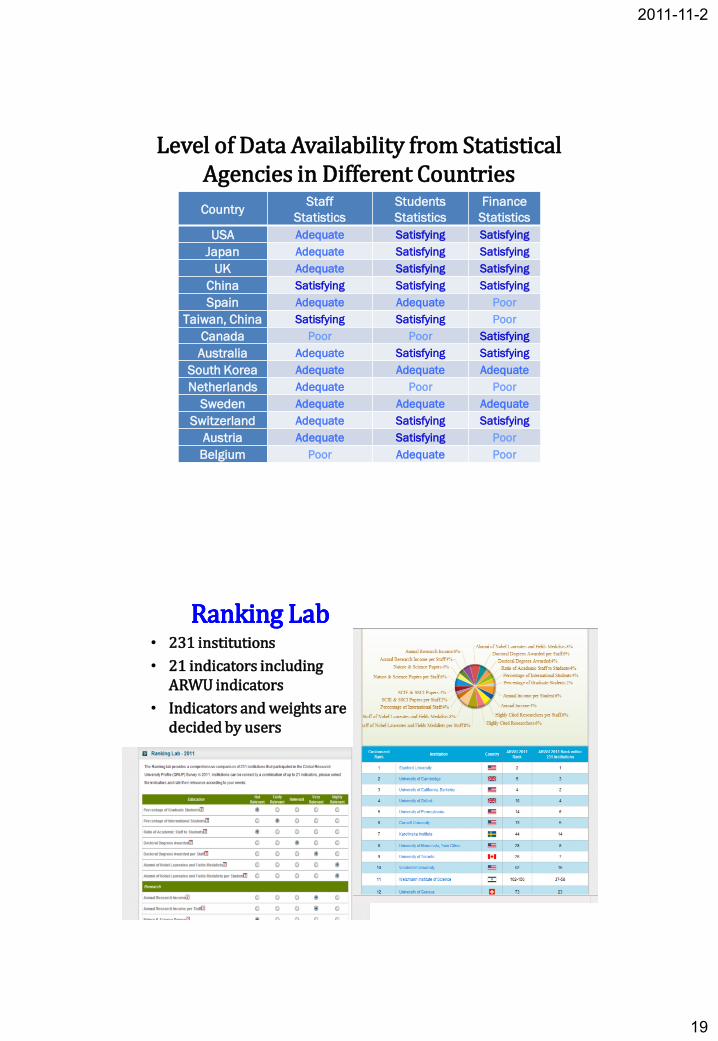
CountryStaff
Statistics
Students
Statistics
Finance
Statistics
USA Adequate Satisfying Satisfying
Japan Adequate Satisfying Satisfying
UK Adequate Satisfying Satisfying
China Satisfying Satisfying Satisfying
Spain Adequate Adequate Poor
Taiwan, China Satisfying Satisfying Poor
Canada Poor Poor Satisfying
Australia Adequate Satisfying Satisfying
South Korea Adequate Adequate Adequate
Netherlands Adequate Poor Poor
Sweden Adequate Adequate Adequate
Switzerland Adequate Satisfying Satisfying
Austria Adequate Satisfying Poor
Belgium Poor Adequate Poor
Level of Data Availability from Statistical Agencies in Different Countries
Ranking LabRanking Lab• 231 institutions
• 21 indicators including ARWU indicators
• Indicators and weights are decided by users
2011-11-2
20
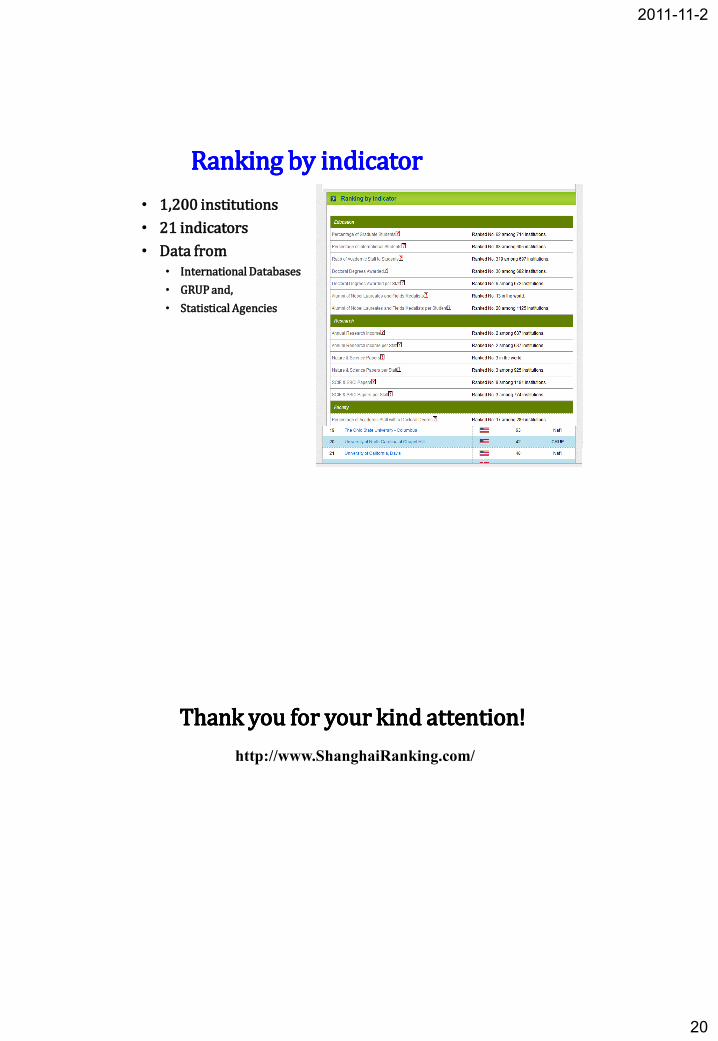
Ranking by indicatorRanking by indicator
• 1,200 institutions
• 21 indicators
• Data from• International Databases
• GRUP and,
• Statistical Agencies
http://www.ShanghaiRanking.com/
Thank you for your kind attention!Thank you for your kind attention!