Embed Size (px)
Citation preview
ARC 360 Report •• Dec. 2014
THE STATE OF THE U.S. MEDIA & ENTERTAINMENT APPS ECONOMYAnalyzing the state of Android and iOS app quality in the media & entertainment industry.
By Ben Gray
Executive Summary:
ow do your customers in the U.S. rate the quality of your Android
and iOS media & entertainment apps? This report answers that
question and provides IT, product and marketing leaders with a
benchmark of the quality of mobile apps across 67 of the most popular
media & entertainment brands, including Flipboard, Instagram, Netflix,
Pandora, Snapchat, Spotify and YouTube, and 5 industries, including
Media & Entertainment, Music & Audio and Photography. Read on to
discover the highest and lowest rated media & entertainment brands
and industries. IT, product and marketing leaders should use this report
to understand how customers rate your mobile app quality, assess your
competitive landscape and set goals for optimizing your app quality
management practices in 2015 as you proceed along the path to a
winning media & entertainment app, as defined by your customers.
1
The State Of The U.S. Media Apps Economy
Until last month, no one had attempted to document the state of app
quality across the modern apps economy. Until then, no one had the
tools to measure customer sentiment as channeled through app store
ratings and reviews. Until then, brands were flying blind on what
customers love and hate about your mobile apps and lacked an open
benchmark with which to compare your app quality against your
competitors’.
Introducing ARC 360’s Media Report
Applause, the 360º app quality company, has commissioned this ARC 360
report on the state of the U.S. media & entertainment apps economy
to help the world’s most popular media & entertainment brands in
the U.S.—and those that compete against them—to understand how
customers perceive your app quality and to rapidly improve the
experience for your mobile users. Last month, we launched Retail and
Travel editions, with plans to release updates and additional industry
editions in subsequent months.
Research Methodology
To build the media & entertainment app quality index, ARC 360:
■ Started with the list of 48,640 media & entertainment apps housed with-in the two most popular U.S. app stores—Google Play and Apple App Store. Google Play media & entertainment categories include Books & Reference,
2
Comics, Entertainment, Media & Video, Music & Audio, News & Magazines and Photography while Apple App Store media & entertainment categories include Books, Entertainment, Music, News, Photo & Video and Reference.
■ Consolidated similar app store categories, which resulted in Books & Ref-erence (includes Books & Reference, Comics, Books and Reference), Media & Entertainment (includes Entertainment (both Google Play and Apple App Store) and Media & Video), Music & Audio (includes Music & Audio and Mu-sic), News & Magazines (includes News & Magazines, News and Newsstand) and Photography (includes Photography and Photo & Video).
■ Sorted the apps by number of user reviews and determined a minimum number for inclusion that varied by category. In ascending order the mini-mum number of user reviews is: 15K (News & Entertainment), 19K (Books & Magazines), 30K (Photography), 40K (Music & Audio) and 50K (Media & Entertainment).
■ Analyzed the quality of the apps using Applause Analytics, a mobile app analytics tool that crawls every rating and review from the top apps stores, including Google Play and Apple App Store. Applause Analytics reports a mobile app quality score, as defined by customers, on a scale of 0 to 100.
The Media Apps Economy Spans 5 Categories
Sixty-seven media & entertainment apps
qualified for the inaugural Applause media
& entertainment app quality index. The
distribution of average app quality scores
varied across 5 media & entertainment
categories, with Books & Reference
averaging the highest score (72) and Media
& Entertainment rounding out the list with
a 58 average. Here’s how customers rated the 5 media & entertainment
categories within today’s modern apps economy (see Figure 1):3
APP TRENDS:
Did you know that across
more than 200 million
apps in the U.S. app
stores, the average app
quality score is 66.5? In
other words, a “D” - a
passing grade but nothing
to write home about.
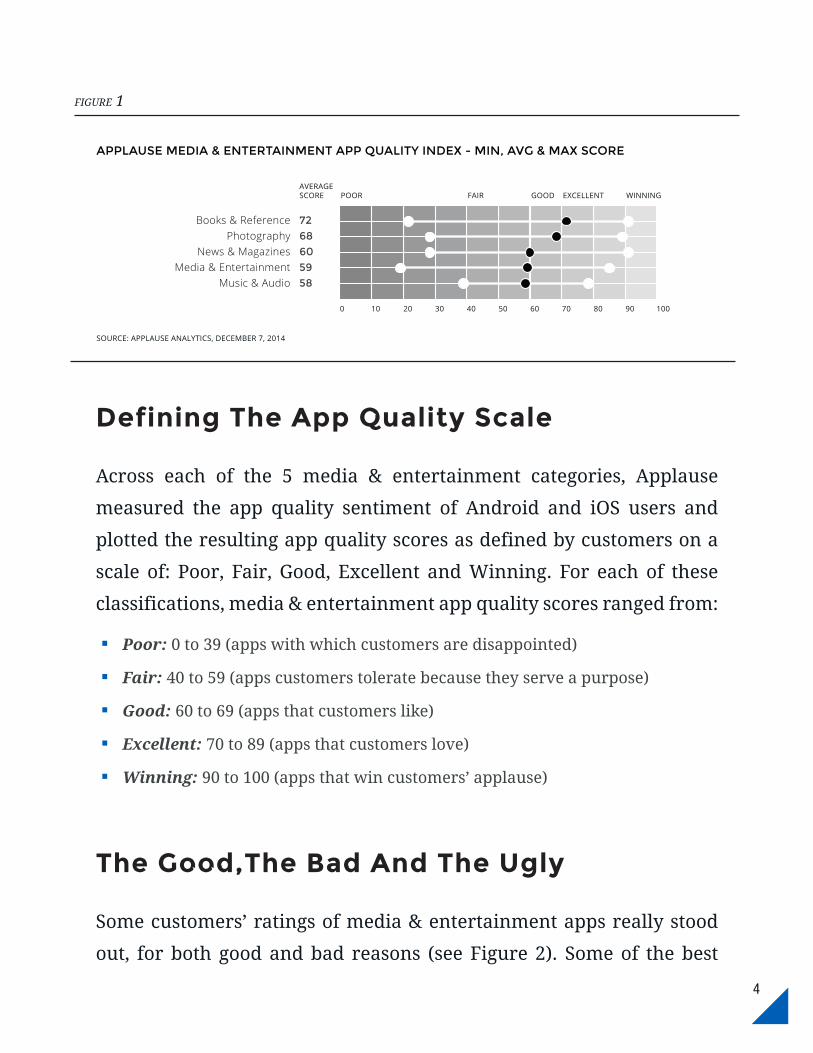
Defining The App Quality Scale
Across each of the 5 media & entertainment categories, Applause
measured the app quality sentiment of Android and iOS users and
plotted the resulting app quality scores as defined by customers on a
scale of: Poor, Fair, Good, Excellent and Winning. For each of these
classifications, media & entertainment app quality scores ranged from:
■ Poor: 0 to 39 (apps with which customers are disappointed)
■ Fair: 40 to 59 (apps customers tolerate because they serve a purpose)
■ Good: 60 to 69 (apps that customers like)
■ Excellent: 70 to 89 (apps that customers love)
■ Winning: 90 to 100 (apps that win customers’ applause)
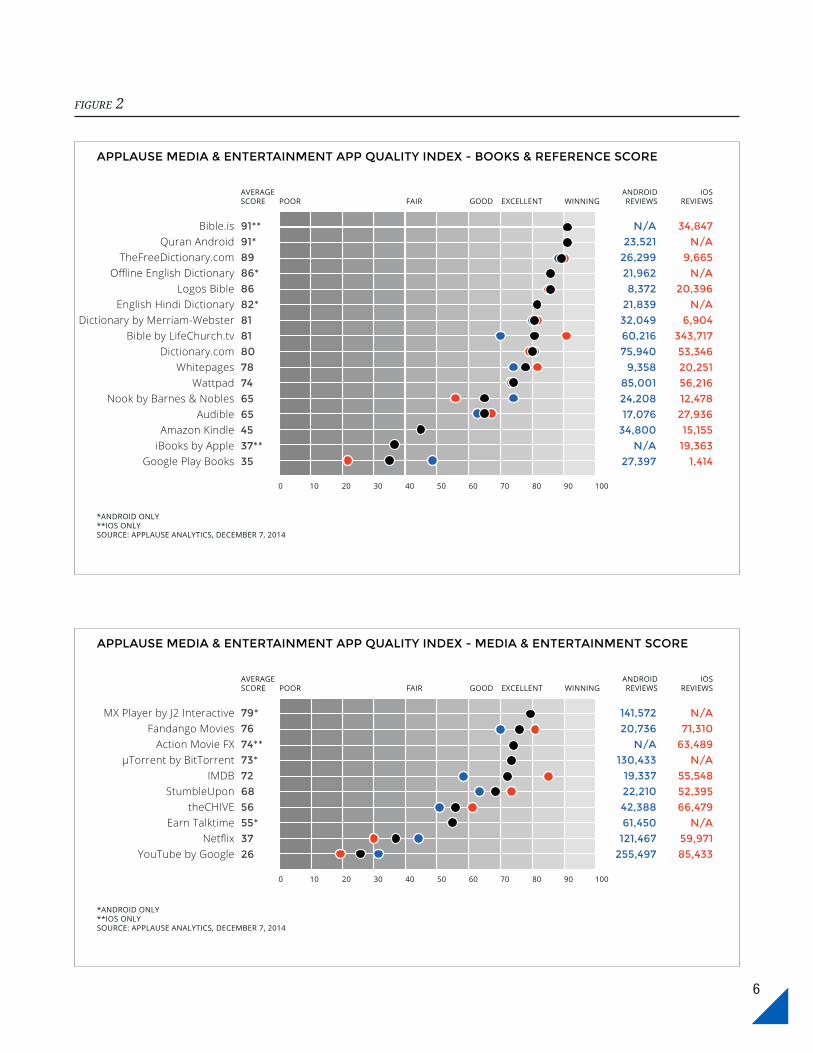
The Good,The Bad And The Ugly
Some customers’ ratings of media & entertainment apps really stood
out, for both good and bad reasons (see Figure 2). Some of the best
4
figure 1
SOURCE: APPLAUSE ANALYTICS, DECEMBER 7, 2014
Books & ReferencePhotography
News & MagazinesMedia & Entertainment
Music & Audio
7268605958
POOR FAIR GOOD EXCELLENT WINNING
100908070605040300 10 20
APPLAUSE MEDIA & ENTERTAINMENT APP QUALITY INDEX - MIN, AVG & MAX SCORE
AVERAGESCORE
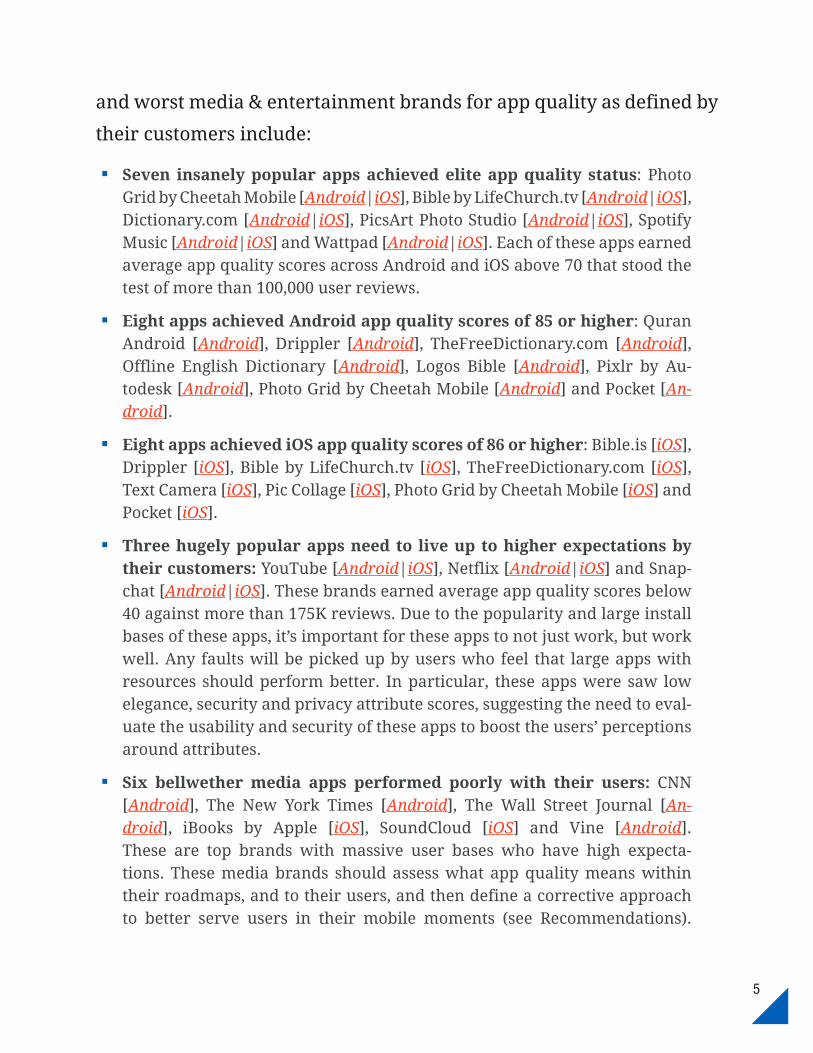
and worst media & entertainment brands for app quality as defined by
their customers include:
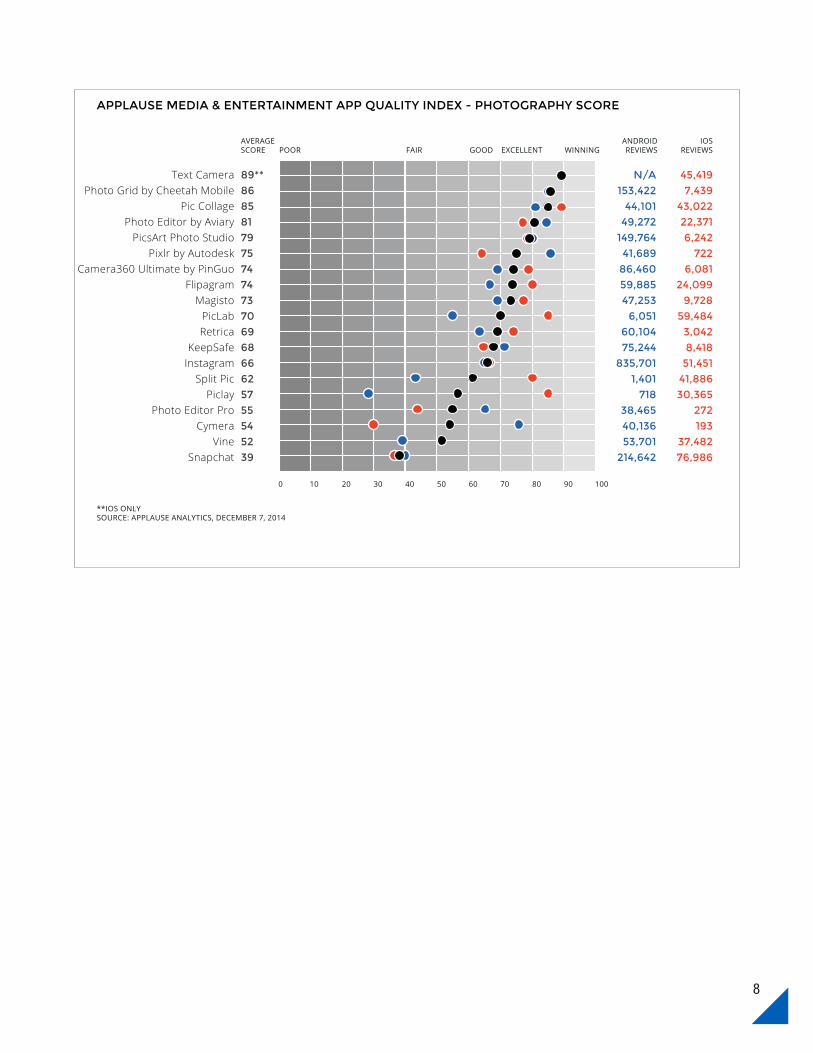
■ Seven insanely popular apps achieved elite app quality status: Photo Grid by Cheetah Mobile [Android|iOS], Bible by LifeChurch.tv [Android|iOS], Dictionary.com [Android|iOS], PicsArt Photo Studio [Android|iOS], Spotify Music [Android|iOS] and Wattpad [Android|iOS]. Each of these apps earned average app quality scores across Android and iOS above 70 that stood the test of more than 100,000 user reviews.
■ Eight apps achieved Android app quality scores of 85 or higher: Quran Android [Android], Drippler [Android], TheFreeDictionary.com [Android], Offline English Dictionary [Android], Logos Bible [Android], Pixlr by Au-todesk [Android], Photo Grid by Cheetah Mobile [Android] and Pocket [An-droid].
■ Eight apps achieved iOS app quality scores of 86 or higher: Bible.is [iOS], Drippler [iOS], Bible by LifeChurch.tv [iOS], TheFreeDictionary.com [iOS], Text Camera [iOS], Pic Collage [iOS], Photo Grid by Cheetah Mobile [iOS] and Pocket [iOS].
■ Three hugely popular apps need to live up to higher expectations by their customers: YouTube [Android|iOS], Netflix [Android|iOS] and Snap-chat [Android|iOS]. These brands earned average app quality scores below 40 against more than 175K reviews. Due to the popularity and large install bases of these apps, it’s important for these apps to not just work, but work well. Any faults will be picked up by users who feel that large apps with resources should perform better. In particular, these apps were saw low elegance, security and privacy attribute scores, suggesting the need to eval-uate the usability and security of these apps to boost the users’ perceptions around attributes.
■ Six bellwether media apps performed poorly with their users: CNN [Android], The New York Times [Android], The Wall Street Journal [An-droid], iBooks by Apple [iOS], SoundCloud [iOS] and Vine [Android].These are top brands with massive user bases who have high expecta-tions. These media brands should assess what app quality means within their roadmaps, and to their users, and then define a corrective approach to better serve users in their mobile moments (see Recommendations).
5
6
MX Player by J2 InteractiveFandango Movies
Action Movie FXµTorrent by BitTorrent
IMDBStumbleUpon
theCHIVEEarn Talktime
NetflixYouTube by Google
141,57220,736
N/A130,433
19,33722,21042,38861,450
121,467255,497
N/A71,310
63,489N/A
55,54852,39566,479
N/A59,97185,433
79*7674**73*72685655*3726
POOR FAIR GOOD EXCELLENT WINNING
100908070605040300 10 20
APPLAUSE MEDIA & ENTERTAINMENT APP QUALITY INDEX - MEDIA & ENTERTAINMENT SCORE
AVERAGESCORE
*ANDROID ONLY**IOS ONLYSOURCE: APPLAUSE ANALYTICS, DECEMBER 7, 2014
ANDROIDREVIEWS
IOSREVIEWS
figure 2
Bible.isQuran Android
TheFreeDictionary.comOffline English Dictionary
Logos BibleEnglish Hindi Dictionary
Dictionary by Merriam-WebsterBible by LifeChurch.tv
Dictionary.comWhitepages
WattpadNook by Barnes & Nobles
AudibleAmazon Kindle
iBooks by AppleGoogle Play Books
N/A23,521
26,29921,9628,372
21,83932,04960,21675,940
9,35885,00124,20817,076
34,800N/A
27,397
34,847N/A
9,665N/A
20,396N/A
6,904343,71753,34620,25156,21612,47827,93615,155
19,3631,414
91**91*8986*8682*818180787465654537**35
POOR FAIR GOOD EXCELLENT WINNING
100908070605040300 10 20
APPLAUSE MEDIA & ENTERTAINMENT APP QUALITY INDEX - BOOKS & REFERENCE SCORE
AVERAGESCORE
*ANDROID ONLY**IOS ONLYSOURCE: APPLAUSE ANALYTICS, DECEMBER 7, 2014
ANDROIDREVIEWS
IOSREVIEWS
7
DripplerPocket
reddit is funFlipboard
FeedlyNewsHunt
LinkedIn PulseFox News
The Times of IndiaAP Mobile
ZinioThe New York Times
The Wall Street JournalCNN
Google Play Newsstand
33,70921,80231,98364,29329,13943,19311,09316,42943,164
7,8317,8837,3866,121
20,94816,402
1,1019,765
N/A33,72715,791
11220,210
19,1121,383
16,36417,92356,19315,185
56,575N/A
908683*797464585652524944413935*
POOR FAIR GOOD EXCELLENT WINNING
100908070605040300 10 20
APPLAUSE MEDIA & ENTERTAINMENT APP QUALITY INDEX - NEWS & MAGAZINES SCORE
AVERAGESCORE
*ANDROID ONLYSOURCE: APPLAUSE ANALYTICS, DECEMBER 7, 2014
ANDROIDREVIEWS
IOSREVIEWS
Spotify MusiciHeartRadio
TuneInPandora
Magic Piano by SmuleSoundCloud
Google Play Music
127,74296,29134,207
110,70235,95447,614
92,300
168,53856,55345,546
197,87354,96527,106
1,704
74656456564845
POOR FAIR GOOD EXCELLENT WINNING
100908070605040300 10 20
APPLAUSE MEDIA & ENTERTAINMENT APP QUALITY INDEX - MUSIC & AUDIO SCORE
AVERAGESCORE
SOURCE: APPLAUSE ANALYTICS, DECEMBER 7, 2014
ANDROIDREVIEWS
IOSREVIEWS
8
Text CameraPhoto Grid by Cheetah Mobile
Pic CollagePhoto Editor by Aviary
PicsArt Photo StudioPixlr by Autodesk
Camera360 Ultimate by PinGuoFlipagram
MagistoPicLabRetrica
KeepSafeInstagram
Split PicPiclay
Photo Editor ProCymera
VineSnapchat
N/A153,422
44,10149,272
149,76441,689
86,46059,88547,253
6,05160,10475,244
835,7011,401
71838,46540,13653,701
214,642
45,4197,439
43,02222,3716,242
7226,081
24,0999,728
59,4843,0428,418
51,45141,88630,365
272193
37,48276,986
89**868581797574747370696866625755545239
POOR FAIR GOOD EXCELLENT WINNING
100908070605040300 10 20
APPLAUSE MEDIA & ENTERTAINMENT APP QUALITY INDEX - PHOTOGRAPHY SCORE
AVERAGESCORE
**IOS ONLYSOURCE: APPLAUSE ANALYTICS, DECEMBER 7, 2014
ANDROIDREVIEWS
IOSREVIEWS
Every media & entertainment brand with an application in the Applause
app quality index is proceeding along its own path to a winning mobile
application. But whether they’re able to achieve winning status as rated
by their customers—not to mention retain that status over time—and
at what rate they earn it really depends on where they landed in the
app quality index.
■ MEDIA & ENTERTAINMENT BRANDS WITH APPS RATED AS POOR need to fundamentally refocus their efforts on serving customers in their mobile moments, because if your app doesn’t serve customer needs in their every-day interactions then prepare to sit back and watch as your competitors do. From discovering breaking news, to listening to the top songs, to preserving moments with friends, to researching a book, to binge watching your favor-ite TV series, your apps have to work every time, for everyone, across every device, OS, network and location. Now is the perfect time to rethink your development and testing strategy in the age of the customer.
■ MEDIA & ENTERTAINMENT BRANDS WITH APPS RATED AS FAIR need to expand testing out of the lab and into the real world, where conditions can disrupt the user experience. Too many media & entertainment compa-nies test almost exclusively in an internal test lab or via a traditional out-sourced model, which simply relocates the test lab, and rely too heavily on automation, which offers few answers for real world challenges. But win-ning mobile apps demand additional testing where users naturally interact with your digital experiences.
■ MEDIA & ENTERTAINMENT BRANDS WITH APPS RATED AS GOOD should expand their development and testing efforts from functional to us-ability, localization, load/performance and security. Because today’s user expectations are incredibly lofty, your apps have to do more than work. They have to be intuitive, offer rock solid stability, perform quickly, shine
RECOMMENDATIONSThe Path To Winning Apps, As Defined By Customers
9
under pressure and keep your customer information secure and private. But the number 1 goal of your apps is to delight your users—when and where they want to interact with your brand. Your apps need to drive re-peat usage, deeper engagement and user loyalty for your brand and your business. Because even a free app has implications on your business and your reputation.
■ MEDIA & ENTERTAINMENT BRANDS WITH APPS RATED AS EXCELLENT should engage early with users on new builds as a means of identifying is-sues before your customers do and to narrow future testing efforts on the most urgent issues that are preventing them from achieving winning app quality status. As an example, most of the indexed media & entertainment apps faired poorly on elegance, security, privacy and stability (versus sat-isfaction, content, interoperability, performance or pricing, for example). Many of these brands could immediately benefit from usability, security and automated mobile functional testing to turn their most glaring app quality weaknesses into strengths.
■ MEDIA & ENTERTAINMENT BRANDS WITH APPS RATED AS WINNING must monitor ongoing user feedback to improve over time. Whether users love or hate your apps, they’re going to be incredibly vocal via social chan-nels and app store ratings and reviews—as evidenced by this report. There’s no clearer voice of the customer than the one that’s already shouting at you with app store ratings and reviews from your most passionate fans and crit-ics alike. For any media & entertainment brand that wants to improve its app quality standing through the eyes of its customers—and we hope that’s all of them—it’s important to listen to and act on customer feedback.
10
About ARC 360
ARC 360 from Applause is a research group dedicated to providing
insights and data on the apps economy. ARC 360 leverages data from
a variety of sources, including proprietary Applause data, to provide
a 360º view of app quality. ARC 360 combines this data, with analysis,
into reports to help brands and app developers understand what is
happening in the apps economy.
Learn more at http://arc.applause.com/.
About Applause Analytics
Combing through millions of ratings and user reviews submitted across
millions of apps in the Android and iOS app stores around the world,
Applause Analytics closes the gap between mobile app developers and
their customers, generating actionable insights and quantifiable metrics
based on what users are actually saying about their app experiences.
Learn more at www.applause.com/analytics.
11