Embed Size (px)
Citation preview
The State of the Allied Health Workforce in North Carolina
Erin Fraher, MPP Director, NC HPDS
Phillip Summers, MPHResearch Assistant
Katie Gaul, MAResearch Associate
Stephen RutledgeResearch Assistant
Presentation to the Council for Allied Health in North CarolinaAnnual Presidents MeetingMay 2, 2007

Today’s Presentation: An Overview
Why study allied health workforce shortages?
Challenges in estimating the supply of, and demand for, allied health professionals
The allied health vacancy tracking project Moving forward—challenges and
opportunities Your questions and input

Why study allied health workforce issues?

Manufacturing and Health Care & Social Assistance Employment, NC, 1995-2005
0
100
200
300
400
500
600
700
800
900
Em
plo
ymen
t (t
hous
ands
)
568,835
822, 995
491,637
332,446
1995 1996 1997 1998 1999 2000 2001 2002 2003 2004 2005
Year
Manufacturing
Health Care & Social Assistance
Source: North Carolina Employment Security Commission, 2006.
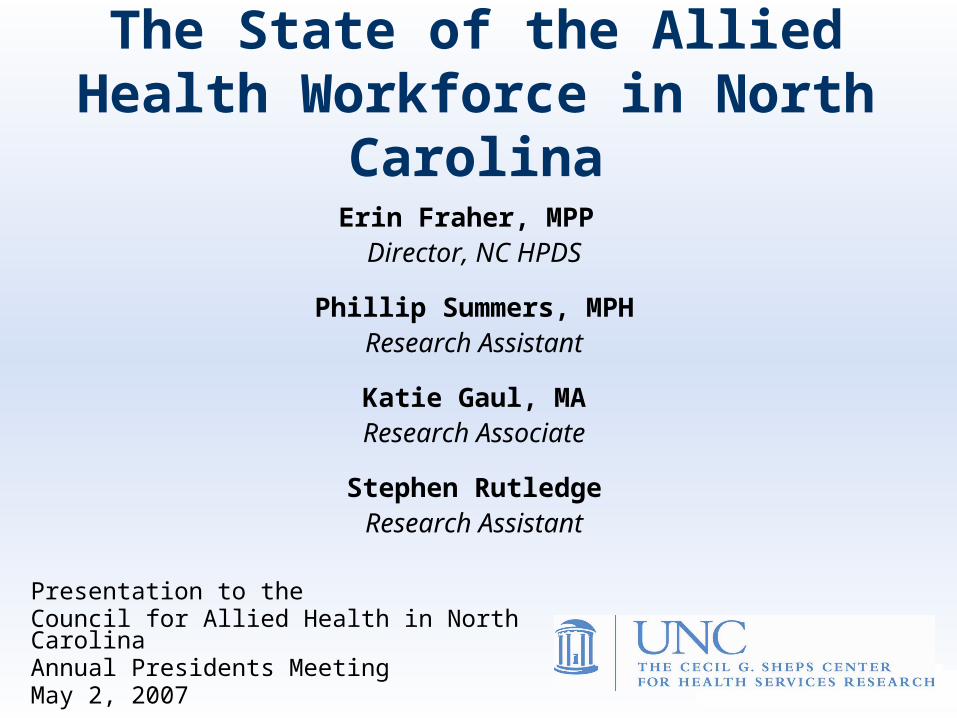
Health Care Jobs in North Carolina, 2005Other, 3%
Physicians, 5%
LPNs, 5%
RNs, 24%
Nurse aides, orderlies and attendants, 26%
Allied Health Professions,
37%
Note: "Other healthcare occupations" includes: chiropractors, dentists, optometrists, and pharmacists.Source: U.S. Bureau of Labor Statistics, Occupational Employment Statistics (2005). URL: http://www.bls.gov/oes/.
Total Health Care Jobs =
302,270
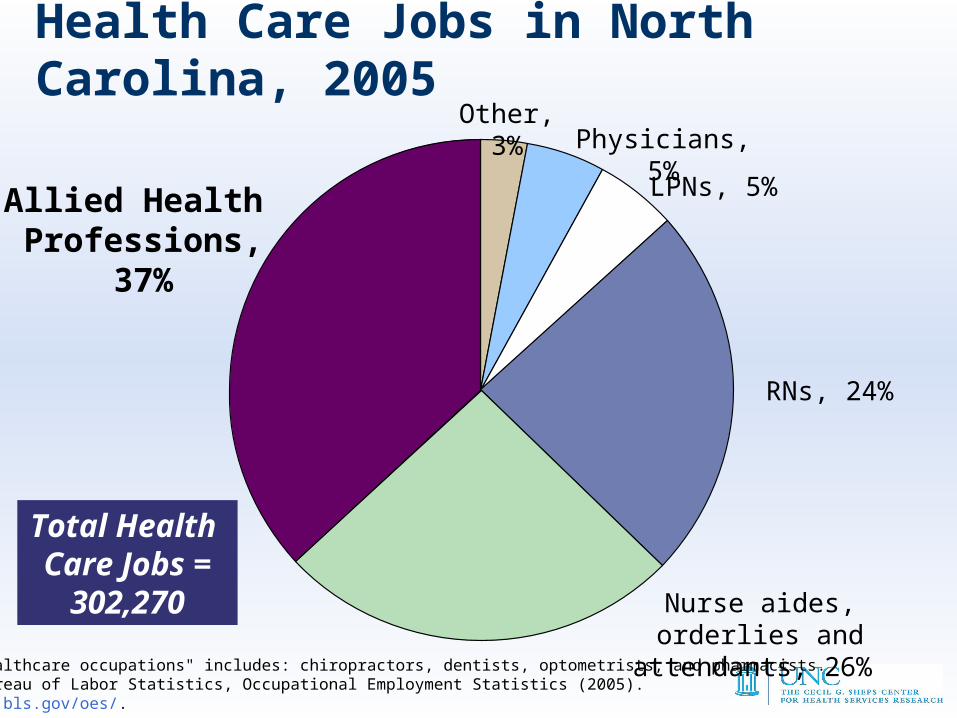
Healthcare and Allied Health Jobs Grew, Overall Employment Remained Stagnant
Total State, Healthcare and Allied Health Employment, North Carolina, 1999-2005
Source: Bureau of Labor Statistics. Occupational Employment Statistics. State Cross-Industry Estimates: 1999-2005. URL: http://www.bls.gov/oes/. Accessed 06/28/2006.
1999 2005% Growth
(1999-2005)
Total N.C. Employment
3,801,670 3,809,690 0.2%
Healthcare Jobs
251,550 302,270 20.2%
Allied Health Jobs
76,590 111,630 45.8%
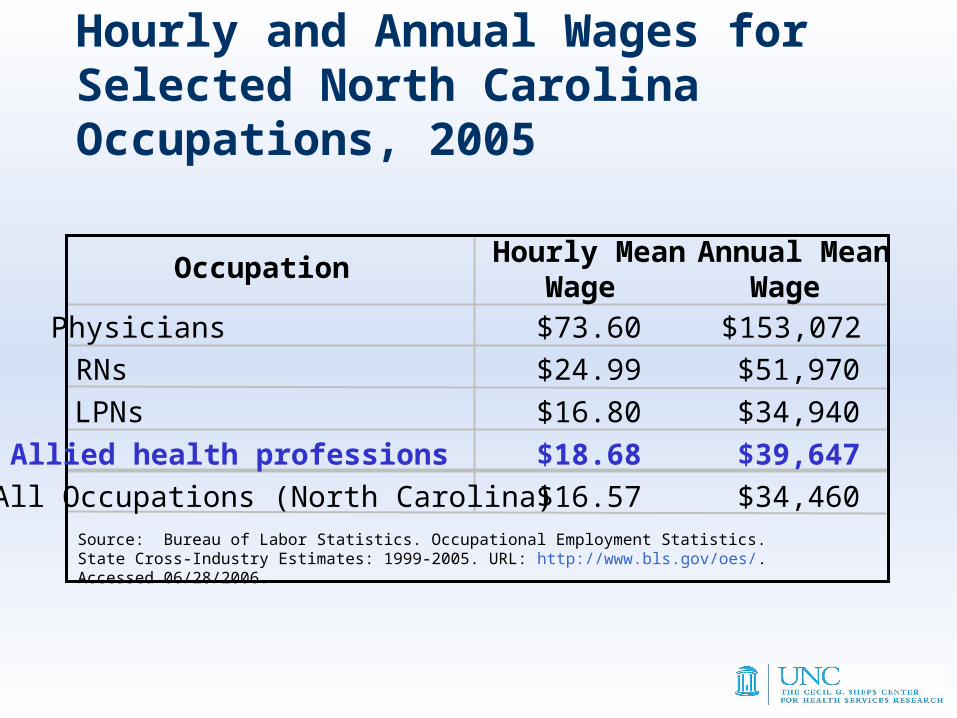
Hourly and Annual Wages for Selected North Carolina Occupations, 2005
Occupation Hourly MeanWage
Annual MeanWage
Physicians $73.60 $153,072
RNs $24.99 $51,970
LPNs $16.80 $34,940
Allied health professions $18.68 $39,647
All Occupations (North Carolina) $16.57 $34,460Source: Bureau of Labor Statistics. Occupational Employment Statistics. State Cross-Industry Estimates: 1999-2005. URL: http://www.bls.gov/oes/. Accessed 06/28/2006.
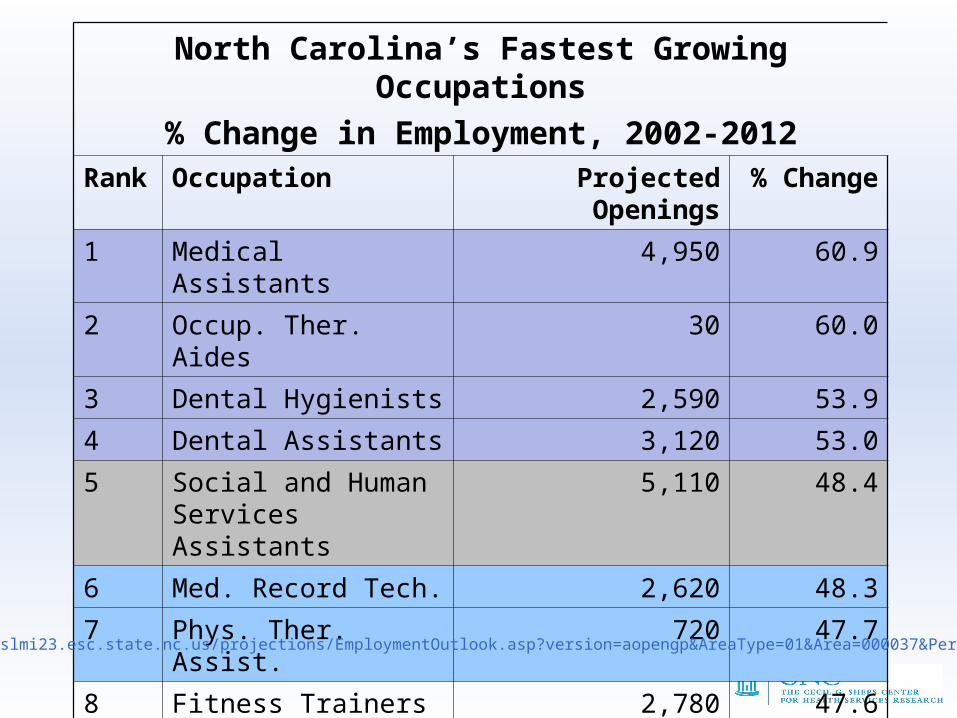
North Carolina’s Fastest Growing Occupations
% Change in Employment, 2002-2012Rank Occupation Projected Openings % Change
1 Medical Assistants 4,950 60.9
2 Occup. Ther. Aides 30 60.0
3 Dental Hygienists 2,590 53.9
4 Dental Assistants 3,120 53.0
5 Social and Human Services Assistants
5,110 48.4
6 Med. Record Tech. 2,620 48.3
7 Phys. Ther. Assist. 720 47.7
8 Fitness Trainers 2,780 47.6
9 Resp. Therapy Tech. 330 47.1
10 Respiratory Therapists 1,170 46.8
http://eslmi23.esc.state.nc.us/projections/EmploymentOutlook.asp?version=aopengp&AreaType=01&Area=000037&PeriodID=06
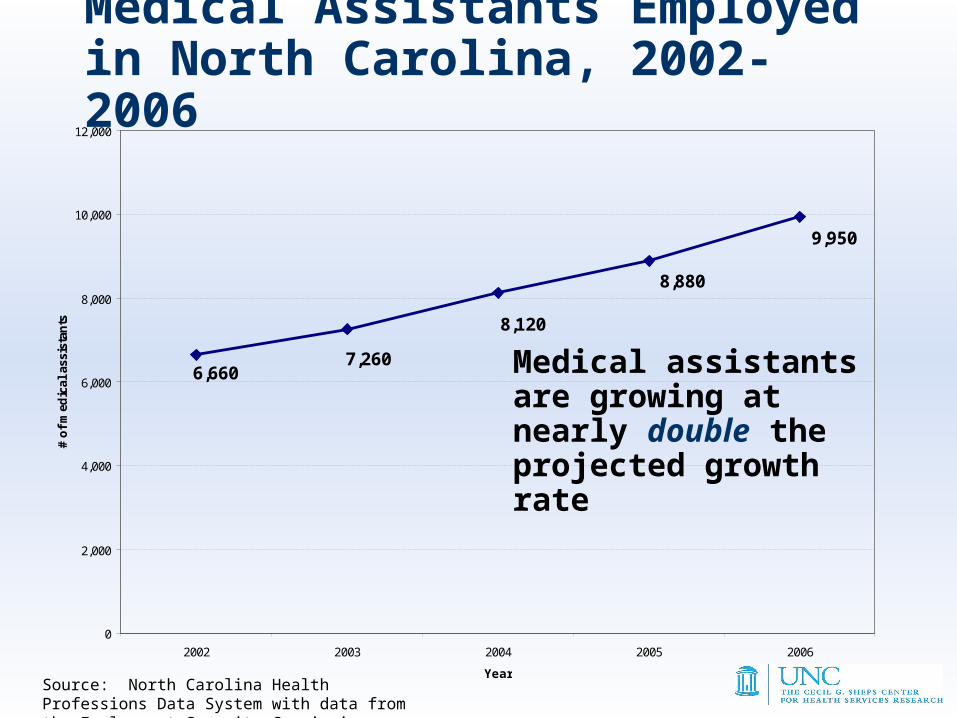
Medical Assistants Employed in North Carolina, 2002-2006
6,6607,260
8,120
9,950
8,880
0
2,000
4,000
6,000
8,000
10,000
12,000
2002 2003 2004 2005 2006
Year
# o
f m
edic
al a
ssis
tan
ts
Source: North Carolina Health Professions Data System with data from the Employment Security Commission.
Medical assistants are growing at nearly double the projected growth rate
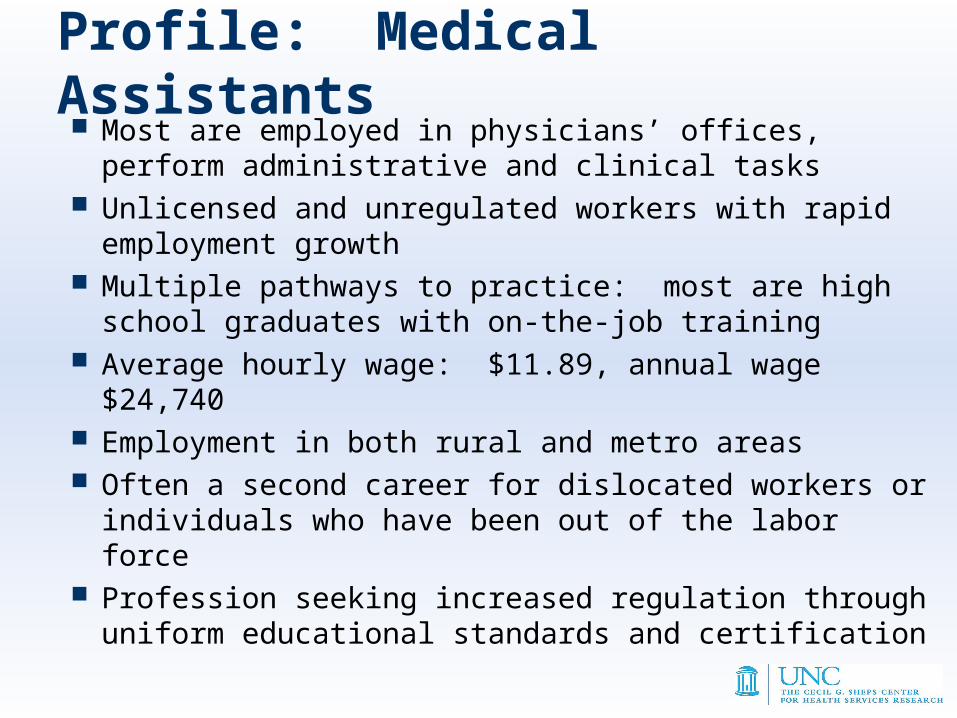
Profile: Medical Assistants Most are employed in physicians’ offices, perform
administrative and clinical tasks Unlicensed and unregulated workers with rapid
employment growth Multiple pathways to practice: most are high school
graduates with on-the-job training Average hourly wage: $11.89, annual wage $24,740 Employment in both rural and metro areas Often a second career for dislocated workers or
individuals who have been out of the labor force Profession seeking increased regulation through
uniform educational standards and certification
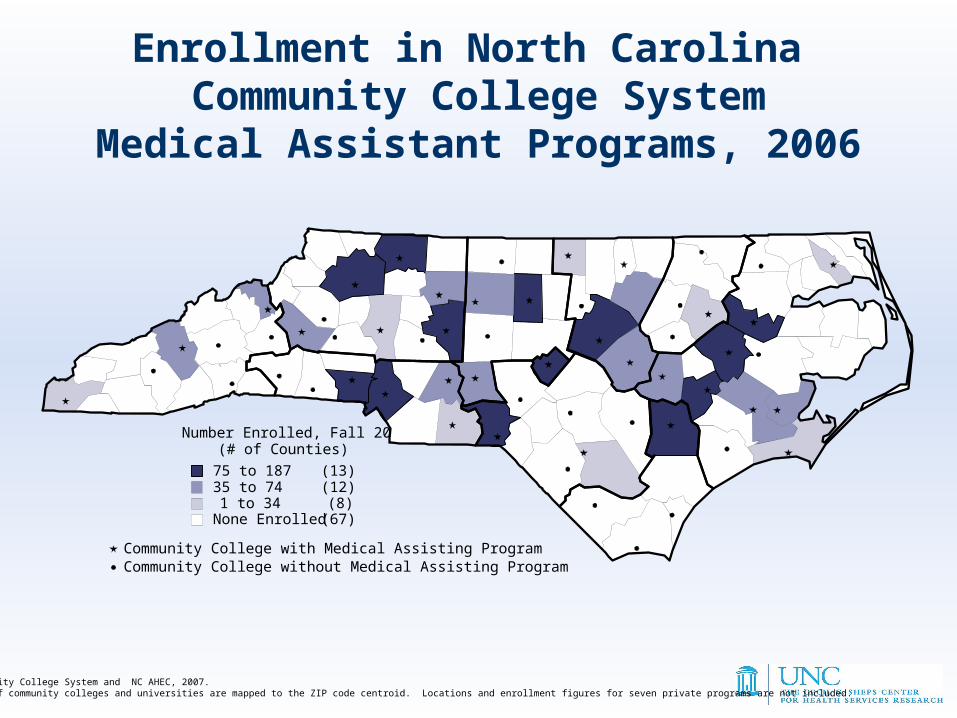
Figure 4.Enrollment in North Carolina Community College System
Medical Assistant Programs, 2006
Sources: NC Community College System and NC AHEC, 2007.Note: Locations of community colleges and universities are mapped to the zip code centroid. Locations and enrollment figures for seven private programs are not included.
Number Enrolled, Fall 2005(# of Counties)
75 to 187 (13)35 to 74 (12)1 to 34 (8)
None Enrolled (67)
Community College with Medical Assisting ProgramCommunity College without Medical Assisting Program
Enrollment in North Carolina Community College System
Medical Assistant Programs, 2006
Sources: NC Community College System and NC AHEC, 2007.Notes: Locations of community colleges and universities are mapped to the ZIP code centroid. Locations and enrollment figures for seven private programs are not included.

Challenges in Estimating the Supply of, and Demand for, Allied Health
Professionals

Challenge 1: Defining allied health Open to different interpretations Easier to define what is not allied health:
– Nurses: LPNs, RNs, NPs– Physicians– Chiropractors– Podiatrists– Optometrists– Pharmacists– Dentists– Aides: psychiatric aides, nursing aides, home
health aides, orderlies, attendants

Challenge 2: Enumerating the Allied Health Workforce: How Many and Where?
Licensed professionals
Mix of licensed and certified professionals
HighMedium Low
Optionalprofessionalcertification
PhysicalPhysicalTherapyTherapy
Speech- Speech- Language Language PathologyPathology
Radiologic Technicians/Radiologic Technicians/TechnologistsTechnologists
Validity, Reliability of Data, a Spectrum

Challenge 3: What to do about unlicensed allied health professions?
Amount, type and quality of data available from credentialing and certifying organizations varies.
Don’t know who is in active practice Can’t fully enumerate workforce or
locate them to counties, employment setting etc.

Result: Lurching from Oversupply to Shortage
time
supp
ly
Ideal intervention point
Allied health professions
Typical intervention point
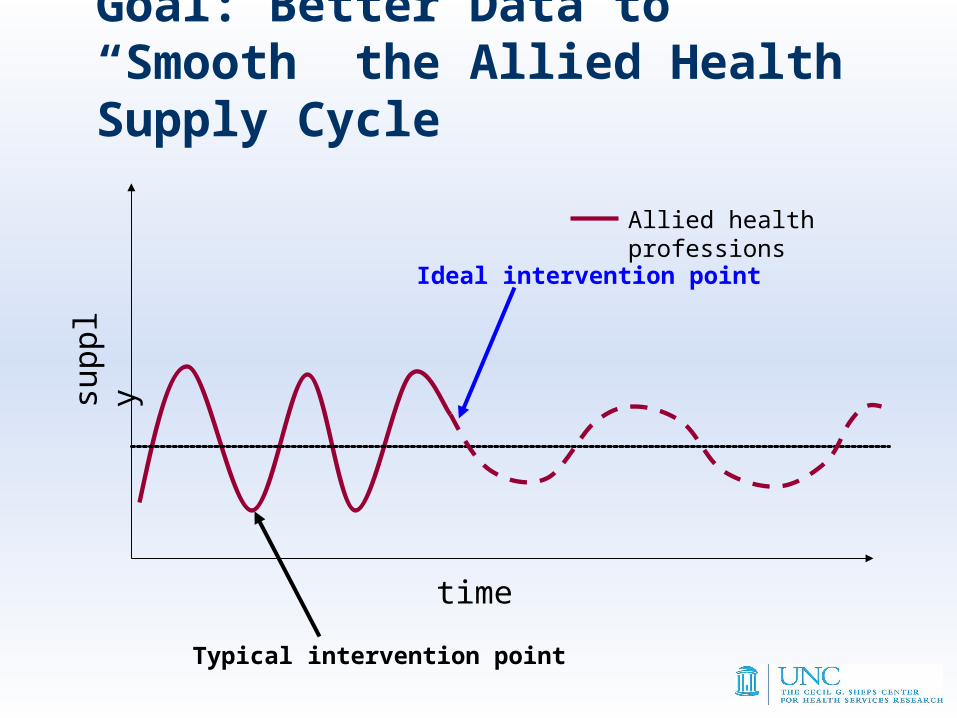
Goal: Better Data to “Smooth” the Allied Health Supply Cycle
time
supp
ly
Typical intervention point
Ideal intervention point
Allied health professions

Vacancy Reports
First report published in May 2005, subsequent report in May 2006. Most recent report is hot off the press.

Vacancy tracking overview Purpose: Estimate workforce demand for selected allied health professions
Method: Monitor weekly job listings in newspaper and online sources
Data: Latest data collected for twelve professions during 10 week period (September 24-November 26, 2006)
Results: – Number of vacancies– Distribution of vacancies by region and profession – Types of employers advertising vacancies

Indeed.com Job Search Engine
American Society for Radiologic Tech (ASRT)
NC Occupational Therapy Association (NCOTA)
NC Office of Emergency Medical Services (NCEMS)
NC Physical Therapy Association (NCPTA)
NC Speech, Hearing & Language Association
(NCSHLA)
Recreation Therapy Directory
Asheville Citizen Times
Charlotte Observer
Fayetteville Observer
Greensboro News & Record
Hickory Daily Record
Raleigh News and Observer
Rocky Mount Telegram
The Daily Reflector
Wilmington Star-News
Wilson Daily Times
Winston Salem Journal
Media Sources Monitored for Allied Health Vacancies
Newspapers Online Sources

Data collection: Online

Data collection: Newspapers
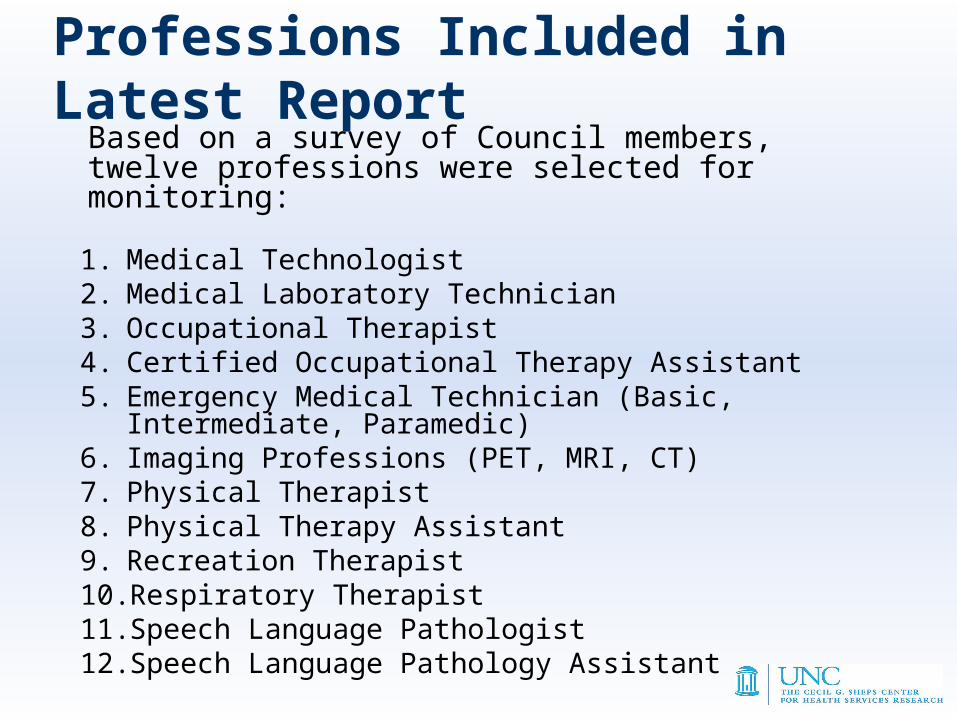
Based on a survey of Council members, twelve professions were selected for monitoring:
1. Medical Technologist2. Medical Laboratory Technician3. Occupational Therapist4. Certified Occupational Therapy Assistant5. Emergency Medical Technician (Basic, Intermediate,
Paramedic)6. Imaging Professions (PET, MRI, CT)7. Physical Therapist8. Physical Therapy Assistant9. Recreation Therapist10. Respiratory Therapist11. Speech Language Pathologist12. Speech Language Pathology Assistant
Professions Included in Latest Report
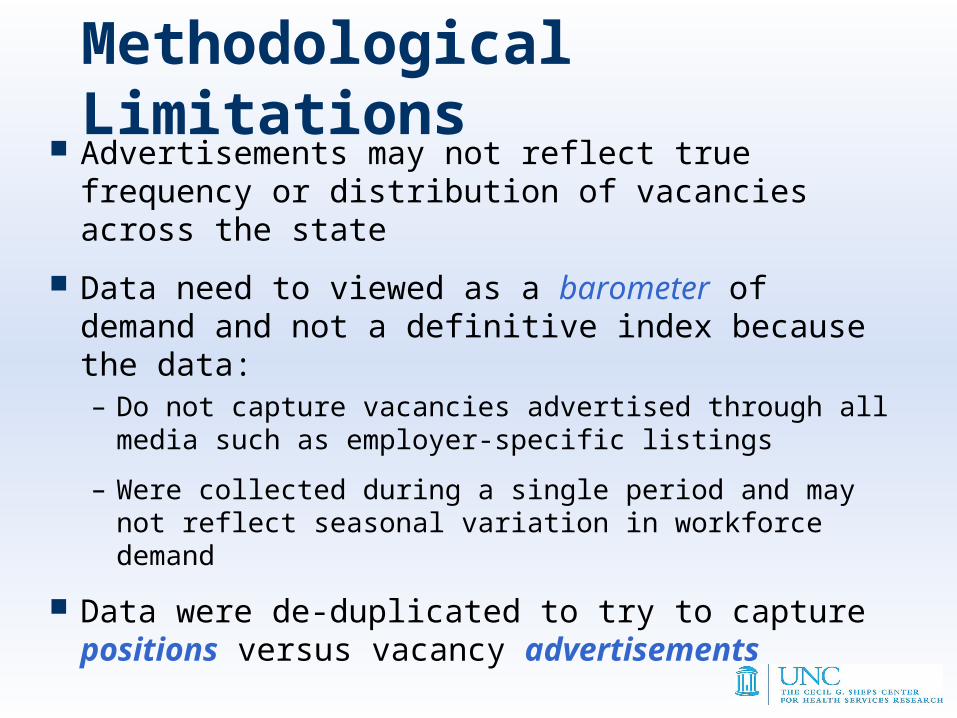
Advertisements may not reflect true frequency or distribution of vacancies across the state
Data need to viewed as a barometer of demand and not a definitive index because the data: – Do not capture vacancies advertised through all media
such as employer-specific listings
– Were collected during a single period and may not reflect seasonal variation in workforce demand
Data were de-duplicated to try to capture positions versus vacancy advertisements
Methodological Limitations

Vacancies by Profession
23
61
81
98
119
122
127
135
172
176
177
275
554
0 100 200 300 400 500 600
Recreation Therapist
EMT (Basic or Inter)
Paramedic
Imaging (PET, MRI, CT)
Medical Technologist
Medical Technician
Respiratory Therapist
Occupational Therapy Assistant
Speech-Language Pathologist
Medical Assistant
Physical Therapy Assistant
Occupational Therapist
Physical Therapist

Vacancies by Employment Setting
Hospital29%
Practice12%
Home Health9%
Rehab8%
Staffing Agency
28%
Other3%
Long-Term Care7%
Government4%
Total vacancies = 2,050
Note: 70 vacancy advertisements were missing setting. Other includes “other”, laboratories, schools and universities

Vacancy indexNeed to adjust raw vacancy numbers to account for different
workforce size of allied health professions
ProfessionWorkforce
Size VacantVacancy
Index
Occupational Therapy Assistant 888 135 15.2
Physical Therapist 3,749 554 14.8
Occupational Therapist 1,990 275 13.8
Physical Therapist Assistant 1,859 177 9.5
Speech-Language Pathologist 2,710 172 6.3
Imaging (PET, MRI, CT) 1,853 98 5.3
Recreation Therapist 450 23 5.1
Respiratory Therapist 3,413 127 3.7
Medical Technologist 4,250 119 2.8
Medical Technician 4,950 122 2.5
EMT (Basic, Inter, Paramedic) 6,790 142 2.1
Medical Assistant 9,950 176 1.8Excludes listings missing employer location (N=22).
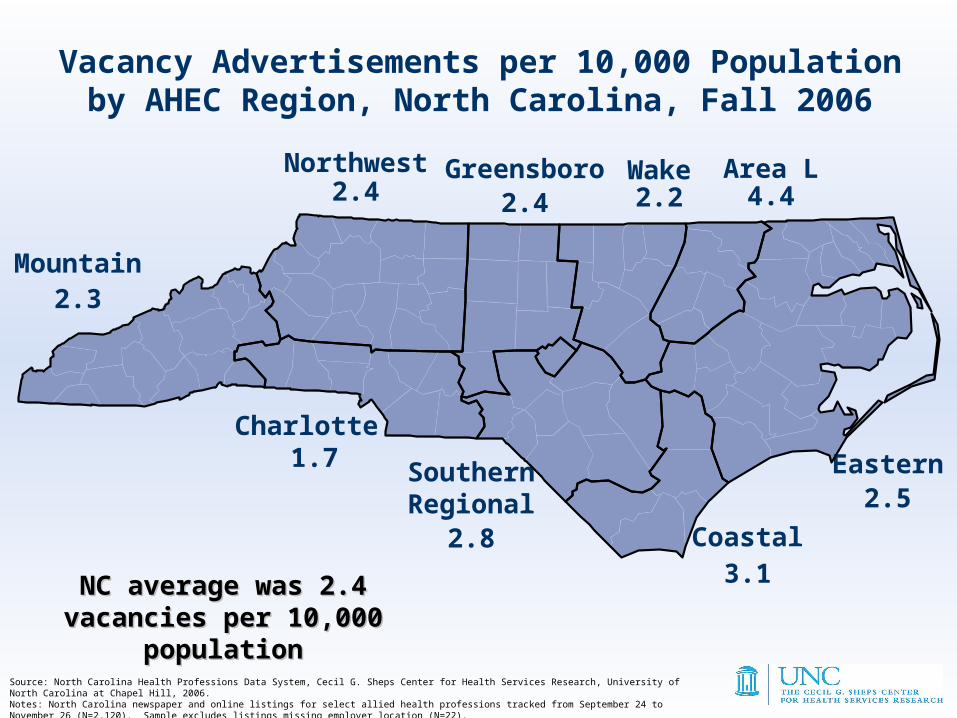
Vacancy Advertisements per 10,000 Populationby AHEC Region, North Carolina, Fall 2006
Source: North Carolina Health Professions Data System, Cecil G. Sheps Center for Health Services Research, University of North Carolina at Chapel Hill, 2006.Notes: North Carolina newspaper and online listings for select allied health professions tracked from September 24 to November 26 (N=2,120). Sample excludes listings missing employer location (N=22).
NC average was 2.4 NC average was 2.4 vacancies per 10,000 vacancies per 10,000
populationpopulation
Northwest2.4
Mountain2.3
Greensboro2.4
Wake2.2
Charlotte 1.7 Southern
Regional2.8 Coastal
3.1
Area L4.4
Eastern2.5
Summary of Issues: What Do We Know?
Allied health employment increasingly important economic sector
Allied health employment will increase and the state faces high vacancy rates in some professions
Vacancy rates are generally higher in rural, eastern North Carolina
Potential investment in educating allied health workers pay large and immediate dividends due to high retention rates
Increasing number of allied health workers has potential to increase access to employment and improve access to health care services

Moving Forward: Challenges and Opportunities
Challenges to Moving Forward Existing system is fragmented, limited
collaboration exists between policy makers, educators, employers and others charged with monitoring, planning and implementing workforce development strategies at the local and state level.
Despite workforce shortages and employer needs for workers, educational system struggles to meet need:– Too few qualified applicants– Attrition– Faculty shortages– Lack of clinical placements– Cost of allied health education is high

Future Opportunities Better collaboration between health workforce
researchers, educators, employers and local workforce development boards
Re-envision workforce development efforts to target specific health care professions and/or regions of the state for workforce development
Initiative currently underway with leadership out of the Governor’s Office/Dept. of Commerce: The allied health sector strategy aims to increase allied health sector competitiveness and employment opportunities

Allied Health Sector Strategy
NC was one of 5 states chosen to participate by The National Governors Association
Focus on identifying regions and professions in the state facing allied health workforce shortages and encourage industry-led partnerships to address them
Intermediate goal: re-envision workforce development system that involves more collaboration between stakeholders
Ultimate goals: increase employment, address workforce shortages, raise skill levels, identify and respond to employer needs…..improve access to health care?

June 15th Conference: Please come!The Impact of Health Care and the Allied Health
Workforce on North Carolina’s EconomySymposium designed to:1. Discuss relationship between economic
development and allied health workforce development efforts underway in NC
2. Describe challenges confronting allied health educators and employers
3. Identify best practices used to meet these challenges
Announcement: New grant opportunity to support sector strategies in allied health
Time: 8:30-2:30Location: Friday Center, Chapel HillRegistration: through Greensboro AHEC