Embed Size (px)
Citation preview

Office of Governor Andrew M. Cuomo
The State of New York’s Failing Schools2015 Report

Report was prepared by the Policy Office, Education Team and the Division of Budget.

The State of New York’s Failing Schools2015 Report
Governor Cuomo is committed to providing access to high quality education for all New Yorkers, no matter who are they are or where they live. Education is thecornerstone of our democracy and paves the way to increased social and economic opportunity. The Governor believes that all of our children deserve ahigh quality public education that will help them lead successful, fulfilling lives.
In his first term Governor Cuomo implemented a series of policies to increase access to early education, equip schools with 21st century learning technology and internet connectivity, and recognize and reward our best teachers. Although these steps have been important, our public education system requires further reform.
Part One: Our Schools and Students
There are 698 school districts in New York with 4,530 public and charter schools that enroll 2.7 million students. New York is also home to 1,768 private schools.1
Our schools serve a diverse student population:
Students by Ethnicity (2014-2015 School Year)Black or African American 18%Hispanic or Latino 25%White 46%Asian or Native Hawaiian/Pacific Islander 9%American Indian or Alaska Native 1%Multiracial 1%
Data from New York State Education Department
Other Groups (2014-2015 School Year)Limited English Proficient Students 8%Students with Disabilities 16%Economically Disadvantaged Students* 53%
Data from New York State Education Department*Economically disadvantaged students are defined as those who participate in, or whose families participate in, economic assistance programs, such as the free or reduced-price lunch programs, Social Security Insurance (SSI), Food Stamps, Foster Care, Refugee Assistance (cash or medical assistance), Earned Income Tax Credit (EITC), Home Energy Assistance Program (HEAP), Safety Net Assistance (SNA), Bureau of Indian Affairs (BIA), or Family Assistance: Temporary Assistance for Needy Families (TANF).
1 New York State Department of Education, Information and Reporting Services. See http://www.p12.nysed.gov/irs/statistics/public/.
3

Part Two: The State’s Financial Commitment
New York's average spending per pupil spending grew from $11,546 in 2002-03to $19,552 in 2012-13.2 As of today, New York spends more than any other state on a per pupil basis and per pupil spending is 84 percent higher than the national average of $10,608.3
New York has been the highest spending state in every school year since 2005-06, when the state surpassed New Jersey. In addition, our education spending tops that of every other nearby state by a significant margin: it is 13 percent greater than New Jersey's, 20 percent greater than Connecticut's, 38 percent greater than Massachusetts's and 47 percent greater than Pennsylvania's. Not one New York school district spent less than the national average; most spent considerably more.
Data from the U.S. Census Bureau. Data as of May 2014.
State support has financed much of New York’s spending growth. For example, school district expenditures more than doubled between 1997-98 and 2012-13, growing from $27.6 billion to $58.3 billion.4 Over the same 15-year period, district revenues increased by $31.2 billion.
2 Data from the United States Census Bureau.3 Data from the United States Census Bureau. 4 New York State Education Department.
$15,981 $17,173 $18,126 $18,618 $19,076 19,552
$0
$5,000
$10,000
$15,000
$20,000
$25,000
2007-2008 2008-2009 2009-2010 2010-2011 2011-2012 2012-2013
New York State Spending Per Pupil
4

Total Percentage Increase in Spending vs. CPI1997-98 to 2012-13
The distribution of this increase almost exactly mirrors that of school districts' total revenues in 2012-13; even in the face of significant economic and policy challenges the State has maintained its commitment to funding education.
Although comprehensive financial data is not yet available for the 2013-14 and 2014-15 school years, it is expected that these years will ultimately show education spending has grown to surpass $60 billion statewide. The State's last two Enacted Budgets contained School Aid increases totaling approximately $2.1 billion, bringing School Aid to its highest annual level in history at $22.2 billion in 2014-15. In addition, these two years saw independent school districts present voters with budgets seeking the levy of $1.0 billion of additional property taxes.
New York State’s School Aid funding is progressive. For example, under the 2014-15 Enacted Budget, New York State provides nearly three times as much aid per pupil to high-need school districts ($9,639) as to low-need districts ($3,371). Excluding New York City, which has significantly more income and property wealth than most high-need districts, the State provides $12,634 of aid per pupil to high-need districts. Because of this progressive formula, in 2012-13 State aid provided the 20 percent of school districts with the lowest fiscal capacity with almost 70 percent of their total revenues on average, compared to less than 17 percent for the 20 percent of districts with the greatest fiscal capacity.
0.0%
20.0%
40.0%
60.0%
80.0%
100.0%
120.0%
1997-98 1999-00 2001-02 2003-04 2005-06 2007-08 2009-10 2011-12
School Spending CPI
5
Part Three: Student Achievement
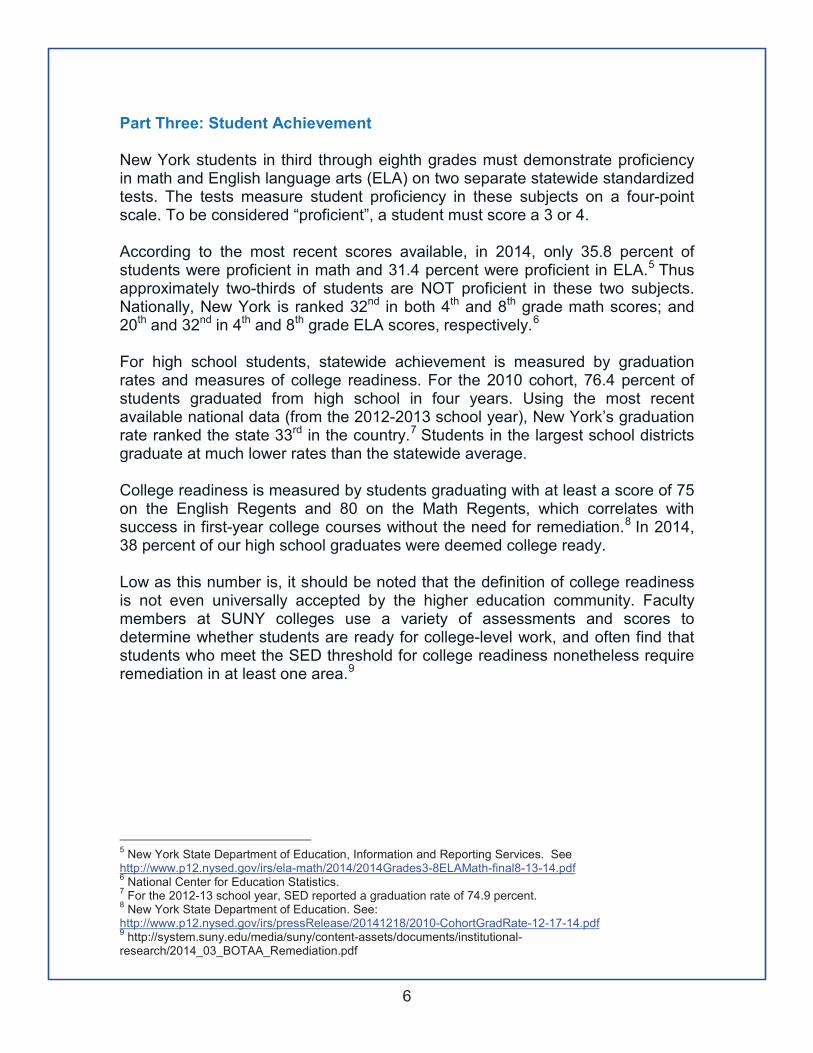
New York students in third through eighth grades must demonstrate proficiency in math and English language arts (ELA) on two separate statewide standardized tests. The tests measure student proficiency in these subjects on a four-point scale. To be considered “proficient”, a student must score a 3 or 4.
According to the most recent scores available, in 2014, only 35.8 percent of students were proficient in math and 31.4 percent were proficient in ELA.5 Thusapproximately two-thirds of students are NOT proficient in these two subjects. Nationally, New York is ranked 32nd in both 4th and 8th grade math scores; and20th and 32nd in 4th and 8th grade ELA scores, respectively.6
For high school students, statewide achievement is measured by graduation rates and measures of college readiness. For the 2010 cohort, 76.4 percent of students graduated from high school in four years. Using the most recent available national data (from the 2012-2013 school year), New York’s graduation rate ranked the state 33rd in the country.7 Students in the largest school districts graduate at much lower rates than the statewide average.
College readiness is measured by students graduating with at least a score of 75 on the English Regents and 80 on the Math Regents, which correlates with success in first-year college courses without the need for remediation.8 In 2014, 38 percent of our high school graduates were deemed college ready.
Low as this number is, it should be noted that the definition of college readiness is not even universally accepted by the higher education community. Faculty members at SUNY colleges use a variety of assessments and scores to determine whether students are ready for college-level work, and often find that students who meet the SED threshold for college readiness nonetheless require remediation in at least one area.9
5 New York State Department of Education, Information and Reporting Services. Seehttp://www.p12.nysed.gov/irs/ela-math/2014/2014Grades3-8ELAMath-final8-13-14.pdf6 National Center for Education Statistics.7 For the 2012-13 school year, SED reported a graduation rate of 74.9 percent.8 New York State Department of Education. See:http://www.p12.nysed.gov/irs/pressRelease/20141218/2010-CohortGradRate-12-17-14.pdf9 http://system.suny.edu/media/suny/content-assets/documents/institutional-research/2014_03_BOTAA_Remediation.pdf
6
Part Four: Teacher Effectiveness
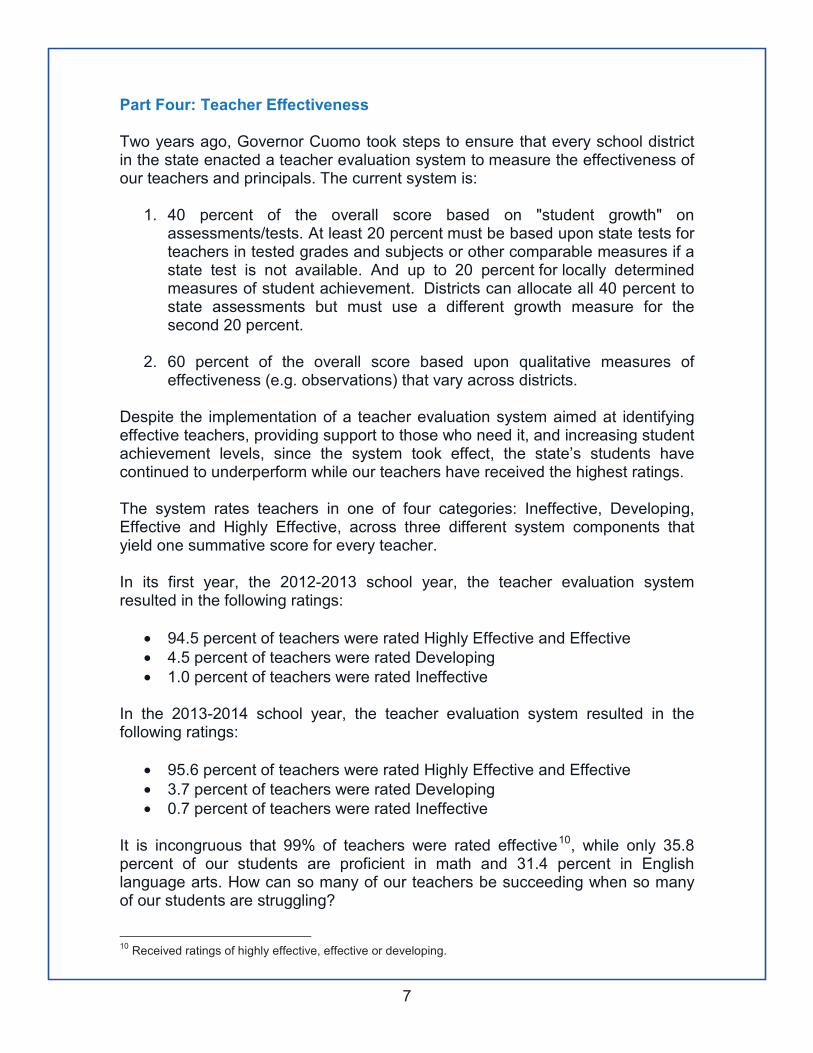
Two years ago, Governor Cuomo took steps to ensure that every school district in the state enacted a teacher evaluation system to measure the effectiveness of our teachers and principals. The current system is:
1. 40 percent of the overall score based on "student growth" on assessments/tests. At least 20 percent must be based upon state tests for teachers in tested grades and subjects or other comparable measures if a state test is not available. And up to 20 percent for locally determined measures of student achievement. Districts can allocate all 40 percent to state assessments but must use a different growth measure for the second 20 percent.
2. 60 percent of the overall score based upon qualitative measures of effectiveness (e.g. observations) that vary across districts.
Despite the implementation of a teacher evaluation system aimed at identifyingeffective teachers, providing support to those who need it, and increasing student achievement levels, since the system took effect, the state’s students havecontinued to underperform while our teachers have received the highest ratings.
The system rates teachers in one of four categories: Ineffective, Developing, Effective and Highly Effective, across three different system components that yield one summative score for every teacher.
In its first year, the 2012-2013 school year, the teacher evaluation system resulted in the following ratings:
• 94.5 percent of teachers were rated Highly Effective and Effective• 4.5 percent of teachers were rated Developing • 1.0 percent of teachers were rated Ineffective
In the 2013-2014 school year, the teacher evaluation system resulted in the following ratings:
• 95.6 percent of teachers were rated Highly Effective and Effective • 3.7 percent of teachers were rated Developing• 0.7 percent of teachers were rated Ineffective
It is incongruous that 99% of teachers were rated effective10, while only 35.8 percent of our students are proficient in math and 31.4 percent in English language arts. How can so many of our teachers be succeeding when so many of our students are struggling?
10 Received ratings of highly effective, effective or developing.
7

Statewide Teacher Evaluations11
Rating 2012-2013 Percent of Teachers
2013-14 Percent of Teachers
Highly Effective 51.2% 41.9%Effective 43.3% 53.7%Developing 4.5% 3.7%Ineffective 1% 0.7%TOTAL 100.0% 100.0%
Data from New York State Education Department. Data as of December 2014.
SED has not yet released district-level teacher evaluation details for the 2013-14 school year except for New York City. The statewide 2013-2014 rating breakdowns are expected to be even less distributed than they were in the 2012-2013 school year.
Part Five: Failing Schools
Today there are 178 “priority” or “failing” schools in 17 school districts in New York. These schools have been in a monitored or “accountability status”pursuant to SED regulations for the last three school years and have beenamong the bottom five percent in the state in ELA and math performance or have graduation rates below 60 percent. 12 There are currently 109,000 students enrolled in these failing schools.
Of the 178 schools, 77 have been failing for a decade. More than 250,000 students13 have passed through these 77 schools in the past ten years. That represents 250,000 students who did not have access to the high quality public education that they deserved.
Moreover, we are failing the kids who need us most. Ninety-three percent of students in failing schools are students of color and 82 percent of these students are eligible for free or reduced price lunch.
Student achievement today at failing schools lags behind state averages in every category.
11 http://www.regents.nysed.gov/meetings/2014/December2014/Evaluation.pdfThis summary reflects the data that were reported to the Department by districts, BOCES, and charter schools with approved 2013-14 APPR plans as of the 10/17/2014 deadline. 186,877 teachers were reported with 3 complete subcomponents and an overall composite rating. New York City did not have a system in place for the 2012-13 school year, but is included in 2013-14.
12 http://www.p12.nysed.gov/accountability/2012-13AccountabilityDesignations.html13 Division of Budget estimates based on historic enrollment data from SED.
8

2013-2014 Student Achievement
Failing Schools StatewideELA Proficiency 5.9% 31.4%Math Proficiency 6.2% 35.8%Graduation Rate 46.6% 76.4%
Data from New York State Education Department.
Despite the fact that districts with failing schools receive more State funding than other districts, these schools are delivering unacceptable results. For example, the 2014-15 Enacted Budget provides the 17 school districts containing these failing schools with $9,000 of School Aid per pupil on average, or 11 percent more than the statewide average of $8,114. The 16 school districts outside New York City, meanwhile, receive $12,933 of School Aid per pupil on average, or 59 percent more than the statewide average.
These statistics – and more – are summarized in the school snapshots contained in the Appendix to this report.14
Part Six: Conclusion
The statistics and facts contained in this report and its Appendix expose a public education system badly in need of change. Our levels of achievement must increase if we want to ensure bright futures for all New Yorkers.
This is why Governor Cuomo has proposed an ambitious education reform agenda in his 2015-2016 Executive Budget that addresses key areas includingteacher preparation, certification, evaluation and tenure and the transformation of our failing schools. Our students deserve nothing less.
14 This Appendix contains snapshots for 177 of the 178 failing schools in the state. The Greenburgh Eleven Middle School, identified by the State Education Department as a Priority School, is not included in this Appendix since it is a part of the Greenburgh Eleven Union Free School District (a Special Act School District) and comparable data is not available in all categories. Special Act School districts were created by special action of the legislature for the purpose of providing education services to students who reside in child care institutions.
9

The State of New York’s Failing SchoolsAppendix
Albany City School District ......................................................................................... 14
Amsterdam City School District .................................................................................. 18
Buffalo City School District ......................................................................................... 20
Central Islip Union Free School District ...................................................................... 48
Hempstead Union Free School District ...................................................................... 50
Mt Vernon School District ........................................................................................... 53
Newburgh City School District .................................................................................... 55
New York City School District ..................................................................................... 57
Poughkeepsie City School District............................................................................ 149
Rochester City School District .................................................................................. 150
Roosevelt Union Free School District ....................................................................... 168
Schenectady City School District.............................................................................. 171
Syracuse City School District ................................................................................... 174
Troy City School District ........................................................................................... 193
Utica City School District .......................................................................................... 195
Wyandanch Union Free School District .................................................................... 197
Yonkers City School District ..................................................................................... 199
10

Glossary of Terms & Data Sources
2012-13 Spending Per Pupil: Census reported Current Spending per pupil from all sources (federal, state and local.) The Census defines current spending as current direct expenditure for salaries, employee benefits, purchased professional and technical services, purchased property and other services, supplies. It includes gross school system expenditure for instruction, support services, and non-instructional functions. It also includes payments made by the state government on behalf of school systems, and transfers made by school systems into their own retirement funds. It excludes expenditure for debt service, capital outlay, and reimbursement to other governments (including other school systems). Also excluded are payments made on behalf of the school system by other governments including employee retirement payments made by state governments to state retirement funds and to social security. Employer contributions made by those few school systems that have their own retirement systems into their own retirement funds are excluded.
Source: United State Census Bureau "Public Elementary–Secondary Education Finance Data." Individual Unit Tables. http://www.census.gov/govs/school/.
Grades 3-8 ELA Proficiency: Percent of Students to have scored a 3 or a 4 on the 2013-14 Grades 3-8 English Language Arts State Exam.
Source: New York New York State Education Department, Release of Data--August 14,2014. "Media File Grades 3-8 ELA and Mathematics." http://www.p12.nysed.gov/irs/pressRelease/20140814/home.html
Grades 3-8 Math Proficiency: Percent of Students to have scored a 3 or a 4 on the 2013-14 Grades 3-8 Mathematics State Exam.
Source: New York New York State Education Department, Release of Data--August 14,2014. "Media File Grades 3-8 ELA and Mathematics." http://www.p12.nysed.gov/irs/pressRelease/20140814/home.html
Graduation Rate: The June 4 year Graduation Rate for the 2010 cohort.New York State Education Department, Graduation Rate Data--December 18, 2014 "Rate and Enrollment Outcomes by Student Subgroup." http://www.p12.nysed.gov/irs/pressRelease/20141218/home.html
In Accountability Status since 2005-6: School identified by New York State Education Department to be in a standing other than "In Good Standing" since 2005-6. State
Source: New York Education Department, Accountability Data.
11

Number of Consecutive Years Failing: Number of Years a school has been identified by New York State Education Department to be in a standing other than "In Good Standing" since 2005-6.
Source: New York State Education Department, Accountability Data.
Need Resource Category: A measure of a district's ability to meet the needs of its students with local resources. Is the ratio of the estimated poverty percentage (expressed in standard score form) to the Combined Wealth Ratio (expressed in standard score form). A district with both estimated poverty and Combined Wealth Ratio equal to the State average would have a need/resource capacity index of 1.0. Need/Resource Capacity (N/RC) categories are determined from this index using the definitions provided by the New York State Education Department in the table located here: http://www.p12.nysed.gov/irs/accountability/2011-12/NeedResourceCapacityIndex.pdf
Percent of Free or Reduced Price Lunch Students: The three-year average computed as: (a) the number of K-6 public school pupils in the district who were eligible applicants for Free and Reduced-Price Lunch Program as of October 2010, 2011 and 2012 divided by (b) the full day K-6 enrollment of pupils on a regular day school register as reported in the Fall 2010, 2011 and 2012 Basic Education Data System (BEDS).
Source: New York New York State Education Department, February 2014.
Percent of Free or Reduced Price Lunch Students for a School: Percent of students identified as receiving free or reduced lunch in the 2012-13 school year.
Source: New York State Education Department "2012-13 Report Card Database." http://data.nysed.gov/downloads.php.
Percent Minority Students: The Percent of the enrollment in a school identified as any ethnicity other than "white" in the school report card dataset.
Source: New York State Education Department "2012-13 Report Card Database."http://data.nysed.gov/downloads.php.
Percent of Students English Language Learners: Computed as (a) the number of pupils served in the base year in programs for pupils with limited English proficiency in accordance with regulations adopted for such purpose (used in the calculation of Foundation Aid) divided by (b) the estimated Fall 2013 public school enrollment for State Aid which includes equivalent attendance, students with disabilities attending BOCES full time, homebound students educated at a district expense and charter school enrollment (excluding students with disabilities attending private and State operated schools.
Source: New York State Education Department, February 2014.
12

Priority School: School identified as being in Priority Status. Priority Schools are among the lowest five percent in the State in terms of combined English language arts and mathematics performance that are not making progress, as well as those schools that have graduation rates below 60% for the last several years. Schools that were previously identified as Persistently Lowest Achieving and received School Improvement Grants in the 2011-12 school year were also identified as Priority Schools.
Source: New York State Education Department, "Accountability designation 2012-13, 2012-13 Web Posting Overview." http://www.p12.nysed.gov/accountability/2012-13AccountabilityDesignations.html.
Teacher Effectiveness 2012-13: The percentage of teachers identified at each level in the Annual Professional Performance Review for the 2012-13 school year (not including suppressed data.)
Source: New York New York State Education Department, Educator Data "Annual Professional Performance Review Ratings." http://data.nysed.gov/.
Teacher Effectiveness 2013-14: The percentage of teachers identified at each level in the Annual Professional Performance Review for the 2013-14 school year for New York City (not including suppressed data).
Source: New York New York State Education Department, "2014 Statewide Evaluation Results--Preliminary Results", pg. 9, December, 2014.http://www.regents.nysed.gov/meetings/2014/December2014/Evaluation.pdf.
Total School Enrollment 2005-06 through 2011-12: New York State Education Department, "2005-06 Report Card Database" "2006-07 Report Card Database" "2007-08 Report Card Database" "2008-09 Report Card Database" "2009-10 Report Card Database" "2010-11 Report Card Database" "2011-12 Report Card Database" Enrollment may be labeled as N/A if the school was not operating in a particular school year, or if the data is unavailable.http://data.nysed.gov/downloads.php
Total School Enrollment 2012-13: New York State Education Department, "NY STATE Public School Enrollment (2012 - 13)." http://data.nysed.gov/enrollment.php?year=2013&state=yes
Total School Enrollment 2013-14: New York State Education Department, "NY STATE Public School Enrollment (2013 - 14)." http://data.nysed.gov/enrollment.php?year=2014&state=yes
13

Albany City School District
14

State Avg. School3-8 Math 35.8% N/A3-8 ELA 31.4% N/A
Grad. Rate 76.4% 51.9%
Total School Enrollment, 2005-06 to 2013-142005-06 2006-07 2007-08 2008-09 2009-10 2010-11 2011-12 2012-13 2013-142,824 2,756 2,840 2,668 2,598 2,507 2,236 2,214 2,262
2011-12 Enacted School Aid $78,815,4554 2014-15 Enacted School Aid $88,456,5885 $ Change + $9,641,133 % Highly Effective 12%6 % Change + 12.2% % Effective 88%7 % Developing 0%
2014-15 Estimated Public Enrollment 10,640 % Ineffective 0%8 2014-15 Formula Based State Aid Per Pupil $8,3149
2012-13 Spending Per Pupil: All Sources (Census) $19,8912012-13 National Average (Census) $10,608
% Above National Average + 87.5%#
#
# % Free or Reduced Price Lunch (FRPL) Students 69.7%% Students English Language Learners (ELL) 6.7%
# 21 20 19 18 17 16 15
10
+ 12.2%
High Need Urban Suburban
Fiscal & Demographic Factors
Percentage Change in Aid, 2011-12 to 2014-15
School District Key Facts
Teacher Effectiveness2012-13
2013-14 Academic Performance2013-14 School Demographics% of Free & Reduced Price
Lunch Students (FRPL)
% Minority Students
50.6%
77.6%
Albany High SchoolAlbany City School District - Albany County
Need Resource Category
2014-15 Status
Has the School Been Failing Since 2005-06?
Number of Consecutive Years Failing Since 2005-06
Priority / Failing
Yes
Summary
Patricia FahyNeil Breslin
Assembly District # 109Senate District # 44
15

State Avg. School3-8 Math 35.8% 5.7%3-8 ELA 31.4% 2.4%
Grad. Rate 76.4% N/A
Total School Enrollment, 2005-06 to 2013-142005-06 2006-07 2007-08 2008-09 2009-10 2010-11 2011-12 2012-13 2013-14
298 261 241 292 286 323 320 295 297
2011-12 Enacted School Aid $78,815,4554 2014-15 Enacted School Aid $88,456,5885 $ Change + $9,641,133 % Highly Effective 12%6 % Change + 12.2% % Effective 88%7 % Developing 0%
2014-15 Estimated Public Enrollment 10,640 % Ineffective 0%8 2014-15 Formula Based State Aid Per Pupil $8,3149
2012-13 Spending Per Pupil: All Sources (Census) $19,8912012-13 National Average (Census) $10,608
% Above National Average + 87.5%#
#
# % Free or Reduced Price Lunch (FRPL) Students 69.7%% Students English Language Learners (ELL) 6.7%
# 21 20 19 18 17 16 15
4
+ 12.2%
High Need Urban Suburban
Fiscal & Demographic Factors
Percentage Change in Aid, 2011-12 to 2014-15
School District Key Facts
Teacher Effectiveness2012-13
2013-14 Academic Performance2013-14 School Demographics% of Free & Reduced Price
Lunch Students (FRPL)
% Minority Students
94.9%
93.9%
P J Schuyler Achievement AcademyAlbany City School District - Albany County
Need Resource Category
2014-15 Status
Has the School Been Failing Since 2005-06?
Number of Consecutive Years Failing Since 2005-06
Priority / Failing
No
Summary
John McDonaldNeil Breslin
Assembly District # 108Senate District # 44
16

State Avg. School3-8 Math 35.8% 6.2%3-8 ELA 31.4% 16.2%
Grad. Rate 76.4% N/A
Total School Enrollment, 2005-06 to 2013-142005-06 2006-07 2007-08 2008-09 2009-10 2010-11 2011-12 2012-13 2013-14
638 495 430 470 629 576 589 603 686
2011-12 Enacted School Aid $78,815,4554 2014-15 Enacted School Aid $88,456,5885 $ Change + $9,641,133 % Highly Effective 12%6 % Change + 12.2% % Effective 88%7 % Developing 0%
2014-15 Estimated Public Enrollment 10,640 % Ineffective 0%8 2014-15 Formula Based State Aid Per Pupil $8,3149
2012-13 Spending Per Pupil: All Sources (Census) $19,8912012-13 National Average (Census) $10,608
% Above National Average + 87.5%#
#
# % Free or Reduced Price Lunch (FRPL) Students 69.7%% Students English Language Learners (ELL) 6.7%
# 21 20 19 18 17 16 15
10
+ 12.2%
High Need Urban Suburban
Fiscal & Demographic Factors
Percentage Change in Aid, 2011-12 to 2014-15
School District Key Facts
Teacher Effectiveness2012-13
2013-14 Academic Performance2013-14 School Demographics% of Free & Reduced Price
Lunch Students (FRPL)
% Minority Students
72.0%
80.7%
William S Hackett Middle SchoolAlbany City School District - Albany County
Need Resource Category
2014-15 Status
Has the School Been Failing Since 2005-06?
Number of Consecutive Years Failing Since 2005-06
Priority / Failing
Yes
Summary
John McDonaldNeil Breslin
Assembly District # 108Senate District # 44
17

Amsterdam City School District
18

State Avg. School3-8 Math 35.8% 11.2%3-8 ELA 31.4% 11.0%
Grad. Rate 76.4% N/A
Total School Enrollment, 2005-06 to 2013-142005-06 2006-07 2007-08 2008-09 2009-10 2010-11 2011-12 2012-13 2013-14
360 466 449 421 454 472 446 453 475
2011-12 Enacted School Aid $31,468,3994 2014-15 Enacted School Aid $40,209,9305 $ Change + $8,741,531 % Highly Effective 0%6 % Change + 27.8% % Effective 100%7 % Developing 0%
2014-15 Estimated Public Enrollment 3,706 % Ineffective 0%8 2014-15 Formula Based State Aid Per Pupil $10,8509
2012-13 Spending Per Pupil: All Sources (Census) $14,9932012-13 National Average (Census) $10,608
% Above National Average + 41.3%#
#
# % Free or Reduced Price Lunch (FRPL) Students 59.2%% Students English Language Learners (ELL) 3.2%
# 21 20 19 18 17 16 15
8
+ 27.8%
High Need Rural
Fiscal & Demographic Factors
Percentage Change in Aid, 2011-12 to 2014-15
School District Key Facts
Teacher Effectiveness2012-13
2013-14 Academic Performance2013-14 School Demographics% of Free & Reduced Price
Lunch Students (FRPL)
% Minority Students
66.0%
44.6%
William B Tecler Arts In EducationAmsterdam City School District - Montgomery County
Need Resource Category
2014-15 Status
Has the School Been Failing Since 2005-06?
Number of Consecutive Years Failing Since 2005-06
Priority / Failing
No
Summary
Angelo SantabarbaraGeorge A. Amedore, Jr.
Assembly District # 111Senate District # 46
19

Buffalo City School District
20

State Avg. School3-8 Math 35.8% N/A3-8 ELA 31.4% N/A
Grad. Rate 76.4% 36.9%
Total School Enrollment, 2005-06 to 2013-142005-06 2006-07 2007-08 2008-09 2009-10 2010-11 2011-12 2012-13 2013-14
950 914 921 952 1,066 848 729 661 592
2011-12 Enacted School Aid $612,363,7764 2014-15 Enacted School Aid $675,091,8825 $ Change + $62,728,106 % Highly Effective 59%6 % Change + 10.2% % Effective 32%7 % Developing 5%
2014-15 Estimated Public Enrollment 41,749 % Ineffective 4%8 2014-15 Formula Based State Aid Per Pupil $16,1709
2012-13 Spending Per Pupil: All Sources (Census) $18,9712012-13 National Average (Census) $10,608
% Above National Average + 78.8%#
#
# % Free or Reduced Price Lunch (FRPL) Students 84.1%% Students English Language Learners (ELL) 10.8%
# 21 20 19 18 17 16 15
10
+ 10.2%
High Need Large Cities
Fiscal & Demographic Factors
Percentage Change in Aid, 2011-12 to 2014-15
School District Key Facts
Teacher Effectiveness2012-13
2013-14 Academic Performance2013-14 School Demographics% of Free & Reduced Price
Lunch Students (FRPL)
% Minority Students
86.4%
95.3%
Bennett High SchoolBuffalo City School District - Erie County
Need Resource Category
2014-15 Status
Has the School Been Failing Since 2005-06?
Number of Consecutive Years Failing Since 2005-06
Priority / Failing
Yes
Summary
Crystal Peoples-StokesTimothy Kennedy
Assembly District # 141Senate District # 63
21
State Avg. School3-8 Math 35.8% 8.6%3-8 ELA 31.4% 8.1%
Grad. Rate 76.4% N/A
Total School Enrollment, 2005-06 to 2013-142005-06 2006-07 2007-08 2008-09 2009-10 2010-11 2011-12 2012-13 2013-14
444 435 465 473 488 479 460 447 452
2011-12 Enacted School Aid $612,363,7764 2014-15 Enacted School Aid $675,091,8825 $ Change + $62,728,106 % Highly Effective 59%6 % Change + 10.2% % Effective 32%7 % Developing 5%
2014-15 Estimated Public Enrollment 41,749 % Ineffective 4%8 2014-15 Formula Based State Aid Per Pupil $16,1709
2012-13 Spending Per Pupil: All Sources (Census) $18,9712012-13 National Average (Census) $10,608
% Above National Average + 78.8%#
#
# % Free or Reduced Price Lunch (FRPL) Students 84.1%% Students English Language Learners (ELL) 10.8%
# 21 20 19 18 17 16 15
10
+ 10.2%
High Need Large Cities
Fiscal & Demographic Factors
Percentage Change in Aid, 2011-12 to 2014-15
School District Key Facts
Teacher Effectiveness2012-13
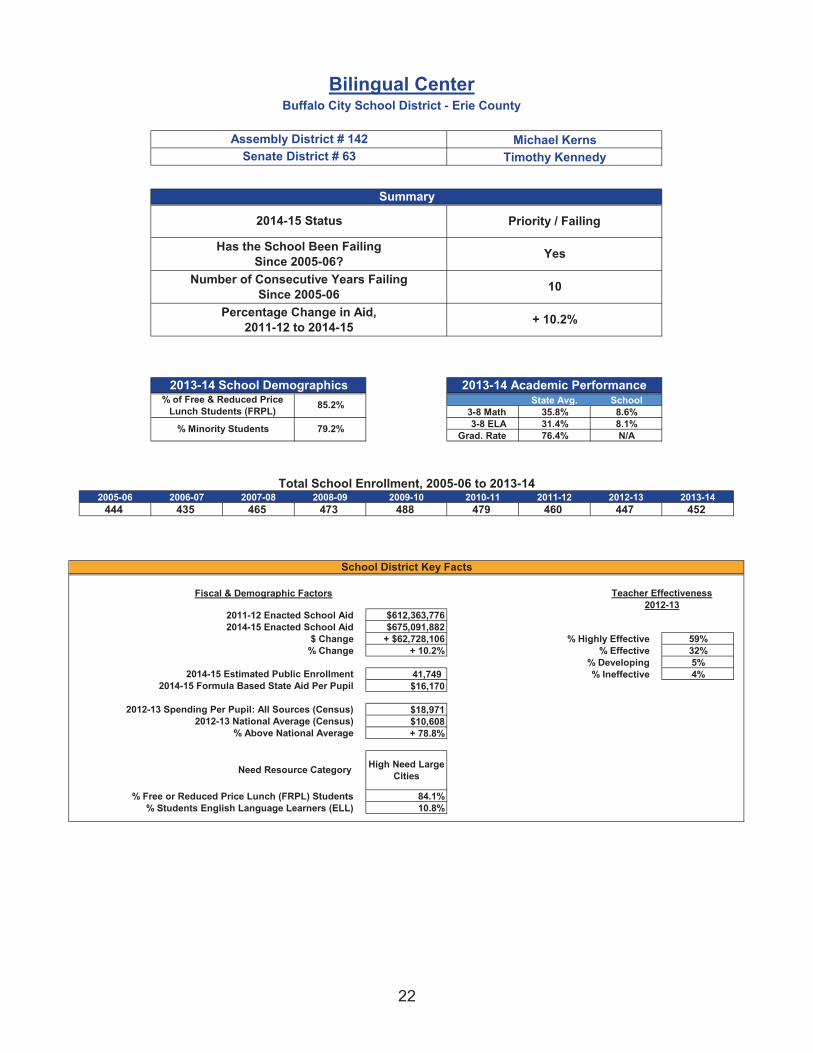
2013-14 Academic Performance2013-14 School Demographics% of Free & Reduced Price
Lunch Students (FRPL)
% Minority Students
85.2%
79.2%
Bilingual CenterBuffalo City School District - Erie County
Need Resource Category
2014-15 Status
Has the School Been Failing Since 2005-06?
Number of Consecutive Years Failing Since 2005-06
Priority / Failing
Yes
Summary
Michael KernsTimothy Kennedy
Assembly District # 142Senate District # 63
22

State Avg. School3-8 Math 35.8% 3.8%3-8 ELA 31.4% 3.9%
Grad. Rate 76.4% N/A
Total School Enrollment, 2005-06 to 2013-142005-06 2006-07 2007-08 2008-09 2009-10 2010-11 2011-12 2012-13 2013-14
675 672 654 570 510 535 516 526 538
2011-12 Enacted School Aid $612,363,7764 2014-15 Enacted School Aid $675,091,8825 $ Change + $62,728,106 % Highly Effective 59%6 % Change + 10.2% % Effective 32%7 % Developing 5%
2014-15 Estimated Public Enrollment 41,749 % Ineffective 4%8 2014-15 Formula Based State Aid Per Pupil $16,1709
2012-13 Spending Per Pupil: All Sources (Census) $18,9712012-13 National Average (Census) $10,608
% Above National Average + 78.8%#
#
# % Free or Reduced Price Lunch (FRPL) Students 84.1%% Students English Language Learners (ELL) 10.8%
# 21 20 19 18 17 16 15
10
+ 10.2%
High Need Large Cities
Fiscal & Demographic Factors
Percentage Change in Aid, 2011-12 to 2014-15
School District Key Facts
Teacher Effectiveness2012-13
2013-14 Academic Performance2013-14 School Demographics% of Free & Reduced Price
Lunch Students (FRPL)
% Minority Students
92.8%
90.5%
Buffalo Elementary School Of TechnologyBuffalo City School District - Erie County
Need Resource Category
2014-15 Status
Has the School Been Failing Since 2005-06?
Number of Consecutive Years Failing Since 2005-06
Priority / Failing
Yes
Summary
Crystal Peoples-StokesTimothy Kennedy
Assembly District # 141Senate District # 63
23

State Avg. School3-8 Math 35.8% 1.3%3-8 ELA 31.4% 2.9%
Grad. Rate 76.4% N/A
Total School Enrollment, 2005-06 to 2013-142005-06 2006-07 2007-08 2008-09 2009-10 2010-11 2011-12 2012-13 2013-14
615 645 582 594 570 574 505 459 433
2011-12 Enacted School Aid $612,363,7764 2014-15 Enacted School Aid $675,091,8825 $ Change + $62,728,106 % Highly Effective 59%6 % Change + 10.2% % Effective 32%7 % Developing 5%
2014-15 Estimated Public Enrollment 41,749 % Ineffective 4%8 2014-15 Formula Based State Aid Per Pupil $16,1709
2012-13 Spending Per Pupil: All Sources (Census) $18,9712012-13 National Average (Census) $10,608
% Above National Average + 78.8%#
#
# % Free or Reduced Price Lunch (FRPL) Students 84.1%% Students English Language Learners (ELL) 10.8%
# 21 20 19 18 17 16 15
4
+ 10.2%
High Need Large Cities
Fiscal & Demographic Factors
Percentage Change in Aid, 2011-12 to 2014-15
School District Key Facts
Teacher Effectiveness2012-13
2013-14 Academic Performance2013-14 School Demographics% of Free & Reduced Price
Lunch Students (FRPL)
% Minority Students
91.7%
97.8%
Build AcademyBuffalo City School District - Erie County
Need Resource Category
2014-15 Status
Has the School Been Failing Since 2005-06?
Number of Consecutive Years Failing Since 2005-06
Priority / Failing
No
Summary
Crystal Peoples-StokesTimothy Kennedy
Assembly District # 141Senate District # 63
24

State Avg. School3-8 Math 35.8% N/A3-8 ELA 31.4% N/A
Grad. Rate 76.4% 38.6%
Total School Enrollment, 2005-06 to 2013-142005-06 2006-07 2007-08 2008-09 2009-10 2010-11 2011-12 2012-13 2013-14
486 518 523 551 655 602 590 523 540
2011-12 Enacted School Aid $612,363,7764 2014-15 Enacted School Aid $675,091,8825 $ Change + $62,728,106 % Highly Effective 59%6 % Change + 10.2% % Effective 32%7 % Developing 5%
2014-15 Estimated Public Enrollment 41,749 % Ineffective 4%8 2014-15 Formula Based State Aid Per Pupil $16,1709
2012-13 Spending Per Pupil: All Sources (Census) $18,9712012-13 National Average (Census) $10,608
% Above National Average + 78.8%#
#
# % Free or Reduced Price Lunch (FRPL) Students 84.1%% Students English Language Learners (ELL) 10.8%
# 21 20 19 18 17 16 15
10
+ 10.2%
High Need Large Cities
Fiscal & Demographic Factors
Percentage Change in Aid, 2011-12 to 2014-15
School District Key Facts
Teacher Effectiveness2012-13
2013-14 Academic Performance2013-14 School Demographics% of Free & Reduced Price
Lunch Students (FRPL)
% Minority Students
81.1%
93.9%
Burgard Vocational High SchoolBuffalo City School District - Erie County
Need Resource Category
2014-15 Status
Has the School Been Failing Since 2005-06?
Number of Consecutive Years Failing Since 2005-06
Priority / Failing
Yes
Summary
Crystal Peoples-StokesTimothy Kennedy
Assembly District # 141Senate District # 63
25

State Avg. School3-8 Math 35.8% 2.3%3-8 ELA 31.4% 7.1%
Grad. Rate 76.4% N/A
Total School Enrollment, 2005-06 to 2013-142005-06 2006-07 2007-08 2008-09 2009-10 2010-11 2011-12 2012-13 2013-14
718 775 765 722 756 790 736 703 675
2011-12 Enacted School Aid $612,363,7764 2014-15 Enacted School Aid $675,091,8825 $ Change + $62,728,106 % Highly Effective 59%6 % Change + 10.2% % Effective 32%7 % Developing 5%
2014-15 Estimated Public Enrollment 41,749 % Ineffective 4%8 2014-15 Formula Based State Aid Per Pupil $16,1709
2012-13 Spending Per Pupil: All Sources (Census) $18,9712012-13 National Average (Census) $10,608
% Above National Average + 78.8%#
#
# % Free or Reduced Price Lunch (FRPL) Students 84.1%% Students English Language Learners (ELL) 10.8%
# 21 20 19 18 17 16 15
4
+ 10.2%
High Need Large Cities
Fiscal & Demographic Factors
Percentage Change in Aid, 2011-12 to 2014-15
School District Key Facts
Teacher Effectiveness2012-13
2013-14 Academic Performance2013-14 School Demographics% of Free & Reduced Price
Lunch Students (FRPL)
% Minority Students
86.2%
97.4%
Dr Lydia T Wright School Of ExcellenceBuffalo City School District - Erie County
Need Resource Category
2014-15 Status
Has the School Been Failing Since 2005-06?
Number of Consecutive Years Failing Since 2005-06
Priority / Failing
No
Summary
Crystal Peoples-StokesTimothy Kennedy
Assembly District # 141Senate District # 63
26

State Avg. School3-8 Math 35.8% 2.0%3-8 ELA 31.4% 2.3%
Grad. Rate 76.4% N/A
Total School Enrollment, 2005-06 to 2013-142005-06 2006-07 2007-08 2008-09 2009-10 2010-11 2011-12 2012-13 2013-14
777 794 811 813 770 676 679 618 583
2011-12 Enacted School Aid $612,363,7764 2014-15 Enacted School Aid $675,091,8825 $ Change + $62,728,106 % Highly Effective 59%6 % Change + 10.2% % Effective 32%7 % Developing 5%
2014-15 Estimated Public Enrollment 41,749 % Ineffective 4%8 2014-15 Formula Based State Aid Per Pupil $16,1709
2012-13 Spending Per Pupil: All Sources (Census) $18,9712012-13 National Average (Census) $10,608
% Above National Average + 78.8%#
#
# % Free or Reduced Price Lunch (FRPL) Students 84.1%% Students English Language Learners (ELL) 10.8%
# 21 20 19 18 17 16 15
10
+ 10.2%
High Need Large Cities
Fiscal & Demographic Factors
Percentage Change in Aid, 2011-12 to 2014-15
School District Key Facts
Teacher Effectiveness2012-13
2013-14 Academic Performance2013-14 School Demographics% of Free & Reduced Price
Lunch Students (FRPL)
% Minority Students
90.1%
98.7%
Dr Martin Luther King, Jr MulticulturalBuffalo City School District - Erie County
Need Resource Category
2014-15 Status
Has the School Been Failing Since 2005-06?
Number of Consecutive Years Failing Since 2005-06
Priority / Failing
Yes
Summary
Crystal Peoples-StokesTimothy Kennedy
Assembly District # 141Senate District # 63
27

State Avg. School3-8 Math 35.8% 5.8%3-8 ELA 31.4% 6.5%
Grad. Rate 76.4% N/A
Total School Enrollment, 2005-06 to 2013-142005-06 2006-07 2007-08 2008-09 2009-10 2010-11 2011-12 2012-13 2013-14
573 626 644 621 622 614 620 642 658
2011-12 Enacted School Aid $612,363,7764 2014-15 Enacted School Aid $675,091,8825 $ Change + $62,728,106 % Highly Effective 59%6 % Change + 10.2% % Effective 32%7 % Developing 5%
2014-15 Estimated Public Enrollment 41,749 % Ineffective 4%8 2014-15 Formula Based State Aid Per Pupil $16,1709
2012-13 Spending Per Pupil: All Sources (Census) $18,9712012-13 National Average (Census) $10,608
% Above National Average + 78.8%#
#
# % Free or Reduced Price Lunch (FRPL) Students 84.1%% Students English Language Learners (ELL) 10.8%
# 21 20 19 18 17 16 15
4
+ 10.2%
High Need Large Cities
Fiscal & Demographic Factors
Percentage Change in Aid, 2011-12 to 2014-15
School District Key Facts
Teacher Effectiveness2012-13
2013-14 Academic Performance2013-14 School Demographics% of Free & Reduced Price
Lunch Students (FRPL)
% Minority Students
84.3%
93.5%
D'Youville - Porter CampusBuffalo City School District - Erie County
Need Resource Category
2014-15 Status
Has the School Been Failing Since 2005-06?
Number of Consecutive Years Failing Since 2005-06
Priority / Failing
No
Summary
Sean RyanTimothy Kennedy
Assembly District # 149Senate District # 63
28

State Avg. School3-8 Math 35.8% N/A3-8 ELA 31.4% N/A
Grad. Rate 76.4% 38.9%
Total School Enrollment, 2005-06 to 2013-142005-06 2006-07 2007-08 2008-09 2009-10 2010-11 2011-12 2012-13 2013-14
663 701 680 714 721 610 524 388 390
2011-12 Enacted School Aid $612,363,7764 2014-15 Enacted School Aid $675,091,8825 $ Change + $62,728,106 % Highly Effective 59%6 % Change + 10.2% % Effective 32%7 % Developing 5%
2014-15 Estimated Public Enrollment 41,749 % Ineffective 4%8 2014-15 Formula Based State Aid Per Pupil $16,1709
2012-13 Spending Per Pupil: All Sources (Census) $18,9712012-13 National Average (Census) $10,608
% Above National Average + 78.8%#
#
# % Free or Reduced Price Lunch (FRPL) Students 84.1%% Students English Language Learners (ELL) 10.8%
# 21 20 19 18 17 16 15
5
+ 10.2%
High Need Large Cities
Fiscal & Demographic Factors
Percentage Change in Aid, 2011-12 to 2014-15
School District Key Facts
Teacher Effectiveness2012-13
2013-14 Academic Performance2013-14 School Demographics% of Free & Reduced Price
Lunch Students (FRPL)
% Minority Students
78.9%
97.7%
East High SchoolBuffalo City School District - Erie County
Need Resource Category
2014-15 Status
Has the School Been Failing Since 2005-06?
Number of Consecutive Years Failing Since 2005-06
Priority / Failing
No
Summary
Crystal Peoples-StokesTimothy Kennedy
Assembly District # 141Senate District # 63
29

State Avg. School3-8 Math 35.8% 8.4%3-8 ELA 31.4% 6.5%
Grad. Rate 76.4% N/A
Total School Enrollment, 2005-06 to 2013-142005-06 2006-07 2007-08 2008-09 2009-10 2010-11 2011-12 2012-13 2013-14
N/A 730 696 665 680 658 685 728 729
2011-12 Enacted School Aid $612,363,7764 2014-15 Enacted School Aid $675,091,8825 $ Change + $62,728,106 % Highly Effective 59%6 % Change + 10.2% % Effective 32%7 % Developing 5%
2014-15 Estimated Public Enrollment 41,749 % Ineffective 4%8 2014-15 Formula Based State Aid Per Pupil $16,1709
2012-13 Spending Per Pupil: All Sources (Census) $18,9712012-13 National Average (Census) $10,608
% Above National Average + 78.8%#
#
# % Free or Reduced Price Lunch (FRPL) Students 84.1%% Students English Language Learners (ELL) 10.8%
# 21 20 19 18 17 16 15
8
+ 10.2%
High Need Large Cities
Fiscal & Demographic Factors
Percentage Change in Aid, 2011-12 to 2014-15
School District Key Facts
Teacher Effectiveness2012-13
2013-14 Academic Performance2013-14 School Demographics% of Free & Reduced Price
Lunch Students (FRPL)
% Minority Students
85.3%
94.9%
Frank A Sedita School #30Buffalo City School District - Erie County
Need Resource Category
2014-15 Status
Has the School Been Failing Since 2005-06?
Number of Consecutive Years Failing Since 2005-06
Priority / Failing
No
Summary
Sean RyanTimothy Kennedy
Assembly District # 149Senate District # 63
30

State Avg. School3-8 Math 35.8% 1.1%3-8 ELA 31.4% 1.2%
Grad. Rate 76.4% N/A
Total School Enrollment, 2005-06 to 2013-142005-06 2006-07 2007-08 2008-09 2009-10 2010-11 2011-12 2012-13 2013-14
710 614 542 503 489 455 480 450 403
2011-12 Enacted School Aid $612,363,7764 2014-15 Enacted School Aid $675,091,8825 $ Change + $62,728,106 % Highly Effective 59%6 % Change + 10.2% % Effective 32%7 % Developing 5%
2014-15 Estimated Public Enrollment 41,749 % Ineffective 4%8 2014-15 Formula Based State Aid Per Pupil $16,1709
2012-13 Spending Per Pupil: All Sources (Census) $18,9712012-13 National Average (Census) $10,608
% Above National Average + 78.8%#
#
# % Free or Reduced Price Lunch (FRPL) Students 84.1%% Students English Language Learners (ELL) 10.8%
# 21 20 19 18 17 16 15
4
+ 10.2%
High Need Large Cities
Fiscal & Demographic Factors
Percentage Change in Aid, 2011-12 to 2014-15
School District Key Facts
Teacher Effectiveness2012-13
2013-14 Academic Performance2013-14 School Demographics% of Free & Reduced Price
Lunch Students (FRPL)
% Minority Students
93.8%
94.9%
Harriet Ross Tubman AcademyBuffalo City School District - Erie County
Need Resource Category
2014-15 Status
Has the School Been Failing Since 2005-06?
Number of Consecutive Years Failing Since 2005-06
Priority / Failing
No
Summary
Crystal Peoples-StokesTimothy Kennedy
Assembly District # 141Senate District # 63
31

State Avg. School3-8 Math 35.8% 3.2%3-8 ELA 31.4% 2.9%
Grad. Rate 76.4% N/A
Total School Enrollment, 2005-06 to 2013-142005-06 2006-07 2007-08 2008-09 2009-10 2010-11 2011-12 2012-13 2013-14
510 400 331 190 261 299 364 396 428
2011-12 Enacted School Aid $612,363,7764 2014-15 Enacted School Aid $675,091,8825 $ Change + $62,728,106 % Highly Effective 59%6 % Change + 10.2% % Effective 32%7 % Developing 5%
2014-15 Estimated Public Enrollment 41,749 % Ineffective 4%8 2014-15 Formula Based State Aid Per Pupil $16,1709
2012-13 Spending Per Pupil: All Sources (Census) $18,9712012-13 National Average (Census) $10,608
% Above National Average + 78.8%#
#
# % Free or Reduced Price Lunch (FRPL) Students 84.1%% Students English Language Learners (ELL) 10.8%
# 21 20 19 18 17 16 15
7
+ 10.2%
High Need Large Cities
Fiscal & Demographic Factors
Percentage Change in Aid, 2011-12 to 2014-15
School District Key Facts
Teacher Effectiveness2012-13
2013-14 Academic Performance2013-14 School Demographics% of Free & Reduced Price
Lunch Students (FRPL)
% Minority Students
94.3%
95.0%
Harvey Austin School #97Buffalo City School District - Erie County
Need Resource Category
2014-15 Status
Has the School Been Failing Since 2005-06?
Number of Consecutive Years Failing Since 2005-06
Priority / Failing
No
Summary
Crystal Peoples-StokesTimothy Kennedy
Assembly District # 141Senate District # 63
32

State Avg. School3-8 Math 35.8% 4.0%3-8 ELA 31.4% 2.7%
Grad. Rate 76.4% N/A
Total School Enrollment, 2005-06 to 2013-142005-06 2006-07 2007-08 2008-09 2009-10 2010-11 2011-12 2012-13 2013-14
494 410 426 380 556 574 607 646 664
2011-12 Enacted School Aid $612,363,7764 2014-15 Enacted School Aid $675,091,8825 $ Change + $62,728,106 % Highly Effective 59%6 % Change + 10.2% % Effective 32%7 % Developing 5%
2014-15 Estimated Public Enrollment 41,749 % Ineffective 4%8 2014-15 Formula Based State Aid Per Pupil $16,1709
2012-13 Spending Per Pupil: All Sources (Census) $18,9712012-13 National Average (Census) $10,608
% Above National Average + 78.8%#
#
# % Free or Reduced Price Lunch (FRPL) Students 84.1%% Students English Language Learners (ELL) 10.8%
# 21 20 19 18 17 16 15
10
+ 10.2%
High Need Large Cities
Fiscal & Demographic Factors
Percentage Change in Aid, 2011-12 to 2014-15
School District Key Facts
Teacher Effectiveness2012-13
2013-14 Academic Performance2013-14 School Demographics% of Free & Reduced Price
Lunch Students (FRPL)
% Minority Students
80.6%
95.4%
Herman Badillo Community SchoolBuffalo City School District - Erie County
Need Resource Category
2014-15 Status
Has the School Been Failing Since 2005-06?
Number of Consecutive Years Failing Since 2005-06
Priority / Failing
Yes
Summary
Sean RyanTimothy Kennedy
Assembly District # 149Senate District # 63
33

State Avg. School3-8 Math 35.8% 2.8%3-8 ELA 31.4% 4.7%
Grad. Rate 76.4% N/A
Total School Enrollment, 2005-06 to 2013-142005-06 2006-07 2007-08 2008-09 2009-10 2010-11 2011-12 2012-13 2013-14
600 610 615 596 530 533 508 494 441
2011-12 Enacted School Aid $612,363,7764 2014-15 Enacted School Aid $675,091,8825 $ Change + $62,728,106 % Highly Effective 59%6 % Change + 10.2% % Effective 32%7 % Developing 5%
2014-15 Estimated Public Enrollment 41,749 % Ineffective 4%8 2014-15 Formula Based State Aid Per Pupil $16,1709
2012-13 Spending Per Pupil: All Sources (Census) $18,9712012-13 National Average (Census) $10,608
% Above National Average + 78.8%#
#
# % Free or Reduced Price Lunch (FRPL) Students 84.1%% Students English Language Learners (ELL) 10.8%
# 21 20 19 18 17 16 15
4
+ 10.2%
High Need Large Cities
Fiscal & Demographic Factors
Percentage Change in Aid, 2011-12 to 2014-15
School District Key Facts
Teacher Effectiveness2012-13
2013-14 Academic Performance2013-14 School Demographics% of Free & Reduced Price
Lunch Students (FRPL)
% Minority Students
86.2%
97.4%
Highgate HeightsBuffalo City School District - Erie County
Need Resource Category
2014-15 Status
Has the School Been Failing Since 2005-06?
Number of Consecutive Years Failing Since 2005-06
Priority / Failing
No
Summary
Crystal Peoples-StokesTimothy Kennedy
Assembly District # 141Senate District # 63
34

State Avg. School3-8 Math 35.8% 6.5%3-8 ELA 31.4% 4.0%
Grad. Rate 76.4% 43.6%
Total School Enrollment, 2005-06 to 2013-142005-06 2006-07 2007-08 2008-09 2009-10 2010-11 2011-12 2012-13 2013-14
N/A N/A 127 265 436 431 495 521 523
2011-12 Enacted School Aid $612,363,7764 2014-15 Enacted School Aid $675,091,8825 $ Change + $62,728,106 % Highly Effective 59%6 % Change + 10.2% % Effective 32%7 % Developing 5%
2014-15 Estimated Public Enrollment 41,749 % Ineffective 4%8 2014-15 Formula Based State Aid Per Pupil $16,1709
2012-13 Spending Per Pupil: All Sources (Census) $18,9712012-13 National Average (Census) $10,608
% Above National Average + 78.8%#
#
# % Free or Reduced Price Lunch (FRPL) Students 84.1%% Students English Language Learners (ELL) 10.8%
# 21 20 19 18 17 16 15
4
+ 10.2%
High Need Large Cities
Fiscal & Demographic Factors
Percentage Change in Aid, 2011-12 to 2014-15
School District Key Facts
Teacher Effectiveness2012-13
2013-14 Academic Performance2013-14 School Demographics% of Free & Reduced Price
Lunch Students (FRPL)
% Minority Students
87.3%
92.9%
Inter Prep School - Grover ClevelandBuffalo City School District - Erie County
Need Resource Category
2014-15 Status
Has the School Been Failing Since 2005-06?
Number of Consecutive Years Failing Since 2005-06
Priority / Failing
No
Summary
Sean RyanTimothy Kennedy
Assembly District # 149Senate District # 63
35

State Avg. School3-8 Math 35.8% 4.5%3-8 ELA 31.4% 4.4%
Grad. Rate 76.4% 15.5%
Total School Enrollment, 2005-06 to 2013-142005-06 2006-07 2007-08 2008-09 2009-10 2010-11 2011-12 2012-13 2013-14
984 834 752 773 870 678 738 780 691
2011-12 Enacted School Aid $612,363,7764 2014-15 Enacted School Aid $675,091,8825 $ Change + $62,728,106 % Highly Effective 59%6 % Change + 10.2% % Effective 32%7 % Developing 5%
2014-15 Estimated Public Enrollment 41,749 % Ineffective 4%8 2014-15 Formula Based State Aid Per Pupil $16,1709
2012-13 Spending Per Pupil: All Sources (Census) $18,9712012-13 National Average (Census) $10,608
% Above National Average + 78.8%#
#
# % Free or Reduced Price Lunch (FRPL) Students 84.1%% Students English Language Learners (ELL) 10.8%
# 21 20 19 18 17 16 15
10
+ 10.2%
High Need Large Cities
Fiscal & Demographic Factors
Percentage Change in Aid, 2011-12 to 2014-15
School District Key Facts
Teacher Effectiveness2012-13
2013-14 Academic Performance2013-14 School Demographics% of Free & Reduced Price
Lunch Students (FRPL)
% Minority Students
76.5%
94.0%
Lafayette High SchoolBuffalo City School District - Erie County
Need Resource Category
2014-15 Status
Has the School Been Failing Since 2005-06?
Number of Consecutive Years Failing Since 2005-06
Priority / Failing
Yes
Summary
Sean RyanTimothy Kennedy
Assembly District # 149Senate District # 63
36

State Avg. School3-8 Math 35.8% N/A3-8 ELA 31.4% N/A
Grad. Rate 76.4% 64.7%
Total School Enrollment, 2005-06 to 2013-142005-06 2006-07 2007-08 2008-09 2009-10 2010-11 2011-12 2012-13 2013-141,152 1,124 1,123 1,185 1,150 1,098 1,080 985 967
2011-12 Enacted School Aid $612,363,7764 2014-15 Enacted School Aid $675,091,8825 $ Change + $62,728,106 % Highly Effective 59%6 % Change + 10.2% % Effective 32%7 % Developing 5%
2014-15 Estimated Public Enrollment 41,749 % Ineffective 4%8 2014-15 Formula Based State Aid Per Pupil $16,1709
2012-13 Spending Per Pupil: All Sources (Census) $18,9712012-13 National Average (Census) $10,608
% Above National Average + 78.8%#
#
# % Free or Reduced Price Lunch (FRPL) Students 84.1%% Students English Language Learners (ELL) 10.8%
# 21 20 19 18 17 16 15
4
+ 10.2%
High Need Large Cities
Fiscal & Demographic Factors
Percentage Change in Aid, 2011-12 to 2014-15
School District Key Facts
Teacher Effectiveness2012-13
2013-14 Academic Performance2013-14 School Demographics% of Free & Reduced Price
Lunch Students (FRPL)
% Minority Students
76.9%
85.7%
Mckinley Vocational High SchoolBuffalo City School District - Erie County
Need Resource Category
2014-15 Status
Has the School Been Failing Since 2005-06?
Number of Consecutive Years Failing Since 2005-06
Priority / Failing
No
Summary
Sean RyanMarc Panepinto
Assembly District # 149Senate District # 60
37

State Avg. School3-8 Math 35.8% 10.9%3-8 ELA 31.4% 8.0%
Grad. Rate 76.4% N/A
Total School Enrollment, 2005-06 to 2013-142005-06 2006-07 2007-08 2008-09 2009-10 2010-11 2011-12 2012-13 2013-14
505 495 481 466 434 366 338 351 366
2011-12 Enacted School Aid $612,363,7764 2014-15 Enacted School Aid $675,091,8825 $ Change + $62,728,106 % Highly Effective 59%6 % Change + 10.2% % Effective 32%7 % Developing 5%
2014-15 Estimated Public Enrollment 41,749 % Ineffective 4%8 2014-15 Formula Based State Aid Per Pupil $16,1709
2012-13 Spending Per Pupil: All Sources (Census) $18,9712012-13 National Average (Census) $10,608
% Above National Average + 78.8%#
#
# % Free or Reduced Price Lunch (FRPL) Students 84.1%% Students English Language Learners (ELL) 10.8%
# 21 20 19 18 17 16 15
10
+ 10.2%
High Need Large Cities
Fiscal & Demographic Factors
Percentage Change in Aid, 2011-12 to 2014-15
School District Key Facts
Teacher Effectiveness2012-13
2013-14 Academic Performance2013-14 School Demographics% of Free & Reduced Price
Lunch Students (FRPL)
% Minority Students
89.6%
92.6%
PS 17Buffalo City School District - Erie County
Need Resource Category
2014-15 Status
Has the School Been Failing Since 2005-06?
Number of Consecutive Years Failing Since 2005-06
Priority / Failing
Yes
Summary
Crystal Peoples-StokesMarc Panepinto
Assembly District # 141Senate District # 60
38

State Avg. School3-8 Math 35.8% 0.0%3-8 ELA 31.4% 0.6%
Grad. Rate 76.4% N/A
Total School Enrollment, 2005-06 to 2013-142005-06 2006-07 2007-08 2008-09 2009-10 2010-11 2011-12 2012-13 2013-14
629 623 569 540 532 528 491 503 467
2011-12 Enacted School Aid $612,363,7764 2014-15 Enacted School Aid $675,091,8825 $ Change + $62,728,106 % Highly Effective 59%6 % Change + 10.2% % Effective 32%7 % Developing 5%
2014-15 Estimated Public Enrollment 41,749 % Ineffective 4%8 2014-15 Formula Based State Aid Per Pupil $16,1709
2012-13 Spending Per Pupil: All Sources (Census) $18,9712012-13 National Average (Census) $10,608
% Above National Average + 78.8%#
#
# % Free or Reduced Price Lunch (FRPL) Students 84.1%% Students English Language Learners (ELL) 10.8%
# 21 20 19 18 17 16 15
10
+ 10.2%
High Need Large Cities
Fiscal & Demographic Factors
Percentage Change in Aid, 2011-12 to 2014-15
School District Key Facts
Teacher Effectiveness2012-13
2013-14 Academic Performance2013-14 School Demographics% of Free & Reduced Price
Lunch Students (FRPL)
% Minority Students
96.5%
95.9%
PS 37 Futures AcademyBuffalo City School District - Erie County
Need Resource Category
2014-15 Status
Has the School Been Failing Since 2005-06?
Number of Consecutive Years Failing Since 2005-06
Priority / Failing
Yes
Summary
Crystal Peoples-StokesTimothy Kennedy
Assembly District # 141Senate District # 63
39

State Avg. School3-8 Math 35.8% 4.3%3-8 ELA 31.4% 3.1%
Grad. Rate 76.4% N/A
Total School Enrollment, 2005-06 to 2013-142005-06 2006-07 2007-08 2008-09 2009-10 2010-11 2011-12 2012-13 2013-14
910 892 901 582 475 470 484 471 712
2011-12 Enacted School Aid $612,363,7764 2014-15 Enacted School Aid $675,091,8825 $ Change + $62,728,106 % Highly Effective 59%6 % Change + 10.2% % Effective 32%7 % Developing 5%
2014-15 Estimated Public Enrollment 41,749 % Ineffective 4%8 2014-15 Formula Based State Aid Per Pupil $16,1709
2012-13 Spending Per Pupil: All Sources (Census) $18,9712012-13 National Average (Census) $10,608
% Above National Average + 78.8%#
#
# % Free or Reduced Price Lunch (FRPL) Students 84.1%% Students English Language Learners (ELL) 10.8%
# 21 20 19 18 17 16 15
10
+ 10.2%
High Need Large Cities
Fiscal & Demographic Factors
Percentage Change in Aid, 2011-12 to 2014-15
School District Key Facts
Teacher Effectiveness2012-13
2013-14 Academic Performance2013-14 School Demographics% of Free & Reduced Price
Lunch Students (FRPL)
% Minority Students
92.1%
93.0%
PS 59 Dr Charles Drew Sci MagnetBuffalo City School District - Erie County
Need Resource Category
2014-15 Status
Has the School Been Failing Since 2005-06?
Number of Consecutive Years Failing Since 2005-06
Priority / Failing
Yes
Summary
Crystal Peoples-StokesTimothy Kennedy
Assembly District # 141Senate District # 63
40

State Avg. School3-8 Math 35.8% 3.1%3-8 ELA 31.4% 3.4%
Grad. Rate 76.4% N/A
Total School Enrollment, 2005-06 to 2013-142005-06 2006-07 2007-08 2008-09 2009-10 2010-11 2011-12 2012-13 2013-14
370 370 384 381 392 423 386 353 330
2011-12 Enacted School Aid $612,363,7764 2014-15 Enacted School Aid $675,091,8825 $ Change + $62,728,106 % Highly Effective 59%6 % Change + 10.2% % Effective 32%7 % Developing 5%
2014-15 Estimated Public Enrollment 41,749 % Ineffective 4%8 2014-15 Formula Based State Aid Per Pupil $16,1709
2012-13 Spending Per Pupil: All Sources (Census) $18,9712012-13 National Average (Census) $10,608
% Above National Average + 78.8%#
#
# % Free or Reduced Price Lunch (FRPL) Students 84.1%% Students English Language Learners (ELL) 10.8%
# 21 20 19 18 17 16 15
4
+ 10.2%
High Need Large Cities
Fiscal & Demographic Factors
Percentage Change in Aid, 2011-12 to 2014-15
School District Key Facts
Teacher Effectiveness2012-13
2013-14 Academic Performance2013-14 School Demographics% of Free & Reduced Price
Lunch Students (FRPL)
% Minority Students
76.6%
89.6%
PS 66 North Park AcademyBuffalo City School District - Erie County
Need Resource Category
2014-15 Status
Has the School Been Failing Since 2005-06?
Number of Consecutive Years Failing Since 2005-06
Priority / Failing
No
Summary
Crystal Peoples-StokesMarc Panepinto
Assembly District # 141Senate District # 60
41

State Avg. School3-8 Math 35.8% 5.0%3-8 ELA 31.4% 4.9%
Grad. Rate 76.4% N/A
Total School Enrollment, 2005-06 to 2013-142005-06 2006-07 2007-08 2008-09 2009-10 2010-11 2011-12 2012-13 2013-14
348 391 381 369 434 486 490 489 487
2011-12 Enacted School Aid $612,363,7764 2014-15 Enacted School Aid $675,091,8825 $ Change + $62,728,106 % Highly Effective 59%6 % Change + 10.2% % Effective 32%7 % Developing 5%
2014-15 Estimated Public Enrollment 41,749 % Ineffective 4%8 2014-15 Formula Based State Aid Per Pupil $16,1709
2012-13 Spending Per Pupil: All Sources (Census) $18,9712012-13 National Average (Census) $10,608
% Above National Average + 78.8%#
#
# % Free or Reduced Price Lunch (FRPL) Students 84.1%% Students English Language Learners (ELL) 10.8%
# 21 20 19 18 17 16 15
4
+ 10.2%
High Need Large Cities
Fiscal & Demographic Factors
Percentage Change in Aid, 2011-12 to 2014-15
School District Key Facts
Teacher Effectiveness2012-13
2013-14 Academic Performance2013-14 School Demographics% of Free & Reduced Price
Lunch Students (FRPL)
% Minority Students
82.2%
96.9%
PS 74 Hamlin Park Elementary SchoolBuffalo City School District - Erie County
Need Resource Category
2014-15 Status
Has the School Been Failing Since 2005-06?
Number of Consecutive Years Failing Since 2005-06
Priority / Failing
No
Summary
Crystal Peoples-StokesTimothy Kennedy
Assembly District # 141Senate District # 63
42

State Avg. School3-8 Math 35.8% N/A3-8 ELA 31.4% N/A
Grad. Rate 76.4% 16.4%
Total School Enrollment, 2005-06 to 2013-142005-06 2006-07 2007-08 2008-09 2009-10 2010-11 2011-12 2012-13 2013-141,210 1,220 1,070 732 794 762 760 751 768
2011-12 Enacted School Aid $612,363,7764 2014-15 Enacted School Aid $675,091,8825 $ Change + $62,728,106 % Highly Effective 59%6 % Change + 10.2% % Effective 32%7 % Developing 5%
2014-15 Estimated Public Enrollment 41,749 % Ineffective 4%8 2014-15 Formula Based State Aid Per Pupil $16,1709
2012-13 Spending Per Pupil: All Sources (Census) $18,9712012-13 National Average (Census) $10,608
% Above National Average + 78.8%#
#
# % Free or Reduced Price Lunch (FRPL) Students 84.1%% Students English Language Learners (ELL) 10.8%
# 21 20 19 18 17 16 15
10
+ 10.2%
High Need Large Cities
Fiscal & Demographic Factors
Percentage Change in Aid, 2011-12 to 2014-15
School District Key Facts
Teacher Effectiveness2012-13
2013-14 Academic Performance2013-14 School Demographics% of Free & Reduced Price
Lunch Students (FRPL)
% Minority Students
82.0%
87.7%
Riverside Institute Of TechnologyBuffalo City School District - Erie County
Need Resource Category
2014-15 Status
Has the School Been Failing Since 2005-06?
Number of Consecutive Years Failing Since 2005-06
Priority / Failing
Yes
Summary
Robin SchimmingerMarc Panepinto
Assembly District # 140Senate District # 60
43

State Avg. School3-8 Math 35.8% N/A3-8 ELA 31.4% N/A
Grad. Rate 76.4% 55.2%
Total School Enrollment, 2005-06 to 2013-142005-06 2006-07 2007-08 2008-09 2009-10 2010-11 2011-12 2012-13 2013-141,032 1,016 859 777 700 817 773 824 882
2011-12 Enacted School Aid $612,363,7764 2014-15 Enacted School Aid $675,091,8825 $ Change + $62,728,106 % Highly Effective 59%6 % Change + 10.2% % Effective 32%7 % Developing 5%
2014-15 Estimated Public Enrollment 41,749 % Ineffective 4%8 2014-15 Formula Based State Aid Per Pupil $16,1709
2012-13 Spending Per Pupil: All Sources (Census) $18,9712012-13 National Average (Census) $10,608
% Above National Average + 78.8%#
#
# % Free or Reduced Price Lunch (FRPL) Students 84.1%% Students English Language Learners (ELL) 10.8%
# 21 20 19 18 17 16 15
10
+ 10.2%
High Need Large Cities
Fiscal & Demographic Factors
Percentage Change in Aid, 2011-12 to 2014-15
School District Key Facts
Teacher Effectiveness2012-13
2013-14 Academic Performance2013-14 School Demographics% of Free & Reduced Price
Lunch Students (FRPL)
% Minority Students
68.9%
48.4%
South Park High SchoolBuffalo City School District - Erie County
Need Resource Category
2014-15 Status
Has the School Been Failing Since 2005-06?
Number of Consecutive Years Failing Since 2005-06
Priority / Failing
Yes
Summary
Michael KearnsTimothy Kennedy
Assembly District # 142Senate District # 63
44
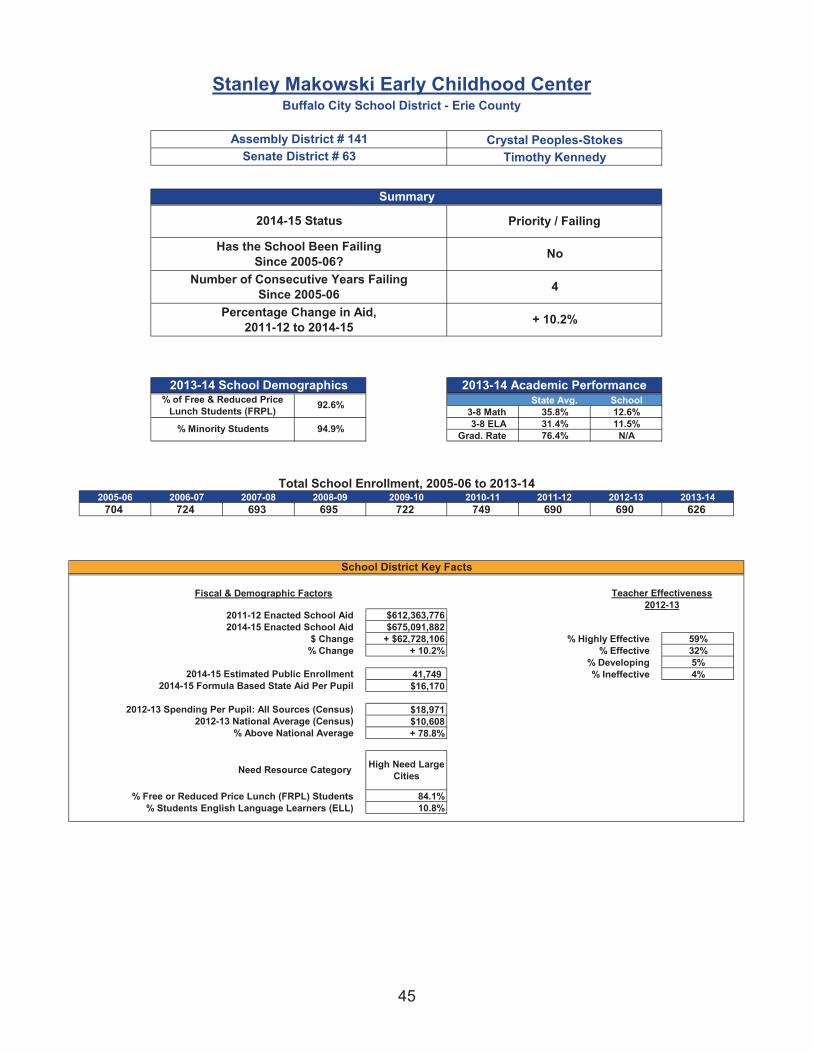
State Avg. School3-8 Math 35.8% 12.6%3-8 ELA 31.4% 11.5%
Grad. Rate 76.4% N/A
Total School Enrollment, 2005-06 to 2013-142005-06 2006-07 2007-08 2008-09 2009-10 2010-11 2011-12 2012-13 2013-14
704 724 693 695 722 749 690 690 626
2011-12 Enacted School Aid $612,363,7764 2014-15 Enacted School Aid $675,091,8825 $ Change + $62,728,106 % Highly Effective 59%6 % Change + 10.2% % Effective 32%7 % Developing 5%
2014-15 Estimated Public Enrollment 41,749 % Ineffective 4%8 2014-15 Formula Based State Aid Per Pupil $16,1709
2012-13 Spending Per Pupil: All Sources (Census) $18,9712012-13 National Average (Census) $10,608
% Above National Average + 78.8%#
#
# % Free or Reduced Price Lunch (FRPL) Students 84.1%% Students English Language Learners (ELL) 10.8%
# 21 20 19 18 17 16 15
4
+ 10.2%
High Need Large Cities
Fiscal & Demographic Factors
Percentage Change in Aid, 2011-12 to 2014-15
School District Key Facts
Teacher Effectiveness2012-13
2013-14 Academic Performance2013-14 School Demographics% of Free & Reduced Price
Lunch Students (FRPL)
% Minority Students
92.6%
94.9%
Stanley Makowski Early Childhood CenterBuffalo City School District - Erie County
Need Resource Category
2014-15 Status
Has the School Been Failing Since 2005-06?
Number of Consecutive Years Failing Since 2005-06
Priority / Failing
No
Summary
Crystal Peoples-StokesTimothy Kennedy
Assembly District # 141Senate District # 63
45

State Avg. School3-8 Math 35.8% 9.8%3-8 ELA 31.4% 6.2%
Grad. Rate 76.4% N/A
Total School Enrollment, 2005-06 to 2013-142005-06 2006-07 2007-08 2008-09 2009-10 2010-11 2011-12 2012-13 2013-14
771 827 815 830 839 881 839 837 830
2011-12 Enacted School Aid $612,363,7764 2014-15 Enacted School Aid $675,091,8825 $ Change + $62,728,106 % Highly Effective 59%6 % Change + 10.2% % Effective 32%7 % Developing 5%
2014-15 Estimated Public Enrollment 41,749 % Ineffective 4%8 2014-15 Formula Based State Aid Per Pupil $16,1709
2012-13 Spending Per Pupil: All Sources (Census) $18,9712012-13 National Average (Census) $10,608
% Above National Average + 78.8%#
#
# % Free or Reduced Price Lunch (FRPL) Students 84.1%% Students English Language Learners (ELL) 10.8%
# 21 20 19 18 17 16 15
10
+ 10.2%
High Need Large Cities
Fiscal & Demographic Factors
Percentage Change in Aid, 2011-12 to 2014-15
School District Key Facts
Teacher Effectiveness2012-13
2013-14 Academic Performance2013-14 School Demographics% of Free & Reduced Price
Lunch Students (FRPL)
% Minority Students
89.8%
87.8%
Waterfront SchoolBuffalo City School District - Erie County
Need Resource Category
2014-15 Status
Has the School Been Failing Since 2005-06?
Number of Consecutive Years Failing Since 2005-06
Priority / Failing
Yes
Summary
Sean RyanTimothy Kennedy
Assembly District # 149Senate District # 63
46

State Avg. School3-8 Math 35.8% 6.8%3-8 ELA 31.4% 5.8%
Grad. Rate 76.4% N/A
Total School Enrollment, 2005-06 to 2013-142005-06 2006-07 2007-08 2008-09 2009-10 2010-11 2011-12 2012-13 2013-14
505 519 459 397 446 506 592 688 764
2011-12 Enacted School Aid $612,363,7764 2014-15 Enacted School Aid $675,091,8825 $ Change + $62,728,106 % Highly Effective 59%6 % Change + 10.2% % Effective 32%7 % Developing 5%
2014-15 Estimated Public Enrollment 41,749 % Ineffective 4%8 2014-15 Formula Based State Aid Per Pupil $16,1709
2012-13 Spending Per Pupil: All Sources (Census) $18,9712012-13 National Average (Census) $10,608
% Above National Average + 78.8%#
#
# % Free or Reduced Price Lunch (FRPL) Students 84.1%% Students English Language Learners (ELL) 10.8%
# 21 20 19 18 17 16 15
10
+ 10.2%
High Need Large Cities
Fiscal & Demographic Factors
Percentage Change in Aid, 2011-12 to 2014-15
School District Key Facts
Teacher Effectiveness2012-13
2013-14 Academic Performance2013-14 School Demographics% of Free & Reduced Price
Lunch Students (FRPL)
% Minority Students
94.8%
86.2%
West Hertel Elementary SchoolBuffalo City School District - Erie County
Need Resource Category
2014-15 Status
Has the School Been Failing Since 2005-06?
Number of Consecutive Years Failing Since 2005-06
Priority / Failing
Yes
Summary
Sean RyanMarc Panepinto
Assembly District # 149Senate District # 60
47

Central Islip Union Free School District
48

State Avg. School3-8 Math 35.8% 11.7%3-8 ELA 31.4% 12.0%
Grad. Rate 76.4% N/A
Total School Enrollment, 2005-06 to 2013-142005-06 2006-07 2007-08 2008-09 2009-10 2010-11 2011-12 2012-13 2013-141,003 960 912 845 862 905 909 934 735
2011-12 Enacted School Aid $75,918,2004 2014-15 Enacted School Aid $91,172,9905 $ Change + $15,254,790 % Highly Effective 73%6 % Change + 20.1% % Effective 27%7 % Developing 0%
2014-15 Estimated Public Enrollment 6,993 % Ineffective 0%8 2014-15 Formula Based State Aid Per Pupil $13,0389
2012-13 Spending Per Pupil: All Sources (Census) $23,9092012-13 National Average (Census) $10,608
% Above National Average + 125.4%#
#
# % Free or Reduced Price Lunch (FRPL) Students 84.7%% Students English Language Learners (ELL) 25.2%
# 21 20 19 18 17 16 15
4
+ 20.1%
High Need Urban Suburban
Fiscal & Demographic Factors
Percentage Change in Aid, 2011-12 to 2014-15
School District Key Facts
Teacher Effectiveness2012-13
2013-14 Academic Performance2013-14 School Demographics% of Free & Reduced Price
Lunch Students (FRPL)
% Minority Students
80.5%
95.6%
Ralph Reed SchoolCentral Islip Union Free School District - Suffolk County
Need Resource Category
2014-15 Status
Has the School Been Failing Since 2005-06?
Number of Consecutive Years Failing Since 2005-06
Priority / Failing
No
Summary
Phil RamosThomas D. Croci
Assembly District # 6Senate District # 3
49

Hempstead Union Free School District
50

State Avg. School3-8 Math 35.8% 4.7%3-8 ELA 31.4% 7.3%
Grad. Rate 76.4% N/A
Total School Enrollment, 2005-06 to 2013-142005-06 2006-07 2007-08 2008-09 2009-10 2010-11 2011-12 2012-13 2013-141,322 1,327 1,207 1,178 1,152 1,202 1,239 1,313 1,394
2011-12 Enacted School Aid $87,708,5404 2014-15 Enacted School Aid $102,528,1365 $ Change + $14,819,596 % Highly Effective 4%6 % Change + 16.9% % Effective 58%7 % Developing 32%
2014-15 Estimated Public Enrollment 7,942 % Ineffective 6%8 2014-15 Formula Based State Aid Per Pupil $12,9109
2012-13 Spending Per Pupil: All Sources (Census) $25,5512012-13 National Average (Census) $10,608
% Above National Average + 140.9%#
#
# % Free or Reduced Price Lunch (FRPL) Students 86.4%% Students English Language Learners (ELL) 22.7%
# 21 20 19 18 17 16 15
4
+ 16.9%
High Need Urban Suburban
Fiscal & Demographic Factors
Percentage Change in Aid, 2011-12 to 2014-15
School District Key Facts
Teacher Effectiveness2012-13
2013-14 Academic Performance2013-14 School Demographics% of Free & Reduced Price
Lunch Students (FRPL)
% Minority Students
47.5%
99.8%
Alverta B Gray Schultz Middle SchoolHempstead Union Free School District - Nassau County
Need Resource Category
2014-15 Status
Has the School Been Failing Since 2005-06?
Number of Consecutive Years Failing Since 2005-06
Priority / Failing
No
Summary
Earlene HooperKemp Hannon
Assembly District # 18Senate District # 6
51

State Avg. School3-8 Math 35.8% N/A3-8 ELA 31.4% N/A
Grad. Rate 76.4% 42.6%
Total School Enrollment, 2005-06 to 2013-142005-06 2006-07 2007-08 2008-09 2009-10 2010-11 2011-12 2012-13 2013-141,679 1,791 1,578 1,669 1,635 1,666 932 570 1,894
2011-12 Enacted School Aid $87,708,5404 2014-15 Enacted School Aid $102,528,1365 $ Change + $14,819,596 % Highly Effective 4%6 % Change + 16.9% % Effective 58%7 % Developing 32%
2014-15 Estimated Public Enrollment 7,942 % Ineffective 6%8 2014-15 Formula Based State Aid Per Pupil $12,9109
2012-13 Spending Per Pupil: All Sources (Census) $25,5512012-13 National Average (Census) $10,608
% Above National Average + 140.9%#
#
# % Free or Reduced Price Lunch (FRPL) Students 86.4%% Students English Language Learners (ELL) 22.7%
# 21 20 19 18 17 16 15
10
+ 16.9%
High Need Urban Suburban
Fiscal & Demographic Factors
Percentage Change in Aid, 2011-12 to 2014-15
School District Key Facts
Teacher Effectiveness2012-13
2013-14 Academic Performance2013-14 School Demographics% of Free & Reduced Price
Lunch Students (FRPL)
% Minority Students
34.1%
100.0%
Hempstead High SchoolHempstead Union Free School District - Nassau County
Need Resource Category
2014-15 Status
Has the School Been Failing Since 2005-06?
Number of Consecutive Years Failing Since 2005-06
Priority / Failing
Yes
Summary
Earlene HooperKemp Hannon
Assembly District # 18Senate District # 6
52

Mt Vernon School District
53

State Avg. School3-8 Math 35.8% 5.6%3-8 ELA 31.4% 10.2%
Grad. Rate 76.4% N/A
Total School Enrollment, 2005-06 to 2013-142005-06 2006-07 2007-08 2008-09 2009-10 2010-11 2011-12 2012-13 2013-14
862 860 784 877 825 792 819 799 723
2011-12 Enacted School Aid $67,420,4844 2014-15 Enacted School Aid $78,739,7685 $ Change + $11,319,284 % Highly Effective 12%6 % Change + 16.8% % Effective 36%7 % Developing 33%
2014-15 Estimated Public Enrollment 8,778 % Ineffective 19%8 2014-15 Formula Based State Aid Per Pupil $8,9709
2012-13 Spending Per Pupil: All Sources (Census) $22,7082012-13 National Average (Census) $10,608
% Above National Average + 114.1%#
#
# % Free or Reduced Price Lunch (FRPL) Students 67.2%% Students English Language Learners (ELL) 9.1%
# 21 20 19 18 17 16 15
4
+ 16.8%
High Need Urban Suburban
Fiscal & Demographic Factors
Percentage Change in Aid, 2011-12 to 2014-15
School District Key Facts
Teacher Effectiveness2012-13
2013-14 Academic Performance2013-14 School Demographics% of Free & Reduced Price
Lunch Students (FRPL)
% Minority Students
68.6%
94.2%
Davis Middle SchoolMt Vernon School District - Westchester County
Need Resource Category
2014-15 Status
Has the School Been Failing Since 2005-06?
Number of Consecutive Years Failing Since 2005-06
Priority / Failing
No
Summary
J. Gary PretlowRuth Hassell-Thompson
Assembly District # 89Senate District # 36
54

Newburgh City School District
55

State Avg. School3-8 Math 35.8% 17.5%3-8 ELA 31.4% 13.7%
Grad. Rate 76.4% N/A
Total School Enrollment, 2005-06 to 2013-142005-06 2006-07 2007-08 2008-09 2009-10 2010-11 2011-12 2012-13 2013-141,177 1,130 1,043 1,043 1,076 1,050 1,056 1,001 961
2011-12 Enacted School Aid $117,356,0884 2014-15 Enacted School Aid $132,850,5415 $ Change + $15,494,453 % Highly Effective 36%6 % Change + 13.2% % Effective 56%7 % Developing 5%
2014-15 Estimated Public Enrollment 11,278 % Ineffective 3%8 2014-15 Formula Based State Aid Per Pupil $11,7809
2012-13 Spending Per Pupil: All Sources (Census) $19,8912012-13 National Average (Census) $10,608
% Above National Average + 87.5%#
#
# % Free or Reduced Price Lunch (FRPL) Students 70.8%% Students English Language Learners (ELL) 13.9%
# 21 20 19 18 17 16 15
10
+ 13.2%
High Need Urban Suburban
Fiscal & Demographic Factors
Percentage Change in Aid, 2011-12 to 2014-15
School District Key Facts
Teacher Effectiveness2012-13
2013-14 Academic Performance2013-14 School Demographics% of Free & Reduced Price
Lunch Students (FRPL)
% Minority Students
87.0%
86.3%
Temple Hill SchoolNewburgh City School District - Orange County
Need Resource Category
2014-15 Status
Has the School Been Failing Since 2005-06?
Number of Consecutive Years Failing Since 2005-06
Priority / Failing
Yes
Summary
James SkoufisWilliam J. Larkin Jr.
Assembly District # 99Senate District # 39
56

New York City School District
57

State Avg. School3-8 Math 35.8% 3.8%3-8 ELA 31.4% 3.3%
Grad. Rate 76.4% 39.3%
Total School Enrollment, 2005-06 to 2013-142005-06 2006-07 2007-08 2008-09 2009-10 2010-11 2011-12 2012-13 2013-14
294 434 518 472 511 450 423 389 314
2011-12 Enacted School Aid $7,662,346,0274 2014-15 Enacted School Aid $8,689,947,1545 $ Change + $1,027,601,127 % Highly Effective 9%6 % Change + 13.4% % Effective 83%7 % Developing 7%
2014-15 Estimated Public Enrollment 1,056,195 % Ineffective 1%8 2014-15 Formula Based State Aid Per Pupil $8,2289
2012-13 Spending Per Pupil: All Sources (Census) $20,2262012-13 National Average (Census) $10,608
% Above National Average + 90.7%#
#
# % Free or Reduced Price Lunch (FRPL) Students 76.1%% Students English Language Learners (ELL) 12.7%
# 21 20 19 18 17 16 15
7
+ 13.4%
High Need - New York City
Fiscal & Demographic Factors
Percentage Change in Aid, 2011-12 to 2014-15
School District Key Facts
Teacher Effectiveness 2013-14
2013-14 Academic Performance2013-14 School Demographics% of Free & Reduced Price
Lunch Students (FRPL)
% Minority Students
74.2%
98.3%
Henry Street SchoolNYC Geographic District # 1 - Manhattan County
Need Resource Category
2014-15 Status
Has the School Been Failing Since 2005-06?
Number of Consecutive Years Failing Since 2005-06
Priority / Failing
No
Summary
Sheldon SilverDaniel L. Squadron
Assembly District # 65Senate District # 26
58

State Avg. School3-8 Math 35.8% N/A3-8 ELA 31.4% N/A
Grad. Rate 76.4% 44.1%
Total School Enrollment, 2005-06 to 2013-142005-06 2006-07 2007-08 2008-09 2009-10 2010-11 2011-12 2012-13 2013-14
558 619 526 441 352 370 365 359 399
2011-12 Enacted School Aid $7,662,346,0274 2014-15 Enacted School Aid $8,689,947,1545 $ Change + $1,027,601,127 % Highly Effective 9%6 % Change + 13.4% % Effective 83%7 % Developing 7%
2014-15 Estimated Public Enrollment 1,056,195 % Ineffective 1%8 2014-15 Formula Based State Aid Per Pupil $8,2289
2012-13 Spending Per Pupil: All Sources (Census) $20,2262012-13 National Average (Census) $10,608
% Above National Average + 90.7%#
#
# % Free or Reduced Price Lunch (FRPL) Students 76.1%% Students English Language Learners (ELL) 12.7%
# 21 20 19 18 17 16 15
10
+ 13.4%
High Need - New York City
Fiscal & Demographic Factors
Percentage Change in Aid, 2011-12 to 2014-15
School District Key Facts
Teacher Effectiveness 2013-14
2013-14 Academic Performance2013-14 School Demographics% of Free & Reduced Price
Lunch Students (FRPL)
% Minority Students
87.9%
98.4%
Marta Valle Secondary SchoolNYC Geographic District # 1 - Manhattan County
Need Resource Category
2014-15 Status
Has the School Been Failing Since 2005-06?
Number of Consecutive Years Failing Since 2005-06
Priority / Failing
Yes
Summary
Sheldon SilverDaniel L. Squadron
Assembly District # 65Senate District # 26
59

State Avg. School3-8 Math 35.8% 9.7%3-8 ELA 31.4% 3.2%
Grad. Rate 76.4% N/A
Total School Enrollment, 2005-06 to 2013-142005-06 2006-07 2007-08 2008-09 2009-10 2010-11 2011-12 2012-13 2013-14
266 228 243 235 192 190 176 170 161
2011-12 Enacted School Aid $7,662,346,0274 2014-15 Enacted School Aid $8,689,947,1545 $ Change + $1,027,601,127 % Highly Effective 9%6 % Change + 13.4% % Effective 83%7 % Developing 7%
2014-15 Estimated Public Enrollment 1,056,195 % Ineffective 1%8 2014-15 Formula Based State Aid Per Pupil $8,2289
2012-13 Spending Per Pupil: All Sources (Census) $20,2262012-13 National Average (Census) $10,608
% Above National Average + 90.7%#
#
# % Free or Reduced Price Lunch (FRPL) Students 76.1%% Students English Language Learners (ELL) 12.7%
# 21 20 19 18 17 16 15
4
+ 13.4%
High Need - New York City
Fiscal & Demographic Factors
Percentage Change in Aid, 2011-12 to 2014-15
School District Key Facts
Teacher Effectiveness 2013-14
2013-14 Academic Performance2013-14 School Demographics% of Free & Reduced Price
Lunch Students (FRPL)
% Minority Students
0.0%
98.3%
PS 15 Roberto Clemente Elementary SchoolNYC Geographic District # 1 - Manhattan County
Need Resource Category
2014-15 Status
Has the School Been Failing Since 2005-06?
Number of Consecutive Years Failing Since 2005-06
Priority / Failing
No
Summary
Brian KavanaghDaniel L. Squadron
Assembly District # 74Senate District # 26
60

State Avg. School3-8 Math 35.8% 15.8%3-8 ELA 31.4% 18.7%
Grad. Rate 76.4% N/A
Total School Enrollment, 2005-06 to 2013-142005-06 2006-07 2007-08 2008-09 2009-10 2010-11 2011-12 2012-13 2013-14
161 256 279 252 178 116 115 118 99
2011-12 Enacted School Aid $7,662,346,0274 2014-15 Enacted School Aid $8,689,947,1545 $ Change + $1,027,601,127 % Highly Effective 9%6 % Change + 13.4% % Effective 83%7 % Developing 7%
2014-15 Estimated Public Enrollment 1,056,195 % Ineffective 1%8 2014-15 Formula Based State Aid Per Pupil $8,2289
2012-13 Spending Per Pupil: All Sources (Census) $20,2262012-13 National Average (Census) $10,608
% Above National Average + 90.7%#
#
# % Free or Reduced Price Lunch (FRPL) Students 76.1%% Students English Language Learners (ELL) 12.7%
# 21 20 19 18 17 16 15
4
+ 13.4%
High Need - New York City
Fiscal & Demographic Factors
Percentage Change in Aid, 2011-12 to 2014-15
School District Key Facts
Teacher Effectiveness 2013-14
2013-14 Academic Performance2013-14 School Demographics% of Free & Reduced Price
Lunch Students (FRPL)
% Minority Students
93.0%
100.0%
University Neighborhood Middle SchoolNYC Geographic District # 1 - Manhattan County
Need Resource Category
2014-15 Status
Has the School Been Failing Since 2005-06?
Number of Consecutive Years Failing Since 2005-06
Priority / Failing
No
Summary
Sheldon SilverDaniel L. Squadron
Assembly District # 65Senate District # 26
61

State Avg. School3-8 Math 35.8% N/A3-8 ELA 31.4% N/A
Grad. Rate 76.4% 50.7%
Total School Enrollment, 2005-06 to 2013-142005-06 2006-07 2007-08 2008-09 2009-10 2010-11 2011-12 2012-13 2013-141,955 1,843 1,855 1,790 1,835 1,707 1,428 1,194 715
2011-12 Enacted School Aid $7,662,346,0274 2014-15 Enacted School Aid $8,689,947,1545 $ Change + $1,027,601,127 % Highly Effective 9%6 % Change + 13.4% % Effective 83%7 % Developing 7%
2014-15 Estimated Public Enrollment 1,056,195 % Ineffective 1%8 2014-15 Formula Based State Aid Per Pupil $8,2289
2012-13 Spending Per Pupil: All Sources (Census) $20,2262012-13 National Average (Census) $10,608
% Above National Average + 90.7%#
#
# % Free or Reduced Price Lunch (FRPL) Students 76.1%% Students English Language Learners (ELL) 12.7%
# 21 20 19 18 17 16 15
10
+ 13.4%
High Need - New York City
Fiscal & Demographic Factors
Percentage Change in Aid, 2011-12 to 2014-15
School District Key Facts
Teacher Effectiveness 2013-14
2013-14 Academic Performance2013-14 School Demographics% of Free & Reduced Price
Lunch Students (FRPL)
% Minority Students
85.4%
97.7%
High School Of Graphic Communication ArtsNYC Geographic District # 2 - Manhattan County
Need Resource Category
2014-15 Status
Has the School Been Failing Since 2005-06?
Number of Consecutive Years Failing Since 2005-06
Priority / Failing
Yes
Summary
Richard GottfriedBrad Hoylman
Assembly District # 75Senate District # 27
62

State Avg. School3-8 Math 35.8% N/A3-8 ELA 31.4% N/A
Grad. Rate 76.4% 39.5%
Total School Enrollment, 2005-06 to 2013-142005-06 2006-07 2007-08 2008-09 2009-10 2010-11 2011-12 2012-13 2013-142,817 2,606 2,432 1,678 1,484 1,239 1,039 586 308
2011-12 Enacted School Aid $7,662,346,0274 2014-15 Enacted School Aid $8,689,947,1545 $ Change + $1,027,601,127 % Highly Effective 9%6 % Change + 13.4% % Effective 83%7 % Developing 7%
2014-15 Estimated Public Enrollment 1,056,195 % Ineffective 1%8 2014-15 Formula Based State Aid Per Pupil $8,2289
2012-13 Spending Per Pupil: All Sources (Census) $20,2262012-13 National Average (Census) $10,608
% Above National Average + 90.7%#
#
# % Free or Reduced Price Lunch (FRPL) Students 76.1%% Students English Language Learners (ELL) 12.7%
# 21 20 19 18 17 16 15
10
+ 13.4%
High Need - New York City
Fiscal & Demographic Factors
Percentage Change in Aid, 2011-12 to 2014-15
School District Key Facts
Teacher Effectiveness 2013-14
2013-14 Academic Performance2013-14 School Demographics% of Free & Reduced Price
Lunch Students (FRPL)
% Minority Students
100.0%
96.8%
Washington Irving High SchoolNYC Geographic District # 2 - Manhattan County
Need Resource Category
2014-15 Status
Has the School Been Failing Since 2005-06?
Number of Consecutive Years Failing Since 2005-06
Priority / Failing
Yes
Summary
Brian KavanaghLiz Krueger
Assembly District # 74Senate District # 28
63

State Avg. School3-8 Math 35.8% 6.0%3-8 ELA 31.4% 11.7%
Grad. Rate 76.4% 67.8%
Total School Enrollment, 2005-06 to 2013-142005-06 2006-07 2007-08 2008-09 2009-10 2010-11 2011-12 2012-13 2013-14
389 450 497 464 442 417 406 396 426
2011-12 Enacted School Aid $7,662,346,0274 2014-15 Enacted School Aid $8,689,947,1545 $ Change + $1,027,601,127 % Highly Effective 9%6 % Change + 13.4% % Effective 83%7 % Developing 7%
2014-15 Estimated Public Enrollment 1,056,195 % Ineffective 1%8 2014-15 Formula Based State Aid Per Pupil $8,2289
2012-13 Spending Per Pupil: All Sources (Census) $20,2262012-13 National Average (Census) $10,608
% Above National Average + 90.7%#
#
# % Free or Reduced Price Lunch (FRPL) Students 76.1%% Students English Language Learners (ELL) 12.7%
# 21 20 19 18 17 16 15
4
+ 13.4%
High Need - New York City
Fiscal & Demographic Factors
Percentage Change in Aid, 2011-12 to 2014-15
School District Key Facts
Teacher Effectiveness 2013-14
2013-14 Academic Performance2013-14 School Demographics% of Free & Reduced Price
Lunch Students (FRPL)
% Minority Students
77.8%
99.0%
Frederick Douglas Academy IINYC Geographic District # 3 - Manhattan County
Need Resource Category
2014-15 Status
Has the School Been Failing Since 2005-06?
Number of Consecutive Years Failing Since 2005-06
Priority / Failing
No
Summary
Keith L.T. WrightBill Perkins
Assembly District # 70Senate District # 30
64

State Avg. School3-8 Math 35.8% 18.0%3-8 ELA 31.4% 6.6%
Grad. Rate 76.4% N/A
Total School Enrollment, 2005-06 to 2013-142005-06 2006-07 2007-08 2008-09 2009-10 2010-11 2011-12 2012-13 2013-14
N/A N/A N/A 86 152 197 179 156 150
2011-12 Enacted School Aid $7,662,346,0274 2014-15 Enacted School Aid $8,689,947,1545 $ Change + $1,027,601,127 % Highly Effective 9%6 % Change + 13.4% % Effective 83%7 % Developing 7%
2014-15 Estimated Public Enrollment 1,056,195 % Ineffective 1%8 2014-15 Formula Based State Aid Per Pupil $8,2289
2012-13 Spending Per Pupil: All Sources (Census) $20,2262012-13 National Average (Census) $10,608
% Above National Average + 90.7%#
#
# % Free or Reduced Price Lunch (FRPL) Students 76.1%% Students English Language Learners (ELL) 12.7%
# 21 20 19 18 17 16 15
4
+ 13.4%
High Need - New York City
Fiscal & Demographic Factors
Percentage Change in Aid, 2011-12 to 2014-15
School District Key Facts
Teacher Effectiveness 2013-14
2013-14 Academic Performance2013-14 School Demographics% of Free & Reduced Price
Lunch Students (FRPL)
% Minority Students
87.8%
99.5%
Global Neighborhood Secondary SchoolNYC Geographic District # 4 - Manhattan County
Need Resource Category
2014-15 Status
Has the School Been Failing Since 2005-06?
Number of Consecutive Years Failing Since 2005-06
Priority / Failing
No
Summary
Robert RodriguezJose Serrano
Assembly District # 68Senate District # 29
65

State Avg. School3-8 Math 35.8% 4.4%3-8 ELA 31.4% 4.4%
Grad. Rate 76.4% N/A
Total School Enrollment, 2005-06 to 2013-142005-06 2006-07 2007-08 2008-09 2009-10 2010-11 2011-12 2012-13 2013-14
360 444 348 300 309 267 234 198 105
2011-12 Enacted School Aid $7,662,346,0274 2014-15 Enacted School Aid $8,689,947,1545 $ Change + $1,027,601,127 % Highly Effective 9%6 % Change + 13.4% % Effective 83%7 % Developing 7%
2014-15 Estimated Public Enrollment 1,056,195 % Ineffective 1%8 2014-15 Formula Based State Aid Per Pupil $8,2289
2012-13 Spending Per Pupil: All Sources (Census) $20,2262012-13 National Average (Census) $10,608
% Above National Average + 90.7%#
#
# % Free or Reduced Price Lunch (FRPL) Students 76.1%% Students English Language Learners (ELL) 12.7%
# 21 20 19 18 17 16 15
4
+ 13.4%
High Need - New York City
Fiscal & Demographic Factors
Percentage Change in Aid, 2011-12 to 2014-15
School District Key Facts
Teacher Effectiveness 2013-14
2013-14 Academic Performance2013-14 School Demographics% of Free & Reduced Price
Lunch Students (FRPL)
% Minority Students
73.4%
99.6%
JHS 13 Jackie RobinsonNYC Geographic District # 4 - Manhattan County
Need Resource Category
2014-15 Status
Has the School Been Failing Since 2005-06?
Number of Consecutive Years Failing Since 2005-06
Priority / Failing
No
Summary
Robert RodriguezBill Perkins
Assembly District # 68Senate District # 30
66
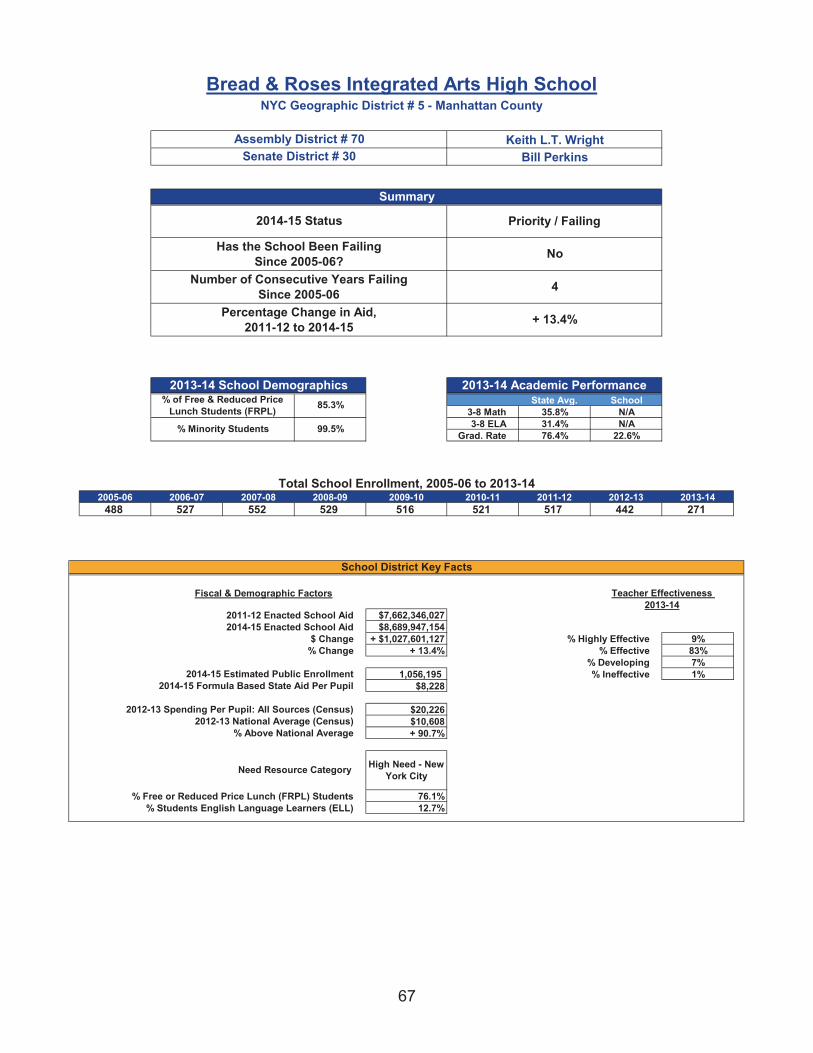
State Avg. School3-8 Math 35.8% N/A3-8 ELA 31.4% N/A
Grad. Rate 76.4% 22.6%
Total School Enrollment, 2005-06 to 2013-142005-06 2006-07 2007-08 2008-09 2009-10 2010-11 2011-12 2012-13 2013-14
488 527 552 529 516 521 517 442 271
2011-12 Enacted School Aid $7,662,346,0274 2014-15 Enacted School Aid $8,689,947,1545 $ Change + $1,027,601,127 % Highly Effective 9%6 % Change + 13.4% % Effective 83%7 % Developing 7%
2014-15 Estimated Public Enrollment 1,056,195 % Ineffective 1%8 2014-15 Formula Based State Aid Per Pupil $8,2289
2012-13 Spending Per Pupil: All Sources (Census) $20,2262012-13 National Average (Census) $10,608
% Above National Average + 90.7%#
#
# % Free or Reduced Price Lunch (FRPL) Students 76.1%% Students English Language Learners (ELL) 12.7%
# 21 20 19 18 17 16 15
4
+ 13.4%
High Need - New York City
Fiscal & Demographic Factors
Percentage Change in Aid, 2011-12 to 2014-15
School District Key Facts
Teacher Effectiveness 2013-14
2013-14 Academic Performance2013-14 School Demographics% of Free & Reduced Price
Lunch Students (FRPL)
% Minority Students
85.3%
99.5%
Bread & Roses Integrated Arts High SchoolNYC Geographic District # 5 - Manhattan County
Need Resource Category
2014-15 Status
Has the School Been Failing Since 2005-06?
Number of Consecutive Years Failing Since 2005-06
Priority / Failing
No
Summary
Keith L.T. WrightBill Perkins
Assembly District # 70Senate District # 30
67

State Avg. School3-8 Math 35.8% 4.4%3-8 ELA 31.4% 8.1%
Grad. Rate 76.4% N/A
Total School Enrollment, 2005-06 to 2013-142005-06 2006-07 2007-08 2008-09 2009-10 2010-11 2011-12 2012-13 2013-14
654 554 538 501 571 662 622 640 538
2011-12 Enacted School Aid $7,662,346,0274 2014-15 Enacted School Aid $8,689,947,1545 $ Change + $1,027,601,127 % Highly Effective 9%6 % Change + 13.4% % Effective 83%7 % Developing 7%
2014-15 Estimated Public Enrollment 1,056,195 % Ineffective 1%8 2014-15 Formula Based State Aid Per Pupil $8,2289
2012-13 Spending Per Pupil: All Sources (Census) $20,2262012-13 National Average (Census) $10,608
% Above National Average + 90.7%#
#
# % Free or Reduced Price Lunch (FRPL) Students 76.1%% Students English Language Learners (ELL) 12.7%
# 21 20 19 18 17 16 15
4
+ 13.4%
High Need - New York City
Fiscal & Demographic Factors
Percentage Change in Aid, 2011-12 to 2014-15
School District Key Facts
Teacher Effectiveness 2013-14
2013-14 Academic Performance2013-14 School Demographics% of Free & Reduced Price
Lunch Students (FRPL)
% Minority Students
68.6%
98.5%
PS 123 Mahalia JacksonNYC Geographic District # 5 - Manhattan County
Need Resource Category
2014-15 Status
Has the School Been Failing Since 2005-06?
Number of Consecutive Years Failing Since 2005-06
Priority / Failing
No
Summary
Keith L.T. WrightBill Perkins
Assembly District # 70Senate District # 30
68

State Avg. School3-8 Math 35.8% 8.1%3-8 ELA 31.4% 11.7%
Grad. Rate 76.4% 58.2%
Total School Enrollment, 2005-06 to 2013-142005-06 2006-07 2007-08 2008-09 2009-10 2010-11 2011-12 2012-13 2013-14
N/A 155 268 343 432 458 520 539 596
2011-12 Enacted School Aid $7,662,346,0274 2014-15 Enacted School Aid $8,689,947,1545 $ Change + $1,027,601,127 % Highly Effective 9%6 % Change + 13.4% % Effective 83%7 % Developing 7%
2014-15 Estimated Public Enrollment 1,056,195 % Ineffective 1%8 2014-15 Formula Based State Aid Per Pupil $8,2289
2012-13 Spending Per Pupil: All Sources (Census) $20,2262012-13 National Average (Census) $10,608
% Above National Average + 90.7%#
#
# % Free or Reduced Price Lunch (FRPL) Students 76.1%% Students English Language Learners (ELL) 12.7%
# 21 20 19 18 17 16 15
4
+ 13.4%
High Need - New York City
Fiscal & Demographic Factors
Percentage Change in Aid, 2011-12 to 2014-15
School District Key Facts
Teacher Effectiveness 2013-14
2013-14 Academic Performance2013-14 School Demographics% of Free & Reduced Price
Lunch Students (FRPL)
% Minority Students
80.8%
99.8%
Community Health Academy Of The HeightsNYC Geographic District # 6 - Manhattan County
Need Resource Category
2014-15 Status
Has the School Been Failing Since 2005-06?
Number of Consecutive Years Failing Since 2005-06
Priority / Failing
No
Summary
Herman FarrellAdriano Espaillat
Assembly District # 71Senate District # 31
69

State Avg. School3-8 Math 35.8% N/A3-8 ELA 31.4% N/A
Grad. Rate 76.4% 47.4%
Total School Enrollment, 2005-06 to 2013-142005-06 2006-07 2007-08 2008-09 2009-10 2010-11 2011-12 2012-13 2013-141,285 1,258 1,203 1,180 1,100 955 719 499 393
2011-12 Enacted School Aid $7,662,346,0274 2014-15 Enacted School Aid $8,689,947,1545 $ Change + $1,027,601,127 % Highly Effective 9%6 % Change + 13.4% % Effective 83%7 % Developing 7%
2014-15 Estimated Public Enrollment 1,056,195 % Ineffective 1%8 2014-15 Formula Based State Aid Per Pupil $8,2289
2012-13 Spending Per Pupil: All Sources (Census) $20,2262012-13 National Average (Census) $10,608
% Above National Average + 90.7%#
#
# % Free or Reduced Price Lunch (FRPL) Students 76.1%% Students English Language Learners (ELL) 12.7%
# 21 20 19 18 17 16 15
10
+ 13.4%
High Need - New York City
Fiscal & Demographic Factors
Percentage Change in Aid, 2011-12 to 2014-15
School District Key Facts
Teacher Effectiveness 2013-14
2013-14 Academic Performance2013-14 School Demographics% of Free & Reduced Price
Lunch Students (FRPL)
% Minority Students
91.4%
99.2%
Alfred E Smith Career & Technical Education High SchoolNYC Geographic District # 7 - Bronx County
Need Resource Category
2014-15 Status
Has the School Been Failing Since 2005-06?
Number of Consecutive Years Failing Since 2005-06
Priority / Failing
Yes
Summary
Carmen ArroyoJose Serrano
Assembly District # 84Senate District # 29
70

State Avg. School3-8 Math 35.8% N/A3-8 ELA 31.4% N/A
Grad. Rate 76.4% 40.8%
Total School Enrollment, 2005-06 to 2013-142005-06 2006-07 2007-08 2008-09 2009-10 2010-11 2011-12 2012-13 2013-14
420 470 482 491 459 394 311 239 178
2011-12 Enacted School Aid $7,662,346,0274 2014-15 Enacted School Aid $8,689,947,1545 $ Change + $1,027,601,127 % Highly Effective 9%6 % Change + 13.4% % Effective 83%7 % Developing 7%
2014-15 Estimated Public Enrollment 1,056,195 % Ineffective 1%8 2014-15 Formula Based State Aid Per Pupil $8,2289
2012-13 Spending Per Pupil: All Sources (Census) $20,2262012-13 National Average (Census) $10,608
% Above National Average + 90.7%#
#
# % Free or Reduced Price Lunch (FRPL) Students 76.1%% Students English Language Learners (ELL) 12.7%
# 21 20 19 18 17 16 15
4
+ 13.4%
High Need - New York City
Fiscal & Demographic Factors
Percentage Change in Aid, 2011-12 to 2014-15
School District Key Facts
Teacher Effectiveness 2013-14
2013-14 Academic Performance2013-14 School Demographics% of Free & Reduced Price
Lunch Students (FRPL)
% Minority Students
94.4%
99.2%
Foreign Language Academy Of Global StudiesNYC Geographic District # 7 - Bronx County
Need Resource Category
2014-15 Status
Has the School Been Failing Since 2005-06?
Number of Consecutive Years Failing Since 2005-06
Priority / Failing
No
Summary
Carmen ArroyoJose Serrano
Assembly District # 84Senate District # 29
71

State Avg. School3-8 Math 35.8% 6.3%3-8 ELA 31.4% 4.4%
Grad. Rate 76.4% N/A
Total School Enrollment, 2005-06 to 2013-142005-06 2006-07 2007-08 2008-09 2009-10 2010-11 2011-12 2012-13 2013-141,168 1,040 961 897 835 731 570 435 390
2011-12 Enacted School Aid $7,662,346,0274 2014-15 Enacted School Aid $8,689,947,1545 $ Change + $1,027,601,127 % Highly Effective 9%6 % Change + 13.4% % Effective 83%7 % Developing 7%
2014-15 Estimated Public Enrollment 1,056,195 % Ineffective 1%8 2014-15 Formula Based State Aid Per Pupil $8,2289
2012-13 Spending Per Pupil: All Sources (Census) $20,2262012-13 National Average (Census) $10,608
% Above National Average + 90.7%#
#
# % Free or Reduced Price Lunch (FRPL) Students 76.1%% Students English Language Learners (ELL) 12.7%
# 21 20 19 18 17 16 15
10
+ 13.4%
High Need - New York City
Fiscal & Demographic Factors
Percentage Change in Aid, 2011-12 to 2014-15
School District Key Facts
Teacher Effectiveness 2013-14
2013-14 Academic Performance2013-14 School Demographics% of Free & Reduced Price
Lunch Students (FRPL)
% Minority Students
76.1%
99.8%
JHS 162 Lola Rodriguez De TioNYC Geographic District # 7 - Bronx County
Need Resource Category
2014-15 Status
Has the School Been Failing Since 2005-06?
Number of Consecutive Years Failing Since 2005-06
Priority / Failing
Yes
Summary
Carmen ArroyoRuben Diaz
Assembly District # 84Senate District # 32
72

State Avg. School3-8 Math 35.8% 0.0%3-8 ELA 31.4% 1.1%
Grad. Rate 76.4% N/A
Total School Enrollment, 2005-06 to 2013-142005-06 2006-07 2007-08 2008-09 2009-10 2010-11 2011-12 2012-13 2013-14
562 528 431 359 296 291 279 294 173
2011-12 Enacted School Aid $7,662,346,0274 2014-15 Enacted School Aid $8,689,947,1545 $ Change + $1,027,601,127 % Highly Effective 9%6 % Change + 13.4% % Effective 83%7 % Developing 7%
2014-15 Estimated Public Enrollment 1,056,195 % Ineffective 1%8 2014-15 Formula Based State Aid Per Pupil $8,2289
2012-13 Spending Per Pupil: All Sources (Census) $20,2262012-13 National Average (Census) $10,608
% Above National Average + 90.7%#
#
# % Free or Reduced Price Lunch (FRPL) Students 76.1%% Students English Language Learners (ELL) 12.7%
# 21 20 19 18 17 16 15
10
+ 13.4%
High Need - New York City
Fiscal & Demographic Factors
Percentage Change in Aid, 2011-12 to 2014-15
School District Key Facts
Teacher Effectiveness 2013-14
2013-14 Academic Performance2013-14 School Demographics% of Free & Reduced Price
Lunch Students (FRPL)
% Minority Students
95.3%
99.6%
MS 203NYC Geographic District # 7 - Bronx County
Need Resource Category
2014-15 Status
Has the School Been Failing Since 2005-06?
Number of Consecutive Years Failing Since 2005-06
Priority / Failing
Yes
Summary
Carmen ArroyoJose Serrano
Assembly District # 84Senate District # 29
73

State Avg. School3-8 Math 35.8% 6.1%3-8 ELA 31.4% 4.3%
Grad. Rate 76.4% N/A
Total School Enrollment, 2005-06 to 2013-142005-06 2006-07 2007-08 2008-09 2009-10 2010-11 2011-12 2012-13 2013-14
496 400 344 356 347 382 373 348 330
2011-12 Enacted School Aid $7,662,346,0274 2014-15 Enacted School Aid $8,689,947,1545 $ Change + $1,027,601,127 % Highly Effective 9%6 % Change + 13.4% % Effective 83%7 % Developing 7%
2014-15 Estimated Public Enrollment 1,056,195 % Ineffective 1%8 2014-15 Formula Based State Aid Per Pupil $8,2289
2012-13 Spending Per Pupil: All Sources (Census) $20,2262012-13 National Average (Census) $10,608
% Above National Average + 90.7%#
#
# % Free or Reduced Price Lunch (FRPL) Students 76.1%% Students English Language Learners (ELL) 12.7%
# 21 20 19 18 17 16 15
10
+ 13.4%
High Need - New York City
Fiscal & Demographic Factors
Percentage Change in Aid, 2011-12 to 2014-15
School District Key Facts
Teacher Effectiveness 2013-14
2013-14 Academic Performance2013-14 School Demographics% of Free & Reduced Price
Lunch Students (FRPL)
% Minority Students
94.5%
98.7%
MS 224NYC Geographic District # 7 - Bronx County
Need Resource Category
2014-15 Status
Has the School Been Failing Since 2005-06?
Number of Consecutive Years Failing Since 2005-06
Priority / Failing
Yes
Summary
Carmen ArroyoJose Serrano
Assembly District # 84Senate District # 29
74

State Avg. School3-8 Math 35.8% N/A3-8 ELA 31.4% N/A
Grad. Rate 76.4% 50.7%
Total School Enrollment, 2005-06 to 2013-142005-06 2006-07 2007-08 2008-09 2009-10 2010-11 2011-12 2012-13 2013-14
336 326 335 321 313 345 385 431 461
2011-12 Enacted School Aid $7,662,346,0274 2014-15 Enacted School Aid $8,689,947,1545 $ Change + $1,027,601,127 % Highly Effective 9%6 % Change + 13.4% % Effective 83%7 % Developing 7%
2014-15 Estimated Public Enrollment 1,056,195 % Ineffective 1%8 2014-15 Formula Based State Aid Per Pupil $8,2289
2012-13 Spending Per Pupil: All Sources (Census) $20,2262012-13 National Average (Census) $10,608
% Above National Average + 90.7%#
#
# % Free or Reduced Price Lunch (FRPL) Students 76.1%% Students English Language Learners (ELL) 12.7%
# 21 20 19 18 17 16 15
7
+ 13.4%
High Need - New York City
Fiscal & Demographic Factors
Percentage Change in Aid, 2011-12 to 2014-15
School District Key Facts
Teacher Effectiveness 2013-14
2013-14 Academic Performance2013-14 School Demographics% of Free & Reduced Price
Lunch Students (FRPL)
% Minority Students
95.1%
99.7%
New Explorers High SchoolNYC Geographic District # 7 - Bronx County
Need Resource Category
2014-15 Status
Has the School Been Failing Since 2005-06?
Number of Consecutive Years Failing Since 2005-06
Priority / Failing
No
Summary
Michael BlakeJose Serrano
Assembly District # 79Senate District # 29
75

State Avg. School3-8 Math 35.8% 10.2%3-8 ELA 31.4% 6.0%
Grad. Rate 76.4% N/A
Total School Enrollment, 2005-06 to 2013-142005-06 2006-07 2007-08 2008-09 2009-10 2010-11 2011-12 2012-13 2013-14
N/A N/A N/A 557 574 572 567 539 231
2011-12 Enacted School Aid $7,662,346,0274 2014-15 Enacted School Aid $8,689,947,1545 $ Change + $1,027,601,127 % Highly Effective 9%6 % Change + 13.4% % Effective 83%7 % Developing 7%
2014-15 Estimated Public Enrollment 1,056,195 % Ineffective 1%8 2014-15 Formula Based State Aid Per Pupil $8,2289
2012-13 Spending Per Pupil: All Sources (Census) $20,2262012-13 National Average (Census) $10,608
% Above National Average + 90.7%#
#
# % Free or Reduced Price Lunch (FRPL) Students 76.1%% Students English Language Learners (ELL) 12.7%
# 21 20 19 18 17 16 15
4
+ 13.4%
High Need - New York City
Fiscal & Demographic Factors
Percentage Change in Aid, 2011-12 to 2014-15
School District Key Facts
Teacher Effectiveness 2013-14
2013-14 Academic Performance2013-14 School Demographics% of Free & Reduced Price
Lunch Students (FRPL)
% Minority Students
92.2%
98.9%
Performance SchoolNYC Geographic District # 7 - Bronx County
Need Resource Category
2014-15 Status
Has the School Been Failing Since 2005-06?
Number of Consecutive Years Failing Since 2005-06
Priority / Failing
No
Summary
Michael BlakeJose Serrano
Assembly District # 79Senate District # 29
76

State Avg. School3-8 Math 35.8% N/A3-8 ELA 31.4% N/A
Grad. Rate 76.4% 30.8%
Total School Enrollment, 2005-06 to 2013-142005-06 2006-07 2007-08 2008-09 2009-10 2010-11 2011-12 2012-13 2013-141,533 1,537 1,504 1,302 1,101 831 659 402 236
2011-12 Enacted School Aid $7,662,346,0274 2014-15 Enacted School Aid $8,689,947,1545 $ Change + $1,027,601,127 % Highly Effective 9%6 % Change + 13.4% % Effective 83%7 % Developing 7%
2014-15 Estimated Public Enrollment 1,056,195 % Ineffective 1%8 2014-15 Formula Based State Aid Per Pupil $8,2289
2012-13 Spending Per Pupil: All Sources (Census) $20,2262012-13 National Average (Census) $10,608
% Above National Average + 90.7%#
#
# % Free or Reduced Price Lunch (FRPL) Students 76.1%% Students English Language Learners (ELL) 12.7%
# 21 20 19 18 17 16 15
6
+ 13.4%
High Need - New York City
Fiscal & Demographic Factors
Percentage Change in Aid, 2011-12 to 2014-15
School District Key Facts
Teacher Effectiveness 2013-14
2013-14 Academic Performance2013-14 School Demographics% of Free & Reduced Price
Lunch Students (FRPL)
% Minority Students
91.2%
99.4%
Samuel Gompers Career & Technical Education High SchoolNYC Geographic District # 7 - Bronx County
Need Resource Category
2014-15 Status
Has the School Been Failing Since 2005-06?
Number of Consecutive Years Failing Since 2005-06
Priority / Failing
No
Summary
Carmen ArroyoJose Serrano
Assembly District # 84Senate District # 29
77

State Avg. School3-8 Math 35.8% 9.4%3-8 ELA 31.4% 3.7%
Grad. Rate 76.4% N/A
Total School Enrollment, 2005-06 to 2013-142005-06 2006-07 2007-08 2008-09 2009-10 2010-11 2011-12 2012-13 2013-14
N/A N/A N/A 263 257 260 262 282 280
2011-12 Enacted School Aid $7,662,346,0274 2014-15 Enacted School Aid $8,689,947,1545 $ Change + $1,027,601,127 % Highly Effective 9%6 % Change + 13.4% % Effective 83%7 % Developing 7%
2014-15 Estimated Public Enrollment 1,056,195 % Ineffective 1%8 2014-15 Formula Based State Aid Per Pupil $8,2289
2012-13 Spending Per Pupil: All Sources (Census) $20,2262012-13 National Average (Census) $10,608
% Above National Average + 90.7%#
#
# % Free or Reduced Price Lunch (FRPL) Students 76.1%% Students English Language Learners (ELL) 12.7%
# 21 20 19 18 17 16 15
4
+ 13.4%
High Need - New York City
Fiscal & Demographic Factors
Percentage Change in Aid, 2011-12 to 2014-15
School District Key Facts
Teacher Effectiveness 2013-14
2013-14 Academic Performance2013-14 School Demographics% of Free & Reduced Price
Lunch Students (FRPL)
% Minority Students
98.1%
96.9%
Young Leaders Elementary SchoolNYC Geographic District # 7 - Bronx County
Need Resource Category
2014-15 Status
Has the School Been Failing Since 2005-06?
Number of Consecutive Years Failing Since 2005-06
Priority / Failing
No
Summary
Carmen ArroyoJose Serrano
Assembly District # 84Senate District # 29
78

State Avg. School3-8 Math 35.8% N/A3-8 ELA 31.4% N/A
Grad. Rate 76.4% 34.9%
Total School Enrollment, 2005-06 to 2013-142005-06 2006-07 2007-08 2008-09 2009-10 2010-11 2011-12 2012-13 2013-14
291 354 409 465 468 451 437 423 347
2011-12 Enacted School Aid $7,662,346,0274 2014-15 Enacted School Aid $8,689,947,1545 $ Change + $1,027,601,127 % Highly Effective 9%6 % Change + 13.4% % Effective 83%7 % Developing 7%
2014-15 Estimated Public Enrollment 1,056,195 % Ineffective 1%8 2014-15 Formula Based State Aid Per Pupil $8,2289
2012-13 Spending Per Pupil: All Sources (Census) $20,2262012-13 National Average (Census) $10,608
% Above National Average + 90.7%#
#
# % Free or Reduced Price Lunch (FRPL) Students 76.1%% Students English Language Learners (ELL) 12.7%
# 21 20 19 18 17 16 15
8
+ 13.4%
High Need - New York City
Fiscal & Demographic Factors
Percentage Change in Aid, 2011-12 to 2014-15
School District Key Facts
Teacher Effectiveness 2013-14
2013-14 Academic Performance2013-14 School Demographics% of Free & Reduced Price
Lunch Students (FRPL)
% Minority Students
78.5%
99.3%
Banana Kelly High SchoolNYC Geographic District # 8 - Bronx County
Need Resource Category
2014-15 Status
Has the School Been Failing Since 2005-06?
Number of Consecutive Years Failing Since 2005-06
Priority / Failing
No
Summary
Marcos CrespoRuben Diaz
Assembly District # 85Senate District # 32
79

State Avg. School3-8 Math 35.8% N/A3-8 ELA 31.4% N/A
Grad. Rate 76.4% 47.6%
Total School Enrollment, 2005-06 to 2013-142005-06 2006-07 2007-08 2008-09 2009-10 2010-11 2011-12 2012-13 2013-14
N/A 4,286 4,322 4,095 4,122 3,945 3,599 2,813 2,057
2011-12 Enacted School Aid $7,662,346,0274 2014-15 Enacted School Aid $8,689,947,1545 $ Change + $1,027,601,127 % Highly Effective 9%6 % Change + 13.4% % Effective 83%7 % Developing 7%
2014-15 Estimated Public Enrollment 1,056,195 % Ineffective 1%8 2014-15 Formula Based State Aid Per Pupil $8,2289
2012-13 Spending Per Pupil: All Sources (Census) $20,2262012-13 National Average (Census) $10,608
% Above National Average + 90.7%#
#
# % Free or Reduced Price Lunch (FRPL) Students 76.1%% Students English Language Learners (ELL) 12.7%
# 21 20 19 18 17 16 15
10
+ 13.4%
High Need - New York City
Fiscal & Demographic Factors
Percentage Change in Aid, 2011-12 to 2014-15
School District Key Facts
Teacher Effectiveness 2013-14
2013-14 Academic Performance2013-14 School Demographics% of Free & Reduced Price
Lunch Students (FRPL)
% Minority Students
5.4%
91.2%
Herbert H Lehman High SchoolNYC Geographic District # 8 - Bronx County
Need Resource Category
2014-15 Status
Has the School Been Failing Since 2005-06?
Number of Consecutive Years Failing Since 2005-06
Priority / Failing
Yes
Summary
Michael BenedettoJeffrey Klein
Assembly District # 82Senate District # 34
80

State Avg. School3-8 Math 35.8% N/A3-8 ELA 31.4% N/A
Grad. Rate 76.4% 37.7%
Total School Enrollment, 2005-06 to 2013-142005-06 2006-07 2007-08 2008-09 2009-10 2010-11 2011-12 2012-13 2013-141,753 1,808 1,720 1,488 1,279 1,010 715 484 293
2011-12 Enacted School Aid $7,662,346,0274 2014-15 Enacted School Aid $8,689,947,1545 $ Change + $1,027,601,127 % Highly Effective 9%6 % Change + 13.4% % Effective 83%7 % Developing 7%
2014-15 Estimated Public Enrollment 1,056,195 % Ineffective 1%8 2014-15 Formula Based State Aid Per Pupil $8,2289
2012-13 Spending Per Pupil: All Sources (Census) $20,2262012-13 National Average (Census) $10,608
% Above National Average + 90.7%#
#
# % Free or Reduced Price Lunch (FRPL) Students 76.1%% Students English Language Learners (ELL) 12.7%
# 21 20 19 18 17 16 15
10
+ 13.4%
High Need - New York City
Fiscal & Demographic Factors
Percentage Change in Aid, 2011-12 to 2014-15
School District Key Facts
Teacher Effectiveness 2013-14
2013-14 Academic Performance2013-14 School Demographics% of Free & Reduced Price
Lunch Students (FRPL)
% Minority Students
90.5%
99.8%
Jane Addams HS For Academic CareersNYC Geographic District # 8 - Bronx County
Need Resource Category
2014-15 Status
Has the School Been Failing Since 2005-06?
Number of Consecutive Years Failing Since 2005-06
Priority / Failing
Yes
Summary
Michael BlakeRuben Diaz
Assembly District # 79Senate District # 32
81

State Avg. School3-8 Math 35.8% 1.6%3-8 ELA 31.4% 4.7%
Grad. Rate 76.4% N/A
Total School Enrollment, 2005-06 to 2013-142005-06 2006-07 2007-08 2008-09 2009-10 2010-11 2011-12 2012-13 2013-14
489 431 359 373 326 338 325 278 224
2011-12 Enacted School Aid $7,662,346,0274 2014-15 Enacted School Aid $8,689,947,1545 $ Change + $1,027,601,127 % Highly Effective 9%6 % Change + 13.4% % Effective 83%7 % Developing 7%
2014-15 Estimated Public Enrollment 1,056,195 % Ineffective 1%8 2014-15 Formula Based State Aid Per Pupil $8,2289
2012-13 Spending Per Pupil: All Sources (Census) $20,2262012-13 National Average (Census) $10,608
% Above National Average + 90.7%#
#
# % Free or Reduced Price Lunch (FRPL) Students 76.1%% Students English Language Learners (ELL) 12.7%
# 21 20 19 18 17 16 15
4
+ 13.4%
High Need - New York City
Fiscal & Demographic Factors
Percentage Change in Aid, 2011-12 to 2014-15
School District Key Facts
Teacher Effectiveness 2013-14
2013-14 Academic Performance2013-14 School Demographics% of Free & Reduced Price
Lunch Students (FRPL)
% Minority Students
85.8%
100.0%
MS 301 Paul L DunbarNYC Geographic District # 8 - Bronx County
Need Resource Category
2014-15 Status
Has the School Been Failing Since 2005-06?
Number of Consecutive Years Failing Since 2005-06
Priority / Failing
No
Summary
Michael BlakeRuben Diaz
Assembly District # 79Senate District # 32
82

State Avg. School3-8 Math 35.8% 10.6%3-8 ELA 31.4% 12.3%
Grad. Rate 76.4% N/A
Total School Enrollment, 2005-06 to 2013-142005-06 2006-07 2007-08 2008-09 2009-10 2010-11 2011-12 2012-13 2013-14
611 564 525 529 534 493 505 471 477
2011-12 Enacted School Aid $7,662,346,0274 2014-15 Enacted School Aid $8,689,947,1545 $ Change + $1,027,601,127 % Highly Effective 9%6 % Change + 13.4% % Effective 83%7 % Developing 7%
2014-15 Estimated Public Enrollment 1,056,195 % Ineffective 1%8 2014-15 Formula Based State Aid Per Pupil $8,2289
2012-13 Spending Per Pupil: All Sources (Census) $20,2262012-13 National Average (Census) $10,608
% Above National Average + 90.7%#
#
# % Free or Reduced Price Lunch (FRPL) Students 76.1%% Students English Language Learners (ELL) 12.7%
# 21 20 19 18 17 16 15
4
+ 13.4%
High Need - New York City
Fiscal & Demographic Factors
Percentage Change in Aid, 2011-12 to 2014-15
School District Key Facts
Teacher Effectiveness 2013-14
2013-14 Academic Performance2013-14 School Demographics% of Free & Reduced Price
Lunch Students (FRPL)
% Minority Students
83.4%
99.6%
PS 107NYC Geographic District # 8 - Bronx County
Need Resource Category
2014-15 Status
Has the School Been Failing Since 2005-06?
Number of Consecutive Years Failing Since 2005-06
Priority / Failing
No
Summary
Marcos CrespoJeffrey Klein
Assembly District # 85Senate District # 34
83

State Avg. School3-8 Math 35.8% 2.0%3-8 ELA 31.4% 6.0%
Grad. Rate 76.4% N/A
Total School Enrollment, 2005-06 to 2013-142005-06 2006-07 2007-08 2008-09 2009-10 2010-11 2011-12 2012-13 2013-14
N/A N/A 125 328 438 428 323 308 278
2011-12 Enacted School Aid $7,662,346,0274 2014-15 Enacted School Aid $8,689,947,1545 $ Change + $1,027,601,127 % Highly Effective 9%6 % Change + 13.4% % Effective 83%7 % Developing 7%
2014-15 Estimated Public Enrollment 1,056,195 % Ineffective 1%8 2014-15 Formula Based State Aid Per Pupil $8,2289
2012-13 Spending Per Pupil: All Sources (Census) $20,2262012-13 National Average (Census) $10,608
% Above National Average + 90.7%#
#
# % Free or Reduced Price Lunch (FRPL) Students 76.1%% Students English Language Learners (ELL) 12.7%
# 21 20 19 18 17 16 15
4
+ 13.4%
High Need - New York City
Fiscal & Demographic Factors
Percentage Change in Aid, 2011-12 to 2014-15
School District Key Facts
Teacher Effectiveness 2013-14
2013-14 Academic Performance2013-14 School Demographics% of Free & Reduced Price
Lunch Students (FRPL)
% Minority Students
93.8%
99.4%
The Bronx Mathematics Prep SchoolNYC Geographic District # 8 - Bronx County
Need Resource Category
2014-15 Status
Has the School Been Failing Since 2005-06?
Number of Consecutive Years Failing Since 2005-06
Priority / Failing
No
Summary
Marcos CrespoJeffrey Klein
Assembly District # 85Senate District # 34
84

State Avg. School3-8 Math 35.8% 3.6%3-8 ELA 31.4% 3.5%
Grad. Rate 76.4% N/A
Total School Enrollment, 2005-06 to 2013-142005-06 2006-07 2007-08 2008-09 2009-10 2010-11 2011-12 2012-13 2013-14
N/A N/A N/A 390 399 406 387 411 356
2011-12 Enacted School Aid $7,662,346,0274 2014-15 Enacted School Aid $8,689,947,1545 $ Change + $1,027,601,127 % Highly Effective 9%6 % Change + 13.4% % Effective 83%7 % Developing 7%
2014-15 Estimated Public Enrollment 1,056,195 % Ineffective 1%8 2014-15 Formula Based State Aid Per Pupil $8,2289
2012-13 Spending Per Pupil: All Sources (Census) $20,2262012-13 National Average (Census) $10,608
% Above National Average + 90.7%#
#
# % Free or Reduced Price Lunch (FRPL) Students 76.1%% Students English Language Learners (ELL) 12.7%
# 21 20 19 18 17 16 15
4
+ 13.4%
High Need - New York City
Fiscal & Demographic Factors
Percentage Change in Aid, 2011-12 to 2014-15
School District Key Facts
Teacher Effectiveness 2013-14
2013-14 Academic Performance2013-14 School Demographics% of Free & Reduced Price
Lunch Students (FRPL)
% Minority Students
93.6%
99.0%
The Hunts Point SchoolNYC Geographic District # 8 - Bronx County
Need Resource Category
2014-15 Status
Has the School Been Failing Since 2005-06?
Number of Consecutive Years Failing Since 2005-06
Priority / Failing
No
Summary
Carmen ArroyoRuben Diaz
Assembly District # 84Senate District # 32
85

State Avg. School3-8 Math 35.8% N/A3-8 ELA 31.4% N/A
Grad. Rate 76.4% 37.7%
Total School Enrollment, 2005-06 to 2013-142005-06 2006-07 2007-08 2008-09 2009-10 2010-11 2011-12 2012-13 2013-14
482 487 521 468 445 439 398 372 352
2011-12 Enacted School Aid $7,662,346,0274 2014-15 Enacted School Aid $8,689,947,1545 $ Change + $1,027,601,127 % Highly Effective 9%6 % Change + 13.4% % Effective 83%7 % Developing 7%
2014-15 Estimated Public Enrollment 1,056,195 % Ineffective 1%8 2014-15 Formula Based State Aid Per Pupil $8,2289
2012-13 Spending Per Pupil: All Sources (Census) $20,2262012-13 National Average (Census) $10,608
% Above National Average + 90.7%#
#
# % Free or Reduced Price Lunch (FRPL) Students 76.1%% Students English Language Learners (ELL) 12.7%
# 21 20 19 18 17 16 15
5
+ 13.4%
High Need - New York City
Fiscal & Demographic Factors
Percentage Change in Aid, 2011-12 to 2014-15
School District Key Facts
Teacher Effectiveness 2013-14
2013-14 Academic Performance2013-14 School Demographics% of Free & Reduced Price
Lunch Students (FRPL)
% Minority Students
81.2%
99.7%
Bronx High School Of BusinessNYC Geographic District # 9 - Bronx County
Need Resource Category
2014-15 Status
Has the School Been Failing Since 2005-06?
Number of Consecutive Years Failing Since 2005-06
Priority / Failing
No
Summary
Latoya JoynerGustavo Rivera
Assembly District # 77Senate District # 33
86

State Avg. School3-8 Math 35.8% N/A3-8 ELA 31.4% N/A
Grad. Rate 76.4% 40.2%
Total School Enrollment, 2005-06 to 2013-142005-06 2006-07 2007-08 2008-09 2009-10 2010-11 2011-12 2012-13 2013-14
N/A 114 216 301 366 348 348 311 346
2011-12 Enacted School Aid $7,662,346,0274 2014-15 Enacted School Aid $8,689,947,1545 $ Change + $1,027,601,127 % Highly Effective 9%6 % Change + 13.4% % Effective 83%7 % Developing 7%
2014-15 Estimated Public Enrollment 1,056,195 % Ineffective 1%8 2014-15 Formula Based State Aid Per Pupil $8,2289
2012-13 Spending Per Pupil: All Sources (Census) $20,2262012-13 National Average (Census) $10,608
% Above National Average + 90.7%#
#
# % Free or Reduced Price Lunch (FRPL) Students 76.1%% Students English Language Learners (ELL) 12.7%
# 21 20 19 18 17 16 15
6
+ 13.4%
High Need - New York City
Fiscal & Demographic Factors
Percentage Change in Aid, 2011-12 to 2014-15
School District Key Facts
Teacher Effectiveness 2013-14
2013-14 Academic Performance2013-14 School Demographics% of Free & Reduced Price
Lunch Students (FRPL)
% Minority Students
83.0%
100.0%
Dreamyard Preparatory SchoolNYC Geographic District # 9 - Bronx County
Need Resource Category
2014-15 Status
Has the School Been Failing Since 2005-06?
Number of Consecutive Years Failing Since 2005-06
Priority / Failing
No
Summary
Latoya JoynerGustavo Rivera
Assembly District # 77Senate District # 33
87

State Avg. School3-8 Math 35.8% 5.4%3-8 ELA 31.4% 5.0%
Grad. Rate 76.4% N/A
Total School Enrollment, 2005-06 to 2013-142005-06 2006-07 2007-08 2008-09 2009-10 2010-11 2011-12 2012-13 2013-141,097 1,080 922 884 802 772 710 666 635
2011-12 Enacted School Aid $7,662,346,0274 2014-15 Enacted School Aid $8,689,947,1545 $ Change + $1,027,601,127 % Highly Effective 9%6 % Change + 13.4% % Effective 83%7 % Developing 7%
2014-15 Estimated Public Enrollment 1,056,195 % Ineffective 1%8 2014-15 Formula Based State Aid Per Pupil $8,2289
2012-13 Spending Per Pupil: All Sources (Census) $20,2262012-13 National Average (Census) $10,608
% Above National Average + 90.7%#
#
# % Free or Reduced Price Lunch (FRPL) Students 76.1%% Students English Language Learners (ELL) 12.7%
# 21 20 19 18 17 16 15
10
+ 13.4%
High Need - New York City
Fiscal & Demographic Factors
Percentage Change in Aid, 2011-12 to 2014-15
School District Key Facts
Teacher Effectiveness 2013-14
2013-14 Academic Performance2013-14 School Demographics% of Free & Reduced Price
Lunch Students (FRPL)
% Minority Students
90.4%
99.6%
IS 117 Joseph H WadeNYC Geographic District # 9 - Bronx County
Need Resource Category
2014-15 Status
Has the School Been Failing Since 2005-06?
Number of Consecutive Years Failing Since 2005-06
Priority / Failing
Yes
Summary
Victor PichardoGustavo Rivera
Assembly District # 86Senate District # 33
88
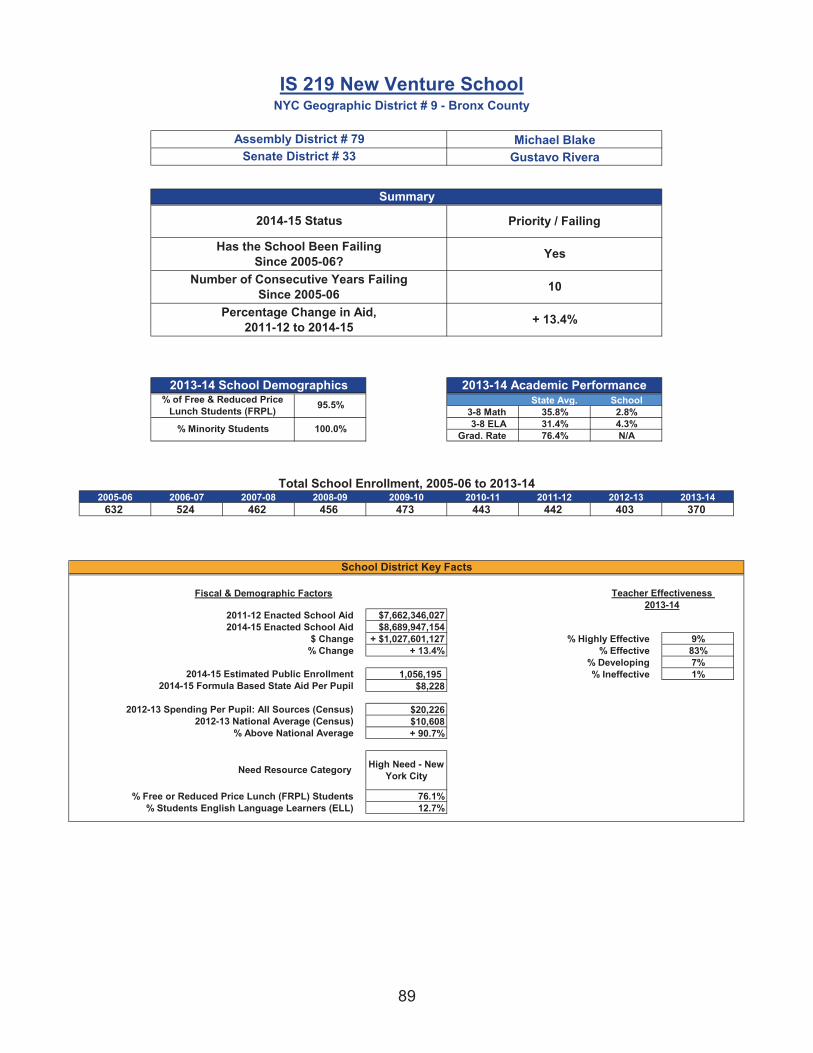
State Avg. School3-8 Math 35.8% 2.8%3-8 ELA 31.4% 4.3%
Grad. Rate 76.4% N/A
Total School Enrollment, 2005-06 to 2013-142005-06 2006-07 2007-08 2008-09 2009-10 2010-11 2011-12 2012-13 2013-14
632 524 462 456 473 443 442 403 370
2011-12 Enacted School Aid $7,662,346,0274 2014-15 Enacted School Aid $8,689,947,1545 $ Change + $1,027,601,127 % Highly Effective 9%6 % Change + 13.4% % Effective 83%7 % Developing 7%
2014-15 Estimated Public Enrollment 1,056,195 % Ineffective 1%8 2014-15 Formula Based State Aid Per Pupil $8,2289
2012-13 Spending Per Pupil: All Sources (Census) $20,2262012-13 National Average (Census) $10,608
% Above National Average + 90.7%#
#
# % Free or Reduced Price Lunch (FRPL) Students 76.1%% Students English Language Learners (ELL) 12.7%
# 21 20 19 18 17 16 15
10
+ 13.4%
High Need - New York City
Fiscal & Demographic Factors
Percentage Change in Aid, 2011-12 to 2014-15
School District Key Facts
Teacher Effectiveness 2013-14
2013-14 Academic Performance2013-14 School Demographics% of Free & Reduced Price
Lunch Students (FRPL)
% Minority Students
95.5%
100.0%
IS 219 New Venture SchoolNYC Geographic District # 9 - Bronx County
Need Resource Category
2014-15 Status
Has the School Been Failing Since 2005-06?
Number of Consecutive Years Failing Since 2005-06
Priority / Failing
Yes
Summary
Michael BlakeGustavo Rivera
Assembly District # 79Senate District # 33
89

State Avg. School3-8 Math 35.8% 5.5%3-8 ELA 31.4% 4.0%
Grad. Rate 76.4% N/A
Total School Enrollment, 2005-06 to 2013-142005-06 2006-07 2007-08 2008-09 2009-10 2010-11 2011-12 2012-13 2013-14
471 452 429 408 434 448 452 426 380
2011-12 Enacted School Aid $7,662,346,0274 2014-15 Enacted School Aid $8,689,947,1545 $ Change + $1,027,601,127 % Highly Effective 9%6 % Change + 13.4% % Effective 83%7 % Developing 7%
2014-15 Estimated Public Enrollment 1,056,195 % Ineffective 1%8 2014-15 Formula Based State Aid Per Pupil $8,2289
2012-13 Spending Per Pupil: All Sources (Census) $20,2262012-13 National Average (Census) $10,608
% Above National Average + 90.7%#
#
# % Free or Reduced Price Lunch (FRPL) Students 76.1%% Students English Language Learners (ELL) 12.7%
# 21 20 19 18 17 16 15
10
+ 13.4%
High Need - New York City
Fiscal & Demographic Factors
Percentage Change in Aid, 2011-12 to 2014-15
School District Key Facts
Teacher Effectiveness 2013-14
2013-14 Academic Performance2013-14 School Demographics% of Free & Reduced Price
Lunch Students (FRPL)
% Minority Students
84.2%
99.8%
IS 313 School Of Leadership DevelopmentNYC Geographic District # 9 - Bronx County
Need Resource Category
2014-15 Status
Has the School Been Failing Since 2005-06?
Number of Consecutive Years Failing Since 2005-06
Priority / Failing
Yes
Summary
Michael BlakeGustavo Rivera
Assembly District # 79Senate District # 33
90

State Avg. School3-8 Math 35.8% 6.1%3-8 ELA 31.4% 6.1%
Grad. Rate 76.4% N/A
Total School Enrollment, 2005-06 to 2013-142005-06 2006-07 2007-08 2008-09 2009-10 2010-11 2011-12 2012-13 2013-14
953 914 895 841 805 799 740 656 601
2011-12 Enacted School Aid $7,662,346,0274 2014-15 Enacted School Aid $8,689,947,1545 $ Change + $1,027,601,127 % Highly Effective 9%6 % Change + 13.4% % Effective 83%7 % Developing 7%
2014-15 Estimated Public Enrollment 1,056,195 % Ineffective 1%8 2014-15 Formula Based State Aid Per Pupil $8,2289
2012-13 Spending Per Pupil: All Sources (Census) $20,2262012-13 National Average (Census) $10,608
% Above National Average + 90.7%#
#
# % Free or Reduced Price Lunch (FRPL) Students 76.1%% Students English Language Learners (ELL) 12.7%
# 21 20 19 18 17 16 15
10
+ 13.4%
High Need - New York City
Fiscal & Demographic Factors
Percentage Change in Aid, 2011-12 to 2014-15
School District Key Facts
Teacher Effectiveness 2013-14
2013-14 Academic Performance2013-14 School Demographics% of Free & Reduced Price
Lunch Students (FRPL)
% Minority Students
97.3%
99.7%
IS 339NYC Geographic District # 9 - Bronx County
Need Resource Category
2014-15 Status
Has the School Been Failing Since 2005-06?
Number of Consecutive Years Failing Since 2005-06
Priority / Failing
Yes
Summary
Michael BlakeGustavo Rivera
Assembly District # 79Senate District # 33
91

State Avg. School3-8 Math 35.8% 1.4%3-8 ELA 31.4% 6.5%
Grad. Rate 76.4% N/A
Total School Enrollment, 2005-06 to 2013-142005-06 2006-07 2007-08 2008-09 2009-10 2010-11 2011-12 2012-13 2013-14
720 701 670 638 679 644 653 664 577
2011-12 Enacted School Aid $7,662,346,0274 2014-15 Enacted School Aid $8,689,947,1545 $ Change + $1,027,601,127 % Highly Effective 9%6 % Change + 13.4% % Effective 83%7 % Developing 7%
2014-15 Estimated Public Enrollment 1,056,195 % Ineffective 1%8 2014-15 Formula Based State Aid Per Pupil $8,2289
2012-13 Spending Per Pupil: All Sources (Census) $20,2262012-13 National Average (Census) $10,608
% Above National Average + 90.7%#
#
# % Free or Reduced Price Lunch (FRPL) Students 76.1%% Students English Language Learners (ELL) 12.7%
# 21 20 19 18 17 16 15
10
+ 13.4%
High Need - New York City
Fiscal & Demographic Factors
Percentage Change in Aid, 2011-12 to 2014-15
School District Key Facts
Teacher Effectiveness 2013-14
2013-14 Academic Performance2013-14 School Demographics% of Free & Reduced Price
Lunch Students (FRPL)
% Minority Students
89.9%
99.4%
JHS 22 Jordan L MottNYC Geographic District # 9 - Bronx County
Need Resource Category
2014-15 Status
Has the School Been Failing Since 2005-06?
Number of Consecutive Years Failing Since 2005-06
Priority / Failing
Yes
Summary
Latoya JoynerRuben Diaz
Assembly District # 77Senate District # 32
92
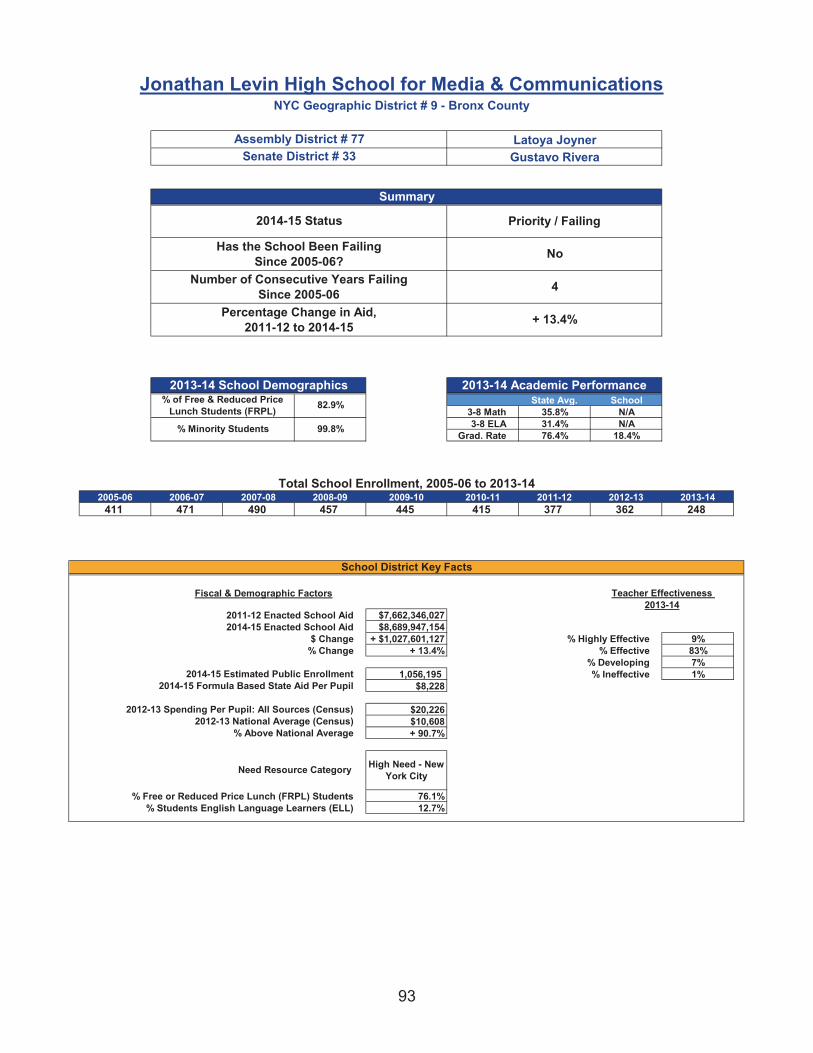
State Avg. School3-8 Math 35.8% N/A3-8 ELA 31.4% N/A
Grad. Rate 76.4% 18.4%
Total School Enrollment, 2005-06 to 2013-142005-06 2006-07 2007-08 2008-09 2009-10 2010-11 2011-12 2012-13 2013-14
411 471 490 457 445 415 377 362 248
2011-12 Enacted School Aid $7,662,346,0274 2014-15 Enacted School Aid $8,689,947,1545 $ Change + $1,027,601,127 % Highly Effective 9%6 % Change + 13.4% % Effective 83%7 % Developing 7%
2014-15 Estimated Public Enrollment 1,056,195 % Ineffective 1%8 2014-15 Formula Based State Aid Per Pupil $8,2289
2012-13 Spending Per Pupil: All Sources (Census) $20,2262012-13 National Average (Census) $10,608
% Above National Average + 90.7%#
#
# % Free or Reduced Price Lunch (FRPL) Students 76.1%% Students English Language Learners (ELL) 12.7%
# 21 20 19 18 17 16 15
4
+ 13.4%
High Need - New York City
Fiscal & Demographic Factors
Percentage Change in Aid, 2011-12 to 2014-15
School District Key Facts
Teacher Effectiveness 2013-14
2013-14 Academic Performance2013-14 School Demographics% of Free & Reduced Price
Lunch Students (FRPL)
% Minority Students
82.9%
99.8%
Jonathan Levin High School for Media & CommunicationsNYC Geographic District # 9 - Bronx County
Need Resource Category
2014-15 Status
Has the School Been Failing Since 2005-06?
Number of Consecutive Years Failing Since 2005-06
Priority / Failing
No
Summary
Latoya JoynerGustavo Rivera
Assembly District # 77Senate District # 33
93

State Avg. School3-8 Math 35.8% 4.4%3-8 ELA 31.4% 4.6%
Grad. Rate 76.4% N/A
Total School Enrollment, 2005-06 to 2013-142005-06 2006-07 2007-08 2008-09 2009-10 2010-11 2011-12 2012-13 2013-14
379 305 261 277 255 209 199 191 188
2011-12 Enacted School Aid $7,662,346,0274 2014-15 Enacted School Aid $8,689,947,1545 $ Change + $1,027,601,127 % Highly Effective 9%6 % Change + 13.4% % Effective 83%7 % Developing 7%
2014-15 Estimated Public Enrollment 1,056,195 % Ineffective 1%8 2014-15 Formula Based State Aid Per Pupil $8,2289
2012-13 Spending Per Pupil: All Sources (Census) $20,2262012-13 National Average (Census) $10,608
% Above National Average + 90.7%#
#
# % Free or Reduced Price Lunch (FRPL) Students 76.1%% Students English Language Learners (ELL) 12.7%
# 21 20 19 18 17 16 15
8
+ 13.4%
High Need - New York City
Fiscal & Demographic Factors
Percentage Change in Aid, 2011-12 to 2014-15
School District Key Facts
Teacher Effectiveness 2013-14
2013-14 Academic Performance2013-14 School Demographics% of Free & Reduced Price
Lunch Students (FRPL)
% Minority Students
86.1%
99.5%
New Millennium Business Academy MSNYC Geographic District # 9 - Bronx County
Need Resource Category
2014-15 Status
Has the School Been Failing Since 2005-06?
Number of Consecutive Years Failing Since 2005-06
Priority / Failing
No
Summary
Latoya JoynerRuben Diaz
Assembly District # 77Senate District # 32
94

State Avg. School3-8 Math 35.8% 12.5%3-8 ELA 31.4% 13.5%
Grad. Rate 76.4% N/A
Total School Enrollment, 2005-06 to 2013-142005-06 2006-07 2007-08 2008-09 2009-10 2010-11 2011-12 2012-13 2013-14
508 496 506 463 410 470 426 449 197
2011-12 Enacted School Aid $7,662,346,0274 2014-15 Enacted School Aid $8,689,947,1545 $ Change + $1,027,601,127 % Highly Effective 9%6 % Change + 13.4% % Effective 83%7 % Developing 7%
2014-15 Estimated Public Enrollment 1,056,195 % Ineffective 1%8 2014-15 Formula Based State Aid Per Pupil $8,2289
2012-13 Spending Per Pupil: All Sources (Census) $20,2262012-13 National Average (Census) $10,608
% Above National Average + 90.7%#
#
# % Free or Reduced Price Lunch (FRPL) Students 76.1%% Students English Language Learners (ELL) 12.7%
# 21 20 19 18 17 16 15
7
+ 13.4%
High Need - New York City
Fiscal & Demographic Factors
Percentage Change in Aid, 2011-12 to 2014-15
School District Key Facts
Teacher Effectiveness 2013-14
2013-14 Academic Performance2013-14 School Demographics% of Free & Reduced Price
Lunch Students (FRPL)
% Minority Students
100.0%
99.8%
PS 230 Dr Roland N PattersonNYC Geographic District # 9 - Bronx County
Need Resource Category
2014-15 Status
Has the School Been Failing Since 2005-06?
Number of Consecutive Years Failing Since 2005-06
Priority / Failing
No
Summary
Latoya JoynerJose Serrano
Assembly District # 77Senate District # 29
95

State Avg. School3-8 Math 35.8% 5.4%3-8 ELA 31.4% 3.4%
Grad. Rate 76.4% N/A
Total School Enrollment, 2005-06 to 2013-142005-06 2006-07 2007-08 2008-09 2009-10 2010-11 2011-12 2012-13 2013-14
962 931 909 866 861 828 885 860 467
2011-12 Enacted School Aid $7,662,346,0274 2014-15 Enacted School Aid $8,689,947,1545 $ Change + $1,027,601,127 % Highly Effective 9%6 % Change + 13.4% % Effective 83%7 % Developing 7%
2014-15 Estimated Public Enrollment 1,056,195 % Ineffective 1%8 2014-15 Formula Based State Aid Per Pupil $8,2289
2012-13 Spending Per Pupil: All Sources (Census) $20,2262012-13 National Average (Census) $10,608
% Above National Average + 90.7%#
#
# % Free or Reduced Price Lunch (FRPL) Students 76.1%% Students English Language Learners (ELL) 12.7%
# 21 20 19 18 17 16 15
10
+ 13.4%
High Need - New York City
Fiscal & Demographic Factors
Percentage Change in Aid, 2011-12 to 2014-15
School District Key Facts
Teacher Effectiveness 2013-14
2013-14 Academic Performance2013-14 School Demographics% of Free & Reduced Price
Lunch Students (FRPL)
% Minority Students
98.0%
99.7%
PS 64 Pura BelpreNYC Geographic District # 9 - Bronx County
Need Resource Category
2014-15 Status
Has the School Been Failing Since 2005-06?
Number of Consecutive Years Failing Since 2005-06
Priority / Failing
Yes
Summary
Latoya JoynerJose Serrano
Assembly District # 77Senate District # 29
96

State Avg. School3-8 Math 35.8% N/A3-8 ELA 31.4% N/A
Grad. Rate 76.4% 41.5%
Total School Enrollment, 2005-06 to 2013-142005-06 2006-07 2007-08 2008-09 2009-10 2010-11 2011-12 2012-13 2013-144,533 4,465 4,398 4,391 4,452 4,417 4,195 3,490 2,707
2011-12 Enacted School Aid $7,662,346,0274 2014-15 Enacted School Aid $8,689,947,1545 $ Change + $1,027,601,127 % Highly Effective 9%6 % Change + 13.4% % Effective 83%7 % Developing 7%
2014-15 Estimated Public Enrollment 1,056,195 % Ineffective 1%8 2014-15 Formula Based State Aid Per Pupil $8,2289
2012-13 Spending Per Pupil: All Sources (Census) $20,2262012-13 National Average (Census) $10,608
% Above National Average + 90.7%#
#
# % Free or Reduced Price Lunch (FRPL) Students 76.1%% Students English Language Learners (ELL) 12.7%
# 21 20 19 18 17 16 15
10
+ 13.4%
High Need - New York City
Fiscal & Demographic Factors
Percentage Change in Aid, 2011-12 to 2014-15
School District Key Facts
Teacher Effectiveness 2013-14
2013-14 Academic Performance2013-14 School Demographics% of Free & Reduced Price
Lunch Students (FRPL)
% Minority Students
10.6%
97.7%
Dewitt Clinton High SchoolNYC Geographic District #10 - Bronx County
Need Resource Category
2014-15 Status
Has the School Been Failing Since 2005-06?
Number of Consecutive Years Failing Since 2005-06
Priority / Failing
Yes
Summary
Jeffrey DinowitzJeffrey D. Klein
Assembly District # 81Senate District # 34
97

State Avg. School3-8 Math 35.8% N/A3-8 ELA 31.4% N/A
Grad. Rate 76.4% 32.1%
Total School Enrollment, 2005-06 to 2013-142005-06 2006-07 2007-08 2008-09 2009-10 2010-11 2011-12 2012-13 2013-14
527 575 541 523 498 464 449 422 460
2011-12 Enacted School Aid $7,662,346,0274 2014-15 Enacted School Aid $8,689,947,1545 $ Change + $1,027,601,127 % Highly Effective 9%6 % Change + 13.4% % Effective 83%7 % Developing 7%
2014-15 Estimated Public Enrollment 1,056,195 % Ineffective 1%8 2014-15 Formula Based State Aid Per Pupil $8,2289
2012-13 Spending Per Pupil: All Sources (Census) $20,2262012-13 National Average (Census) $10,608
% Above National Average + 90.7%#
#
# % Free or Reduced Price Lunch (FRPL) Students 76.1%% Students English Language Learners (ELL) 12.7%
# 21 20 19 18 17 16 15
6
+ 13.4%
High Need - New York City
Fiscal & Demographic Factors
Percentage Change in Aid, 2011-12 to 2014-15
School District Key Facts
Teacher Effectiveness 2013-14
2013-14 Academic Performance2013-14 School Demographics% of Free & Reduced Price
Lunch Students (FRPL)
% Minority Students
91.7%
98.8%
Fordham Leadership Academy For Business & TechnologyNYC Geographic District #10 - Bronx County
Need Resource Category
2014-15 Status
Has the School Been Failing Since 2005-06?
Number of Consecutive Years Failing Since 2005-06
Priority / Failing
No
Summary
Jose RiveraJeffrey D. Klein
Assembly District # 78Senate District # 34
98

State Avg. School3-8 Math 35.8% N/A3-8 ELA 31.4% N/A
Grad. Rate 76.4% 27.7%
Total School Enrollment, 2005-06 to 2013-142005-06 2006-07 2007-08 2008-09 2009-10 2010-11 2011-12 2012-13 2013-141,481 1,480 1,454 1,487 1,472 1,374 1,160 715 408
2011-12 Enacted School Aid $7,662,346,0274 2014-15 Enacted School Aid $8,689,947,1545 $ Change + $1,027,601,127 % Highly Effective 9%6 % Change + 13.4% % Effective 83%7 % Developing 7%
2014-15 Estimated Public Enrollment 1,056,195 % Ineffective 1%8 2014-15 Formula Based State Aid Per Pupil $8,2289
2012-13 Spending Per Pupil: All Sources (Census) $20,2262012-13 National Average (Census) $10,608
% Above National Average + 90.7%#
#
# % Free or Reduced Price Lunch (FRPL) Students 76.1%% Students English Language Learners (ELL) 12.7%
# 21 20 19 18 17 16 15
10
+ 13.4%
High Need - New York City
Fiscal & Demographic Factors
Percentage Change in Aid, 2011-12 to 2014-15
School District Key Facts
Teacher Effectiveness 2013-14
2013-14 Academic Performance2013-14 School Demographics% of Free & Reduced Price
Lunch Students (FRPL)
% Minority Students
100.0%
99.2%
Grace H Dodge Career & Technical High SchoolNYC Geographic District #10 - Bronx County
Need Resource Category
2014-15 Status
Has the School Been Failing Since 2005-06?
Number of Consecutive Years Failing Since 2005-06
Priority / Failing
Yes
Summary
Jose RiveraGustavo Rivera
Assembly District # 78Senate District # 33
99

State Avg. School3-8 Math 35.8% 4.8%3-8 ELA 31.4% 5.2%
Grad. Rate 76.4% N/A
Total School Enrollment, 2005-06 to 2013-142005-06 2006-07 2007-08 2008-09 2009-10 2010-11 2011-12 2012-13 2013-14
917 754 673 658 620 652 647 654 622
2011-12 Enacted School Aid $7,662,346,0274 2014-15 Enacted School Aid $8,689,947,1545 $ Change + $1,027,601,127 % Highly Effective 9%6 % Change + 13.4% % Effective 83%7 % Developing 7%
2014-15 Estimated Public Enrollment 1,056,195 % Ineffective 1%8 2014-15 Formula Based State Aid Per Pupil $8,2289
2012-13 Spending Per Pupil: All Sources (Census) $20,2262012-13 National Average (Census) $10,608
% Above National Average + 90.7%#
#
# % Free or Reduced Price Lunch (FRPL) Students 76.1%% Students English Language Learners (ELL) 12.7%
# 21 20 19 18 17 16 15
10
+ 13.4%
High Need - New York City
Fiscal & Demographic Factors
Percentage Change in Aid, 2011-12 to 2014-15
School District Key Facts
Teacher Effectiveness 2013-14
2013-14 Academic Performance2013-14 School Demographics% of Free & Reduced Price
Lunch Students (FRPL)
% Minority Students
82.1%
95.0%
JHS 80 The Mosholu ParkwayNYC Geographic District #10 - Bronx County
Need Resource Category
2014-15 Status
Has the School Been Failing Since 2005-06?
Number of Consecutive Years Failing Since 2005-06
Priority / Failing
Yes
Summary
Mark GjonajRuth Hassell-Thompson
Assembly District # 80Senate District # 36
100

State Avg. School3-8 Math 35.8% 7.1%3-8 ELA 31.4% 4.7%
Grad. Rate 76.4% N/A
Total School Enrollment, 2005-06 to 2013-142005-06 2006-07 2007-08 2008-09 2009-10 2010-11 2011-12 2012-13 2013-141,167 1,122 1,163 1,167 1,195 1,131 1,089 1,057 998
2011-12 Enacted School Aid $7,662,346,0274 2014-15 Enacted School Aid $8,689,947,1545 $ Change + $1,027,601,127 % Highly Effective 9%6 % Change + 13.4% % Effective 83%7 % Developing 7%
2014-15 Estimated Public Enrollment 1,056,195 % Ineffective 1%8 2014-15 Formula Based State Aid Per Pupil $8,2289
2012-13 Spending Per Pupil: All Sources (Census) $20,2262012-13 National Average (Census) $10,608
% Above National Average + 90.7%#
#
# % Free or Reduced Price Lunch (FRPL) Students 76.1%% Students English Language Learners (ELL) 12.7%
# 21 20 19 18 17 16 15
10
+ 13.4%
High Need - New York City
Fiscal & Demographic Factors
Percentage Change in Aid, 2011-12 to 2014-15
School District Key Facts
Teacher Effectiveness 2013-14
2013-14 Academic Performance2013-14 School Demographics% of Free & Reduced Price
Lunch Students (FRPL)
% Minority Students
98.4%
99.2%
PS 85 Great ExpectationsNYC Geographic District #10 - Bronx County
Need Resource Category
2014-15 Status
Has the School Been Failing Since 2005-06?
Number of Consecutive Years Failing Since 2005-06
Priority / Failing
Yes
Summary
Victor PichardoGustavo Rivera
Assembly District # 86Senate District # 33
101

State Avg. School3-8 Math 35.8% 7.3%3-8 ELA 31.4% 7.6%
Grad. Rate 76.4% N/A
Total School Enrollment, 2005-06 to 2013-142005-06 2006-07 2007-08 2008-09 2009-10 2010-11 2011-12 2012-13 2013-14
860 795 757 742 699 633 623 632 583
2011-12 Enacted School Aid $7,662,346,0274 2014-15 Enacted School Aid $8,689,947,1545 $ Change + $1,027,601,127 % Highly Effective 9%6 % Change + 13.4% % Effective 83%7 % Developing 7%
2014-15 Estimated Public Enrollment 1,056,195 % Ineffective 1%8 2014-15 Formula Based State Aid Per Pupil $8,2289
2012-13 Spending Per Pupil: All Sources (Census) $20,2262012-13 National Average (Census) $10,608
% Above National Average + 90.7%#
#
# % Free or Reduced Price Lunch (FRPL) Students 76.1%% Students English Language Learners (ELL) 12.7%
# 21 20 19 18 17 16 15
10
+ 13.4%
High Need - New York City
Fiscal & Demographic Factors
Percentage Change in Aid, 2011-12 to 2014-15
School District Key Facts
Teacher Effectiveness 2013-14
2013-14 Academic Performance2013-14 School Demographics% of Free & Reduced Price
Lunch Students (FRPL)
% Minority Students
87.8%
99.8%
The Angelo Patri Middle SchoolNYC Geographic District #10 - Bronx County
Need Resource Category
2014-15 Status
Has the School Been Failing Since 2005-06?
Number of Consecutive Years Failing Since 2005-06
Priority / Failing
Yes
Summary
Victor PichardoGustavo Rivera
Assembly District # 86Senate District # 33
102

State Avg. School3-8 Math 35.8% N/A3-8 ELA 31.4% N/A
Grad. Rate 76.4% 47.5%
Total School Enrollment, 2005-06 to 2013-142005-06 2006-07 2007-08 2008-09 2009-10 2010-11 2011-12 2012-13 2013-14
348 361 333 367 408 426 480 478 498
2011-12 Enacted School Aid $7,662,346,0274 2014-15 Enacted School Aid $8,689,947,1545 $ Change + $1,027,601,127 % Highly Effective 9%6 % Change + 13.4% % Effective 83%7 % Developing 7%
2014-15 Estimated Public Enrollment 1,056,195 % Ineffective 1%8 2014-15 Formula Based State Aid Per Pupil $8,2289
2012-13 Spending Per Pupil: All Sources (Census) $20,2262012-13 National Average (Census) $10,608
% Above National Average + 90.7%#
#
# % Free or Reduced Price Lunch (FRPL) Students 76.1%% Students English Language Learners (ELL) 12.7%
# 21 20 19 18 17 16 15
4
+ 13.4%
High Need - New York City
Fiscal & Demographic Factors
Percentage Change in Aid, 2011-12 to 2014-15
School District Key Facts
Teacher Effectiveness 2013-14
2013-14 Academic Performance2013-14 School Demographics% of Free & Reduced Price
Lunch Students (FRPL)
% Minority Students
69.7%
94.1%
Bronx High School For The Visual ArtNYC Geographic District #11 - Bronx County
Need Resource Category
2014-15 Status
Has the School Been Failing Since 2005-06?
Number of Consecutive Years Failing Since 2005-06
Priority / Failing
No
Summary
Mark GjonajJeffrey D. Klein
Assembly District # 80Senate District # 34
103

State Avg. School3-8 Math 35.8% 8.3%3-8 ELA 31.4% 7.5%
Grad. Rate 76.4% N/A
Total School Enrollment, 2005-06 to 2013-142005-06 2006-07 2007-08 2008-09 2009-10 2010-11 2011-12 2012-13 2013-14
209 413 573 523 486 487 429 354 298
2011-12 Enacted School Aid $7,662,346,0274 2014-15 Enacted School Aid $8,689,947,1545 $ Change + $1,027,601,127 % Highly Effective 9%6 % Change + 13.4% % Effective 83%7 % Developing 7%
2014-15 Estimated Public Enrollment 1,056,195 % Ineffective 1%8 2014-15 Formula Based State Aid Per Pupil $8,2289
2012-13 Spending Per Pupil: All Sources (Census) $20,2262012-13 National Average (Census) $10,608
% Above National Average + 90.7%#
#
# % Free or Reduced Price Lunch (FRPL) Students 76.1%% Students English Language Learners (ELL) 12.7%
# 21 20 19 18 17 16 15
4
+ 13.4%
High Need - New York City
Fiscal & Demographic Factors
Percentage Change in Aid, 2011-12 to 2014-15
School District Key Facts
Teacher Effectiveness 2013-14
2013-14 Academic Performance2013-14 School Demographics% of Free & Reduced Price
Lunch Students (FRPL)
% Minority Students
92.9%
98.3%
Globe School for Environmental ResearchNYC Geographic District #11 - Bronx County
Need Resource Category
2014-15 Status
Has the School Been Failing Since 2005-06?
Number of Consecutive Years Failing Since 2005-06
Priority / Failing
No
Summary
Carl HeastieRuth Hassell-Thompson
Assembly District # 83Senate District # 36
104

State Avg. School3-8 Math 35.8% 3.7%3-8 ELA 31.4% 5.5%
Grad. Rate 76.4% N/A
Total School Enrollment, 2005-06 to 2013-142005-06 2006-07 2007-08 2008-09 2009-10 2010-11 2011-12 2012-13 2013-141,064 1,049 1,068 1,034 955 824 575 435 195
2011-12 Enacted School Aid $7,662,346,0274 2014-15 Enacted School Aid $8,689,947,1545 $ Change + $1,027,601,127 % Highly Effective 9%6 % Change + 13.4% % Effective 83%7 % Developing 7%
2014-15 Estimated Public Enrollment 1,056,195 % Ineffective 1%8 2014-15 Formula Based State Aid Per Pupil $8,2289
2012-13 Spending Per Pupil: All Sources (Census) $20,2262012-13 National Average (Census) $10,608
% Above National Average + 90.7%#
#
# % Free or Reduced Price Lunch (FRPL) Students 76.1%% Students English Language Learners (ELL) 12.7%
# 21 20 19 18 17 16 15
10
+ 13.4%
High Need - New York City
Fiscal & Demographic Factors
Percentage Change in Aid, 2011-12 to 2014-15
School District Key Facts
Teacher Effectiveness 2013-14
2013-14 Academic Performance2013-14 School Demographics% of Free & Reduced Price
Lunch Students (FRPL)
% Minority Students
89.1%
99.8%
MS 142 John Philip SousaNYC Geographic District #11 - Bronx County
Need Resource Category
2014-15 Status
Has the School Been Failing Since 2005-06?
Number of Consecutive Years Failing Since 2005-06
Priority / Failing
Yes
Summary
Carl HeastieRuth Hassell-Thompson
Assembly District # 83Senate District # 36
105

State Avg. School3-8 Math 35.8% 5.2%3-8 ELA 31.4% 8.2%
Grad. Rate 76.4% N/A
Total School Enrollment, 2005-06 to 2013-142005-06 2006-07 2007-08 2008-09 2009-10 2010-11 2011-12 2012-13 2013-14
N/A N/A 135 308 433 454 391 341 277
2011-12 Enacted School Aid $7,662,346,0274 2014-15 Enacted School Aid $8,689,947,1545 $ Change + $1,027,601,127 % Highly Effective 9%6 % Change + 13.4% % Effective 83%7 % Developing 7%
2014-15 Estimated Public Enrollment 1,056,195 % Ineffective 1%8 2014-15 Formula Based State Aid Per Pupil $8,2289
2012-13 Spending Per Pupil: All Sources (Census) $20,2262012-13 National Average (Census) $10,608
% Above National Average + 90.7%#
#
# % Free or Reduced Price Lunch (FRPL) Students 76.1%% Students English Language Learners (ELL) 12.7%
# 21 20 19 18 17 16 15
5
+ 13.4%
High Need - New York City
Fiscal & Demographic Factors
Percentage Change in Aid, 2011-12 to 2014-15
School District Key Facts
Teacher Effectiveness 2013-14
2013-14 Academic Performance2013-14 School Demographics% of Free & Reduced Price
Lunch Students (FRPL)
% Minority Students
76.4%
99.3%
School Of DiplomacyNYC Geographic District #11 - Bronx County
Need Resource Category
2014-15 Status
Has the School Been Failing Since 2005-06?
Number of Consecutive Years Failing Since 2005-06
Priority / Failing
No
Summary
Carl HeastieRuth Hassell-Thompson
Assembly District # 83Senate District # 36
106

State Avg. School3-8 Math 35.8% N/A3-8 ELA 31.4% N/A
Grad. Rate 76.4% 67.4%
Total School Enrollment, 2005-06 to 2013-142005-06 2006-07 2007-08 2008-09 2009-10 2010-11 2011-12 2012-13 2013-14
200 268 328 330 362 363 411 414 402
2011-12 Enacted School Aid $7,662,346,0274 2014-15 Enacted School Aid $8,689,947,1545 $ Change + $1,027,601,127 % Highly Effective 9%6 % Change + 13.4% % Effective 83%7 % Developing 7%
2014-15 Estimated Public Enrollment 1,056,195 % Ineffective 1%8 2014-15 Formula Based State Aid Per Pupil $8,2289
2012-13 Spending Per Pupil: All Sources (Census) $20,2262012-13 National Average (Census) $10,608
% Above National Average + 90.7%#
#
# % Free or Reduced Price Lunch (FRPL) Students 76.1%% Students English Language Learners (ELL) 12.7%
# 21 20 19 18 17 16 15
5
+ 13.4%
High Need - New York City
Fiscal & Demographic Factors
Percentage Change in Aid, 2011-12 to 2014-15
School District Key Facts
Teacher Effectiveness 2013-14
2013-14 Academic Performance2013-14 School Demographics% of Free & Reduced Price
Lunch Students (FRPL)
% Minority Students
72.5%
99.0%
The Bronxwood Prep AcademyNYC Geographic District #11 - Bronx County
Need Resource Category
2014-15 Status
Has the School Been Failing Since 2005-06?
Number of Consecutive Years Failing Since 2005-06
Priority / Failing
No
Summary
Carl HeastieRuth Hassell-Thompson
Assembly District # 83Senate District # 36
107

State Avg. School3-8 Math 35.8% 9.8%3-8 ELA 31.4% 8.2%
Grad. Rate 76.4% N/A
Total School Enrollment, 2005-06 to 2013-142005-06 2006-07 2007-08 2008-09 2009-10 2010-11 2011-12 2012-13 2013-14
170 249 264 232 235 241 252 247 250
2011-12 Enacted School Aid $7,662,346,0274 2014-15 Enacted School Aid $8,689,947,1545 $ Change + $1,027,601,127 % Highly Effective 9%6 % Change + 13.4% % Effective 83%7 % Developing 7%
2014-15 Estimated Public Enrollment 1,056,195 % Ineffective 1%8 2014-15 Formula Based State Aid Per Pupil $8,2289
2012-13 Spending Per Pupil: All Sources (Census) $20,2262012-13 National Average (Census) $10,608
% Above National Average + 90.7%#
#
# % Free or Reduced Price Lunch (FRPL) Students 76.1%% Students English Language Learners (ELL) 12.7%
# 21 20 19 18 17 16 15
7
+ 13.4%
High Need - New York City
Fiscal & Demographic Factors
Percentage Change in Aid, 2011-12 to 2014-15
School District Key Facts
Teacher Effectiveness 2013-14
2013-14 Academic Performance2013-14 School Demographics% of Free & Reduced Price
Lunch Students (FRPL)
% Minority Students
94.6%
100.0%
Fannie Lou Hamer Middle SchoolNYC Geographic District #12 - Bronx County
Need Resource Category
2014-15 Status
Has the School Been Failing Since 2005-06?
Number of Consecutive Years Failing Since 2005-06
Priority / Failing
No
Summary
Marcos CrespoRuben Diaz
Assembly District # 85Senate District # 32
108

State Avg. School3-8 Math 35.8% N/A3-8 ELA 31.4% N/A
Grad. Rate 76.4% 41.9%
Total School Enrollment, 2005-06 to 2013-142005-06 2006-07 2007-08 2008-09 2009-10 2010-11 2011-12 2012-13 2013-14
529 510 523 499 473 450 467 458 464
2011-12 Enacted School Aid $7,662,346,0274 2014-15 Enacted School Aid $8,689,947,1545 $ Change + $1,027,601,127 % Highly Effective 9%6 % Change + 13.4% % Effective 83%7 % Developing 7%
2014-15 Estimated Public Enrollment 1,056,195 % Ineffective 1%8 2014-15 Formula Based State Aid Per Pupil $8,2289
2012-13 Spending Per Pupil: All Sources (Census) $20,2262012-13 National Average (Census) $10,608
% Above National Average + 90.7%#
#
# % Free or Reduced Price Lunch (FRPL) Students 76.1%% Students English Language Learners (ELL) 12.7%
# 21 20 19 18 17 16 15
3
+ 13.4%
High Need - New York City
Fiscal & Demographic Factors
Percentage Change in Aid, 2011-12 to 2014-15
School District Key Facts
Teacher Effectiveness 2013-14
2013-14 Academic Performance2013-14 School Demographics% of Free & Reduced Price
Lunch Students (FRPL)
% Minority Students
88.2%
99.6%
Monroe Academy For Visual Arts & DesignNYC Geographic District #12 - Bronx County
Need Resource Category
2014-15 Status
Has the School Been Failing Since 2005-06?
Number of Consecutive Years Failing Since 2005-06
Priority / Failing
No
Summary
Marcos CrespoRuben Diaz
Assembly District # 85Senate District # 32
109

State Avg. School3-8 Math 35.8% 10.5%3-8 ELA 31.4% 6.7%
Grad. Rate 76.4% N/A
Total School Enrollment, 2005-06 to 2013-142005-06 2006-07 2007-08 2008-09 2009-10 2010-11 2011-12 2012-13 2013-14
716 567 576 511 519 477 449 402 185
2011-12 Enacted School Aid $7,662,346,0274 2014-15 Enacted School Aid $8,689,947,1545 $ Change + $1,027,601,127 % Highly Effective 9%6 % Change + 13.4% % Effective 83%7 % Developing 7%
2014-15 Estimated Public Enrollment 1,056,195 % Ineffective 1%8 2014-15 Formula Based State Aid Per Pupil $8,2289
2012-13 Spending Per Pupil: All Sources (Census) $20,2262012-13 National Average (Census) $10,608
% Above National Average + 90.7%#
#
# % Free or Reduced Price Lunch (FRPL) Students 76.1%% Students English Language Learners (ELL) 12.7%
# 21 20 19 18 17 16 15
10
+ 13.4%
High Need - New York City
Fiscal & Demographic Factors
Percentage Change in Aid, 2011-12 to 2014-15
School District Key Facts
Teacher Effectiveness 2013-14
2013-14 Academic Performance2013-14 School Demographics% of Free & Reduced Price
Lunch Students (FRPL)
% Minority Students
84.6%
99.1%
PS 50 Clara BartonNYC Geographic District #12 - Bronx County
Need Resource Category
2014-15 Status
Has the School Been Failing Since 2005-06?
Number of Consecutive Years Failing Since 2005-06
Priority / Failing
Yes
Summary
Michael BlakeRuben Diaz
Assembly District # 79Senate District # 32
110

State Avg. School3-8 Math 35.8% 3.3%3-8 ELA 31.4% 4.3%
Grad. Rate 76.4% N/A
Total School Enrollment, 2005-06 to 2013-142005-06 2006-07 2007-08 2008-09 2009-10 2010-11 2011-12 2012-13 2013-14
568 555 526 501 505 482 502 474 469
2011-12 Enacted School Aid $7,662,346,0274 2014-15 Enacted School Aid $8,689,947,1545 $ Change + $1,027,601,127 % Highly Effective 9%6 % Change + 13.4% % Effective 83%7 % Developing 7%
2014-15 Estimated Public Enrollment 1,056,195 % Ineffective 1%8 2014-15 Formula Based State Aid Per Pupil $8,2289
2012-13 Spending Per Pupil: All Sources (Census) $20,2262012-13 National Average (Census) $10,608
% Above National Average + 90.7%#
#
# % Free or Reduced Price Lunch (FRPL) Students 76.1%% Students English Language Learners (ELL) 12.7%
# 21 20 19 18 17 16 15
4
+ 13.4%
High Need - New York City
Fiscal & Demographic Factors
Percentage Change in Aid, 2011-12 to 2014-15
School District Key Facts
Teacher Effectiveness 2013-14
2013-14 Academic Performance2013-14 School Demographics% of Free & Reduced Price
Lunch Students (FRPL)
% Minority Students
85.3%
99.2%
PS 92NYC Geographic District #12 - Bronx County
Need Resource Category
2014-15 Status
Has the School Been Failing Since 2005-06?
Number of Consecutive Years Failing Since 2005-06
Priority / Failing
No
Summary
Michael BlakeGustavo Rivera
Assembly District # 79Senate District # 33
111

State Avg. School3-8 Math 35.8% 4.2%3-8 ELA 31.4% 6.1%
Grad. Rate 76.4% N/A
Total School Enrollment, 2005-06 to 2013-142005-06 2006-07 2007-08 2008-09 2009-10 2010-11 2011-12 2012-13 2013-14
518 438 350 382 352 341 325 351 354
2011-12 Enacted School Aid $7,662,346,0274 2014-15 Enacted School Aid $8,689,947,1545 $ Change + $1,027,601,127 % Highly Effective 9%6 % Change + 13.4% % Effective 83%7 % Developing 7%
2014-15 Estimated Public Enrollment 1,056,195 % Ineffective 1%8 2014-15 Formula Based State Aid Per Pupil $8,2289
2012-13 Spending Per Pupil: All Sources (Census) $20,2262012-13 National Average (Census) $10,608
% Above National Average + 90.7%#
#
# % Free or Reduced Price Lunch (FRPL) Students 76.1%% Students English Language Learners (ELL) 12.7%
# 21 20 19 18 17 16 15
10
+ 13.4%
High Need - New York City
Fiscal & Demographic Factors
Percentage Change in Aid, 2011-12 to 2014-15
School District Key Facts
Teacher Effectiveness 2013-14
2013-14 Academic Performance2013-14 School Demographics% of Free & Reduced Price
Lunch Students (FRPL)
% Minority Students
95.0%
99.7%
School Of Performing ArtsNYC Geographic District #12 - Bronx County
Need Resource Category
2014-15 Status
Has the School Been Failing Since 2005-06?
Number of Consecutive Years Failing Since 2005-06
Priority / Failing
Yes
Summary
Marcos CrespoRuben Diaz
Assembly District # 85Senate District # 32
112

State Avg. School3-8 Math 35.8% 13.8%3-8 ELA 31.4% 10.7%
Grad. Rate 76.4% N/A
Total School Enrollment, 2005-06 to 2013-142005-06 2006-07 2007-08 2008-09 2009-10 2010-11 2011-12 2012-13 2013-14
N/A 585 626 619 576 581 591 596 576
2011-12 Enacted School Aid $7,662,346,0274 2014-15 Enacted School Aid $8,689,947,1545 $ Change + $1,027,601,127 % Highly Effective 9%6 % Change + 13.4% % Effective 83%7 % Developing 7%
2014-15 Estimated Public Enrollment 1,056,195 % Ineffective 1%8 2014-15 Formula Based State Aid Per Pupil $8,2289
2012-13 Spending Per Pupil: All Sources (Census) $20,2262012-13 National Average (Census) $10,608
% Above National Average + 90.7%#
#
# % Free or Reduced Price Lunch (FRPL) Students 76.1%% Students English Language Learners (ELL) 12.7%
# 21 20 19 18 17 16 15
7
+ 13.4%
High Need - New York City
Fiscal & Demographic Factors
Percentage Change in Aid, 2011-12 to 2014-15
School District Key Facts
Teacher Effectiveness 2013-14
2013-14 Academic Performance2013-14 School Demographics% of Free & Reduced Price
Lunch Students (FRPL)
% Minority Students
89.7%
99.5%
School Of Science & Applied LearningNYC Geographic District #12 - Bronx County
Need Resource Category
2014-15 Status
Has the School Been Failing Since 2005-06?
Number of Consecutive Years Failing Since 2005-06
Priority / Failing
No
Summary
Michael BlakeGustavo Rivera
Assembly District # 79Senate District # 33
113

State Avg. School3-8 Math 35.8% 3.9%3-8 ELA 31.4% 4.1%
Grad. Rate 76.4% N/A
Total School Enrollment, 2005-06 to 2013-142005-06 2006-07 2007-08 2008-09 2009-10 2010-11 2011-12 2012-13 2013-14
N/A N/A 75 138 195 179 154 119 85
2011-12 Enacted School Aid $7,662,346,0274 2014-15 Enacted School Aid $8,689,947,1545 $ Change + $1,027,601,127 % Highly Effective 9%6 % Change + 13.4% % Effective 83%7 % Developing 7%
2014-15 Estimated Public Enrollment 1,056,195 % Ineffective 1%8 2014-15 Formula Based State Aid Per Pupil $8,2289
2012-13 Spending Per Pupil: All Sources (Census) $20,2262012-13 National Average (Census) $10,608
% Above National Average + 90.7%#
#
# % Free or Reduced Price Lunch (FRPL) Students 76.1%% Students English Language Learners (ELL) 12.7%
# 21 20 19 18 17 16 15
4
+ 13.4%
High Need - New York City
Fiscal & Demographic Factors
Percentage Change in Aid, 2011-12 to 2014-15
School District Key Facts
Teacher Effectiveness 2013-14
2013-14 Academic Performance2013-14 School Demographics% of Free & Reduced Price
Lunch Students (FRPL)
% Minority Students
89.0%
99.4%
Ms 596 Peace AcademyNYC Geographic District #13 - Kings County
Need Resource Category
2014-15 Status
Has the School Been Failing Since 2005-06?
Number of Consecutive Years Failing Since 2005-06
Priority / Failing
No
Summary
Walter MosleyVelmanette Montgomery
Assembly District # 57Senate District # 25
114

State Avg. School3-8 Math 35.8% N/A3-8 ELA 31.4% N/A
Grad. Rate 76.4% 49.2%
Total School Enrollment, 2005-06 to 2013-142005-06 2006-07 2007-08 2008-09 2009-10 2010-11 2011-12 2012-13 2013-14
982 1,055 1,132 1,010 987 888 737 586 437
2011-12 Enacted School Aid $7,662,346,0274 2014-15 Enacted School Aid $8,689,947,1545 $ Change + $1,027,601,127 % Highly Effective 9%6 % Change + 13.4% % Effective 83%7 % Developing 7%
2014-15 Estimated Public Enrollment 1,056,195 % Ineffective 1%8 2014-15 Formula Based State Aid Per Pupil $8,2289
2012-13 Spending Per Pupil: All Sources (Census) $20,2262012-13 National Average (Census) $10,608
% Above National Average + 90.7%#
#
# % Free or Reduced Price Lunch (FRPL) Students 76.1%% Students English Language Learners (ELL) 12.7%
# 21 20 19 18 17 16 15
10
+ 13.4%
High Need - New York City
Fiscal & Demographic Factors
Percentage Change in Aid, 2011-12 to 2014-15
School District Key Facts
Teacher Effectiveness 2013-14
2013-14 Academic Performance2013-14 School Demographics% of Free & Reduced Price
Lunch Students (FRPL)
% Minority Students
95.9%
98.2%
Automotive High SchoolNYC Geographic District #14 - Kings County
Need Resource Category
2014-15 Status
Has the School Been Failing Since 2005-06?
Number of Consecutive Years Failing Since 2005-06
Priority / Failing
Yes
Summary
Joseph LentolDaniel Squadron
Assembly District # 50Senate District # 26
115

State Avg. School3-8 Math 35.8% N/A3-8 ELA 31.4% N/A
Grad. Rate 76.4% 13.0%
Total School Enrollment, 2005-06 to 2013-142005-06 2006-07 2007-08 2008-09 2009-10 2010-11 2011-12 2012-13 2013-14
N/A N/A 275 317 224 189 138 147 111
2011-12 Enacted School Aid $7,662,346,0274 2014-15 Enacted School Aid $8,689,947,1545 $ Change + $1,027,601,127 % Highly Effective 9%6 % Change + 13.4% % Effective 83%7 % Developing 7%
2014-15 Estimated Public Enrollment 1,056,195 % Ineffective 1%8 2014-15 Formula Based State Aid Per Pupil $8,2289
2012-13 Spending Per Pupil: All Sources (Census) $20,2262012-13 National Average (Census) $10,608
% Above National Average + 90.7%#
#
# % Free or Reduced Price Lunch (FRPL) Students 76.1%% Students English Language Learners (ELL) 12.7%
# 21 20 19 18 17 16 15
4
+ 13.4%
High Need - New York City
Fiscal & Demographic Factors
Percentage Change in Aid, 2011-12 to 2014-15
School District Key Facts
Teacher Effectiveness 2013-14
2013-14 Academic Performance2013-14 School Demographics% of Free & Reduced Price
Lunch Students (FRPL)
% Minority Students
77.5%
98.6%
Foundations AcademyNYC Geographic District #14 - Kings County
Need Resource Category
2014-15 Status
Has the School Been Failing Since 2005-06?
Number of Consecutive Years Failing Since 2005-06
Priority / Failing
No
Summary
Annette RobinsonMartin Malavé Dilan
Assembly District # 56Senate District # 18
116

State Avg. School3-8 Math 35.8% 3.9%3-8 ELA 31.4% 7.3%
Grad. Rate 76.4% N/A
Total School Enrollment, 2005-06 to 2013-142005-06 2006-07 2007-08 2008-09 2009-10 2010-11 2011-12 2012-13 2013-14
736 720 700 632 541 471 413 339 304
2011-12 Enacted School Aid $7,662,346,0274 2014-15 Enacted School Aid $8,689,947,1545 $ Change + $1,027,601,127 % Highly Effective 9%6 % Change + 13.4% % Effective 83%7 % Developing 7%
2014-15 Estimated Public Enrollment 1,056,195 % Ineffective 1%8 2014-15 Formula Based State Aid Per Pupil $8,2289
2012-13 Spending Per Pupil: All Sources (Census) $20,2262012-13 National Average (Census) $10,608
% Above National Average + 90.7%#
#
# % Free or Reduced Price Lunch (FRPL) Students 76.1%% Students English Language Learners (ELL) 12.7%
# 21 20 19 18 17 16 15
10
+ 13.4%
High Need - New York City
Fiscal & Demographic Factors
Percentage Change in Aid, 2011-12 to 2014-15
School District Key Facts
Teacher Effectiveness 2013-14
2013-14 Academic Performance2013-14 School Demographics% of Free & Reduced Price
Lunch Students (FRPL)
% Minority Students
91.5%
99.5%
JHS 50 John D WellsNYC Geographic District #14 - Kings County
Need Resource Category
2014-15 Status
Has the School Been Failing Since 2005-06?
Number of Consecutive Years Failing Since 2005-06
Priority / Failing
Yes
Summary
Maritza DavilaMartin Malavé Dilan
Assembly District # 53Senate District # 18
117

State Avg. School3-8 Math 35.8% 10.5%3-8 ELA 31.4% 11.9%
Grad. Rate 76.4% N/A
Total School Enrollment, 2005-06 to 2013-142005-06 2006-07 2007-08 2008-09 2009-10 2010-11 2011-12 2012-13 2013-14
738 704 611 474 420 330 319 262 264
2011-12 Enacted School Aid $7,662,346,0274 2014-15 Enacted School Aid $8,689,947,1545 $ Change + $1,027,601,127 % Highly Effective 9%6 % Change + 13.4% % Effective 83%7 % Developing 7%
2014-15 Estimated Public Enrollment 1,056,195 % Ineffective 1%8 2014-15 Formula Based State Aid Per Pupil $8,2289
2012-13 Spending Per Pupil: All Sources (Census) $20,2262012-13 National Average (Census) $10,608
% Above National Average + 90.7%#
#
# % Free or Reduced Price Lunch (FRPL) Students 76.1%% Students English Language Learners (ELL) 12.7%
# 21 20 19 18 17 16 15
10
+ 13.4%
High Need - New York City
Fiscal & Demographic Factors
Percentage Change in Aid, 2011-12 to 2014-15
School District Key Facts
Teacher Effectiveness 2013-14
2013-14 Academic Performance2013-14 School Demographics% of Free & Reduced Price
Lunch Students (FRPL)
% Minority Students
75.9%
97.5%
John Ericsson Middle School 126NYC Geographic District #14 - Kings County
Need Resource Category
2014-15 Status
Has the School Been Failing Since 2005-06?
Number of Consecutive Years Failing Since 2005-06
Priority / Failing
Yes
Summary
Joseph LentolDaniel Squadron
Assembly District # 50Senate District # 26
118

State Avg. School3-8 Math 35.8% 3.8%3-8 ELA 31.4% 2.4%
Grad. Rate 76.4% 54.2%
Total School Enrollment, 2005-06 to 2013-142005-06 2006-07 2007-08 2008-09 2009-10 2010-11 2011-12 2012-13 2013-14
787 879 953 923 911 877 864 806 769
2011-12 Enacted School Aid $7,662,346,0274 2014-15 Enacted School Aid $8,689,947,1545 $ Change + $1,027,601,127 % Highly Effective 9%6 % Change + 13.4% % Effective 83%7 % Developing 7%
2014-15 Estimated Public Enrollment 1,056,195 % Ineffective 1%8 2014-15 Formula Based State Aid Per Pupil $8,2289
2012-13 Spending Per Pupil: All Sources (Census) $20,2262012-13 National Average (Census) $10,608
% Above National Average + 90.7%#
#
# % Free or Reduced Price Lunch (FRPL) Students 76.1%% Students English Language Learners (ELL) 12.7%
# 21 20 19 18 17 16 15
4
+ 13.4%
High Need - New York City
Fiscal & Demographic Factors
Percentage Change in Aid, 2011-12 to 2014-15
School District Key Facts
Teacher Effectiveness 2013-14
2013-14 Academic Performance2013-14 School Demographics% of Free & Reduced Price
Lunch Students (FRPL)
% Minority Students
100.0%
96.7%
Juan Morel Campos Secondary SchoolNYC Geographic District #14 - Kings County
Need Resource Category
2014-15 Status
Has the School Been Failing Since 2005-06?
Number of Consecutive Years Failing Since 2005-06
Priority / Failing
No
Summary
Joseph LentolDaniel Squadron
Assembly District # 50Senate District # 26
119

State Avg. School3-8 Math 35.8% 8.2%3-8 ELA 31.4% 8.1%
Grad. Rate 76.4% N/A
Total School Enrollment, 2005-06 to 2013-142005-06 2006-07 2007-08 2008-09 2009-10 2010-11 2011-12 2012-13 2013-14
580 483 441 477 498 499 491 461 491
2011-12 Enacted School Aid $7,662,346,0274 2014-15 Enacted School Aid $8,689,947,1545 $ Change + $1,027,601,127 % Highly Effective 9%6 % Change + 13.4% % Effective 83%7 % Developing 7%
2014-15 Estimated Public Enrollment 1,056,195 % Ineffective 1%8 2014-15 Formula Based State Aid Per Pupil $8,2289
2012-13 Spending Per Pupil: All Sources (Census) $20,2262012-13 National Average (Census) $10,608
% Above National Average + 90.7%#
#
# % Free or Reduced Price Lunch (FRPL) Students 76.1%% Students English Language Learners (ELL) 12.7%
# 21 20 19 18 17 16 15
10
+ 13.4%
High Need - New York City
Fiscal & Demographic Factors
Percentage Change in Aid, 2011-12 to 2014-15
School District Key Facts
Teacher Effectiveness 2013-14
2013-14 Academic Performance2013-14 School Demographics% of Free & Reduced Price
Lunch Students (FRPL)
% Minority Students
89.4%
94.9%
IS 136 Charles O DeweyNYC Geographic District #15 - Kings County
Need Resource Category
2014-15 Status
Has the School Been Failing Since 2005-06?
Number of Consecutive Years Failing Since 2005-06
Priority / Failing
Yes
Summary
Felix OrtizVelmanette Montgomery
Assembly District # 51Senate District # 25
120

State Avg. School3-8 Math 35.8% N/A3-8 ELA 31.4% N/A
Grad. Rate 76.4% 39.8%
Total School Enrollment, 2005-06 to 2013-142005-06 2006-07 2007-08 2008-09 2009-10 2010-11 2011-12 2012-13 2013-144,400 4,045 3,710 2,847 2,302 1,954 1,597 1,127 895
2011-12 Enacted School Aid $7,662,346,0274 2014-15 Enacted School Aid $8,689,947,1545 $ Change + $1,027,601,127 % Highly Effective 9%6 % Change + 13.4% % Effective 83%7 % Developing 7%
2014-15 Estimated Public Enrollment 1,056,195 % Ineffective 1%8 2014-15 Formula Based State Aid Per Pupil $8,2289
2012-13 Spending Per Pupil: All Sources (Census) $20,2262012-13 National Average (Census) $10,608
% Above National Average + 90.7%#
#
# % Free or Reduced Price Lunch (FRPL) Students 76.1%% Students English Language Learners (ELL) 12.7%
# 21 20 19 18 17 16 15
10
+ 13.4%
High Need - New York City
Fiscal & Demographic Factors
Percentage Change in Aid, 2011-12 to 2014-15
School District Key Facts
Teacher Effectiveness 2013-14
2013-14 Academic Performance2013-14 School Demographics% of Free & Reduced Price
Lunch Students (FRPL)
% Minority Students
84.4%
99.5%
Boys And Girls High SchoolNYC Geographic District #16 - Kings County
Need Resource Category
2014-15 Status
Has the School Been Failing Since 2005-06?
Number of Consecutive Years Failing Since 2005-06
Priority / Failing
Yes
Summary
Annette RobinsonVelmanette Montgomery
Assembly District # 56Senate District # 25
121

State Avg. School3-8 Math 35.8% 4.0%3-8 ELA 31.4% 0.0%
Grad. Rate 76.4% 45.5%
Total School Enrollment, 2005-06 to 2013-142005-06 2006-07 2007-08 2008-09 2009-10 2010-11 2011-12 2012-13 2013-14
348 424 472 504 506 467 438 257 161
2011-12 Enacted School Aid $7,662,346,0274 2014-15 Enacted School Aid $8,689,947,1545 $ Change + $1,027,601,127 % Highly Effective 9%6 % Change + 13.4% % Effective 83%7 % Developing 7%
2014-15 Estimated Public Enrollment 1,056,195 % Ineffective 1%8 2014-15 Formula Based State Aid Per Pupil $8,2289
2012-13 Spending Per Pupil: All Sources (Census) $20,2262012-13 National Average (Census) $10,608
% Above National Average + 90.7%#
#
# % Free or Reduced Price Lunch (FRPL) Students 76.1%% Students English Language Learners (ELL) 12.7%
# 21 20 19 18 17 16 15
4
+ 13.4%
High Need - New York City
Fiscal & Demographic Factors
Percentage Change in Aid, 2011-12 to 2014-15
School District Key Facts
Teacher Effectiveness 2013-14
2013-14 Academic Performance2013-14 School Demographics% of Free & Reduced Price
Lunch Students (FRPL)
% Minority Students
89.1%
99.6%
Frederick Douglass Academy IVNYC Geographic District #16 - Kings County
Need Resource Category
2014-15 Status
Has the School Been Failing Since 2005-06?
Number of Consecutive Years Failing Since 2005-06
Priority / Failing
No
Summary
Annette RobinsonVelmanette Montgomery
Assembly District # 56Senate District # 25
122

State Avg. School3-8 Math 35.8% 4.6%3-8 ELA 31.4% 1.7%
Grad. Rate 76.4% N/A
Total School Enrollment, 2005-06 to 2013-142005-06 2006-07 2007-08 2008-09 2009-10 2010-11 2011-12 2012-13 2013-14
275 276 287 303 269 224 180 147 131
2011-12 Enacted School Aid $7,662,346,0274 2014-15 Enacted School Aid $8,689,947,1545 $ Change + $1,027,601,127 % Highly Effective 9%6 % Change + 13.4% % Effective 83%7 % Developing 7%
2014-15 Estimated Public Enrollment 1,056,195 % Ineffective 1%8 2014-15 Formula Based State Aid Per Pupil $8,2289
2012-13 Spending Per Pupil: All Sources (Census) $20,2262012-13 National Average (Census) $10,608
% Above National Average + 90.7%#
#
# % Free or Reduced Price Lunch (FRPL) Students 76.1%% Students English Language Learners (ELL) 12.7%
# 21 20 19 18 17 16 15
4
+ 13.4%
High Need - New York City
Fiscal & Demographic Factors
Percentage Change in Aid, 2011-12 to 2014-15
School District Key Facts
Teacher Effectiveness 2013-14
2013-14 Academic Performance2013-14 School Demographics% of Free & Reduced Price
Lunch Students (FRPL)
% Minority Students
94.4%
99.4%
MS 584NYC Geographic District #16 - Kings County
Need Resource Category
2014-15 Status
Has the School Been Failing Since 2005-06?
Number of Consecutive Years Failing Since 2005-06
Priority / Failing
No
Summary
Annette RobinsonVelmanette Montgomery
Assembly District # 56Senate District # 25
123

State Avg. School3-8 Math 35.8% N/A3-8 ELA 31.4% N/A
Grad. Rate 76.4% 68.1%
Total School Enrollment, 2005-06 to 2013-142005-06 2006-07 2007-08 2008-09 2009-10 2010-11 2011-12 2012-13 2013-14
212 324 437 423 423 399 384 375 338
2011-12 Enacted School Aid $7,662,346,0274 2014-15 Enacted School Aid $8,689,947,1545 $ Change + $1,027,601,127 % Highly Effective 9%6 % Change + 13.4% % Effective 83%7 % Developing 7%
2014-15 Estimated Public Enrollment 1,056,195 % Ineffective 1%8 2014-15 Formula Based State Aid Per Pupil $8,2289
2012-13 Spending Per Pupil: All Sources (Census) $20,2262012-13 National Average (Census) $10,608
% Above National Average + 90.7%#
#
# % Free or Reduced Price Lunch (FRPL) Students 76.1%% Students English Language Learners (ELL) 12.7%
# 21 20 19 18 17 16 15
4
+ 13.4%
High Need - New York City
Fiscal & Demographic Factors
Percentage Change in Aid, 2011-12 to 2014-15
School District Key Facts
Teacher Effectiveness 2013-14
2013-14 Academic Performance2013-14 School Demographics% of Free & Reduced Price
Lunch Students (FRPL)
% Minority Students
78.1%
99.0%
High School for Youth & Community DevelopmentNYC Geographic District #17 - Kings County
Need Resource Category
2014-15 Status
Has the School Been Failing Since 2005-06?
Number of Consecutive Years Failing Since 2005-06
Priority / Failing
No
Summary
Rodneyse BichotteKevin S. Parker
Assembly District # 42Senate District # 21
124

State Avg. School3-8 Math 35.8% N/A3-8 ELA 31.4% N/A
Grad. Rate 76.4% 7.5%
Total School Enrollment, 2005-06 to 2013-142005-06 2006-07 2007-08 2008-09 2009-10 2010-11 2011-12 2012-13 2013-14
N/A 304 306 302 259 289 194 134 124
2011-12 Enacted School Aid $7,662,346,0274 2014-15 Enacted School Aid $8,689,947,1545 $ Change + $1,027,601,127 % Highly Effective 9%6 % Change + 13.4% % Effective 83%7 % Developing 7%
2014-15 Estimated Public Enrollment 1,056,195 % Ineffective 1%8 2014-15 Formula Based State Aid Per Pupil $8,2289
2012-13 Spending Per Pupil: All Sources (Census) $20,2262012-13 National Average (Census) $10,608
% Above National Average + 90.7%#
#
# % Free or Reduced Price Lunch (FRPL) Students 76.1%% Students English Language Learners (ELL) 12.7%
# 21 20 19 18 17 16 15
8
+ 13.4%
High Need - New York City
Fiscal & Demographic Factors
Percentage Change in Aid, 2011-12 to 2014-15
School District Key Facts
Teacher Effectiveness 2013-14
2013-14 Academic Performance2013-14 School Demographics% of Free & Reduced Price
Lunch Students (FRPL)
% Minority Students
84.8%
99.7%
W E B Dubois Academic High SchoolNYC Geographic District #17 - Kings County
Need Resource Category
2014-15 Status
Has the School Been Failing Since 2005-06?
Number of Consecutive Years Failing Since 2005-06
Priority / Failing
No
Summary
Walter MosleyJesse Hamilton
Assembly District # 57Senate District # 20
125

State Avg. School3-8 Math 35.8% 6.8%3-8 ELA 31.4% 3.6%
Grad. Rate 76.4% N/A
Total School Enrollment, 2005-06 to 2013-142005-06 2006-07 2007-08 2008-09 2009-10 2010-11 2011-12 2012-13 2013-14
N/A N/A 89 143 252 241 282 273 245
2011-12 Enacted School Aid $7,662,346,0274 2014-15 Enacted School Aid $8,689,947,1545 $ Change + $1,027,601,127 % Highly Effective 9%6 % Change + 13.4% % Effective 83%7 % Developing 7%
2014-15 Estimated Public Enrollment 1,056,195 % Ineffective 1%8 2014-15 Formula Based State Aid Per Pupil $8,2289
2012-13 Spending Per Pupil: All Sources (Census) $20,2262012-13 National Average (Census) $10,608
% Above National Average + 90.7%#
#
# % Free or Reduced Price Lunch (FRPL) Students 76.1%% Students English Language Learners (ELL) 12.7%
# 21 20 19 18 17 16 15
4
+ 13.4%
High Need - New York City
Fiscal & Demographic Factors
Percentage Change in Aid, 2011-12 to 2014-15
School District Key Facts
Teacher Effectiveness 2013-14
2013-14 Academic Performance2013-14 School Demographics% of Free & Reduced Price
Lunch Students (FRPL)
% Minority Students
68.9%
99.2%
East Flatbush Community Research SchoolNYC Geographic District #18 - Kings County
Need Resource Category
2014-15 Status
Has the School Been Failing Since 2005-06?
Number of Consecutive Years Failing Since 2005-06
Priority / Failing
No
Summary
N. Nick PerryJesse Hamilton
Assembly District # 58Senate District # 20
126

State Avg. School3-8 Math 35.8% N/A3-8 ELA 31.4% N/A
Grad. Rate 76.4% 47.1%
Total School Enrollment, 2005-06 to 2013-142005-06 2006-07 2007-08 2008-09 2009-10 2010-11 2011-12 2012-13 2013-14
N/A N/A N/A 320 420 433 434 417 370
2011-12 Enacted School Aid $7,662,346,0274 2014-15 Enacted School Aid $8,689,947,1545 $ Change + $1,027,601,127 % Highly Effective 9%6 % Change + 13.4% % Effective 83%7 % Developing 7%
2014-15 Estimated Public Enrollment 1,056,195 % Ineffective 1%8 2014-15 Formula Based State Aid Per Pupil $8,2289
2012-13 Spending Per Pupil: All Sources (Census) $20,2262012-13 National Average (Census) $10,608
% Above National Average + 90.7%#
#
# % Free or Reduced Price Lunch (FRPL) Students 76.1%% Students English Language Learners (ELL) 12.7%
# 21 20 19 18 17 16 15
4
+ 13.4%
High Need - New York City
Fiscal & Demographic Factors
Percentage Change in Aid, 2011-12 to 2014-15
School District Key Facts
Teacher Effectiveness 2013-14
2013-14 Academic Performance2013-14 School Demographics% of Free & Reduced Price
Lunch Students (FRPL)
% Minority Students
70.7%
98.6%
Cypress Hills Collegiate Prep SchoolNYC Geographic District #19 - Kings County
Need Resource Category
2014-15 Status
Has the School Been Failing Since 2005-06?
Number of Consecutive Years Failing Since 2005-06
Priority / Failing
No
Summary
Erik DilanMartin Malavé Dilan
Assembly District # 54Senate District # 18
127

State Avg. School3-8 Math 35.8% N/A3-8 ELA 31.4% N/A
Grad. Rate 76.4% 64.1%
Total School Enrollment, 2005-06 to 2013-142005-06 2006-07 2007-08 2008-09 2009-10 2010-11 2011-12 2012-13 2013-14
210 306 389 397 420 403 378 336 299
2011-12 Enacted School Aid $7,662,346,0274 2014-15 Enacted School Aid $8,689,947,1545 $ Change + $1,027,601,127 % Highly Effective 9%6 % Change + 13.4% % Effective 83%7 % Developing 7%
2014-15 Estimated Public Enrollment 1,056,195 % Ineffective 1%8 2014-15 Formula Based State Aid Per Pupil $8,2289
2012-13 Spending Per Pupil: All Sources (Census) $20,2262012-13 National Average (Census) $10,608
% Above National Average + 90.7%#
#
# % Free or Reduced Price Lunch (FRPL) Students 76.1%% Students English Language Learners (ELL) 12.7%
# 21 20 19 18 17 16 15
5
+ 13.4%
High Need - New York City
Fiscal & Demographic Factors
Percentage Change in Aid, 2011-12 to 2014-15
School District Key Facts
Teacher Effectiveness 2013-14
2013-14 Academic Performance2013-14 School Demographics% of Free & Reduced Price
Lunch Students (FRPL)
% Minority Students
75.2%
99.0%
Fdny High School - Fire & Life SafetyNYC Geographic District #19 - Kings County
Need Resource Category
2014-15 Status
Has the School Been Failing Since 2005-06?
Number of Consecutive Years Failing Since 2005-06
Priority / Failing
No
Summary
Charles BarronJohn L. Sampson
Assembly District # 60Senate District # 19
128

State Avg. School3-8 Math 35.8% 1.0%3-8 ELA 31.4% 3.1%
Grad. Rate 76.4% N/A
Total School Enrollment, 2005-06 to 2013-142005-06 2006-07 2007-08 2008-09 2009-10 2010-11 2011-12 2012-13 2013-14
790 667 572 543 559 517 442 392 230
2011-12 Enacted School Aid $7,662,346,0274 2014-15 Enacted School Aid $8,689,947,1545 $ Change + $1,027,601,127 % Highly Effective 9%6 % Change + 13.4% % Effective 83%7 % Developing 7%
2014-15 Estimated Public Enrollment 1,056,195 % Ineffective 1%8 2014-15 Formula Based State Aid Per Pupil $8,2289
2012-13 Spending Per Pupil: All Sources (Census) $20,2262012-13 National Average (Census) $10,608
% Above National Average + 90.7%#
#
# % Free or Reduced Price Lunch (FRPL) Students 76.1%% Students English Language Learners (ELL) 12.7%
# 21 20 19 18 17 16 15
10
+ 13.4%
High Need - New York City
Fiscal & Demographic Factors
Percentage Change in Aid, 2011-12 to 2014-15
School District Key Facts
Teacher Effectiveness 2013-14
2013-14 Academic Performance2013-14 School Demographics% of Free & Reduced Price
Lunch Students (FRPL)
% Minority Students
85.7%
99.8%
JHS 166 George GershwinNYC Geographic District #19 - Kings County
Need Resource Category
2014-15 Status
Has the School Been Failing Since 2005-06?
Number of Consecutive Years Failing Since 2005-06
Priority / Failing
Yes
Summary
Charles BarronJohn L. Sampson
Assembly District # 60Senate District # 19
129

State Avg. School3-8 Math 35.8% 7.9%3-8 ELA 31.4% 7.6%
Grad. Rate 76.4% N/A
Total School Enrollment, 2005-06 to 2013-142005-06 2006-07 2007-08 2008-09 2009-10 2010-11 2011-12 2012-13 2013-141,263 1,128 1,002 953 1,017 977 924 887 551
2011-12 Enacted School Aid $7,662,346,0274 2014-15 Enacted School Aid $8,689,947,1545 $ Change + $1,027,601,127 % Highly Effective 9%6 % Change + 13.4% % Effective 83%7 % Developing 7%
2014-15 Estimated Public Enrollment 1,056,195 % Ineffective 1%8 2014-15 Formula Based State Aid Per Pupil $8,2289
2012-13 Spending Per Pupil: All Sources (Census) $20,2262012-13 National Average (Census) $10,608
% Above National Average + 90.7%#
#
# % Free or Reduced Price Lunch (FRPL) Students 76.1%% Students English Language Learners (ELL) 12.7%
# 21 20 19 18 17 16 15
10
+ 13.4%
High Need - New York City
Fiscal & Demographic Factors
Percentage Change in Aid, 2011-12 to 2014-15
School District Key Facts
Teacher Effectiveness 2013-14
2013-14 Academic Performance2013-14 School Demographics% of Free & Reduced Price
Lunch Students (FRPL)
% Minority Students
80.0%
99.3%
JHS 302 Rafael CorderoNYC Geographic District #19 - Kings County
Need Resource Category
2014-15 Status
Has the School Been Failing Since 2005-06?
Number of Consecutive Years Failing Since 2005-06
Priority / Failing
Yes
Summary
Erik DilanMartin Malavé Dilan
Assembly District # 54Senate District # 18
130

State Avg. School3-8 Math 35.8% 4.4%3-8 ELA 31.4% 3.7%
Grad. Rate 76.4% N/A
Total School Enrollment, 2005-06 to 2013-142005-06 2006-07 2007-08 2008-09 2009-10 2010-11 2011-12 2012-13 2013-14
738 693 602 558 533 494 454 398 363
2011-12 Enacted School Aid $7,662,346,0274 2014-15 Enacted School Aid $8,689,947,1545 $ Change + $1,027,601,127 % Highly Effective 9%6 % Change + 13.4% % Effective 83%7 % Developing 7%
2014-15 Estimated Public Enrollment 1,056,195 % Ineffective 1%8 2014-15 Formula Based State Aid Per Pupil $8,2289
2012-13 Spending Per Pupil: All Sources (Census) $20,2262012-13 National Average (Census) $10,608
% Above National Average + 90.7%#
#
# % Free or Reduced Price Lunch (FRPL) Students 76.1%% Students English Language Learners (ELL) 12.7%
# 21 20 19 18 17 16 15
10
+ 13.4%
High Need - New York City
Fiscal & Demographic Factors
Percentage Change in Aid, 2011-12 to 2014-15
School District Key Facts
Teacher Effectiveness 2013-14
2013-14 Academic Performance2013-14 School Demographics% of Free & Reduced Price
Lunch Students (FRPL)
% Minority Students
98.4%
100.0%
PS 328 Phyllis WheatleyNYC Geographic District #19 - Kings County
Need Resource Category
2014-15 Status
Has the School Been Failing Since 2005-06?
Number of Consecutive Years Failing Since 2005-06
Priority / Failing
Yes
Summary
Charles BarronJohn L. Sampson
Assembly District # 60Senate District # 19
131

State Avg. School3-8 Math 35.8% N/A3-8 ELA 31.4% N/A
Grad. Rate 76.4% 43.8%
Total School Enrollment, 2005-06 to 2013-142005-06 2006-07 2007-08 2008-09 2009-10 2010-11 2011-12 2012-13 2013-143,531 2,981 2,673 2,458 2,280 2,152 1,924 1,624 1,140
2011-12 Enacted School Aid $7,662,346,0274 2014-15 Enacted School Aid $8,689,947,1545 $ Change + $1,027,601,127 % Highly Effective 9%6 % Change + 13.4% % Effective 83%7 % Developing 7%
2014-15 Estimated Public Enrollment 1,056,195 % Ineffective 1%8 2014-15 Formula Based State Aid Per Pupil $8,2289
2012-13 Spending Per Pupil: All Sources (Census) $20,2262012-13 National Average (Census) $10,608
% Above National Average + 90.7%#
#
# % Free or Reduced Price Lunch (FRPL) Students 76.1%% Students English Language Learners (ELL) 12.7%
# 21 20 19 18 17 16 15
10
+ 13.4%
High Need - New York City
Fiscal & Demographic Factors
Percentage Change in Aid, 2011-12 to 2014-15
School District Key Facts
Teacher Effectiveness 2013-14
2013-14 Academic Performance2013-14 School Demographics% of Free & Reduced Price
Lunch Students (FRPL)
% Minority Students
56.6%
92.0%
Sheepshead Bay High SchoolNYC Geographic District #22 - Kings County
Need Resource Category
2014-15 Status
Has the School Been Failing Since 2005-06?
Number of Consecutive Years Failing Since 2005-06
Priority / Failing
Yes
Summary
Helene Weinstein John L. Sampson
Assembly District # 41Senate District # 19
132

State Avg. School3-8 Math 35.8% N/A3-8 ELA 31.4% N/A
Grad. Rate 76.4% 6.8%
Total School Enrollment, 2005-06 to 2013-142005-06 2006-07 2007-08 2008-09 2009-10 2010-11 2011-12 2012-13 2013-14
N/A N/A N/A 150 272 270 267 243 233
2011-12 Enacted School Aid $7,662,346,0274 2014-15 Enacted School Aid $8,689,947,1545 $ Change + $1,027,601,127 % Highly Effective 9%6 % Change + 13.4% % Effective 83%7 % Developing 7%
2014-15 Estimated Public Enrollment 1,056,195 % Ineffective 1%8 2014-15 Formula Based State Aid Per Pupil $8,2289
2012-13 Spending Per Pupil: All Sources (Census) $20,2262012-13 National Average (Census) $10,608
% Above National Average + 90.7%#
#
# % Free or Reduced Price Lunch (FRPL) Students 76.1%% Students English Language Learners (ELL) 12.7%
# 21 20 19 18 17 16 15
4
+ 13.4%
High Need - New York City
Fiscal & Demographic Factors
Percentage Change in Aid, 2011-12 to 2014-15
School District Key Facts
Teacher Effectiveness 2013-14
2013-14 Academic Performance2013-14 School Demographics% of Free & Reduced Price
Lunch Students (FRPL)
% Minority Students
72.3%
99.6%
Aspirations Diploma Plus High SchoolNYC Geographic District #23 - Kings County
Need Resource Category
2014-15 Status
Has the School Been Failing Since 2005-06?
Number of Consecutive Years Failing Since 2005-06
Priority / Failing
No
Summary
Latrice WalkerMartin Malavé Dilan
Assembly District # 55Senate District # 18
133

State Avg. School3-8 Math 35.8% 3.0%3-8 ELA 31.4% 5.3%
Grad. Rate 76.4% N/A
Total School Enrollment, 2005-06 to 2013-142005-06 2006-07 2007-08 2008-09 2009-10 2010-11 2011-12 2012-13 2013-14
N/A N/A N/A 235 208 204 208 174 86
2011-12 Enacted School Aid $7,662,346,0274 2014-15 Enacted School Aid $8,689,947,1545 $ Change + $1,027,601,127 % Highly Effective 9%6 % Change + 13.4% % Effective 83%7 % Developing 7%
2014-15 Estimated Public Enrollment 1,056,195 % Ineffective 1%8 2014-15 Formula Based State Aid Per Pupil $8,2289
2012-13 Spending Per Pupil: All Sources (Census) $20,2262012-13 National Average (Census) $10,608
% Above National Average + 90.7%#
#
# % Free or Reduced Price Lunch (FRPL) Students 76.1%% Students English Language Learners (ELL) 12.7%
# 21 20 19 18 17 16 15
4
+ 13.4%
High Need - New York City
Fiscal & Demographic Factors
Percentage Change in Aid, 2011-12 to 2014-15
School District Key Facts
Teacher Effectiveness 2013-14
2013-14 Academic Performance2013-14 School Demographics% of Free & Reduced Price
Lunch Students (FRPL)
% Minority Students
82.2%
100.0%
General D Chappie James Middle SchoolNYC Geographic District #23 - Kings County
Need Resource Category
2014-15 Status
Has the School Been Failing Since 2005-06?
Number of Consecutive Years Failing Since 2005-06
Priority / Failing
No
Summary
Latrice WalkerJohn L. Sampson
Assembly District # 55Senate District # 19
134

State Avg. School3-8 Math 35.8% 9.1%3-8 ELA 31.4% 11.1%
Grad. Rate 76.4% N/A
Total School Enrollment, 2005-06 to 2013-142005-06 2006-07 2007-08 2008-09 2009-10 2010-11 2011-12 2012-13 2013-14
569 602 638 620 615 569 558 506 445
2011-12 Enacted School Aid $7,662,346,0274 2014-15 Enacted School Aid $8,689,947,1545 $ Change + $1,027,601,127 % Highly Effective 9%6 % Change + 13.4% % Effective 83%7 % Developing 7%
2014-15 Estimated Public Enrollment 1,056,195 % Ineffective 1%8 2014-15 Formula Based State Aid Per Pupil $8,2289
2012-13 Spending Per Pupil: All Sources (Census) $20,2262012-13 National Average (Census) $10,608
% Above National Average + 90.7%#
#
# % Free or Reduced Price Lunch (FRPL) Students 76.1%% Students English Language Learners (ELL) 12.7%
# 21 20 19 18 17 16 15
5
+ 13.4%
High Need - New York City
Fiscal & Demographic Factors
Percentage Change in Aid, 2011-12 to 2014-15
School District Key Facts
Teacher Effectiveness 2013-14
2013-14 Academic Performance2013-14 School Demographics% of Free & Reduced Price
Lunch Students (FRPL)
% Minority Students
87.2%
98.8%
PS 165 Ida PosnerNYC Geographic District #23 - Kings County
Need Resource Category
2014-15 Status
Has the School Been Failing Since 2005-06?
Number of Consecutive Years Failing Since 2005-06
Priority / Failing
No
Summary
N. Nick PerryJohn L. Sampson
Assembly District # 58Senate District # 19
135

State Avg. School3-8 Math 35.8% 1.7%3-8 ELA 31.4% 6.5%
Grad. Rate 76.4% N/A
Total School Enrollment, 2005-06 to 2013-142005-06 2006-07 2007-08 2008-09 2009-10 2010-11 2011-12 2012-13 2013-14
657 652 585 506 512 522 461 326 253
2011-12 Enacted School Aid $7,662,346,0274 2014-15 Enacted School Aid $8,689,947,1545 $ Change + $1,027,601,127 % Highly Effective 9%6 % Change + 13.4% % Effective 83%7 % Developing 7%
2014-15 Estimated Public Enrollment 1,056,195 % Ineffective 1%8 2014-15 Formula Based State Aid Per Pupil $8,2289
2012-13 Spending Per Pupil: All Sources (Census) $20,2262012-13 National Average (Census) $10,608
% Above National Average + 90.7%#
#
# % Free or Reduced Price Lunch (FRPL) Students 76.1%% Students English Language Learners (ELL) 12.7%
# 21 20 19 18 17 16 15
4
+ 13.4%
High Need - New York City
Fiscal & Demographic Factors
Percentage Change in Aid, 2011-12 to 2014-15
School District Key Facts
Teacher Effectiveness 2013-14
2013-14 Academic Performance2013-14 School Demographics% of Free & Reduced Price
Lunch Students (FRPL)
% Minority Students
93.9%
99.4%
PS 298 Dr Betty ShabazzNYC Geographic District #23 - Kings County
Need Resource Category
2014-15 Status
Has the School Been Failing Since 2005-06?
Number of Consecutive Years Failing Since 2005-06
Priority / Failing
No
Summary
Latrice WalkerJohn L. Sampson
Assembly District # 55Senate District # 19
136

State Avg. School3-8 Math 35.8% N/A3-8 ELA 31.4% N/A
Grad. Rate 76.4% 51.5%
Total School Enrollment, 2005-06 to 2013-142005-06 2006-07 2007-08 2008-09 2009-10 2010-11 2011-12 2012-13 2013-143,058 3,051 2,957 2,774 2,668 2,425 2,063 1,908 1,866
2011-12 Enacted School Aid $7,662,346,0274 2014-15 Enacted School Aid $8,689,947,1545 $ Change + $1,027,601,127 % Highly Effective 9%6 % Change + 13.4% % Effective 83%7 % Developing 7%
2014-15 Estimated Public Enrollment 1,056,195 % Ineffective 1%8 2014-15 Formula Based State Aid Per Pupil $8,2289
2012-13 Spending Per Pupil: All Sources (Census) $20,2262012-13 National Average (Census) $10,608
% Above National Average + 90.7%#
#
# % Free or Reduced Price Lunch (FRPL) Students 76.1%% Students English Language Learners (ELL) 12.7%
# 21 20 19 18 17 16 15
10
+ 13.4%
High Need - New York City
Fiscal & Demographic Factors
Percentage Change in Aid, 2011-12 to 2014-15
School District Key Facts
Teacher Effectiveness 2013-14
2013-14 Academic Performance2013-14 School Demographics% of Free & Reduced Price
Lunch Students (FRPL)
% Minority Students
13.8%
78.2%
Grover Cleveland High SchoolNYC Geographic District #24 - Queens County
Need Resource Category
2014-15 Status
Has the School Been Failing Since 2005-06?
Number of Consecutive Years Failing Since 2005-06
Priority / Failing
Yes
Summary
Catherine NolanJoseph P. Addabbo Jr
Assembly District # 37Senate District # 15
137

State Avg. School3-8 Math 35.8% N/A3-8 ELA 31.4% N/A
Grad. Rate 76.4% 52.5%
Total School Enrollment, 2005-06 to 2013-142005-06 2006-07 2007-08 2008-09 2009-10 2010-11 2011-12 2012-13 2013-142,661 2,544 2,613 2,618 2,758 3,045 3,116 2,948 2,559
2011-12 Enacted School Aid $7,662,346,0274 2014-15 Enacted School Aid $8,689,947,1545 $ Change + $1,027,601,127 % Highly Effective 9%6 % Change + 13.4% % Effective 83%7 % Developing 7%
2014-15 Estimated Public Enrollment 1,056,195 % Ineffective 1%8 2014-15 Formula Based State Aid Per Pupil $8,2289
2012-13 Spending Per Pupil: All Sources (Census) $20,2262012-13 National Average (Census) $10,608
% Above National Average + 90.7%#
#
# % Free or Reduced Price Lunch (FRPL) Students 76.1%% Students English Language Learners (ELL) 12.7%
# 21 20 19 18 17 16 15
10
+ 13.4%
High Need - New York City
Fiscal & Demographic Factors
Percentage Change in Aid, 2011-12 to 2014-15
School District Key Facts
Teacher Effectiveness 2013-14
2013-14 Academic Performance2013-14 School Demographics% of Free & Reduced Price
Lunch Students (FRPL)
% Minority Students
8.9%
97.0%
Flushing High SchoolNYC Geographic District #25 - Queens County
Need Resource Category
2014-15 Status
Has the School Been Failing Since 2005-06?
Number of Consecutive Years Failing Since 2005-06
Priority / Failing
Yes
Summary
Ron KimToby Ann Stavisky
Assembly District # 40Senate District # 16
138

State Avg. School3-8 Math 35.8% N/A3-8 ELA 31.4% N/A
Grad. Rate 76.4% 49.1%
Total School Enrollment, 2005-06 to 2013-142005-06 2006-07 2007-08 2008-09 2009-10 2010-11 2011-12 2012-13 2013-143,425 3,283 3,169 2,952 2,817 2,551 2,367 2,155 2,041
2011-12 Enacted School Aid $7,662,346,0274 2014-15 Enacted School Aid $8,689,947,1545 $ Change + $1,027,601,127 % Highly Effective 9%6 % Change + 13.4% % Effective 83%7 % Developing 7%
2014-15 Estimated Public Enrollment 1,056,195 % Ineffective 1%8 2014-15 Formula Based State Aid Per Pupil $8,2289
2012-13 Spending Per Pupil: All Sources (Census) $20,2262012-13 National Average (Census) $10,608
% Above National Average + 90.7%#
#
# % Free or Reduced Price Lunch (FRPL) Students 76.1%% Students English Language Learners (ELL) 12.7%
# 21 20 19 18 17 16 15
5
+ 13.4%
High Need - New York City
Fiscal & Demographic Factors
Percentage Change in Aid, 2011-12 to 2014-15
School District Key Facts
Teacher Effectiveness 2013-14
2013-14 Academic Performance2013-14 School Demographics% of Free & Reduced Price
Lunch Students (FRPL)
% Minority Students
3.3%
97.3%
Martin Van Buren High SchoolNYC Geographic District #26 - Queens County
Need Resource Category
2014-15 Status
Has the School Been Failing Since 2005-06?
Number of Consecutive Years Failing Since 2005-06
Priority / Failing
No
Summary
Barbara ClarkLeroy Comrie
Assembly District # 33Senate District # 14
139

State Avg. School3-8 Math 35.8% N/A3-8 ELA 31.4% N/A
Grad. Rate 76.4% 28.4%
Total School Enrollment, 2005-06 to 2013-142005-06 2006-07 2007-08 2008-09 2009-10 2010-11 2011-12 2012-13 2013-141,715 1,512 1,382 1,226 1,229 1,170 1,024 958 823
2011-12 Enacted School Aid $7,662,346,0274 2014-15 Enacted School Aid $8,689,947,1545 $ Change + $1,027,601,127 % Highly Effective 9%6 % Change + 13.4% % Effective 83%7 % Developing 7%
2014-15 Estimated Public Enrollment 1,056,195 % Ineffective 1%8 2014-15 Formula Based State Aid Per Pupil $8,2289
2012-13 Spending Per Pupil: All Sources (Census) $20,2262012-13 National Average (Census) $10,608
% Above National Average + 90.7%#
#
# % Free or Reduced Price Lunch (FRPL) Students 76.1%% Students English Language Learners (ELL) 12.7%
# 21 20 19 18 17 16 15
10
+ 13.4%
High Need - New York City
Fiscal & Demographic Factors
Percentage Change in Aid, 2011-12 to 2014-15
School District Key Facts
Teacher Effectiveness 2013-14
2013-14 Academic Performance2013-14 School Demographics% of Free & Reduced Price
Lunch Students (FRPL)
% Minority Students
68.5%
98.7%
August Martin High SchoolNYC Geographic District #27 - Queens County
Need Resource Category
2014-15 Status
Has the School Been Failing Since 2005-06?
Number of Consecutive Years Failing Since 2005-06
Priority / Failing
Yes
Summary
Vivan CookJames Sanders Jr.
Assembly District # 32Senate District # 10
140

State Avg. School3-8 Math 35.8% N/A3-8 ELA 31.4% N/A
Grad. Rate 76.4% 51.4%
Total School Enrollment, 2005-06 to 2013-142005-06 2006-07 2007-08 2008-09 2009-10 2010-11 2011-12 2012-13 2013-143,358 3,173 3,276 3,370 3,252 3,309 3,325 3,121 2,778
2011-12 Enacted School Aid $7,662,346,0274 2014-15 Enacted School Aid $8,689,947,1545 $ Change + $1,027,601,127 % Highly Effective 9%6 % Change + 13.4% % Effective 83%7 % Developing 7%
2014-15 Estimated Public Enrollment 1,056,195 % Ineffective 1%8 2014-15 Formula Based State Aid Per Pupil $8,2289
2012-13 Spending Per Pupil: All Sources (Census) $20,2262012-13 National Average (Census) $10,608
% Above National Average + 90.7%#
#
# % Free or Reduced Price Lunch (FRPL) Students 76.1%% Students English Language Learners (ELL) 12.7%
# 21 20 19 18 17 16 15
10
+ 13.4%
High Need - New York City
Fiscal & Demographic Factors
Percentage Change in Aid, 2011-12 to 2014-15
School District Key Facts
Teacher Effectiveness 2013-14
2013-14 Academic Performance2013-14 School Demographics% of Free & Reduced Price
Lunch Students (FRPL)
% Minority Students
9.1%
96.6%
John Adams High SchoolNYC Geographic District #27 - Queens County
Need Resource Category
2014-15 Status
Has the School Been Failing Since 2005-06?
Number of Consecutive Years Failing Since 2005-06
Priority / Failing
Yes
Summary
Michael MillerJames Sanders Jr.
Assembly District # 38Senate District # 10
141

State Avg. School3-8 Math 35.8% 2.8%3-8 ELA 31.4% 5.7%
Grad. Rate 76.4% N/A
Total School Enrollment, 2005-06 to 2013-142005-06 2006-07 2007-08 2008-09 2009-10 2010-11 2011-12 2012-13 2013-14
883 762 649 620 549 504 445 387 347
2011-12 Enacted School Aid $7,662,346,0274 2014-15 Enacted School Aid $8,689,947,1545 $ Change + $1,027,601,127 % Highly Effective 9%6 % Change + 13.4% % Effective 83%7 % Developing 7%
2014-15 Estimated Public Enrollment 1,056,195 % Ineffective 1%8 2014-15 Formula Based State Aid Per Pupil $8,2289
2012-13 Spending Per Pupil: All Sources (Census) $20,2262012-13 National Average (Census) $10,608
% Above National Average + 90.7%#
#
# % Free or Reduced Price Lunch (FRPL) Students 76.1%% Students English Language Learners (ELL) 12.7%
# 21 20 19 18 17 16 15
10
+ 13.4%
High Need - New York City
Fiscal & Demographic Factors
Percentage Change in Aid, 2011-12 to 2014-15
School District Key Facts
Teacher Effectiveness 2013-14
2013-14 Academic Performance2013-14 School Demographics% of Free & Reduced Price
Lunch Students (FRPL)
% Minority Students
80.1%
99.2%
MS 53 Brian PiccoloNYC Geographic District #27 - Queens County
Need Resource Category
2014-15 Status
Has the School Been Failing Since 2005-06?
Number of Consecutive Years Failing Since 2005-06
Priority / Failing
Yes
Summary
Phillip GoldfederJames Sanders Jr.
Assembly District # 23Senate District # 10
142

State Avg. School3-8 Math 35.8% N/A3-8 ELA 31.4% N/A
Grad. Rate 76.4% 48.5%
Total School Enrollment, 2005-06 to 2013-142005-06 2006-07 2007-08 2008-09 2009-10 2010-11 2011-12 2012-13 2013-143,619 3,676 3,602 3,507 3,179 2,918 2,547 2,287 2,181
2011-12 Enacted School Aid $7,662,346,0274 2014-15 Enacted School Aid $8,689,947,1545 $ Change + $1,027,601,127 % Highly Effective 9%6 % Change + 13.4% % Effective 83%7 % Developing 7%
2014-15 Estimated Public Enrollment 1,056,195 % Ineffective 1%8 2014-15 Formula Based State Aid Per Pupil $8,2289
2012-13 Spending Per Pupil: All Sources (Census) $20,2262012-13 National Average (Census) $10,608
% Above National Average + 90.7%#
#
# % Free or Reduced Price Lunch (FRPL) Students 76.1%% Students English Language Learners (ELL) 12.7%
# 21 20 19 18 17 16 15
10
+ 13.4%
High Need - New York City
Fiscal & Demographic Factors
Percentage Change in Aid, 2011-12 to 2014-15
School District Key Facts
Teacher Effectiveness 2013-14
2013-14 Academic Performance2013-14 School Demographics% of Free & Reduced Price
Lunch Students (FRPL)
% Minority Students
66.9%
97.6%
Richmond Hill High SchoolNYC Geographic District #27 - Queens County
Need Resource Category
2014-15 Status
Has the School Been Failing Since 2005-06?
Number of Consecutive Years Failing Since 2005-06
Priority / Failing
Yes
Summary
David WeprinJames Sanders Jr.
Assembly District # 24Senate District # 10
143

State Avg. School3-8 Math 35.8% 9.8%3-8 ELA 31.4% 11.7%
Grad. Rate 76.4% N/A
Total School Enrollment, 2005-06 to 2013-142005-06 2006-07 2007-08 2008-09 2009-10 2010-11 2011-12 2012-13 2013-141,032 975 908 821 719 742 749 675 573
2011-12 Enacted School Aid $7,662,346,0274 2014-15 Enacted School Aid $8,689,947,1545 $ Change + $1,027,601,127 % Highly Effective 9%6 % Change + 13.4% % Effective 83%7 % Developing 7%
2014-15 Estimated Public Enrollment 1,056,195 % Ineffective 1%8 2014-15 Formula Based State Aid Per Pupil $8,2289
2012-13 Spending Per Pupil: All Sources (Census) $20,2262012-13 National Average (Census) $10,608
% Above National Average + 90.7%#
#
# % Free or Reduced Price Lunch (FRPL) Students 76.1%% Students English Language Learners (ELL) 12.7%
# 21 20 19 18 17 16 15
4
+ 13.4%
High Need - New York City
Fiscal & Demographic Factors
Percentage Change in Aid, 2011-12 to 2014-15
School District Key Facts
Teacher Effectiveness 2013-14
2013-14 Academic Performance2013-14 School Demographics% of Free & Reduced Price
Lunch Students (FRPL)
% Minority Students
80.9%
99.3%
JHS 8 Richard S GrossleyNYC Geographic District #28 - Queens County
Need Resource Category
2014-15 Status
Has the School Been Failing Since 2005-06?
Number of Consecutive Years Failing Since 2005-06
Priority / Failing
No
Summary
Vivan CookLeroy Comrie
Assembly District # 32Senate District # 14
144

State Avg. School3-8 Math 35.8% N/A3-8 ELA 31.4% N/A
Grad. Rate 76.4% 56.2%
Total School Enrollment, 2005-06 to 2013-142005-06 2006-07 2007-08 2008-09 2009-10 2010-11 2011-12 2012-13 2013-143,824 3,432 3,352 3,207 3,307 3,519 3,359 2,973 2,516
2011-12 Enacted School Aid $7,662,346,0274 2014-15 Enacted School Aid $8,689,947,1545 $ Change + $1,027,601,127 % Highly Effective 9%6 % Change + 13.4% % Effective 83%7 % Developing 7%
2014-15 Estimated Public Enrollment 1,056,195 % Ineffective 1%8 2014-15 Formula Based State Aid Per Pupil $8,2289
2012-13 Spending Per Pupil: All Sources (Census) $20,2262012-13 National Average (Census) $10,608
% Above National Average + 90.7%#
#
# % Free or Reduced Price Lunch (FRPL) Students 76.1%% Students English Language Learners (ELL) 12.7%
# 21 20 19 18 17 16 15
10
+ 13.4%
High Need - New York City
Fiscal & Demographic Factors
Percentage Change in Aid, 2011-12 to 2014-15
School District Key Facts
Teacher Effectiveness 2013-14
2013-14 Academic Performance2013-14 School Demographics% of Free & Reduced Price
Lunch Students (FRPL)
% Minority Students
9.9%
89.0%
Long Island City High SchoolNYC Geographic District #30 - Queens County
Need Resource Category
2014-15 Status
Has the School Been Failing Since 2005-06?
Number of Consecutive Years Failing Since 2005-06
Priority / Failing
Yes
Summary
Aravella SimotasMichael Gianaris
Assembly District # 36Senate District # 12
145

State Avg. School3-8 Math 35.8% 9.2%3-8 ELA 31.4% 8.5%
Grad. Rate 76.4% N/A
Total School Enrollment, 2005-06 to 2013-142005-06 2006-07 2007-08 2008-09 2009-10 2010-11 2011-12 2012-13 2013-14
407 362 379 362 404 423 401 415 368
2011-12 Enacted School Aid $7,662,346,0274 2014-15 Enacted School Aid $8,689,947,1545 $ Change + $1,027,601,127 % Highly Effective 9%6 % Change + 13.4% % Effective 83%7 % Developing 7%
2014-15 Estimated Public Enrollment 1,056,195 % Ineffective 1%8 2014-15 Formula Based State Aid Per Pupil $8,2289
2012-13 Spending Per Pupil: All Sources (Census) $20,2262012-13 National Average (Census) $10,608
% Above National Average + 90.7%#
#
# % Free or Reduced Price Lunch (FRPL) Students 76.1%% Students English Language Learners (ELL) 12.7%
# 21 20 19 18 17 16 15
4
+ 13.4%
High Need - New York City
Fiscal & Demographic Factors
Percentage Change in Aid, 2011-12 to 2014-15
School District Key Facts
Teacher Effectiveness 2013-14
2013-14 Academic Performance2013-14 School Demographics% of Free & Reduced Price
Lunch Students (FRPL)
% Minority Students
86.5%
93.5%
PS 111 Jacob BlackwellNYC Geographic District #30 - Queens County
Need Resource Category
2014-15 Status
Has the School Been Failing Since 2005-06?
Number of Consecutive Years Failing Since 2005-06
Priority / Failing
No
Summary
Catherine NolanMichael Gianaris
Assembly District # 37Senate District # 12
146

State Avg. School3-8 Math 35.8% N/A3-8 ELA 31.4% N/A
Grad. Rate 76.4% 61.8%
Total School Enrollment, 2005-06 to 2013-142005-06 2006-07 2007-08 2008-09 2009-10 2010-11 2011-12 2012-13 2013-14
300 417 459 489 482 503 461 414 363
2011-12 Enacted School Aid $7,662,346,0274 2014-15 Enacted School Aid $8,689,947,1545 $ Change + $1,027,601,127 % Highly Effective 9%6 % Change + 13.4% % Effective 83%7 % Developing 7%
2014-15 Estimated Public Enrollment 1,056,195 % Ineffective 1%8 2014-15 Formula Based State Aid Per Pupil $8,2289
2012-13 Spending Per Pupil: All Sources (Census) $20,2262012-13 National Average (Census) $10,608
% Above National Average + 90.7%#
#
# % Free or Reduced Price Lunch (FRPL) Students 76.1%% Students English Language Learners (ELL) 12.7%
# 21 20 19 18 17 16 15
4
+ 13.4%
High Need - New York City
Fiscal & Demographic Factors
Percentage Change in Aid, 2011-12 to 2014-15
School District Key Facts
Teacher Effectiveness 2013-14
2013-14 Academic Performance2013-14 School Demographics% of Free & Reduced Price
Lunch Students (FRPL)
% Minority Students
95.0%
100.0%
Bushwick Leaders High School for Acad ExcellenceNYC Geographic District #32 - Kings County
Need Resource Category
2014-15 Status
Has the School Been Failing Since 2005-06?
Number of Consecutive Years Failing Since 2005-06
Priority / Failing
No
Summary
Erik DilanMartin Malavé Dilan
Assembly District # 54Senate District # 18
147

State Avg. School3-8 Math 35.8% 5.9%3-8 ELA 31.4% 5.9%
Grad. Rate 76.4% N/A
Total School Enrollment, 2005-06 to 2013-142005-06 2006-07 2007-08 2008-09 2009-10 2010-11 2011-12 2012-13 2013-141,020 886 833 686 659 653 641 591 518
2011-12 Enacted School Aid $7,662,346,0274 2014-15 Enacted School Aid $8,689,947,1545 $ Change + $1,027,601,127 % Highly Effective 9%6 % Change + 13.4% % Effective 83%7 % Developing 7%
2014-15 Estimated Public Enrollment 1,056,195 % Ineffective 1%8 2014-15 Formula Based State Aid Per Pupil $8,2289
2012-13 Spending Per Pupil: All Sources (Census) $20,2262012-13 National Average (Census) $10,608
% Above National Average + 90.7%#
#
# % Free or Reduced Price Lunch (FRPL) Students 76.1%% Students English Language Learners (ELL) 12.7%
# 21 20 19 18 17 16 15
10
+ 13.4%
High Need - New York City
Fiscal & Demographic Factors
Percentage Change in Aid, 2011-12 to 2014-15
School District Key Facts
Teacher Effectiveness 2013-14
2013-14 Academic Performance2013-14 School Demographics% of Free & Reduced Price
Lunch Students (FRPL)
% Minority Students
96.4%
99.7%
JHS 291 Roland HayesNYC Geographic District #32 - Kings County
Need Resource Category
2014-15 Status
Has the School Been Failing Since 2005-06?
Number of Consecutive Years Failing Since 2005-06
Priority / Failing
Yes
Summary
Maritza DavilaMartin Malavé Dilan
Assembly District # 53Senate District # 18
148

Poughkeepsie City School District
149
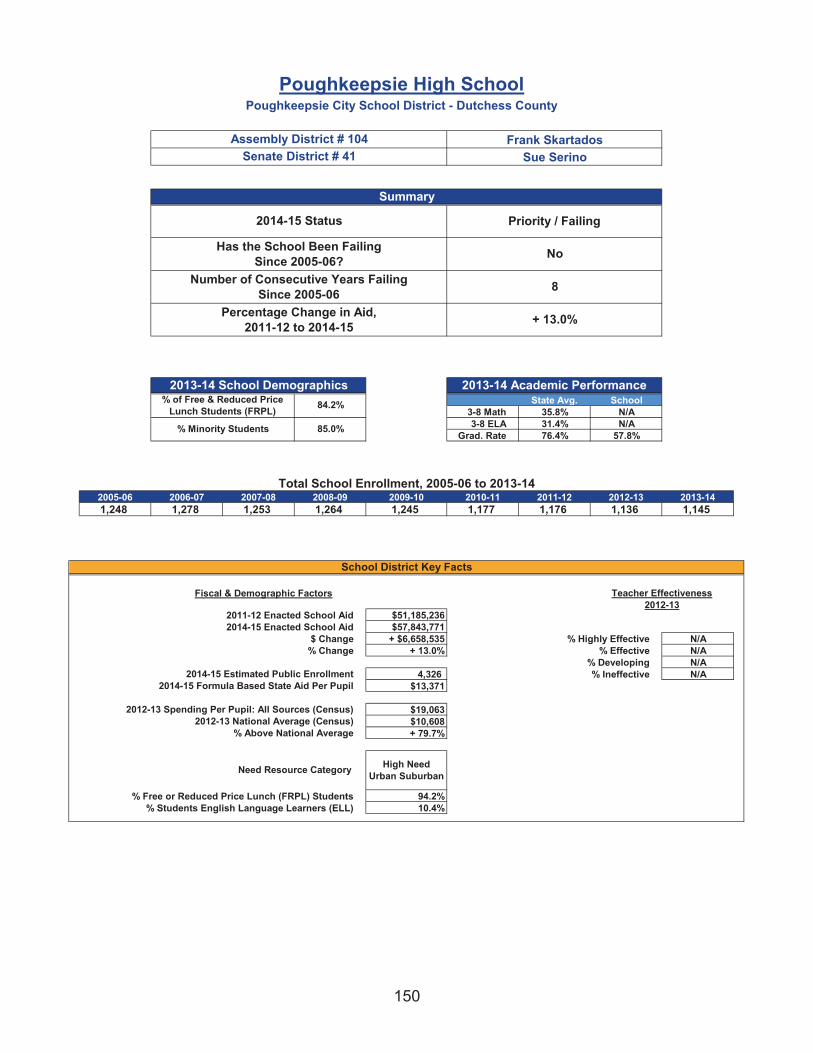
State Avg. School3-8 Math 35.8% N/A3-8 ELA 31.4% N/A
Grad. Rate 76.4% 57.8%
Total School Enrollment, 2005-06 to 2013-142005-06 2006-07 2007-08 2008-09 2009-10 2010-11 2011-12 2012-13 2013-141,248 1,278 1,253 1,264 1,245 1,177 1,176 1,136 1,145
2011-12 Enacted School Aid $51,185,2364 2014-15 Enacted School Aid $57,843,7715 $ Change + $6,658,535 % Highly Effective N/A6 % Change + 13.0% % Effective N/A7 % Developing N/A
2014-15 Estimated Public Enrollment 4,326 % Ineffective N/A8 2014-15 Formula Based State Aid Per Pupil $13,3719
2012-13 Spending Per Pupil: All Sources (Census) $19,0632012-13 National Average (Census) $10,608
% Above National Average + 79.7%#
#
# % Free or Reduced Price Lunch (FRPL) Students 94.2%% Students English Language Learners (ELL) 10.4%
# 21 20 19 18 17 16 15
8
+ 13.0%
High Need Urban Suburban
Fiscal & Demographic Factors
Percentage Change in Aid, 2011-12 to 2014-15
School District Key Facts
Teacher Effectiveness2012-13
2013-14 Academic Performance2013-14 School Demographics% of Free & Reduced Price
Lunch Students (FRPL)
% Minority Students
84.2%
85.0%
Poughkeepsie High SchoolPoughkeepsie City School District - Dutchess County
Need Resource Category
2014-15 Status
Has the School Been Failing Since 2005-06?
Number of Consecutive Years Failing Since 2005-06
Priority / Failing
No
Summary
Frank SkartadosSue Serino
Assembly District # 104Senate District # 41
150

State Avg. School3-8 Math 35.8% 4.3%3-8 ELA 31.4% 10.3%
Grad. Rate 76.4% N/A
Total School Enrollment, 2005-06 to 2013-142005-06 2006-07 2007-08 2008-09 2009-10 2010-11 2011-12 2012-13 2013-14
879 907 848 1,000 996 1,017 968 973 956
2011-12 Enacted School Aid $51,185,2364 2014-15 Enacted School Aid $57,843,7715 $ Change + $6,658,535 % Highly Effective N/A6 % Change + 13.0% % Effective N/A7 % Developing N/A
2014-15 Estimated Public Enrollment 4,326 % Ineffective N/A8 2014-15 Formula Based State Aid Per Pupil $13,3719
2012-13 Spending Per Pupil: All Sources (Census) $19,0632012-13 National Average (Census) $10,608
% Above National Average + 79.7%#
#
# % Free or Reduced Price Lunch (FRPL) Students 94.2%% Students English Language Learners (ELL) 10.4%
# 21 20 19 18 17 16 15
4
+ 13.0%
High Need Urban Suburban
Fiscal & Demographic Factors
Percentage Change in Aid, 2011-12 to 2014-15
School District Key Facts
Teacher Effectiveness2012-13
2013-14 Academic Performance2013-14 School Demographics% of Free & Reduced Price
Lunch Students (FRPL)
% Minority Students
87.9%
87.8%
Poughkeepsie Middle SchoolPoughkeepsie City School District - Dutchess County
Need Resource Category
2014-15 Status
Has the School Been Failing Since 2005-06?
Number of Consecutive Years Failing Since 2005-06
Priority / Failing
No
Summary
Frank SkartadosSue Serino
Assembly District # 104Senate District # 41
151

Rochester City School District
152

State Avg. School3-8 Math 35.8% N/A3-8 ELA 31.4% N/A
Grad. Rate 76.4% 26.0%
Total School Enrollment, 2005-06 to 2013-142005-06 2006-07 2007-08 2008-09 2009-10 2010-11 2011-12 2012-13 2013-141,012 1,030 1,107 1,049 1,007 1,046 864 531 505
2011-12 Enacted School Aid $443,998,3974 2014-15 Enacted School Aid $521,685,0775 $ Change + $77,686,680 % Highly Effective 2%6 % Change + 17.5% % Effective 58%7 % Developing 37%
2014-15 Estimated Public Enrollment 32,674 % Ineffective 2%8 2014-15 Formula Based State Aid Per Pupil $15,9669
2012-13 Spending Per Pupil: All Sources (Census) $18,7622012-13 National Average (Census) $10,608
% Above National Average + 76.9%#
#
# % Free or Reduced Price Lunch (FRPL) Students 90.0%% Students English Language Learners (ELL) 10.9%
# 21 20 19 18 17 16 15
10
+ 17.5%
High Need Large Cities
Fiscal & Demographic Factors
Percentage Change in Aid, 2011-12 to 2014-15
School District Key Facts
Teacher Effectiveness2012-13
2013-14 Academic Performance2013-14 School Demographics% of Free & Reduced Price
Lunch Students (FRPL)
% Minority Students
77.6%
83.4%
Charlotte High SchoolRochester City School District - Monroe County
Need Resource Category
2014-15 Status
Has the School Been Failing Since 2005-06?
Number of Consecutive Years Failing Since 2005-06
Priority / Failing
Yes
Summary
Joseph MorelleJoseph Robach
Assembly District # 136Senate District # 56
153

State Avg. School3-8 Math 35.8% N/A3-8 ELA 31.4% N/A
Grad. Rate 76.4% 35.8%
Total School Enrollment, 2005-06 to 2013-142005-06 2006-07 2007-08 2008-09 2009-10 2010-11 2011-12 2012-13 2013-14
967 903 988 1,066 1,042 1,064 985 530 547
2011-12 Enacted School Aid $443,998,3974 2014-15 Enacted School Aid $521,685,0775 $ Change + $77,686,680 % Highly Effective 2%6 % Change + 17.5% % Effective 58%7 % Developing 37%
2014-15 Estimated Public Enrollment 32,674 % Ineffective 2%8 2014-15 Formula Based State Aid Per Pupil $15,9669
2012-13 Spending Per Pupil: All Sources (Census) $18,7622012-13 National Average (Census) $10,608
% Above National Average + 76.9%#
#
# % Free or Reduced Price Lunch (FRPL) Students 90.0%% Students English Language Learners (ELL) 10.9%
# 21 20 19 18 17 16 15
8
+ 17.5%
High Need Large Cities
Fiscal & Demographic Factors
Percentage Change in Aid, 2011-12 to 2014-15
School District Key Facts
Teacher Effectiveness2012-13
2013-14 Academic Performance2013-14 School Demographics% of Free & Reduced Price
Lunch Students (FRPL)
% Minority Students
29.8%
95.5%
Dr Freddie Thomas High SchoolRochester City School District - Monroe County
Need Resource Category
2014-15 Status
Has the School Been Failing Since 2005-06?
Number of Consecutive Years Failing Since 2005-06
Priority / Failing
No
Summary
David GanttJoseph Robach
Assembly District # 137Senate District # 56
154

State Avg. School3-8 Math 35.8% 1.4%3-8 ELA 31.4% 2.0%
Grad. Rate 76.4% 40.2%
Total School Enrollment, 2005-06 to 2013-142005-06 2006-07 2007-08 2008-09 2009-10 2010-11 2011-12 2012-13 2013-141,960 1,901 1,891 1,940 1,694 1,714 1,728 1,720 1,851
2011-12 Enacted School Aid $443,998,3974 2014-15 Enacted School Aid $521,685,0775 $ Change + $77,686,680 % Highly Effective 2%6 % Change + 17.5% % Effective 58%7 % Developing 37%
2014-15 Estimated Public Enrollment 32,674 % Ineffective 2%8 2014-15 Formula Based State Aid Per Pupil $15,9669
2012-13 Spending Per Pupil: All Sources (Census) $18,7622012-13 National Average (Census) $10,608
% Above National Average + 76.9%#
#
# % Free or Reduced Price Lunch (FRPL) Students 90.0%% Students English Language Learners (ELL) 10.9%
# 21 20 19 18 17 16 15
10
+ 17.5%
High Need Large Cities
Fiscal & Demographic Factors
Percentage Change in Aid, 2011-12 to 2014-15
School District Key Facts
Teacher Effectiveness2012-13
2013-14 Academic Performance2013-14 School Demographics% of Free & Reduced Price
Lunch Students (FRPL)
% Minority Students
72.1%
91.7%
East High SchoolRochester City School District - Monroe County
Need Resource Category
2014-15 Status
Has the School Been Failing Since 2005-06?
Number of Consecutive Years Failing Since 2005-06
Priority / Failing
Yes
Summary
David GanttRich Funke
Assembly District # 137Senate District # 55
155

State Avg. School3-8 Math 35.8% 0.5%3-8 ELA 31.4% 1.0%
Grad. Rate 76.4% 35.4%
Total School Enrollment, 2005-06 to 2013-142005-06 2006-07 2007-08 2008-09 2009-10 2010-11 2011-12 2012-13 2013-141,192 1,292 1,316 1,137 1,094 1,074 1,190 1,109 1,141
2011-12 Enacted School Aid $443,998,3974 2014-15 Enacted School Aid $521,685,0775 $ Change + $77,686,680 % Highly Effective 2%6 % Change + 17.5% % Effective 58%7 % Developing 37%
2014-15 Estimated Public Enrollment 32,674 % Ineffective 2%8 2014-15 Formula Based State Aid Per Pupil $15,9669
2012-13 Spending Per Pupil: All Sources (Census) $18,7622012-13 National Average (Census) $10,608
% Above National Average + 76.9%#
#
# % Free or Reduced Price Lunch (FRPL) Students 90.0%% Students English Language Learners (ELL) 10.9%
# 21 20 19 18 17 16 15
10
+ 17.5%
High Need Large Cities
Fiscal & Demographic Factors
Percentage Change in Aid, 2011-12 to 2014-15
School District Key Facts
Teacher Effectiveness2012-13
2013-14 Academic Performance2013-14 School Demographics% of Free & Reduced Price
Lunch Students (FRPL)
% Minority Students
86.2%
96.8%
James Monroe High SchoolRochester City School District - Monroe County
Need Resource Category
2014-15 Status
Has the School Been Failing Since 2005-06?
Number of Consecutive Years Failing Since 2005-06
Priority / Failing
Yes
Summary
Harry BronsonRich Funke
Assembly District # 138Senate District # 55
156

State Avg. School3-8 Math 35.8% 1.0%3-8 ELA 31.4% 2.0%
Grad. Rate 76.4% 18.8%
Total School Enrollment, 2005-06 to 2013-142005-06 2006-07 2007-08 2008-09 2009-10 2010-11 2011-12 2012-13 2013-14
N/A 156 299 363 410 472 530 544 499
2011-12 Enacted School Aid $443,998,3974 2014-15 Enacted School Aid $521,685,0775 $ Change + $77,686,680 % Highly Effective 2%6 % Change + 17.5% % Effective 58%7 % Developing 37%
2014-15 Estimated Public Enrollment 32,674 % Ineffective 2%8 2014-15 Formula Based State Aid Per Pupil $15,9669
2012-13 Spending Per Pupil: All Sources (Census) $18,7622012-13 National Average (Census) $10,608
% Above National Average + 76.9%#
#
# % Free or Reduced Price Lunch (FRPL) Students 90.0%% Students English Language Learners (ELL) 10.9%
# 21 20 19 18 17 16 15
6
+ 17.5%
High Need Large Cities
Fiscal & Demographic Factors
Percentage Change in Aid, 2011-12 to 2014-15
School District Key Facts
Teacher Effectiveness2012-13
2013-14 Academic Performance2013-14 School Demographics% of Free & Reduced Price
Lunch Students (FRPL)
% Minority Students
79.2%
92.4%
Northeast College Prep High SchoolRochester City School District - Monroe County
Need Resource Category
2014-15 Status
Has the School Been Failing Since 2005-06?
Number of Consecutive Years Failing Since 2005-06
Priority / Failing
No
Summary
Harry BronsonRich Funke
Assembly District # 138Senate District # 55
157

State Avg. School3-8 Math 35.8% 2.0%3-8 ELA 31.4% 2.2%
Grad. Rate 76.4% 36.2%
Total School Enrollment, 2005-06 to 2013-142005-06 2006-07 2007-08 2008-09 2009-10 2010-11 2011-12 2012-13 2013-14
N/A 145 269 332 405 440 480 502 573
2011-12 Enacted School Aid $443,998,3974 2014-15 Enacted School Aid $521,685,0775 $ Change + $77,686,680 % Highly Effective 2%6 % Change + 17.5% % Effective 58%7 % Developing 37%
2014-15 Estimated Public Enrollment 32,674 % Ineffective 2%8 2014-15 Formula Based State Aid Per Pupil $15,9669
2012-13 Spending Per Pupil: All Sources (Census) $18,7622012-13 National Average (Census) $10,608
% Above National Average + 76.9%#
#
# % Free or Reduced Price Lunch (FRPL) Students 90.0%% Students English Language Learners (ELL) 10.9%
# 21 20 19 18 17 16 15
5
+ 17.5%
High Need Large Cities
Fiscal & Demographic Factors
Percentage Change in Aid, 2011-12 to 2014-15
School District Key Facts
Teacher Effectiveness2012-13
2013-14 Academic Performance2013-14 School Demographics% of Free & Reduced Price
Lunch Students (FRPL)
% Minority Students
82.3%
100.0%
Northwest College Prep High SchoolRochester City School District - Monroe County
Need Resource Category
2014-15 Status
Has the School Been Failing Since 2005-06?
Number of Consecutive Years Failing Since 2005-06
Priority / Failing
No
Summary
Harry BronsonRich Funke
Assembly District # 138Senate District # 55
158

State Avg. School3-8 Math 35.8% 3.5%3-8 ELA 31.4% 1.6%
Grad. Rate 76.4% N/A
Total School Enrollment, 2005-06 to 2013-142005-06 2006-07 2007-08 2008-09 2009-10 2010-11 2011-12 2012-13 2013-14
473 450 514 527 517 568 597 667 670
2011-12 Enacted School Aid $443,998,3974 2014-15 Enacted School Aid $521,685,0775 $ Change + $77,686,680 % Highly Effective 2%6 % Change + 17.5% % Effective 58%7 % Developing 37%
2014-15 Estimated Public Enrollment 32,674 % Ineffective 2%8 2014-15 Formula Based State Aid Per Pupil $15,9669
2012-13 Spending Per Pupil: All Sources (Census) $18,7622012-13 National Average (Census) $10,608
% Above National Average + 76.9%#
#
# % Free or Reduced Price Lunch (FRPL) Students 90.0%% Students English Language Learners (ELL) 10.9%
# 21 20 19 18 17 16 15
7
+ 17.5%
High Need Large Cities
Fiscal & Demographic Factors
Percentage Change in Aid, 2011-12 to 2014-15
School District Key Facts
Teacher Effectiveness2012-13
2013-14 Academic Performance2013-14 School Demographics% of Free & Reduced Price
Lunch Students (FRPL)
% Minority Students
97.3%
93.0%
School 17 - Enrico FermiRochester City School District - Monroe County
Need Resource Category
2014-15 Status
Has the School Been Failing Since 2005-06?
Number of Consecutive Years Failing Since 2005-06
Priority / Failing
No
Summary
David GanttJoseph Robach
Assembly District # 137Senate District # 56
159

State Avg. School3-8 Math 35.8% 2.7%3-8 ELA 31.4% 2.2%
Grad. Rate 76.4% N/A
Total School Enrollment, 2005-06 to 2013-142005-06 2006-07 2007-08 2008-09 2009-10 2010-11 2011-12 2012-13 2013-14
506 477 477 464 438 445 424 483 485
2011-12 Enacted School Aid $443,998,3974 2014-15 Enacted School Aid $521,685,0775 $ Change + $77,686,680 % Highly Effective 2%6 % Change + 17.5% % Effective 58%7 % Developing 37%
2014-15 Estimated Public Enrollment 32,674 % Ineffective 2%8 2014-15 Formula Based State Aid Per Pupil $15,9669
2012-13 Spending Per Pupil: All Sources (Census) $18,7622012-13 National Average (Census) $10,608
% Above National Average + 76.9%#
#
# % Free or Reduced Price Lunch (FRPL) Students 90.0%% Students English Language Learners (ELL) 10.9%
# 21 20 19 18 17 16 15
4
+ 17.5%
High Need Large Cities
Fiscal & Demographic Factors
Percentage Change in Aid, 2011-12 to 2014-15
School District Key Facts
Teacher Effectiveness2012-13
2013-14 Academic Performance2013-14 School Demographics% of Free & Reduced Price
Lunch Students (FRPL)
% Minority Students
100.0%
98.3%
School 22 - Lincoln SchoolRochester City School District - Monroe County
Need Resource Category
2014-15 Status
Has the School Been Failing Since 2005-06?
Number of Consecutive Years Failing Since 2005-06
Priority / Failing
No
Summary
David GanttJoseph Robach
Assembly District # 137Senate District # 56
160

State Avg. School3-8 Math 35.8% 3.4%3-8 ELA 31.4% 3.5%
Grad. Rate 76.4% N/A
Total School Enrollment, 2005-06 to 2013-142005-06 2006-07 2007-08 2008-09 2009-10 2010-11 2011-12 2012-13 2013-14
737 686 669 651 621 665 645 646 655
2011-12 Enacted School Aid $443,998,3974 2014-15 Enacted School Aid $521,685,0775 $ Change + $77,686,680 % Highly Effective 2%6 % Change + 17.5% % Effective 58%7 % Developing 37%
2014-15 Estimated Public Enrollment 32,674 % Ineffective 2%8 2014-15 Formula Based State Aid Per Pupil $15,9669
2012-13 Spending Per Pupil: All Sources (Census) $18,7622012-13 National Average (Census) $10,608
% Above National Average + 76.9%#
#
# % Free or Reduced Price Lunch (FRPL) Students 90.0%% Students English Language Learners (ELL) 10.9%
# 21 20 19 18 17 16 15
4
+ 17.5%
High Need Large Cities
Fiscal & Demographic Factors
Percentage Change in Aid, 2011-12 to 2014-15
School District Key Facts
Teacher Effectiveness2012-13
2013-14 Academic Performance2013-14 School Demographics% of Free & Reduced Price
Lunch Students (FRPL)
% Minority Students
96.0%
96.0%
School 3 - Nathaniel RochesterRochester City School District - Monroe County
Need Resource Category
2014-15 Status
Has the School Been Failing Since 2005-06?
Number of Consecutive Years Failing Since 2005-06
Priority / Failing
No
Summary
David GanttJoseph Robach
Assembly District # 137Senate District # 56
161

State Avg. School3-8 Math 35.8% 9.3%3-8 ELA 31.4% 4.7%
Grad. Rate 76.4% N/A
Total School Enrollment, 2005-06 to 2013-142005-06 2006-07 2007-08 2008-09 2009-10 2010-11 2011-12 2012-13 2013-14
497 449 433 461 490 500 468 469 465
2011-12 Enacted School Aid $443,998,3974 2014-15 Enacted School Aid $521,685,0775 $ Change + $77,686,680 % Highly Effective 2%6 % Change + 17.5% % Effective 58%7 % Developing 37%
2014-15 Estimated Public Enrollment 32,674 % Ineffective 2%8 2014-15 Formula Based State Aid Per Pupil $15,9669
2012-13 Spending Per Pupil: All Sources (Census) $18,7622012-13 National Average (Census) $10,608
% Above National Average + 76.9%#
#
# % Free or Reduced Price Lunch (FRPL) Students 90.0%% Students English Language Learners (ELL) 10.9%
# 21 20 19 18 17 16 15
5
+ 17.5%
High Need Large Cities
Fiscal & Demographic Factors
Percentage Change in Aid, 2011-12 to 2014-15
School District Key Facts
Teacher Effectiveness2012-13
2013-14 Academic Performance2013-14 School Demographics% of Free & Reduced Price
Lunch Students (FRPL)
% Minority Students
92.1%
80.1%
School 34 - Dr Louis A CerulliRochester City School District - Monroe County
Need Resource Category
2014-15 Status
Has the School Been Failing Since 2005-06?
Number of Consecutive Years Failing Since 2005-06
Priority / Failing
No
Summary
Joseph MorelleJoseph Robach
Assembly District # 136Senate District # 56
162
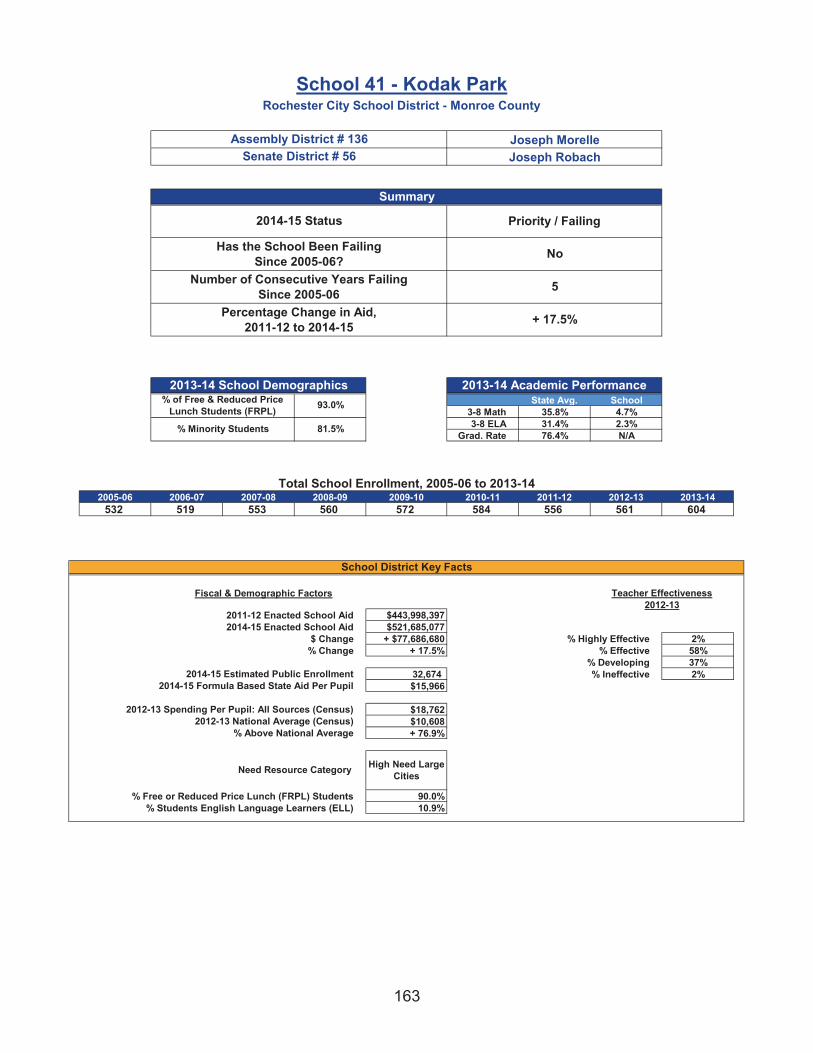
State Avg. School3-8 Math 35.8% 4.7%3-8 ELA 31.4% 2.3%
Grad. Rate 76.4% N/A
Total School Enrollment, 2005-06 to 2013-142005-06 2006-07 2007-08 2008-09 2009-10 2010-11 2011-12 2012-13 2013-14
532 519 553 560 572 584 556 561 604
2011-12 Enacted School Aid $443,998,3974 2014-15 Enacted School Aid $521,685,0775 $ Change + $77,686,680 % Highly Effective 2%6 % Change + 17.5% % Effective 58%7 % Developing 37%
2014-15 Estimated Public Enrollment 32,674 % Ineffective 2%8 2014-15 Formula Based State Aid Per Pupil $15,9669
2012-13 Spending Per Pupil: All Sources (Census) $18,7622012-13 National Average (Census) $10,608
% Above National Average + 76.9%#
#
# % Free or Reduced Price Lunch (FRPL) Students 90.0%% Students English Language Learners (ELL) 10.9%
# 21 20 19 18 17 16 15
5
+ 17.5%
High Need Large Cities
Fiscal & Demographic Factors
Percentage Change in Aid, 2011-12 to 2014-15
School District Key Facts
Teacher Effectiveness2012-13
2013-14 Academic Performance2013-14 School Demographics% of Free & Reduced Price
Lunch Students (FRPL)
% Minority Students
93.0%
81.5%
School 41 - Kodak ParkRochester City School District - Monroe County
Need Resource Category
2014-15 Status
Has the School Been Failing Since 2005-06?
Number of Consecutive Years Failing Since 2005-06
Priority / Failing
No
Summary
Joseph MorelleJoseph Robach
Assembly District # 136Senate District # 56
163

State Avg. School3-8 Math 35.8% 5.5%3-8 ELA 31.4% 2.0%
Grad. Rate 76.4% N/A
Total School Enrollment, 2005-06 to 2013-142005-06 2006-07 2007-08 2008-09 2009-10 2010-11 2011-12 2012-13 2013-14
330 279 314 332 370 384 424 434 401
2011-12 Enacted School Aid $443,998,3974 2014-15 Enacted School Aid $521,685,0775 $ Change + $77,686,680 % Highly Effective 2%6 % Change + 17.5% % Effective 58%7 % Developing 37%
2014-15 Estimated Public Enrollment 32,674 % Ineffective 2%8 2014-15 Formula Based State Aid Per Pupil $15,9669
2012-13 Spending Per Pupil: All Sources (Census) $18,7622012-13 National Average (Census) $10,608
% Above National Average + 76.9%#
#
# % Free or Reduced Price Lunch (FRPL) Students 90.0%% Students English Language Learners (ELL) 10.9%
# 21 20 19 18 17 16 15
5
+ 17.5%
High Need Large Cities
Fiscal & Demographic Factors
Percentage Change in Aid, 2011-12 to 2014-15
School District Key Facts
Teacher Effectiveness2012-13
2013-14 Academic Performance2013-14 School Demographics% of Free & Reduced Price
Lunch Students (FRPL)
% Minority Students
92.2%
95.3%
School 44 - Lincoln ParkRochester City School District - Monroe County
Need Resource Category
2014-15 Status
Has the School Been Failing Since 2005-06?
Number of Consecutive Years Failing Since 2005-06
Priority / Failing
No
Summary
David GanttMichael Ranzenhofer
Assembly District # 137Senate District # 61
164

State Avg. School3-8 Math 35.8% 2.1%3-8 ELA 31.4% 1.6%
Grad. Rate 76.4% N/A
Total School Enrollment, 2005-06 to 2013-142005-06 2006-07 2007-08 2008-09 2009-10 2010-11 2011-12 2012-13 2013-14
722 671 669 679 642 646 670 730 685
2011-12 Enacted School Aid $443,998,3974 2014-15 Enacted School Aid $521,685,0775 $ Change + $77,686,680 % Highly Effective 2%6 % Change + 17.5% % Effective 58%7 % Developing 37%
2014-15 Estimated Public Enrollment 32,674 % Ineffective 2%8 2014-15 Formula Based State Aid Per Pupil $15,9669
2012-13 Spending Per Pupil: All Sources (Census) $18,7622012-13 National Average (Census) $10,608
% Above National Average + 76.9%#
#
# % Free or Reduced Price Lunch (FRPL) Students 90.0%% Students English Language Learners (ELL) 10.9%
# 21 20 19 18 17 16 15
10
+ 17.5%
High Need Large Cities
Fiscal & Demographic Factors
Percentage Change in Aid, 2011-12 to 2014-15
School District Key Facts
Teacher Effectiveness2012-13
2013-14 Academic Performance2013-14 School Demographics% of Free & Reduced Price
Lunch Students (FRPL)
% Minority Students
93.3%
95.4%
School 45 - Mary Mcleod BethuneRochester City School District - Monroe County
Need Resource Category
2014-15 Status
Has the School Been Failing Since 2005-06?
Number of Consecutive Years Failing Since 2005-06
Priority / Failing
Yes
Summary
David GanttRich Funke
Assembly District # 137Senate District # 55
165

State Avg. School3-8 Math 35.8% 1.6%3-8 ELA 31.4% 1.8%
Grad. Rate 76.4% N/A
Total School Enrollment, 2005-06 to 2013-142005-06 2006-07 2007-08 2008-09 2009-10 2010-11 2011-12 2012-13 2013-14
593 530 506 518 543 517 612 671 622
2011-12 Enacted School Aid $443,998,3974 2014-15 Enacted School Aid $521,685,0775 $ Change + $77,686,680 % Highly Effective 2%6 % Change + 17.5% % Effective 58%7 % Developing 37%
2014-15 Estimated Public Enrollment 32,674 % Ineffective 2%8 2014-15 Formula Based State Aid Per Pupil $15,9669
2012-13 Spending Per Pupil: All Sources (Census) $18,7622012-13 National Average (Census) $10,608
% Above National Average + 76.9%#
#
# % Free or Reduced Price Lunch (FRPL) Students 90.0%% Students English Language Learners (ELL) 10.9%
# 21 20 19 18 17 16 15
5
+ 17.5%
High Need Large Cities
Fiscal & Demographic Factors
Percentage Change in Aid, 2011-12 to 2014-15
School District Key Facts
Teacher Effectiveness2012-13
2013-14 Academic Performance2013-14 School Demographics% of Free & Reduced Price
Lunch Students (FRPL)
% Minority Students
93.0%
95.0%
School 8 - Roberto ClementeRochester City School District - Monroe County
Need Resource Category
2014-15 Status
Has the School Been Failing Since 2005-06?
Number of Consecutive Years Failing Since 2005-06
Priority / Failing
No
Summary
David GanttJoseph Robach
Assembly District # 137Senate District # 56
166

State Avg. School3-8 Math 35.8% 5.0%3-8 ELA 31.4% 2.3%
Grad. Rate 76.4% N/A
Total School Enrollment, 2005-06 to 2013-142005-06 2006-07 2007-08 2008-09 2009-10 2010-11 2011-12 2012-13 2013-14
699 647 697 675 665 708 722 744 767
2011-12 Enacted School Aid $443,998,3974 2014-15 Enacted School Aid $521,685,0775 $ Change + $77,686,680 % Highly Effective 2%6 % Change + 17.5% % Effective 58%7 % Developing 37%
2014-15 Estimated Public Enrollment 32,674 % Ineffective 2%8 2014-15 Formula Based State Aid Per Pupil $15,9669
2012-13 Spending Per Pupil: All Sources (Census) $18,7622012-13 National Average (Census) $10,608
% Above National Average + 76.9%#
#
# % Free or Reduced Price Lunch (FRPL) Students 90.0%% Students English Language Learners (ELL) 10.9%
# 21 20 19 18 17 16 15
10
+ 17.5%
High Need Large Cities
Fiscal & Demographic Factors
Percentage Change in Aid, 2011-12 to 2014-15
School District Key Facts
Teacher Effectiveness2012-13
2013-14 Academic Performance2013-14 School Demographics% of Free & Reduced Price
Lunch Students (FRPL)
% Minority Students
99.6%
98.5%
School 9 - Dr Martin Luther King JrRochester City School District - Monroe County
Need Resource Category
2014-15 Status
Has the School Been Failing Since 2005-06?
Number of Consecutive Years Failing Since 2005-06
Priority / Failing
Yes
Summary
David GanttJoseph Robach
Assembly District # 137Senate District # 56
167

Roosevelt Union Free School District
168

State Avg. School3-8 Math 35.8% N/A3-8 ELA 31.4% N/A
Grad. Rate 76.4% 69.6%
Total School Enrollment, 2005-06 to 2013-142005-06 2006-07 2007-08 2008-09 2009-10 2010-11 2011-12 2012-13 2013-14
782 797 799 779 750 755 793 778 846
2011-12 Enacted School Aid $44,280,6274 2014-15 Enacted School Aid $53,997,3575 $ Change + $9,716,730 % Highly Effective 4%6 % Change + 21.9% % Effective 77%7 % Developing 9%
2014-15 Estimated Public Enrollment 3,687 % Ineffective 9%8 2014-15 Formula Based State Aid Per Pupil $14,6459
2012-13 Spending Per Pupil: All Sources (Census) $23,8542012-13 National Average (Census) $10,608
% Above National Average + 124.9%#
#
# % Free or Reduced Price Lunch (FRPL) Students 79.9%% Students English Language Learners (ELL) 17.6%
# 21 20 19 18 17 16 15
10
+ 21.9%
High Need Urban Suburban
Fiscal & Demographic Factors
Percentage Change in Aid, 2011-12 to 2014-15
School District Key Facts
Teacher Effectiveness2012-13
2013-14 Academic Performance2013-14 School Demographics% of Free & Reduced Price
Lunch Students (FRPL)
% Minority Students
67.9%
100.0%
Roosevelt High SchoolRoosevelt Union Free School District - Nassau County
Need Resource Category
2014-15 Status
Has the School Been Failing Since 2005-06?
Number of Consecutive Years Failing Since 2005-06
Priority / Failing
Yes
Summary
Earlene HooperMichael Venditto
Assembly District # 18Senate District # 8
169

State Avg. School3-8 Math 35.8% N/A3-8 ELA 31.4% N/A
Grad. Rate 76.4% N/A
Total School Enrollment, 2005-06 to 2013-142005-06 2006-07 2007-08 2008-09 2009-10 2010-11 2011-12 2012-13 2013-14
406 427 379 554 556 630 632 627 434
2011-12 Enacted School Aid $44,280,6274 2014-15 Enacted School Aid $53,997,3575 $ Change + $9,716,730 % Highly Effective 4%6 % Change + 21.9% % Effective 77%7 % Developing 9%
2014-15 Estimated Public Enrollment 3,687 % Ineffective 9%8 2014-15 Formula Based State Aid Per Pupil $14,6459
2012-13 Spending Per Pupil: All Sources (Census) $23,8542012-13 National Average (Census) $10,608
% Above National Average + 124.9%#
#
# % Free or Reduced Price Lunch (FRPL) Students 79.9%% Students English Language Learners (ELL) 17.6%
# 21 20 19 18 17 16 15
8
+ 21.9%
High Need Urban Suburban
Fiscal & Demographic Factors
Percentage Change in Aid, 2011-12 to 2014-15
School District Key Facts
Teacher Effectiveness2012-13
2013-14 Academic Performance2013-14 School Demographics% of Free & Reduced Price
Lunch Students (FRPL)
% Minority Students
92.4%
99.7%
Roosevelt Middle SchoolRoosevelt Union Free School District - Nassau County
Need Resource Category
2014-15 Status
Has the School Been Failing Since 2005-06?
Number of Consecutive Years Failing Since 2005-06
Priority / Failing
No
Summary
Earlene HooperMichael Venditto
Assembly District # 18Senate District # 8
170

Schenectady City School District
171

State Avg. School3-8 Math 35.8% 10.0%3-8 ELA 31.4% 10.6%
Grad. Rate 76.4% N/A
Total School Enrollment, 2005-06 to 2013-142005-06 2006-07 2007-08 2008-09 2009-10 2010-11 2011-12 2012-13 2013-14
331 451 431 410 400 441 403 437 454
2011-12 Enacted School Aid $90,744,9874 2014-15 Enacted School Aid $102,379,1825 $ Change + $11,634,195 % Highly Effective 39%6 % Change + 12.8% % Effective 50%7 % Developing 9%
2014-15 Estimated Public Enrollment 10,263 % Ineffective 2%8 2014-15 Formula Based State Aid Per Pupil $9,9769
2012-13 Spending Per Pupil: All Sources (Census) $16,2622012-13 National Average (Census) $10,608
% Above National Average + 53.3%#
#
# % Free or Reduced Price Lunch (FRPL) Students 74.7%% Students English Language Learners (ELL) 4.2%
# 21 20 19 18 17 16 15
4
+ 12.8%
High Need Urban Suburban
Fiscal & Demographic Factors
Percentage Change in Aid, 2011-12 to 2014-15
School District Key Facts
Teacher Effectiveness2012-13
2013-14 Academic Performance2013-14 School Demographics% of Free & Reduced Price
Lunch Students (FRPL)
% Minority Students
87.1%
73.2%
Hamilton Elementary SchoolSchenectady City School District - Schenectady County
Need Resource Category
2014-15 Status
Has the School Been Failing Since 2005-06?
Number of Consecutive Years Failing Since 2005-06
Priority / Failing
No
Summary
Angelo SantabarbaraHugh T. Farley
Assembly District # 111Senate District # 49
172

State Avg. School3-8 Math 35.8% 9.8%3-8 ELA 31.4% 12.8%
Grad. Rate 76.4% N/A
Total School Enrollment, 2005-06 to 2013-142005-06 2006-07 2007-08 2008-09 2009-10 2010-11 2011-12 2012-13 2013-14
354 390 377 314 381 368 352 329 309
2011-12 Enacted School Aid $90,744,9874 2014-15 Enacted School Aid $102,379,1825 $ Change + $11,634,195 % Highly Effective 39%6 % Change + 12.8% % Effective 50%7 % Developing 9%
2014-15 Estimated Public Enrollment 10,263 % Ineffective 2%8 2014-15 Formula Based State Aid Per Pupil $9,9769
2012-13 Spending Per Pupil: All Sources (Census) $16,2622012-13 National Average (Census) $10,608
% Above National Average + 53.3%#
#
# % Free or Reduced Price Lunch (FRPL) Students 74.7%% Students English Language Learners (ELL) 4.2%
# 21 20 19 18 17 16 15
4
+ 12.8%
High Need Urban Suburban
Fiscal & Demographic Factors
Percentage Change in Aid, 2011-12 to 2014-15
School District Key Facts
Teacher Effectiveness2012-13
2013-14 Academic Performance2013-14 School Demographics% of Free & Reduced Price
Lunch Students (FRPL)
% Minority Students
85.7%
79.3%
Lincoln SchoolSchenectady City School District - Schenectady County
Need Resource Category
2014-15 Status
Has the School Been Failing Since 2005-06?
Number of Consecutive Years Failing Since 2005-06
Priority / Failing
No
Summary
Angelo SantabarbaraHugh T. Farley
Assembly District # 111Senate District # 49
173

Syracuse City School District
174

State Avg. School3-8 Math 35.8% 10.6%3-8 ELA 31.4% 3.9%
Grad. Rate 76.4% N/A
Total School Enrollment, 2005-06 to 2013-142005-06 2006-07 2007-08 2008-09 2009-10 2010-11 2011-12 2012-13 2013-14
405 381 374 406 392 427 415 446 483
2011-12 Enacted School Aid $258,353,0414 2014-15 Enacted School Aid $290,823,8795 $ Change + $32,470,838 % Highly Effective 2%6 % Change + 12.6% % Effective 58%7 % Developing 33%
2014-15 Estimated Public Enrollment 22,112 % Ineffective 6%8 2014-15 Formula Based State Aid Per Pupil $13,1529
2012-13 Spending Per Pupil: All Sources (Census) $18,3872012-13 National Average (Census) $10,608
% Above National Average + 73.3%#
#
# % Free or Reduced Price Lunch (FRPL) Students 81.5%% Students English Language Learners (ELL) 13.2%
# 21 20 19 18 17 16 15
4
+ 12.6%
High Need Large Cities
Fiscal & Demographic Factors
Percentage Change in Aid, 2011-12 to 2014-15
School District Key Facts
Teacher Effectiveness2012-13
2013-14 Academic Performance2013-14 School Demographics% of Free & Reduced Price
Lunch Students (FRPL)
% Minority Students
90.4%
83.4%
Bellevue Elementary SchoolSyracuse City School District - Onondaga County
Need Resource Category
2014-15 Status
Has the School Been Failing Since 2005-06?
Number of Consecutive Years Failing Since 2005-06
Priority / Failing
No
Summary
William MagnarelliDavid J. Valesky
Assembly District # 129Senate District # 53
175

State Avg. School3-8 Math 35.8% 2.0%3-8 ELA 31.4% 1.8%
Grad. Rate 76.4% N/A
Total School Enrollment, 2005-06 to 2013-142005-06 2006-07 2007-08 2008-09 2009-10 2010-11 2011-12 2012-13 2013-14
592 576 558 493 463 493 516 462 452
2011-12 Enacted School Aid $258,353,0414 2014-15 Enacted School Aid $290,823,8795 $ Change + $32,470,838 % Highly Effective 2%6 % Change + 12.6% % Effective 58%7 % Developing 33%
2014-15 Estimated Public Enrollment 22,112 % Ineffective 6%8 2014-15 Formula Based State Aid Per Pupil $13,1529
2012-13 Spending Per Pupil: All Sources (Census) $18,3872012-13 National Average (Census) $10,608
% Above National Average + 73.3%#
#
# % Free or Reduced Price Lunch (FRPL) Students 81.5%% Students English Language Learners (ELL) 13.2%
# 21 20 19 18 17 16 15
8
+ 12.6%
High Need Large Cities
Fiscal & Demographic Factors
Percentage Change in Aid, 2011-12 to 2014-15
School District Key Facts
Teacher Effectiveness2012-13
2013-14 Academic Performance2013-14 School Demographics% of Free & Reduced Price
Lunch Students (FRPL)
% Minority Students
92.9%
95.2%
Danforth Middle SchoolSyracuse City School District - Onondaga County
Need Resource Category
2014-15 Status
Has the School Been Failing Since 2005-06?
Number of Consecutive Years Failing Since 2005-06
Priority / Failing
No
Summary
Sam RobertsDavid J. Valesky
Assembly District # 128Senate District # 53
176

State Avg. School3-8 Math 35.8% 3.6%3-8 ELA 31.4% 1.6%
Grad. Rate 76.4% N/A
Total School Enrollment, 2005-06 to 2013-142005-06 2006-07 2007-08 2008-09 2009-10 2010-11 2011-12 2012-13 2013-14
501 492 481 460 445 401 461 523 544
2011-12 Enacted School Aid $258,353,0414 2014-15 Enacted School Aid $290,823,8795 $ Change + $32,470,838 % Highly Effective 2%6 % Change + 12.6% % Effective 58%7 % Developing 33%
2014-15 Estimated Public Enrollment 22,112 % Ineffective 6%8 2014-15 Formula Based State Aid Per Pupil $13,1529
2012-13 Spending Per Pupil: All Sources (Census) $18,3872012-13 National Average (Census) $10,608
% Above National Average + 73.3%#
#
# % Free or Reduced Price Lunch (FRPL) Students 81.5%% Students English Language Learners (ELL) 13.2%
# 21 20 19 18 17 16 15
10
+ 12.6%
High Need Large Cities
Fiscal & Demographic Factors
Percentage Change in Aid, 2011-12 to 2014-15
School District Key Facts
Teacher Effectiveness2012-13
2013-14 Academic Performance2013-14 School Demographics% of Free & Reduced Price
Lunch Students (FRPL)
% Minority Students
99.5%
87.8%
Delaware AcademySyracuse City School District - Onondaga County
Need Resource Category
2014-15 Status
Has the School Been Failing Since 2005-06?
Number of Consecutive Years Failing Since 2005-06
Priority / Failing
Yes
Summary
Sam RobertsDavid J. Valesky
Assembly District # 128Senate District # 53
177

State Avg. School3-8 Math 35.8% 7.4%3-8 ELA 31.4% 2.3%
Grad. Rate 76.4% N/A
Total School Enrollment, 2005-06 to 2013-142005-06 2006-07 2007-08 2008-09 2009-10 2010-11 2011-12 2012-13 2013-14
497 498 466 535 509 509 547 579 598
2011-12 Enacted School Aid $258,353,0414 2014-15 Enacted School Aid $290,823,8795 $ Change + $32,470,838 % Highly Effective 2%6 % Change + 12.6% % Effective 58%7 % Developing 33%
2014-15 Estimated Public Enrollment 22,112 % Ineffective 6%8 2014-15 Formula Based State Aid Per Pupil $13,1529
2012-13 Spending Per Pupil: All Sources (Census) $18,3872012-13 National Average (Census) $10,608
% Above National Average + 73.3%#
#
# % Free or Reduced Price Lunch (FRPL) Students 81.5%% Students English Language Learners (ELL) 13.2%
# 21 20 19 18 17 16 15
10
+ 12.6%
High Need Large Cities
Fiscal & Demographic Factors
Percentage Change in Aid, 2011-12 to 2014-15
School District Key Facts
Teacher Effectiveness2012-13
2013-14 Academic Performance2013-14 School Demographics% of Free & Reduced Price
Lunch Students (FRPL)
% Minority Students
96.5%
98.6%
Dr King Elementary SchoolSyracuse City School District - Onondaga County
Need Resource Category
2014-15 Status
Has the School Been Failing Since 2005-06?
Number of Consecutive Years Failing Since 2005-06
Priority / Failing
Yes
Summary
Sam RobertsDavid J. Valesky
Assembly District # 128Senate District # 53
178

State Avg. School3-8 Math 35.8% 3.3%3-8 ELA 31.4% 6.9%
Grad. Rate 76.4% N/A
Total School Enrollment, 2005-06 to 2013-142005-06 2006-07 2007-08 2008-09 2009-10 2010-11 2011-12 2012-13 2013-14
678 638 684 696 757 757 712 702 726
2011-12 Enacted School Aid $258,353,0414 2014-15 Enacted School Aid $290,823,8795 $ Change + $32,470,838 % Highly Effective 2%6 % Change + 12.6% % Effective 58%7 % Developing 33%
2014-15 Estimated Public Enrollment 22,112 % Ineffective 6%8 2014-15 Formula Based State Aid Per Pupil $13,1529
2012-13 Spending Per Pupil: All Sources (Census) $18,3872012-13 National Average (Census) $10,608
% Above National Average + 73.3%#
#
# % Free or Reduced Price Lunch (FRPL) Students 81.5%% Students English Language Learners (ELL) 13.2%
# 21 20 19 18 17 16 15
4
+ 12.6%
High Need Large Cities
Fiscal & Demographic Factors
Percentage Change in Aid, 2011-12 to 2014-15
School District Key Facts
Teacher Effectiveness2012-13
2013-14 Academic Performance2013-14 School Demographics% of Free & Reduced Price
Lunch Students (FRPL)
% Minority Students
84.3%
79.1%
Dr Weeks Elementary SchoolSyracuse City School District - Onondaga County
Need Resource Category
2014-15 Status
Has the School Been Failing Since 2005-06?
Number of Consecutive Years Failing Since 2005-06
Priority / Failing
No
Summary
William MagnarelliDavid J. Valesky
Assembly District # 129Senate District # 53
179

State Avg. School3-8 Math 35.8% N/A3-8 ELA 31.4% N/A
Grad. Rate 76.4% 30.3%
Total School Enrollment, 2005-06 to 2013-142005-06 2006-07 2007-08 2008-09 2009-10 2010-11 2011-12 2012-13 2013-141,357 1,208 1,086 1,075 1,214 1,154 1,150 1,150 1,321
2011-12 Enacted School Aid $258,353,0414 2014-15 Enacted School Aid $290,823,8795 $ Change + $32,470,838 % Highly Effective 2%6 % Change + 12.6% % Effective 58%7 % Developing 33%
2014-15 Estimated Public Enrollment 22,112 % Ineffective 6%8 2014-15 Formula Based State Aid Per Pupil $13,1529
2012-13 Spending Per Pupil: All Sources (Census) $18,3872012-13 National Average (Census) $10,608
% Above National Average + 73.3%#
#
# % Free or Reduced Price Lunch (FRPL) Students 81.5%% Students English Language Learners (ELL) 13.2%
# 21 20 19 18 17 16 15
10
+ 12.6%
High Need Large Cities
Fiscal & Demographic Factors
Percentage Change in Aid, 2011-12 to 2014-15
School District Key Facts
Teacher Effectiveness2012-13
2013-14 Academic Performance2013-14 School Demographics% of Free & Reduced Price
Lunch Students (FRPL)
% Minority Students
82.9%
78.3%
Fowler High SchoolSyracuse City School District - Onondaga County
Need Resource Category
2014-15 Status
Has the School Been Failing Since 2005-06?
Number of Consecutive Years Failing Since 2005-06
Priority / Failing
Yes
Summary
William MagnarelliDavid J. Valesky
Assembly District # 129Senate District # 53
180

State Avg. School3-8 Math 35.8% N/A3-8 ELA 31.4% N/A
Grad. Rate 76.4% N/A
Total School Enrollment, 2005-06 to 2013-142005-06 2006-07 2007-08 2008-09 2009-10 2010-11 2011-12 2012-13 2013-14
771 744 756 722 715 730 722 670 682
2011-12 Enacted School Aid $258,353,0414 2014-15 Enacted School Aid $290,823,8795 $ Change + $32,470,838 % Highly Effective 2%6 % Change + 12.6% % Effective 58%7 % Developing 33%
2014-15 Estimated Public Enrollment 22,112 % Ineffective 6%8 2014-15 Formula Based State Aid Per Pupil $13,1529
2012-13 Spending Per Pupil: All Sources (Census) $18,3872012-13 National Average (Census) $10,608
% Above National Average + 73.3%#
#
# % Free or Reduced Price Lunch (FRPL) Students 81.5%% Students English Language Learners (ELL) 13.2%
# 21 20 19 18 17 16 15
8
+ 12.6%
High Need Large Cities
Fiscal & Demographic Factors
Percentage Change in Aid, 2011-12 to 2014-15
School District Key Facts
Teacher Effectiveness2012-13
2013-14 Academic Performance2013-14 School Demographics% of Free & Reduced Price
Lunch Students (FRPL)
% Minority Students
83.9%
69.3%
Franklin Elementary SchoolSyracuse City School District - Onondaga County
Need Resource Category
2014-15 Status
Has the School Been Failing Since 2005-06?
Number of Consecutive Years Failing Since 2005-06
Priority / Failing
No
Summary
William MagnarelliJohn A. DeFrancisco
Assembly District # 129Senate District # 50
181

State Avg. School3-8 Math 35.8% 7.0%3-8 ELA 31.4% 5.2%
Grad. Rate 76.4% N/A
Total School Enrollment, 2005-06 to 2013-142005-06 2006-07 2007-08 2008-09 2009-10 2010-11 2011-12 2012-13 2013-14
837 808 801 812 794 805 821 838 928
2011-12 Enacted School Aid $258,353,0414 2014-15 Enacted School Aid $290,823,8795 $ Change + $32,470,838 % Highly Effective 2%6 % Change + 12.6% % Effective 58%7 % Developing 33%
2014-15 Estimated Public Enrollment 22,112 % Ineffective 6%8 2014-15 Formula Based State Aid Per Pupil $13,1529
2012-13 Spending Per Pupil: All Sources (Census) $18,3872012-13 National Average (Census) $10,608
% Above National Average + 73.3%#
#
# % Free or Reduced Price Lunch (FRPL) Students 81.5%% Students English Language Learners (ELL) 13.2%
# 21 20 19 18 17 16 15
10
+ 12.6%
High Need Large Cities
Fiscal & Demographic Factors
Percentage Change in Aid, 2011-12 to 2014-15
School District Key Facts
Teacher Effectiveness2012-13
2013-14 Academic Performance2013-14 School Demographics% of Free & Reduced Price
Lunch Students (FRPL)
% Minority Students
85.2%
75.2%
Frazer K - 8 SchoolSyracuse City School District - Onondaga County
Need Resource Category
2014-15 Status
Has the School Been Failing Since 2005-06?
Number of Consecutive Years Failing Since 2005-06
Priority / Failing
Yes
Summary
William MagnarelliDavid J. Valesky
Assembly District # 129Senate District # 53
182

State Avg. School3-8 Math 35.8% 5.0%3-8 ELA 31.4% 5.5%
Grad. Rate 76.4% N/A
Total School Enrollment, 2005-06 to 2013-142005-06 2006-07 2007-08 2008-09 2009-10 2010-11 2011-12 2012-13 2013-14
779 709 645 689 670 629 601 641 647
2011-12 Enacted School Aid $258,353,0414 2014-15 Enacted School Aid $290,823,8795 $ Change + $32,470,838 % Highly Effective 2%6 % Change + 12.6% % Effective 58%7 % Developing 33%
2014-15 Estimated Public Enrollment 22,112 % Ineffective 6%8 2014-15 Formula Based State Aid Per Pupil $13,1529
2012-13 Spending Per Pupil: All Sources (Census) $18,3872012-13 National Average (Census) $10,608
% Above National Average + 73.3%#
#
# % Free or Reduced Price Lunch (FRPL) Students 81.5%% Students English Language Learners (ELL) 13.2%
# 21 20 19 18 17 16 15
10
+ 12.6%
High Need Large Cities
Fiscal & Demographic Factors
Percentage Change in Aid, 2011-12 to 2014-15
School District Key Facts
Teacher Effectiveness2012-13
2013-14 Academic Performance2013-14 School Demographics% of Free & Reduced Price
Lunch Students (FRPL)
% Minority Students
89.0%
66.9%
Grant Middle SchoolSyracuse City School District - Onondaga County
Need Resource Category
2014-15 Status
Has the School Been Failing Since 2005-06?
Number of Consecutive Years Failing Since 2005-06
Priority / Failing
Yes
Summary
William MagnarelliDavid J. Valesky
Assembly District # 129Senate District # 53
183

State Avg. School3-8 Math 35.8% N/A3-8 ELA 31.4% N/A
Grad. Rate 76.4% 49.5%
Total School Enrollment, 2005-06 to 2013-142005-06 2006-07 2007-08 2008-09 2009-10 2010-11 2011-12 2012-13 2013-141,732 1,703 1,697 1,621 1,648 1,683 1,619 1,676 1,757
2011-12 Enacted School Aid $258,353,0414 2014-15 Enacted School Aid $290,823,8795 $ Change + $32,470,838 % Highly Effective 2%6 % Change + 12.6% % Effective 58%7 % Developing 33%
2014-15 Estimated Public Enrollment 22,112 % Ineffective 6%8 2014-15 Formula Based State Aid Per Pupil $13,1529
2012-13 Spending Per Pupil: All Sources (Census) $18,3872012-13 National Average (Census) $10,608
% Above National Average + 73.3%#
#
# % Free or Reduced Price Lunch (FRPL) Students 81.5%% Students English Language Learners (ELL) 13.2%
# 21 20 19 18 17 16 15
10
+ 12.6%
High Need Large Cities
Fiscal & Demographic Factors
Percentage Change in Aid, 2011-12 to 2014-15
School District Key Facts
Teacher Effectiveness2012-13
2013-14 Academic Performance2013-14 School Demographics% of Free & Reduced Price
Lunch Students (FRPL)
% Minority Students
71.5%
66.0%
Henninger High SchoolSyracuse City School District - Onondaga County
Need Resource Category
2014-15 Status
Has the School Been Failing Since 2005-06?
Number of Consecutive Years Failing Since 2005-06
Priority / Failing
Yes
Summary
William MagnarelliDavid J. Valesky
Assembly District # 129Senate District # 53
184

State Avg. School3-8 Math 35.8% 5.7%3-8 ELA 31.4% 3.7%
Grad. Rate 76.4% N/A
Total School Enrollment, 2005-06 to 2013-142005-06 2006-07 2007-08 2008-09 2009-10 2010-11 2011-12 2012-13 2013-14
460 443 423 453 428 494 575 612 339
2011-12 Enacted School Aid $258,353,0414 2014-15 Enacted School Aid $290,823,8795 $ Change + $32,470,838 % Highly Effective 2%6 % Change + 12.6% % Effective 58%7 % Developing 33%
2014-15 Estimated Public Enrollment 22,112 % Ineffective 6%8 2014-15 Formula Based State Aid Per Pupil $13,1529
2012-13 Spending Per Pupil: All Sources (Census) $18,3872012-13 National Average (Census) $10,608
% Above National Average + 73.3%#
#
# % Free or Reduced Price Lunch (FRPL) Students 81.5%% Students English Language Learners (ELL) 13.2%
# 21 20 19 18 17 16 15
10
+ 12.6%
High Need Large Cities
Fiscal & Demographic Factors
Percentage Change in Aid, 2011-12 to 2014-15
School District Key Facts
Teacher Effectiveness2012-13
2013-14 Academic Performance2013-14 School Demographics% of Free & Reduced Price
Lunch Students (FRPL)
% Minority Students
88.3%
93.1%
Hughes Elementary SchoolSyracuse City School District - Onondaga County
Need Resource Category
2014-15 Status
Has the School Been Failing Since 2005-06?
Number of Consecutive Years Failing Since 2005-06
Priority / Failing
Yes
Summary
William MagnarelliDavid J. Valesky
Assembly District # 129Senate District # 53
185

State Avg. School3-8 Math 35.8% 11.2%3-8 ELA 31.4% 12.4%
Grad. Rate 76.4% N/A
Total School Enrollment, 2005-06 to 2013-142005-06 2006-07 2007-08 2008-09 2009-10 2010-11 2011-12 2012-13 2013-14
752 696 706 766 814 784 790 777 847
2011-12 Enacted School Aid $258,353,0414 2014-15 Enacted School Aid $290,823,8795 $ Change + $32,470,838 % Highly Effective 2%6 % Change + 12.6% % Effective 58%7 % Developing 33%
2014-15 Estimated Public Enrollment 22,112 % Ineffective 6%8 2014-15 Formula Based State Aid Per Pupil $13,1529
2012-13 Spending Per Pupil: All Sources (Census) $18,3872012-13 National Average (Census) $10,608
% Above National Average + 73.3%#
#
# % Free or Reduced Price Lunch (FRPL) Students 81.5%% Students English Language Learners (ELL) 13.2%
# 21 20 19 18 17 16 15
10
+ 12.6%
High Need Large Cities
Fiscal & Demographic Factors
Percentage Change in Aid, 2011-12 to 2014-15
School District Key Facts
Teacher Effectiveness2012-13
2013-14 Academic Performance2013-14 School Demographics% of Free & Reduced Price
Lunch Students (FRPL)
% Minority Students
73.5%
81.7%
Hurlbut W Smith K - 8 SchoolSyracuse City School District - Onondaga County
Need Resource Category
2014-15 Status
Has the School Been Failing Since 2005-06?
Number of Consecutive Years Failing Since 2005-06
Priority / Failing
Yes
Summary
Sam RobertsDavid J. Valesky
Assembly District # 128Senate District # 53
186

State Avg. School3-8 Math 35.8% 2.2%3-8 ELA 31.4% 6.4%
Grad. Rate 76.4% N/A
Total School Enrollment, 2005-06 to 2013-142005-06 2006-07 2007-08 2008-09 2009-10 2010-11 2011-12 2012-13 2013-14
577 508 483 476 420 465 513 541 565
2011-12 Enacted School Aid $258,353,0414 2014-15 Enacted School Aid $290,823,8795 $ Change + $32,470,838 % Highly Effective 2%6 % Change + 12.6% % Effective 58%7 % Developing 33%
2014-15 Estimated Public Enrollment 22,112 % Ineffective 6%8 2014-15 Formula Based State Aid Per Pupil $13,1529
2012-13 Spending Per Pupil: All Sources (Census) $18,3872012-13 National Average (Census) $10,608
% Above National Average + 73.3%#
#
# % Free or Reduced Price Lunch (FRPL) Students 81.5%% Students English Language Learners (ELL) 13.2%
# 21 20 19 18 17 16 15
4
+ 12.6%
High Need Large Cities
Fiscal & Demographic Factors
Percentage Change in Aid, 2011-12 to 2014-15
School District Key Facts
Teacher Effectiveness2012-13
2013-14 Academic Performance2013-14 School Demographics% of Free & Reduced Price
Lunch Students (FRPL)
% Minority Students
86.4%
74.1%
Lincoln Middle SchoolSyracuse City School District - Onondaga County
Need Resource Category
2014-15 Status
Has the School Been Failing Since 2005-06?
Number of Consecutive Years Failing Since 2005-06
Priority / Failing
No
Summary
William MagnarelliJohn A. DeFrancisco
Assembly District # 129Senate District # 50
187

State Avg. School3-8 Math 35.8% N/A3-8 ELA 31.4% N/A
Grad. Rate 76.4% 59.6%
Total School Enrollment, 2005-06 to 2013-142005-06 2006-07 2007-08 2008-09 2009-10 2010-11 2011-12 2012-13 2013-141,338 1,291 1,251 1,211 1,314 1,316 1,220 1,194 1,264
2011-12 Enacted School Aid $258,353,0414 2014-15 Enacted School Aid $290,823,8795 $ Change + $32,470,838 % Highly Effective 2%6 % Change + 12.6% % Effective 58%7 % Developing 33%
2014-15 Estimated Public Enrollment 22,112 % Ineffective 6%8 2014-15 Formula Based State Aid Per Pupil $13,1529
2012-13 Spending Per Pupil: All Sources (Census) $18,3872012-13 National Average (Census) $10,608
% Above National Average + 73.3%#
#
# % Free or Reduced Price Lunch (FRPL) Students 81.5%% Students English Language Learners (ELL) 13.2%
# 21 20 19 18 17 16 15
10
+ 12.6%
High Need Large Cities
Fiscal & Demographic Factors
Percentage Change in Aid, 2011-12 to 2014-15
School District Key Facts
Teacher Effectiveness2012-13
2013-14 Academic Performance2013-14 School Demographics% of Free & Reduced Price
Lunch Students (FRPL)
% Minority Students
74.0%
77.4%
Nottingham High SchoolSyracuse City School District - Onondaga County
Need Resource Category
2014-15 Status
Has the School Been Failing Since 2005-06?
Number of Consecutive Years Failing Since 2005-06
Priority / Failing
Yes
Summary
Sam RobertsDavid J. Valesky
Assembly District # 128Senate District # 53
188

State Avg. School3-8 Math 35.8% 8.3%3-8 ELA 31.4% 2.5%
Grad. Rate 76.4% N/A
Total School Enrollment, 2005-06 to 2013-142005-06 2006-07 2007-08 2008-09 2009-10 2010-11 2011-12 2012-13 2013-14
531 506 527 511 530 523 525 512 512
2011-12 Enacted School Aid $258,353,0414 2014-15 Enacted School Aid $290,823,8795 $ Change + $32,470,838 % Highly Effective 2%6 % Change + 12.6% % Effective 58%7 % Developing 33%
2014-15 Estimated Public Enrollment 22,112 % Ineffective 6%8 2014-15 Formula Based State Aid Per Pupil $13,1529
2012-13 Spending Per Pupil: All Sources (Census) $18,3872012-13 National Average (Census) $10,608
% Above National Average + 73.3%#
#
# % Free or Reduced Price Lunch (FRPL) Students 81.5%% Students English Language Learners (ELL) 13.2%
# 21 20 19 18 17 16 15
4
+ 12.6%
High Need Large Cities
Fiscal & Demographic Factors
Percentage Change in Aid, 2011-12 to 2014-15
School District Key Facts
Teacher Effectiveness2012-13
2013-14 Academic Performance2013-14 School Demographics% of Free & Reduced Price
Lunch Students (FRPL)
% Minority Students
75.4%
57.2%
Porter Elementary SchoolSyracuse City School District - Onondaga County
Need Resource Category
2014-15 Status
Has the School Been Failing Since 2005-06?
Number of Consecutive Years Failing Since 2005-06
Priority / Failing
No
Summary
William MagnarelliDavid J. Valesky
Assembly District # 129Senate District # 53
189

State Avg. School3-8 Math 35.8% 4.5%3-8 ELA 31.4% 4.3%
Grad. Rate 76.4% N/A
Total School Enrollment, 2005-06 to 2013-142005-06 2006-07 2007-08 2008-09 2009-10 2010-11 2011-12 2012-13 2013-14
417 380 379 387 429 448 513 506 508
2011-12 Enacted School Aid $258,353,0414 2014-15 Enacted School Aid $290,823,8795 $ Change + $32,470,838 % Highly Effective 2%6 % Change + 12.6% % Effective 58%7 % Developing 33%
2014-15 Estimated Public Enrollment 22,112 % Ineffective 6%8 2014-15 Formula Based State Aid Per Pupil $13,1529
2012-13 Spending Per Pupil: All Sources (Census) $18,3872012-13 National Average (Census) $10,608
% Above National Average + 73.3%#
#
# % Free or Reduced Price Lunch (FRPL) Students 81.5%% Students English Language Learners (ELL) 13.2%
# 21 20 19 18 17 16 15
10
+ 12.6%
High Need Large Cities
Fiscal & Demographic Factors
Percentage Change in Aid, 2011-12 to 2014-15
School District Key Facts
Teacher Effectiveness2012-13
2013-14 Academic Performance2013-14 School Demographics% of Free & Reduced Price
Lunch Students (FRPL)
% Minority Students
98.9%
90.6%
Seymour Dual Language AcademySyracuse City School District - Onondaga County
Need Resource Category
2014-15 Status
Has the School Been Failing Since 2005-06?
Number of Consecutive Years Failing Since 2005-06
Priority / Failing
Yes
Summary
William MagnarelliDavid J. Valesky
Assembly District # 129Senate District # 53
190

State Avg. School3-8 Math 35.8% 4.0%3-8 ELA 31.4% 4.0%
Grad. Rate 76.4% N/A
Total School Enrollment, 2005-06 to 2013-142005-06 2006-07 2007-08 2008-09 2009-10 2010-11 2011-12 2012-13 2013-14
355 335 351 366 365 357 336 322 351
2011-12 Enacted School Aid $258,353,0414 2014-15 Enacted School Aid $290,823,8795 $ Change + $32,470,838 % Highly Effective 2%6 % Change + 12.6% % Effective 58%7 % Developing 33%
2014-15 Estimated Public Enrollment 22,112 % Ineffective 6%8 2014-15 Formula Based State Aid Per Pupil $13,1529
2012-13 Spending Per Pupil: All Sources (Census) $18,3872012-13 National Average (Census) $10,608
% Above National Average + 73.3%#
#
# % Free or Reduced Price Lunch (FRPL) Students 81.5%% Students English Language Learners (ELL) 13.2%
# 21 20 19 18 17 16 15
5
+ 12.6%
High Need Large Cities
Fiscal & Demographic Factors
Percentage Change in Aid, 2011-12 to 2014-15
School District Key Facts
Teacher Effectiveness2012-13
2013-14 Academic Performance2013-14 School Demographics% of Free & Reduced Price
Lunch Students (FRPL)
% Minority Students
82.0%
87.0%
Van Duyn Elementary SchoolSyracuse City School District - Onondaga County
Need Resource Category
2014-15 Status
Has the School Been Failing Since 2005-06?
Number of Consecutive Years Failing Since 2005-06
Priority / Failing
No
Summary
Sam RobertsDavid J. Valesky
Assembly District # 128Senate District # 53
191

State Avg. School3-8 Math 35.8% 1.0%3-8 ELA 31.4% 1.8%
Grad. Rate 76.4% N/A
Total School Enrollment, 2005-06 to 2013-142005-06 2006-07 2007-08 2008-09 2009-10 2010-11 2011-12 2012-13 2013-14
N/A N/A N/A N/A N/A N/A 427 395 411
2011-12 Enacted School Aid $258,353,0414 2014-15 Enacted School Aid $290,823,8795 $ Change + $32,470,838 % Highly Effective 2%6 % Change + 12.6% % Effective 58%7 % Developing 33%
2014-15 Estimated Public Enrollment 22,112 % Ineffective 6%8 2014-15 Formula Based State Aid Per Pupil $13,1529
2012-13 Spending Per Pupil: All Sources (Census) $18,3872012-13 National Average (Census) $10,608
% Above National Average + 73.3%#
#
# % Free or Reduced Price Lunch (FRPL) Students 81.5%% Students English Language Learners (ELL) 13.2%
# 21 20 19 18 17 16 15
3
+ 12.6%
High Need Large Cities
Fiscal & Demographic Factors
Percentage Change in Aid, 2011-12 to 2014-15
School District Key Facts
Teacher Effectiveness2012-13
2013-14 Academic Performance2013-14 School Demographics% of Free & Reduced Price
Lunch Students (FRPL)
% Minority Students
93.7%
86.8%
Westside Academy At BlodgettSyracuse City School District - Onondaga County
Need Resource Category
2014-15 Status
Has the School Been Failing Since 2005-06?
Number of Consecutive Years Failing Since 2005-06
Priority / Failing
No
Summary
Sam RobertsDavid J. Valesky
Assembly District # 128Senate District # 53
192

Troy City School District
193

State Avg. School3-8 Math 35.8% 5.0%3-8 ELA 31.4% 5.1%
Grad. Rate 76.4% N/A
Total School Enrollment, 2005-06 to 2013-142005-06 2006-07 2007-08 2008-09 2009-10 2010-11 2011-12 2012-13 2013-14
339 326 358 366 383 376 403 328 298
2011-12 Enacted School Aid $46,675,6644 2014-15 Enacted School Aid $60,628,7025 $ Change + $13,953,038 % Highly Effective 16%6 % Change + 29.9% % Effective 75%7 % Developing 6%
2014-15 Estimated Public Enrollment 4,901 % Ineffective 2%8 2014-15 Formula Based State Aid Per Pupil $12,3719
2012-13 Spending Per Pupil: All Sources (Census) $19,0142012-13 National Average (Census) $10,608
% Above National Average + 79.2%#
#
# % Free or Reduced Price Lunch (FRPL) Students 68.5%% Students English Language Learners (ELL) 1.5%
# 21 20 19 18 17 16 15
4
+ 29.9%
High Need Urban Suburban
Fiscal & Demographic Factors
Percentage Change in Aid, 2011-12 to 2014-15
School District Key Facts
Teacher Effectiveness2012-13
2013-14 Academic Performance2013-14 School Demographics% of Free & Reduced Price
Lunch Students (FRPL)
% Minority Students
94.8%
72.3%
PS 2Troy City School District - Rensselaer County
Need Resource Category
2014-15 Status
Has the School Been Failing Since 2005-06?
Number of Consecutive Years Failing Since 2005-06
Priority / Failing
No
Summary
John McDonaldNeil D. Breslin
Assembly District # 108Senate District # 44
194

Utica City School District
195

State Avg. School3-8 Math 35.8% 9.1%3-8 ELA 31.4% 4.5%
Grad. Rate 76.4% N/A
Total School Enrollment, 2005-06 to 2013-142005-06 2006-07 2007-08 2008-09 2009-10 2010-11 2011-12 2012-13 2013-14
226 237 233 248 273 283 341 347 302
2011-12 Enacted School Aid $92,891,7394 2014-15 Enacted School Aid $110,007,5405 $ Change + $17,115,801 % Highly Effective 9%6 % Change + 18.4% % Effective 55%7 % Developing 26%
2014-15 Estimated Public Enrollment 10,072 % Ineffective 10%8 2014-15 Formula Based State Aid Per Pupil $10,9229
2012-13 Spending Per Pupil: All Sources (Census) $15,1292012-13 National Average (Census) $10,608
% Above National Average + 42.6%#
#
# % Free or Reduced Price Lunch (FRPL) Students 83.0%% Students English Language Learners (ELL) 16.5%
# 21 20 19 18 17 16 15
4
+ 18.4%
High Need Urban Suburban
Fiscal & Demographic Factors
Percentage Change in Aid, 2011-12 to 2014-15
School District Key Facts
Teacher Effectiveness2012-13
2013-14 Academic Performance2013-14 School Demographics% of Free & Reduced Price
Lunch Students (FRPL)
% Minority Students
97.4%
91.9%
Martin Luther King Jr Elementary SchoolUtica City School District - Oneida County
Need Resource Category
2014-15 Status
Has the School Been Failing Since 2005-06?
Number of Consecutive Years Failing Since 2005-06
Priority / Failing
No
Summary
Anthony Brindisi Joseph A. Griffo
Assembly District # 119Senate District # 47
196

Wyandanch Union Free School District
197

State Avg. School3-8 Math 35.8% 8.9%3-8 ELA 31.4% 7.5%
Grad. Rate 76.4% N/A
Total School Enrollment, 2005-06 to 2013-142005-06 2006-07 2007-08 2008-09 2009-10 2010-11 2011-12 2012-13 2013-14
480 406 410 390 412 406 440 461 454
2011-12 Enacted School Aid $30,772,2944 2014-15 Enacted School Aid $39,117,6735 $ Change + $8,345,379 % Highly Effective 100%6 % Change + 27.1% % Effective 0%7 % Developing 0%
2014-15 Estimated Public Enrollment 2,226 % Ineffective 0%8 2014-15 Formula Based State Aid Per Pupil $17,5739
2012-13 Spending Per Pupil: All Sources (Census) $24,3282012-13 National Average (Census) $10,608
% Above National Average + 129.3%#
#
# % Free or Reduced Price Lunch (FRPL) Students 80.0%% Students English Language Learners (ELL) 16.5%
# 21 20 19 18 17 16 15
4
+ 27.1%
High Need Urban Suburban
Fiscal & Demographic Factors
Percentage Change in Aid, 2011-12 to 2014-15
School District Key Facts
Teacher Effectiveness2012-13
2013-14 Academic Performance2013-14 School Demographics% of Free & Reduced Price
Lunch Students (FRPL)
% Minority Students
60.3%
99.3%
Milton L Olive Middle SchoolWyandanch Union Free School District - Suffolk County
Need Resource Category
2014-15 Status
Has the School Been Failing Since 2005-06?
Number of Consecutive Years Failing Since 2005-06
Priority / Failing
No
Summary
Kimberly Jean-PierrePhil Boyle
Assembly District # 11Senate District # 4
198

Yonkers City School District
199

State Avg. School3-8 Math 35.8% 6.8%3-8 ELA 31.4% 7.8%
Grad. Rate 76.4% N/A
Total School Enrollment, 2005-06 to 2013-142005-06 2006-07 2007-08 2008-09 2009-10 2010-11 2011-12 2012-13 2013-14
958 757 680 863 855 704 650 592 640
2011-12 Enacted School Aid $206,361,3134 2014-15 Enacted School Aid $239,014,7585 $ Change + $32,653,445 % Highly Effective 31%6 % Change + 15.8% % Effective 53%7 % Developing 14%
2014-15 Estimated Public Enrollment 26,231 % Ineffective 3%8 2014-15 Formula Based State Aid Per Pupil $9,1129
2012-13 Spending Per Pupil: All Sources (Census) $18,7982012-13 National Average (Census) $10,608
% Above National Average + 77.2%#
#
# % Free or Reduced Price Lunch (FRPL) Students 67.3%% Students English Language Learners (ELL) 10.2%
# 21 20 19 18 17 16 15
10
+ 15.8%
High Need Large Cities
Fiscal & Demographic Factors
Percentage Change in Aid, 2011-12 to 2014-15
School District Key Facts
Teacher Effectiveness2012-13
2013-14 Academic Performance2013-14 School Demographics% of Free & Reduced Price
Lunch Students (FRPL)
% Minority Students
83.8%
92.8%
Cross Hill AcademyYonkers City School District - Westchester County
Need Resource Category
2014-15 Status
Has the School Been Failing Since 2005-06?
Number of Consecutive Years Failing Since 2005-06
Priority / Failing
Yes
Summary
Shelley MayerAndrea Stewart-Cousins
Assembly District # 90Senate District # 35
200

State Avg. School3-8 Math 35.8% 15.2%3-8 ELA 31.4% 7.0%
Grad. Rate 76.4% N/A
Total School Enrollment, 2005-06 to 2013-142005-06 2006-07 2007-08 2008-09 2009-10 2010-11 2011-12 2012-13 2013-14
881 889 847 885 920 939 882 839 873
2011-12 Enacted School Aid $206,361,3134 2014-15 Enacted School Aid $239,014,7585 $ Change + $32,653,445 % Highly Effective 31%6 % Change + 15.8% % Effective 53%7 % Developing 14%
2014-15 Estimated Public Enrollment 26,231 % Ineffective 3%8 2014-15 Formula Based State Aid Per Pupil $9,1129
2012-13 Spending Per Pupil: All Sources (Census) $18,7982012-13 National Average (Census) $10,608
% Above National Average + 77.2%#
#
# % Free or Reduced Price Lunch (FRPL) Students 67.3%% Students English Language Learners (ELL) 10.2%
# 21 20 19 18 17 16 15
4
+ 15.8%
High Need Large Cities
Fiscal & Demographic Factors
Percentage Change in Aid, 2011-12 to 2014-15
School District Key Facts
Teacher Effectiveness2012-13
2013-14 Academic Performance2013-14 School Demographics% of Free & Reduced Price
Lunch Students (FRPL)
% Minority Students
90.1%
98.2%
Enrico Fermi School of Performing ArtsYonkers City School District - Westchester County
Need Resource Category
2014-15 Status
Has the School Been Failing Since 2005-06?
Number of Consecutive Years Failing Since 2005-06
Priority / Failing
No
Summary
Shelley MayerAndrea Stewart-Cousins
Assembly District # 90Senate District # 35
201

State Avg. School3-8 Math 35.8% 4.6%3-8 ELA 31.4% 2.2%
Grad. Rate 76.4% N/A
Total School Enrollment, 2005-06 to 2013-142005-06 2006-07 2007-08 2008-09 2009-10 2010-11 2011-12 2012-13 2013-14
454 440 400 378 407 478 522 527 534
2011-12 Enacted School Aid $206,361,3134 2014-15 Enacted School Aid $239,014,7585 $ Change + $32,653,445 % Highly Effective 31%6 % Change + 15.8% % Effective 53%7 % Developing 14%
2014-15 Estimated Public Enrollment 26,231 % Ineffective 3%8 2014-15 Formula Based State Aid Per Pupil $9,1129
2012-13 Spending Per Pupil: All Sources (Census) $18,7982012-13 National Average (Census) $10,608
% Above National Average + 77.2%#
#
# % Free or Reduced Price Lunch (FRPL) Students 67.3%% Students English Language Learners (ELL) 10.2%
# 21 20 19 18 17 16 15
8
+ 15.8%
High Need Large Cities
Fiscal & Demographic Factors
Percentage Change in Aid, 2011-12 to 2014-15
School District Key Facts
Teacher Effectiveness2012-13
2013-14 Academic Performance2013-14 School Demographics% of Free & Reduced Price
Lunch Students (FRPL)
% Minority Students
78.0%
99.0%
Martin Luther King, Jr High Tech Computer Magnet SchoolYonkers City School District - Westchester County
Need Resource Category
2014-15 Status
Has the School Been Failing Since 2005-06?
Number of Consecutive Years Failing Since 2005-06
Priority / Failing
No
Summary
Shelley MayerAndrea Stewart-Cousins
Assembly District # 90Senate District # 35
202

State Avg. School3-8 Math 35.8% 13.1%3-8 ELA 31.4% 8.6%
Grad. Rate 76.4% N/A
Total School Enrollment, 2005-06 to 2013-142005-06 2006-07 2007-08 2008-09 2009-10 2010-11 2011-12 2012-13 2013-14
429 464 406 404 413 448 430 391 359
2011-12 Enacted School Aid $206,361,3134 2014-15 Enacted School Aid $239,014,7585 $ Change + $32,653,445 % Highly Effective 31%6 % Change + 15.8% % Effective 53%7 % Developing 14%
2014-15 Estimated Public Enrollment 26,231 % Ineffective 3%8 2014-15 Formula Based State Aid Per Pupil $9,1129
2012-13 Spending Per Pupil: All Sources (Census) $18,7982012-13 National Average (Census) $10,608
% Above National Average + 77.2%#
#
# % Free or Reduced Price Lunch (FRPL) Students 67.3%% Students English Language Learners (ELL) 10.2%
# 21 20 19 18 17 16 15
6
+ 15.8%
High Need Large Cities
Fiscal & Demographic Factors
Percentage Change in Aid, 2011-12 to 2014-15
School District Key Facts
Teacher Effectiveness2012-13
2013-14 Academic Performance2013-14 School Demographics% of Free & Reduced Price
Lunch Students (FRPL)
% Minority Students
88.5%
98.7%
Museum School 25Yonkers City School District - Westchester County
Need Resource Category
2014-15 Status
Has the School Been Failing Since 2005-06?
Number of Consecutive Years Failing Since 2005-06
Priority / Failing
No
Summary
Shelley MayerAndrea Stewart-Cousins
Assembly District # 90Senate District # 35
203

State Avg. School3-8 Math 35.8% 14.3%3-8 ELA 31.4% 10.1%
Grad. Rate 76.4% N/A
Total School Enrollment, 2005-06 to 2013-142005-06 2006-07 2007-08 2008-09 2009-10 2010-11 2011-12 2012-13 2013-14
725 841 827 826 848 775 751 719 736
2011-12 Enacted School Aid $206,361,3134 2014-15 Enacted School Aid $239,014,7585 $ Change + $32,653,445 % Highly Effective 31%6 % Change + 15.8% % Effective 53%7 % Developing 14%
2014-15 Estimated Public Enrollment 26,231 % Ineffective 3%8 2014-15 Formula Based State Aid Per Pupil $9,1129
2012-13 Spending Per Pupil: All Sources (Census) $18,7982012-13 National Average (Census) $10,608
% Above National Average + 77.2%#
#
# % Free or Reduced Price Lunch (FRPL) Students 67.3%% Students English Language Learners (ELL) 10.2%
# 21 20 19 18 17 16 15
7
+ 15.8%
High Need Large Cities
Fiscal & Demographic Factors
Percentage Change in Aid, 2011-12 to 2014-15
School District Key Facts
Teacher Effectiveness2012-13
2013-14 Academic Performance2013-14 School Demographics% of Free & Reduced Price
Lunch Students (FRPL)
% Minority Students
90.3%
96.8%
Robert C Dodson SchoolYonkers City School District - Westchester County
Need Resource Category
2014-15 Status
Has the School Been Failing Since 2005-06?
Number of Consecutive Years Failing Since 2005-06
Priority / Failing
No
Summary
Shelley MayerGeorge Latimer
Assembly District # 90Senate District # 37
204

State Avg. School3-8 Math 35.8% N/A3-8 ELA 31.4% N/A
Grad. Rate 76.4% 58.6%
Total School Enrollment, 2005-06 to 2013-142005-06 2006-07 2007-08 2008-09 2009-10 2010-11 2011-12 2012-13 2013-141,829 1,655 1,403 1,133 1,039 871 729 764 738
2011-12 Enacted School Aid $206,361,3134 2014-15 Enacted School Aid $239,014,7585 $ Change + $32,653,445 % Highly Effective 31%6 % Change + 15.8% % Effective 53%7 % Developing 14%
2014-15 Estimated Public Enrollment 26,231 % Ineffective 3%8 2014-15 Formula Based State Aid Per Pupil $9,1129
2012-13 Spending Per Pupil: All Sources (Census) $18,7982012-13 National Average (Census) $10,608
% Above National Average + 77.2%#
#
# % Free or Reduced Price Lunch (FRPL) Students 67.3%% Students English Language Learners (ELL) 10.2%
# 21 20 19 18 17 16 15
10
+ 15.8%
High Need Large Cities
Fiscal & Demographic Factors
Percentage Change in Aid, 2011-12 to 2014-15
School District Key Facts
Teacher Effectiveness2012-13
2013-14 Academic Performance2013-14 School Demographics% of Free & Reduced Price
Lunch Students (FRPL)
% Minority Students
85.3%
90.8%
Roosevelt High SchoolYonkers City School District - Westchester County
Need Resource Category
2014-15 Status
Has the School Been Failing Since 2005-06?
Number of Consecutive Years Failing Since 2005-06
Priority / Failing
Yes
Summary
Shelley MayerGeorge Latimer
Assembly District # 90Senate District # 37
205

State Avg. School3-8 Math 35.8% 12.2%3-8 ELA 31.4% 12.1%
Grad. Rate 76.4% N/A
Total School Enrollment, 2005-06 to 2013-142005-06 2006-07 2007-08 2008-09 2009-10 2010-11 2011-12 2012-13 2013-14
491 456 498 546 543 565 575 576 596
2011-12 Enacted School Aid $206,361,3134 2014-15 Enacted School Aid $239,014,7585 $ Change + $32,653,445 % Highly Effective 31%6 % Change + 15.8% % Effective 53%7 % Developing 14%
2014-15 Estimated Public Enrollment 26,231 % Ineffective 3%8 2014-15 Formula Based State Aid Per Pupil $9,1129
2012-13 Spending Per Pupil: All Sources (Census) $18,7982012-13 National Average (Census) $10,608
% Above National Average + 77.2%#
#
# % Free or Reduced Price Lunch (FRPL) Students 67.3%% Students English Language Learners (ELL) 10.2%
# 21 20 19 18 17 16 15
4
+ 15.8%
High Need Large Cities
Fiscal & Demographic Factors
Percentage Change in Aid, 2011-12 to 2014-15
School District Key Facts
Teacher Effectiveness2012-13
2013-14 Academic Performance2013-14 School Demographics% of Free & Reduced Price
Lunch Students (FRPL)
% Minority Students
76.6%
94.7%
Scholastic Academy For Academic ExcellenceYonkers City School District - Westchester County
Need Resource Category
2014-15 Status
Has the School Been Failing Since 2005-06?
Number of Consecutive Years Failing Since 2005-06
Priority / Failing
No
Summary
Shelley MayerAndrea Stewart-Cousins
Assembly District # 90Senate District # 35
206

State Avg. School3-8 Math 35.8% 11.6%3-8 ELA 31.4% 7.1%
Grad. Rate 76.4% N/A
Total School Enrollment, 2005-06 to 2013-142005-06 2006-07 2007-08 2008-09 2009-10 2010-11 2011-12 2012-13 2013-14
485 486 483 526 542 566 552 560 618
2011-12 Enacted School Aid $206,361,3134 2014-15 Enacted School Aid $239,014,7585 $ Change + $32,653,445 % Highly Effective 31%6 % Change + 15.8% % Effective 53%7 % Developing 14%
2014-15 Estimated Public Enrollment 26,231 % Ineffective 3%8 2014-15 Formula Based State Aid Per Pupil $9,1129
2012-13 Spending Per Pupil: All Sources (Census) $18,7982012-13 National Average (Census) $10,608
% Above National Average + 77.2%#
#
# % Free or Reduced Price Lunch (FRPL) Students 67.3%% Students English Language Learners (ELL) 10.2%
# 21 20 19 18 17 16 15
8
+ 15.8%
High Need Large Cities
Fiscal & Demographic Factors
Percentage Change in Aid, 2011-12 to 2014-15
School District Key Facts
Teacher Effectiveness2012-13
2013-14 Academic Performance2013-14 School Demographics% of Free & Reduced Price
Lunch Students (FRPL)
% Minority Students
90.5%
95.4%
School 13Yonkers City School District - Westchester County
Need Resource Category
2014-15 Status
Has the School Been Failing Since 2005-06?
Number of Consecutive Years Failing Since 2005-06
Priority / Failing
No
Summary
J. Gary PretlowAndrea Stewart-Cousins
Assembly District # 89Senate District # 35
207

The State of New York’s Failing Schools - 2015 Report


![Failing Schools[1]](https://img.pdfslide.us/doc/110x75/577d2db41a28ab4e1eae1fd8/failing-schools1.jpg)