Embed Size (px)
Citation preview
Stanford Latino Entrepreneurship Initiative
STATE OF LATINOENTREPRENEURSHIP


Table of ContentsTable of Contents
020304050708
09
12
14
3132
About This Report
Acknowledgments
LBAN
Executive Summary
Section IIntroduction
Section IIPopulation Growth:The Latino Population,Market & Power
Section IIICurrent State of LOBs
- Current Data - Number of LOBs - Sales & Employees
Section IVWhat Future Can Look Like
- Economic Impact
Section VWhy are LOBs Smaller?
- Industry, Customers ...- Capacity for Growth
Section VIConclusions
Appendix

Sec
tion
I
AboutThis ReportAboutThis Report
The Stanford Latino Entrepreneurship Initiative (SLEI), a collaboration between the Latino Business Action Network (LBAN) and Stanford University, housed within the Stanford Graduate School of Business, created this report on the State of Latino Entrepreneurship in the United States. The information contained in this report was prepared from sources and data that we believe to be reliable, but we make no representation as to its accuracy or completeness and we assume neither responsibility nor liability for any damages of any type resulting from any errors or omissions. Projected to be published annually, this fi rst report is published in November, 2015.
Principal InvestigatorsDr. Douglas Rivers, a senior fellow at the Hoover Institution and a professor of political science at Stanford University, designed the research study,
and implemented the data collection.
Dr. Jerry Porras is the cofounder and chairman of the board of LBAN, co-author of the business bestseller, Built to Last: Successful Habits of Visionary Companies, and the Lane Professor of Organizational Behavior, Emeritus at the Stanford Graduate School of Business.
Other ContributorsRemy Arteaga is the Executive Director of the LBAN, co-author of the Wiley published book, Pivot: How Top Entrepreneurs Adapt and Change Course to Find Ultimate Success.
Tiq Chapa is the Program Manager of SLEI.
Jessica Salinas is the Community & Marketing Manager of LBAN.
2

AcknowledgmentsAcknowledgmentsJust as growing a business would not be possible without a network of support, SLEI has many to thank for its development and results.
First, LBAN would like to thank 21st Century Fox, Wells Fargo Bank, State Farm Insurance, Pitch Johnson, John Arrillaga, Microsoft, Comcast, Latino Donor Collaborative, and The Gilbert and Jacki Cisneros Foundation for their generous funding and support.
Second, we want to thank our Board of Directors for their guidance and insights. The LBAN board:
Victor Arias, Korn Ferry International
Phil Pompa, International Accelerator, Inc.
Jerry I. Porras, Stanford Graduate School of Business (Chairman - LBAN)
Frank Ramirez, Entrepreneur
David Segura, VisionIT
Sol Trujillo, Trujillo Investments
We would also like to thank all the hard-working Latino entrepreneurs of the research panel who are helping build America’s economy.
Finally, we would also like to thank Barbi Bistrowitz ([email protected]), who donated her time as art director to design this report.
3Sol Trujillo, Trujillo Investments

Sec
tion
I
The Stanford Latino Entrepreneurship Initiative (SLEI) is a research collaboration between Stanford University housed at the Graduate School of Business and the Latino Business Action Network (LBAN), a 501(c)3 not for profi t organization located in Palo Alto, CA.
VisionThe vision to make America stronger by empowering Latino entrepreneurs to grow large businesses through entrepreneurship research, education and networks.
GoalThe Goal is to grow the American economy by doubling the number of $10+ million, $100+ million, and $1+ Billion Latino-owned businesses by 2020.
For more on information, please visit www.LatinoEI.org.
LBANLBAN
4

With this report, Stanford Latino Entrepreneurship Initiative (SLEI) provides the fi rst annual State of Latino Entrepreneurship report. It provides academic researchers, policy makers and business leaders with a timely update of SLEI’s research results.
The report fi nds that even as the Latino population (currently at 17%) is growing at an undeniably fast rate (estimated to be 30% by 2060), and with it, an explosion in the number of Latino Owned Businesses (LOBs), there is a multi trillion dollar opportunity gap between Latino Owned Businesses and Non-Latino Owned Businesses (NLOBs), driven by the dramatic difference in size between the two.
What can explain this difference? To answer that question, SLEI has created a carefully cleaned database of 1,432,746 Latino businesses, from which two panels of Latino businesses owners - 1,831 and 368 - who agreed to participate in ongoing surveys and research was created. This report expands on the U.S. Census based reports, including the Kauffman Foundation report, by examining the economic impact of LOBs on the American economy and issues related to growing large LOBs. For the fi rst time, a deeper examination into the drivers that lead to smaller LOBs is analyzed.
Key InsightsMulti Trillion Dollar Opportunity Gap The current gap between the average yearly sales generated by LOBs and NLOBs points to an exciting opportunity for signifi cant growth in the
U.S. economy. The potential impact on the U.S. economy if LOBs generated the same level of sales as NLOBs was calculated over the period of 2002-2012. A pattern was found to exist over these years. For example, in 2012 alone, if all LOBs averaged the same yearly sales per fi rm as all NLOBs, $1.38 trillion would have been added to the economy. This difference is named the Opportunity Gap and represents the potential economic impact of scaling LOBs to the same average level of NLOBs.
Diverse Customers & IndustriesOur research also found that reasons often cited for lack of large size for LOBs- industry selection and customer base- are without merit. When comparing the mixture of industries of LOBs to NLOBs in industries with either high average sales per fi rm or high growth rates, SLEI found no discernible differences between the two groups in the percentage of fi rms within industries. On the second point, SLEI found that 80% of LOBs sell to a mixture of both Latino and non-Latino customers. The results counter the perception that LOBs are small because Latino entrepreneurs choose to open businesses in small industries or because of a lack of diverse customer base.
An Entrepreneurial MindsetThe data speak to an interesting misalignment between the mindset of the Latino business owner and the reality of the state of their business. Although the growth mentality is present, the reality is that more than half (54%) of the surveyed LBOs have businesses that are either growing slowly, staying stagnant or shrinking, revealing a clear disconnect between goals and reality.
ExecutiveSummaryExecutive Summary 1
5

Internal Motivations Affect Ownership and CapitalFurther, our results indicate that Latino business owners are motivated primarily by internal, non-economic factors. When asked, only 37% of Latino entrepreneurs responded that external market opportunity was a key inspiration for becoming business owners. Instead, Latino business owners point to reasons based on internal impact-- building something to pass down to children, parents or family members, working with family or friends, or having control of their fi nancial future.
Personal motivations contribute to more than business creation, also infl uencing ownership and capital decisions. When it comes to ownership, the results show that LOBs are predominantly family owned with only 8% non-family ownership, compared to 15% of NLOBs. Additionally, although over half of respondents believe that they could grow faster if they had additional capital, 67% are concerned about losing control of their business if during fundraising, they sold a share to someone else or brought in a partner.
Capital Awareness & EngagementCompared to NLOBs, LOBs were less likely to look to conventional institutional capital sources, like banks, for funding and were more likely to use credit cards. However, while taking a closer look at capital and LOBs, our survey found that ⅓ of respondents have been turned down for funding, with the majority of those being declined by banks.
Further, while the SBA, SBIC and SBIR grants are three of the largest and most well-known
government funding programs for small businesses, according to our survey respondents, many Latino business owners are totally unaware of these government funds and programs. In fact, 22% have never heard of the SBA, 51% have never heard of the SBIC, and 56% have never heard of SBIR.
Next StepsLatino business owners are having a signifi cant impact on the economy, and there is an opportunity to have an even greater impact by understanding the factors that inhibit growth. This report is a fi rst step in improving the lives of Latinos through entrepreneurship, as it gives us a better understanding of the potential economic impact LOBs can have in the U.S. economy and the challenges that need to be addressed to get there.
In addition to the research, the Latino business database and research panel can help policymakers and business leaders understand and then accelerate the engines of job creation and wealth formation latent in the surging rates of Latino entrepreneurship. This report can also provide government agencies - such as the SBA, SBIC, SBIR - venture capitalists, banks and other commercial institutions, and nonprofi ts the opportunity to engage deeper with the Latino population, and specifi cally, the Latino entrepreneur.
In turn, further surveys and work with this research panel of LOBs can track the successes created by changes in public policy and public investments.
ExecutiveSummaryExecutiveSummary 2
6

Section
I
The Stanford Latino Entrepreneurship Initiative (SLEI) will conduct annual surveys of Latino business owners in the United States and provide timely reports on its fi ndings. This document, the fi rst State of Latino Entrepreneurship Report, provides academic researchers, policy makers and business leaders with a timely update of SLEI’s research results.
The research report’s data is derived from the following: a) a carefully cleaned database of 1,432,746 LOBs compiled from an aggregation of seven commercial databases provided the contact list for an initial survey of business owners and b) two survey panels were created--of 1,831 and 368 Latino business owners drawn from the database who agreed to participate in ongoing surveys and research. This panel, believed to be the largest statistically signifi cant panel on LOBs ever created,
provided the data for our initial analysis. Data models, using government surveys as the basis, were used to calibrate and weight the panel data and estimate more representative results. All further mention of the “research panel’s data” in this report refers to model corrected data.
The lead researcher for this report, Dr. Doug Rivers, senior fellow at the Hoover Institution and professor of political science at Stanford University, is one of the world’s leading experts on survey research. Previously, Dr. Rivers taught at Harvard University and at the California Institute of Technology.
IntroductionIntroduction
Section
I
7

Sec
tion
II
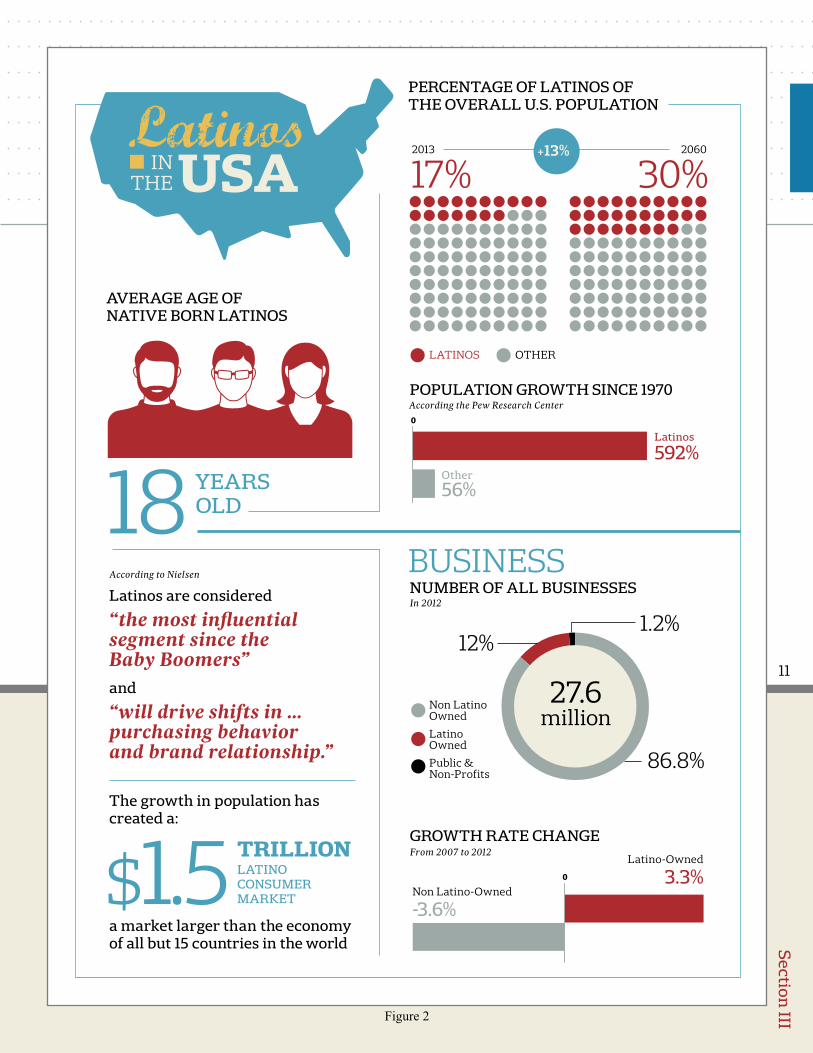
Latinos, a growing force in United States economy, currently represent 17% of the overall U.S. population (2013) and by 2060, Latinos will represent 30% of the U.S. population.1 According to the Pew Research Center (PRC), the Hispanic population has grown 592% since 1970, compared to only 56% for the overall U.S. population.2 In one of its demographic studies, the PRC determined that the average age of native born Latinos is 18 years of age with roughly 1 million entering adulthood every year.3 Clearly, the U.S. economy faces a future in which almost one out of every three workers and one out of every three consumers will be Latino. Their ability to provide skilled labor and to have suffi cient resources to consume will determine the future health of our national economy.
Nielsen, a leading global information and measurement fi rm, adds that Latinos are considered “the most infl uential segment since the Baby
Boomers,” and “will drive shifts in … purchasing behavior and brand relationship.”4 In fact, the growth in population has created a $1.5 trillion Latino consumer market,5 a market that, in 2014, was larger than the economy of all but 15 countries in the world.6
The infl uence of the Latino population on the economy is undeniable - from purchasing power to the labor supply. Yet, of potentially more interest is the recent explosion in the number of Latino Owned Businesses (LOBs). According to a recent news report, the number of Latino small businesses is growing at three times the rate of the national average,7 an extraordinary level of entrepreneurship that suggests Latinos play a substantial role in local job creation and economic development. SLEI seeks to more fully understand this rapidly growing segment of our economy in an effort to better promote its development and impact.
PopulationThe Latino Population, Market & Power
PopulationThe Latino Population, Market & Power
8

Section
III
3.1 Current DataMuch of the data on LOBs is out of date. Most generally comes from the Survey of Business Owners (SBO), conducted by the U.S. Census Bureau every fi ve years with results reported three years after the data are collected. For example, the 2007 SBO report was made available in 2010, and the 2012 report was issued in August 2015. Beyond the basic questions addressed by this Census, little is known about the particulars of U.S. LOBs.
In 1997, Latinos owned an estimated 1.2 million businesses. The number grew to 1.5 million by 2002, increased to 2.3 million in 2007, and by 2012, increased to 3.3 million (which represents 12% of the 27.6 million businesses in existence in the U.S. that year).
The growth rate of the number of LOBs went from 43.6% (2002-2007) to 46.9% (2007-2012), a 3.3%
increase over the two time periods. This is in sharp contrast to the growth rate of the number of Non-Latino Owned Businesses (NLOBs), which went from 4.4% (2002-2007) to 0.7% (2007-2012), a drop of 3.6%.
An important metric to put the LOB growth in context is the Kauffman Index of Entrepreneurship developed by the Kauffman Foundation. This metric focuses on “entrepreneurial outcomes, as opposed to inputs.” This index takes into account the birth rate of new entrepreneurs, the opportunity share of new entrepreneurs, and startup density.
According to Kauffman’s 2015 report, in 2014, Latinos had the highest rate of new entrepreneurs, with an index of 0.46 compared to 0.29 for Whites and 0.22 for African Americans.8
CurrentState of LOBsCurrentState of LOBs
continued on page 10
9

Sec
tion
III
3.3 Sales & EmployeesIn 2012, the 3.3 million LOBs had an average of 8.6 employees per fi rm, $18,027 per employee, an average of $155,806 in annual sales per fi rm, employing 2.5 million workers and generating a total of $517 billion in sales. This accounted for 1.5% of the $34 trillion sales by all businesses. By comparison, the 24 million NLOBs averaged 12 employees per fi rm, $47,677 per employee, and $573, 209 in annual sales per fi rm-- over 3.5 times more than the average LOB.
Perhaps most signifi cant, only 1.9% of LOBs grossed over $1 million in revenue, roughly 2.5 times lower than the 4.9% of NLOBs who reached that mark in 2007.9
Figure 1 compares the average sales per fi rm for LOBs and NLOBs from 1997 through 2012. While
NLOBs average sale per fi rm increased from $426,482 to $573,209 between 1997 to 2012 - an increase of $146,727 - LOBs average sales per fi rm went from $155,242 in 1997 to $155,806 in 2012 - an increase of only $564. This gap in average performance between LOBs and NLOBs has been a signifi cant pattern over at least the last decade and a half. As such, it represents a signifi cant opportunity for the future growth and development of our overall U.S. economy.
CurrentState of LOBsCurrentState of LOBs
0
1997
1997 -2002 2002-2007 2007-2012
2002
2007
2012
$ 426,482
-$ 14,198
-$ 52,994
$ 69,638
$ 664
$ 130,083
$ 155,242
$ 141,044
$ 155,141
$ 155,806
$ 373,487
$ 443,125
$ 573,209
Latino-Owned Business
Non Latino-Owned Business
0
$ 14,098
0
1997
1997 -2002 2002-2007 2007-2012
2002
2007
2012
$ 426,482
-$ 14,198
-$ 52,994
$ 69,638
$ 664
$ 130,083
$ 155,242
$ 141,044
$ 155,141
$ 155,806
$ 373,487
$ 443,125
$ 573,209
Latino-Owned Business
Non Latino-Owned Business
0
$ 14,098
Figure 1
Average Sales per Firm Comparison
Change in Average Sales10
Section
III
PERCENTAGE OF LATINOS OF THE OVERALL U.S. POPULATION
GROWTH RATE CHANGE
POPULATION GROWTH SINCE 1970
Latinos
592%Other
56%
86.8%
12%1.2%
LatinoOwned
Non LatinoOwned
Public &Non-Profits
The growth in population has created a:
a market larger than the economy of all but 15 countries in the world
17%
$1.5
2013
LATINOS OTHER
30%2060
According the Pew Research Center
According to NielsenNUMBER OF ALL BUSINESSES In 2012
From 2007 to 2012
AVERAGE AGE OF NATIVE BORN LATINOS
Latinos are considered
“the most influential segment since the Baby Boomers”and
“will drive shifts in … purchasing behavior and brand relationship.”
BUSINESS
3.3%
-3.6%
Latino-Owned
0
0
Non Latino-Owned
+13%
TRILLION LATINO CONSUMER MARKET
27.6million
18 YEARS OLD
Figure 2
11
Sec
tion
IV
As the Latino population grows and Latino businesses emerge at an even faster rate, a timely understanding of who these entrepreneurs are and how to support their growth is necessary to strengthen the economic fabric of the nation. To address these issues this initiative has created three complementary data sources to help researchers, policymakers and business leaders understand the current generation of Latino Owned Businesses (LOBs.) These are 1) the 2012 U.S. Census SBO dataset; 2) the 2014 initiative’s database of LOBs; and 3) the 2014/15 initiative’s survey panels of LOBs.
The data sources will expand throughout the years, yet they already provide insight on the economic force of the Latino entrepreneur, and the results highlight opportunities for impact.
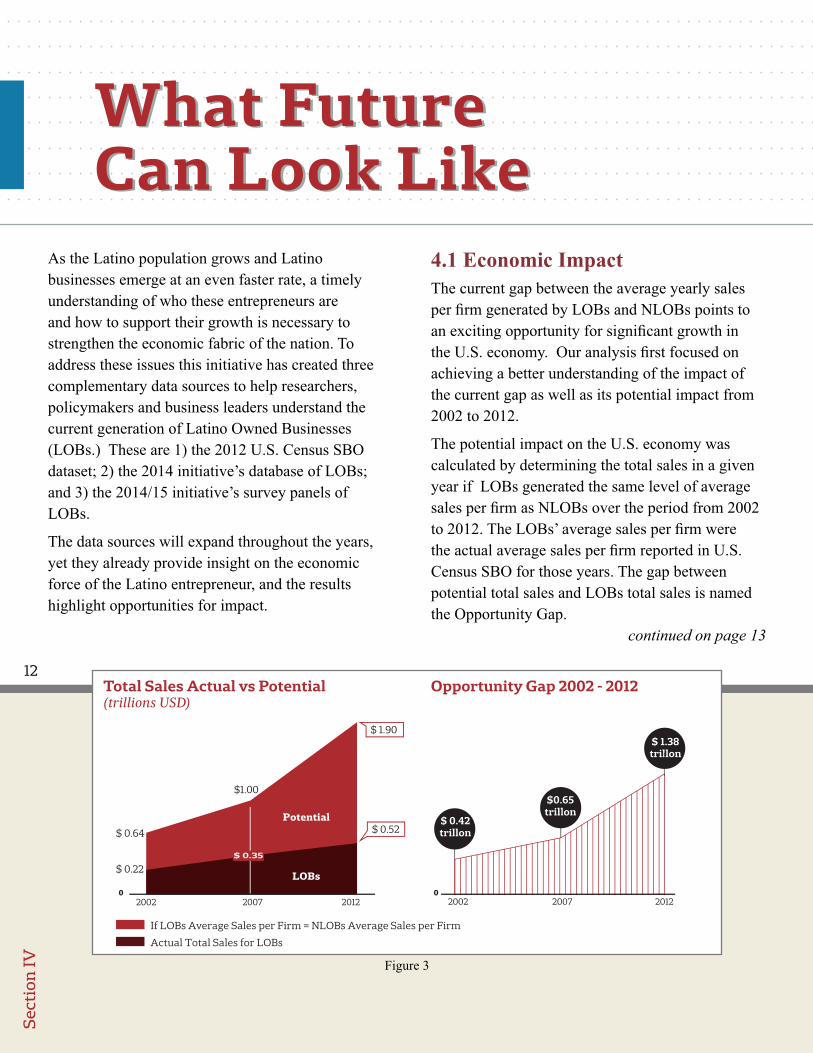
4.1 Economic ImpactThe current gap between the average yearly sales per fi rm generated by LOBs and NLOBs points to an exciting opportunity for signifi cant growth in the U.S. economy. Our analysis fi rst focused on achieving a better understanding of the impact of the current gap as well as its potential impact from 2002 to 2012.
The potential impact on the U.S. economy was calculated by determining the total sales in a given year if LOBs generated the same level of average sales per fi rm as NLOBs over the period from 2002 to 2012. The LOBs’ average sales per fi rm were the actual average sales per fi rm reported in U.S. Census SBO for those years. The gap between potential total sales and LOBs total sales is named the Opportunity Gap.
What Future Can Look LikeWhat Future Can Look Like
$ 0.64
$ 0.22
002002 2007 2012
$ 1.90
$1.00
Potential
LOBs
2002 2012 2007
$ 0.52
$ 0.35
$ 0.42trillon
$0.65trillon
$ 1.38trillon
If LOBs Average Sales per Firm = NLOBs Average Sales per Firm
Actual Total Sales for LOBs
Total Sales Actual vs Potential(trillions USD)
Opportunity Gap 2002 - 2012
Figure 3
continued on page 13
12

Section
IV
As shown in Figure 1, the average sales per fi rm of NLOBs grew by roughly $200 thousand from 1997 to 2012, while the average sales per fi rm for LOBs grew by roughly $563. The total potential sales for LOBs in 2012 was $1.90 trillion - an opportunity gap of over $1.38 trillion. This gap grew from just $0.42 trillion to $1.38 trillion from 2002 to 2012 (see Figure 3).
To further put the opportunity gap in perspective, an independent economic analysis conducted by LBAN determined that after eliminating the effects of industry and regions, LOBs’ impact to GDP growth, in contrast to total sales, in 2009 would have increased it by 40% if LOBs’ output were the same as the output of NLOBs in that year.
We can expect this Opportunity Gap to widen as the population and number of LOBs continues to grow. The economic impact of scaling LOBs on the
U.S. economy is evident; however, to effectively do so, additional insight is needed to better understand why LOBs are smaller. This report addresses this question in Section V.
What Future Can Look LikeWhat Future Can Look Like
13

Sec
tion
V
In the fi rst phase of the research - the fi rst annual Latino Owned Business (LOB) survey - respondents were asked about industry, customer base, company size, age, ownership structure, source of capital, and business challenges.
All of this report’s research analysis indicates that LOBs are dramatically smaller in size than NLOBs, although Latinos rank highest in entrepreneurial activity. But why are they smaller? Reasons often cited for lack of size are industries LOBs compete in and the customer base they target. However, the research challenges these perceptions and adds new explanations for why Latinos have been relatively unsuccessful in effectively scaling their companies.
5.1 Industry, Customers, Capital and OwnershipIndustries
The survey data on LOBs paints a picture of diversity of industries and integration into the economy. When comparing the mixture of industries of LOBs to NLOBs (Figure 4), the results counter the perception that LOBs are small because Latino entrepreneurs choose to open businesses in small industries (measured by Average Sales per Firm).
Figure 4 shows that in the top 5 industries in Average Sales per Firm, the difference in the percentages of LOBs and NLOBs in each of those industries is less than 1%. The data also show that of the bottom 5 industries in Average Sales per
Why areLOBS Smaller?Why areLOBS Smaller?
continued on page 16
14

Section
V
Latino Owned Business Non Latino Owned Business
0.1%0.07%
Utilities $ 11.8
1.9%Wholesale trade $ 11.5
1.5%2.1%
2.6%
Manufacturing $ 8
0.1%0.5%
Mining. quarringand oil and gas $ 7.9
0.9%1.4%Information $ 5.1
0.01%0.07%
Management ofcompanies $ 4.7
7.7%9.3%Retail trade $ 3.4
1.6%3.7%
Finance andinsurance $ 2.4
7.3%4%
Transportation andwarehousing
$ 2.3
14.3%10.2%
Construction $ 1.8
15.9%7.3%
Administrative andsupport and waste $ 1.3
3%5%
Arts. entertainment and recreation
$ 1.2
10.5%8.9%
Health care andsocial assistance $ 1.1
8.4%14.9%
Professional. scientificand technical
$ 1.1
0.5%0.9%
Agriculture.forestry. fishing
$ 1.1
4%10.4%
Real estate and rental and leasing
$ 1.1
3%3%
Accommodationand food services
$ 1
1.6%2.4%
Educationalservices
$ 0.8
16.7%12.8%
Other services (except public) $ 0.5
0.01%0.03%
Industries not classified
$ 0.1
Figure 4
INDUSTRIES LOBS & NLOBSIn percentage 2012
AVERAGE SALES
(millions USD)
15

Sec
tion
I
Equal Mixture
47%MostlyLatino
Mostly Not Latino
20%
33%
Firm, the difference in the percentages of LOBs and NLOBs in each of those industries is less than 7%.
The most visible differences are in the Professional Services and Real Estate industries. In the former, over 14% of NLOBs are in that industry, compared to 8% of LOBs. In the latter, there is a 6% gap between NLOBs and LOBs. However, Figure 4 shows that Real Estate and Professional Services rank 14th and 16th out of the top 20 industries in Average Sales per Firm.
The two industries where LOBs have a higher percentage than NLOBs - Construction and Administrative Support - are ranked 10th and 11th in Average Sales per Firm. Both LOBs and NLOBs have a small percentage of fi rms in the top four industries in Average Sales per Firm - Utilities, Wholesale, Manufacturing, Mining.
Figure 6 shows the percentages of LOBs and NLOBs by industry as compared to Projected Growth Rates. It reveals that LOBs are surprisingly oversubscribed in the industries with the highest projected growth rates and have less or similar percentages of businesses in the industries with the lowest growth rates-- further challenging the notion that LOBs concentrate in industries that are small or not growing rapidly.
Customers
A second common explanation of why LOBs remain small points to the perception that they mainly serve Latino customers and even though this segment of the U.S. population is growing rapidly it still is a relatively small proportion of all consumers. We investigated the reality of this perception by examining the profi le of the customer
Why areLOBS Smaller?Why areLOBS Smaller?
Figure 5
CUSTOMERS
Sec
tion
V
continued on page 18
16

Section
V
Latino Owned Business Non Latino Owned Business
26%
24%
23%
22%
21%
18%
18%
17%
17%
16%
16%
15%
14%
12%
11%
11%
10%
9%
9%
9%
14.3%10.2%
Construction
10.5%8.9%
Health care andsocial assistance
15.9%7.3%
Administrative andsupport and waste
16.7%12.8%
Other services (except public)
8.4%14.9%
Professional. scientificand technical
0.1%0.5%
Mining. quarringand oil and gas
0.01%0.03%
Industries not classified
1.9%Wholesale trade 2.6%
0.9%1.4%Information
0.01%0.07%
Management ofcompanies
0.1%0.07%
Utilities
7.3%4%
Transportation andwarehousing
0.5%0.9%
Agriculture.forestry. fishing
1.6%3.7%
Finance andinsurance
4%10.4%
Real estate and rental and leasing
3%5%
Arts. entertainment and recreation
1.5%2.1%
Manufacturing
1.6%2.4%
Educationalservices
3%3%
Accommodationand food services
7.7%9.3%Retail trade
Figure 6
INDUSTRIES FOR LOBS & NLOBSIn percentage 2012
GROWTHRATES
Projected for NLOBs 2012 - 2020
17

Sec
tion
V
Why areLOBs Smaller
base of LOBs.
We found that LOBs demonstrate a signifi cant amount of integration into the broader economy as measured by the mix of customers they serve. As shown in Figure 5, only 20% of LOBs have a “Mostly Latino” customer base, and roughly 80% of LOBs have either predominantly “Not Latino” or an equal mixture of “Latino” and “Non-Latino” customers. It is clear that, overall, LOBs do not depend totally on the Latino consumer for their success. As such, this does not appear to be a robust explanation for their average smaller size.
We then explored the possibility that age of a fi rm might infl uence the customer base and explain why LOBs are systematically smaller than NLOBs. Since older fi rms would normally tend to be larger than younger fi rms, one might predict that the older fi rms focus more on a Latino customer than the
younger fi rm and that is why they remain relatively small to in relation to NLOBs of the same age. Our analysis yielded the exact opposite results. Comparing mature fi rms, defi ned as those with 30 years in business, and younger fi rms, defi ned as those with less than 5 years in business, fewer mature LOBs (7.6%) serviced a “Mostly Latino” customer base than younger LOBs (22.5%). So, the older fi rms are not being restricted in their growth by the type of customer they serve. In fact, since they serve both Latinos and non-Latinos, one would expect them to be able to grow more easily than if they were only serving Latinos.
Why areLOBs Smaller
Equal mixture
47%
MostlyLatino
Mostly Not Latino
20%
33%
YOUNGUnder 6 years old
MATUREOver 30 years old
49%48.5%
22.5%
37.1%
7.6%
55.4%
Figure 7
continued on page 19
18

Section
V
Why areLOBs Smaller
Capital Sources
Perhaps the most commonly accepted explanation of why LOBs remain small is that they do not have access to capital. We asked our survey participants to identify their primary sources of capital. Their responses are summarized in Figure 8. Please note that respondents identifi ed more than one source for their fi nancial support.
As illustrated in Figure 8, the most common source of capital, cited by almost 70% of LOB respondents, was “Personal Savings.” The next three most common sources—very distant runner-ups—were “Credit Cards” and “Friends” and “Personal Bank Loans.” Surprisingly, only 6.1% of LOBs in this panel have fi nanced their business with a commercial loan and roughly 2.4% have fi nanced their business with a Government Loan (see Figure 8.), Indicating a near-absence of
Why areLOBs Smaller
PersonalSavings
Credit Cards
Friends
PersonalBank Loan
NoneNeeded
Commercial Bank Loan
Government Loan
LATINO OWNED
BUSINESS
NON LATINO OWNED
BUSINESS
69.1% 61.7%
18.3% 10.5%
12.2% 2.6%
10.7% 13.4%
6.5% 20.8%
6.1% 10.8%
2.4% 1.3%
Figure 8
continued on page 2019

Sec
tion
V
conventional institutional capital sources.
More specifi cally, the venture capital world has been almost totally absent in the funding of LOBs. A recent 2014 study focusing on analyzing the targets of funding in the VC industry found that less than 1% of venture-backed startups are founded by Latinos.10
In contrast, NLOBs were more likely to look to conventional institutional capital sources, like Banks, for funding. Moreover, 20.8% of NLOBs claim that they do not need any funding, compared to only 6.5% of LOBs reported in our survey.11 Clearly a stark difference in funding sources and needs between LOBs and NLOBs exists.
Ownership
Ownership patterns could potentially affect a company’s ability to grow. If founders were
unwilling to allow outside investors to provide the capital needed to fund growth because it would mean having to give up part ownership of this fi rm, then scaling becomes more diffi cult. An exploration of the ownership patterns was thus undertaken to determine if they might potentially be another inhibitor to LOB growth.
We found that LOBs are predominantly family owned. As illustrated in Figure 9, approximately 75% of LOBs are solely owned. “Husband and Wife” joint ownership and “Other Family Members” ownership combine for 17%, leaving “Non-Family” ownership at 8%. There are also differences between LOBs and NLOBs, with 92% of LOBs compared to 85% of NLOBs being family owned.
Why areLOBs SmallerWhy areLOBs Smaller
continued on page 22
20

Section
V
Non-Family
Sole Owner
Husband and Wife
Other FamilyMembers
Latino Owned Business
Non Latino Owned Business
75%12%
8%5%
OWNEROF LOBs
8% 15%
92% 85%
Non-Family Non-Family
Family Family
FIRM OWNERSHIPPercentage
Figure 9
21

Sec
tion
V
5.2 Capacity for GrowthExternal Contributions
Our study indicates that Latino business owners are motivated to become entrepreneurs by internal factors. When asked, only 37% of Latino entrepreneurs responded that external market opportunity was a key inspiration for becoming business owners. As shown in Figure 10, all other responses from Latino business owners point to reasons based on internal impact-- building something to pass down to children, parents or family members, working with family or friends, or having control of their fi nancial future. These results are consistent with a 2011 study, which found that Latinos were 16% more likely to start a business to provide fi nancially for their family than the general population. The same study found that Latinos
were 57% more likely to start a business to have something tangible to pass on to their children.12
These inspirations are further affi rmed by the manner in which businesses were started, with 68% of respondents launching their business alone. When new businesses are driven by market opportunity, the market dictates the skill set of the founders, increasing the likelihood of multiple business owners. This is evident by taking a look at the top 100 Silicon Valley startups, where solo founders are rare.
Personal motivations contribute to more than business creation. They also infl uence ownership and capital decisions. As seen in Figure 11, 88% of respondents own their business either alone or with an immediate family member, demonstrating a desire to keep the business close and within their
Why areLOBs SmallerWhy areLOBs Smaller
continued on page 25
22

Section
V
Marketplaceopportunity
InternalLatinoBusinessOwner’sInspiration
37%
68%Startedby myself
2%Other
13%Acquired the
business from someone else
13%Started with one
or more part-ners
4%Inherited or was
giventhe business
Build something to pass down to children
Parents or family members
Control of financial future
Other
Working with family or friends
26%
16%
16%
11%
12%
0
Which of the following things inspired you to become a business owner?
Did you start your business or take it over from someone else?
INSPIRATION
STARTED A BUSINESS
Figure 10
23

Sec
tion
V
Yes
12%
21%SomewhatConcerned
33%Not Concerned
6%Slightly
Concerned
40%ExtremelyConcerned
No
88%
Yes 51%
No 29%
Not Sure20%
0
ADDITIONAL CAPITALCould you grow faster if you had additional capital?
OWNERSHIPDoes anyone other than you or your immediate family own part of your business?
CONCERNAbout sharing equity during fund raising.
Figure 11
24

Why areLOBs SmallerWhy areLOBs Smaller
Section
V
social network. Further, although over half of respondents believe that they could grow faster if they had additional capital (see Figure 11), 67% are concerned about losing control of their business if during fundraising, they sold a share to someone else or brought in a partner.
Latino business owners’ tendency to make decisions based on the effect on their social network could be a hindrance to their growth and longevity. Prior research concludes that enduring, great companies have leaders who are passionate about the external contribution the business makes to the world. Such contributions would be demonstrated by those inspired by market opportunity to start and would not be driven to retain control of business.
Mentorship
A great deal of research and writings from experts in entrepreneurship cite mentorship as a key factor
for entrepreneurial success. A 2015 study from Endeavor titled: “The Power of Entrepreneur Networks” cultivated key insights from interviews with over 700 entrepreneurs, fi nding that most critically: mentor quality matters, good mentorship requires a sustained relationship and great mentors focus on critical business issues.
Our data affi rm these fi ndings. The LBO’s in our survey that report having a mentor highly value their relationships with their mentors (see Figure 12.) Of those that have a mentor, 81% had been engaging their mentor for 2 years or longer, pointing to a sustained relationship, and over 77% of LBO’s felt mentorship is either “Critical” or “Very Helpful” to the continued success of their business. Perhaps most strikingly, even with the guidance of
continued on page 26
25

Sec
tion
V
a mentor being so important, only 34% of Latino business owners in our sample have a mentor.
Entrepreneurial Mindset
Our data speak to an interesting misalignment between the mindset of the Latino business owner and the reality of the state of their business. In our survey, Latino business owners were asked about the current and projected growth of their business as well as factors that contribute to growth.
As shown in Figure 13, when asked what factors drive their business growth, the top three most frequently checked responses were technology, market expansion and product innovation, suggesting an entrepreneurial mindset. Additionally, out of the 64% of LOBs that are growing at any rate, 81% believe that it will take 5 years or less to double the size of their business-- an ambitious feat.
Although the growth mentality is present, the reality is that more than half (54%) of the surveyed LBOs have businesses that are either growing slowly, staying stagnant or shrinking, revealing a clear disconnect between goals and reality.
Sources of Capital
As shown in Figure 14, Latino Business Owners self-fi nance, followed by bank loans as the next biggest tier of fi nancing. The theme of internal drivers and support is highly visible in sources of capital LBO’s seek and receive. At fi rst glance, it seems many Latino business owners never seek growth capital of any sort. While striving to scale based on self-fi nancing alongside revenues and profi ts makes sense for many, when we look at why LBO’s consistently under-index in size both
Why areLOBs SmallerWhy areLOBs Smaller
No 62%
Yes 34%
Not Sure 4%
59.7%
17.7%
15.9%
6.6%0.1%Not Helpful
Somewhat Helpful
Very Helpful
Critical
Only Slightly Helpful
16% 34% 9% 38% 3%
Less than 1 year 2-5 years
5-10 years More than 10 years
Not Sure
% of LOBs with mentors Value of Mentors
Time with Mentor
continued on page 28
Figure 12
26

Section
V
1 2 3 4 5 6 7 8 9 10 11 12 13 14 15 16 17 18 19 more than 20
31%
50%
13% 3%3%
YEARS
Incorporating new technology into operations
Focusing on new
markets
Developingnew
products
Expanding your sales
force
Expandingsize of existing
locations
Other Increasing the number of locations
32% 29% 28% 24%
37%
28%
18%
9%
9%
22% 17% 9%
Growing at anormal rate
Growingslowly
Neither growingnor shrinking
Growingrapidly
Shrinking
TIME TO DOUBLE BUSINESS
Drivers of Growth
Describe Current State of Business
How long do you think it will take to double the size of your business?
Figure 13
27

Sec
tion
V
at the median and at the highest tiers, it is clear the inability to access growth capital is a factor.
Interestingly, as Figure 14 shows, approximately 42% of our respondents have been denied capital by outside sources, such as banks and commercial lenders, while 54% have either never asked or never been denied outside capital. This provides an opportunity for banks and commercial lenders to better engage Latino Business Owners, especially those that have been in existence for multiple years, as it is crucial to growing the strength of our LOB’s.
Government Funding & Organizations
The SBA, SBIC and SBIR grant are three of the largest and most well-known government funding programs for small businesses.
The Small Business Administration (SBA) provides support for both the ecosystem of Small Business Investment Companies (SBIC) and the Small
Business Innovation Research (SBIR) programs. SBICs have provided many funding opportunities to American businesses. Since its inception through 2014, the SBIC program has provided a total of $73.3 billion of long-term debt and equity capital to more than 118,000 small U.S. businesses, with $5.46 billion invested in 1,085 small U.S. businesses in fi scal year 2014 alone. The SBIR Program, “America’s Seed Fund,” has provided over $42 billion since the program’s inception and supports over 150,000 awards.
The government provides a strong platform to support businesses in the U.S.. Yet, according to our survey respondents, Latino Business Owners are unaware of many of these business government funds and programs. In fact, as shown in Figure 15, 22% have never heard of the SBA, 51% have never heard of the SBIC, and 56% have never heard of
Why areLOBs SmallerWhy areLOBs Smaller
continued on page 3028

Section
VFigure 14
Personal Savings Bank Loans
Familymembers
None ofthe above
VC/Angel 1.1%
Other 0.4%
Friends 0.2%
63.5%
54.1%27.2%
0
6.7%
3.9% 0.2%4.2%
18% 8.7% 8.1%
Never Requested/Declined
Bank or othercommercial
lending institution
Other A government program
Individualsor angel
investors
Nonprofit/micro-finance
program
SOURCES OF CAPITAL
DECLINED FUNDING FROM
16%
14%
10%
9%
7%
7%
4%
2%
General Chambersof Commerce
Hispanic Chambers of Commerce
Trade Associations/Organizations
Local Non-Profit Boards
Local Governmental Boards
Latino Business orientednon-profits
Governmental Business/ Economic Development Organizations
Other
ORGANIZATIONS ENGAGED WITH
29

Sec
tion
V
SBIR. This presents an incredible opportunity for government agencies to expand their efforts into the Latino business sphere. In 2015, SBIR did just that, taking it upon themselves to broaden outreach. The hope is continued engagement leads to more Latino business owners seeking these grants and loans.
This opportunity for engagement extends farther than government agencies. Our survey asked Latino business owners about organizations they have engaged with, as shown in Figure 14. Only 16% of respondents have engaged with general chambers of commerce, 14% with Hispanic chambers of commerce, 10% with trade associations, 7% with economic development organizations, and 2% with Latino business oriented nonprofi ts.
Why areLOBs SmallerWhy areLOBs Smaller
Are you familiar with:
24%
22%
17% 36%
Very Familiar Somewhat Familiar
Slightly Familiar Never Heard Of
SBA
51%
56%
2%10%
37%
36%
2%6%
SBDIC
SBIR
GOVERNMENT FUNDING
Figure 15
30

Section
VI
ConclusionsConclusionsWith the fi rst annual State of Latino Entrepreneurship, the Stanford Latino Entrepreneurship Initiative has presented data on Latino Business Owners in the United States. Many of the fi ndings regarding inhibitors to scaling Latino Owned Businesses (LOBs) were presented for the very fi rst time. In addition to developing a survey of Latino Business Owners that compliments the U.S. Census Survey of Business Owners, this report provided data on Latino business owners’ motivations to launch businesses, use of mentorship, and entrepreneurial mindset. In addition, a deeper analysis regarding use of capital and government funding was presented.
This report is a fi rst step in improving the lives of Latinos through entrepreneurship, as it gives us a better understanding of the potential economic impact LOBs can have in the U.S. economy and the challenges that need to be addressed to get there.
In addition to the research, the Latino business database and research panel can help policymakers, business leaders, and other organizations understand and then accelerate the
engines of job creation and wealth formation latent in the surging rates of Latino entrepreneurship.
It can help policymakers who are focused on a wide range of pressing social and economic issues such as job creation, economic equality, underserved communities, anti-poverty programs, and the like. This data can help policymakers understand how changes in laws, policies, incentives, or set-asides might turn disadvantage and poverty into opportunity and wealth. This report can also provide government agencies - such as the SBA, SBIC, SBIR -, venture capitalists, banks and other commercial institutions, and nonprofi ts the opportunity to engage deeper with the Latino entrepreneur. In turn, further surveys and work with this research panel of LOBs can document the successes created by changes in public policy and public investments.
Finally, it is SLEI’s intention to make its database and growing survey panel available to all academic researchers free of charge. We want to promote the substantial increase in the body of research on this very important segment of the U.S. economy.
31

Appendix A ChartsAppendix A Charts
Economy
Marketing
Employees
Financial
40%
38%
37%
Clients
28%13%
9%
4%18%
Technology
30%Competition
Other
None
CONCERNSIn percentage
REVENUES & AGE OF FIRMS
2%2%
17%79%
Less Than5 years
< $100K $100K - $500K $500K - $1M >$1M
4%5%
Greater Than30 years
80% 11%
Figure 16
Figure 17
32
Appendix A Charts
LatinoOwned Business
0.2%
0.3% 0.4% 0.4%
28.4%3.1%
2.3%
0.3%
2.5% 2.9% 3.1%
Non Latino Owned Business
LatinoOwned Business
Non Latino Owned Business
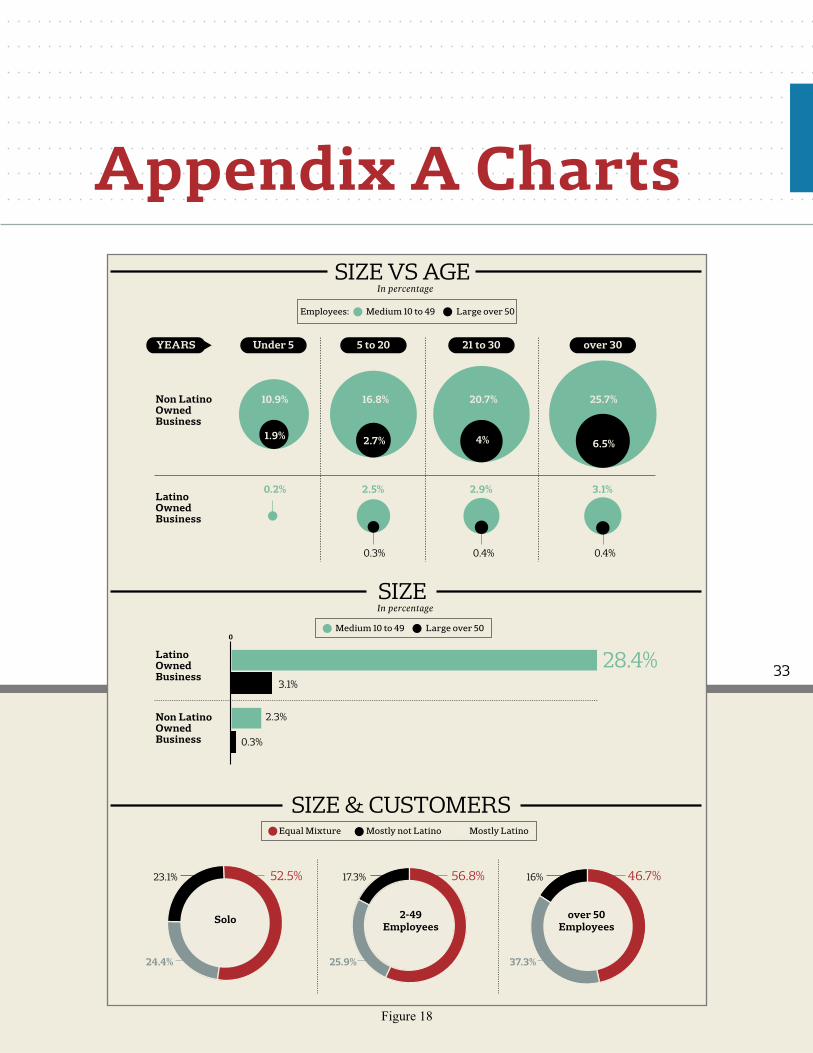
SIZE VS AGEIn percentage
SIZE & CUSTOMERSMostly not LatinoEqual Mixture Mostly Latino
10.9% 16.8% 20.7% 25.7%
Under 5 5 to 20 21 to 30 over 30
6.5%4%2.7%1.9%
YEARS
Medium 10 to 49Employees: Large over 50
SIZEIn percentage
Medium 10 to 49 Large over 500
46.7%
37.3%
16%
over 50Employees
56.8%
25.9%
17.3%
2-49Employees
52.5%
24.4%
23.1%
Solo
Figure 18
33

Hispanic - LatinoThe U.S. Census defi nes Hispanic or Latino as “those people who classifi ed themselves in one of the specifi c Spanish, Hispanic, or Latino categories listed on the Census ... questionnaire -”Mexican,” “Puerto Rican”, or “Cuban”-as well as those who indicate that they are “another Hispanic, Latino, or Spanish origin.” People who do not identify with one of the specifi c origins listed on the questionnaire but indicate that they are “another Hispanic, Latino, or Spanish origin” are those whose origins are from Spain, the Spanish-speaking countries of Central or South America, or the Dominican Republic.”
In this report, the terms Hispanic and Latino are used interchangeably.
All FirmsThe U.S. Census describes it as the “list of all fi rms (or universe) [that] was compiled from a combination of business tax returns and data collected on other economic census reports.” This report refers to “All Firms” as used within the 2012 US Census SBO.
Non-LatinoThe list of private fi rms that are not listed as Hispanic or Latino.
TerminologyAppendix BTerminology
34
Much of the data on Latino Owned Businesses comes from an old 2007 Survey of Business Owners conducted by the Census Bureau before the fi nancial crisis and recession. Worse, little was known about the particulars of Latino Owned Businesses (LOBs), such as their customers, ownership, fi nancing, challenges, or use of government resources to help grow their businesses. As the Latino population grows and Latino businesses emerge even faster, understanding who these entrepreneurs are and supporting their growth will strengthen the economic fabric of the nation. Good policies depend on good data.
This report is based on four complementary data sources that help researchers, policymakers, and businesses understand the current generation of LOBs. The fi rst is a carefully cleaned database of 1,432,746 Latino businesses compiled from seven
commercial databases. The second is a panel of 1,861 Latino business owners who responded to our fi rst survey and have agreed to participate in ongoing surveys and research. The third is a panel of 368 Latino business owners who responded to our second survey. The fourth is modeled data that uses government surveys to calibrate and weight our panel data to estimate more representative results. Although we continue to improve and expand these data sources, they already provide breadth, depth, and improved accuracy for understanding this new economic force.
The 1,861 business panel is perhaps our most important resource for helping everyone understand LOBs and entrepreneurs who create and grow them. The panel consists of Latino entrepreneurs who have been contacted by us, completed an
MethodologyAppendix CMethodology
continued on page 36
35

Appendix CMethodology
initial interview, and have agreed to participate in future research.
Although the Census’s Survey of Business Owners is now out-of-date and contains only a few variables of interest, it is still useful for weighting samples from the research panel. A statistical model was used to project estimates of the number, industry, location, and number of employees for LOBs from 2007 to 2012 (and will be updated to 2015). These estimates are then used to weight samples from the SLEI panel so that they are approximately representative of the current universe of Latino entrepreneurs.
The primary dataset used for statistical modeling is the 2007 Survey of Business Owners, which contained a sample of 155,995 Latino business owners. The Census is able to use payroll fi lings and tax returns to identify businesses. Businesses
selected for inclusion in the Census’s sample are legally required to participate in the survey, which makes the response rate much higher than is typical for most research surveys.
Appendix CMethodology
36

Appendix DReferences
[1] http://www.census.gov/content/dam/Census/library/publications/2015/demo/p25-1143.pdf
[2] http://www.pewresearch.org/fact-tank/2014/12/16/with-fewer-new-arrivals-census-lowers-hispanic-population-projections-2/
[3] http://www.pewhispanic.org/2013/02/15/statistical-portrait-of-hispanics-in-the-united-states-2011/
[4] http://www.nielsen.com/us/en/insights/news/2013/upscale-latinos--americas-new-baby-boomers.html
[5] http://www.nielsen.com/us/en/insights/news/2014/a-fresh-view-of-hispanic-consumers.html
[6] http://www.bizjournals.com/atlanta/news/2014/09/30/uga-minority-buying-power-rises-hispanics-lead-the.html
[7] http://latino.foxnews.com/latino/money/2015/02/19/us-economy-being-fueled-by-success-hispanic-owned-business/
[8] Fairlie, Morelix, Reedy, & Russell, The Kauffman Index Startup Activity 2015
[9] https://www.minneapolisfed.org/publications/community-dividend/hispanic-entrepreneurship-grows-but-barriers-persist#f4
[10] http://teten.com/blog/2014/04/29/why-are-venture-capitalists-ignoring-the-future-the-emerging-domestic-economy
[11] 2007 US Census Survey of Business Owners
[12] “The pursuit of the American dream The fi scal practices of today’s Hispanic business owners”, Massachusetts Mutual Life Insurance Company, 2011
Appendix DReferences
37