Embed Size (px)
Citation preview
the stateof foodand agriculture
1970
1945-1970
FOOD AND AGRICULTURE ORGANIZATION OF TI-IF UNITED NATIONS
THE STATE OF FOD AND AGRICt LTURESPECIAL CHAPTERS
In addition to the usual review of the recent world food and agriculturesituation, each issue of this report from 1957 has included one or morespecial studies of problems of longer term interest. Special chapters inearlier issues have covered the following subjects:
1957 Factors influencing the trend of food consumptionPostwar changes in some institutional factors affecting agriculture
1958 Food and agricultural developments in Africa south of the Sahara
The growth of forest industries and their impact on the world's forests
1959 Agricultural incomes and levels of living in countries at different stagesof economic development
Some general problems of agricultural development in less developedcountries in the light of postwar experience
1960 Programing for agricultural development
1961 Land reform and institutional changeAgricultural extension, education and research in Africa, Asia and LatinAmerica
1962 The role of forest industries in the attack on economic underdevelopment
The livestock industry in less developed countries
1963 Basic factors affecting the growth of productivity in agriculture
Fertilizer use: spearhead of agricultural development
1964 Protein nutrition: needs and prospectsSynthetics and their effects on international trade
1966 Agriculture and industrialization
Rice in the world food economy
1967 Incentives and disincentives for farmers in developing countries
The management of fishery resources
1968 Raising agricultural productivity in developing countries through techno-logical improvement
Improved storage and its contribution to world food supplies
1969 Agricultural marketing improvement programmes: some lessons fromrecent experience
Modernization of institutions to promote development
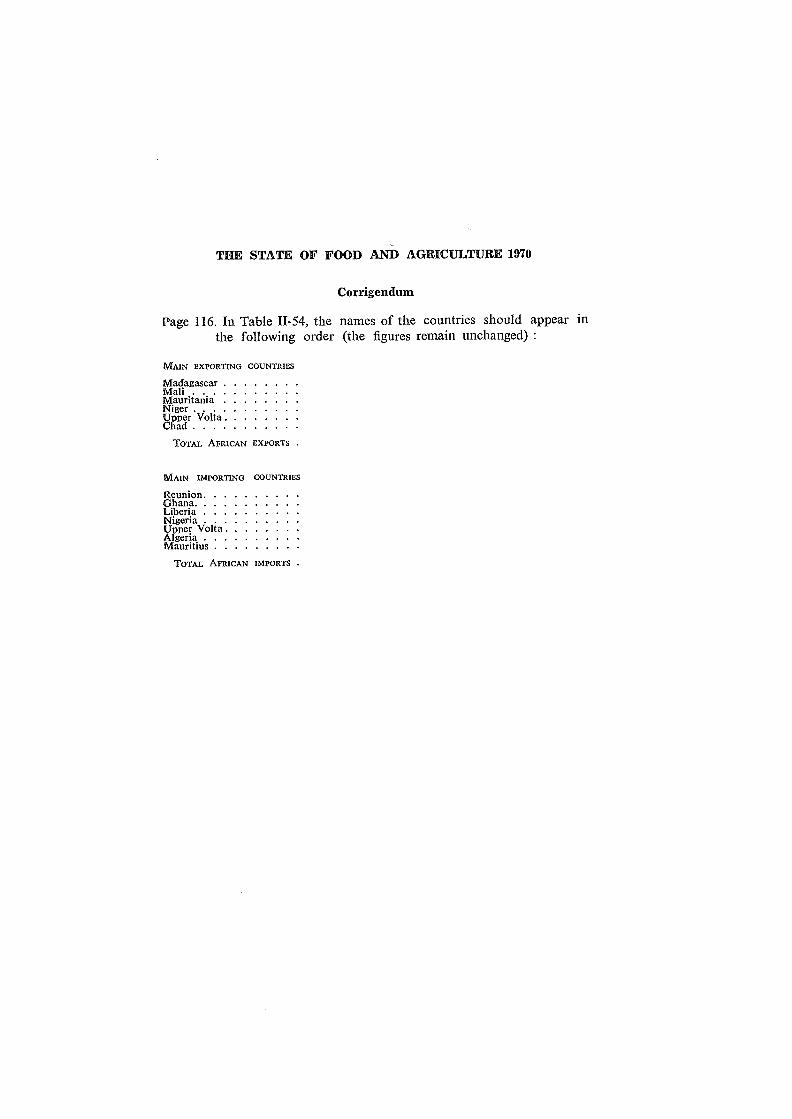
THE STATE OF FOOD AND' AGRICULTURE 1970
Corrigendum
Page 116. In Table II-54, the names of the countries should appear inthe following order (the figures remain unchanged)
MAIN EXPORTING COUNTRIES
MadagascarMaliMauritaniaNigerUpper VoltaChad
TOTAL AFRICAN EXPORTS .
MAIN IMPORTING COUNTRIES
ReunionGhanaLiberiaNigeriaUpper VoltaAlgeriaMauritius
TOTAL AFRICAN IMPORTS

THE STATE OF FOOD AND AGRICULTURE 1970

ni
,
WORLD REVIEW
REVIEW BY REGIONS
AGRICULTURE AT THE THRESHOLDOF TEIE SECOND DEVELOPMENT DECADE
FOOD AND AGRICULTURE ORGANIZATION OF THE MATED NATIONS
Rome, 1970
The statistical material in this publication hasbeen prepared from the information availableto FAO up to I October 1970
The designations employed and the presentationof the material in this publication do not implythe expression of any opinion whatsoever on thepart of the Food and Agriculture Organizationof the United Nations concerning the legal orconstitutional status of any country, territory orsea area, or concerning the delimitation offrontiers.
© FAO 1970
Printed in Italy
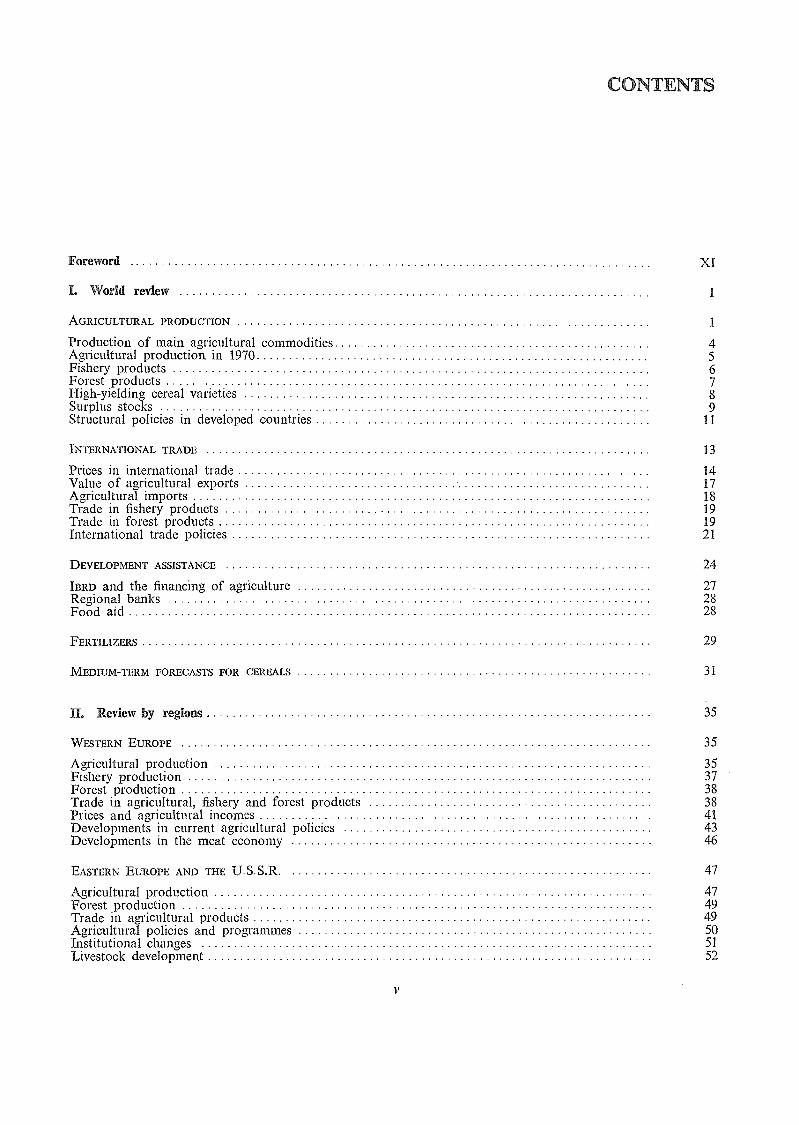
Foreword
I. World review
AGRICULTURAL PRODUCTION
Production of main agricultural commodities 4Agricultural production in 1970 5Fishery products 6Forest products 7High-yielding cereal varieties 8Surplus stocks 9Structural policies in developed countries 11
INTERNATIONAL TRADE 13
Prices in international trade 14Value of agricultural exports 17Agricultural imports 18Trade in fishery products 19Trade in forest products 19International trade policies 21
DEVELOPMENT ASSISTANCE 24
IBRD and the financing of agriculture 27Regional banks 28Food aid 28
FERTILIZERS 29
MEDIUM-TERM FORECASTS FOR CEREALS 31
IL Review by regions 35
WESTERN EUROPE 35
Agricultural production 35Fishery production 37Forest production 38Trade in agricultural, fishery and forest products 38Prices and agricultural incomes 41Developments in current agricultural policies 43Developments in the meat economy 46
EASTERN EUROPE AND THE U.S S R 47
Agricultural production 47Forest production 49Trade in agricultural products 49Agricultural policies and programmes 50Institutional changes 51Livestock development 52
V
CONTENTS
vi
NORTH AMERICA 54
Agricultural production 54Fishery production 56Forest production 56Trade in agricultural, fishery and forest products 56Agricultural incomes and prices 57Problems, policies and programmes 59
OCEANIA 63
Agricultural production 64Trade in agricultural and fishery products 64Agricultural prices and incomes 65Forest production and trade 65Problems, policies and programmes 65
LATIN AMERICA 67
Agricultural production 68Fishery production 70Forest production 70Trade in agricultura l, fishery and forest products 70Livestock development 72Development plans and policies 76Regional economic integration 78
FuR EAST ' 79
Developing countries 79
Agricultural production 80High-yielding cereal varieties 82Fishery production 85Forest production 85Trade in agricultural, fishery and forest products 86Livestock development 88Development planning 91Regional economic cooperation 93
Japan 94
Principal problems and policies 95
Mainland China 95
NEAR EAST 96
Agricultural production 96High-yielding varieties of cereals 98Role of economic incentive measures 99Trade in agricultural, fishery and forest products 100Livestock development 102Development planning 106Regional integration 107
AFRICA 108
Agricultural production 109Fishery production 110Forest production 111Trade in agricultural, fishery and forest products 111Technological progress 112Desert locust control 113Livestock development 114Development plans and policies 120Regional economic cooperation 123
TH. Agriculture at the threshold of the Second Development Decade
POSTWAR TRENDS
PERFORMANCE OF AGRICULTURE IN DEVELOPING COUNTRIES
Agricultural productionInternational trade in agricultural productsAgricultural incomes and levels of livingFood consumption and nutrition
TECHNOLOGICAL PROGRESS
Application of techn.ology in developing countries
AGRICULTURAL DEVELOPMENT POLICIES 143
Agricultural planning 143Rural institutions 145Population. policy 147International trade policies 148Development assistance 150
SOME AGRICULTURAL PROBLEMS IN THE SECOND DEVELOPMENT DECADE 153
FOOD CROP PRODUCTION 158
Cereal production prospects 158Priorities and future policies for major food crops 163Strategy for the modernization of production 167Improving productivity in difficult environments 169
LIVESTOCK PRODUCTION 170
Meat from ruminants . 171Pigs and poultry 174Dairy development 175Livestock on the small farm 176
AGRICULTURAL EXPORT EARNINGS 176
Basic foods 178Agricultural raw materials . 179Processed agricultural products 180Tropical beverages . 180Minor agricultural exports 181Trade between developing countries 182
RURAL EMPLOYMENT 182
Difficulties in increasing agricultural employment 183Labour-intensive agricultural production techniques 184Nonagricultural employment opportunities in rural areas . 186Overall policy considerations in increasing rural employment 188
SOME POLICY IMPLICATIONS 188
Agricultural policies in developin.g countriesInternational cooperation and assistance
vil
125
127
127
127132135137
139
141
188190
Figures
I-1 Trends in food production and population in the developing regions 3
I-2 World: Average export unit values of agricultural, fishery and forest products 16
II-1 Western Europe: Changes in indices of prices received and paid by farmers and the ratiobetween the two indices (1968 to 1969) 38
II-2 Far East: Rice (paddy) yields in selected countries, 1952-69 77
III-1 Average annual growth of agricultural production in 75 developing countries, 1952-54 to1967-69 129
III-2 Growth of agricultural production and population in the developing regions 130
111-3 Calorie and protein supplies as percentages of requirements 138
TH-4 Animal protein as a percentage of total protein 138
II1-5 Percentage of calories from carbohydrates 138
III-6 Total and official flow of development assistance in relation to the gross national product ofdonor countries 151
Annex tables
Explanatory note: FAO index numbers of agricultural, fishery, and forest production and_trade 196
lA World: Volume of production of major agricultural, fishery and forest products 197
1B World: Volume of exports of major agricultural, fishery and forest products 198
1C World: Average export unit values of selected agricultural, fishery and forest products 199
2A Western Europe: Basic data on national agriculture 201
2B Western Europe: Volume of production of major agricultural, fishery and forest products 203
2C Western Europe: Indices of food and total agricultural production 204
2D Western Europe: Volume of imports of major agricultural and forest products 206
2E Western Europe: Volume of exports of major agricultural, fishery and forest products 207
2F Western Europe: Indices of volume and value of exports and imports of agricultural, fish-ery and forest products, by commodity groups . 208
2G Western Europe: Per caput food supplies available for human consumption :in selectedcountries 209
2H Western Europe: Estimated calorie and protein content of national average food supplyper caput . 210
3A Eastern Europe and U.S.S.R.: Basic data on national agriculture 211
3B Eastern Europe and U.S.S.R.: Volume of production of major agricultural, fishery andforest products . 212
3C Eastern Europe and U.S.S.R. : Indices of food and total agricultural production 213
3D Eastern Europe and U.S.S.R.: Volume of imports of major agricultural and forest products 213
3E Eastern Europe and U.S.S.R.: Volume of exports of major agricultural, fishery and forestproducts 214
3F Eastern Europe and U.S.S.R.: Indices of volume and value of exports and imports of agri-cultural, fishery and forest products, by commodity groups 215
3G Eastern Europe and U.S.S.R.: Per caput food supplies available for human consumption inselected countries 216
3H Eastern Europe and U.S.S.R.: Estimated calorie and protein content of national averagefood supply per caput 216
4A North America: Basic data on national agriculture 217
4B North America: Volume of production of major agricultural, fishery and forest products 217
4C North America: Indices of food and total agricultural production 218
4D North America: Volume of imports of major agricultural and forest products 219
4E North America: Volume of exports of major agricultural, fishery and forest products4F North America: Indices of volume and value of exports and imports of agricultural, fishery
and forest products, by commodity groups4G North America: Per capu.t food supplies available for human consumption in selected coun-
tries .
4H North America: Estimated calorie and protein content of national average food supply percaput
5A Oceania: Basic data on national agriculture 2235B Oceania: Volume of production of major agricultural, fishery and forest products 2235C Oceania: Indices of food and total agricultural production 2245D Oceania: Volume of imports of major agricultural and forest products 2245E Oceania: Volume of exports of major agricultural, fishery and forest products 2255F Oceania: Indices of volume and value of exports and imports of agricultural, fishery and
forest products, by commodity groups 226SG Oceania: Per caput food supplies available for hurnan consumption in selected countries 2275H Oceania: Estimated calorie and protein content of national average food supply per caput 227
6A Latin America: Basic data on national agriculture 2286B Latin America: Volume of production of major agricultural, fishery an.d forest products 2306C Latin. America: Indices of food and total agricultural production 2316D Latin. America: Volume of imports of major agricultural and forest products 2336E Latin America: Volume of exports of major agricultural, fishery and forest products 2346F Latin America: Indices of volume and value of exports and imports of agricultural, fishery
and forest products, by commodity groups 2356G Latin America: Per caput food supplies available for human consumption in selected coun-
tries 23661-I Latin America: Estimated calorie and protein content of national average food supply per
caput 237
7A Far East: Basic data on national agriculture 2387B Far East: Volume of production of major agricultural, fishery and forest products . 2397C Far East: Indices of food and total agricultural production 2407D Far East: Volume of imports of major agricultural and forest products 2427E Far East: Volume of exports of major agricultural, fishery and forest products 243
7F Far East: Indices of volume and value of exports an.d imports of agricultural, fishery andforest products, by commodity groups 244
7G Far East: Per caput food supplies available for human consumption in selected countries 24571-I Far East: Estimated calorie and protein content of n.ational average food supply per caput 246
8A Near East: Data on national agriculture 2478B Near East: Volume of production of major agricultural, fishery and forest products 2488C Near East: Indices of food and total agricultural production 2498D Near East: Volume of imports of major agricultural and forest products 2518E Near East: Volume of exports of major agricultural, fishery and forest products 2528F Near East: Indices of volume and value of exports and imports of agricultural, fishery and
forest products, by commodity groups 2538G Near East: Per caput food supplies available for human consumption in selected countries 2548H Near East: Estimated calorie an.d protein content of national average food supply per caput 255
9A Africa: Basic data on national agriculture 2569B Africa: Volume of production of major agricultural, fishery and forest products 258
9C Africa: Indices of food and total agricultural production 259
ix
220
221
222
222
9D Africa: Volume of imports of major agricultural and forest products 263
9E Africa: Volume of exports of major agricultural, fishery and forest products 264
9F Africa: Indices of volume and value of exports and imports of agricultural, fishery andforest products, by commodity groups 265
9G Africa.: Per caput food supplies available for human consumption in selected countries 266
9H Africa: Estimated calorie and protein content of national average food supply per caput 267
10A Average annual growth of agricultural production and population in developing countries 268
10B Main features of postwar development plans in developing countries . 270
NOTE
The following symbols are used in statistical tables:
non.e or negligible
not available
1967/68 signifies a crop, marketing or fiscal year running from one calendar year to the next. 1967-68signifies the average for two calendar years. In the An.nex tables an average of split years, for example1948/49-1950/51, is indicated as follows: 1948/-50/.
Figures in statistical tables may not add up because of rounding. Percent changes from one year to an-other have been calculated from unroun.ded figures.
Unless otherwise indicated, the metric system is used throughout. For explanation of the coverage andmethods of calculating the FAO index numbers of agricultural production and international trade in agricul-tural products, see Explanatory Note to the Annex Tables.
FOR-770RD
The year 1970 is in several respects a special one for FAO. It is the twenty-fifthanniversary of the Organization, which was founded on 16 October 1945. In June, a verylarge number of people from all walks of life came together at the Second World FoodCongress for a searching discussion of the problems that lie ahead in FAO's field of inter-national responsibility. Not least, 1970 marks the beginning of a concerted atteinpt tohnplement an international strategy for the economic and social betterment of mankindduring the Second United Nations Development Decade.
Thus, it is a year ivhich calls for an assessment of past performance and of the tasksfor the future. A large part of this issue of The state of food and agriculture is there-fore devoted to a chapter which, after a brief backward look at the past quarter of a cen-tury, examines some of the main agricultural problems facing Me developing countries atthe threshold of the Second Development Decade.
The current review chapters of this report offer further evidence that at long lastsomething of a turning point may have been reached in the difficult struggle of thedeveloping countries to achieve a sufficiently rapid increase in their food production. Notthat 1969, the season principally under review, was a good one for agriculture. At theworld level, after tivo years of especially good results, production showed no increase atall. But this was mainly, although not entirely, because of unfavourable growing conditionsin 1969 in the well-fed, developed regions of the world.
Food production in the needy, developing regions recorded a further increase in 1969,although at 2 percent it was not only smaller than in each of the two preceding years, butalso below the 2.6 percent average increase for the past decade, which barely kept pacewith the population growth and resulted in increased food imports by developing countries.
In Latin America there was only a limited recovery and in the Near East the increasewas below average. In Africa bad weather kept production at the level of the previousyear. But in the Far East, with its immense population, there was the third successivelarge increase in food production (4 percent in 1969, compared with 6 percent in 1968 and4 percent iii 1967) since the disastrous harvests of 1965 and 1966.
This is cause for satisfaction, not only because it affects such vast numbers ofpeople,but also because it suggests ivhat can be done when goverwnents are firmly committed toagricultural development: it illustrates what can happen when farmers are introduced tohnproved technology in econotnic and institutional circumstances that enable them totake full advantage of it.
How to achieve, in Mis way, the desirable level and pattern of food-crop productionis the first of the major agricultural problems of the Second Development Decade dis-cussed in this report. It is necessary to ensure not only that the momentum of the spreadof the high-yielding varieties of cereals is maintained in the countries where they have al-ready been introduced but also that the higher level of technology that the new varietiesrepresent is extended to other crops and other countries. It is also necessary to ensurethat a nutnber of important side-effects caused by the technological changes in such fieldsas trade, employment and inconre distribution are successfully dealt with.
It seems reasonable to hope that the high-yielding varieties of cereals will make itpossible to overconze the worst calorie deficiencies in many of the developing countries dur-ing the course of the 1970s. They should also help to reduce the scourge of protein deficiency that particularly afflicts so many children, both because cereals are man's mainsource of protein, and because higher yields of these dominant crops can release land forother proposes, including feed production. But protein deficiencies seem likely to continuemuch longer than calorie. deficiencies, especially because many good sources of proteinare comparatively expensive and thus out of reach of the lower income groups in the manydeveloping countries where wide in come discrepancies persist.
The most costly sources of protein, livestock products, are greatly sought after in mostparts of the world, and livestock production is the second major probletn area of the SecondDevelopment Decade discussed in this report. It appears inevitable that the relative pricesof livestock products will rise very rapidly in the coming years, thus putting them still far-ther out of reach of the poorest people who most need additional protein. If protein sup-plies are to be increased at anywhere near a sufficiently fast pace, it will be necessary totake all possible steps to raise the production and consumption of good vegetable sourcesof protein and of fish and, within the livestock sector, to concentrate on the productionof pigs and poultry, which have a shorter reproductive cycle thatz ruminants.
xi
So far one of the main results of the introduction of the high-yielding varieties ofcereals has been a return to greater self-sufficiency in food in a number of developing coun-tries. Some of them already have or may have in the near future a surplus capacity. Thisis an example both of the side-effects arising from the recent technological breakthroughsand of the adjustment problems to which I have recently been drawing attention. At leastfor cereals the coming years will necessitate a major reconsideration of production andtrade policies by a number of countries, both developed and developing, importing andexporting.
Trade problems, which have loomed large in the world agricultwal economy throughoutthe past 25 years, are the third area discussed in this report in connexion with the SecondDevelopment Decade. The abnost continuous downward trend in the prices and terms oftrade of agricultural exports has done much to frustrate the plans of the developing coun-tries to achieve a better life for their people. Although in 1969, for the first time for someyears, there was a small increase in the agricultural export earnings of the developing coun-tries, this only took thetn back to a level afready achieved several years ago. Substantialchanges are needed if trade problems are to be any less serious in the future: partly thisdepends on adjustments in the terms of trade in favour of developing countries, partly onadjustments in production and utilization patterns in these countries.
The fourth and final question discussed here concerns rural employment. Just as thereseems at last to be some hope of achieving a better balance between food supplies andpopulation growth, employment is emerging as a further problem whose solution is incideinfinitely more difficult by the unprecedentedly high rates of population growth in the devel-oping countries. Unemployment and underemployment, in agriculture and in the rest ofthe econotny, seem certain to bring a heavy burden of individual suffering and indignity, ofwasted productive resources, and of social dissatisfaction and unrest during the 1970sand beyond.
A glance at the Provisional Indicative World Plan for Agricultural Development (whichis now being evolved hito a perspective study of ivorld agricultural development) or atthe report of the Second World Food Congress will confirm that the four subjects singledout for discussion here far from exhaust the list of the agriculturdl problems that willbeset the world during the Second Development Decade. Yet all is not gloom. Progresshas been made in the last 25 years. Although there has not been much improvenzent in thenutrition and general welfare of many of the world's poorest people, it has at least been pos-sible to cope with an unprecedented rate of population growth without any major break-downs in food supplies.
In the future, MliCh more than this will be needed, especially since what can beachieved in the agricultural sector will be a major determinant of the overall progress thatis possible during the Second Development Decade. But there are grounds for hope inthe generally greater awareness of the crucial role of agriculture in economic and socialdevelopment, in the increased government investtnent in the agricultural sector in severalof the latest national development plans, in the increased assistance for agriculture in spiteof the unfortunate slowdown in foreign aid, and in the recent achievetnents of farmers inmany countries. Moreover, as inust be very clear to anyone who was at the SecondWorld Food Congress, the energies and enthusiasms of the youth of the world can consti-tute a new and immensely powerful force for development.
At this anniversary time, I am above all conscious of the need for FAO to play itsfull part in the difficult period before us. The experience of the last few years has illustrat-ed how quickly the situation and needs of our Member Nations can change. In the lightof my assessment of these needs when I took office in 1968, I have given priority inthe Organization's work to assisting countries in their planning for economic developtnent,especially to the five areas of concentration: high-yielding varieties, protein, human re-sources, earning and saving foreign exchange, and war on waste. We are intensifying ourwork in these areas. At the same time, we shall participate, together with the rest ofthe international community, in a detailed review and appraisal of progress during theSecond United Nations Development Decade and adjust our priorities, if necessary, in thelight of that review, so as to continue to make the greatest possible contribution towardthe solution of the problems facing us.
xii
A.H. BoermaDirector-General
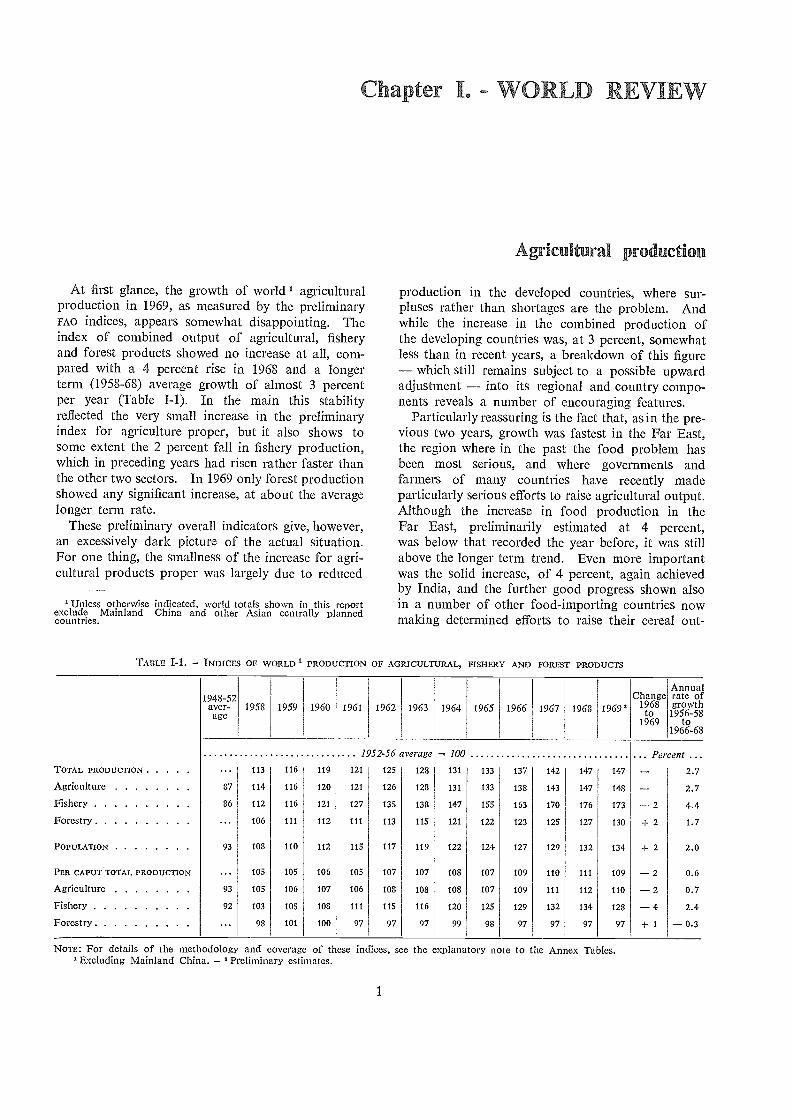
At first glance, the growth of world agriculturalproduction in 1969, as measured by the prelimin.aryFAO indices, appears somewhat disappointing. Theindex of combined output of agricultural, fisheryand forest products showed no increase at all, com-pared with a 4 percent rise in 1968 and a longerterm (1958-68) average growth of almost 3 percentper year (Table I-1). In the main this stabilityreflected the very small increase in the preliminaryindex for agriculture proper, but it also shows tosome extent the 2 percent fall in fishery production,which in preceding years had risen rather faster thanthe other two sectors. In 1969 only forest productionshowed any significant increase, at about the averagelonger term rate.
These preliminary overall indicators give, however,an excessively dark picture of the actual situation.For one thing, the smallness of the increase for agri-cultural products proper was largely due to reduced
Unless otherwise indicated, world totals shown in this reportexclude Mainland China and other Asian centrally plannedcountries.
Chapter L - WORLD
Agricultura production
production in the developed countries, where sur-pluses rather than shortages are the problem. Andwhile the irtcrease in the combined production ofthe developing countries was, at 3 percent, somewhatless than in recent years, a breakdown of this figure
which still remains subject to a possible upwardadjustment into its regional and country compo-nents reveals a number of encouraging features.
Particularly reassuring is the fact that, as in the pre-vious two years, growth was fastest in the Far East,the region where in the past the food problem hasbeen most serious, and where governments andfarmers of many countries have recently madeparticularly serious efforts to raise agricultural output.Although the increase in food production in theFar East, preliminarily estimated at 4 percent,was below that recorded the year before, it was stillabove the longer term trend. Even more importantwas the solid increase, of 4 percent, again achievedby India, and the further good progress shown alsoin a number of other food-importing countries nowmaking determined efforts to raise their cereal out-
NOTE: For details of the metl odology and coverage of these indices, see the explanatory note to the Annex Tables.Excluding Mainland China. Preliminary estimates.
TABLE I-1. INDICES OF WORLD PRODUCTION OF AGRICULTURAL, FISHERY AND FOREST PRODUCTS
I94S-52aver-age
1958 1959 1960 1961 1962 1963 1964 1965 1966 1967 1968 1969'Change
1968to
1969
Annualrate ofgrowth1956-58
to1966-68
1952-56 average 100 Percent .TOTAL PRODUCTION 113 116 119 121 125 128 131 133 137 142 147 147 -- 2.7
Agriculture 37 114 116 120 121 126 128 131 133 138 143 147 148 -- 2.7
Fishery 86 112 116 121 127 135 138 147 155 163 170 176 173 -- 2 4.4
Forestry 106 111 112 111 113 115 121 122 123 125 127 130 + 2 1.7
POPULATION 93 108 110 112 115 117 119 122 121 127 129 132 134 + 2 2.0
PER CAPUT TOTAL PRODUCTION 105 105 106 105 107 107 108 107 109 110 111 109 -- 2 0.6
Agriculture 93 105 106 107 106 108 108 108 107 109 111 112 110 -- 2 0.7
Fishery 92 103 105 108 111 115 116 120 125 129 132 134 128 -- 4 2.4
Forestry 98 101 100 97 97 97 99 98 97 97 97 97 + 1 -- 0.3
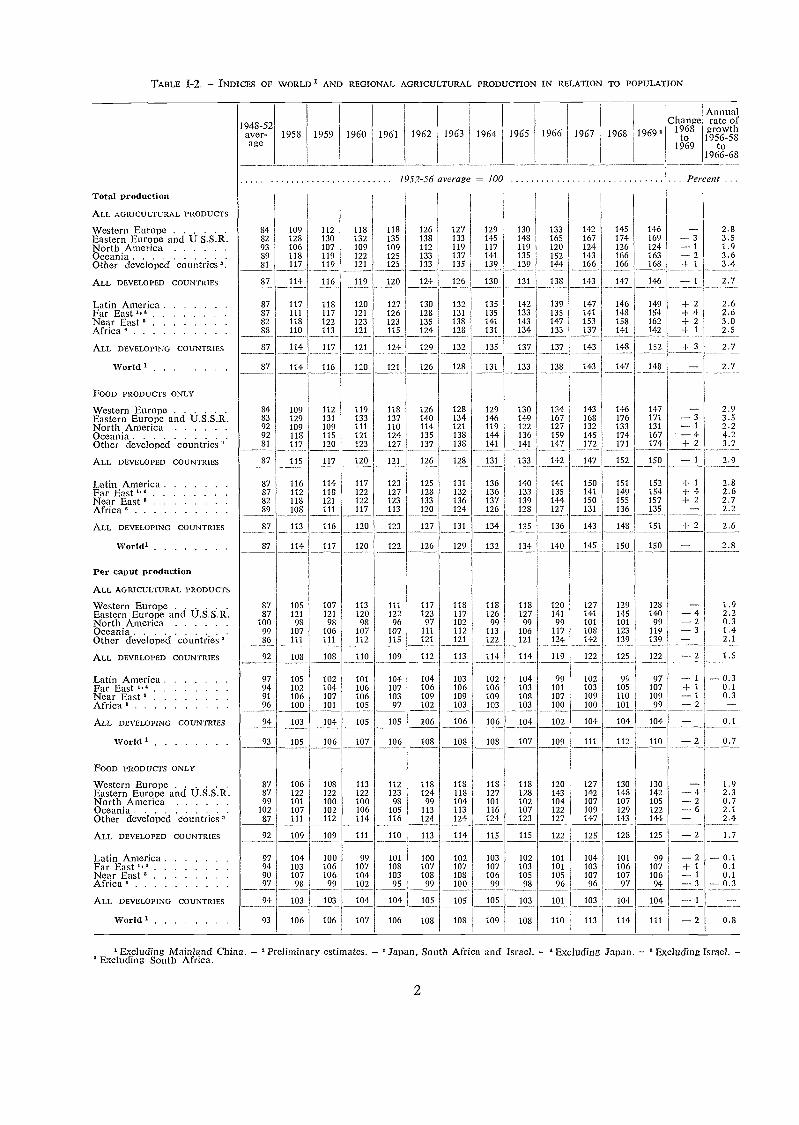
TABLE 1-2. - INDICES OF WORLD 1 AND REGIONAL AGRICULTURAL PRODUCTION IN RELATION TO POPULATION
1948-52aver-age
1958 1959 1960 1961 1962 1963 1964 1965 1966 1967 1968 1969'Change
1968to
1969
Amlualrate ofgrowth
1956-58to
1966-68
'Excluding Mainland China. - 'Preliminary estimates. - °Japan, South Africa and Israel. - 'Excluding Japan. - °Excluding Israel. -° Excluding South Africa.
2
Total production
ALL AGRICULTURAL PRODUCTS
1952-56 average - 100 Percent . .
Western Europe . . .
R.Eastern Europe and U.S.S. .
8482
109128
112130
118132
118135
126138
127133
129145
130148
133165
142167
145174
146169
---3 2.83.5
North America 93 106 107 109 109 112 119 117 119 120 124 126 124 -- 1 1.9Oceania 89 118 119 122 125 133 137 141 135 152 143 166 163 - 2 3.6Other developed countries'. 81 117 119 121 125 133 135 139 139 144 166 166 168 + 1 3.4
ALL DEVELOPED COUNTRIES 87 114 116 119 120 124 126 130 131 138 143 147 146 -1 2.7
Latin America 87 117 118 120 127 130 132 135 142 139 147 146 149 + 2 2.6Far East'," 87 111 117 121 126 128 131 135 133 135 141 148 154 + 4 2.6Near East 82 118 122 123 123 135 138 141 143 147 153 158 162 + 2 3.0Africa 88 110 113 121 115 124 128 131 134 133 137 141 142 + 1 2.5
ALL DEVELOPING COUNTRIES 87 114 117 121 124 129 132 135 137 137 143 148 152 + 3 2.7
World 87 114 116 120 121 126 128 131 133 138 143 147 148 -- 2.7
FOOD PRODUCTS ONLY
Western Europe 84 109 112 119 118 126 128 129 130 134 143 146 147 -- 2.9Eastern Europe and U.S.S.R. 83 129 131 133 137 140 134 146 149 167 168 176 171 -3 3.5North America 92 109 109 111 110 114 121 119 122 127 132 133 131 -1 2.2Oceania 92 118 115 121 124 135 138 144 136 159 145 174 167 -4 4.2Other developed countries 81 117 120 123 127 137 138 141 141 147 172 171 174 + 2 3.7
ALL DEVELOPED COUNTRIES 87 115 117 120 121 126 128 131 133 142 147 152 150 -1 2.9
Latin America 87 116 114 117 123 125 131 136 140 141 150 151 152 + 1 2.8Far East 4'5 87 112 118 122 127 123 132 136 133 135 141 149 154 + 4 2.6Near East 82 118 121 122 123 133 136 137 139 144 150 155 157 + 2 2.7Africa 89 108 111 117 113 120 124 126 128 127 131 136 135 -- 2.2
ALL DEVELOPING COUNTRIES 87 113 116 120 123 127 131 134 135 136 143 148 151 + 2 2.6
VVorldl 87 114 117 120 122 126 129 132 134 140 145 150 150 -- 2.8
Per caput production
ALL AGRICULTURAL PRODUCTS
Western EuroPe 87 105 107 113 111 117 118 118 118 120 127 129 128 1.9Eastern Europe ztnd U.S.S.R. 87 121 121 120 122 123 117 126 127 141 141 145 140 -- 4 2.2North America 100 98 98 98 96 97 102 99 99 99 101 101 99 -2 0.3Oceania 99 107 106 107 107 111 112 113 106 117 108 123 119 -3 1.4Other developed countries' 86 111 111 112 115 121 121 122 121 124 142 139 139 -- 2.1
ALL DEVELOPED COUNTRIES 92 108 108 110 109 112 113 114 114 119 122 125 122 -2 1.5
Latin America 97 105 102 101 104 104 103 102 104 99 102 99 97 -- 1 -- 0.3Far East 1,4 94 102 104 106 107 106 106 106 103 101 103 105 107 + 1 0.1Near East 91 106 107 106 103 109 109 109 108 107 109 110 109 -1 0.3Africa 96 100 101 105 97 102 103 103 103 100 100 101 99 -2ALL DEVELOPING COUNTRIES 94 103 104 105 105 106 106 106 104 102 104 104 104 -- 0.1
World 1 93 105 106 107 106 108 108 108 107 109 111 112 110 -2 0.7
FOOD PRODUCTS ONLY
Western Europe 87 106 108 113 112 118 118 118 118 120 127 130 130 -- 1.9Eastern Europe and U.S.S.R. 87 122 122 122 123 124 118 127 128 143 142 148 142 -- 4 2.3North America 99 101 100 100 98 99 104 101 102 104 107 107 105 -2 0.7Oceania 102 107 102 106 105 113 113 116 107 122 109 129 122 -6 2.1Other developed countries 87 111 112 114 116 124 124 124 123 127 147 143 144 -- 2.4
ALL DEVELOPED COUNTRIES 92 109 109 111 110 113 114 115 115 122 125 128 125 -2 1.7
Latin America 97 104 100 99 101 100 102 103 102 101 104 101 99 -- 2 -- 0.1Far East 1," 94 103 106 107 108 107 107 107 103 101 103 106 107 + 1 0.1Near East 90 107 106 104 103 108 108 106 105 105 107 107 106 -1 0.1Africa 97 98 99 102 95 99 100 99 98 96 96 97 94 -3 -0.3ALL DEVELOPING COUNTRIES 94 103 103 104 104 105 105 105 103 101 103 104 104 -1
World 93 106 106 107 106 108 108 109 108 110 113 114 111 -2 0.8
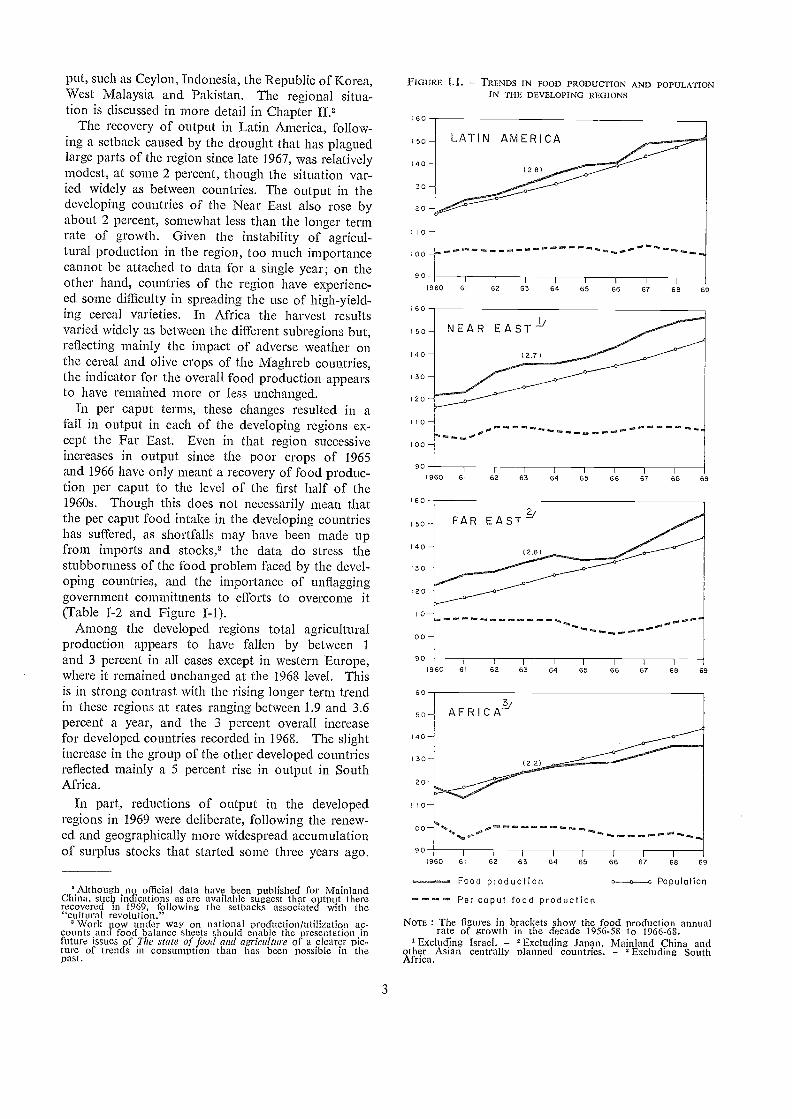
put, such as Ceylon, Indonesia, the Republic of Korea,West Malaysia and Pakistan. The regional situa-tion is discussed in more detail in Chapter 112
The recovery of output in Latin America, follow-ing a setback caused by the drought that has plaguedlarge parts of the region since late 1967, was relativelymodest, at some 2 percent, though the situation var-ied widely as between countries. The output in thedeveloping countries of the Near East also rose byabout 2 percent, somewhat less than the longer termrate of growth. Given the instability of agricul-tural production in the region, too much importancecannot be attached to data for a single year; on theother hand, countries of the region have experienc-ed some difficulty in spreading the use of high-yield-ing cereal varieties. In Africa the harvest resultsvaried widely as between the different subregions but,reflecting mainly the impact of adverse weather onthe cereal and olive crops of the Maghreb countries,the indicator for the overall food production appearsto have remained more or less unchanged.
In per caput terms, these changes resulted in afall in output in each of the developing regions ex-cept the Far East. Even in that region successiveincreases in output since the poor crops of 1965and 1966 have only meant a recovery of food produc-tion per caput to the level of the first half of the1960s. Though this does not necessarily mean thatthe per caput food intake in the developing countrieshas suffered, as shortfalls may have been made upfrom imports and stocks,3 the data do stress thestubbornness of the food problem faced by the devel-oping countries, and the importance of unflagginggovernment commitments to efforts to overcome it(Table f-2 and Figure T-1).
Among the developed regions total agriculturalproduction appears to have fallen by between 1
and 3 percent in all cases except in western Europe,where it remained unchanged at the 1968 level. Thisis in strong contrast with the rising longer term trendin these regions at rates ranging between 1.9 and 3.6percent a year, and the 3 percent overall increasefor developed countries recorded in 1968. The slightincrease in the group of the other developed countriesreflected mainly a 5 percent rise in output in SouthAfrica.
In part, reductions of output in the developedregions in 1969 were deliberate, following the renew-ed and geographically more widespread accumulationof surplus stocks that started some three years ago.
'Although no official data have been published for MainlandChina, such indications as are available suggest that output thererecovcrecf in 1969, following the setbacks associated with the"cultural revolution."
' Work now undcr way on national production/utilization ac-counts and food balance sheets should enable the presentation infuture issues of The state of food and agriculture of a clearer pic-ture of trends in consumption than has been possible in thepast.
3
FIGURE 1.1. TRENDS IN FOOD PRODUCTION AND POPULATIONIN THE DEVELOPING REGIONS
/ 6 0
1 50 -
40 -
130 -
12 0 -
1 I 0 -
100
90
16 0
1 5 0 -
14 0 -
1 30 -
120
11 0 -
10 0 -
16 0
1 50 -
14 0 -
13 0 -
/ 2 0 -
11 0 -
10 -
1 6 0
I 5 0
140
1 30
120
1 0
I 0 0
90
1960
1960 61
LATIN AMERICA
(2.8)
62 63 64
1
1 1
3 64 65 66 676
1 1
65 66 67
68 69
Food production Population
---- Per caput food production
NOTE : The figures in brackets show the food production annualrate of growth in the decacfe 1956-58 to 1966-68.
Excluding Israel. Excluding Japan, Mainland China andother Asian centrally planned countries. Excluding SouthAfrica.
68 69
62 63 66 6764 65 6968
1960 61 62 63 54 65 66 67 68 69
As is discussed in more detail later in this chapterand also in Chapter II, the tendency was counteredin 1968 and 1969 by various measures to discourageor limit production and to increase consumption,though many of them will have their impact andin some cases probably only a limited one in1970 and the following years. More commonly,the 1969 shortfall appears to have been due to un-favourable weather, for example in the U.S.S.R.and parts of both eastern and western Europe. Nordo developments in production appear to have beensuch as to have had any major impact as yet on thesize of stocks. Overall, the impression remainsthat so far most of the adjustments in output of thesurplus products have taken place in the developedexporting countries, while the developed importingcountries with few exceptions have madelittle contribution toward a better long-term balancein world markets for these products.
Production of main agricultural commodities 4
Among the principal agricultural commodities, theoverall production of wheat declined in 1969 by 6percent from the record level of 1968 to a total ofabout 290 million tons. Production decreases werewidespread in both developed and centrally plannedcountries, reflecting acreage cuts in North America(though the effect of these in Canada was offsetby higher yields) and unfavourable weather condi-tions, particularly in the U.S.S.R., Australia, northAfrica, and parts of the Near East where widespreadrust attacks also affected the crop. Several countriesin Asia and Latin America, however, reached recordlevels of wheat production in particular Indiawhere both the area cultivated and yields were larger,Pakistan, and Argentina where the crop recoveredstrongly following improved weather conditions.
In contrast, the output of coarse grains increasedmoderately in 1969. The output of maize was upby about 5 percent, reflecting larger crops in NorthAmerica, western and eastern Europe, the U.S.S.R.and Asia, which more than offset smaller crops inthe Southern Hemisphere for the second year in suc-cession. No significant change was recorded in thetotal output of barley or millet and sorghums.
Another record was achieved in the production ofrice, reflecting both favourable weather conditionsin the main rice-producing countries and continuingtechnological progress, particularly the wider adop-tion of the new high-yielding varieties. With in-creases taking place in both the main exporting and
' For a detailed account of the commodity situation, seeFAO commodity review and outlook 1969-1970. Rome, 1970.Production data for individual commodities are also shown inAnnex table IA of this report.
4
importing countries, competition on world marketswas expected to become more intense.
Among other major foods, world meat productionis estimated to have risen by only about 2 percentcompared with an average of just below 4 percent ayear during the 1960s. There was hardly any risein red meat production in the high-income countries,except for the considerable increases in Australiaand New Zealand, where severe droughts in someareas caused additional slaughtering. The expansionof poultry meat production was only moderate. Inthe developing countries meat output is estimated tohave increased by about 2 percent thanks to the mark-ed expansion in beef production, particularly inArgentina. Pigmeat production was smaller in west-ern Europe (despite increases in the United King-dom, Portugal and Spain), in the United States andin Japan, but there was some increase in the U.S.S.R.World production of mutton and lamb fell slightlyin spite of increases recorded for New Zealand andAustralia. Milk production remained unchanged in1969. Higher production was recorded in LatinAmerica and in Oceania, where production recoveredfrom a low level in 1968, as well as in the Far Eastwhere Japan's output continued to expand rapidly.In the United States production declined further,however, and it also fell in western Europe and inthe U.S.S.R.
World production of sugar recovered in 1969 byaround 5 percent, following a decline in 1968. Beetsugar production increased only slightly because ofthe small harvest in eastern Europe and the U.S.S.R.where weather conditions were unusually bad. Totalcane sugar production is however estimated at anew record, in spite of another setback in Cubaand a smaller crop in Oceania. As in each of thepast 11 years, world output of oilseeds increasedagain in 1969 by 2 percent. The volume of out-put was smaller in the developing countries (exceptin India, where groundnut production was up by11 percent), and in the centrally planned countries,mainly because of a reduced sunflowerseed harvestin the U.S.S.R. These declines were just about off-set by a continuation of the upward trend in thedeveloped countries, mainly the United States whichaccounts for over one quarter of world productionand where the production of soybeans showed amarginal increase in 1969.
Total production of citrus fruit rose again in prac-tically all countries. Apple production also reach-ed a new record while the output of pears was lower.World production of bananas increased slightly inspite of losses in Central America due to adverseclimatic factors in the last quarter of the year.
Production of both coffee and cocoa recoveredfrom the low levels of 1968. Larger coffee cropswere harvested in all the main producing countries

except Uganda. Brazil's crop, though larger thanin 1968, was lower than expected because of frostand drought. Cocoa production was higher mainlybecause of the return of more normal weather con-ditions in west AfricEt. World output of tea roseby roughly 2 percent to a new record, with increasesin African countries more than making good thesmaller crops in India and Ceylon. Tobacco pro-duction remained unchanged; output increased inNorth and Latin America but fell in other areas,particularly in developing countries in Asia.
Among raw materials, world cotton productiondeclined slightly in 1969, with lower yields in severalmajor producing countries and smaller cultivatedareas in many minor ones. In the United Statesthe area planted was larger than in 1968, but adverseweather conditions and insect infestation led to thelowest yield per acre since 1957. Lower output wasalso recorded in Mexico and Central American coun-tries, because of reduced cultivation. Increases wererecorded in Australia, Brazil, Colombia, the Sudanand the United Arab Republic as well as in India andPakistan. World production of wool remained un-changed in 1969, with a rise in the developed countries(to a record level in both Australia and South Africa)offset by a fall in centrally planned economies. Nonet change took place in developing countries. Nat-ural rubber production rose by more than 8 percent,reflecting a new record in Malaysia as replantedhigh-yielding trees approached their period of fullyield, and more intensive tapping in Thailand. Worldproduction of jute, kenaf and allied fibres recoveredsubstantially from the extremely low level in 1968
particularly in India, Pakistan and Thailandand the total WITS only fractionally short of the 1966peak. Aside from generally favourable weather con-ditions, this reflected the attractive prices at sowingtime that had induced farmers to increase plantings.
Agricultural production in 1970
Early estimates for 1970 suggest that the tendencyfor total agricultural output in the developed regionsto remain stable has continued. Little or no increaseis estnnated to have taken place in western Europeor Oceania., and production in North America mayhave fallen slightly. The modest increase in out-put provisionally estimated for eastern Europe andthe U.S.S.R. represents only a partial recoveryafter the disappointing production results of 1969(Table I-3).
The situation in 1970 is described in more detailin Chapter II. In western Europe, the stability ofoutput was the combined result of decreases in theproduction of cereals and, to a lesser extent, sugar
5
TABLE 1-3. - EARLY INDICATORS OF AGRICULTURAL PRODUCTIONIN 1970
'Including Israel, South Africa and Janan
beet and milk all commodities currently in surplus.These decreases were more or less offset by modestincreases in the output of a number of other majorcommodities, including most types of meat, potatoesand olive oil. Countries whose agricultural produc-tion showed no increase include Denmark, France,the Federal Republic of Germany, Italy and Spain.Smaller cereal crops were also largely responsiblefor the stable level of output in North America andOceania. There were particularly steep reductions inthe wheat crops of Canada (where total agriculturalproduction fell by some 7 percent) and Australia,and in North America coarse-grain production wassmaller also. In eastern Europe and the U.S.S.R.,on the other hand, cereal crops showed a partialrecovery, especially wheat, and this, together withlarger harvests of potatoes and oilseeds, was mainlyresponsible for the increase that is estimated tohave taken place.
For the developing countries, fewer and less reli-able data on the 1970 production were available atthe time of writing. In Latin America, however,the indications were for some acceleration in thegrowth of output, following two years of disappoint-ing overall results. The majority of countries of theregion appear to have participated in this improve-ment, despite steep reductions in the Argentine wheatproduction and in the Brazilian coffee crop. Noquantitative estimate can as yet be made of thechange in other developing regions. In the FarEast, wheat crops are estimated to be larger in Indiaand Pakistan. For rice, weather conditions haveso far been reported to be generally favourable, butno harvest estimate can as yet be hazarded. Datafor the Near East and Africa are even fewer. Inthe former region, the total cereal crop may be down,with reduced crops of wheat and barley in some
Change1969 to 1970
Percent
DEVELOPED REGIONS
Western Eurone
Eastern Europe and U.S.S.R
North America
Oceania
TOTAL
DEVELOPING REGIONS
Latin America +4
major producing countries, and cotton productionmay also be smaller. For Africa, information is sofar limited to some of the major cash crops. Littlechange is expected to have taken place in coffee andcocoa production; that of tea may have fallen some-what. Olive oil production has recovered from lastyear's decline, and that of palm oil continued toincrease, but groundnut production is expected tobe smaller. Cotton production is thought likely tohave risen. Excellent maize crops were reportedfrom Kenya and Tanzania.
As a result of the above-described changes in wheatproduction, the world total for the crop is expectedto have remained slightly below the 1969 level. Thesame holds true for coarse-grain production, wherethe main factor is the decline in European crops.In the case of rice, crops in the United States andJapan were smaller in response to policies to reduceoutput, but if weather remains normal during therest of the growing season, particularly in the FarEast, a world total equal to the 1969 record levelis considered possible.
The output of other foods, including meat andfats and oils, was expected to total well above the1969 level. Meat supplies, in particular, will prob-ably rise markedly, mainly due to the sharp increaseanticipated in the production of pigmeat and poultryin western Europe and North America. However,sugar production in 1970/71 was not likely to exceedsubstantially the 1969/70 record. Milk production
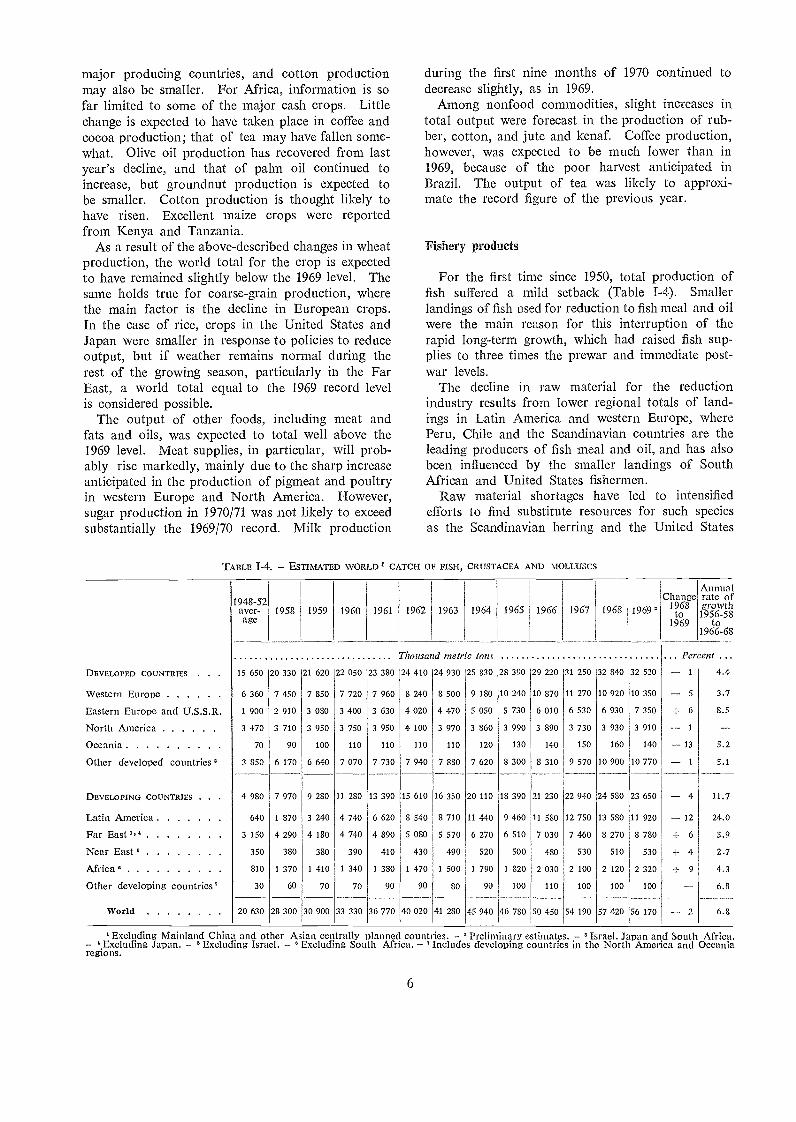
TABLE I-4. ESTIMATED WORLD 1 CATCH OF FISH, CRUSTÁCEA AND MOLLUSCS
1948-52aver-age
1958 1959 1960 1961 1962
410
240
020
100
110
940
610
020
6
during the first nine months of 1970 continued todecrease slightly, as in 1969.
Among nonfood commodities, slight increases intotal output were forecast in the production of rub-ber, cotton, and jute and kenaf. Coffee production,however, was expected to be much lower than in1969, because of the poor harvest anticipated inBrazil. The output of tea was likely to approxi-mate the record figure of the previous year.
Fishery products
For the first time since 1950, total production offish suffered a mild setback (Table 1-4). Smallerlandings of fish used for reduction to fish meal and oilwere the main reason for this interruption of therapid long-term growth, which had raised fish sup-plies to three times the prewar and immediate post-war levels.
The decline in raw material for the reductionindustry results from lower regional totals of land-ings in Latin America and western Europe, wherePeru, Chile and the Scandinavian countries are theleading producers of fish meal and oil, and has alsobeen influenced by the smaller landings of SouthAfrican and United States fishermen.
Raw material shortages have led to intensifiedefforts to find substitute resources for such speciesas the Scandinavian herring and the United States
1963
16 350
41 280
1964
20 110
45 940
1965
18 390
46 780
1966
21 230
540 8 710 11 440 9 460 11 580 12 750 13 580
080 5 570 6 270 6 510 7 030 7 460 8 270
430 490 520 500 480 530 510
470 1 500 1 790 1 820 2 030 2 100 2 120
90 30 90 100 110 100 100
50 450
1967
22 940
54 190
1963
24 530
57 420
1969'
Thousa d metric tons
32 520
10 350
7 350
3 910
140
10 770
23 650
11 920
8 780
530
2 320
100
56 170
Change1968to
1969
. Percent .. .1
5
6
1
13
1
4
12
6
4
9
2
Annualrate ofgrowth
1956-58to
1966-68
4.4
3.7
8.5
5.2
5.1
11.7
24.0
5.9
2.7
4.3
6.8
6.8
Excluding Mainland China and other Asian centrally planned count' ies. Preliminary estimates. ' Israel, Japan and South Africa.° Excluding Japan. °Excluding Israel. Excluding South Africa. 'Includes developing countries in the North America and Oceania
regions.
DEVELOPED COUNTRIES . 15 650 20 330 21 620 22 050 23 380 24
Western Europe 6 360 7 450 7 850 7 720 7 960 8
Eastern Europe and U.S.S.R 1 900 2 910 3 080 3 400 3 630 4
North Americq 3 470 3 710 3 950 3 750 3 950 4
Oceania 70 90 100 110 110
Other developed countries 3 850 6 170 6 640 7 070 7 730 7
DEVELOP ING COUNTRIES 4 980 7 970 9 280 11 280 13 390 15
Latin America 640 1 870 3 240 4 740 6 620 8
Far East ',' 3 150 4 290 4 180 4 740 4 890 5
Near East 350 380 380 390 410
Africa ' 810 1 370 1 410 1 340 1 380 1
Other developing countries' 30 60 70 70 90
World 20 630 28 300 30 900 33 330 36 770 40
25 830 28 390 29 220 31 250 32 840
8 500 9 180 10 240 10 870 11 270 10 920
4 470 5 050 5 730 6 010 6 530 6 930
3 970 3 860 3 990 3 890 3 730 3 930
110 120 130 140 150 160
7 880 7 620 8 300 8 310 9 570 10 900
24 930
menhaden, which have been the mainstay of the reduc-tion industries. Limited progress so far along theselines and continuing in some cases even morestringent resources management controls make itunlikely, however, that raw material landings willincrease in the immediate future. A tendency toupgrade the utilization of scarce resources, suchas the Scandinavian herring, by diverting suppliesto human consumption, may further aggravate theraw material problems of fish-meal and oil industries.Last year, price increases for fish meal and oil blunt-ed to some extent the economic impact on the indus-try of short supplies. A continuation of recent pricetrends would, however, have serious market impli-cations for industries in those countries where reduc-tion products are in price competition with othercomponents of animal feed rations or of food prod-ucts. Substitution was already a significant phe-nomenon in 1969 in the United States, where feedcompounders took advantage of low soybean mealprices and substantially reduced their purchases offish meal.
A brighter outlook is justified for food fish pro-duction. Although here, too, increasing demand forsome high unit-value products in the face of growingsupply scarcity will tend to raise prices, so far thishas had no appreciable effect on demand, with theexception of some signs of consumer resistance inthe United States shrimp market late in 1969. Rec-ord supplies of northeast Pacific salmon predictedfor 1970, increasing market acceptance of haddockand plaice partly in substitution of northwestAtlantic cod and other food fish which are becomingmore scarce as well as the accelerated develop-ment of fisheries for home market consumption indeveloping countries, all should contribute towardsome expansion of food fish landings in 1970.
TABLE I-5. INDICES OF WORLD 1 ROUNDWOOD PRODUCTION
7
Forest products
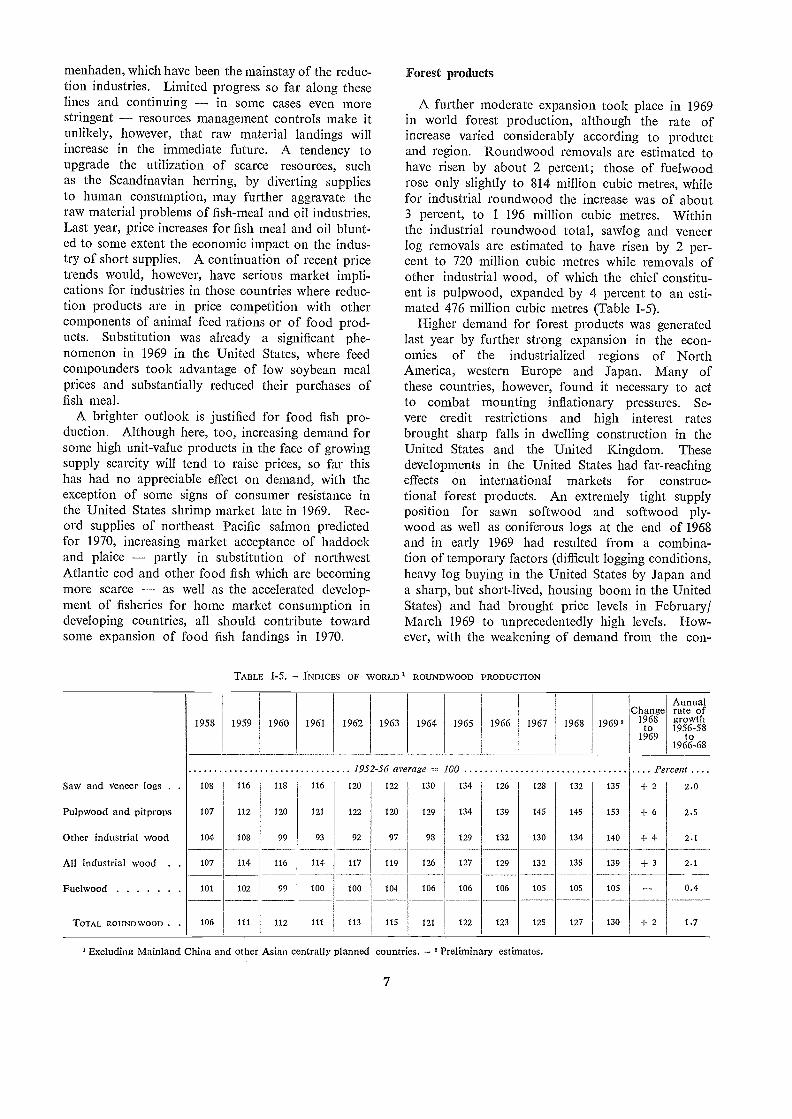
A further moderate expansion took place in 1969in world forest production, although the rate ofincrease varied considerably according to productand region. Roundwood removals are estimated tohave risen by about 2 percent; those of fuelwoodrose only slightly to 814 million cubic metres, whilefor industrial roundwood the increase was of about3 percent, to 1 196 million cubic metres. Withinthe industrial roundwood total, sawlog and veneerlog removals are estimated to have risen by 2 per-cent to 720 million cubic metres while removals ofother industrial wood, of which the chief constitu-ent is pulpwood, expanded by 4 percent to an esti-mated 476 million cubic metres (Table I-5).
Higher demand for forest products was generatedlast year by further strong expansion in the econ-omies of the indusirialized regions of NorthAmerica, western Europe and Japan. Many ofthese countries, however, found it necessary to actto combat mounting inflationary pressures. Se-vere credit restrictions and high interest ratesbrought sharp falls in dwelling construction in theUnited States and the United Kingdom. Thesedevelopments in the United States had far-reachingeffects on international markets for construc-tional forest products. An extremely tight supplyposition for sawn softwood and softwood ply-wood as well as coniferous logs at the end of 1968and in early 1969 liad resulted from a combina-tion of temporary factors (difficult logging conditions,heavy log buying in the United States by Japan anda sharp, but short-lived, housing boom in the UnitedStates) and liad brought price levels in February/March 1969 to unprecedentedly high levels. How-ever, with the weakening of demand from the con-
' Excluding Mainland China and other Asian centrally planned countries. Preliminary estimates.
ChangeAnnualrate of
1958 1959 1960 1961 1962 1963 1964 1965 1966 1967 1968 1969" 1968to
1969
growth1956-58
to1966-68
1952-56 average = 100 Pe cent ....
Sal,v and veneer logs . . 108 116 118 116 120 122 130 134 126 128 132 135 4- 2 2.0
Pulpwood and pitprops 107 112 120 121 122 120 129 134 139 145 145 153 4- 6 2.5
Other industrial wood 104 108 99 93 92 97 98 129 132 130 134 140 + 4 2.1
All industrial wood . . 107 114 116 114 117 119 126 127 129 132 135 139 + 3 2.1
Fuelwood 101 102 99 100 100 104 106 106 106 105 105 105 0.4
TOTAL ROUND WOOD . 106 111 112 111 113 115 121 122 123 125 127 130 + 2 1.7
struction sector for wood, from the spring onward,prices subsequently fell back sharply.
Although production of sawn softwood and ply-wood in North America remained more or less at 1968levels, world output of these products expanded mod-erately. In the case of sawn softwood, output ofwhich was in excess of 295 million cubic metres in1969, the increase was chiefly due to a 5 percent risein western Europe, where the previous trend forimports from other regions to gain an increasing shareof consumption has been reversed since 1965. Hard-wood plywood production rose strongly in the mainAsian producer countries and, largely as a result ofthis, world output of plywood (both softwood andhardwood) rose by 4.7 percent, to 31 million cubicmetres. North America accounted for a major partof the 4.6 percent increase to 87 million cubic metresin sawn hardwood production in 1969 (to refurnishstocks and to meet deman.d from the furniture andother industries), but southeast Asia and some LatinAmerican countries also expanded output substan-tially.
Europe accounted for a large part of the 16 percentgrowth in particle board production in 1969; onthe other hand, world output of fibreboard rose onlyslightly.
In the pulp and paper sector, the main feature in1969 was the increasingly tight supply position forchemical pulp. This was a rather sudden develop-ment, the turn-round from the previously oversup-plied market situation having occurred sooner thanhad been generally expected. With production ca-pacity almost fully utilized for a number of gradesduring much of 1969, chemical pulp output is esti-mated to have risen by 7.5 percent to 71.6 milliontons, and mechanical pulp at a similar rate to 24.7million tons. Production of paper and paperboardin 1969 is provisionally put at 117.7 million tons,or nearly 8 percent more than in 1968, with newsprintsharing fully in overall growth.
High-yieldbig cereal varieties
The slowdown in 1969 in the growth of the com-bined food production of the developing regions,about one third of which (in terms of value) consistsof cereals, and the failure of regions other than theFar East to accelerate significantly the growth oftheir food production in the past two years, raisesome questions regarding the high-yielding cerealvarieties on which so much hope is being placedfor a permanent improvement in the food situation ofthe developing countries. It is being asked whether,in the Far Eastern countries where the adoption ofthe high-yielding varieties has so far been rnost
8
rapid and widespread, some of the potential short-and long-term constraints on their use are beginningto influence the rate of progress; and whether countriesin other regions are making an effort to adopt thenew varieties at a rate commensurate with theirneeds and potential.
Regarding the first question, Chapter II showsthat the general slowing down of food productiongrowth in the Far East did not affect significantly thetwo major cereals which hitherto have benefited mostfrom the technological improvements associated withthe development of high-yielding varieties. As againstan overall increase of 4 percent in the region'stotal food production, the combined paddy cropof the region again expanded by 4 percent, and thatof wheat by 9 percent. The total was held backmainly by smaller increases in the output of livestockproducts and declines in the production of barleyand pulses. In many individual countries of theregion, moreover, substantially larger increases wereachieved in the production of rice and wheat, rang-ing from 6 to 13 percent for rice in Indonesia, Paki-stan and the Philippines to 13 percent for wheat inIndia and a 28 percent recovery of rice productionin the Republic of Korea. And if the 4 percent in-crease in wheat production in Pakistan appears rela-tively modest, this should be set against the excep-tionally large increase of over 40 percent achievedthe year before. Moreover, as in shown in TableII-32, in most major countries of the region thearea under high-yielding varieties of rice increasedin 1969, and a further expansion was in the offingfor 1970.
In the longer run, the principal limit to the use ofthe existing high-yielding cereal varieties is thearea under controlled irrigation, and the com-petition for it by other crops. Specific data on theshare of irrigated area allotted to high-yielding vari-eties of wheat and rice are not available. As shownin Table II-32, however, by 1969 only about 7 percentof the total rice area in the Far East was under suchvarieties, and in only one country the Philippines
was the figure very much higher than the average.For wheat, the corresponding figures in India andPakistan were 32 and 43 percent respectively, sug-gesting less room for further expansion.
Before too long, moreover, this constraint on theuse of high-yielding cereal varieties may be easedby new developments in plant breeding. Work isproceeding, both in the Far East and elsewhere, onthe development of new and improved high-responsevarieties suited to a wider range of natural conditions,including both rainfed or upland areas, and deepflooded monsoon areas for rice, and of varietieswhich mature quickly enough to make possibledouble cropping of rice under controlled irrigation incountries where today this is limited by the short
duration of the dry season. Promising progress inboth directions is already reported.
Moreover, in considering the prospects for thefurther adoption of high-yielding varieties of cerealsin various countries of the Far East and elsewhere,note should be taken of the different strategies thathave been followed by different countries in pursuitof higher yields and output of rice, depending onland/man ratios, the size structure of holdings,etc., and their effects on the possible future rate ofadoption of more advanced techniques. These arediscussed in Chapter II.
Finally, recent experience with regard to foodproduction in the Far East draws attention to twofactors of importance for the future. First, the con-tinued importance of weather is brought home bythe relative failure of yields and output of rice togrow rapidly in the Philippines in the last two years,even with fully one third of the total rice area underhigh-yielding varieties on irrigated land. Second, theimportance of increased research on crops which havenot benefited from the kind of effort put into devel-oping wheat and rice varieties particularly pulses,some coarse grains and oilseeds is emphasized bythe generally poorer recent performance of thesecrops than of rice and wheat in the Far East region.
As for the second question raised at the beginningof this section the extent and strength of the com-mitment to the raising of cereal yields and outputin regions other than the Far East it should bekept in mind that the strength of the factors callingfor intensification of cereal output varies widely fromcountry to country and region to region. The par-ticularly heavy stress given to this approach in theFar East is a rational response to a number of pres-sures affecting that region especially strongly, whilein much of Latin America and Africa the pressureof population on land is such as to lend less urgencyto the search for higher yields. And even where suchpressures do exist in both of the latter regionsthere are large pockets of heavy population pressureon land landownership and tenancy conditionsmay work against intensification of production.
The region where the pressures most resemble thosein the Far East is no doubt the Near East, with itsrapid population growth and limited availability ofarable land; and, next to the Far East, this is theregion where the greatest attention has been givento the new cereal varieties. Somewhat in analogywith Ceylon, China (Taiwan) and West Malaysiain the Far East, the United Arab Republic has forsome time based its programmes on a gradual improve-ment of local varieties, with the result that averagecereal yields in that country are in fact well abovethose in the rest of the region.
Although it is difficult to make exact quantitativecomparisons between the regions, it would appear
9
that, even if allowance is made for the later startof the efforts to spread high-yielding varieties in theNear East than in the Far East, the success in theformer region has so far been less. As stated inChapter II, the new varieties have so far failed tomake a decisive impact on the cereal output of theNear East. Although imports of cereals are animperfect indicator, because of the wide fluctuationsin output that are characteristic for the region, datafor the last several years show no ten.dency for therising trend to have levelled off, except in Turkeyand the United Arab Republic. And whereas inthe major wheat-producing countries of the FarEast India and Pakistan 30 to 40 percent ofthe total wheat area was under high-yielding varietiesby 1969, in the developing countries of the NearEast the share of such varieties ranges (except inthe United Arab Republic) from insignificant amountsto a maximum of 6 percent in Afghanistan and 10percent in Turkey.
The principal factors which appear to have beenresponsible for both the relatively slower spread ofthe high-yielding varieties in the Near East, and forthe fact that full advantage of their yield potential isnot enjoyed everywhere in the region, are discussedin Chapter II. They include an inadequate supplyof seeds and fertilizers, a shortage of wheat breeders(except in the United Arab Republic), defects in thedistribution mechanism for fertilizers, lack of suit-able varieties for rainfed areas, and lack of sufficientmechanization to permit timely land preparationand sowing operations, etc.
Whatever the detailed causes, experience in 1969would seem to stress once more the importance of astrong and consistent government commitment toefforts to raise yields and output by means of thenew technologies now available for developing coun-tries, if full advantage is to be taken of them. Thereward will be not only to raise the output of cereals,but also to provide a base for the creation of a gener-ally higher level of agricultural output and a morediversified pattern of production.
Surplus stocks
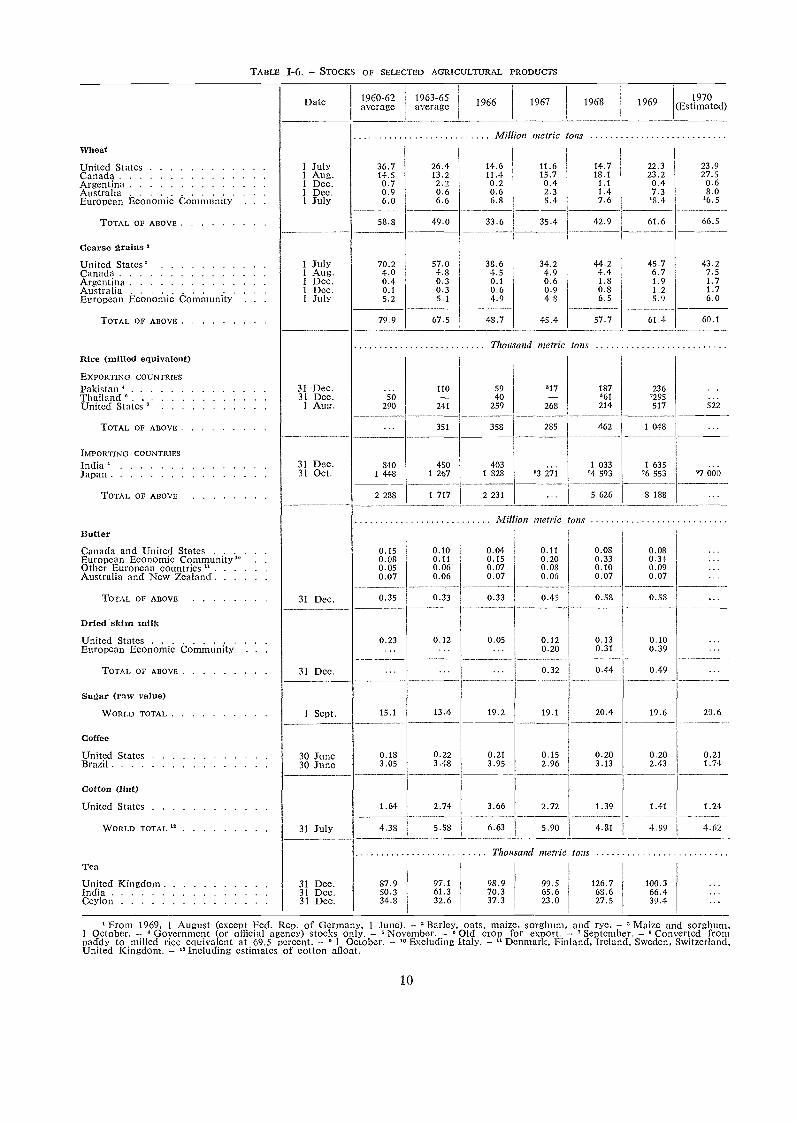
Attention was drawn in The state of food and agri-culture 1969 to the renewed tendency for surplusaccumulation of a number of farm products, particu-larly wheat, dairy products and rice, and to the factthat these surpluses are now geographically morewidespread than in earlier years, including countrieswith little experience and sometimes without anyof the administrative machinery necessary for supplymanagement.
As can be seen from Table 1-6, the situation hasnot shown any improvement in 1969 and 1970.
10
' From 1969, 1 August (except Fed. Rep. of Germany, 1 June). - 'Barley, oats, maize, sorghum, and I'ye. - a Maize and sorghum,1 October. - 4 Government (or official agency) stocks only. - 'November. - °Old crop for export. - ' September. - 6 Converted frompaddy to milled rice equivalent at 69.5 percent. - ° 1 October. - '0 Excluding Italy. - " Denmark, Finland, Ireland, Sweden, Switzerland,United Kingdom. - "Including estimates of cotton afloat.
TABLE I-6. - STOCKS OF SELECTED AGRICULTURAL PRODUCTS
Date 1960-62average
1963-65average 1966 1967 1968 1969 1970
(Estimated)
Mil/ion metric tonsWheat
United States 1 July 36.7 26.4 14.6 11.6 14.7 22.3 23.9Canada 1 Aug. 14.5 13.2 11.4 15.7 18.1 23.2 27.5Argentina 1 Dec. 0.7 2.2 0.2 0.4 1.1 0.4 0.6Australia 1 Dcc. 0.9 0.6 0.6 2.3 1.4 7.3 8.0European Economic Community . 1 July 6.0 6.6 6.8 5.4 7.6 '8.4 06.5
TOTAL OF ABOVE 58.8 49.0 33.6 35.4 42.9 61.6 66.5
Coarse grains a
United States' 1 July 70.2 57.0 38.6 34.2 44.2 45.7 43.2Canada 1 Aug. 4.0 4.8 4.5 4.9 4.4 6.7 7.5Argentina 1 Dec. 0.4 0.3 0.1 0.6 1.8 1.9 1.7Australia 1 I)ec. 0.1 0.3 0.6 0.9 0.8 1.2 1.7European Economic Co nrnunity . 1 July 5.2 5.1 4.9 48 6.5 59 6.0
TOTAL OF ABOVE 79.9 67.5 48.7 45.4 57.7 61.4 60.1
Thousand metric tonsRice (milled equivalent)
EXPORTING COUNTRIES
Pakistan 31 Dec. 110 59 517 187 236Thailand 31 Dec. 50 40 -- 561 0295United States 1 Aug. 290 241 259 268 214 517
TOTAL OF ABOVE 351 358 285 462 1 048
IMPORTING COUNTRIES
India 31 Dec. 840 450 403 1 033 1 635Japan 31 Oct. i 448 1 267 1 828 .3 .4 593 .6 553 07 66.0
TOTAL OF Al3OVE 2 283 1 717 2 231 5 626 8 183
Mil/ion metric tonsButter
Canada and United States 0.15 0.10 0.04 0.11 0.08 0.08European Economic Community" . . . 0.08 0.11 0.15 0.20 0.33 0.31Other European countries 0.05 0.06 0.07 0.08 0.10 0.09Australia and New Zealand 0.07 0.06 0.07 0.06 0.07 0.07
TOTAL OF ABOVE 31 Dec. I 0.35 0.33 0.33 0.45 0.58 0.58
Dried skim milk
United St.ites 0.23 0.12 0.05 0.12 0.13 0.10European Economic Community . . ... 0.20 0.31 0.39
TOTAL OF ABOVE 31 Dec. 0.32 0.44 0.49
Sugar (raw value)
WORLD TOTAL 1 Sept. 15.1 13.4 19.2 19.1 20.4 19.6 20.6
Coffee
United States 30 June 0.18 0.22 0.21 0.15 0.20 0.20 0.21Brazil 30 June 3.05 3.48 3.95 2.96 3.13 2.43 1.74
Cotton (lint)
United States 1.64 2.74 3.66 2.72 1.39 1.41 1.24
WORLD TOTAL '2 31 July 4.38 5.58 6.63 5.90 4.81 4.99 4.62
Thousand metric tonsTea
United Kingdom 31 Dec. 87.9 97.1 98.9 99.5 126.7 100.3India 31 Dec. 50.3 61.3 70.3 65.6 68.6 66.4Ceylon 31 Dec. 34.8 32.6 37.3 23.0 27.5 39.4
Substantial further increases (though smaller thanthe year before) were expected in 1969/70 in stocksof wheat, and there was a very large expansion instocks of rice in 1969. The growth of butter stockswas halted, but the stocks of skim milk powderonce more increased.
To some extent the increase in rice stocks is a posi-tive development, since carryovers in some majordeveloping importing countries had been reduced toextremely low levels during recent years of scarcity.Of concern, however, are increases in stocks in thedeveloped countries, particularly in the United Statesand Japan, which have led to larger shipments onconcessional terms (now accounting for 20 percentof world trade in rice), and the fact that theseshipments, and the increase in the subsidizationof exports (from EEC, the United States and Spain)have taken place against a background of fallingrice prices and reduced import demand in severaldeveloping countries, a trend which is expected tocontinue.
Total wheat stocks in exporting countries were ex-pected by the end of the 1969/70 season to reach theall-time record level of over 66 million tons, of whichprobably one half can be considered surplus to nor-mal requirements. The tendency for these stocks toaccumulate increasingly outside the United States,which was stressed in The state of food and agri-culture 1969 continued, and more than half of thetotal end-of-season stocks will probably be heldby Canada and Australia. Stocks in the Euro-pean Economic Com.munity (EEc) were expected todecline slightly, and those of Argentina to remainsmall.
Various measures have been taken in the producingcountries to reduce surpluses, or slow down theirgrowth. In western Europe, these measures havelargely taken the form of incerttives to increase con-sumption of the products affected, mainly wheatand dairy products. To a lesser extent they have alsobeen aimed at reducing output. Subsidized exportsalso increased (EEc was in 1969 the second largestbutter exporter in the world after New Zealan.d),thus contributing to a continued tension in worldmarkets, not only for wheat and butter but alsorice. Together with reduced output in the case ofmilk, measures of this type helped to stop the growthof butter stocks and to reduce those of wheat inwestern Europe in 1969. Most of the drop in milkoutput, however, is thought to have been due tounfavourable weather. With increased milk pricesto producers in a number of countries and the returnof better weather, milk production in western Europewas, in fact, expected to show a slight recovery in1970.
The measures taken in the traditional exportingcountries have, of necessity, been aimed more directly
11
at output itself, generally taking the form of acreagerestrictions and price regulations. These countrieshave not failed to point out that so far they havecarried the main burden of adjusting supply to de-mand. While generally expressing sympathy withthe goal of many developing countries to improvetheir self-sufficiency in basic foods, they have ex-pressed their disappointment at the hitherto limitedcontribution that developed importing countries havemade toward a better market balance. They llavetherefore continued to call for greater efforts to-ward achieving a degree of harmonization betweennational agricultural production policies in the future,particularly among the industrialized countrieswhich depend much less than the developing coun-tries on agricultural production for national incomeand export earnings, and can far more readilyafford to make the necessary adjustments in theireconomies.
Structural policies in developed countries
it is in the light of this need that particular impor-tance is assumed by the various discussions nowunder way or about to be launched, for examplein the General Agreement on Tariffs and Trade(GATT) with regard to dairy production, in theInternational Wheat Coun.cil on the reconsiderationof the international arrangements for grains and inthe FAO Group on Rice regarding international actionon that commodity. But, if such actions are toprovide more than a temporary solution, there willhave to be a greater readiness than hitherto demon-strated by the developed countries to implement struc-tural policies which not only speed up the alreadyfairly rapid transfer of marginal farmers out ofagriculture, but also bring about a sufficient shift ofother resources away from the sector, and a moreextensive use of land remaining in agriculture. Onlythus will it be possible to ensure that the gains inoutput per man remaining in agriculture (whichresult both from continued technological improve-ment as such and from government measures tomodernize farming) will not lead to further rapidincreases in output of products which are alreadyin surplus, or for which demand is only growingslowly.
Not that structural policies are new. They arein the arsenal of every developed country in the worldtoday, and the most recent developments in this fieldare discussed in Chapter II. Their very existenceis evidence of a move toward the acceptance on apolitical level of changes in policy emphasis thathave long been advocated, and some of the mostrecent plans submitted to governments contain ele-ments far more radical than were considered politically
feasible only a few years ago.5 At the same time,there appears to be little in the policy measures cur-rently implemented to suggest that any serious moveis being made toward a reduction of the productivebase of agriculture in those developed importingcountries which today are plagued by a tendency toproduce surpluses. On the contrary, many structuralpolicy measures have been aimed at improving theconditions of production., through provision of im-proved infrastructure, and this has tended to boostoutput. The recently introduced premiums for slaugh-tering dairy cows in a number of European coun-tries affects only a small percent of the total number,and as culling will take place selectively to elimi-nate the lowest yielding animals, the average pro-ductivity per cow will rise. Withdrawal of arableland from cultivation is included among the policymeasures of only very few importing countries andonly a relatively small portion of the total, much ofit consisting of marginal land, is likely to be affected.
The obstacles to structural shifts of a radical natureare well known. In fact, evidence shows that, exceptwhere the pull of other opportunities for resourceuse (particularly labour) is exceptionally strong,they have hitherto been implemented in a decisivemanner only where external forces compel a countryto do so. In practice, this usually means that mostof the adjustment is made by exporters, and the re-cent measures taken in developed cereal-exportingcountries bear eloquent testimony to this.
Nor is the current phase of developments in worldagriculture particularly favourable for major deci-sions in this field. The possible enlargement ofEEC and the still very different agricultural policiesfollowed by the present and some major potentialnew members necessarily make for uncertainty asregards immediate policy developments. The possi-bility, in particular cases the probability, of somedeveloping countries emerging as potential cerealexporters, and more generally the likely shifts incomparative advantage of cereal production result-ing from the technological breakthrough associatedwith the high-yielding varieties in developing coun-tries are other factors contributing to the uncer-tainty. A further element is the lack of clarity asregards the strength of the current protectionistmood in the United States.
Since the continuous technological improvemen.tsin food production are likely to maintain, at leastin the medium term, the present tendency for theproduction of many commodities to grow faster thanthe demand for them, the international policy prob-lem narrows essentially to that of how the burden
s Thus a key recommendation of the Vedel report. requestedby the French Minister of Agriculture in 1967, is the reduction inthe total cultivated area in France by up to one third by 1985.The report was published early this year, but the Governmenthas so far not indicated official approval of its contents.
12
of adjusting output to demand should be sharedbetween countries.
The obvious categories for burden sharing includesuch broad groupings as exporters versus importers,efficient versus high-cost producers, and developingversus developed countries. Some of these haveundisputable merits as criteria for instance, forthe developed countries to deny obligation to assumea greater burden of adjustment than developingcountries would be in conflict with the obligation forinternational development assistance that they havealready taken on. For more realistic policy talks,however, it would appear necessary to take accountof a more detailed set of circumstances affectingeach country's ability to make adjustments. Asidefrom the varying political strengths of the sectorsinvolved in different countries, these include in par-ticular the current size and various structural fea-tures of the agricultural sector, and various dynamicaspects of the countries' economic growth, includingthe relative and absolute growth and labour ab-sorptive capacity of the nonagricultural sectors. Aconcrete illustration of both the current limits ofthe latter and of the importance of free labour mar-kets as a short-term safety valve to ease structuraladjustment is the large-scale temporary emigration ofrural manpower from Italy to Switzerland and theFederal Republic of Germany, or from Finland toSweden. Other factors that need to be taken intoaccount in the short term include the balance ofpayments situation of the various countries, theiradministrative ability to influence the level of supply,and their proved commitment to supply food aidfor developing countries.
In the long run, the adjustment will no doubt bemade. The process is probably being accelerated bythe rapidly increasing cost of present methods offarm support, either to the treasury or to the con-sumers, and by the steady diminution of the farmvote as a political factor. In the short and mediumterm, however, the problem remains acute. Signs ofa continued, even intensified search for solutions areto be found, for instance, in the forthcoming consid-eration by the FAO Committee on Commodity Prob-lems of the role of FAO in more general approachesto international adjustment, and in the opening ofthe next round of trade negotiations in GATT, an-nounced for 1971 and covering both tariff and non-tariff measures including agricultural price supportpolicies. Studies that should facilitate governmentsin formulating their policies include that by FAOand the United Nations Economic Commission forEurope on agricultural adjustment policy in develop-ed countries, scheduled to be presented to the six-teenth session of the FAO Conference in 1971, andthe integrated study of the economic and technicalproblems of the meat and milk sector of European
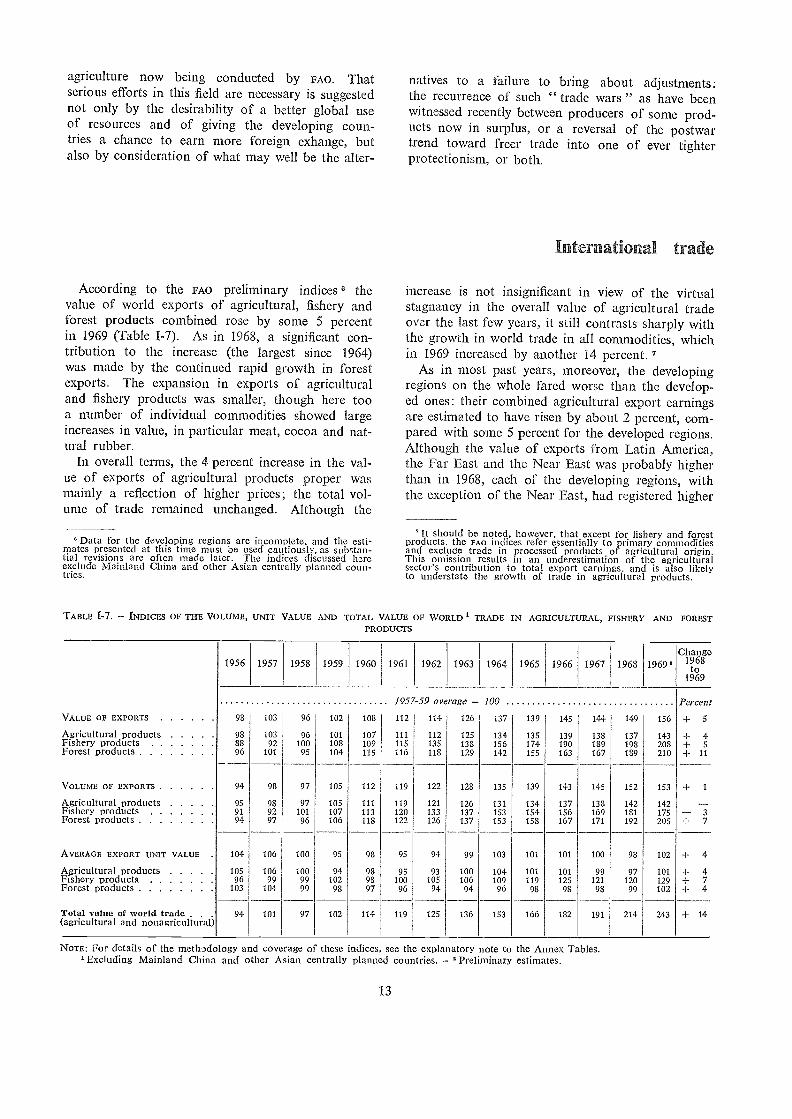
agriculture now being conducted by FAO. Thatserious efforts in this field are necessary is suggestednot only by the desirability of a better global useof resources and of giving the developing coun-tries a chance to earn more foreign exhange, butalso by consideration of what may well be the alter-
According to the FAO preliminary indices 6 thevalue of world exports of agricultural, fishery andforest products combined rose by some 5 percentin 1969 (Table 1-7). As in 1968, a significant con-tribution to the increase (the largest since 1964)was made by the continued rapid growth in forestexports. The expansion in exports of agriculturaland fishery products was smaller, though here tooa number of individual commodities showed largeincreases in value, in particular meat, cocoa and nat-ural rubber.
In overall tent's, the 4 percent increase in the val-ue of exports of agricultural products proper wasmainly a reflection of higher prices; the total vol-ume of trade remained unchanged. Although the
°Data for the developing regions are incomplete, and the esti-mates presented at this time must be used cautiously, as substan-tial revisions are often made later. The indices discussed hereexclude Nlainland China and other Asian centrally planned coun-tries.
TABLE 1-7. - INDICES OF THE VOLUME, UNIT VALUE AND TOTAL VALUE OF WORLD 1 TRADE IN AGRICULTLTRAL, FISHERY AND FORESTPRODUCTS
(agricultural and nonagricultural)
13
natives to a failure to bring about Etdjustments:the recurrence of such " trade wars " as have beenwitnessed recently between producers of some prod-ucts now in surplus, or a reversal of the postwartrend toward freer trade into one of ever tighterprotectionism, or both.
increase is not insignificant in view of the virtualstagnancy in the overall value of agricultural tradeover the last few years, it still contrasts sharply withthe growth in world trade in all commodities, whichin 1969 increased by another 14 percent. 7
As in most past years, moreover, the developingregions on the whole fared worse than the develop-ed ones: their combined agricultural export earningsare estimated to have risen by about 2 percent, com-pared with some 5 percent for the developed regions.Although the value of exports from Latin America,the Far East and the Near East was probably higherthan in 1968, each of the developing regions, withthe exception of the Near East, liad registered higher
'It should be noted, however, that except for fishery and forestproducts, the FAO indices refer essentially to primary commoditiesand exclude trade in processed products of agricultural origin.Tisis omission results in an underestimation of the agriculturalsector's contribution to total export earnings, and is also likelyto understate the growth of trade in agricultural products.
Ir2E-tAonal trade
NOTE: For details of the metIodology and coverage of these indices see the explanatory note to the Annex Tables.Excluding Mainland China and other Asian centrally planned countries. 'Preliminary estimates.
Change1956 1957 1958 1959 1960 1961 1962 1963 1964 1965 1966 1967 1968 1969° 1968
to1969
1957-59 average 100 Percent
VALUE OF EXPORTS 98 103 96 102 108 112 114 126 I 137 139 145 144 149 156 + 5
Agricultural products 98 103 96 101 107 111 112 125 134 135 139 138 137 143 -I- 4Fishery products 88 92 100 108 109 115 135 138 156 174 190 189 198 208 -I- 5Forest products 96 101 95 104 115 116 118 129 142 155 163 167 189 210 + 11
VOLUME OF EXPORTS 94 98 97 105 112 119 122 128 135 139 143 145 152 153 + 1
Agricultural products 95 98 97 105 111 119 121 126 131 134 137 138 142 142Fishery products 91 92 101 107 113 120 133 137 153 154 156 169 181 175 3Forest products 94 97 96 106 113 122 126 137 153 158 167 171 192 205 + 7
AVERAGE EXPORT UNIT VALUE 104 106 100 95 98 95 94 99 103 101 101 100 98 102 + 4
Agricultural products 105 106 100 94 98 95 93 100 104 101 101 99 97 101 + 4Fishery products 96 99 99 102 98 100 105 106 109 119 125 121 120 129 + 7Forest products 103 104 99 98 97 96 94 94 96 98 98 98 99 102 + 4
Total value a world trade 94 101 97 102 114 119 125 136 153 166 182 191 214 243 + 14
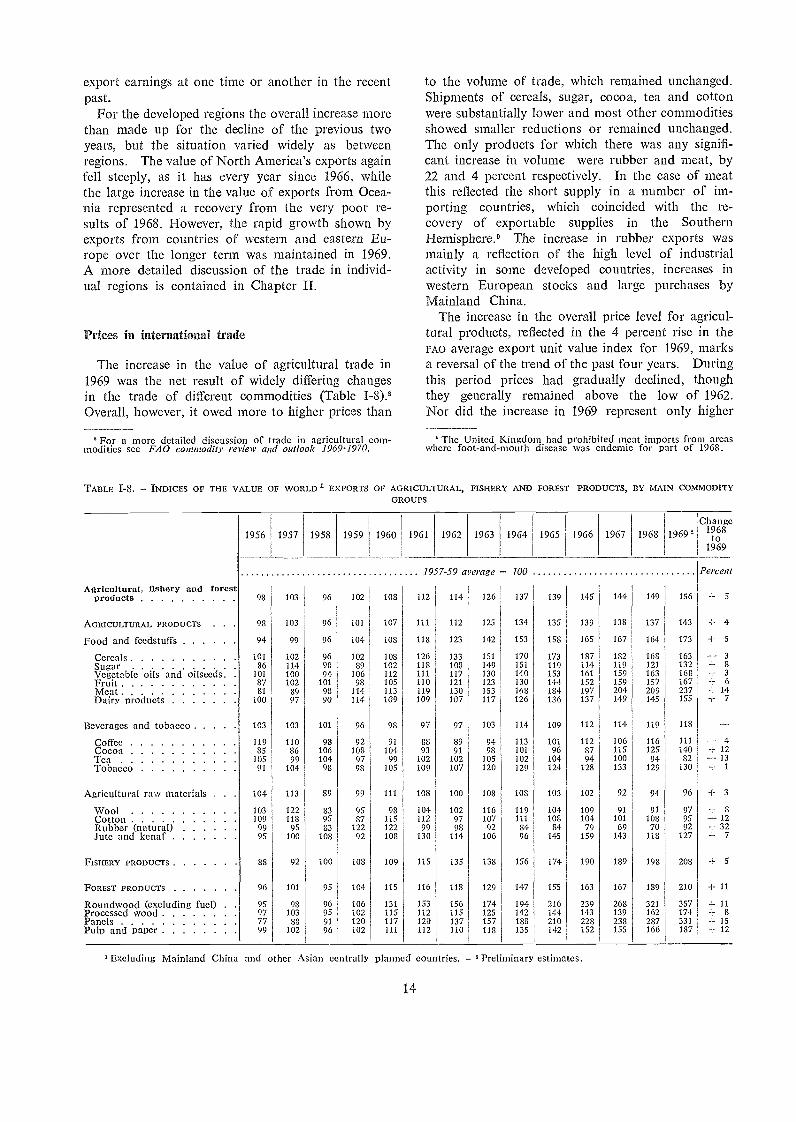
export earnings at one time or another in the recentpast.
For the developed regions the overall increase morethan made up for the decline of the previous twoyears, but the situation varied widely as betweenregions. The value of North America's exports againfell steeply, as it has every year since 1966, whilethe large increase in the value of exports from Ocea-nia represented a recovery from the very poor re-sults of 1968. However, the rapid growth shown byexports from countries of western and eastern Eu-rope over the longer term was maintained in 1969.A more detailed discussion of the trade in individ-ual regions is contained in Chapter II.
Prices in international trade
The increase in the value of agricultural trade in1969 was the net result of widely differing changesin the trade of different commodities (Table I-8).8Overall, however, it owed more to higher prices than
For a more detailed discussion of trade in agricultural com-modities see FAO commodity review and outlook 1969-1970.
14
to the voltnne of trade, which remained unchanged.Shipments of cerea.ls, sugar, cocoa, tea and cottonwere substantially lower and most other commoditiesshowed smaller reductions or remained unchanged.The only products for which there was any signifi-cant increase in volume were rubber and meat, by22 and 4 percent respectively. In the case of meatthis reflected the short supply in a number of im-porting countries, which coincided with the re-covery of exportable supplies in the SouthernHemisphere.' The increase in rubber exports wasmainly a reflection of the high level of industrialactivity in some developed countries, increases inwestern European stocks and large purchases byMainland China.
The increase in the overall price level for agricul-tural products, reflected in the 4 percent rise in theFAO average export unit value index for 1969, marksa reversal of the trend of the past four years. Duringthis period prices liad gradually declined, thoughthey generally remained above the low of 1962.Nor did the increase in. 1969 represent only higher
°The United Kingdom liad prohibited meat imports from areaswhere foot-and-mouth disease was endemic for part of 1968.
' Excluding Mainland China and other Asian centrally planned countries. - ,PreFininary estimates.
TABLE 1-8. - INDICES OF THE VALUE OF WORLD EXPORTS OF AGRICULTURAL, FISHERY AND FOREST PRODUCTS, BY MAIN COMMODITYGROUPS
1956 1957 1958 1959 1960 1961 1962 1963 1964 1965 1966 1967 1968 1969'Change
1968to
1969
1957-59 average - 100 Percent
Agricultural, fishery and forestproducts 98 103 96 102 108 112 114 126 137 139 145 144 149 156 -F 5
AGRICULTURAL PRODUCTS 98 103 96 101 107 111 112 125 134 135 139 138 137 143 + 4Food and feedstuffs 94 99 96 104 108 118 123 142 153 158 165 167 164 173 + 5
Cereals 101 102 96 102 103 126 133 151 170 173 187 182 168 163 3
Sugar 86 114 89 102 113 108 149 151 119 114 119 121 132 +8Vegetable oils and oilseeds 101 100 94 106 112 111 117 130 140 153 161 159 163 168 -F 3
Fruit 87 102 101 98 105 110 121 123 130 144 152 159 157 167 -I- 6
Meat 31 89 98 114 113 119 130 153 168 184 197 204 209 237 + 14Dairy products 100 97 90 114 109 109 107 117 126 136 137 149 145 155 +7
Beverages and tobacco 103 103 101 96 98 97 97 103 114 109 112 114 119 118
Coffee 119 110 98 92 91 88 89 94 113 101 112 106 116 111 4Cocoa 85 86 106 108 104 93 91 98 101 96 87 115 125 140 -I- 12Tea 105 99 104 97 99 102 102 105 102 104 94 100 94 82 13
Tobacco 91 104 98 98 105 109 107 120 129 124 128 133 129 130 -I- 1
Agricultural raw materials . . 104 113 89 99 111 108 100 108 108 103 102 92 94 96 + 3Wool 103 122 83 95 98 104 102 116 119 104 109 91 91 97 -I- 8Cotton 109 118 95 87 115 112 97 107 111 108 104 101 108 95 12Rubber (natural) 99 95 83 122 122 99 98 92 84 84 79 69 70 92 + 32Jute and kcnaf 95 100 108 92 108 130 114 106 96 145 159 143 118 127 +7
FISHERY PRODUCTS 88 92 100 108 109 115 135 138 156 174 190 189 198 208 + 5
FOREST PRODUCTS 96 101 95 104 115 116 118 129 147 155 163 167 189 210 +11
Roundwood (excluding fuel) . . 95 98 96 106 131 153 156 174 194 216 239 268 321 357 + 11Processed wood 97 103 95 102 115 112 115 125 142 144 143 139 162 174 -I- 8Panels 77 88 91 120 117 120 137 157 188 210 228 238 287 331 -I- 15Pulp and paper 99 102 96 102 111 112 110 118 135 142 152 155 166 187 + 12
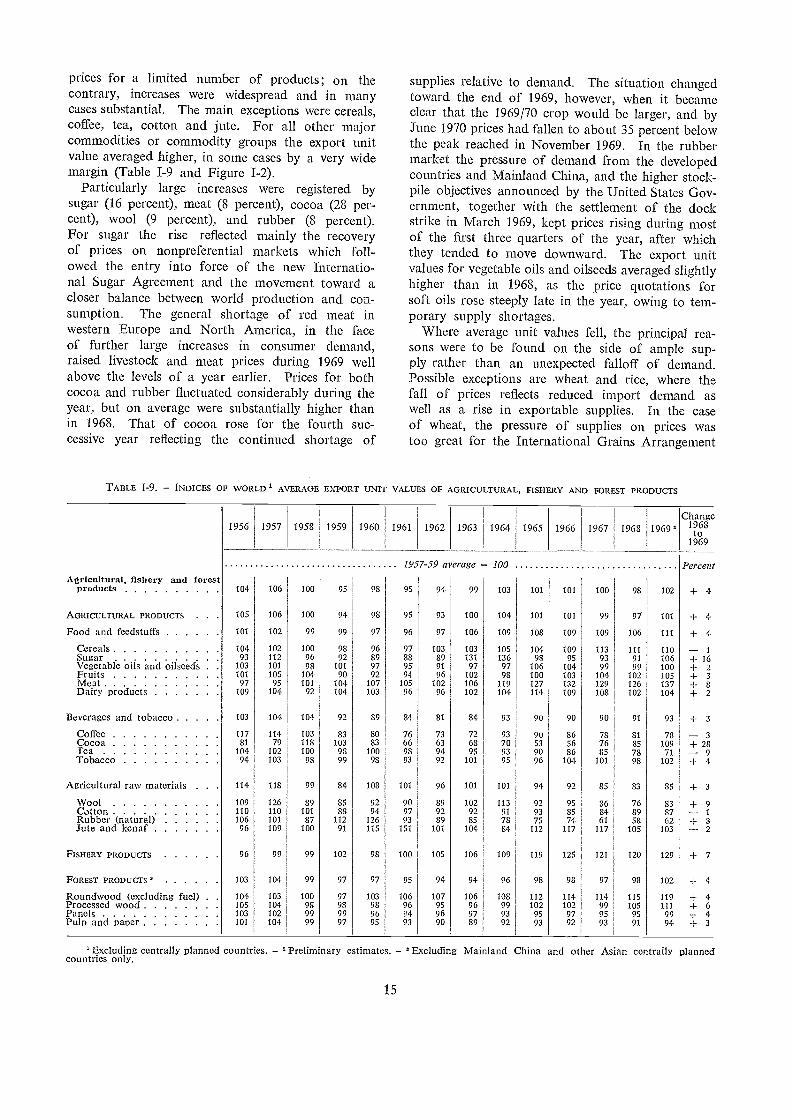
prices for a limited number of products; on thecontrary, increases were widespread and in manycases substantial. The main exceptions were cereals,coffee, tea, cotton and jute. For all other majorcommodities or commodity groups the export unitvalue averaged higher, in some cases by a very widernargin (Table 1-9 and Figure I-2).
Particularly large increases were registered bysugar (16 percent), meat (8 percent), cocoa (28 per-cent), wool (9 percent), and rubber (8 percent).For sugar the rise reflected mainly the recoveryof prices on nonpreferential markets which foll-owed the entry into force of the new Internatio-nal Sugar Agreement and the movement toward acloser balance between world production and con-sumption. The general shortage of red meat inwestern Europe and North America, in the faceof further large increases in consumer demand,raised livestock and meat prices during 1969 wellabove the levels of a year earlier. Prices for bothcocoa and rubber fluctuated considerably during theyear, but on average were substantially higher thanin 1968. That of cocoa rose for the fourth suc-cessive year reflecting the continued shortage of
TABLE I-9. - INDICES OF WORLD I AVERAGE EXPORT UNIT VALUES OF AGRICULTURAL, FISHERY AND FOREST PRODUCTS
15
supplies relative to demand. The situation changedtoward the end of 1969, however, when it becameclear that the 1969/70 crop would be larger, and byJune 1970 prices had fallen to about 35 percent belowthe peak reached in November 1969. In the rubbermarket the pressure of demand from the developedcountries and Mainland China, and the higher stock-pile objectives announced by the United States Gov-ernment, together with the settlement of the dockstrike in March 1969, kept prices rising during mostof the first three quarters of the year, after whichthey tended to move downward. The export unitvalues for vegetable oils and oilseeds averaged slightlyhigher than in 1968, as the price quotations forsoft oils rose steeply late in the year, owing to tem-porary supply shortages.
Where average unit values fell, the principal rea-50115 were to be found on the side of ample sup-ply rather than an unexpected falloff of demand.Possible exceptions are wheat and rice, where thefall of prices reflects reduced import demand aswell as a rise in exportable supplies. In the caseof wheat, the pressure of supplies on prices wastoo great for the International Grains Arrangement
Excluding centrally planned countr'es. - 'Preliminary estimates. - 'Excluding Mainland China and other Asian centrally plannedcountries only.
1956 1957 1958 1959 1960 1961 1962 1963 1964 1965 1966 1967 1968 1969'Chango
1968to
1969
1957-59 average = 100 PercentAgricultural, fishery and forest
products 104 106 100 95 93 95 94 99 103 101 101 100 93 102 + 4
AGRICULTURAL PRODUCTS . . 105 106 100 94 98 95 93 100 104 101 101 99 97 101 +4Food and feedstuffs 101 102 99 99 97 96 97 106 109 108 109 109 106 111 +4
Cereals 104 102 100 93 96 97 103 103 105 104 109 113 111 110 1Sugar 93 112 96 92 89 88 89 131 136 98 95 93 91 106 -1- 16Vegetable oils and oilseeds . 103 101 98 101 97 95 91 97 97 106 104 99 99 100 +2Fruits 101 105 104 90 92 94 96 102 98 100 103 104 102 105 +3Meat 97 95 101 104 107 105 102 106 119 127 132 129 126 137 +8Dairy products 109 104 92 104 103 96 96 102 104 114 109 108 102 104 -I- 2
Beverages and tobacco 103 104 104 92 89 84 81 84 93 90 90 90 91 93 -I- 3
Coffee 117 114 103 83 80 76 73 72 93 90 86 78 81 78 3Cocoa 81 79 118 103 83 66 63 68 70 53 56 76 85 109 -I- 28Tea 104 102 100 98 100 98 94 95 93 90 86 85 78 71 9Tobacco 94 103 98 99 98 93 92 101 95 96 104 101 98 102 +4
Agricultural raw materials . . 114 118 99 84 108 101 96 101 101 94 92 85 83 85 +3Wool 109 126 89 85 92 90 89 102 113 92 95 86 76 83 +9Cotton 110 110 101 88 94 97 92 92 91 93 85 84 89 87 1Rubber (natural) 106 101 112 126 93 89 85 78 75 74 61 58 62 -I- 8Jute and kenaf 96 109 100 91 115 151 101 104 84 112 117 117 105 103 2
FISHERY PRODUCTS 96 99 99 102 98 100 105 106 109 119 125 121 120 129 +7FOREST PRODUCTS 3 103 104 99 97 97 95 94 94 96 98 93 97 98 102 +4Roundwood (excluding fuel) 104 103 100 97 103 106 107 106 108 112 114 114 115 119 +4Processed wood 105 104 98 98 98 96 95 96 99 102 102 99 105 111 +6Panels 103 102 99 99 96 94 96 97 93 95 97 95 95 99 +4Pulp and paper 101 104 99 97 95 93 90 89 92 93 92 93 91 94 -I- 3
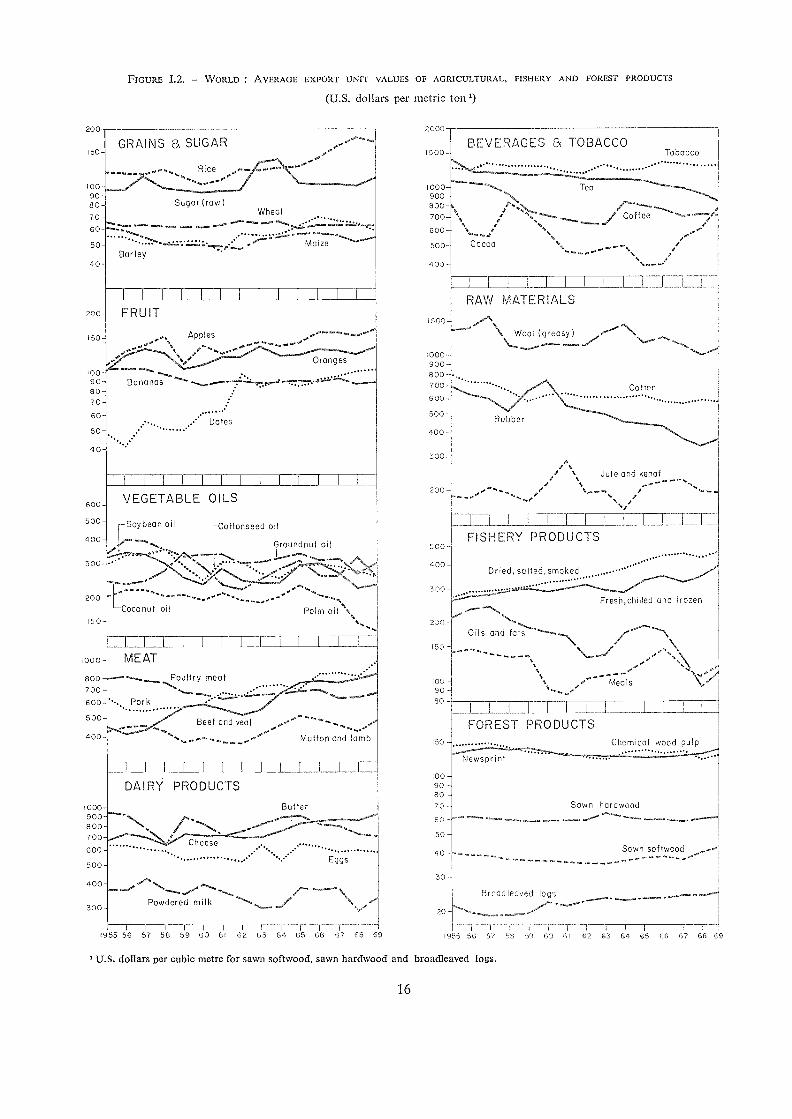
200
10090 -8 0 -
1 0
Sugar (raw).......
0.4,4 , .......purnr.o.. ommato mwee,
.......... wow........ Maize
Barley
FRUIT
Apples
MI= IMMII
MEAT
Poultry meat ........"*.. Pork
................Beef and veal
DAIRY PRODUCTS
Butter
' Ch se.......... ................................
Wheat
*a.
Cottonseed oil
Oranges......... .
Bananas .
Groundnut oil
"""'"'"
--Coconut oil Palm all \15 0
=MN ==.............
Mutton and lamb
7 0 -
GO
50 -
4 0 -
200-
10090 -8 0 -7 0 -
200
1000900800700GOO
FIGURE 1.2. - WORLD : AVERAGE EXPORT UNIT VALUES OF AGRICULTURAI,, FISHERY AND FOREST PRODUCTS
(U.S. dollars per metric ton
GRAINS 8, SUGAR
Rice
" ....... .......... ... Eggs
IIIIJ11111955 56 57 58 59 Co 61 62 03 64 65 66 67 66 69
U.S. dollars per cubic metre for sawn softwood, sawn hardwood and broadleaved logs.
16
1 1
1955 56 57 58 59 69 Cl 62 63 64 65 66 67 68 69
BEVERAGES 8, TOBACCOTobacco
.....,. . . ............ ...,,, ..... ..... ..... ....°. ...... ."" .....,Tea
/''''''''''''''a ../ Coffee -
,,,,,....../ .. ..."t. /,''Cocoa a`"-"'"'s i
S. e....,....../llJ jRAVV MATERIALS
. .
Wool (greasy)\ ,-. ------
'° .........., ,, Cotton,. ....
'
Rubber
Ae ,.,/
%.,Jute and kenaf
oo'''' ' am-''''....,.... ....
a Xa
T I
FISHERY PRODUCTS
.... ................. .-Dried, sa lted, smoked....... . ' ...
....... ..... , . *". :*Fresh,chilled and frozen
Oils and fats ---,,,,,,
---......,....... \-- ---1" °/'''..:,\aNe/-- -M-e-a'Is
iIIiJ I L I Li.FOREST PRODUCTS
C. ........ . ...... ...,, ..::. hemical woodpulp..r...
Newsprint ,,,,,..,--....:,:::::::::::.:::::::.. .....
Sawn hardwood-
.---- ----''''''''''----...-.---
Sawn softwood
Brood leaved logs°
.... e60 -
50 -,e Dates
40 -
MI600 - VEGETABLE OILS
500
400 '"300 Powdered milk
5 00 - -Soybean oil
4 00 -
300 -
2000
1500-
1000900800700
GOO
500
400
1500
1000900800700600
500
400
300
200-
500 -
400
300
200
150
70 -
60 -
50
40
30 -
20
1000 -
800700600
500
400 -
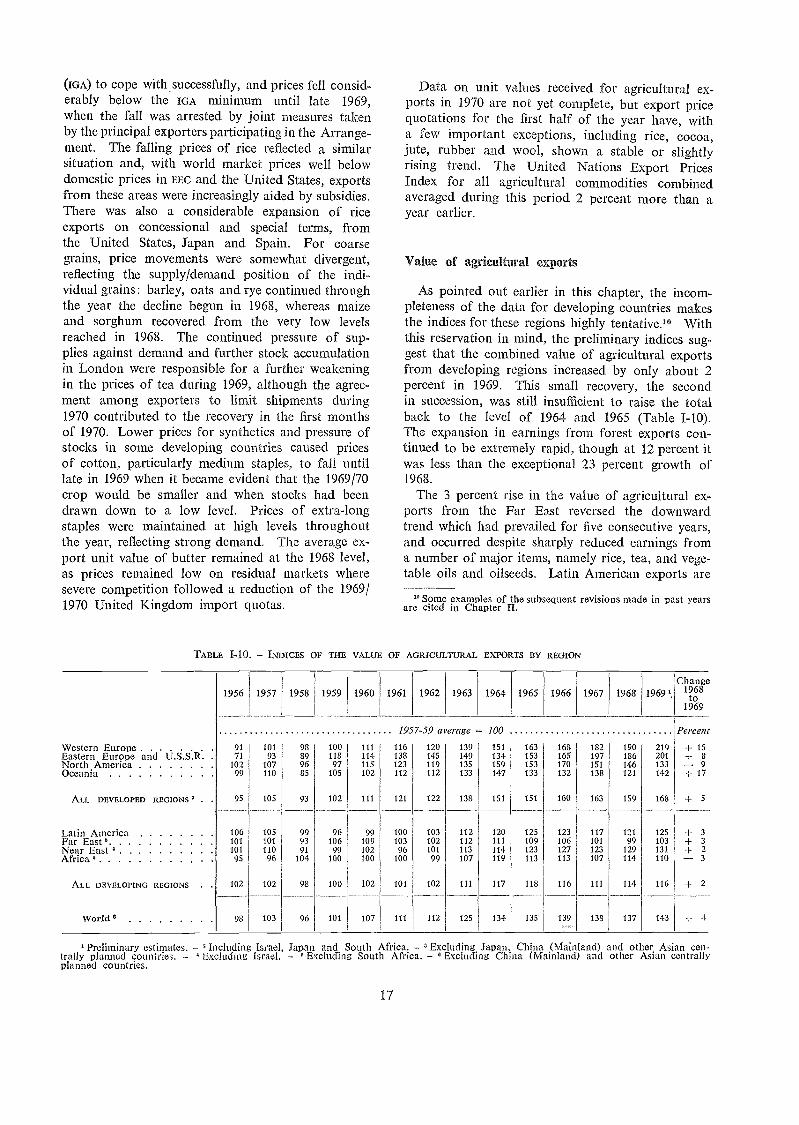
(IGA) to cope with 'successfully, and prices fell consid-erably below the IGA minimum until late 1969,when the fall was arrested by joint measures takenby the principal exporters participating in the Arrange-ment. The falling prices of rice reflected a similarsituation an.d, with world market prices well belowdomestic prices in EEC and the United States, exportsfrom these areas were increasingly aided by subsidies.There was also a considerable expansion of riceexports on concessional and special terms, fromthe United States, Japan and Spain. For coarsegrains, price movements were somewhat divergent,reflecting the supply/demand position of the indi-vidual grains: barley, oats and rye continued throughthe year the decline begun in 1968, whereas maizeand sorghum recovered from the very low levelsreached in 1968. The continued pressure of sup-plies against demand and further stock accumulationin London were responsible for a further weakeningin the prices of tea during 1969, although the agree-ment among exporters to limit shipments during1970 contributed to the recovery in the first monthsof 1970. Lower prices for synthetics and pressure ofstocks in some developing countries caused pricesof cotton, particularly medium staples, to fall untillate in 1969 when it became evident that the 1969/70crop would be smaller and when stocks had beendrawn down to a low level. Prices of extra-longstaples were maintained at high levels throughoutthe year, reflecting strong demand. The average ex-port unit value of butter remained at the 1968 level,as prices remained low on residual markets wheresevere competition followed a reduction of the 1969/1970 United Kingdom hnport quotas.
TABLE - INDICES OF THE VALUE OF AGRICULTURAL EXPORTS BY REGION
Preliminary estiinates. Including Israel, Japan and South Africa. Excluding Japan, China (Mainland) and other Asian cen-trally planned countries. Excluding Israel. 5 Excluding South Africa. Excluding China (Mainland) and other Asian centrallyplanned countries.
17
Data on unit values received for agricultural ex-ports in 1970 are not yet complete, but export pricequotations for the first half of the year have, witha few important exceptions, including rice, cocoa,jute, rubber and wool, shown a stable or slightlyrising trend. The United Nations Export PricesIndex for all agricultural commodities combinedaveraged during this period 2 percent more than ayear earlier.
Value of agricultural exports
As pointed out earlier in this chapter, the incom-pleteness of the data for developing countries makesthe indices for these regions highly tentative." Withthis reservation in mind, the preliminary indices sug-gest that the combined value of agricultural exportsfrom developing regions increased by only about 2percent in 1969. This small recovery, the secondin succession, was still insufficient to raise the totalback to the level of 1964 and 1965 (Table I-10).The expansion in earnings from forest exports con-tinued to be extremely rapid, though at 12 percent itwas less than the exceptional 23 percent growth or1968.
The 3 percent rise in the value of agricultural ex-ports from the Far East reversed the downwardtrend which liad prevailed for five consecutive years,and occurred despite sharply reduced earnings froma number of major items, namely rice, tea, and vege-table oils and oilseeds. Latin American exports are
"Some examples of the subsequent revisions made in past yearsare cited in Chapter II.
Change1956 1957 1958 1959 1960 1961 1962 1963 1964 1965 1966 1967 1968 1969', 1968
to1969
1957-59 average 100 Percent
Western Europe ..... . . 91 101 93 100 111 116 120 139 151 163 168 182 190 219 + 15Eastern Europe and U.S.S.R. . 71 93 89 118 114 138 145 149 134 153 165 197 186 201 -I- 8North America 102 107 96 97 115 123 119 135 159 153 170 151 146 133 9Oceania 99 110 85 105 102 112 112 133 147 133 132 138 121 142 + 17
ALL DEVELOPED REGIONS . 95 105 93 102 111 121 122 138 151 151 160 163 159 168 +5
Latin America 106 105 99 96 99 100 103 112 120 125 123 117 121 125 +3Far East 101 101 93 106 109 103 102 112 111 109 106 101 99 103 + 3Near East 101 110 91 99 102 96 101 113 114 123 127 123 129 131 + 2Africa 95 96 104 100 100 100 99 107 119 113 113 107 114 110 3
ALL DEVELOPING REGIONS . . 102 102 98 100 102 101 102 111 117 118 116 111 114 116 +2
World 98 103 96 101 107 111 112 125 134 135 139 138 137 143
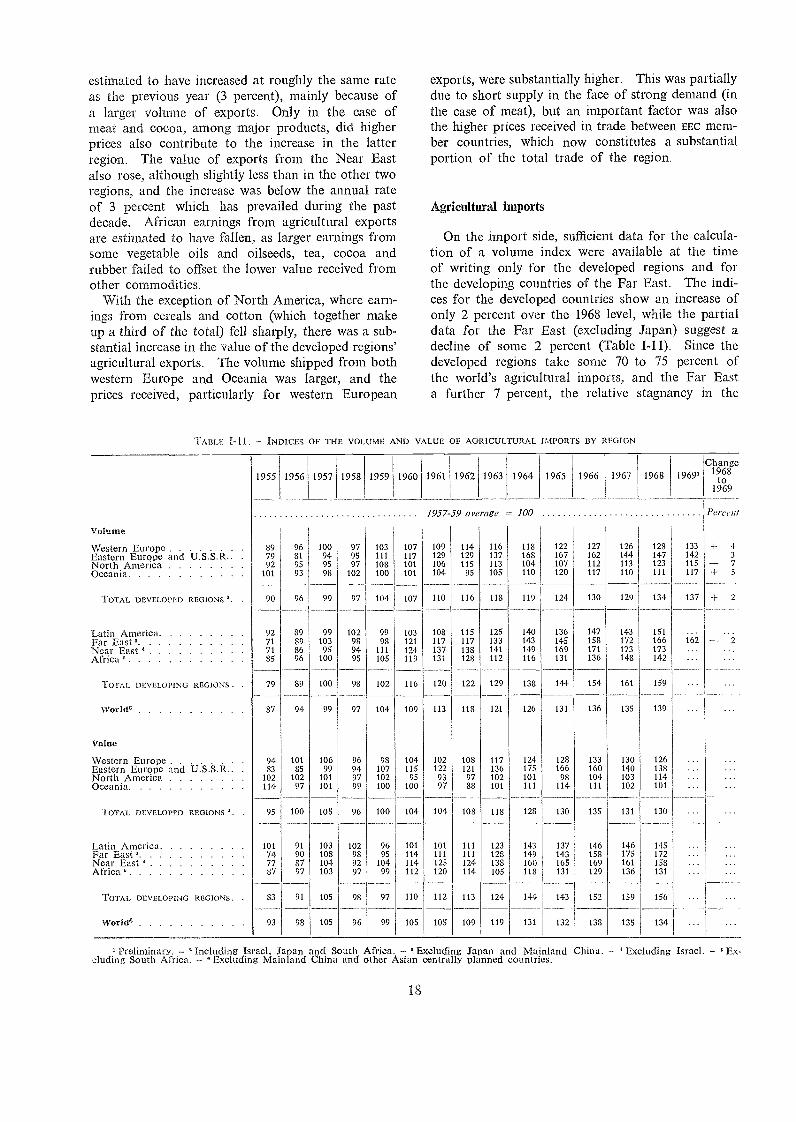
estimated to have increased at roughly the same rateas the previous year (3 percent), mainly because ofa larger volume of exports. Only in the case ofmeat and cocoa, among major products, did higherprices also contribute to the increase in the latterregion. The value of exports from the Near Eastalso rose, although slightly less than in the other tworegions, and the increase was below the annual rateof 3 percent which has prevailed during the pastdecade. African earnings from agricultural exportsare estimated to have fallen, as larger earnings fromsome vegetable oils and oilseeds, tea, cocoa andrubber failed to offset the lower value received fromother commodities.
With the exception of North America, where earn-ings from cereals and cotton (which together makeup a third of the total) fell sharply, there was a sub-stantial increase in the value of the developed regions'agricultural exports. The volume shipped from bothwestern Europe and Oceania was larger, and theprices received, particularly for western European
exports, were substantially higher. This was partiallydue to short supply in the face of strong demand (inthe case of meat), but an important factor was alsothe higher prices received in trade between EEC mem-ber countries, which now constitutes a substantialportion of the total trade of the region.
Agricultural imports
On the import side, sufficient data for the calcula-tion of a volume index were available at the timeof writing only for the developed regions and forthe developing countries of the Far East. The indi-ces for the developed countries show an increase ofonly 2 percent over the 1968 level, while the partialdata for the Far East (excluding Japan) suggest adecline of some 2 percent (Table I-11). Since thedeveloped regions take some 70 to 75 percent ofthe world's agricultural imports, and the Far Easta further 7 percent, the relative stagnancy in the
18
a Preliminary. - 'Including Israel. Japan in(' South Africa. - 'Excluding Japan and Mai Iland China. - a Excluding Israel. - a Ex-cluding South Africa. - Excluding Mainland China and other Asian centrally planned countries.
TABLE -II. INDICES OF THE VOLUME AND VALUE OE AGRICULTURAL IMPORTS BY REGION
Change1955 1956 1957 1958 1959 1960 1961 1962 1963 1964 1965 1966 1967 1968 1969' 1968
to1969
1957-59 average 100 Perceni
Volume
Western Europe ...... 89 96 100 97 103 107 109 114 116 118 122 127 126 128 133 + 4Eastern Europe and U.S.S.R.. 79 81 94 95 111 117 129 129 137 168 167 162 144 147 142 3
North America 92 95 95 97 108 101 106 115 113 104 107 112 113 123 115 7Oceania 101 93 98 102 100 101 104 95 105 110 120 117 110 111 117 + 5
TOTAL DEVELOPED REGIONS . 90 96 99 97 104 107 110 116 118 119 124 130 129 134 137 -I- 2
Latin America 92 39 99 102 99 103 108 115 125 140 136 147 143 151
Far East' 71 89 103 98 98 121 117 117 133 143 145 158 172 166 16. -- ;Near East 71 86 95 94 111 124 137 138 141 149 169 171 173 173Africa a 85 96 100 95 105 119 131 128 112 116 131 136 148 142
TOTAL DEVELOPING REGIONS . 79 89 100 98 102 116 120 122 129 138 144 154 161 159
World, 87 94 99 97 104 109 113 118 121 126 131 136 135 139
Value
Western Europe . . 94 101 106 96 98 104 102 108 117 124 128 133 130 126Eastern Europe and U.S.S.R.. 83 85 99 94 107 115 122 121 136 175 166 160 140 138North America 102 102 101 97 102 95 93 97 102 101 98 104 103 114Oceania 114 97 101 99 100 100 97 88 101 111 114 111 102 101
TOTAL DEVELOPED REGIONS ' . 95 100 105 96 100 104 104 108 118 128 130 135 131 130
Latin America 101 91 103 102 96 101 101 111 123 143 137 146 146 145Far East' 74 90 108 98 95 114 111 111 128 149 143 158 175 172Near East a 77 87 104 92 104 114 125 124 138 160 165 169 161 158Africa a 87 97 103 97 99 112 120 114 105 118 131 129 136 131
TOTAL DEVELOPING REGIONS. 83 91 105 98 97 110 112 113 124 144 143 152 159 156
World° 93 98 105 96 99 105 105 109 119 131 132 138 135 134
volume of world agricultural trade may in part beattributed to this limited increase. On the otherhand, if the preliminary index for total volume ofexports (which remained unchanged in 1969) is evenapproximately correct, the total volume of agricul-tural imports into the developing and centrally plan-ned countries must have shown a substantial reduc-tion.
The imports of all western European countriescombined rose by some 4 percent. A large portionof the increase (though less tha.n in the case of ex-ports) can be attributed to greater trade within theregion, and particularly within EEC. Other fac-tors include the recovery of the United Kingdom'smeat imports from Argentina, and increased purchasesof this commodity throughout the rest of the region.A very large increase of 12 percent was registeredfor rubber imports, reflecting the rapid growth ofindustrial production and, toward the end of theyear, stock building. North American agriculturalimports were reduced sharply, particularly those ofbeverages and tobacco. In part this represented adecline from the high level of 1968, when there hadbeen an exceptional increase in imports in antici-pation of the dock strike in the United States. Importsof coffee and wool, in particular, were considerablylower than the previous year, as coffee stocks weredrawn down in the United States, and wool consump-tion continued to decline reflecting further in-roads by man-made fibres into end uses for apparelwools.
For the developing regions, the probable declinein imports in 1969 may be attributed to the improv-,cd production of food grains in many of the majordeficit countries, which has permitted a further reduction from the peak level reached in 1967. In 1968,their combined cereal imports liad fallen some 8percent, which resulted in a decline in total agricul-tura.1 imports for the first time in a decade, despitelarger imports of most other foodstuffs, beveragesand tobacco, and agricultural raw materials. Theinformation available for the Far East, which showsa decline of 10 percent in cereal imports, and thefragmentary data for the other developing regions(see Chapter II), suggest that this trend continuedin 1969.
Trade in fishery products
The outstanding development in 1969 was the sub-stantial increase in export prices accounted for bysupply shortages of some commodities as well asby a general strengthening of the demand for fisheryproducts. The total value of fishery exports roseby nearly 10 percent in spite of a somewhat lowervolume of shipments. Exports of fresh and frozen
19
fish and shellfish (particularly shrimp) increased bothin volume and value. Higher fish-meal and fish-oilprices made up for sharply reduced shipments fromnearly all the major world suppliers. Trade in driedproducts continued to be affected by reduced purchaseson the part of the traditional importing countries.
The outlook for fishery products markets is health-ier than for several years and the chief concern hasswung back once more from selling to supply prob-lems. Reduced catches of fish used for productionof exports con_unodities and rising prices are likelyto have a greater influence on the future evolution oftrade than will trade barriers and demand factorsnot related to price. The operation of minimumprice systems, which have been instituted in a numberof the major fish-importing countries, has no directimpact as long as market prices remain above theminimum, although it may lead to the control ofexport supplies for the purpose of market stabilization.
In the early months of 1970, -fish-meal supplieswere nearly 20 percent above the level of the preced-ing year, because of substantial production in-creases in Peru, Norway and Denmark. The UnitedStates continued to reduce fish-meal imports, not-withstanding a decline in domestic production.Prices in the United States declined during the firsthalf of 1970, as compounders of animal rations turn-ed increasingly to other components. In Europeanmarkets, however, fish meal demand was strong,with imports and prices near record levels.
Shrimp exports of developing countries to the Unit-ed States and Japan expanded further in early 1970.The high volume of shipments to Japan weakenedthe market, however, and led to a curtaihnent ofpurchases in April. Nearly all major suppliers ofshrimp succeeded in increasing their shipments tothe United States, and the market there was firm,as earlier fears about adverse consumer reaction tohigh prices were not borne out. Groundfish mar-kets, too, were characterized by continued healthand the supply picture was favourable, because theyear classes available to the fishery of some of themore important species were above normal.
Trade in forest products
With an 11 percent increase in the export value,world trade in forest products continued in 1969the dynamic growth which is characteristic of thissector. Although this trade is still of relativelyless importance for developing regions, the growthhas recently been particularly rapid. In 1969, theexport earnings of the developing countries of theFar East from this source rose by 13 percent and thoseof the developing African countries by 15 percent,and they accounted for 21 percent and 11 percent
respectively of the combined value of agricultural,fishery and forest exports from these regions.
An important element in the expansion of forestproducts trade in 1969 was the strong growth inthe exports of logs and semiprocessed forest productsfrom the developing regions to North America,Japan, other east Asian countries and western Europe.Hardwood log exports continued to expand stronglyfrom southeast Asia, the main markets being Japanand other east Asian countries. Indonesia's exportsrose very strongly and this country joined the Philip-pines, Sabah and Sarawak as one of the main logexporters in southeast Asia. African log exports alsoincreased strongly, chiefly to western Europe,the Ivory Coast once again accounting for an im-portant part of the increase. After the strong growthof recent years, United States coniferous log exportsto Japan fell in 1969, partly as a result of restrictionsplaced on exports of logs from United States fed-eral lands and partly because of heavy stockingin Japan at the end of 1968.
World trade in sawn softwood remained at aboutthe 1968 level. United States imports, chiefly fromCallada, rose in the early months, then fell sharplyas demand weakened. For the year as a whole theimport volume was just above that in 1968. UnitedKingdom imports of sawn softwood, as well asthose of other constructional forest products, fellappreciably in 1969, but this was more than offsetby higher imports in the rest of western Europe.This region also imported substantially increased vol-umes of sawn hardwood, plywood, particle boardand fibreboard. Much of the increase in sawn hard-wood imports was from southeast Asia, while for theother products the increase was mainly in the formof intraregional trade. North America also import-ed substantially higher volumes of sawn hardwoodfrom southeast Asia and Latin America, and hard-wood plywood and veneers from southeast Asiaand, to a lesser extent, Finland.
The chemical wood-pulp trade in 1969 was notablefor the large increase in North American, chieflyCanadian, exports and higher imports by westernEurope, the United States and Japan. Net importsin western Europe rose from 250 000 tons in 1965to 1.4 million tons in 1969. Exports from the Nor-dic countries rose in 1969, but the proportion of theirtotal production which was exported declined asmore was retained for conversion by their stronglyexpan.ding paper and paperboard industries. Worldtrade in paper and paperboard continued to growrapidly in 1969, with western Europe and NorthAmerica accounting for a major part of both totalexports and imports and of the increase gainedlast year.
Prices for forest products entering trade in 1969were generally firm, especially for chemical pulp.
20
North American prices for sawn softwood, havingrisen to unprecedented levels in early 1969, weak-ened considerably thereafter, but this did not disturbthe firmness of the European market. Oversupplyof hardwood logs in west Africa in the autumn of1969 reversed the upward trend of prices at least forsome species such as sipo and mahogany, while therewas some uncertainty about price levels towardthe end of 1969 for " red " plywoods in Africa andEurope and for European imports of some sawnhardwood from southeast Asia. After a long pe-riod of relative stability, paper and paperboard pricesrose during 1969, reflecting the higher costs of pulp.
In the fist half of 1970, contrasting trends in theoverall economies of three of the largest consumingregions of wood products brought a correspondingdiversity to the international markets for forest prod-ucts. In the United States, house building contin-ued to be affected by severe credit restrictions andhigh interest rates, thus depressing the market forconstructional forest products, particularly for sawnsoft and hardwood. The levelling off in the growthof the country's overall economy was mirrored inthe pulp and paper sector, where production didnot rise in the first half of 1970 and capacity operat-ing ratios fell.
The weakened demand by the United States marketand the drop in North American prices for sawnsoftwood have enabled Canadian sales to Europe torecover very strongly in 1970. Relatively large in-creases in prices for sawn softwood offered by th.eU.S.S.R. can be related to the reduction in its salesto western Europe, but Finland's prices rose far lessthan those of its main competitors (excluding Can-ada) and its sales of sawn softwood increased cor-respondingly.
The continued rapid economic expansion in Japanhas stimulated the growth of forest products im-ports. In western Europe, credit restrictions andhigh interest rates have prevented dwelling construc-tion from sharing fully in the generally strong eco-nomic expansion. Demand for most forest productshas nevertheless remained firrn during 1970 andprices have in general been rising, partly in linewith the overall inflationary trends.
The very tight supply situation for chemical pulpthat developed in the international market in 1969has continued in 1970, with demand still rising stronglyin western Europe and Japan. The flattening out ofdemand expansion in North America has, to someextent, been offset by supply disruptions causedby strikes in British Columbia. The pulpwood mar-ket in Europe now appears to be in better balance,with production and trade reacting to strong priceincreases.
Oversupply has characterized in 1970 the trade intropical hardwood logs between Africa and Europe.
After the steep rise in exports in 1969, Europeanexporters have followed a cautious forward buyingpolicy, and the west African log export market hasconsequently been stagnant. For the second yearin succession, the rainy season in west Africa thisyear was shorter than normal, further hampering theefforts of producers to reduce the excess supply oflogs.
In southeast Asia, the most significant feature hasbeen the further rapid expansion of log exportsfrom Indonesia. Japan was expected to raise itsimports of tropical hardwood logs by 9 percent in1970, much of the increase coming from Indonesia,while imports from the Philippines may decline.Its imports of coniferous timber from the U.S.S.R.are also reported to be falling in 1970, because thelatter's price levels have become relatively less attrac-tive.
International trade policies
The record in the field of international tradepolicies affecting agricultural products in 1969 andearly 1970 was mixed.
As regards the wider aspects of agricultural com-modity tmde, there was some progress toward ageneralized system of preferences in favour of develop-ing countries. Steps were also taken by FAO tostrengthen the procedures and machinery for con-sultation as regards the increasingly widespread non-commercial trade in agricultural products. In themeantime, the Agriculture Committee of GATT pro-ceeded with its fact-finding work on nontariff bar-riers to agricultural trade, preparatory to the launch-ing of new trade negotiations, which are nowscheduled to be initiated in 1971, and which arealso intended to cover agricultural support policies.
Some progress was also made with regard toarrangements affecting individual commodities, par-ticularly dairy products. The International CoffeeAgreement and the International Sugar Agreementwere further developed, although the sharp priceincreases in August-September 1970 put the formertmder severe pressure, and there were also somemoves toward a possible formulation of a formal in-ternational arrangement 00 tea. In the meantime, con-tinuing or increasing pressures in several commoditymarkets, including rice and dairy products, broughtadded urgency to the examination of possible lortgerterm arrangements in the context of FAO study groupsand other commodity bodies.
On the negative side, the most significant eventswere the virtual breakdown of the price provisionsof the Wheat Trade Convention of the InternationalGrains Arrangement (IGA) following the dmstic changein the world market situation subsequent to the
21
signing of the Arrangement, and the continued failureof cocoa exporting and importing countries to reachan international agreement for that commodity.
The informal arrangements on jute and kenaf andon hard fibres, operated under the auspices of FAO,
experienced difficulty in maintaining prices withinthe agreed ranges in 1969, and lack of agreementon export quotas and prices for sisal means thatno arrangement has been in force in 1970. At thesame time, the committees concerned have taken astep toward joint international action, by agreeingto promote the establishment of international researchinstitutes to help improve the competitive positionof jute and hard fibres vis-à-vis synthetic fibres.
GENERAL PREFERENCES
The question of general preferences for the exportsof developing countries has been the subject ofcontinuing discussion both within the framework ofPart IV of GATT and in the UNCTAD COMMIIIee 011
Preferences since 1968, when UNCTAD II agreed ontheir desirability. Following a series of direct ne-gotiations among the industrialized countries withinthe framework of OECD, the prospects for concreteaction improved early in 1970. Although no agree-ment could be reached on a uniform set of prefer-ential tariffs to be applied by all industrializedcountries, a compromise solution was found where-by each country would be free to work out its ownarrangements, after which some machinery would beset up to determine whether there was a reasonablesharing of the burden. The preferences to be grantedwould, moreover, be temporary in nature and wouldnot constitute a binding commitment. Although anumber of difficulties remain to be solved includ-ing the treatment of the developing countries whichcurrently receive preferential treatment under theEuropean Economic Community association agree-ments and the Commonwealth preference schemethe compromise reached is thought to lay the basefor a scheme which could represent a major stepforward in the attainment of the objectives of PartIV of GATT. At the time of writing, revised propos-als by major developed trading nations were beingexamined by the UNCTAD Committee on Preferences.
COMMODITY A_RRANGEMENTS
The extensive negotiations held under the auspicesof GATT in an attempt to achieve a better balance indairy markets have also achieved results, althoughso far limited in scope. An Arrangement Concern-ing Dairy Products agreed upon by Australia, Can-ada, Denmark, the EEC countries, Japan, New Zea-land, South Africa and the United Kingdom came
into force in May 1970 for an initial period of oneyear. Under the agreement both exporting and im-porting countries undertake not to sell or buy skimmilk powder below an agreed minimum price.Although the price provisions of the Arrangementapply only to skim milk powder, the possibilities ofextending them to cover other dairy products havebeen under examination.
The newly drawn up International Dairy Develop-ment Scheme may be regarded as complementaryto the GATT commercial arrangement. Proposed ini-tially at the Committee on Commodity Problems(ccr) in the autumn_of 1969, the Scheme was elabo-rated by an ad hoc consultation of 47 countries and10 intergovernmental organizations in June 1970 andis now awaiting government approval. Under theScheme FAO would act as an international clearing-house to promote bilateral and multilateral aid inthe form of dairy products and animal feedstuffs,technical assistance, equipmen.t and finance, to buildup local dairy industries in accordance with integrat-ed plans submitted by the recipient countries. TheScheme would be operated jointly with the WorldFood Programme, and in close cooperation with theother international agencies concerned.
Although the International Coffee Agreements(tcA) of 1962 and 1968 contributed a measure ofstability to world coffee markets, in 1969 and 1970events and conditions beyond the control of the newAgreement played a major role in the determinationof world coffee prices. Early in 1969, sluggish de-mand due, to a large extent, to the excess coffeestocks held in the United States brought pricesfor most types of coffee to their lowest level in manyyears. The trend \vas, however, sharply reversed inmid-1969 as a result of the reports in July of seriousfrost damage to coffee in Brazil, and prices rose totheir highest level in a decade. After considerabledifficulty the member countries of ICA agreed inAugust 1970 to raise the initial quotas to 54 millionbags, 8 million more than last year. Depending onhow the prices move, 4 million bags may be added,or 3 million withdrawn. The fact that the Agree-ment weathered this serious crisis, together with themoves made in the latter part of 1969 and in thefirst half of 1970 to strengthen it submission by20 producing countries of their national plans foradjusting coffee production to 1972/73, the d.ecisionto review annually the national stock positions inorder to ensure sufficient supplies at times of reduc-ed output, and the removal from the list of " newmarkets of a number of countries whose importswere considered excessive relative to domestic re-,quirernents suggest that ICA remains the mostsuccessful of the existing commodity arrangements.
Progress was also made in implementing the In-ternational Sugar Agreement, which came into force
22
in June 1969. In particular, the International SugarCouncil adopted rules pertaining to commitmentsby exporters to make releases from the stipulatedminimum stocks when prices rise above a certainlevel, and to sell certain quantities to their traditionalimporting members at a higher "supply commitmentprice" when the market price exceeds it.
For some other com.modities, international effortsto deal with market difficulties extending over aconsiderable period have been less successful. At-tempts to conclude an international agreement oncocoa, which have continued off and on since 1963,remain so far unsuccessful; various proposals forfurther action, presented in the course of consulta-tions arranged by the Secretary-General of UNCTADin late 1969 and early 1970, were discussed in June1970, but did not provide a basis for agreement.
More important still, during the period underreview it became clear that because of the profoundchange in the wheat market situation that took placesoon after the negotiation of the Arrangement, theWheat Trade Convention of IGA has failed to main-tain world prices within the agreed range. True,the downward movement in prices, which gatheredmomentum in the early months of 1969, was haltedlater in the year at a level substantially below theIGA minimum, but this was due less to the Arrange-ment itself, than to informal cooperation arrang-ed among the main participating exporters. Atthe June 1970 session of the International WheatCouncil (twc) member governments decided to setup a preparatory committee to examine possiblebases for a new arrangement after the expiry of thepresent IGA at the end of June 1971, and to reportto twc at its October/November 1970 session. Thecommittee's programme of work is intended toterminate in a negotiating conference in January 1971.
In the meantime, the continued or intensified pres-sure on a number of commodity markets has ledto a more active search for possible national andinternational measures to arrest price falls and/or tostabilize the level of prices in international markets,particularly within the framework of FAO study groupsand ad hoc consultations. In the case of tea, agree-ment was reached among main exporters in mid-1969 to restrict and allot among themselves thequantity of black tea to enter world markets in 1970.These measures were welcomed by the importers atthe December meeting of the Consultative Committeeon. Tea, which had been established by CCP in theautumn of 1969, and it was generally agreed thatwork toward a long-term arrangement should becontinued. In the spring of 1970 the Working Partyon Long-Term Measures, established for this purpose,noted that despite the helpful temporary measuresby exporters, the long-term imbalance between ratesof growth of production and consumption had, if
anything, worsened. The working party thereforeasked the Director-General of FAO, in associationwith the Secretary-General of UNCTAD, to appointone or more conciliators to prepare the groundfor subsequent discussions in the Consultative C0111-mittee on Tea on a long-term agreement.
Other discussions on international commodity ac-tion remain at a less advanced stage. A specialsession of the Study Group on Oilseeds, Oils andFats was held early in 1970 to undertake furtherconsultations on the possible establishment of anintergovernmental consultative committee, and tomake practical proposals for short-term action andlong-term measures for intergovernmental arrange-ments. The group agreed that its policy functionsshould be strengthened to enable it to recommendaction to coordinate measures at national, re-gional and international levels to deal with spe-cific short-term problems. To provide a basis forthis, it decided to set up a statistical subcommitteeto prepare evaluations of the current and prospectivemarket situation.s. The first session of this subcom-mittee was held in July 1970.
Consideration of possible international measuresto prevent instability in world rice trade and priceswas revived at the thirteenth session of the FAOStudy Group on Rice in March 1969, and the recentdeterioration in the situation discussed earlier inthis chapter led to a more intensive examinationat its fourteenth session in May 1970. The groupidentified the principal problems confronting theworld rice economy, both at presertt and in themedium-term future, and agreed on the importanceof concerted action to ensure orderly tradin.g in riceat reasonably remunerative prices. It therefore setup an ad hoc working party to examine in detailthe technical and economic feasibility of proposalsfor appropriate national and/or international action,and to draw up concrete recommendations for policyaction for consideration by governments at thegroup's next session.
OTFIER DEVELOPMENTS
One feature of the current situation in the worldrice trade, namely the increasing importance of con-cessional trade and exports at subsidized prices, alsodraws attentiort to the revised procedures and obli-gations for consultation under the FAO Principles ofSurplus Disposal. The need for such revision hasarisen from the major changes in the scope of near-commercial or extracommercial transactions whichhave taken place since the adoption of the FAO Prin-ciples in 1954. There has been a sharp increase in"grey area" shipments, which can be classified neitheras normal commercial trade nor as food aid. Forsome commodities, moreover, a part of the supplies
23
shipped as food aid now comes from current pro-duction, rather than from surplus stocks. Morecommodities and countries have recently become af-fected by surplus problems, while the introductionin 1968 of the Food Aid Convention under IGAmultiplied the number of bilateral donors of foodaid. All this has tended to increase the fears ofgovernments that trade of this nature would increas-ingly undermine normal commercial trade, partic-ularly in view of the uncertainty as to which typesof noncommercial transactions are subject to theexisting irtternational procedures for consultation andreporting.
Following a lengthy study leading to the drawingup of a catalogue of transactions in internationaltrade in agricultural commodities likely to causeinterference to normal patterns of production andtrade," CCP drew up a new set of detailed proceduresfor reporting and consultation between interestedgovernments, in certain cases prior to the final nego-tiation of the deal. The recommendations of CCPwere subsequently endorsed by the FAO Council atits fifty-third session. in November 1969. By endJune 1970, 20 countries including the UnitedStates, EEC and its member states, Australia, Canada,India, Japan, New Zealand, the United Kingdom anda number of other major trading nations liadformally signified their acceptance of the new pro-cedures. At the same time, the terms of referenceof the Consultative Subcommittee on Surplus Dis-posal (csD) were strengthened to bring them intoline with the new obligations, and CSD was request-ed to draw up revised working methods to imple-ment this new code of behaviour. In the mean-time, FAO has established a new Central InformationService on Food Aid, which will assemble data oncurrent trade transactions subject to the new proce-dures, drawing on reports made to CSD. Informa-tion on actual food aid shipments and, as far aspossible, on prospective food aid programmes andavailabilities will also be assembled.
Finally, attention should be drawn to a furtherdevelopment arising from the informal arranaementsfor hard fibres and for jute, kenaf and allied fibresoperated under the relevant FAO consultative com-mittees. As briefly mentioned earlier, in 1969 botharrangements succeeded in maintaining the prices ofthe commodities affected within the terms of theirrespective arrangements, though with some difficulty.In the case of sisal, the pressures became too greatin early 1970, the arrangement beca.me inoperative,and prices fell steeply. The producing countries havesubsequently been unable to reach agreement onindividual quotas and minimum prices, and the sisalmarket has therefore been a free onc since early
"The catalogue is shown the Appendix of the FAO commodityreview and outlook 1969-1970.
1970. In the case of abaca, prices rose significantlybeyond the recommended indicative levels, owing toa supply shortage. Those of jute pressed againstand even exceeded the ceiling recommended, lead-ing to a recommendation in February 1970 thatproducing countries should make efforts to increaseproduction sufficiently to reduce prices to the mid-point of the recommended range. By September 1970,prices were back at the top level of the range, thanksto the introduction of an export bonus in Pakistan.
In moves that may be of some importance in thelong run, both committees have recently taken stepstoward the initiation of international research activi-ties for their fibres. It has long been felt that oneof the best means of preventing a rapid loss of mar-kets for these fibres is, on the one hand, improve-
Devei[opEiaciff assistance
If 1968 was a year of "uncertainty and question-ing" in international development assistance, 1969and 1970 will probably in retrospect be considereda period in which this questioning developed intoa more active search for a basis for a relaunchingof the aid effort, which has tended to falter overthe past several years. Some major reviews ofmultilateral and bilateral aid programmes, policiesand performance were concluded, including thePearson report," the capacity study of the UnitedNations Development System (the Jackson report),"a report by Raúl Prebisch for the Inter-AmericanDevelopment Bank on the development prospectsand problems of Latin America," and a presidentialtask force review of United States aid policies (thePeterson report); and the broad objectives and linesof policy for the Second Development Decadewere approved. There was also evidence, in theforin of a more active public debate of the entiredevelopment question, that these and other studiesliad made a positive impact on world opinion. Andalthough at the time of writing few of the conclusionsof the different studies had yet been translated intoconcrete action, the generally favourable receptionthey received gave some grounds for anticipating ashift toward a better climate for aid.
Several elements, by now well lcnown, werebehind the decisions to initiate these studies. As aresult of a number of factors including disillusionin aid-giving countries about the effectiveness of aid,
"Partners in development Report of the Commission on Inter-national Development. New York, Praeger, 1969.
"A study of the capacity of the United Nations DevelopmentSystginbiGscehnev. ,1111J.ni erdanslfloartnioiancsi, n19y69.
desarrollo. Report present-ed to the Inter-American Development Bank, Washington, D.C.,May 1970.
24
ments in productivity and in the quality of thesefibres, thus making them more competitive with syn-thetic substitutes; and, on the other, the develop-ment of new end uses for them. To help achievethese goals the Study Group on Hard Fibres setup an Advisory Working Party on Research, whichhas begun to implement a programme of enckiseresearch, priority being given to projects of practicalapplication, and has recommended the establish-ment of an independent International Research Centrefor Hard Fibres to supervise international researchactivities. Th.e setting up of a similar research cen-tre for jute and kenaf had already been proposed bythe Study Group for Jute, Kenaf and Allied Fibres,and a detailed feasibility study on this subject, fmanc-ed by UNDP, is expected to be completed in 1971.
the balance of payments problems of some of them,increasing attention in many countries to the solutionof domestic problems, and probably the reducedpolitical tensions among the major powers theincrease in the flow of funds from developed todeveloping countries slowed down during the pastdecade, particularly if compared with the growth ofthe developed countries' economies. At the sametime, the share of assistance on concessional termsin the total fell (Table I-12), and the terms of aidtended to harden at a time when the debt serviceburden of a great many developing countries becameincreasingly heavy.
Information on the flow of aid in 1969 indicatesthat the overall picture has not improved. Thetotal amount of aid public and private showedvirtually no increase at all. Official developmentassistance (the portion which is significantly conces-:sional in character) increased by almost 4 percent,but this was barely sufficient to offset the declinesin other official and private flows. The ratio ofboth total and official development assistance to thedonor countries' gross national product (GNP) Ii1UScontinued to fall in 1969.
It was against such a background that the Presi-dent of the World Bank suggested, as far backas 1967, that an experienced group meet to "studythe consequences of twenty years of development assis-tance, assess the results, clarify the errors and proposethe policies which will work better in the future."The results of their study the report of the Com-mission on International Development (the Pearsonreport) were released in September 1969. Thereport noted that "the climate surrounding foreignaid programmes is heavy with disillusion and dis-
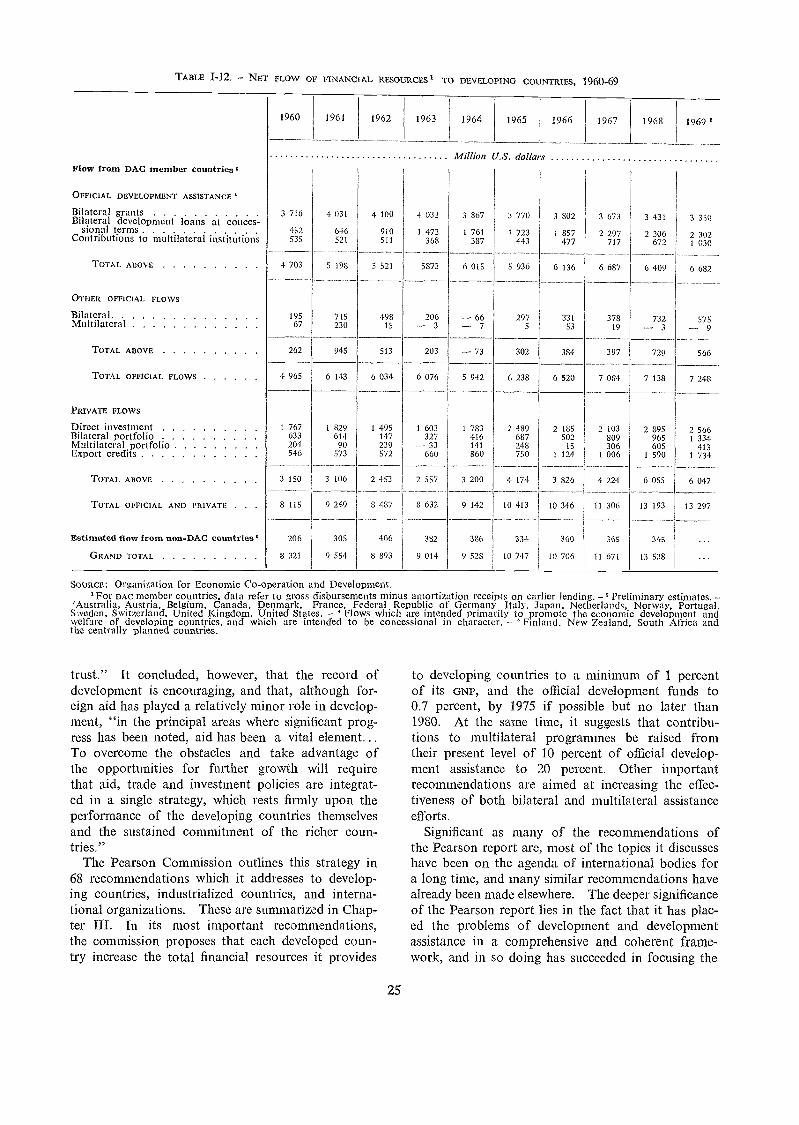
Flow from DAC member countries.
OFFICIAL DEVELOPMENT ASSISTANCE
TABLE 1-12. NET FLOW OF FINANCIAL RESOURCES' TO DEVELOPING COUNTRIES, 1960-69
trust." It concluded, however, that the record ofdevelopment is encouraging, and that, although for-eign aid has played a relatively minor role in develop-ment, "in the principal areas where significant prog-ress has been noted, aid has been a vital element...To overcome the obstacles and take advantage ofthe opportunities for further growth will requirethat aid, trade and investment policies are integrat-ed in a single strategy, which rests firmly upon theperformance of the developing countries themselvesand the sustained commitment of the richer coun-tries."
The Pearson Commission outlines this strategy in68 recommendations which it addresses to develop-ing countries, industrialized countries, and interna-tional organizations. These are summarized in Chap-ter III. In its most important recommendations,the commission proposes that each developed coun-try increase the total financial resources it provides
Million U.S. dollars
206 663 7
203 73
6 076 5 942
1 603 1 783327 416
-- 33 141660 860
2 557 3 200
25
297
302
6 238
2 489687248750
4 174
6 136
384
6 520
SOURCE: Organization for Economic Co-operation and DeveloPment'For DAC member countries, data refer to gross disbursements minus amortization receipts on earlier lending. Preliminary estimates.
'Australia, Austria, Belgium, Canada, Denmark, France, Federal Republic of Germany Italy. Japan. Netherlands, Norway, Portugal,S ,veden, Switzerland, United Kingdom, United States. ' Flows which are intended primarily to promote the economic development andwelfare of developing countries, and which are intended to be concessional in character. - Finland, New Zealand, South Africa andthe centrally planned countries.
to developing countries to a minimum of 1 percentof its GNP, and the official development funds to0.7 percent, by 1975 if possible but no later than1980. At the same time, it suggests that contribu-tions to multilateral programmes be raised fromtheir present level of 10 percent of official develop-ment assistance to 20 percent. Other importantrecommendations are aimed at increasing the effec-tiveness of both bilateral and multilateral assistanceefforts.
Significant as many of the recommendations ofthe Pearson report are, most of the topics it discusseshave been on the agenda of international bodies fora long time, and many similar recommendations havealready been made elsewhere. The deeper significanceof the Pearson report lies in the fact that it has plac-ed the problems of development and developmentassistance in a comprehensive and coherent frame-work, and in so doing has succeeded in focusing the
Bilateral grants 3 716 4 031 4 100Bilateral development loans at conces-
sional terms . . ... ... . 452 646 910Contributions to multilateral institutions 535 521 511
TOTAL ABOVE 4 703 5 193 5 521
OTHER OFFICIAL FLOWS
Bilateral 195 715 498Multilateral 67 230 15
TOTAL ABOVE 262 945 513
TOTAL OFFICIAL FLOWS 4 965 6 143 6 034
PRIVATE FLOWS
Direct investment 1 767 1 829 1 495Bilateral portfolio 633 614 147Multilateral portfolio 204 90 239Export credits 546 573 572
TOTAL ABOVE 3 150 3 106 2 453
TOTAL OFFICIAL AND PRIVATE . . . 8 115 9 249 8 437
Estimated flow from non-DAC countries' 206 305 406
GRAND TOTAL 8 321 9 554 8 893
3 673 3 431 3 350
2 297 2 306 2 302717 672 1 030
6 687 6 409 6 682
378 732 57519 3 9
397 729 566
7 084 7 138 7 248
2 103 2 895 2 566809 965 1 334306 605 413
1 006 1 590 1 734
4 224 6 055 6 047
11 306 13 193 13 297
365 345
11 671 13 538
1960 1961 1962 1963 1964 1965 1966 1967 1968 1969
8 632 9 142
382 386
9 014 9 528
4 032 3 807
1 473 1 761368 387
5873 6 015
10 413
334
10 747
3 770
1 723443
5 936
2 185502
151 124
3 826
10 346
360
10 706
3 802
1 857477
33153
attention of donor countries, multilateral institutionsand the general public on the need to take concreteaction to give renewed impetus to internation.al co-operation for development.
Some evidence of such action has already appear-ed during the period under review. In many of thesmaller donor countries aid is already receivingstrong public support a.nd has grown steadily overthe past decade. A number of them, in declaringtheir support of the 1 percent target recommendedby the Pearson Commission and before it by theUnited Nations Conference on Trade and Develop-ment (uNcTAD) and the Development AssistanceCommittee (DAc), have announced specific plansfor its attainment. Both Denmark (in 1968) andthe Netherlands (in 1969) liad already drawn upprogrammes for reaching this target, the first by1972/73 and the second by 1971. The Governmentsof New Zealand and the Federal Republic of Germanyhave also expressed their intentions in this respect,the latter through an annual increase of 11 percentin official development assistance. Norway willtriple government aid during the period 1968-73,and Japan will double it "in the near future." Inthe United Kingdom one million signatures havebeen collected supporting the Pearson targets fortotal and official aid, and the Government announc-ed that it intended to increase economic aid from$526 million in 1969/70 to $720 million in 1973/74,with the expectation of reaching the 1 percent targetbetween 1975 and 1980. Even in the United States,where the climate for foreign assistance has becomeincreasingly unfavourable in recent years, the reportof the President's Task Force on International De-velopment ari aim which has been subsequentlyendorsed in the President's Message to Congress onForeign Aid urged that " the downward trend inUnited States development assistance appropriationsbe reversed.
At the same time, multilateral lending has beenreceiving an even more substantial and immediateimpetus. Already in 1968 IBRD announced plansto double the total volume of its lending duringthe period 1969 to 1973 and, as will be reportedbelow, substantial progress toward that end hasalready been achieved. Furthermore, by March1970 it seemed probable that, in line with the PearsonCommission recommendations, the funds of IBRD'Ssoft loan affiliate, the international DevelopmentAssociation (IDA), would be increased to $1 000million per year between 1972 and 1974, comparedto $100 million annually during the early 1960s and$400 million per year during 1969-71. Support forthe new target had already been announced by theUnited States, which contributes 40 percent of allIDA funds. The financial position of IDA may alsobe helped by the record profits, of around $200
26
million, expected to be announced by IBRD at theend of 1969/70.
United States support of the expansion in IDAlending is closely in line with one of the principalpoints of the President's message to Congress, namelythat there be a substantial shift in the United Statesforeign assistance operations from a bilateral to amultilateral basis. The Peterson report had advo-cated an increase of $500 million in annual contribu-tions to international financial institutions by 1972(these averaged $224 million during the period 1966-68), and reconunended that bilateral programmes beadapted as far as possible to objectives and standardslaid down by multilateral agencies.
The problems created by the increasingly heavydebt burden in many developing countries, andhence the need to provide assistance on easier terms,are widely recognized. For several years DAC hasbeen active in attempts to obtain a softening of theterms of assistance, and in February 1969 adopteda supplement to the 1965 recommendation on finan-cial terms and conditions which calls for a furtherimprovement in the terms of lending so as to raisethe average concessional element of official develop-ment assistance commitments." The Pearson Com-mission goes even further by recommending thateasier terms relate to all development assistanceloans." Despite DAc's efforts, which have been in-strumental in obtaining an improvement in the termsof lending of several donor countries (for exampleCanada, Denmark, the Federal Republic of Germany,the Netherlands, Sweden and the United Kingdom)there has been no improvement in the overall situa-tion, primarily because the impact of softer lendingby some countries has been overshadowed by theharder terms of others.
During 1969 some limited initiatives were alsotaken to reduce the degree of aid tying, which thePearson Commission estimates may reduce the valueof aid to developing countries by as much as 20percent. The Canadian Government reduced theminimum Canadian content of goods supplied from80 percent to 66 percent, and the Government ofthe Federal Republic of Germany decided to permitaid-financed procurement (formerly limited to Ger-man suppliers) in the developing countries. TheUnited States, reversing the trend of recent yearsduring which virtually all loans under the country'said programmes have been tied, abolished "addi-
"Specifically, it calls for donor countries to provide at least85 percent of their official development assistance commitmentsso that each transaction has a minimum concessional element of61 percent, or to ensure that those conunitments contain an aver-age concessional element of at least 85 percent. The concessionalelement is defined as the face value of the loan, less the discount-ed present value of required amortization and interest payments(using a 10 percent discount rate).
"It calls for a maximum interest rate of 2 percent. a maturityof between 25 and 40 years, and a grace period of 7 to 10 yearson all development assistance loans.
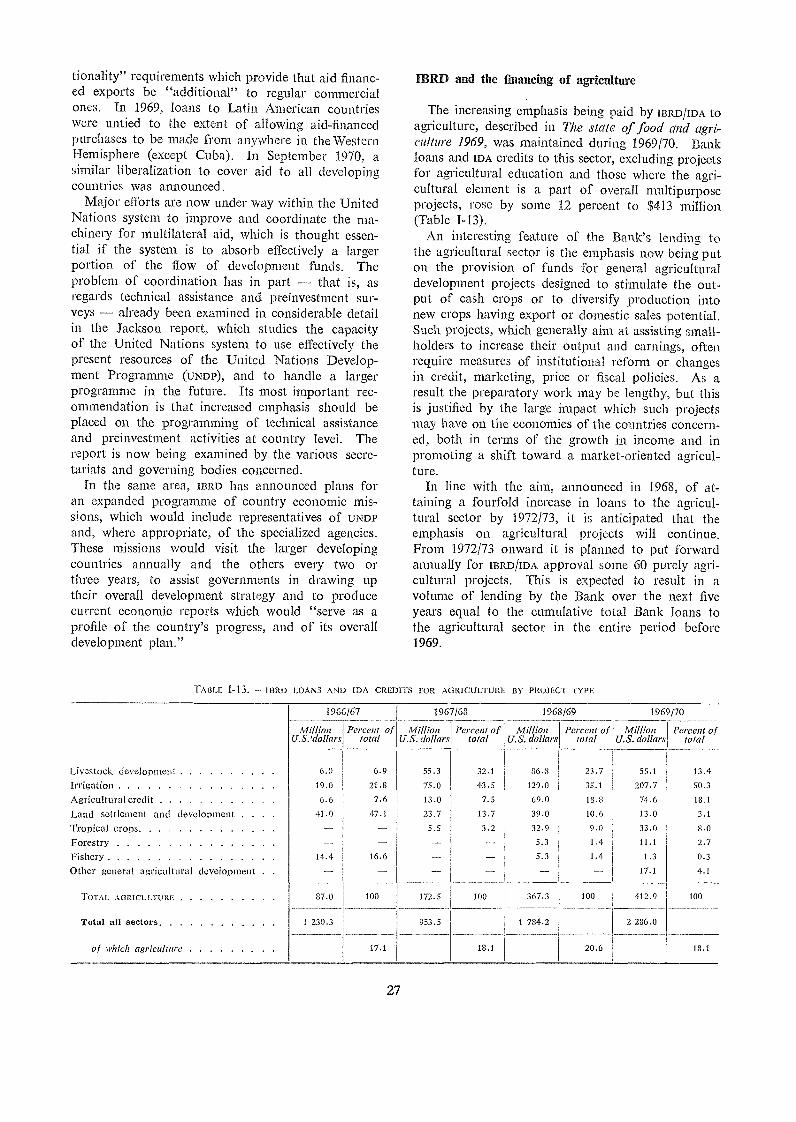
tionality" requirements which provide that aid financ-ed exports be "additional" to regular commercialones. In 1969, loans to Latin American countrieswere untied to the extent of allowing aid-financedpurchases to be made from anywhere in the WesternHemisphere (except Cuba). In September 1970, asimilar liberalization to cover aid to all developingcountries was announced.
Major efforts are now under way within the UnitedNations system to improve and coordinate the ma-chinery for multilateral aid, which is thought essen-tial if the system is to absorb effectively a largerportion of the flow of development funds. Theproblem of coordination has in part - that is, asregards technical assistance and preinvestment sur-veys - already been examined in considerable detailin the Jackson report, which studies the capacityof the United Nations system to use effectively thepresent resources of the United Nations Develop-ment Programme (uNDP), and to handle a largerprogramme in the future. Its most important rec-ommendation is that increased emphasis should beplaced on the programming of technical assistanceand preinvestment activities at country level. Thereport is now being examined by the various secre-tariats and governing bodies concerned.
in the same area, IBRD has announced plans foran expanded programme of country economic mis-sions, which would include representatives of UNDPand, where appropriate, of the specialized agencies.These missions would visit the larger developingcountries annually and the others every two orthree years, to assist governments in drawing uptheir overall development strategy and to producecurrent economic reports which would "serve as aprofile of the country's progress, and of its overalldevelopment plan."
TA13LE -13. 113R0 LOANS AND IDA CREDITS FOR AGRICULTURE 13Y PROJECT TYPE
27
IBRD and the financing of agriculture
The increasing emphasis being paid by IBRD/IDA toagriculture, described in The state of food and agri-culture 1969, was maintained during 1969/70. Bankloans and IDA credits to this sector, excluding projectsfor agricultural education and those where the agri-cultural element is a part of overall multipurposeprojects, rose by some 12 percent to $413 million(Table 1-13).
An interesting feature of the Bank's lending tothe agricultural sector is the emphasis now being put011 the provision of funds for general agriculturaldevelopment projects designed to stimulate the out-put of cash crops or to diversify production intonew crops having export or domestic sales potential.Such projects, which generally aim at assisting small-holders to increase their output and earnings, oftenrequire measures of institutional reform or changesin credit, marketing, price or fiscal policies. As aresult the preparatory work may be lengthy, but thisis justified by the large impact which such projectsmay have on the economies of the countries concern-ed, both in terms of the growth in income and inpromoting a shift toward a market-oriented agricul-ture.
In line with the aim, announced in 1968, of at-taining a fourfold increase in loans to the agricul-tural sector by 1972/73, it is anticipated that theemphasis on agricultural projects will continue.From 1972/73 onward it is planned to put forwardannually for IBRD/IDA approval some 60 purely agri-cultural projects. This is expected to result in avolume of lending by the Bank over the next fiveyears equal to the cumulative total Bank loans tothe agricultural sector in the entire period before1969.
1966/67 1967/68 1968/69 1969170
AlillionU.S.'dollars
Percent oftotal
MillionU.S. dollars
Percent oftotal
MillionU.S. dollars
Percent oftotal
Mil/ionU.S. dollars
Percent oftotal
_ivestock- development 6.0 6.9 55.3 32.1 86.8 23.7 55.1 13.4
[rrigation 19.0 21.8 75.0 43.5 129.0 35.1 207.7 50.3
Agricultural credit 6.6 7.6 13.0 7.5 69.0 18.3 74.6 18.1
Land settlement and development . . . . 11.0 47.1 23.7 13.7 39.0 10.6 13.0 3.1
Tropical crops 5.5 3.2 32.9 9.0 33.0 8.0
Forestry -- - 5.3 1.4 11.1 2.7
Fishery 14.4 16.6 - -- 5.3 1.4 1.3 0.3
3ther general agricultural development - - -- - 17.1 4.1
TOTAL ACMICULTUIO' 87.0 100 172.5 100 367.3 100 412.9 100
Total 811 sectors 1 230.3 953.5 1 784.2 2 286.0
of which agriculture 17.1 18.1 20.6 18.1
If such a flow of approved projects is to be achiev-ed, preparation will have to be started on a muchlarger number in any one year, to allow for delaysand slippage of various kinds. A considerable ef-fort on project preparation is therefore required, notonly by IBRD but by the other development banksas well. A number of initiatives have also beentaken to ensure that preinvestment activities withinthe United Nations system lead, where possible, toinvestment. Investment agencies are, for example,being encouraged to become involved at an earlystage in projects which are of interest to them. Thiscould help ensure that the preinvestment studieshave the form and content required by the agencies.
Regional banks
The activities of the regional development banksprimarily the Asian Development Bank (Aspa)
and the older established Inter-American Develop-ment Bank (1m) continued to expand, with con-siderable emphasis being put on agriculture.
Since its inception. in 1966, ASDB has committed$163 million for 31 projects in 13 countries, of whichapproximately 20 percent went to the agriculturalsector. In 1969 total commitments amounted to$100 million, with 28 percent for agriculture andrelated industries. For 1970 ASDB intends to doubleboth its total commitments and the funds going toagriculture. Importan.t for the financing of agri-culture has been the increase in the contributionsto its soft loan special funds which now amountto some $85 million, of which $23 million havebeen provided specifically for agriculture, and theliberalization of the recent contributions, in particularas regards the tying of loans and interest rates. Thisshould enable the Bank to finalice more agriculturalprojects, although it is still hampered by its policyof financing only the foreign exchange costs of proj-ects. The policy is now under examination, how-ever, and if changed the volume of loans for agri-culture should expand sharply.
A substantial increase in the lending capacity ofIDB was announced at its April 1970 meeting. TheBank's ordinary resources (used for relatively lowinterest, long-term loans repayable in hard curren-cies) will be increased from $3 200 million to $5 200million, and its Fund for Special Operations (avail-able for social investment and repayable in the cur-rency of the borrower) from $2 300 million to $3 890million. In view of the important role which theBank has played in providing finance to agriculture
its lending to the sector has increased from $75million in 1968 to $202 million in 1969, and it provid-ed nearly 50 percent of all of the external loan com-mitments to the Latin American region during the
28
period 1961-68 the possibility now exists for asubstantial increase in agricultural investment in theregion during the coming years.
The African Development Bank (AFDB) started lend-ing operations in 1967/68, and by the end of 1969loans to 20 projects totalling $50 million had beenapproved. Considerable emphasis is being put oncareful screening in order to ensure that the limitedavailable funds go only to top priority, highly re-munerative projects. As a result, although projectpreparation activities are being carried on in some12 African countries, only one agricultural projecthas so far been approved.
Food aid
Statistics on food aid disbursements and ship-ments are incomplete, in part because of insufficientreporting, in part because of uncertainty as to thekinds of shipments which should be thus classi-fied. Improvements in both respects should re-sult from recent action to clarify the concepts of" concessional trade " and to improve the reportingprocedures on such transactions through the Con-sultative Subcommittee on Surplus Disposal of ccr,discussed above, and from the establishment byFAO of the Central Information Service on FoodAid.
For the time being, however, only partial data areavailable. As indicated below, the food aid providedby the two main donor countries, Canada and theUnited States, showed diverse movements in 1969.For the United States, concessional shipments de-clined by some 14 percent, 1,vhereas for Canada therehas probably been a substantial increase. The ini-tiation of shipments under the Food Aid Conven-tion (FAc) in 1968/69 has meant, however, that inaddition to these two countries, nine others andEEC are now providing food aid on a regular basis.
In terms of commodities, special trade in grainsis estimated to have declined by some 40 percentbetween the peak in 1964/65 and 1968/69, from19.8 to 11.8 million tons, reflecting the smaller overallimport requirements of the major recipient countries,notably India and Pakistan. This decrease tookplace despite the coming into force of FAC underwhich a minimum of 4.2 million tons of food grainsare being shipped annually. Food aid shipments ofother commodities probably have fallen less, andalthough grains are the largest item, the reductionin the total has most likely been rather less than forgrains alone.
Of the total shipments under FAC, 6 percent werechannelled through the UN/FAO World Food Pro-gramme (wrr) in 1968/69. Thanks to growing pledgesby governments, as well as to the FAC and other
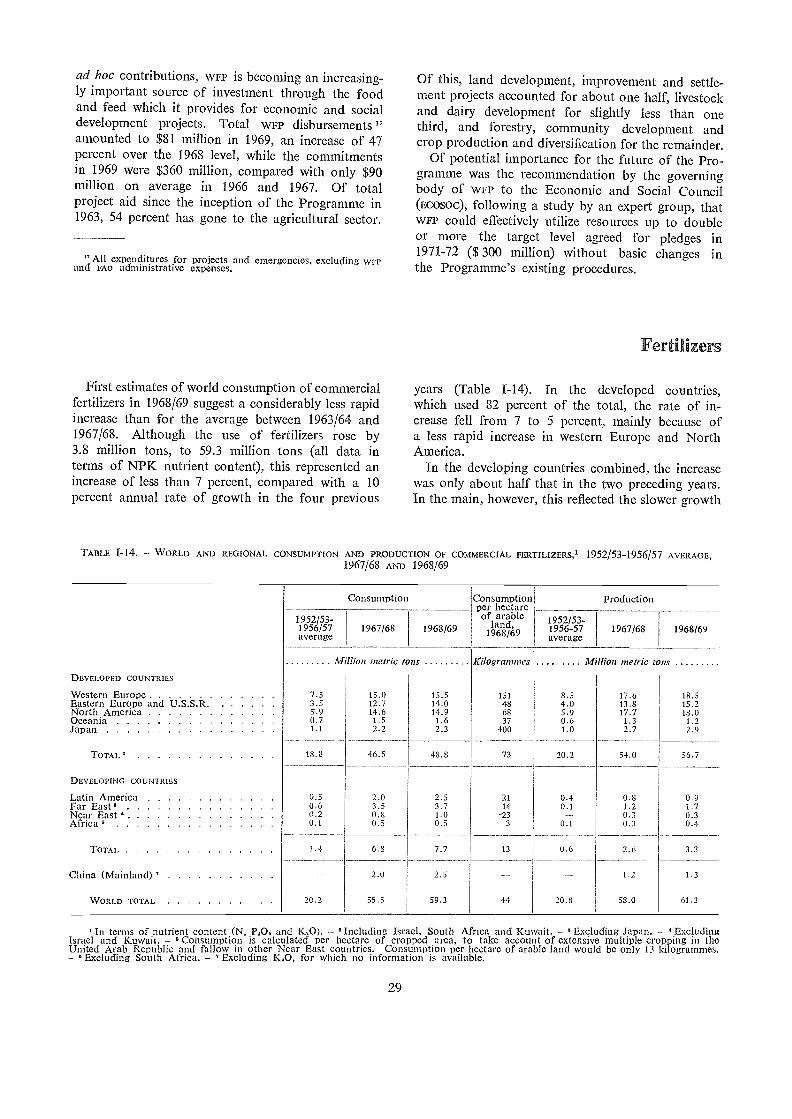
ad hoc contributions, WFP is becoming an increasing-ly important source of investment through the foodand feed which it provides for economic and socialdevelopment projects. Total WFP disbursementsamounted to $81 million in 1969, an increase of 47percent over the 1968 level, while the commitmentsin 1969 were $360 million, compared with only $90million on average in 1966 and 1967. Of totalproject aid since the inception of the Programme in1963, 54 percent has gone to the agricultural sector.
All expenditures for projects and emergencies. excluding WFPand FAO administrative expenses.
First estimates of world consumption of commercialfertilizers in 1968/69 suggest a considerably less rapidincrease than for the average between 1963/64 and1967/68. Although the use of fertilizers rose by3.8 million tons, to 59.3 million tons (all data interms of NPK nutrient content), this represented anincrease of less than 7 percent, compared with a 10percent annual rate of growth in the four previous
TABLE I-14. - WORLD AND REGIONAL CONSUMPTION AND PRODUCTION OF COMMERCIAL FERTILIZERS,1 1952/53-1956/57 AVERAGE,1967/68 AND 1968/69
1952/53-1956/57average_
Consumption
1967/68 1968/69
29
Of this, land development, improvement and settle-ment projects accounted for about one half, livestockand dairy development for slightly less than onethird, and forestry, community development andcrop production and diversification for the remainder.
Of poterttial importance for the future of the Pro-gramme was the recommendation by the governingbody of WFP to the Economic and Social Council(Ecosoc), following a study by an expert group, thatWFP could effectively utilize resources up to doubleor more the target level agreed for pledges in1971-72 ($ 300 million) without basic changes inthe Programme's existing procedures.
years (Table T-14). In the developed countries,which used 82 percent of the total, the rate of in-crease fell from 7 to 5 percent, mainly because ofa less rapid increase in western Europe and NorthAmerica.
In the developing countries combined, the increasewas only about half that in the two preceding years.In the main, however, this reflected the slower growth
M Won metric tons
Consumptionper hectareof arable
land.1968/69
Kilogrammes
1952/53-1956-57average
Production
1967/68
Fertilizers
1968/69
Million metric tons
In terms of nutrient content (N. P..:05 and K.0). - 'Including Israel, South Africa and Kuwait. - Excluding Japan. - ExcludingIsrael and Kuwait. - 'Consumption is calculated per hectare of cropped arca, to take account of extensive multiple cropping in theUnited Arab Republic and fallow in other Near East countries. Consumption per hectare of arable land would be only 13 kilogrammes.- ' Excluding South Africa. -- T Excluding K,O, for which no information is available.
DEVELOPED COUNTRIES
Western Europe 7.5 15.0 15.5 151 8.5 17.6 18.5Eastern Europe and U.S.S.R. 3.5 12.7 14.0 48 4.0 13.8 15.2North America 5.9 14.6 14.9 68 5.9 17.7 18.0Oceania 0.7 1.5 1.6 37 0.6 1.3 1.2Japan 1.1 2.2 2.3 400 1.0 2.7 2.9
TOTAL 18.8 46.5 48.8 73 20.2 54.0 56.7
DEVELOPING COUNTRIES
Latin America 0.5 2.0 2.5 21 0.4 0.8 0.9Far East 0.6 3.5 3.7 14 0.1 1.2 1.7Near East (1.2 0.8 1.0 23 -- 0.3 0.3Africa 0.1 0.5 0.5 3 0.1 0.3 0.4
TOTA1 6.8 7.7 13 0.6 2.6 3.3
China (Mainland) 2.0 2.5 1.2 1.3
WORLD TOTAL 20.2 55.5 59.3 44 20.8 58.0 61.3
of offtake in India, thought to reflect the impositionof a 10 percent tax on fertilizers, poor weather insome areas of the country, and the relatively highlevel of fertilizer application already reached by largerfarmers using high-yielding cereal varieties. Theother developing countries combined more or lessmaintained or even accelerated their recent growthrates of fertilizer consumption, and 12 major develop-ing countries reported fertilizer consumption in 1968/1969 at 25 percent or more above the year before.These were, by region: Brazil and Cuba; Burma,Ceylon, Indonesia and Pakistan; Afghanistan, Cy-prus, Syria and Turkey; and Cameroon and Zambia.A number of these countries have special crop inten-.sification programmes or were carrying out large-scale fertilizer schemes.
World production of fertilizers rose in 1968/69by nearly 6 percent, to 61.3 million tons. Nitrogenoutput at 27.4 million tons, and that of potash at15.9 million tons, increased by nearly 9 and 5 per-cent respectively, while phosphate production at 18million tons rose by only 2 percent. The largestincrease in coinbined output is estimated for Europe,followed by Asia and the U.S.S.R. Over 90 percentof all fertilizers was produced in developed coun-tries, but output in developing countries grew nearly5 times as fast. In particular, the output of nitroge-nous fertilizers in developing countries increased bynearly 30 percent. Two thirds of the additionaloutput was produced in India and the Republic ofKorea, where large new plants have come on stream.The latter country has become an exporter of ni-trogenous fertilizers. Most of the increase in po-tash production was in Cariada. The small in-crease in phosphate offtake was accompanied by amarginal decline in world phosphate rock output.The principal areas where production of rock phos-phate was significantly reduced were the UnitedStates and Tunisia. Other rock phosphate-producingcountries either maintained or raised their produc-tion.
The volume of world trade in all fertilizers in1968/69 is estimated at more than 17 million tonsand represen.ts 29 percent of total world consumptioncompared with 31 percent in 1967/68. Europe,North America and Central America were the larg-est net exporters.
Consumption of nitrogen fertilizers rose about 9percent, to 26.8 million tons in 1968/69. The de-veloping countries increased their use from 5.9 to6.9 million and the developed countries from 18.5to 19.9 million tons. The shift to more concentratedmaterials continued, with the share of urea risingand that of ammonium sulphate and nitrate falling.Exports rose by more than 6 percent, to over6 million tons, owing to increased shipments fromwestern and eastern European countries and from
30
the United States. Although Japanese exportsfell from 1.05 to 0.92 million tons, Japan remain-ed the leading exporter, followed by the UnitedStates, the Federal Republic of Germany and theNeth.erlands. China (Mainland) remained the largestimporter of nitrogen fertilizer with 1.3 milliontons, followed by India with about 820 000 tons.Other large importers were the United States withover 330 000 tons, Pakistan with about 225 000,Indonesia with 205 000 and Turkey with almost200 000 tons.
The consumption of both phosphate and potashincreased by about 5 percent to 17.8 million and11.9 million tons, respectively. The largest increasein phosphate consumption took place in Latin Amer-ica, by over 15 percent to 780 000 tons. ExcludingJapan, the use of phosphate fell in Asia and theFar East and showed only small gains in otherregions.
For various reasons, the fertilizer industry inEurope, North America and Japan has recentlybeen going through one of its worst periods. 'Duringthe 1960s massive investments were made in nevplants to expand production. Forecasts for effec-tive deman.d turned out to be overoptimistic, how-ever, with the result of overproduction, increasedstocks and depressed prices. Prospects for 1970 arenot too bright, but an improvement in the industry'sposition is expected in the future. Consumption indeveloping countries is rising, and as it is unlikelythat any significant investment in new plant will bemade in the developed regions in the near future,the period of overproduction should soon come toan. end.
The indicative World Plan for Agricultural De-velopment (iwP) proposes fast rates of growth forfertilizers, particularly in the period up to 1975,when an overall annual rate of increase of 14.3percent is envisaged. This compares with an averageof 12.7 percent in the study countries in the recentpast, under the impact of favourable changes infertilizer/product price ratios, the wider use of fer-tilizer-responsive varieties of cereals, and positiveaction by governments to make fertilizer available.Some developing countries have reached annual in-creases of 25 percent. Under 1WP, the total value ofthe fertilizer used would rise from $664 million in1962 to $7 800 million in 1985, comprising 45 per-cent of the total value of all current inputs in thatyear. The increase proposed by iwr would resultin a world average use of 60 kilogrammes per hect-are by 1985, compared with 44 in 1968/69. Eventhis would be well below levels currently achievedin the agriculturally more advanced countries (seeTable I-14), and considerable scope remains both forincreasing the area fertilized and levels of use perhectare.
Table I-15 summarizes the results of the mostrecent medium-term forecast of production, consump-tion and net trade in cereals in 15 selected develop-ing countries and 1 country grouping." As explain-ed in The state of food and agriculture 1969, medium-term forecasts for wheat, coarse grains and rice havebeen prepared on an experimental basis since 1967.Following the decision of the fifteenth session ofthe FAO Conference in November 1969 to continuethe project on a regular basis, the number of coun-tries for which forecasts of production, utilizationand net trade are made has been expanded, and itis hoped to broaden country coverage further infuture years, subject to the availability of informationand resources.
The countries included in Table I-15 account for al-most 60 percent of the cereals produced in develop-ing regions, and 65 percent of their combined cerealimports. Regional coverage is uneven, however,ranging from almost 80 percent of production and90 percent of net imports in the case of the FarEast, to only 14 percent of regional production and27 percent of net imports for developing Africa.
These medium-term forecasts should be viewedwithin the longer term setting of the world cerealsmarket outlook. The broad forward trends overthe next 15 years as suggested by FAO'S recent stud-ies, particularly the Indicative World Plan for Agri-cultural Development, were outlined in The stateof food and agriculture 1969. Very briefly, theypoint toward an increasing degree of self-sufficiencyin cereals among developing countries. The emer-gence of more developing countries as net exportersseems possible, although a considerable numberappear certain to remain in a heavy deficit position.According to these studies, the overall prospect forthe world cereal trade would be one of ample sup-plies and competitive markets, which would implythe need for a serious reassessment and adjustmentof the export and production policies in many devel-oped and developing countries.
The evidence on recent performance and the fore-casts for 1973 presented in Table I-15 are broadlyin line with these longer range expectations. Themain cereal trading countries of the Far East showan impressive overall growth in their aggregate ce-real production and consumption, as well as a lessen-ing reliance on food-grain imports. This trend isexpected to continue over the next few years. Inthe Near East, also, the selected countries havemoved closer to self-sufficiency since the mid-1960s,
"Central American republics, that is, Costa Rica, El Salvador,Guatemala, Honduras and Nicaragua.
31
MecIliniu,4erm for7cL cereals
and their imports have declined. In Latin Americaand Africa on the contrary, the progress of cerealproduction has not been sufficient to meet the risingrequirements in the countries under review, andtheir net imports were marginally bigger in 1969than in 1964-66.
For individual countries, only tentative conclu-sions should be drawn from the production figuresof a single year like 1969, as varying weather condi-tions frequently result in exceptionally good or poorharvests. But the probable error is much reducedwhen the results are aggregated. It therefore appearshighly significant that, for all the 14 importing coun-tries combined, aggregate cereal production in 1969was 24 percent above the 1964-66 average. Thismade it possible for them to reduce their combinednet imports by 25 percent, despite an 18 percent in-crease in apparent domestic consumption.
Looking forward to 1973, none of the selectedcountries that were net importers in 1969 is ex-pected to become a net exporter durin.g this period.India is, however, predicted to be virtually self-sufficient by 1973. Brazil is also expected to improveits overall cereal self-sufficiency, with exports ofmaize and some rice largely offsetting the continuingsubstantial import requirements of wheat; the coun-try's net import requirements of all cereals are fore-cast to decline to about 3 percent of total cerealconsumption. Among the other countries whose netimports are expected to decline are Ceylon, West Ma-laysia, Senegal and the United Arab Republic. Allthe same, they will continue to rely on the worldmarket for a considerable share of their requirements,ranging from 13 percen.t in the United Arab Republicto 36 percent in Ceylon. Little change is seen overthe medium term in the net imports of Pakistan inabsolute terms, but its self-sufficiency in cereals mayrise to about 95 percent by 1973. Countries whererising net imports are indicated include Chile, theRepublic of Korea and Morocco, which seem likelyto depend ort imports for between 12 and 16 percentof their total domestic cereal requirements in 1973.
For the net importing countries combined, fore-casts suggest a fall in net imports of all cereals to8 million tons. This would be 4 million tons be-low the 1969 volume, and less than half the averagefor 1964-66. The most pronounced fall is expectediii net imports of wheat by about 2 million tonseven though lower purchases by India, Brazil andChile will be partly offset by the larger requirementsof other countries such as the Republic of Korea,Morocco and the United Arab Republic. Rice im-ports are expected to decline by almost 1 milliontons, mostly because of the smaller requirements of
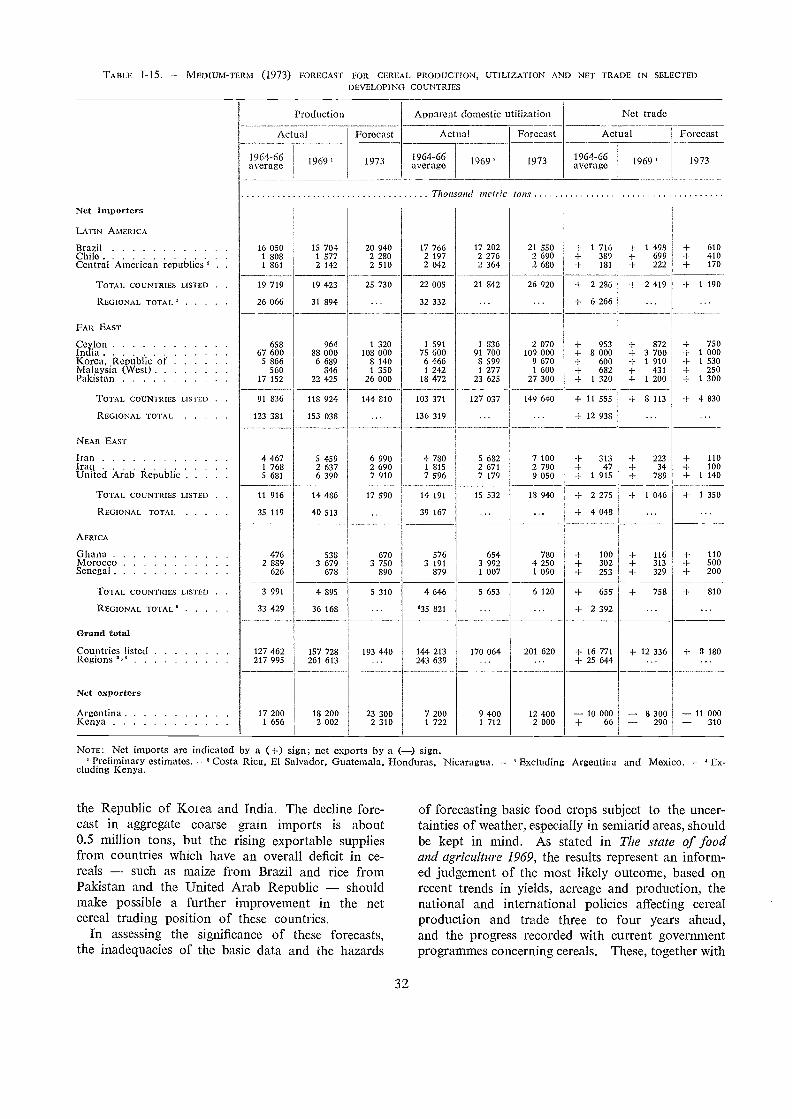
TABLE I-15. - MEDIUM-TERM (1973) FORECAST FOR CEREAL PRODUCTION, UTILIZATION AND NET TRADE IN SELECTEDDE,VELOPING COUNTRIES
BrazilChileCentral American republics' .
TOTAL COUNTRIES LISTED . .
REGIONAL TOTAL
FAR EAST
CeylonIndiaKorea, Republic orMalaysia (West)Pakistan
TOTAL COUNTRIES LISTED .
REGIONAL TOTAL
NEAR EAST
IranIraqUnited Arab Republic
TOTAL COUNTRIES LISTED .
REGIONAL TOTAL
AFRICA
GhanaMoroccoSenegal
TOTAL COUNTRIES LISTED
REGIONAL TOTAL
Grand total
Countries listedRegions 2'4
Net exporters
ArgentinaKenya
1964-66average
Actual
Production
16 050 15 7041 808 1 5771 861 2 142
19 719 19 423
26 066 31 894
658 96467 600 88 0005 866 6 689
560 84617 152 22 425
91 836 118 924
123 381 153 038
4 467 5 4591 768 2.6375 681 6 390
11 916 14 486
35 119 40 513
476 5382 889 3 679
626 678
3 991 4 895
33 429 36 168
127 462 157 728217 995 261 613
17 200 18 2001 656 2 002
Forecast
20 9402 2802 510
25 730
1 320108 000
8 1401 350
26 000
144 810
6 9902 6907 910
17 590
6703 750
890
5 310
193 440
the Republic of Korea and India. The decline fore-cast in aggregate coarse grain imports is about0.5 million tons, but the rising exportable suppliesfrom countries which have an overall deficit in ce-reals such as maize from Brazil and rice fromPakistan and the United Arab Republic shouldmake possible a further improvement in the netcereal trading position of these countries.
In assessing the sigrtificance of these forecasts,the inadequacies of the basic data and the hazards
32
Apparent domestic utilization
17 7662 1972 042
1 59175 600
6 4661 242
18 472
4 7801 8157 596
5763 191
879
Actual
17 2022 2762 364
21 842
1 836 2 07091 700 109 0008 599 9 6701 277 1600
23 625 27 300
127 037 149 640
5 6822 6717 179
15 532
6543 9921 007
5 653
Forecast
1973
21 5502 6902 680
26 920
7 1002 7909 050
18 940
7804 2501 090
6 120
201 620
1964-66average
1 716389181
9538 000
-I- 600682
1 320
Actual
Net trade
1 498+ 699
222
+ 2 419
8723 7001 910
4311 200
8 113
-I- 313 + 22347 + 34
1 915 + 789
2 275 + 1 046
4 048
100 + 116302 + 313
-I- 253 + 329
655 + 758
+ 2 392
16 771 + 12 33625 644
10 000 8 30066 290
Forecast
610410170
1 190
7501 000
-F 1 530250
1 300
4 830
110100
1 140
-I- 1 350
110-I- 500
200
810
8 180
-- 11 000310
NOTE: Net imports are indicated by a (-I-) sign; net exports by a () sign.Preliminary estimates. - 2Costa Rica, El Salvador, Guatemala, Honduras, Nicaragua. - ' Excluding Argentina and Mexico. - ' Ex-
cluding Kenya.
of forecasting basic food crops subject to the uncer-tainties of weather, especially in semiarid areas, shouldbe kept in mind. As stated in The suite of foodand agriculture 1969, the results represent an inform-ed judgement of the most likely outcome, based onrecent trends in yields, acreage and production, thenational and international policies affecting cerealproduction and trade three to four years ahead,and the progress recorded with current governmentprogrammes concerning cereals. These, together with
Thou Told metric tons
Net importers
LATIN AMERICA
average1964-66 19691969 1973 1969 1973
22 005
32 332
103 371
136 319
14 191
39 167
4 646
95 821
144 213243 639
170 064
23 3002 310
7 2001 722
9 4001 712
12 4002 000
2 286
6 266
-I- 11 555
12 938
the growth of demand, are the factors which willlargely determine the size of the cereal output andtrade performance during the forecast period. Themargin of uncertainty, particularly where net traderepresents a small share of total supplies, is illustrat-ed by the revised forecast for Pakistan. Whereaslast year it was stated that "by 1972 Pakistan mayalready emerge as a net exporter," " the currentforecast is for net imports of more than 1 milliontons (about 5 percent of total consumption) in 1973.The main cause for this reassessment is the shortfallnow expected in the production of both rice in EastPalcistan and wheat in West Pakistan in 1970, relativeto the targets under the country's Food Self-Suf-ficiency Programme, due to the insufficient avail-ability of fertilizers, and other difficulties.
Of major weight in the overall picture is India,which in 1969 accounted for 56 percent of the totalcereal production of the countries covered by thesurvey and for 30 percent of their combined net im-ports. While progress in the adoption of high-yieldingvarieties and the associated techniques has been veryrapid in wheat, the advance in rice which is byfar the larger food crop has been rather slowerfor reasons discussed elsewhere in this report. Thefuture progress of India's cereal production dependsvery largely on the extent to which impediments tothe spread of high-yielding varieties of rice can beovercome. Though the targets for fertilizer consump-tion spelled out in the fourth plan may not bereached, some of the other problems for instanceas regards palatability of rice, and its disease resis-tance are reported to be well on the way to beingsolved. On these grounds, India is expected tobecome virtually self-sufficient by 1973, with totalcereal production reaching 108 million tons. TheGovernment of India has recently reaffirmed itspolicy objective of stopping all concessional importsafter 1971. These currently account for five sixthsof its total cereal imports.
For the other selected countries, the results of thisyear's medium-term forecast confirm some of theremaining reasons for caution as regards the success
In The state of food and agricultura 1969. The report wenton. however, to point out that " the forecast exportable margin[in 19721 is small in relation to the total anticipated consumptionand output. and could thus be either wiped out or increased sub-stantially by deviations in the forecast in either utilization or pro-duction." (D. 32).
33
and currently foreseen impact of the "green revolu-tion," given the rapid growth of demand and the vari-ous constraints on the adoption of the new technol-ogy. Aside from the revision of the forecast forPakistan, this is illustrated by the fact that a furtherincrease is foreseen in the net imports of cereals intothe United Arab Republic despite a relatively rap-id growth of output.
Of particular significance are the trade forecastsfor West Malaysia and Ceylon not because ofthe amounts involved, which are small relative tototal trade in cereals, but because of the traditionallylow self-sufficiency ratio with regard to cereals inthese two countries. Both of them are historicallyplantation economies based on large-scale food im-ports and exports of estate products. With limit-ed prospects for their main exports relative to theimport needs, higher rates of cereal self-sufficiencyhave become a major policy goal, and both countrieshave shown considerable success in moving towardit. As late as in 1964-66, imports still accountedfor two thirds of the total cereal supplies of Ceylon,and for half of those of West Malaysia. Thanksto well-supported programmes for raising yieldsand output, by 1969 this ratio had fallen to aboutone half in Ceylon and about one third in WestMalaysia. Further reductions, to 36 percent and16 percent respectively, are forecast by 1973. Astotal requireinents are progressively growing, how-ever, the fall in import requirements in absoluteterms is more modest.
Finally, Kenya stands out as an example of adeveloping country which, after having achieved thegoal of self-sufficiency in cereals, is experiencing dif-ficulties like Mexico in disposing of its excessproduction. This particularly applies to wheat, thef.o.b. price of which is high relative to prevailingworld market prices. No significant increase inwheat or maize exports is in fact forecast, since muchof Kenya's additional output (consisting mainly ofmaize) is expected to be used domestically as animalfeed and for industrial uses.
Some increase in exports is foreseen for Argentina,the major grain exporter among the developingcountries; this increase is expected to occur mainlyin shipments of coarse grains for which export pros-pects are more promising than for wheat.

The combined real gross domestic product (GDP)of the countries of the European Economic Com-munity (EEC) and the rest of northwestern Europerose in 1969 by 6 percent. This was well abovethe increase in 1968, and even in the five countrieswhere economic growth slowed down Ireland,Italy, the Netherlands, Norway and the UnitedKingdom the increase was generally (except inthe United Kingdom) equal to or greater than thelonger term trend of about 4 percent a year overthe period 1953-67.
Two factors were mainly responsible for this ac-celeration: a large expartsion in capital investmentand much larger exports. Trade within the region,in particular, showed a rapid increase, with an ex-pansion of some 20 percent among all Europeancountries an.d about 30 percent among the EECcountries. There was also a significant rise in pri-vate consumption expenditure. The principal factorsholding back growth in the five countries just men-tioned were deflationary policies, especially in theUnited Kingdom and Ireland, and labour unrest(in Italy) as well as poor harvests or fishing in theNetherlands and Norway. Virtually everywhere themore rapid economic growth was associated withinflationary pressures in 1969, with the consumerprice indices of eight countries showing increases ofover 4 percent.
Economic growth in the countries of southernEurope, with the exception of Portugal, recoveredin 1969 from the 1968 slowdown. Here, too, animportant factor was export growth, which sustainedindustrial expansion, but a significant confribu-tion was also made by the recovery of agricul-ture over its virtual stagnation in 1968. In con-trast, a decline in agriculture held back growth inPortugal.
Indicators for 1970 generally suggest some slow-down in overall economic growth in the region,though less than had been anticipated earlier. Fac-tors contributing to the slowdown include pressureon productive capacity, including labour supply, re-duced investment growth in some countries, aiad do-mestic policies to control the inflation evident in mostcountries, which will hold back the growth of pri-vate consumption. Overall, gross domestic product
35
growth is anticipated to fall within the range of 5to 6 percent in real terms, and to remain for mostcountries around the longer term trend level.
Agricultural production
Within the overall picture of stable agriculturaloutput, there were widely varying results amongindividual countries (Table IT-1). Substantial gainsin production were recorded in Finland, Greece andYugoslavia; at the other extreme there were sizabledecreases in output in Norway, Portugal and Sweden.
The problem of the surplus production of keycommodities cereals, sugar and dairy products
persisted. The total output of cereals in theregion increased slightly, with larger crops record-ed in Austria, Greece and Yugoslavia. In the EECcountries production remained at about the 1968level except for Belgium, where production droppedabout 7 percent from 1968. The increase was,however, entirely accounted for by coarse grains,the output of which rose by 4 percent, reflectinglarger harvests of maize and barley. The wheatcrop fell by some 3 percent in EEC, and more sharplyin Portugal and especially Spain, though the qualitywas better on the average, with hard wheat produc-tion increasing and soft wheat production declining.
The total production of sugar beet in the regionremained at about the 1968 level, but the favourableautumn weather resulted in a high sugar content,and sugar production rose by about S percent. Par-ticularly large increases were recorded in the Beneluxcountries, France, Greece and Yugoslavia, whichwere only partially offset by declines in some north-ern countries.
For the other important crops potatoes, fruitan.d vegetables production fell, or increased onlymoderately. In northwestern countries the potatocrop fell substantially, particularly in Austria andthe Federal Republic of Germany, mainly due tothe low profitability of potato cultivation in recentyears. In the EEC countries production declinedby 12 percent to its lowest level in 20 years, resultingin record price levels.
Fresh fruit production rose only fractionally inEEC, while in southern Europe the citrus harvest
Ch REVI 5.1( REGIONS
Western Europe
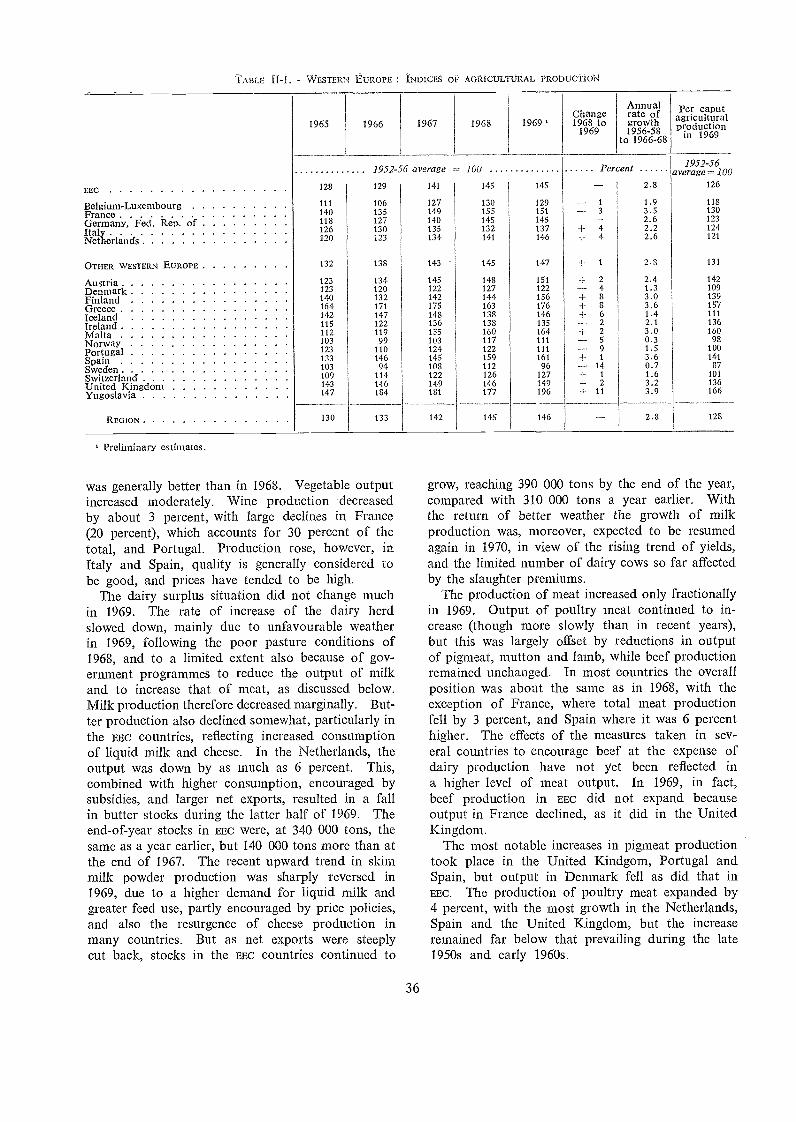
Preliminary estimates.
TABLE I -1. - WESTERN I.',UROPE : INDICES Or AGRICOLTIIRAL 1,RODUCTION
was generally better than in 1968. Vegetable outputincreased moderately. Wine production decreasedby about 3 percent, with large declines in France(20 percent), which accounts for 30 percent of thetotal, and Portugal. Production rose, however, inItaly and Spain, quality is generally considered tobe good, and prices have tended to be high.
The dairy surplus situation did not change muchin 1969. The rate of increase of the dairy herdslowed down, mainly due to unfavourable weatherin 1969, following the poor pasture conditions of1968, and to a limited extent also because of gov-ernment programmes to reduce the output of milkand to increase that of meat, as discussed below.Milk production therefore decreased marginally. But-ter production also declined somewhat, particularly inthe EEC countries, reflecting increased consumptionof liquid milk and cheese. In the Netherlands, theoutput was down by as much as 6 percent. This,combined with higher consumption, encouraged bysubsidies, and larger net exports, resulted in a fallin butter stocks during the latter half of 1969. Theend-of-year stocks in EEC were, at 340 000 tons, thesame as a year earlier, but 140 000 tons more than atthe end of 1967. The recent upward trend in skimmilk powder production was sharply reversed in1969, due to a higher demand for liquid milk andgreater feed use, partly encouraged by price policies,and also the resurgence of cheese production inmany countries. But as net exports were steeplycut back, stocks in the EEC countries continued to
1967 1968
1952-56 average 100
36
1969Change1968 to
1969
Per eta
Annualrate ofgrowth19 56-5 8
to 1966-68
Per caputagriculturalproduction
in 1969
1952-56average = 100
grow, reaching 390 000 tons by the end of the year,compared with 310 000 tons a year earlier. Withthe return of better weather the growth of milkproduction was, moreover, expected to be resumedagain in 1970, in view of the rising trend of yields,and the limited number of dairy cows so far affectedby the slaughter premiums.
The production of meat increased only fractionallyin 1969. Output of poultry meat continued to in-crease (though more slowly than in recent years),but this was largely offset by reductions in outputof pigmeat, mutton and lamb, while beef productionremained unchanged. In most countries the overallposition was about the same as in 1968, with theexception of France, where total meat productionfell by 3 percent, and Spain where it was 6 percenthigher. The effects of the measures taken in sev-eral countries to encourage beef at the expense ofdairy production have not yet been reflected ina higher level of meat output. In 1969, in fact,beef production in EEC did not expand becauseoutput in France declined, as it did in the UnitedKingdom.
The most notable increases in pigmeat productiontook place in the United Kindgom, Portugal andSpain, but output in Denmark fell as did that inEEC. The production of poultry meat expanded by4 percent, with the most growth in the Netherlands,Spain and the United Kingdom, but the increaseremained far below that prevailing during the late1950s and early 1960s.
EEC
Belgium-LuxembourgFranceGermany, Fed. Rep. ofItalYNetherlands
128
111140118126120
129
106135127130123
141
127149140135134
145
130155145132141
145
129151145137146
3+ 4+ 4
2.8
1.93.52.62.22.6
126
118130123124121
OTHER WESTERN EuROPE 132 138 143 145 147 -I- 1 2.3 131
AustriaDenmarkFinlandGreeceIcelandIrelandMaltaNorwayPortugalSpainSwedenSwitzerlandUnited KingdomYugoslavia
123123140164142115112103123133103109143147
13412013217114712211999
11014694
114146184
145122142175148136135103124145108122149181
148127144163138138160117122159112126146177
15112215617614613516411111116196
127149196
+ 24+-I- 8-I- 62+ 259-I- 1
14-F 1
-1- 2+ 11
2.41.33.03.61.42.13.00.31.53.60.71.63.23.9
142109139157111136160
98100141
87101136166
REGION 130 133 142 145 146 2.3 128
1965 1966
The first estimates for 1970 suggest another yearof stable overall output. Among the major produc-ing countries little or no increase is estimated tohave taken place in Denmark, France, the FederalRepublic of Germany, Italy and Spain. In theNetherlands, production rose again substantially, andin Sweden it showed a partial recovery following thesteep reduction in 1969. Output in Finland con-tinued to rise, although less rapidly than the yearbefore. The largest decrease, possibly by some 10percent, is estimated to have taken place in Yugo-slavia, from the high record level reached the yearbefore.
Among the principal commodities, the productionof wheat is estimated to have declined by some 5percent, the second successive decrease. There wereparticularly large decreases in France, Spain andYugoslavia, but the crop was also smaller in theFederal Republic of Germany, while in the UnitedKingdom it was up by nearly a fifth. The produc-tion of feed grains fell also ; maize production wasup again, by some 4 percent, with large increasesin France and Italy more than offsetting smallercrops in Yugoslavia and Spain; but barley produc-tion fell by some 7 percent, with smaller crops inFrance, Germany, Spain and the United Kingdom.Rice production remained unchanged at the 1969level, reflecting mainly the stable output in Italy.
Among other major products, there were fraction-al decreases in the harvest of sugar beets, mainlyreflecting smaller crops in France and Belgium, andin the production of milk, again particularly in Franceand to a lesser extent in Denmark and Finland. Milkoutput in most other countries increased somewhat.The potato crop showed only a partial recoveryfrom last year's poor results; in particular, both theFrench and German crops remained virtually un-changed at the 1969 level. The production of oliveoil is estimated to have risen by nearly 10 percent,thus more than recovering the previous year's slightsetback, despite a smaller output in Italy. Outputof all major meats is estimated to have increased in1970. Beef production, which in 1969 had remain-ed unchanged, expanded in all principal produc-ing countries except France, and the total for theregion is estimated to have increased by about 5percent. Poultry production showed a similar andwidespread increase, and that of pigmeat is estimat-ed to have risen by some 2 percent.
Fishery production
With the exception of Iceland and the UnitedKingdom, the countries of western Europe caughtless fish in 1969 and total production was down byabout 7 percent.
37
Improvements in the fisheries for groundfish, shrimpand other high-priced products boosted the value ofthe Icelandic catch by nearly one quarter. Herringlandings, on the other land, continued to declineand the fish-meal industry experienced serious sup-ply problems which were only partially solved byincreased landings of capelin. The scarcity of her-ring encouraged a shift in its utilization from a rawmaterial for the reduction industry to salting or saleas fresh herring. The United Kingdom was ableto catch more herring and, together with slightlyhigher prices for cod, the principal product of thegroundfish fishery, this largely accounted for the risein the volume of the country's fish production.
The Norwegian fishery industry had a better yearthan in 1968, despite a 14 percent reduction in catch.The value increased ; higher value varieties account-ed for a larger proportion of the catch, prices ofsome species were up, and more fish were processedinto more valuable products. Record mackerel andgood capelin catches were, however, unable to com-pen.sate for a further drastic decline in that of her-ring, and fish-meal production was one fifth belowthe 1968 figure.
Similar developments took place in Denmark, whereresults in the herring fishery were disappointing andwhere there were also smaller catches of some spe-cies used primarily for human consumption.
The decrease in landings of the Spanish fishingfleet was attributed mainly to curtailment of freezership and cod fishing operations. Demand for cod andhake was weak, prompting some boats to fish forother species. These developments notwithstand-ing, the total catch value was slightly up because oflarger landings of higher priced products by thecoastal and near water fleets. Amon.g processedproducts there was a drop in the output of saltedand canned products.
Portugal experienced a reduction in both the volumeand value of its catches, which have been adverselyaffected by the scarcity of sardines off the westerncoast of the Iberian peninsula. To ensure adequatesupplies for the canning industry, Portugal is tryingto charter freezer trawlers from Spain for fishingin more distant waters. Rising prices and costsare also affecting the sardine industry by reducingits competitive strength in international markets.
In the EEC countries fish production on the wholechanged very little from the preceding year. Land-ings were slightly lower but higher prices for manyproducts kept catch values up. In France largerproduction and higher prices of shellfish made upfor the reduced production of salted and frozen. cod.The economic situation of the fishery industry ofthe Federal Republic of Germany continued to im-prove as the result of structural changes and rationali-zation of operations, although volume and value
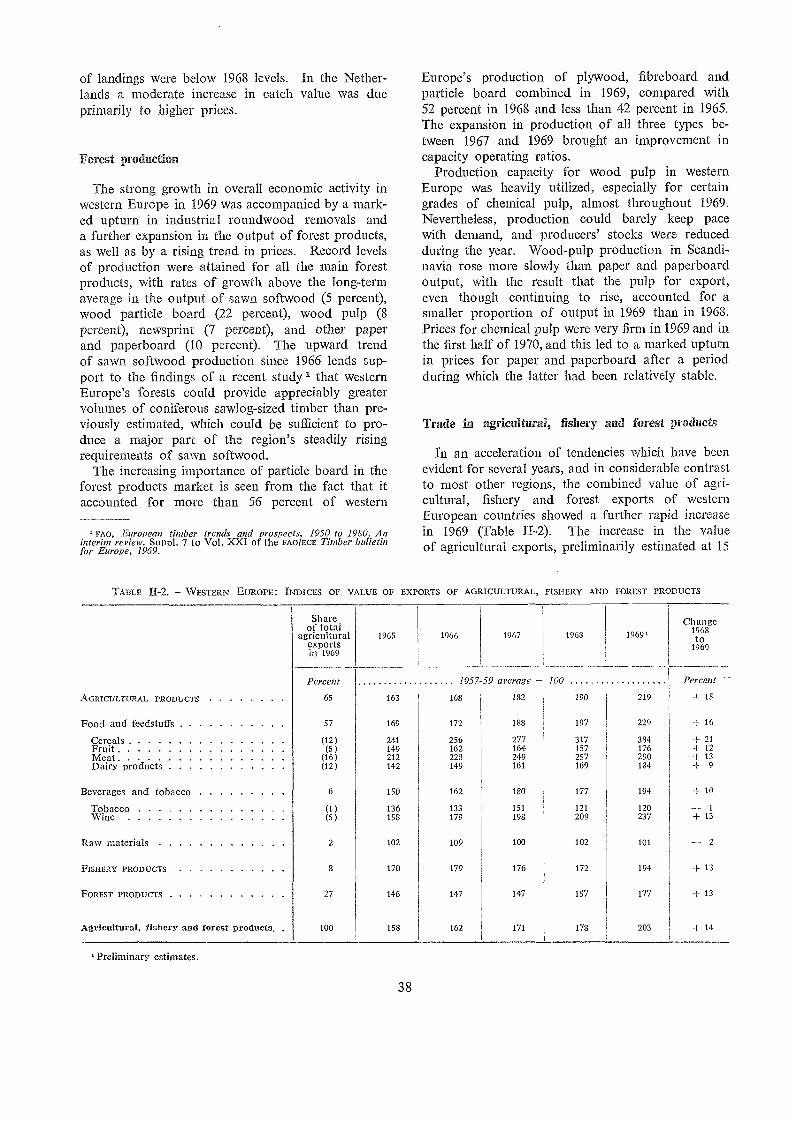
of landings were below 1968 levels. In the Nether-lands a moderate increase in catch value was dueprimarily to higher prices.
Forest production
The strong growth in overall economic activity inwestern Europe in 1969 was accompanied by a mark-ed upturn in industrial roundwood removals anda further expansion in the output of forest products,as well as by a rising trend in prices. Record levelsof production were attained for all the main forestproducts, with rates of growth above the long-termaverage in the output of sawn softwood (5 percent),wood particle board (22 percent), wood pulp (8percent), newsprint (7 percent), and other paperand paperboard (10 percent). The upward trendof sawn softwood production since 1966 lends sup-port to the findings of a recent study 1 that westernEurope's forests could provide appreciably greatervolumes of coniferous sawlog-sized timber than pre-viously estimated, which could be sufficient to pro-duce a major part of the region's steadily risingrequirements of sawn softwood.
The increasing importance of particle board in theforest products market is seen from the fact that itaccounted for more than 56 percent of western
' FAO, European timber trends and prospects, 1950 to 1980. Aninterim review. Surml. 7 to Vol. XXI of the FAO/ECE Timber bulletinfor Europe, 1969.
TABLE II-2. WESTERN EUROPE: INDICES OF VALUE OF EXPORTS OF AGRICULTURAL, FISHERY AND FOREST PRODUCTS
Preliminary estimates,
Shareof total
agriculturalexportsin 1969
Percent
1965
Europe's production of plywood, fibreboard andparticle board combined in 1969, compared with52 percent in 1968 and less than 42 percent in 1965.The expansion in production of all three types be-tween 1967 and 1969 brought an improvemen.t incapacity operating ratios.
Production capacity for wood pulp in westernEurope was heavily utilized, especially for certaingrades of chemical pulp, almost throughout 1969.Nevertheless, production could barely keep pacewith demand, and producers' stocks were reducedduring the year. Wood-pulp production in Scandi-navia rose more slowly than paper and paperboardoutput, with the result that the pulp for export,even though continuing to rise, accounted for asmaller proportion of output in 1969 than in 1968.Prices for chemical pulp were very firm in 1969 and inthe first half of 1970, and this led to a marked upturnin prices for paper and paperboard after a periodduring which the latter had been relatively stable.
Trade in agricuitural, fishery and forest products
in an acceleration of tendencies wh.ich have beenevident for several years, and in considerable contrastto most other regions, the combined value of agri-cultural, fishery and forest exports of westernEuropean countries showed a further rapid increasein 1969 (Table 11-2). The increase in the valueof agricultural exports, preliminarily estimated at 15
1966
1957-59 average 100
38
1967 1968 1969'Change
1968to
1969
-Percent
AG fit CULTURA L PRODUCTS 65 163 168 182 190 219 + 15
Food and fcedstuffs 57 169 172 188 197 229 + 16
Cereals (12) 241 256 277 317 384 + 21Fruit (5) 149 162 164 157 176 -I- 12Meat (16) 212 228 249 257 290 + 13Dairy products (12) 142 149 161 169 184 -I- 9
Beverages and tobacco 6 150 162 180 177 194 + 10
Tobacco (1) 136 133 151 121 120Wine (5) 158 179 198 209 237 + 13
Raw materials 2 102 109 100 102 101 -- 2
FISHERY PRODUCTS 170 179 176 172 194 + 13
FOREST PRODUCTS 27 146 147 147 157 177 + 13
Agricultural, fishery and forest products. 100 158 162 171 178 203 -I- 14
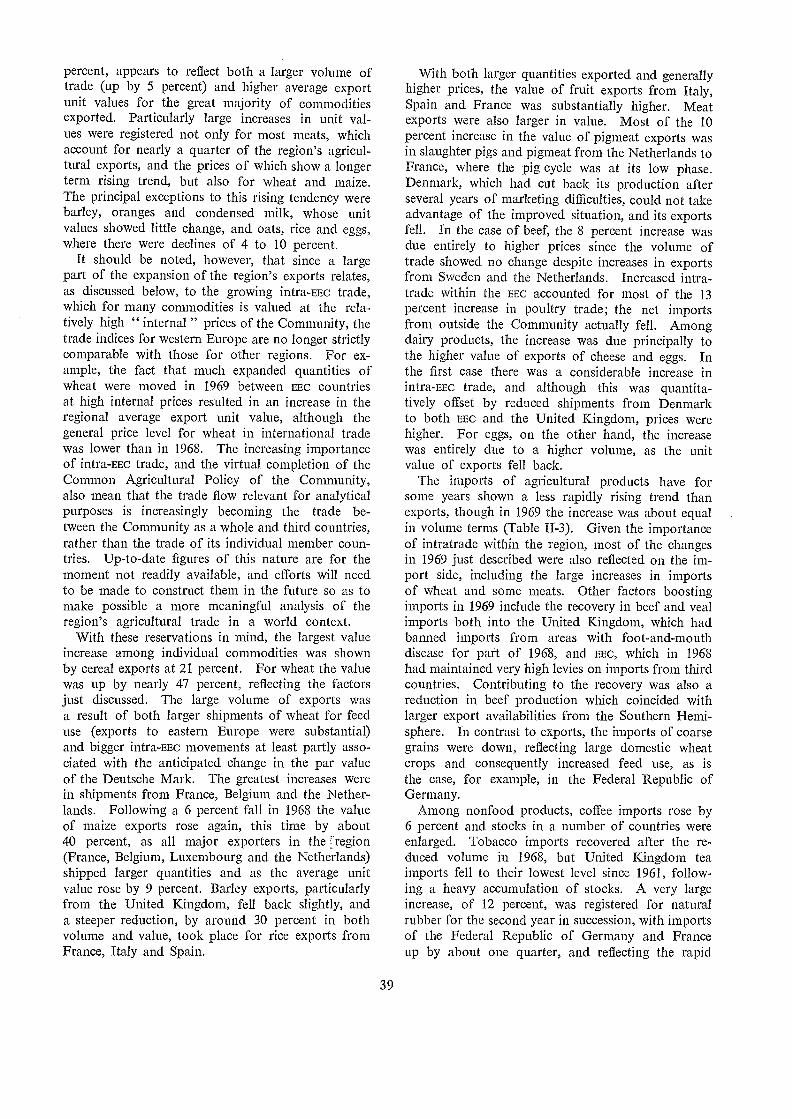
percent, appears to reflect both a larger volume oftrade (up by 5 percent) and higher average exportunit values for the great majority of commoditiesexported. Particularly large increases in unit val-ues were registered not only for most meats, whichaccount for nearly a quarter of the region's agricul-tural exports, and the prices of which show a longerterm rising trend, but also for wheat and maize.The principal exceptions to this rising tendency werebarley, oranges and condensed milk, whose unitvalues showed little change, and oats, rice and eggs,where there were declines of 4 to 10 percent.
It should be noted, however, that since a largepart of the expansion of the region's exports relates,as discussed below, to the growing intra-EEc trade,which for many commodities is valued at the rela-tively high " internal " prices of the Community, thetrade indices for western Europe are no longer strictlycomparable with those for other regions. For ex-ample, the fact that much expanded quantities ofwheat were moved in 1969 between EEC countriesat high internal prices resulted in an increase in theregional average export unit value, although thegeneral price level for wheat in international tradewas lower than in 1968. The increasing importanceof intra-EEc trade, and the virtual completion of theCommon Agricultural Policy of the Community,also mean that the trade flow relevant for analyticalpurposes is increasingly becoming the trade be-tween the Community as a whole and third countries,rather than the trade of its individual member coun-tries. Up-to-date figures of this nature are for themoment not readily available, and efforts will needto be made to construct them in the future so as tomake possible a more meaningful analysis of theregion's agricultural trade in a world context.
With these reservations in mind, the largest valueincrease among individual commodities was shownby cereal exports at 21 percent. For wheat the valuewas up by nearly 47 percent, reflecting the factorsjust discussed. The large volume of exports wasa result of both larger shipments of wheat for feeduse (exports to eastern Europe were substantial)and bigger intra-EEc movements at least partly asso-ciated with the anticipated change in the par valueof the Deutsche Mark. The greatest increases werein shipments from France, Belgium and the Nether-lands. Following a 6 percent fall in 1968 the valueof maize exports rose again, this time by about40 percent, as all major exporters in the ::region(France, Belgium, Luxembourg and the Netherlands)shipped larger quantities and as the average unitvalue rose by 9 percent. Barley exports, particularlyfrom the United Kingdom, fell back slightly, anda steeper reduction, by around 30 percent in bothvolume and value, took place for rice exports fromFrance, Italy and Spain.
39
With both larger quantities exported and generallyhigher prices, the value of fruit exports from Italy,Spain and France was substantially higher. Meatexports were also larger in value. Most of the 10percent increase in the value of pigmeat exports wasin slaughter pigs and pigmeat from the Netherlan.ds toFrance, where the pig cycle was at its low phase.Denmark, which had cut back its production afterseveral years of marketing difficulties, could not takeadvantage of the improved situation, and its exportsfell. In the case of beef, the 8 percent increase wasdue entirely to higher prices since the volume oftrade showed no change despite increases in exportsfrom Sweden and the Netherlands. Increased intra-trade within the EEC accounted for most of the 13percent increase in poultry trade; the net importsfrom outside the Community actually fell. Amongdairy products, the increase was due principally tothe higher value of exports of cheese and eggs. Inthe first case there was a considerable increase inintra-EEc trade, and although this was quantita-tively offset by reduced shipments from Denmarkto both EEC and the United Kingdom, prices werehigher. For eggs, on the other hand, the increasewas entirely due to a higher volume, as the unitvalue of exports fell back.
The imports of agricultural products have forsome years shown a less rapidly rising trend thanexports, though in 1969 the increase was about equalin volume terms (Table II-3). Given the importanceof intratrade within the region, most of the changesin 1969 just described were also reflected on the im-port side, including the large increases in importsof wheat and some meats. Other factors boostingimports in 1969 in.clude the recovery in beef and vealimports both into the United Kingdom, which hadbanned imports from areas with foot-and-mouthdisease for part of 1968, and EEC, which in 1968had maintained very high levies on imports from thirdcountries. Contributing to the recovery was also areduction in beef production which coincided withlarger export availabilities from the Southern Hemi-sphere. In contrast to exports, the imports of coarsegrains were down, reflecting large domestic wheatcrops and consequently increased feed use, as isthe case, for example, in the Federal Republic ofGermany.
Among nonfood products, coffee imports rose by6 percent and stocks in a number of countries wereenlarged. Tobacco imports recovered after the re-duced volume in 1968, but United Kingdom teaimports fell to their lowest level since 1961, follow-ing a heavy accumulation of stocks. A very largeincrease, of 12 percent, was registered for naturalrubber for the second year in succession, with importsof the Federal Republic of Germany and Franceup by about one quarter, and reflecting the rapid
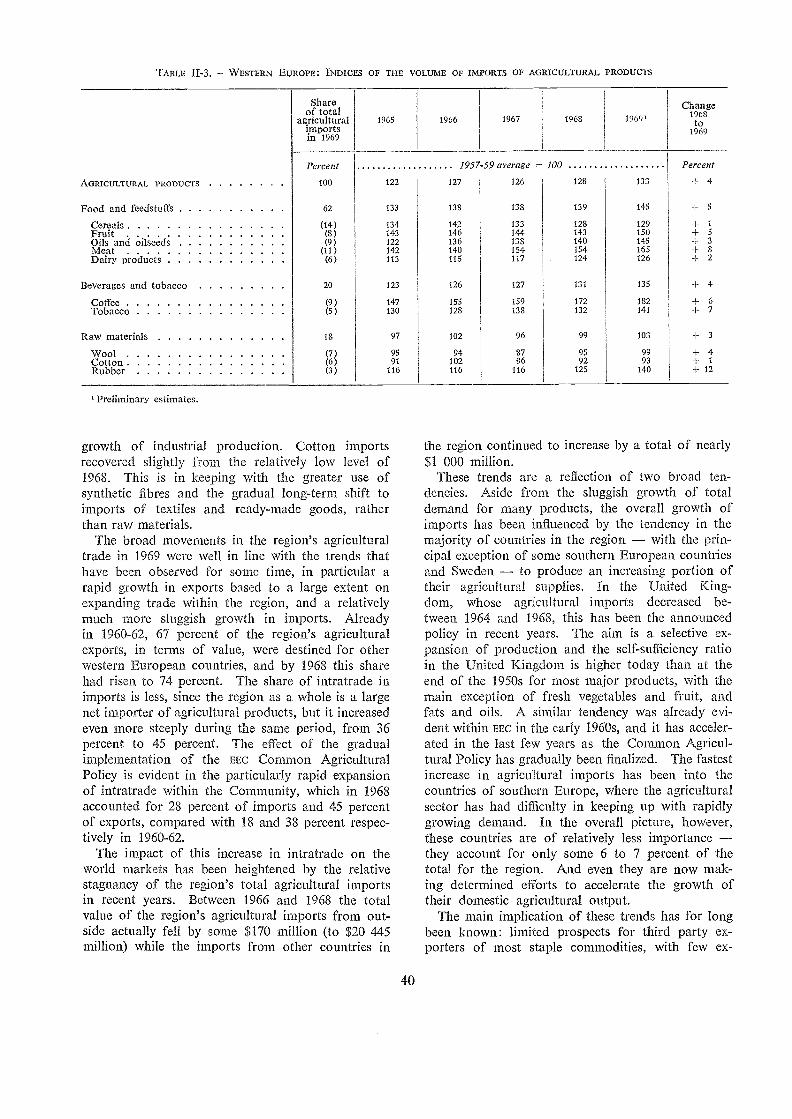
TA13LE 11-3. - WESTERN EUROPE: INDICES OF THE VOLUME OF IMPORTS OF AGRICULTURAL PRODUCTS
Shareof total
agriculturalimportsin 1969
Percent
growth of industrial production. Cotton importsrecovered slightly from the relatively low level of1968. This is in keeping with the greater use ofsynthetic fibres and the gradual long-term shift toimports of textiles and ready-made goods, ratherthan raw materials.
The broad movements in the region's agriculturaltrade in 1969 were well in line with the trends thathave been observed for some time, in particular arapid growth in exports based to a large extent onexpanding trade within the region, and a relativelymuch more sluggish growth in imports. Alreadyin 1960-62, 67 percent of the region's agriculturalexports, in terms of value, were destined for otherwestern European countries, and by 1968 this sharehad risen to 74 percent. The share of intratrade inimports is less, since the region as a whole is a largenet importer of agricultural products, but it increasedeven more steeply during the same period, from 36percent to 45 percent. The effect of the gradualimplementation of the EEC Common AgriculturalPolicy is evident in the particularly rapid expansionof intratrade within the Community, which in 1968accounted for 28 percent of imports and 45 percentof exports, compared with 18 and 38 percent respec-tively in 1960-62.
The impact of this increase in intratrade on theworld markets has been heightened by the relativestagnancy of the region's total agricultural importsin recent years. Between 1966 and 1968 the totalvalue of the region's agricultural imports from out-side actually fell by some $170 million. (to $20 445million) while the imports from other countries in
1957-59 average 100
40
Change1968to
1969
Percent
the region continued to increase by a total of nearly$1 000 million.
These trends are a reflection of two broad ten-dencies. Aside from the sluggish growth of totaldemand for many products, the overall growth ofimports has been influenced by the tendency in themajority of countries in the region with the prin-cipal exception of some southern European countriesand Sweden to produce an increasing portion oftheir agricultural supplies. In the United King-dom, whose agricultural imports decreased be-tween 1964 and 1968, this has been the announcedpolicy in recent years. The aim is a selective ex-pansion of production and the self-sufficiency ratioin the United Kingdom is higher today than at theend of the 1950s for most major products, with themain exception of fresh vegetables and fruit, andfats and oils. A similar tendency was already evi-dent within EEC in the early 1960s, and it has acceler-ated in the last fel,v years as the Common Agricul-tural Policy has gradually been finalized. The fastestincrease in agricultural imports has been into thecountries of southern Europe, where the agriculturalsector has had difficulty in keeping up with rapidlygrowing demand. In the overall picture, however,these countries are of relatively less importancethey account for only some 6 to 7 percent of thetotal for the region. And even they are now mak-ing determined efforts to accelerate the growth oftheir domestic agricultural output.
The main implication of these trends has for longbeen known: limited prospects for third party ex-porters of most staple commodities, with few ex-
AGRICuLTuRAL PRODucTs 100 122 127 126 128 133 -I- 4
Food and fcedstuffs 62 133 138 138 139 145 -I- 5
Cereals (14) 134 142 133 128 129 -I- 1
Fruit (8) 143 146 144 143 150 +5Oils and oilseeds (9) 122 136 138 140 145 3
Meat (11) 142 140 154 154 165 -1- 8
Dairy products (6) 113 115 117 124 126 -I- 2
Beverages and tobacco 20 123 126 127 131 135 + 4
Coffee (9) 147 155 159 172 182 +6Tobacco (5) 130 128 138 132 141 -I- 7
Raw materials 18 97 102 96 99 103 3
Wool (7) 95 94 87 95 99 + 4Cotton (6) 91 102 96 92 93 +1Rubber (3) 116 116 116 125 140 + 12
' Prelhninary estimates.
1965 1966 1967 1968 1969'

ceptions such as hard wheat, feed grains and beef.This trend may be further accentuated if the nego-tiations about to be started lead to an enlargementof EEC, since some of the candidate countries aremore efficient producers than certain of the presentmembers. On the other hand, the rapidly risingdemand for highly differentiated and sophisticatedprocessed products offers potential export opportu-nities for countries, both inside and outside theregion, which are capable of taking advantage ofthis demand.
The 13 percent increase in the value of fisheryexports was mainly the result of higher prices formost conunodities. Exports from Norway, Europe'sleading fishing country, increased both in volumeand value (the latter by over 7 percent), primarilybecause of a very substantial boost in shipments offrozen fish fillets. Denmark shipped less (in partbecause of a voluntary agreement entered into byCanada, Denmark, Norway and Iceland to maintainminimum prices for frozen cod block exports to theUnited States) but the total value of the country'sexports was nevertheless higher. Iceland's earningsfrom fisheries exports were also greater, with bothhigher prices and, assisted by devaluation in late 1968,a larger volume of exports of most items. The majorexception WaS the stockfish trade which remainedstagnant as a result of the loss of the Nigerian market.
Another country v,ihich succeeded in boosting thevolume and value of its fishery 'exports was Spain,despite a smaller total output. The largest gainswere achieved by exports of canned products andsalted fish, but also exports of frozen fish were signifi-cantly higher. In contrast, exports of the Portu-guese canned fish industry, which was adverselyaffected by the sardine raw material shortage, wasone fifth down from 1968.
The United Kingdom an.d the EEC countries, whichwith the exception of the Netherlands have an
import balance in their trade in fishery products,imported about the same or slightly reduced quanti-ties of fish. The import value, however, was up inall instances, because of higher prices.
Both exports and imports of forest products increas-ed quite rapidly in 1969, although for most categoriesthis reflected an expansion of trade within the region.There were, nevertheless, some striking changes inthe general pattern of trade.
A notable feature was the contrast between thestrong increase in the imports of most of the region,and the sharp decline in the imports of sawnwoodand panel products into the United Kingdom, wherecredit restrictions and high interest rates broughtabout a steep fall in dwelling construction. In thecase of sawn softwood, the region's total importswere barely higher in 1969 than 1968. Its exports,however, rose by 8 percent to a record level and net
41
imports, which reached a peak in 1965, declined tothe lowest level since 1962.
There were particularly striking increases in im-ports (except to the United Kingdom) of hardwoodlogs, chiefly from west Africa but also from the Philip-pines and Indonesia; of sawn hardwood, notablyfrom Malaysia and Singapore; and of plywood, partlyowing to higher intra-EEc trade but also because ofincreased imports from Finland and the UnitedStates.
The strong demand for chemical pulp in westernEuropean importing countries led to a further consid-erable increase in the region's net imports. Theseamounted to 1.4 million tons in 1969 compared withonly 250 000 tons as recently as 1965. The regionbecame increasingly dependent on North Americafor its additional supplies, despite an increase inproduction and trade of pulpwood within the re-gion.
Prices and agricultural imcomes
The movements of the principal price indicatorsrelated to the food and agricultural situation re-flected the generally more pronounced inflationarytendencies in the region. The increase in retailprices of food accelerated in all countries exceptDenmark, Finland and Spain. Both the pricesreceived and prices paid by farmers were higher in1969 in all the countries for which such indices arecalculated (Figure II-1), and particularly the pricesreceived tended to rise at a faster rate than in 1968,the only exceptions being Finland, Ireland and Spain.
In marked contrast to previous years, when in-creases in food prices tended to slow down andinvariably to be less than those in the overall costof living index, food prices in 1969 rose rapidlyin many countries (Austria, Belgium, Greece, Nor-way, Sweden, the United Kingdom and Yugoslavia),and in most cases faster than in the cost of livingindex as a whole.
Evidence available does not suggest that any gen-eralized factors were responsible for this shift. Alonger term market factor was the widespread in-crease in prices of all types of meat except poultry.Short-term market factors include the higher pricesof potatoes, following the small crop in a numberof countries, and also of vegetables and fruit in sev-eral countries. Other price changes were due togovernment policy measures, such as the introductionof a value-added tax in the Netherlands and Norway.In both countries price controls were introducedsubsequently in the course of the year or in early1970. In the United Kingdom, too, tax increaseswere largely responsible for a steep rise in consumerfood prices. In France the price increase reflected
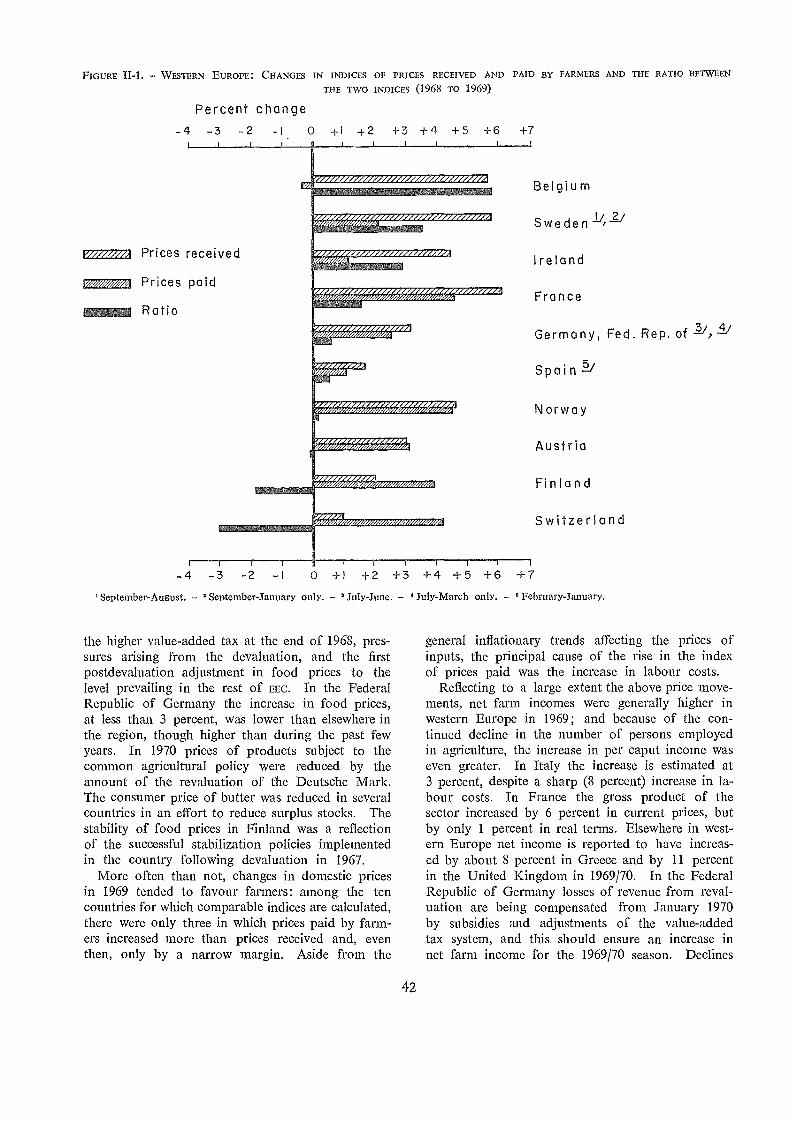
FIGURE II-1. - WESTERN EUROPE: CHANGES IN INDICES OF PRICES RECEIVED AND PAID BY FARMERS AND THE RATIO BETWEENTHE TWO INDICES (1968 TO 1969)
Percent change
[222= Prices received
fr// Prices paid
Ratio
-4 -3 -21
the higher value-added tax at the en.d of 1968, pres-sures arising from the devaluation, and the firstpostdevaluation adjustment in food prices to thelevel prevailing in the rest of EEC. In the FederalRepublic of Germany the increase in food prices,at less than 3 percent, was lower than elsewhere inthe region, though higher than during the past fewyears. In 1970 prices of products subject to thecommon agricultural policy were reduced by theamount of the revaluation of the Deutsche Mark.The consumer price of butter was reduced in severalcountries in an effort to reduce surplus stocks. Thestability of food prices in Finland was a reflectionof the successful stabilization policies implementedin the country following devaluation in 1967.
More often than not, changes in domestic pricesin 1969 tended to favour farmers: among the tencountries for which comparable indices are calculated,there were only three in which prices paid by farm-ers increased more than prices received and, eventhen, only by a narrow margin. Aside from the
-i O -hl +2 +3 +4 +5 +6 +7I I I
Arr,
rrowenr,Weer 60400
Arrf
%CIF 41', Are ZIAVorAFOW 47/
,firAWAIWAVAV "AO
V.001( #1' matoreoznin; mormsowow,
Aril=rfon
.471= 0.07.,
-4 -3 -2 -I 0 +1 +2 +3 +4 +5 +6 +7September-August. - September-January only. - July-June. - July-March only. - February-January.
42
Belgium
Sweden
Ireland
France
Germany, Fed. Rep, of
Spain .P-f
Norway
Austria
Finland
Switzerland
general inflationary trends affecting the prices ofinputs, the principal cause of the rise in the indexof prices paid was the increase in labour costs.
Reflecting to a large extent the above price move-ments, net farm incomes were generally higher inwestern Europe in 1969; and because of the con-tinued decline in the number of persons employedin agriculture, the increase in per caput income waseven greater. In Italy the increase is estimated at3 percent, despite a sharp (8 percent) increase in la-bour costs. In France the gross product of thesector increased by 6 percent in current prices, butby only 1 percent in real terms. Elsewhere in west-ern Europe net income is reported to have increas-ed by about 8 percent in Greece and by 11 percentin the United Kingdom in 1969/70. In the FederalRepublic of Germany losses of revenue from reval-uation are being compensated from January 1970by subsidies and adjustments of the value-addedtax system, and this should ensure an increase innet farm income for the 1969/70 season. Declines
are reported in Switzerland and Finland as a resultof higher costs of production, although price increasesin Finland for beef, pork, milk, eggs and rye, whichtook effect as of April 1970, should raise incomesduring the current year.
Developments in current agricultural policies
A principal short-term goal of agricultural policyremained the alteration of the balance of productionbetween commodities in surplus wheat, sugarand dairy products and those for which demandis tending to outrun supply beef and feed grains.The main instrument of policy has been the adjust-ment of the relative levels of price guarantees andsubsidies. In Norway, for example, the guaranteedprice for milk in 1969 was raised less than pricesfor other agricultural products. In Switzerland milksubsidies were reduced as of 1 November 1969,and producers were required to use excess productionin the form of whole milk powder for animal feed.At the same time, subsidies were introduced to en-courage the slaughter of dairy cows. In Austriathe slaughter of female calves and the fattening ofmale calves are being encouraged, while in Finlanda premium will be paid to farmers agreeing to slaugh-ter milk cows and to cease milk production for aperiod of three years. Among EEC countries, Francehas prepared a plan, as part of the 1970 budget,to provide considerably increased credits to stimu-late all forms of meat production. As a corollarythere should be some curtailment of milk output.
The United Kingdom continued action to reducethe share of imports in total consumption, and tostabilize the domestic market for dairy products,eggs and pork products. Import quotas for butterwere reduced and temporary quotas imposed oncheese imports. The bacon import quota systemwas revised to the disadvantage of foreign. sources.Action under consideration includes drastic changesin egg marketing procedures, under which productionsubsidies would be progressively reduced until elim-inated by 1974.
In order to change the composition of cereal pro-duction the prices of coarse grains were increasedin 1969 in Austria, while guarantees applying tosoft wheats were reduced. At the same time, directattempts are also being made to encourage the useof soft wheat in animal feed. In Finland price guar-antees for wheat were reduced as of 1 September1969 and, as will be outlined below, a new systen-i ofproduction control through the variation of the areaunder crops has been introduced.
Little national action has been taken so far todeal with sugar, the third main problem commodity ofthe region. A notable exception is Denmark where a
43
new programme, beginning 1 May 1970 and effec-tive until the 1979/80 crop year, is designed togradually adapt production to demand throughthe reduction of quotas to which guaranteed pricesapply.
In EEC, the Commission has proposed a reductionin the intervention prices for dairy products, whichhitherto have enjoyed particularly favourable rela-tive prices. The intervention price for butter wouldunder this plan fall from 173.5 to 142.25 units ofaccount per 100 kilogrammes. This, the Commis-sion expects, would increase annual consumptionby about 100 000 tons. In partial compensation,the intervention price for skim milk powder wouldbe raised from 41.25 to 50.75 units of account per100 kilogrammes, and subsidies for the use of skimmilk powder for calf feeding vvoulel be raised from33 to 36 units of account per 100 kilogrammes.
For 1970/71, the 1969/70 prices will be continuedunchanged. A regulation has however been adopt-ed which is aimed at reducing the dairy herd bymeans of two types of subsidy, the cost being sharedequally between the Agricultural Guidance andGuarantee Fund and national budgets. First, farm-ers with at least two cows, who agreed to slaughter alltheir cows by 30 April 1970 and to cease milk pro-duction completely for not less than five years, are toreceive a premium of 200 units of account per cowfor the first 10 cows taken out of production, and130 units of account thereafter. Secondly, farmerswith 10 or more cows who agree not to sell milk forfive years can receive a premium of 200 units ofaccount per cow, without limit and without the require-ment that the cows be slaughtered. The two schemeswere intended to cover a maximum of 500 000 cows(2 percent of the total).
In order to reverse the current rising trend ofwheat production in the face of decreasing humanconsumption and a rising demand for animal feed
the latter at a rate of some 2 million tons peryear the EEC Commission has proposed to reducethe price of soft wheat and rye relative to barley,and to increase the price of maize. Hard wheatprices would be left unchanged. Further, due tothe emergence of imbalances in some regions underthe current system of regionalized intervention prices,it is now proposed to unify intervention prices.
As for sugar, the Commission has recommendedthat the quantity enjoying maximum guaranteedprices be reduced from 105 percent of estimated hu-mart consumption to 100 percent in the 1970/71crop year. It is also proposed that the cost of sugarsupport, through the Agricultural Guidance andGuarantee Fund, be entirely covered by producersby means of a supplementary tax equivalent to amaximum of 1 unit of account per ton of sugarbeet.
EEC COMMON AGRICULTURAL POLICY
A number of essential decisions for the commonagricultural and economic policy of EEC were takenat a conference of the heads of state of the membergovernments in December 1969. Among the prin-cipal decisions were the establishment of definitefinancial regulations for agriculture, including ma-chinery for adapting them to the requirements ofan enlarged common market; and the adoption ofprinciples for closer control over markets for agri-cultural products within the Community, so as tofacilitate the planning of production and in orderto minimize budgetary charges arising from produc-tion imbalances.
The most important decision regarding financialarrangements was postponement of the completebudgetary autonomy of the Community which isnow to be implemented over a five-year period. in1970 the distribution of charges among membersis to remain virtually as before, with 90 percent ofthe import levies reverting to the common fund.From 1971 to 1974 all agricultural levies and a grad-ually increasing proportion of the customs dutieswill go into the common budget. The differencebetween these and the total budget will be made upfrom national contributions. Finally, from 1975 on-ward the common fund will become completelyindependent of national budgets. The common ex-penses of the Community will be covered by itsown resources, composed of all agricultural levies,that part of customs duties accruing to the commonfund, and a part of the value-added tax to a maximumof 1 percent, which by that time will be applied inthe Community at a common rate.
Some important progress has also been made incommon market arrangements for wine, tobacco,fruit and vegetables. Thus basic regulations for themarket control of wine were adopted at the end ofApril 1970, after a number of years of study andnegotiation. Under the agreement, effective from1 June 1970, trade in table wines within the Commu-nity will move freely.2 The planting of vines is to befreely allowed as in Italy, representing a drasticchange in France where the right to plant has beenstrictly regulated. Prices will be supported accord-ing to a system similar to that now in force in France,involving an annually determined orientation priceand a threshold price at which intervention willbegin. A regular forecast of the market situationwill be made, and should the system of unregulatedplanting appear to be leading to a chronic surplussituation, measures will be taken to control newplantings.
' France will, however. be allowed to talc() measures to limitthe imports of Italian wine until the end of 1971, should such im-ports reach excessive levels.
44
The common market for wine is to be protectedagainst imports from third countries by prohibit-ing the mixing of it with imported wines and by ap-plying the common tariff and compensation dutiesshould import prices fall below the reference prices.The protective regulations will not fully apply toassociated countries or to Algeria.
Although there are only two tobacco-growingEEC countries, Italy and France, their productionis subject to very different regulations. France reg-ulates planting and has a system of guaranteedprices whereas production is uncontrolled in Italy,but in both countries marketing is under state mo-nopolies. Because of the complexity of the situa-tion, a common market for tobacco is to be createdin stages.
In February 1970, regulations were adopted abol-ishing production quotas and providing for an orien-tation and intervention price each season for theprincipal tobacco varieties. Marketing will be bymeans of contracts between producers and processorsat prices negotiated at a level somewhere betweenthe target and intervention prices. Processors giv-ing preference to EEC tobacco will receive a subsidyfrom the Agricultural Guidance and Guarantee Fundto cover the difference between the prices of tobaccoin the world markets and Community prices. Al-though excess production is not anticipated, ma-chinery has been created to prevent its emergence;it includes a reduction in the guaranteed price forthe affected variety, an eventual halt of supportpurchases and, if total tobacco supply exceeds de-mand, a reduction in the intervention price and inprocessors' subsidies. Italy and France will be re-quired gradually to relinquish state monopoly rightsover tobacco marketing, which will be completelyabolished by 1 January 1976. Filially, a commontax system for tobacco will be introduced by 1980.
POLICIES FOR STRUCTURAL REFORM
The rapid increase in the cost of farm income sup-port, together with problems arising from the re-newed accumulation of surpluses and the realizationthat present policies are not solving the income prob-lems of small farmers, continue to result in addedemphasis on structural reform everywhere in theregion. Stress is increasingly placed on the restruc-turing of farms to create more viable productionunits in which modern farming methods can beapplied to advantage, so that farm income can beraised more through the reduction of productioncosts and less through the use of price policy.
Recent policy measures have put emphasis on theconsolidation of farm holdings to create larger pro-duction units, either through an increase in the
size of individual farms or through the organizationof producers into cooperative groups. The meansadopted include selective credit systems, direct finan-cial assistance for farm purchase, tax relief, andfinancial assistance to small farmers willing to selltheir holdings.
In France an important policy under the sixthplan is the limitation of government aid only toorganized producers, that is, those producing withinthe framework of producers' organizations or undercontract to private firms or cooperatives. In 1969 theindemnities paid to farmers willing to leave the landwere increased and easier credit terms were offeredto young farmers for the expansion of their holdings.For 1970 budgetary provisions for improvements indepressed rural areas were to be increased by abouthalf, relative to 1969.
In the Federal Republic of Germany structuralassistance is being reserved for farms which arebasically profitable or which can be developed intomore commercially viable units. Assistance takesthe form of interest rebates on loans for expansionand improvement, and is also available to part-timefarmers who undertake to join producer groups.New measures were adopted in 1969 to increase pen-sions to elderly farmers, and also to make paymentsto those farmers willing to sell or lease their land forthe creation of larger farms. In problem areas,agriculture is to be developed in the broader contextof regional improvement plans, which include mea-sures for land consolidation, road building and wa-ter supply, together with nonfarm rural develop-ment.
In Italy a bill to replace the 1968 law for the im-provement of agriculture in mountain zones is nowunder discussion. If passed, it would view ruraldevelopment on an integrated basis, providing some180 000 million lire for the financing of a comprehen-sive programme including the creation of combinedcrop-forest-livestock farms, pasture improvement, thegrouping of small livestock units, the expropriationand protection of forest areas, reforestation and soilconservation, improvement of water supplies, elec-trification, and road construction.
In Austria new legislation has been passed to im-prove measures for land consolidation to createlarger holdings, and a bill with similar aims is underconsideration in the United Kingdom as part ofan overall plan to raise farm productivity. Struc-tural measures in the Netherlands have concentratedon further land reclamation through the constructionof new sea dikes.
In Finland unique measures (for Europe) havebeen passed to provide some flexibility in the useor-f-Tand under crops. A soil bank system has beenestablished under which certain classes of land canbe withdrawn from production for a period of three
45
years. The system not only gives some control overtotal land in production, but provides a meanswhereby the area urtder individual crops can bevaried.
The structural policy proposals of EEC for the re-organization of agriculture within the Community,aimed at turning farming into a viable industry andeliminating surpluses, continue to be associated withthe name of Dr Mansholt, the commissioner respon-sible for agriculture. Following on the original Mans-holt Plan, described in The state of food and agricul-ture 1969, a new version was presented in May1970. It includes a number of new features orchanges in emphasis, and may thus be consideredmore than mere updating.
The use of prices as the main policy instrumentis retained, but a distinction has been drawn between" social wages," which should be paid to guarantee alivelihood to small farmers, and market prices whichare intended for efficient agricultural producers. Thenew plan admits that a system of absolute giaranteesto purchase cannot be maintained in the long run,but it continues to oppose the introduction of pro-duction quotas. While maintaining that centralizeddecision making is necessary for price policies, thenew plan recognizes the need for maximum decen-tralization in planning for structural changes, whichmust vary with local conditions. The Council ofMinisters will accordingly be asked to adopt a planwhich is binding as to the ends, but which leavesgovernments free to choose the means.
The new proposals no longer specify " modern pro-duction units " and " modern agricultural enterprises "as the forms of future holdings, but simply aim atthe creation of farms which can be developed intorational production units. Structural changes in thetenure system would be financed by credit, ratherthan through direct payments, except where specialpensions are provided to farmers 55 years and olderwho are willing to leave the land.
Other related proposals of the EEC Commissioninclude measures to limit the cost of market support,provided for in the guarantee section of the Euro-pean Agricultural Guidance and Guarantee Fund. Asthe growth of these costs has shown no signs oflevelling off, it has been decided that the Commissionwill present annual forecasts of expenses by sectorfor several years ahead. Should marked differencesappear between the forecast and actual expenditures,alternative measures for attaining market equilib-rium will be studied.
Revised plans for meeting Community expensesfor structural reform have also been made. Until1972 the current system, which limits total outlaysto 285 million units of account, will remain in force.After 1972 that limit can be exceeded to financesuitable Community, but not national, projects.
Developments in the meat economy
BEEF AND VEAL
In the 1960s the consumption of beef and vealgrew more rapidly than production in all of the region,except for the northwestern countries outside EEC.For the region as a whole consumption increasedbetween 1960-61 and 1968 by 23 percent, comparedwith a 20 percent rise in output. In southern Eu-rope the rise in consumption over the same periodwas ahnost 70 percent, in EEC 24 percent, and in othernorthwestern countries only some 6 percent. Thevery rapid increase in consumption in the EEC areais not, however, expected to be maintained in the1970s.
In EEC countries, over the 1960-61 to 1968 period,the cattle herd increased by about 9 percent, reflect-ing to a large extent the high prices for milk anddairy products. Consequently, as discussed above,large dairy surpluses developed. The recent mea-sures to limit these are slowly beginning to causea reduction in cattle numbers. However, the pre-vailing type of mixed dairy/beef cattle, together withthe high value of land and relatively small herdsper production unit, make it difficult to build upbeef production economically on the basis of purelybeef cattle. Although in the longer term it is hopedto bring about an expansion of beef herds with thehelp of appropriate price policies, in the mediumterm increases in beef and veal production in muchof the northwestern part of the region will dependlargely on increasing the meat yield of animals.To this end, measures are being taken to reduce theslaughtering of sucking calves and increase theslaughter weight of animals, although consumerpreferences for white meat may cause difficulties.
In southern Europe the demand for beef andveal will probably continue to grow faster than else-where in the region, reflecting a rapid increase inincomes per head and the low initial levels of consump-tion. Cattle numbers in the area have in the pastincreased at roughly the same rate as in the EECcountries. Since the supply of dairy products insouthern Europe is not excessive to demand thereis still room for an expansion of time dairy herd,although low productivity in the animal sector ingeneral also calls for measures to raise productiv-ity. In this area, unlike the rest of western Europe,it would seem that feeding and breeding methodsstill need to be studied before concrete measuresfor raising productivity can be worked out. Inparticular, it is necessary to decide whether thebest results can be provided by a dual-purpose herdor a regional stratification of production leadingto a clear division between purely dairy and purelybeef stocks. Official price policies in southern Eu-
46
ropean countries are not yet sufficiently well devel-oped to influence production in a defined direction,and inadequate data on the structure and develop-ment of the livestock sector make it difficult topromote more sophisticated policies.
The lag of production behind consumption inwestern Europe as a whole has led to a rapid growthin the imports of beef and veal into the region, from552 000 tons in 1961 to 1.2 million tons in 1969.The increase has been particularly rapid in theFederal Republic of Germany and Italy. A largeportion of the additional trade has been within EEC,with France and the Netherlands as the main ex-porters, and Benelux, the Federal Republic of Ger-many and Italy as the main importers, but importsfrom outside the area have also risen, particularlyto Italy. The prospects for the next 5 to 15 yearsare for a further increase in the net deficit. Importsinto southern Europe are expected to increase par-ticularly rapidly, and the Federal Republic of Ger-many, Italy and the United Kingdom are also expect-ed to increase their net deficits.
PIGMEAT
The consumption of pigmeat in the region as awhole increased somewhat faster than that of beefand veal, namely by 27 percent between 1960-61and 1968. The growth of production approximate-ly kept pace with consumption, and varied butlittle as between the different parts of the region.On the demand side the growth was, as in thecase of beef, faster in the southern Europeancountries where total consumption rose duringthe period 1960-61 to 1968 by some 44 percent,followed by the EEC countries with 31 percent, andthe northwestern European countries with about 15percent.
The demand for pigmeat in western Europe isexpected to continue to rise in the 1970s more rap-idly than that for beef and veal, and it is thoughtthat production will keep pace with demand. Thestrong growth in demand for pigmeat is partly re-lated to the development of pigs with considerablyless fat, and also to a continuing rise in productivity.There seems to be scope for further gains in meatyields in southern European countries, but else-where in the region the future expansion of produc-tion will probably depend more on increasing ani-mal numbers. Implicit in these trends is a relativestability of trade in pigmeat, once the current short-ages associated with pig cycles in certain countriesare overcome, probably after 1971. In the longerrun, the United Kingdom is expected to remainthe only important deficit country for pigmeat inthe region.
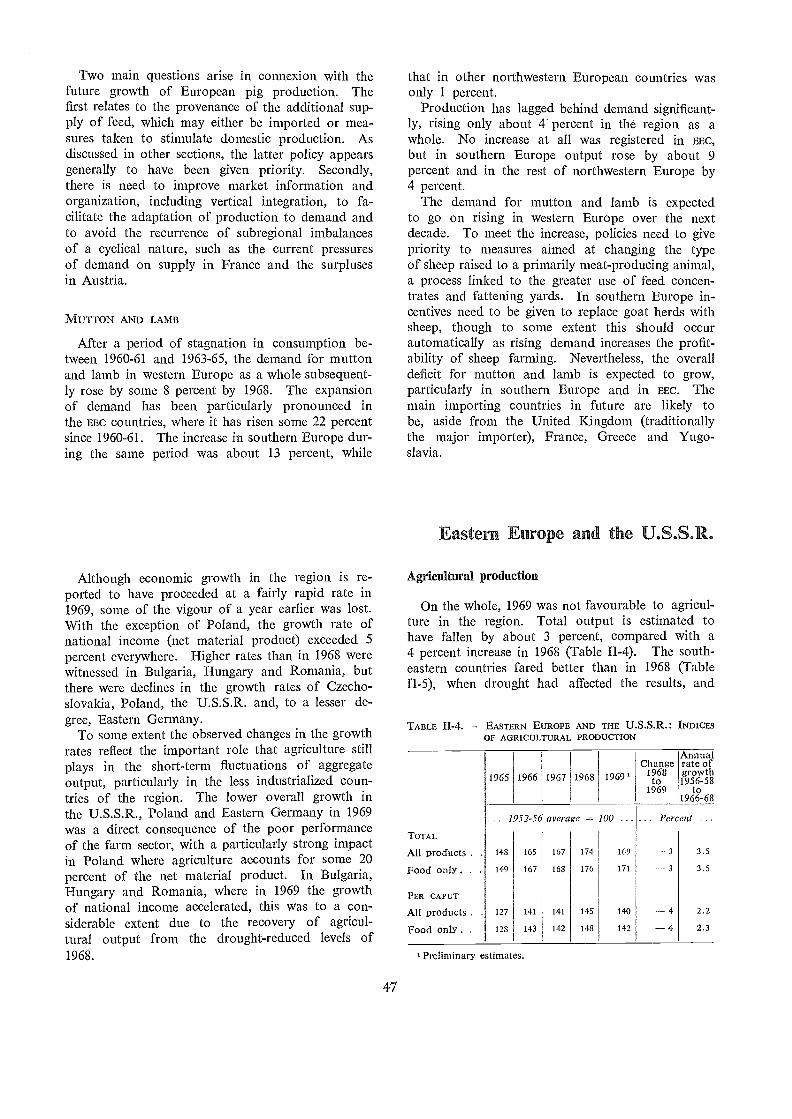
Two main questions arise in connexion with thefuture growth of European pig production. Thefirst relates to the provenance of the additional sup-ply of feed, which may either be imported or mea-sures taken to stimulate domestic production. Asdiscussed in other sections, the latter policy appearsgenerally to have been given priority. Secondly,there is need to improve market information andorganization, including vertical integration, to fa-cilitate the adaptation of production to demand andto avoid the recurrence of subregional imbalancesof a cyclical nature, such as the current pressuresof demand on supply in France and the surplusesin Austria.
MUTTON AND LAMB
After a period of stagnation in consumption be-tween 1960-61 and 1963-65, the demand for muttonand lamb in western Europe as a whole subsequent-ly rose by some 8 percent by 1968. The expansionof demand has been particularly pronounced inthe EEC countries, where it has risen some 22 percentsince 1960-61. The increase in southern Europe dur-ing the same period was about 13 percent, while
Although economic growth in the region is re-ported to have proceeded at a fairly rapid rate in1969, some of the vigour of a year earlier was lost.With the exception of Poland, the growth rate ofnational income (net material product) exceeded 5percent everywhere. Higher rates than in 1968 werewitnessed in Bulgaria, Hungary and Romania, butthere were declines in the growth rates of Czecho-slovakia, Poland, the U.S.S.R. and, to a lesser de-gree, Eastern Germany
To some extent the observed changes in the growthrates reflect the important role that agriculture stillplays in the short-term fluctuations of aggregateoutput, particularly in the less industrialized coun-tries of the region. The lower overall growth inthe U.S.S.R., Poland and Eastern Germany in 1969was a direct consequence of the poor performanceof the farm sector, with a particularly strong impactin Poland where agriculture accounts for some 20percent of the net material product. In Bulgaria,Hungary and Romania, where in 1969 the growthof national income accelerated, this was to a con-siderable extent due to the recovery of agricul-tural output from the drought-reduced levels of1968.
47
that in other northwestern European countries wasonly 1 percent.
Production has lagged behind demand significant-ly, rising only about 4 percent in the region as awhole. No increase at all was registered in EEC,but in southern Europe output rose by about 9percent and in the rest of northwestern Europe by4 percent.
The demand for mutton and lamb is expectedto go on rising in western Europe over the nextdecade. To meet the increase, policies need to givepriority to measures aimed at changing the typeof sheep raised to a primarily meat-producing animal,a process linked to the greater use of feed concen-trates and fattening yards. In southern Europe in-centives need to be given to replace goat herds withsheep, though to some extent this should occurautomatically as rising demand increases the profit-ability of sheep farming. Nevertheless, the overalldeficit for mutton and lamb is expected to grow,particularly in southern Europe and in EEC. Themain importing countries in future are likely tobe, aside from the United Kingdom (traditionallythe major importer), France, Greece and Yugo-slavia.
Eastern Europe and the U.S.S.R.
Agricultural production
On the whole, 1969 was not favourable to agricul-ture in the region. Total output is estimated tohave fallen by about 3 percent, compared with a4 percent increase in 1968 (Table II-4). The south-eastern countries fared better than in 1968 (TableH-5), when drought had affected the results, and
TABLE 11-4. EASTERN EUROPE AND THE U.S.S.R.: INDICESOF AGRICULTURAL PRODUCTION
Preliminary estimates.
... 1952-56 average = loo. . Percent ...TOTAL
All products . 148 165 167 174 169 3 3.5
Food only. . . . 149 167 168 176 171 -- 3 3.5
PER CAPUT
All products . . 127 141 141 145 140 4 2.2
Food only. . . 128 143 142 148 142 4 2.3
ChangeAnnualrate of
1965 1966 1967 1968 1969 1968to
1969
growth1956-58
to1966-68
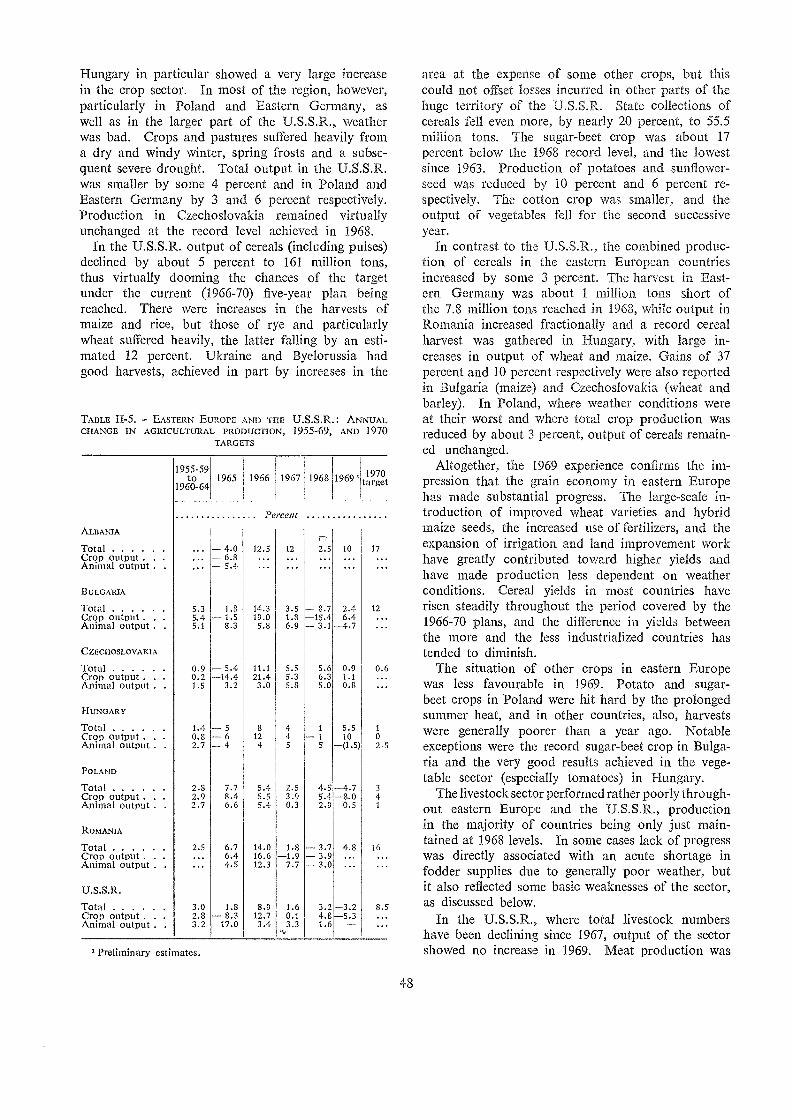
Hungary in particular showed a very large increasein the crop sector. In most of the region, however,particularly in Poland and Eastern Germany, aswell as in the larger part of the U.S.S.R., weatherwas bad. Crops and pastures suffered heavily froma dry and windy winter, spring frosts and a subse-quent severe drought. Total output in the U.S.S.R.was smaller by some 4 percent and in Poland andEastern Germany by 3 and 6 percent respectively.Production in Czechoslovakia remained virtuallyunchanged at the record level achieved in 1968.
In the U.S.S.R. output of cereals (including pulses)declined by about 5 percent to 161 million tons,thus virtually dooming the chances of the targetunder the current (1966-70) five-year plan beingreached. There were increases in the harvests ofmaize and rice, but those of rye and particularlywheat suffered heavily, the latter falling by an esti-mated 12 percent. Ukraine and Byelorussia hadgood harvests, achieved in part by increases in the
TABLE 11-5. - EASTERN EUROPE AND THE U.S.S.R.: ANNUALCHANGE IN AGRICULTURAL PRODUCTION, 1955-69, AND 1970
TARGETS
' Preliminary estimates.
48
arca at the expense of some other crops, but thiscould not offset losses incurred in other parts of thehuge territory of the U.S.S.R. State collections ofcereals fell even more, by nearly 20 percent, to 55.5million tons. The sugar-beet crop was about 17percent below the 1968 record level, and the lowestsince 1963. Production of potatoes and sunflower-seed was reduced by 10 percent and 6 percent re-spectively. The cotton crop was smaller, and theoutput of vegetables fell for the second successiveyear.
In contrast to the U.S.S.R., the combined produc-tion of cereals in the eastern European countriesincreased by some 3 percent. The harvest in East-ern German.y was about 1 million tons short ofthe 7.8 million tons reached in 1968, while output inRomania increased fractionally and a record cerealharvest was gathered in Hungary, with large in-creases in output of wheat and maize. Gains of 37percent and 10 percent respectively were also reportedin Bulgaria (maize) and Czechoslovakia (wheat andbarley). In Poland, where weather condition.s wereat their worst and where total crop production wasreduced by about 3 percent, output of cereals remain-ed unchanged.
Altogether, the 1969 experience confirms the im-pression that the grain economy in eastern Europehas made substantial progress. The large-scale in-troduction of improved wheat varieties and hybridmaize seeds, the increased use of fertilizers, and theexpansion of irrigation and land improvement workhave greatly contributed toward higher yields andhave made production less dependent on weatherconditions. Cereal yields in most countries haverisen steadily throughout the period covered by the1966-70 plans, and the difference in yields betweenthe more and the less industrialized countries hastended to diminish.
The situation of other crops in eastern Europewas less favourable in 1969. Potato and sugar-beet crops in Poland were hit hard by the prolongedsummer heat, and in other countries, also, harvestswere generally poorer than a year ago. Notableexceptions were the record sugar-beet crop in Bulga-ria and the very good results achieved in the vege-table sector (especially tomatoes) in Hungary.
The livestock sector performed rather poorly through-out eastern Europe and the U.S.S.R., productionin the majority of countries being only just main-tained at 1968 levels. In some cases lack of progresswas directly associated with an acute shortage infodder supplies due to generally poor weather, butit also reflected some basic weaknesses of the sector,as discussed below.
In the U.S.S.R., where total livestock numbershave been declining since 1967, output of the sectorshowed no increase in 1969. Meat production was
ALBANIA
1955-59to
1960-641965 1966 1967 1968 1969 1970
target
Percent
Total - 4.0 12.5 12 2.5 10 17Crop output . . . - 6.3Animal output . . - 5.4 .
BULGARIA
Total 5.3 1.8 14.3 3.5 -- 8.7 2.4 12Crop output . . . 5.4 - 1.5 19.0 1.3 --15.4 6.4Animal output . . 5.1 8.3 5.8 6.9 -3.1 -4.7
CZECHOSLOVAKIA
Total 0.9 -- 5.4 11.1 5.5 5.6 0.9 0.6Crop output . . . 0.2 --14.4 21.4 5.3 6.3 1.1Animal output . . 1.5 3.2 3.0 5.8 5.0 0.8
HUNGARY
TotalCrop output .
1.40.8
-5-6 812
44 -1 5.5
10 oAnimal output . . 2.7 -4 4 5 -(1.5) 2.5
POLAND
Total 2.8 7.7 5.4 2.5 4.5 -4.7 3
Crop output . . . 2.9 8.4 5.5 3.9 5.4 -8.0 4Animal output . . 2.7 6.6 5.4 0.3 2.9 0.5 1
ROMANIA
Total 2.5 6.7 14.0 1.8 - 3.7 4.8 16Crop output . . . 6.4 16.6 -1.9 - 3.9Animal output . . 4.5 12.3 7.7 - 3.0
U.S.S.R.
Total 3.0 1.8 8.9 1.6 3.2 --3.2 8.5Crop output . . 2.8 -- 8.3 12.7 0.1 4.8 --5.3Animal output . 3.2 17.0 3.4 3.3 1.6
maintained at the 1968 level, but the amounts mar-keted were reduced.
Output of milk declined slightly and there wasalso a drop in wool production caused by a severereduction in flocks of sheep on the frostbitten pasturesin the eastern territories. Eggs were the only majoritem where progress was recorded in 1969.
In Bulgaria and in Poland where animal produc-tion rose only marginally, fodder supplies wereinadequate. In both countries the Government hadto step in with large assistance programmes in orderto alleviate the strain on the farms' own resources.No such problems were reported in Czechoslovakia,Hungary and Romania. Cattle, sheep and pig num-bers continued to rise and, as also in Bulgaria, fur-ther progress was made in poultry production.
First, largely unofficial estimates for 1970 suggestthat output in the region may have staged a partialrecovery from the losses of the previous year. Over-all, output appears to have risen by some 1 to 2 per-cent. Wheat production is estimated to have increas-ed by perhaps 6 percent, and by somewhat more inthe U.S.S.R., Eastern Gerniany and Bulgaria, al-though both the regional total and the figure forthe U.S.S.R. will have remained below the 1968level. The U.S.S.R. maize crop is also estimatedto be substantially larger, but for the region as awhole the increase probably will have been held backby splatter crops in Bulgaria and especially Roma-nia. Potato harvests were larger in all countries ofthe region except Bulgaria, Poland and Hungary, andalso the rice crop (mainly grown in the U.S.S.R.)may be slightly larger than in 1969. Little changeis expected in sugar production as smaller outputin Bulgaria, Czechoslovakia, Eastern Germany andHungary will llave largely offset the increaseselsewhere in the region. Oilseed crops, on theother hand, are thought to have been generallylarger.
Meat production in the region as a whole is thoughtto llave risen but little, with substantial increasesshown only by Bulgaria and Czechoslovakia, and areduction by perhaps 8 to 10 percent in Hungary.The regional milk production remained more or lessunchanged, and it may have fallen slightly in EasternGermany, Romania and the U.S.S.R.
Forest production
From statistics which exclude removals from statefarms, it appears that roundwood removals in theU.S.S.R. rose by about 3 percent in 1969. Removalsof sawlogs were barely higher than in 1968, butthose of other industrial wood increased substan-tially, partly for domestic use and partly for export.The pattern was similar in eastern Europe, except
49
that the removals of sawlogs are estimated to havefallen slightly. In both the U.S.S.R. and easternEurope, fuetwood removals are estimated to havedeclined further.
Sawn softwood and hardwood output in theU.S.S.R. remained at about the 1968 level but, ineastern Europe, sawn softwood production fell for thethird year in succession. Official policy is to reducethe production and use of sawn softwood and topromote that of wood-based panel products in orderto make optimum use of the limited raw materialresources. The centre of production of roundwoodand forest products in the U.S.S.R. is graduallymoving eastward, as new capacity in the form oflarge " combinats " is installed in Siberia. In westernU.S.S.R. the possibilities of expanding roundwoodproduction are believed to be limited, and the plan-ned expansion in the output of wood pulp and panelproducts in those areas will be based to a large ex-tent on greater use of residues, and possibly on a re-duction in the volume of roundwood exports, whichare still substantial.
Compared with the show growth of fibreboardproduction in western Europe, that in eastern Europecontinued to expand strongly. Bulgaria began out-put in 1968 and further increased it in 1969; Ro-mania is in the midst of a major new phase of fibre-board capacity expansion.
Trade in agricultural products
The volume of the region's agricultural exportshas remained virtually unchanged for two years,following a rise of more than 20 percent in 1967.In 1969, the volume of exports of wheat, barley,fruit and sunflowerseed was larger, but that of maize,sugar, meat, cotton and wool was smaller. Agricul-tural imports declined slightly. Imports of wheat,coarse grains and sugar were reduced substantially,and were larger for a few products only princi-pally rice, coffee, tea and wine.
Interest continues to be centred on the region'sgrains trade and particularly that of the U.S.S.R.For the third consecutive year, this country maintain-ed a net export balance in grains. The very goodcrop of 1968 has permitted exports of wheat to beincreased from 4.4 million tons in 1968 to almost 6million tons in 1969, while imports were reducedfrom 1.3 million to 38 000 tons in the same years.The net export balance was thus almost doubled.In 1970, however, there is likely to be a considerableweakening of the U.S.S.R.'s export position. The1969 crop was estimated to be about 12 percentsmaller, and state grain deliveries are reported tobe only sufficient to cover domestic requirements for1970, leaving little scope for exports.
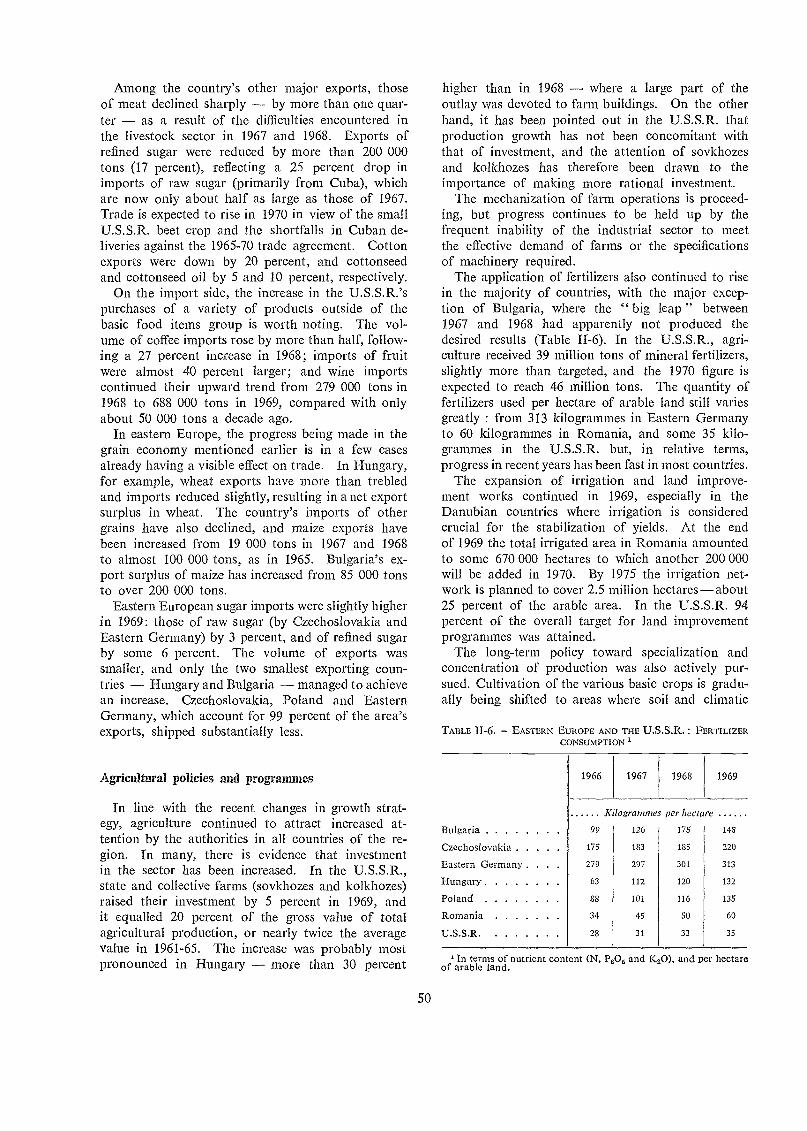
Among the country's other major exports, thoseof meat declined sharply by more than one quar-ter as a result of the difficulties encountered inthe livestock sector in 1967 and 1968. Exports ofrefined sugar were reduced by more than 200 000tons (17 percent), reflecting a 25 percent drop inimports of raw sugar (primarily from Cuba), whichare now only about half as large as those of 1967.Trade is expected to rise in 1970 in view of the smallU.S.S.R. beet crop and the shortfalls in Cuban de-liveries against the 1965-70 trade agreement. Cottonexports were down by 20 percent, and cottonseedand cottonseed oil by 5 and 10 percent, respectively.
On the import side, the increase in the U.S.S.R.'spurchases of a variety of products outside of thebasic food items group is worth noting. The vol-ume of coffee imports rose by more than half, follow-ing a 27 percent increase in 1968; imports of fruitwere almost 40 percent larger; and wine importscontinued their upward trend from 279 000 tons in1968 to 688 000 tons in 1969, compared with onlyabout 50 000 tons a decade ago.
In eastern Europe, the progress being made in thegrain economy mentioned earlier is in a few casesalready having a visible effect on trade. In Hungary,for example, wheat exports have more than trebledand imports reduced slightly, resulting in a net exportsurplus in wheat. The country's imports of othergrains have also declined, and maize exports havebeen increased from 19 000 tons in 1967 and 1968to almost 100 000 tons, as in 1965. Bulgaria's ex-port surplus of maize has increased from 85 000 tonsto over 200 000 tons.
Eastern European sugar imports were slightly higherin 1969: those of raw sugar (by Czechoslovakia andEastern Gerinany) by 3 percent, and of refined sugarby some 6 percent. The volume of exports wassmaller, and only the two smallest exporting coun-tries Hungary and Bulgaria managed to achievean increase. Czechoslovakia, Poland and EasternGermany, which account for 99 percent of the area'sexports, shipped substantially less.
Agricultural policies and progrannnes
In line with the recent changes in growth strat-egy, agriculture continued to attract increased at-tention by the authorities in all countries of the re-gion. In many, there is evidence that investmentin the sector has been increased. In the U.S.S.R.,state and collective fauns (sovkhozes and kolkhozes)raised their investment by 5 percent in 1969, andit equalled 20 percent of the gross value of totalagricultural production, or nearly twice the averagevalue in 1961-65. The increase was probably mostpronounced in Hungary more than 30 percent
50
higher than in 1968 where a large part of theoutlay was devoted to farm buildings. On the otherhand, it has been pointed out in the U.S.S.R. thatproduction growth has not been concomitant withthat of investment, and the attention of sovIchozesand kolkhozes has therefore been drawn to theimportance of making more rational investment.
The niechanization of farm operations is proceed-ing, but progress continues to be held up by thefrequent inability of the industrial sector to meetthe effective demand of farms or the specificationsof machinery required.
The application of fertilizers also continued to risein the majority of countries, with the major excep-tion of Bulgaria, where the " big leap " between1967 and 1968 had apparently not produced thedesired results (Table IT-6). In the U.S.S.R., agri-culture received 39 million tons of mineral fertilizers,slightly more than targeted, and the 1970 figure isexpected to reach 46 million tons. The quantity offertilizers used per hectare of arable land still variesgreatly : from 313 kilogrammes in Eastern Germanyto 60 kilogrammes in Romania, and some 35 kilo-grammes in the U.S.S.R. but, in relative terms,progress in recent years has been fast in most countries.
The expansion of irrigation and land improve-ment works continued in 1969, especially in theDanubian countries where irrigation is consideredcrucial for the stabilization of yields. At the endof 1969 the total irrigated area in Romania amountedto some 670 000 hectares to which another 200 000will be added in 1970. By 1975 the irrigation net-work is planned to cover 2.5 million hectares about25 percent of the arable area. In the U.S.S.R. 94percent of the overall target for land improvementprogrammes was attained.
The long-term policy toward specialization andconcentration of production was also actively pur-sued. Cultivation of the various basic crops is gradu-ally being shifted to areas where soil and climatic
TABLE II-6. EASTERN EUROPE AND THE U.S.S.R. : FERTILIZERCONSUMPTION
' In terms of nutrient content (N. P205 and K20), and per hectareof arable land.
1966 1967 1968 1969
lo granunes per hectare
Bulgaria 99 126 175 148
Czechoslovakia 175 183 185 220
Eastern GermanY . 279 297 301 313
Hungary 63 112 120 132
Poland 88 101 116 135
Romania 34 45 50 60
U.S.S.R. 28 31 33 35
conditions are the most suitable, and large-scaleproduction units are being established. In the live-stock sector, this has resulted in some disturbances,probably of a short-term nature, which are discussedbelow.
The debate ort pricing systems and price structurescontinues in many countries, particularly Czecho-slovakia where the present system of grants, differ-entiated prices and direct financial support is beingcriticized as not having given adequate stimulus toproduction in the agricultural sector; it is beingsuggested that this be replaced by an integrated sys-tem within the framework of a general price reform.Much of the original impetus of the reform seemsto have been lost recently, however, and action isbeing limited to minor readjustments that do nottangibly affect the existing price structure.
Recent information on the draft five-year plan ofthe U.S.S.R. (1971-75), 3 which is scheduled to beapproved early in 1971 by the 24th Congress of theCommunist Party, suggests that the recent emphasison accelerating agricultural growth in the countrywill be continued. The principal goal under thedraft plan is to achieve a five-year average level ofcereal production of 195 million tons, 15 percentmore than the target under the current plan, and20 percent more than the 1966-69 average of 162 mil-lion tons. The new target implies a production levelin 1975 of some 205-210 million tons. Large increases are also planned for most other products.The total output of meat, at 15.6 million tons, wouldbe 34 percent higher than the actual production in1969, that of milk 20 percent more, and of eggs38 percent.
In order to achieve these increases, it is plannedthat the State will invest in agriculture a total of77 600 million roubles over the five-year period, anincrease of 70 percent over the period 1966-70, whilethe collective farms plan to raise their investment by50 percent to 43 000 million roubles. A major in-vestment objective is irrigation (3 million additionalhectares), and the sector is to receive 1.7 milliontractors. The production of mineral fertilizers toois to rise rapidly, reaching by 1975 the level of 90million tons in conventional units (21 million tonsin terms of nutrient content). Recent decisions toraise the prices of a number of farm products areexpected to provide added incentives to expand output.
Institutional changes
The new model kolkhoz statute the draftwas described briefly in The state of food and agri-culture 1969 which replaces the statute of 1935,
' Statement by L.I. Brezhnev, reported in Izvestia, 3 July 1970.
51
was approved with few additions at the end of No-vember 1969 by the Third Kolkhozian Congress.4The major changes reflect the desire to extend cul-tivation to avoid the waste of land, and to holdback the rise in the cost of production. To thisend, the kolkhozes will be required to put into pro-duction all land suitable for agriculture and toimplement crop rotation systems. The statute alsostates that henceforth wages may be increased onlyat a lower rate than the growth of labour produc-tivity. As regards the organization of labour, thefinal text has retained the draft provision authorizingkolkhozes to create small autonomous mechanizedteams consisting of 8 to 10 persons (the zveno sys-tem) outside the production brigades. Such teamshave in many cases shown higher labour productivitythan the larger groups. The expansion of thezveno system, coupled with increased mechanization,may well represent the emergence of a new structurein the organization of agricultural labour in theU.S.S.R.
The new statute has also confirmed the right ofthe kolkhoz to create small industries to provide anoccupation for its members during the winter monthsand to produce additional income for the farm,although their establishment is conditional on theirnot damaging agricultural production.
An important decision of the Third KolkhozianCongress was the return to a kolkhozian federativesystem which existed until 1930, but was suppressedby the statute of 1935. Under this system the kol-khozes will elect councils by districts, by provincesand by republics, with a central kolkhozian councilof 125 members at the top of the pyramid. Thecreation of this new set of institutions implies atthe same time both an increased centralization ofthe kolkhozian system, and a greater autonomy ofthe kolkhozes in their relations with various stateinstitutions, especially at the regional level, whichuntil now have controlled the activities of the kol-khoz.
Important organizational measures were also de-cided upon in 1969 in Romania. They aim at im-proving planning and management in the collectivefarm sector, which at present comprises about 60 per-cent of the farmland, and place strong emphasis onthe concentration and specialization of production.Until now, Romania was the only country in easternEurope still maintaining a system of state-ownedmachine and tractor stations; the latter will nowbe integrated with the farm units. New regulationsconcerning the definition of work norms and thecalculation of labour remun,eration have also been
The new statute is described in an article by A.N. Sakoff.Soviet agriculture and the new model constitution of the kolkhoz,in Monthly Bulletin of Agricultural Economics and Statistics, 19: 9,September 1970, FAO, Rome.
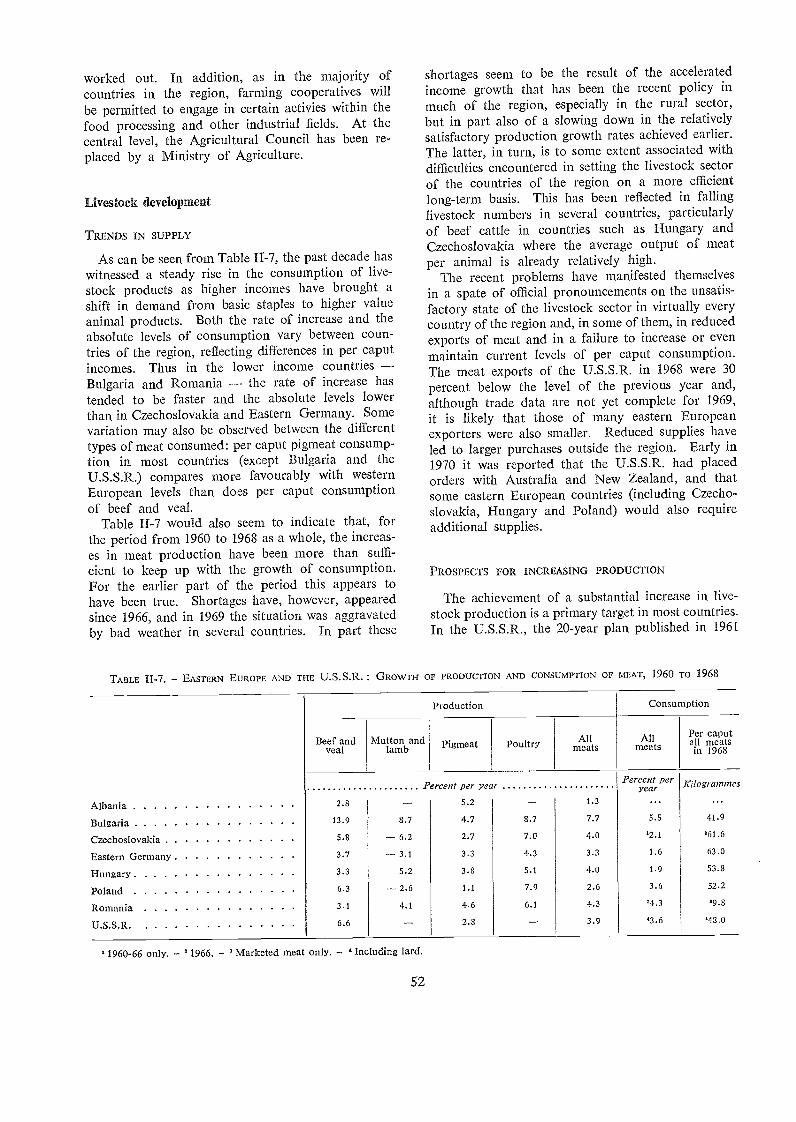
worked out. In addition, as in the majority ofcountries in the region, farming cooperatives willbe permitted to engage in certain activies within thefood processing and other industrial fields. At thecentral level, the Agricultural Council has been re-placed by a Ministry of Agriculture.
Livestock development
TRENDS IN SUPPLY
As can be seen from Table II-7, the past decade haswitnessed a steady rise in the consumption of live-stock products as higher incomes have brought ashift in demand from basic staples to higher valueanimal products. Both the rate of increase and theabsolute levels of consumption vary between coun-tries of the region, reflecting differences in per caputincomes. Thus in the lower income countries -Bulgaria and Romania - the rate of increase hastended to be faster and the absolute levels lowerthan in Czechoslovakia and Eastern Germany. Somevariation may also be observed between the differenttypes of meat consumed: per caput pigmeat consump-tion in most countries (except Bulgaria and theU.S.S.R.) compares more favourably with westernEuropean levels than does per caput con.sumptionof beef and veal.
Table II-7 would also seem to indicate that, forthe period from 1960 to 1968 as a whole, the increas-es in meat production have been more than suffi-cient to keep up with the growth of consumption.For the earlier part of the period this appears tohave been true. Shortages have, however, appearedsince 1966, and in 1969 the situation was aggravatedby bad weather in several countries. In part these
1960-66 only. - 1966. - Marketed meat only. - 'Including lard.
52
shortages seem to be the result of the acceleratedincome growth that has been the recent policy inmuch of the region, especially in the rural sector,but in part also of a slowing down in the relativelysatisfactory production growth rates achieved earlier.The latter, in turn, is to some extent associated withdifficulties encountered in setting the livestock sectorof the countries of the region on a more efficientlong-term basis. This has been reflected in fallinglivestock numbers in several countries, particularlyof beef cattle in countries such as Hungary andCzechoslovakia where the average output of meatper animal is already relatively high.
The recent problems have manifested themselvesin a spate of official pronouncements on the unsatis-factory state of the livestock sector in virtually everycountry of the region and, in some of them, in reducedexports of meat and in a failure to increase or evenmaintain current levels of per caput consumption.The meat exports of the U.S.S.R. in 1968 were 30percent below the level of the previous year and,although trade data are not yet complete for 1969,it is likely that those of many eastern Europeanexporters were also smaller. Reduced supplies haveled to larger purchases outside the region. Early in1970 it was reported that the U.S.S.R. had placedorders with Australia and New Zealand, and thatsome eastern European countries (including Czecho-slovakia, Hungary and Poland) would also requireadditional supplies.
PROSPECTS FOR INCREASING PRODUCTION
The achievement of a substantial increase in live-stock production is a primary target in most countries.In the U.S.S.R., the 20-year plan published in 1961
TABLE II-7. - EASTERN EUROPE AND THE U.S.S.R. : GROWTH OF PRODUCTION AND CONSUMPTION OF MEAT, 1960 TO 1968
Beef andveal
Mutton andlamb Pigmeat Poultry All
meatsAll
meatsPer caputa II meatsin 1968
Percent per yearPercent per
Year Kilogrammes
Albania 2.8 5.2 1.3
Bulgaria 13.9 8.7 4.7 8.7 7.7 5.5 41.9
Czechoslovakia 5.8 - 6.2 2.7 7.0 4.0 '2.1 '61.6
Eastern Germany 3.7 -3.1 3.3 4.3 3.3 1.6 63.0
Hungary 3.3 5.2 3.8 5.1 4.0 1.9 53.8
Poland 6.3 -26 1.1 7.9 2.6 3.6 52.2
Romania 3.1 4.1 4.6 6.1 4.3 '4.3 39.8
U.S.S.R. 6.6 2.8 3.9 '3.6 '48.0
Production Consumption
included targets for 1980 of 163 million head ofcattle (compared to an actual figure of 95 millionin 1969), 91 million of pigs (56 million in 1969),and 270 million of sheep (140 million in 1968). Nofigures were given for poultry, but egg productionwas to be increased to 116 000 million in 1980 (in1969 production was 37 000 million).
Although the information on the draft 1971-75plan suggests that the attainment of such produc-tion levels has been postponed, these data do pro-vide some indication of the scope which is thoughtpossible for the livestock sector. This is also sug-gested by the available grazing area: 3.32 hectaresof permanent meadows and pastures per convention-al livestock unit compared to 0.61 in Europe, 1.84in Latin America and 2.45 in North America. Ineastern Europe, also, an increase in livestock produc-tion is planned. In Poland in September 1969 itwas announced that extra measures would be takento ensure increased production of milk, meat anddairy products.
PRINCIPAL PROBLEMS AND POLICIES
To obtain the required increases in production,however, it will be necessary to solve a number ofmajor problems which are generally blamed for therecent unsatisfactory performance of the sector. Al-though each country has its particular difficulties, invirtually all of them complaints are heard aboutthe inadequate farm structure, the unsatisfactorystate of farm buildings, insufficient mechanization,obsolete feeding methods and, in more general terms,the slow adoption by farmers of improved techniques.These deficiencies result in the high costs of productionand low level of labour productivity which consti-tute the key problems of the region.
The solution is largely being sought through spe-cialization of production in the large-scale kol-khozes and sovkhozes.5 Specialized units would rearlarge numbers of a single type of livestock, as oppos-ed to the mixed livestock, or livestock and crops,on most existing farms. A kolkhoz specializing inveal husbandry, for example, should rear some10 000 animals, while a dairy kolkhoz should havea minimum of 1 200 to 1 600 cows. In 1968 only3.4 percent of the kolkhozes and 20.1 percent of thesovkhozes in the U.S.S.R. had more than 3 000 headof cattle, and only 3.7 percent and 25.2 percent re-spectively more than 1 000 cows. The specializedunits would be highly mechanized and labour wouldbe organized on an industrial basis in order to bring
In Poland the situation is somewhat different for, althoughmuch of the blame for the current problems of the sector is puton the inadequately equipped private holdings, they still accountfor some 35 percent of the output of livestock and livestock prod-ucts,
53
down the cost of production. Reductions in labourcosts by as much as one third have been reported onspecialized livestock kolkhozes in some areas.
The planned emphasis on specialization was evi-dent in the last five-year plan (1966-70) of theU.S.S.R. By 1969 there was evidence, however, espe-cially in Hungary and the U.S.S.R., that the shiftof production to specialized units was resulting in adecline in total output. While the establishment ofspecialized farms was progressing slowly, in theU.S.S.R. the elimination of livestock from units notspecializing in animal production was proceedingrelatively more rapidly. 'Thus, while in 1961 only6.5 percent of the kolkhozes did not rear pigs and8 percent did not rear sheep, by 1969 the proportionhad grown to 25 and 30 percent. A similar develop-ment from 20 to 50 percent for pigs, and from52 to 65 percent for sheep occurred on the sov-khozes. This trend has contributed to the failure oflivestock numbers to expand, and has resulted inofficial emphasis now being placed on the dangersof the kolkhozes and sovkhozes going out of animalproduction before the output of the specialized unitsis assured.
For the same reason, there is also evidence ofincreased official encouragement of production onfamily plots. Their output of animals and animalproducts has shown some decline over the pastyears in many countries of the region, with increas-ing urbanization and with the improvement of theincome levels of kolkhozian workers. Also impor-tant in some countries in eastern Europe is the in-creasing tendency for collective farms to pay mem-bers in cash rather than kind. Under the lattersystem, workers would tend to use payments infeedstuffs to raise their own livestock, whereas cashpayments would reduce the incentive to do so.This shift has contributed to an increased aware-,ness of the shortcomings of the prevailing tax sys-tems and price structures which do not providesufficient incentives to livestock development. Thereis some evidence of official action to encourage pri-vate production through the improvement of pricerelationships, although the impact may be limitedby the possibility of obtaining higher prices on theunofficial market.
Considerable emphasis is also being placed onimproving supplies of forage and feed, which aretoo costly and inadequate to support large increasesin animal numbers. In some countries shortagesof feed have resulted in premature slaughteringsand disrupted plans for increasing herds. The as-surance of a reliable and timely supply of feed andof other production inputs is particularly importantunder a system which relies upon specialized produc-tion units. Shortages of concentrates specificallyblended for different types of livestock are reported
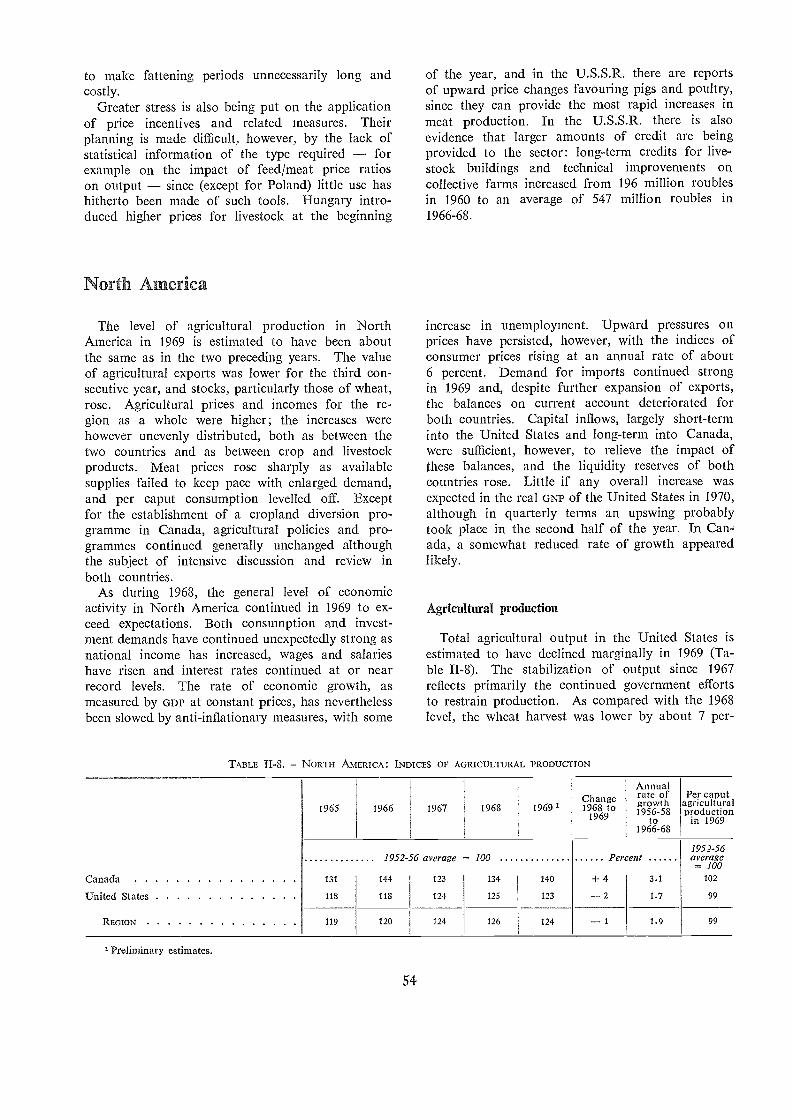
to make fattening periods unnecessarily long andcostly.
Greater stress is also being put on the applicationof price incentives and related measures. Theirplanning is made difficult, however, by the lack ofstatistical information of the type required forexample on the impact of feed/meat price ratioson output since (except for Poland) little use hashitherto been made of such tools. Hungary intro-duced higher prices for livestock at the beginning
enea
The level of agricultural production in NorthAmerica in 1969 is estimated to have been aboutthe same as in the two preceding years. The valueof agricultural exports was lower for the third con-secutive year, and stocks, particularly those of wheat,rose. Agricultural prices and incomes for the re-gion as a whole were higher; the increases werehowever unevenly distributed, both as between thetwo countries and as between crop and livestockproducts. Meat prices rose sharply as availablesupplies failed to keep pace with enlarged demand,and per caput consumption levelled off. Exceptfor the establishment of a cropland diversion pro-gramme in Canada, agricultural policies and pro-grammes continued generally unchanged althoughthe subject of intensive discussion and review inboth countries.
As during 1968, the general level of economicactivity in North America continued in 1969 to ex-ceed expectations. Both consumption and invest-ment demands have continued unexpectedly strong asnational income has increased, wages and salarieshave risen and interest rates continued at or nearrecord levels. The rate of economic growth, asmeasured by GDP at constant prices, has neverthelessbeen slowed by anti-inflationary measures, with some
Preliminary estimates.
TABLE II-8. NORTH AMERICA : INDICES OF AGRICULTURAL PRODUCTION
54
of the year, and in the U.S.S.R. there are reportsof upward price changes favouring pigs and poultry,since they can provide the most rapid increases inmeat production. In the U.S.S.R. there is alsoevidence that larger amounts of credit are beingprovided to the sector: long-term credits for live-stock buildings and technical improvements oncollective farms increased from 196 million roublesin 1960 to an average of 547 million roubles in1966-68.
increase in unemployment. Upward pressures onprices have persisted, however, with the indices ofconsumer prices rising at an annual rate of about6 percent. Demand for imports continued strongin 1969 and, despite further expansion of exports,the balances on current account deteriorated forboth countries. Capital inflows, largely short-terminto the United States and long-term into Canada,were sufficient, however, to relieve the impact ofthese balances, and the liquidity reserves of bothcountries rose. Little if any overall increase wasexpected in the real GNP of the United States in 1970,although in quarterly terms an upswing probablytook place in the second half of the year. In Can-ada, a somewhat reduced rate of growth appearedlikely.
Agricultural production
Total agricultural output in the United States isestimated to have declined marginally in 1969 (Ta-ble II-8). The stabilization of output since 1967reflects primarily the continued government effortsto restrain production. As compared with the 1968level, the wheat harvest was lower by about 7 per-
1965 1966 1967 1968 1969 1Change1968 to
1969
Annualrate ofgrowt h1956-58
to
Per caputagricult uralproduction
in 19691966-68
1952-561952-56 average = 100 Percent average
100
Canada 131 144 123 134 140 +4 3.1 102
United States 118 118 124 125 123 2 1.7 99
REGION 119 120 124 126 124 1 1.9 99
North A fi
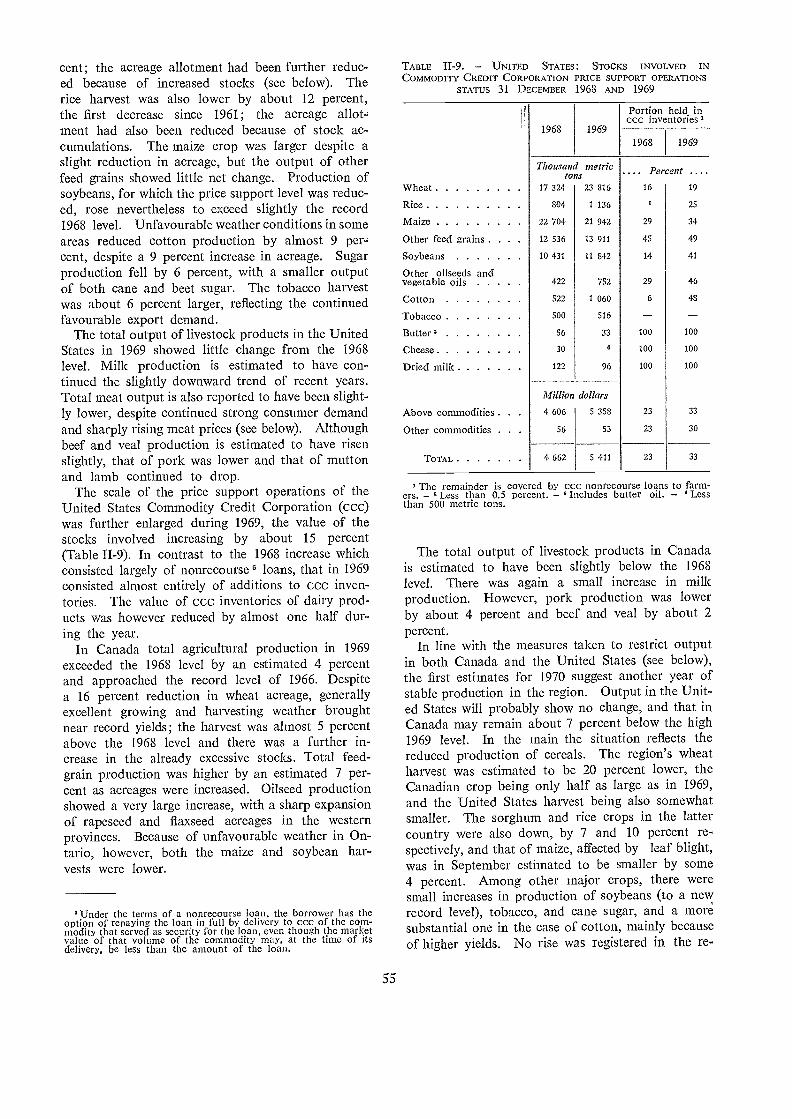
cent; the acreage allotment had been further reduc-ed because of increased stocks (see below). Therice harvest was also lower by about 12 percent,the first decrease since 1961; the acreage allot,ment had also been reduced because of stock ac-cumulations. The maize crop was larger despite aslight reduction in acreage, but the output of otherfeed grains showed little net change. Production ofsoybeans, for which the price support level was reduc-ed, rose nevertheless to exceed slightly the record1968 level. Unfavourable weather conditions in someareas reduced cotton production by almost 9 per-cent, despite a 9 percent increase in acreage. Sugarproduction fell by 6 percent, with a smaller outputof both cane and beet sugar. The tobacco harvestwas about 6 percent larger, reflecting the continuedfavourable export demand.
The total output of livestock products in the UnitedStates in 1969 showed little change from the 1968level. Milk production is estimated to have con-tinued the slightly downward trend of recent years.Total meat output is also reported to have been slight-ly lower, despite continued strong consumer demandand sharply rising meat prices (see below). Althoughbeef and veal production is estimated to have risenslightly, that of pork was lower and that of muttonand lamb continued to drop.
The scale of the price support operations of theUnited States Commodity Credit Corporation (ccc)was further enlarged during 1969, the value of thestocks involved increasing by about 15 percent(Table II-9). In contrast to the 1968 increase whichconsisted largely of nonrecourse 6 loans, that in 1969consisted almost entirely of additions to ccc inven-tories. The value of ccc inventories of dairy prod-ucts was however reduced by almost one half dur-ing the year.
In Canada total agricultural production in 1969exceeded the 1968 level by an estimated 4 percentand approached the record level of 1966. Despitea 16 percent reduction in wheat acreage, generallyexcellent growing and harvesting weather broughtnear record yields ; the harvest was almost 5 percentabove the 1968 level and there was a further in-crease in the already excessive stocks. Total feed-grain production was higher by an estimated 7 per-cent as acreages were increased. Oilseed productionshowed a very large increase, with a sharp expansionof rapeseed and flaxseed acreages in the westernprovinces. Because of unfavourable weather in On-tario, however, both the maize and soybean har-vests were lower.
°Under the terms of a nonrecourse loan, the borrower has theoption of repaying the loan in full by delivery to ccc of the com-modity that served as security for the loan, even though the marketvalue of that volume of the commodity may, at the time of itsdelivery, be less than the amount of the loan.
55
TABLE II-9. UNITED STATES: STOCKS INVOLVED INCOMMODITY CREDIT CORPORATION PRICE SUPPORT OPERATIONS
STATUS 31 DECEMBER 1968 AND 1969
Portion held inccc inventories
The remainder is covered by ccc nonrecourse loans to farm-ers. Less than 0.5 percent. 3Inc1udes butter oil. Lessthan 500 metric tons.
The total output of livestock products in Canadais estimated to have been slightly below the 1968level. There was again a small increase in milkproduction. However, pork production was lowerby about 4 percent and beef and veal by about 2percent.
In line with the measures taken to restrict outputin both Canada and the United States (see below),the first estimates for 1970 suggest another year ofstable production in the region. Output in the Unit-ed States will probably show no change, and that inCanada may remain about 7 percent below the high1969 level. In the main the situation reflects thereduced production of cereals. The region's wheatharvest was estimated to be 20 percent lower, theCanadian crop being only half as large as in 1969,and the United States harvest being also somewhatsmaller. The sorghum and rice crops in the lattercountry were also down, by 7 and 10 percent re-spectively, and that of maize, affected by leaf blight,was in September estimated to be smaller by some4 percent. Among other major crops, there weresmall increases in production of soybeans (to a newrecord level), tobacco, and cane sugar, and a moresubstantial one in the case of cotton, mainly becauseof higher yields. No rise was registered in the re-
1968 19691968 1969
Thousand metrictons .... Percent ....
Wheat 17 324 23 816 16 19
Rice 804 1 136 2 25
Maize 22 704 21 942 29 34
Other feed grains . . 12 536 13 911 45 49
Soybeans 10 431 11 842 14 41
Other oilseeds andvegetable oils 422 752 29 46
Cotton 522 1 060 6 48
Tobacco 500 516
Butter 3 56 33 100 100
Cheese 30 4 100 100
Dried milk 122 96 100 100
Million dollars
Above conunodities . . 4 606 5 358 23 33
Other commodities . . 56 53 23 30
TOTAL 4 662 5 411 23 33
gional production of milk, despite a small increase inCanada, and meat production was only fractionallygreater than in 1969.
Fishery production
North American fish production in 1969 remainedat about the same level as the previous year. UnitedStates catches were slightly higher, but in Canadathe strong growth trend of the past few years washalted and turned into a moderate decline.
The United States catch was about 2.5 milliontons, and the country regained the fifth place amongthe leading fishing nations. The value of the catchwas estimated at $518 million, the highest on record.
Increased landings of fish for human consumptionwere registered in the anchovy, cod, halibut, jackmackerel and tuna fisheries. Shrimp, the most valu-able catch for the United States fisherman, alsowas caught in slightly larger quantities, following theexpansion of fishing off the New England and Pacificnortheast coasts. Results in the fisheries in the Gulfof Mexico and the North Atlantic, which have beenthe most important sources of domestic supply formany years, were disappointing.
Food fisheries which fared less well than in 1968were those for haddock, sea herring, red hake, whiting,and sea scallop meats. The Pacific Northwest sal-mon fishery was the smallest recorded this century.
Raw material landings for the fish reduction indus-try were sufficiently higher to enable the UnitedStates to increase fish-meal output by 8 percent.
The reduction in Canadian production resultedfrom smaller catches of herring, scallops, some ground-fish species, and especially Pacific Coast salmon,which were only partially offset by increased land-ings of halibut, flatfish and lobster.
Forest production
In 1969 the North American forest products mar-ket was influenced mainly by a slump in UnitedStates dwelling construction, after a short-lived in-crease in late 1968 and early 1969, and the overallinflationary trend of the economy. In the UnitedStates demand for constructional forest products,after rising in the early months of 1969 accompaniedby an almost unprecedented surge in prices, con-tracted throughout the remainder of the year, witha particularly marked effect on sawn softwood andplywood and fibreboard production in North Amer-ica. Demand for sawn softwood was slightly below1968, and for plywood and fibreboard about thesame as in 1968. On the other hand, sawn hard-wood output rose very strongly in 1969 to a new
56
record level following a downward trend between1966 and 1968. End-1968 stocks were very lowand the increase in production was partly for stockrebuilding and partly in response to demand fromthe furniture industry.
North American production of pulp and paperrose strongly, and capacity operating ratios werehigher than for a number of years. Output of chem-ical pulp rose somewhat faster than that of paperand paperboard other than newsprint, enabling ex-ports to be increased by approximately 800 000 tons.Nevertheless, delays in bringing new capacity intofull operation, notably in British Columbia wherethere has been very heavy capital expenditure in thesulphate pulp sector in recent years, contributedto the tight supply position for chemical pulp. Thisis being aggravated by recent strikes in the woodtransportation and construction sectors.
Trade in agricultural, fishery and forest products
The value of North America's exports of agricul-tural, fishery and forest products fell in 1969 by 2 per-cent, back to the 1967 level. This reflected a steepdecline by 9 percent in the value of agricul-tural exports, which was only partly offset by con-siderably higher export earnings from forest andparticularly fishery products.
The reduction in the value of agricultural exportsfrom the North American countries was the thirdone in succession an.d brought the total includingconcessional exports to its lowest level since1962 (Table II-10). Export unit values averaged 2percent higher than in 1968, but the volume waslower by 11 percent, with particularly sharp dropsin exports of wheat and cotton. This more thanoffset increases in the value of exports of a numberof other commodities (including meat, oilseeds andvegetable oils, fruit, oilseed cake and meal, tobaccoand animal fats). Although the United States dockstrike during the early part of 1969 was a factor, inthe main the drop reflected the general weaknessof export demand for the commodities in questionand the further reduction in concessional exports,mainly from the United States.
Among food grains, the volume of wheat exportswas 26 percent below the 1968 level and the lowestsince 1959, reflecting reduced import demand andhighly competitive conditions in world markets. Ex-ports of feed grains (largely maize) were also lower,from both Canada and the United States, by a totalof 8 percent in volume and 4 percent in value.
This was due in part to reduced demand in com-mercial markets, in part to smaller PL 480 shipmentsof sorghum to India. Rice exports, although 3percent below the 1968 level, remained nevertheless
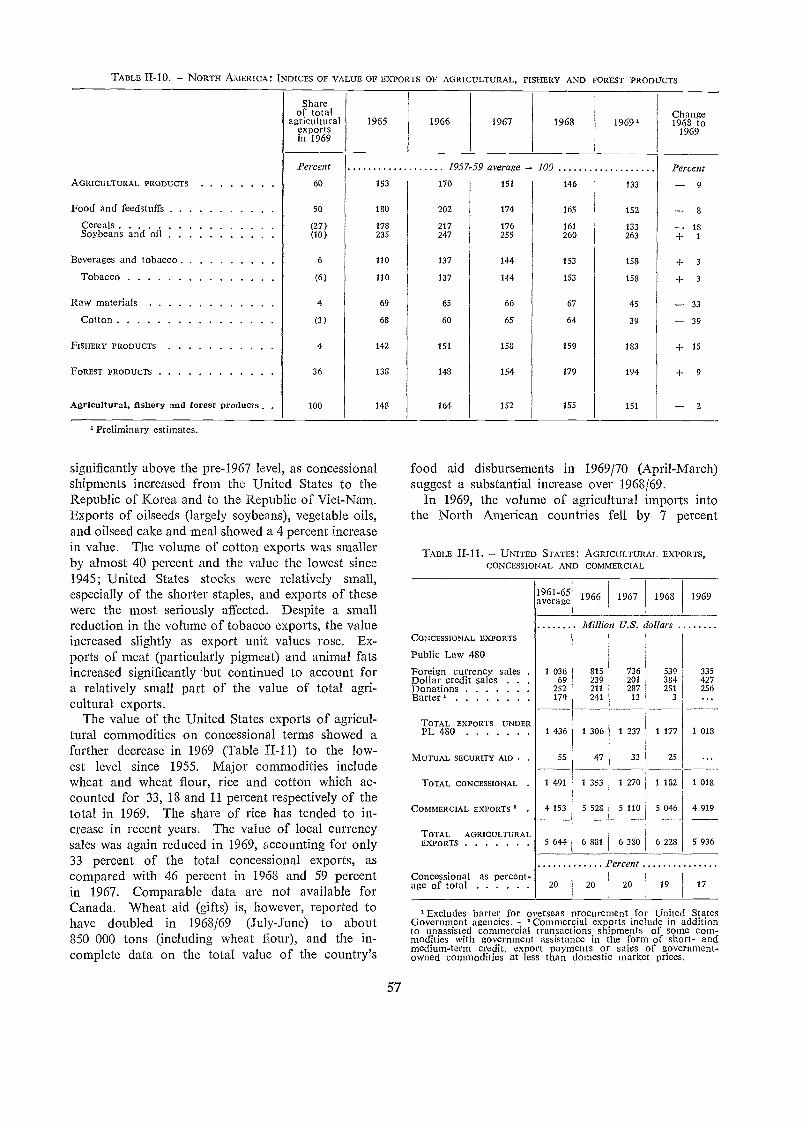
'Preliminary estimates.
significantly above the pre-1967 level, as concessionalshipments increased from the United States to theRepublic of Korea and to the Republic of Viet-Nam.Exports of oilseeds (largely soybeans), vegetable oils,and oilseed cake and meal showed a 4 percent increasein value. The volume of cotton exports was smallerby almost 40 percent and the value the lowest since1945; :United States stocks were relatively small,especially of the shorter staples, and exports of thesewere the most seriously affected. Despite a smallreduction in the volume of tobacco exports, the valueincreased slightly as export unit values rose. Ex-ports of meat (particularly pigmeat) and animal fatsincreased significantly but continued to account fora relatively small part of the value of total agri-cultural exports.
The value of the United States exports of agricul-tural commodities on concessional terms showed afurther decrease in 1969 (Table II-11) to the low-est level since 1955. Major commodities includewheat and wheat flour, rice and cotton which ac-counted for 33, 18 and 11 percent respectively of thetotal in 1969. The share of rice has tended to in-crease in recent years. The value of local currencysales was again reduced in 1969, accounting for only33 percent of the total concessional exports, ascompared with 46 percent in 1968 and 59 percentin 1967. Comparable data are not available forCanada. Wheat aid (gifts) is, however, reported tohave doubled in 1968/69 (July-June) to about850 000 tons (including wheat flour), and the in-complete data on the total value of the country's
57
food aid disbursements in 1969/70 (April-March)suggest a substantial increase over 1968/69.
In 1969, the volume of agricultural imports intothe North American countries fell by 7 percent
TABLE II-1 1. UNITED STATES : AGRICULTURAL EXPORTS,CONCESSIONAL AND COMMERCIAL
1961-65average 1966 1967 1968 1969
Million U.S. dollarsCONCESSIONAL EXPORTS
Public Law 480
1 036 815 736 539 335
PercentConeessional as percent-age of total 20 20 20 19 17
Excludes barter for overseas procurementfor United StatesGovernment agencies. - 'Commercial exports include in additionto unassisted commercial transactions shipments of some com-modities with government assistance in the form of short- andmedium-term credit, export payments or sales of government-owned commodities at less than domestic market prices.
Dollar credit sales . . 69 239 201 384 427Donations 252 211 287 251 256Barter 179 241 13 3
TOTAL EXPORTS UNDERPL 480 1 436 1 306 1 237 1 177 1 018
MUTUAL SECURITY AID . 55 47 33 25
TOTAL CONCESSIONAL . 1 491 1 353 1 270 1 132 1 018
COMMERCIAL EXPORTS ° 4 153 5 528 5 110 5 046 4 919
TOTAL AGRICULTURALEXPORTS 5 644 6 881 6 380 6 228 5 936
TABLE II-1 0. NORTH AMERICA : INDICES OF VALLTE OF EXT'ORTS OF AGRICULTURAL, FISHERY AND FOREST PRODUCTS
Shareof total
agriculturalexportsin 1969
1965 1966 1967 1968 1969'Change1968 to
1969
Percent 1957-59 average = 100 PercentAGRICULTURAL PRODUCTS 60 153 170 151 146 133 9
Food and feedstuffs 50 180 202 174 165 152 8
Cereals (27) 173 217 176 161 133 18Soybeans and oil (10) 235 247 255 260 263 + 1
13everages and tobacco 6 110 137 144 153 158 -I- 3
Tobacco (6) 110 137 144 153 158 -I- 3
Raw materials 4 69 65 66 67 45 33
Cotton (3) 68 60 65 64 39 39
FISHERY PRODUCTS 4 142 151 158 159 183 -I- 15
FOREST PRODUCTS 36 138 143 154 179 194 + 9
Agricultural, fishery and forest products . 100 148 164 152 155 151 2
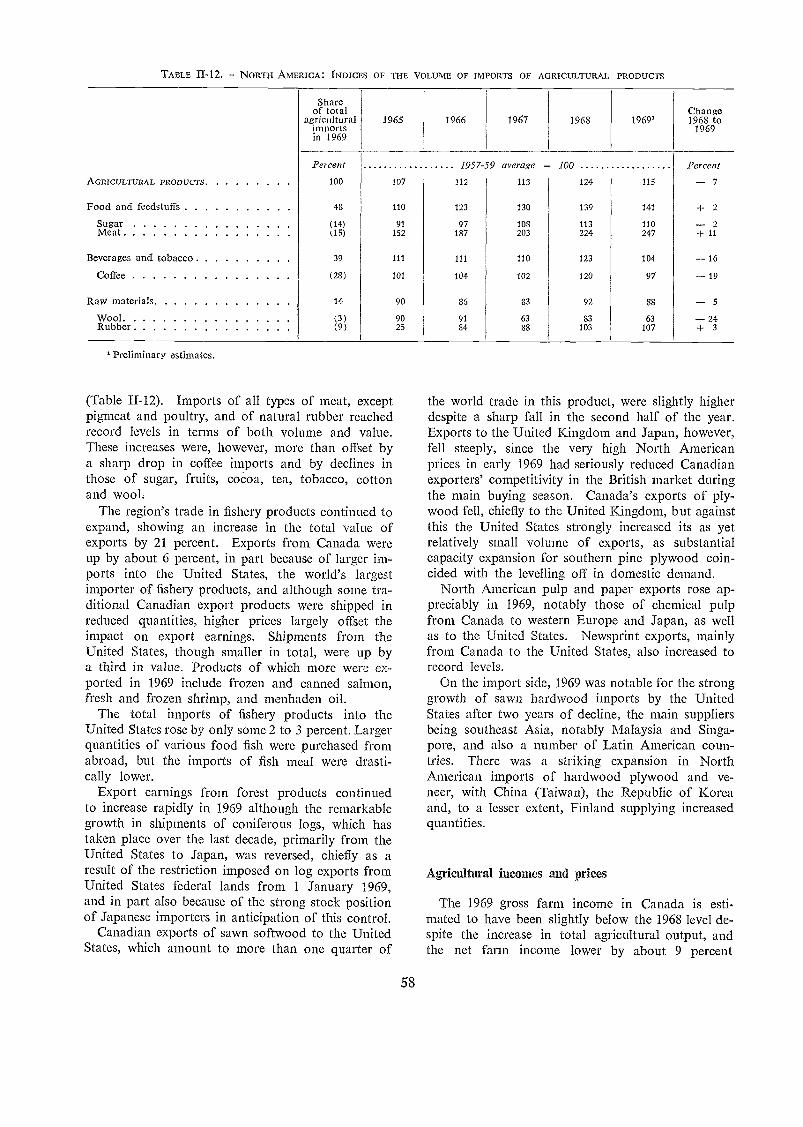
TABLE 11-12. - NORTH AMERICA: INDICES OF TETE VOLUME OF IMPORTS OF AGRICULTURAL PRODUCTS
(Table 11-12). Imports of all types of meat, exceptpigmeat and poultry, and of natural rubber reachedrecord levels in terms of both volume and value.These increases were, however, more than offset bya sharp drop in coffee imports and by declines inthose of sugar, fruits, coCoa, tea, tobacco, cottonand wool.
The region's trade in fishery products continued toexpand, showing an increase in the total value ofexports by 21 percent. Exports from Canada wereup by about 6 percent, in part because of larger im-ports into the United States, the world's largestimporter of fishery products, and although some tra-ditional Canadian export products were shipped inreduced quantities, higher prices largely offset theimpact on export earnings. Shipments from theUnited States, though smaller in total, were up bya third in value. Products of which more were ex-ported in 1969 include frozen and canned salmon,fresh and frozen shrimp, and menhaden oil.
The total imports of fishery products into theUnited States rose by only sonic 2 to 3 percent. Largerquantities of various food fish were purchased fromabroad, but the imports of fish meal were drasti-cally lower.
Export earnings from forest products continuedto increase rapidly in 1969 although the remarkablegrowth in shipments of coniferous logs, which hastaken place over the last decade, primarily from theUnited States to Japan, was reversed, chiefly as aresult of the restriction imposed on log exports fromUnited States federal lands from 1 January 1969,and in part also because of the strong stock positionof Japanese importers in anticipation of this control.
Canadian exports of sawn softwood to the UnitedStates, which amount to more than one quarter of
58
the world trade in this product, were slightly higherdespite a sharp fall in the second half of the year.Exports to the United Kingdom and Japan, however,fell steeply, since the very high North Americanprices in early 1969 liad seriously reduced Canadianexporters' competitivity in the British market duringthe main buying season. Canada's exports of ply-wood fell, chiefly to the United Kingdom, but againstthis the United States strongly increased its as yetrelatively small volume of exports, as substantialcapacity expansion for southern pine plywood coin-cided with the levelling off in domestic demand.
North American pulp and paper exports rose ap-preciably in 1969, notably those of chemical pulpfrom Canada to western Europe and Japan, as wellas to the United States. Newsprint exports, mainlyfrom Canada to the United States, also increased torecord levels.
On the import side, 1969 was notable for the stronggrowth of sawn hardwood imports by the UnitedStates after two years of decline, the main suppliersbeing southeast Asia, notably Malaysia and Singa-pore, and also a number of Latin American coun-tries. There was a striking expansion in NorthAmerican imports of hardwood plywood and ve-neer, with China (Taiwan), the Repubfic of Koreaand, to a lesser extent, Finland supplying increasedquantities.
Agricultural incomes and prices
The 1969 gross farm income in Canada is esti-mated to have been slightly below the 1968 level de-spite the increase in total agricultural output, andthe net farm income lower by about 9 percent
Shareof total Change
agriculturalimportsin 1969
1965 1966 1967 1968 1969' 1968 to1969
Percent 1957-59 average 100 Percent
AGRICULTURAL PRODUCTS . 100 107 112 113 124 115 7
Food and feedstuffs 48 110 123 130 139 141 + 2Sugar (14) 91 97 108 113 110 2Meat k 15) 152 187 203 224 247 +11
Beverages and tobacco 39 111 111 110 123 104 16Coffee (28) 101 104 102 120 97 19
Raw materials 14 90 86 83 92 88 5
Wool (3) 90 91 63 83 63 24Rubber (9) 25 84 88 103 107 + 3
' Preliminary estimates.
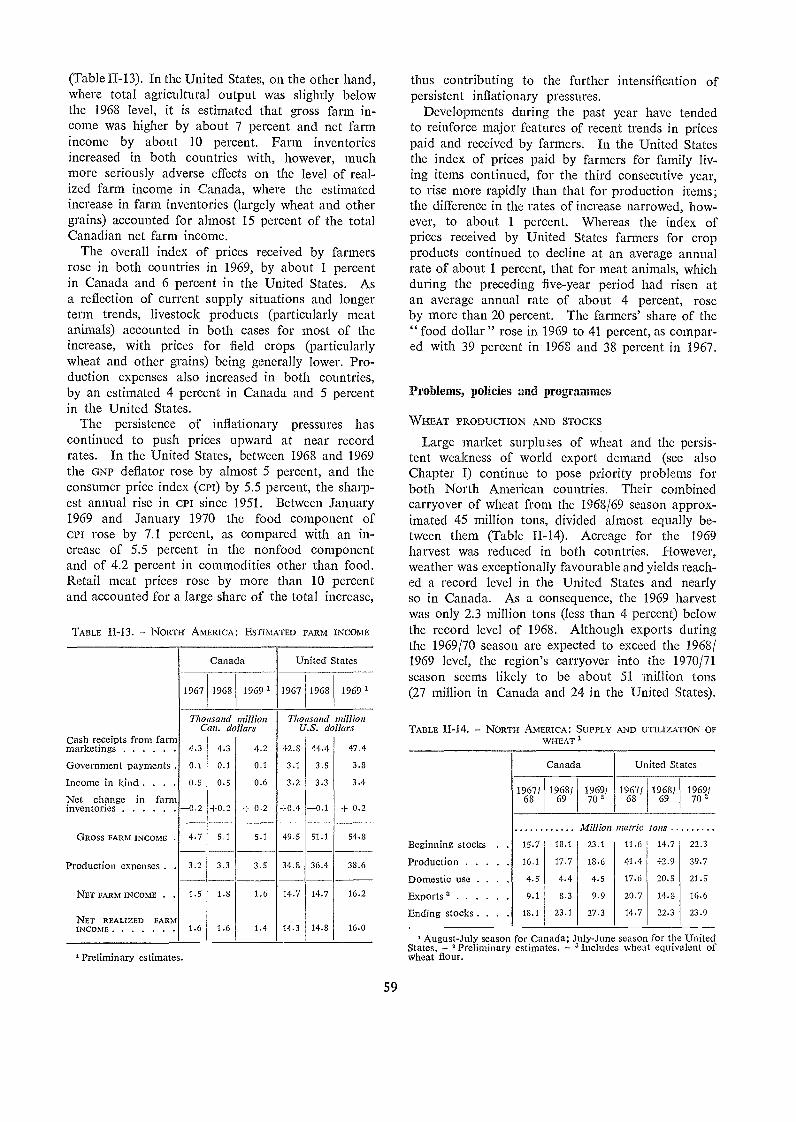
(Table II-13). In the United States, on the other hand,where total agricultural output was slightly belowthe 1968 level, it is estimated that gross farm in-come was higher by about 7 percent and net farmincome by about 10 percent. Farm inventoriesincreased in both countries with, however, muchmore seriously adverse effects on the level of real-ized farm income in Canada, where the estimatedincrease in farm inventories (largely wheat and othergrains) accounted for almost 15 percent of the totalCanadian net farm income.
The overall index of prices received by farmersrose in both countries in 1969, by about 1 percentin Canada and 6 percent in the United States. Asa reflection of current supply situations and longerterm trends, livestock products (particularly meatanimals) accounted in both cases for most of theincrease, with prices for field crops (particularlywheat and other grains) being generally lower. Pro-duction expenses also increased in both countries,by an estimated 4 percent in Canada and 5 percentin the United States.
The persistence of inflationary pressures hascontinued to push prices upward at near recordrates. In the United States, between 1968 and 1969the GNP deflator rose by almost 5 percent, and theconsumer price index (cm) by 5.5 percent, the sharp-est annual rise in CPI since 1951. Between January1969 and January 1970 the food component ofcri rose by 7.1 percent, as compared with an in-crease of 5.5 percent in thc nonfood componentand of 4.2 percent in commodities other than food.Retail meat prices rose by more than 10 percentand accounted for a large share of the total increase,
TABLE II-13. - NORTH AMERICA: ESTIMATED FARM INCONIE
Preliminary estimates.
59
thus contributing to the further intensification ofpersistent inflationary pressures.
Developments during the past year have tendedto reinforce major features of recent trends in pricespaid and received by farmers. In the United Statesthe index of prices paid by farmers for family liv-ing items continued, for the third consecutive year,to rise more rapidly than that for production items;the difference in the rates of increase narrowed, how-ever, to about 1 percent. Whereas the index ofprices received by United States farmers for cropproducts continued to decline at an average annualrate of about 1 percent, that for meat animals, whichduring the preceding five-year period had risen atan average annual rate of about 4 percent, roseby more than 20 percent. The farmers' share of the" food dollar " rose in 1969 to 41 percent, as compar-ed with 39 percent in 1968 and 38 percent in 1967.
Problems, policies and programmes
WHEAT PRODUCTION AND STOCKS
Large market surpluses of wheat and the persis-tent weakness of world export demand (see alsoChapter I) continue to pose priority problems forboth North American countries. Their combinedcarryover of wheat from the 1968/69 season approx-imated 45 million tons, divided almost equally be-tween them (Table II-14). Acreage for the 1969harvest was reduced in both countries. However,weather was exceptionally favourable and yields reach-ed a record level in the United States and nearlyso in Canada. As a consequence, the 1969 harvestwas only 2.3 million tons (less than 4 percent) belowthe record level of 1968. Although exports duringthe 1969/70 season are expected to exceed the 1968/1969 level, the region's carryover into the 1970/71season seems likely to be about 51 million tons(27 million in Canada and 24 in the United States).
TABLE II-14. - NORTH AMERICA : SUPPLY AND UTILIZ.AT1ON OFWHEAT 1
August-July season for Canada; July-June season for the UnitedStates. - ' Preliminary estimates. - 3 Includes wheat equivalent ofwheat flour.
1967 1968 1969 1967 1968 1969
Thousand millionCan. dollars
Tho ¡sand millionU.S. dollars
Cash receipts from farmmarketings 4.3 4.3 4.2 42.8 44.4 47.4
Government payments . 0.1 0.1 0.1 3.1 3.5 3.8
Income in kind . . . 0.5 0.5 0.6 3.2 3.3 3.4
Net change in farminventories -0 2 +0.2 + 0.2 +0.4 -0.1 + 0.2
GROSS FARM INCOME . 4.7 5.1 5.1 49.5 51.1 54.8
Production expenses . . 3.2 3.3 3.5 34.8 36.4 38.6
NET FARM INCOME . 1.5 1.8 1.6 14.7 14.7 16.2
NET REALIZED FARMINCONIE 1.6 1.6 1.4 14.3 14.8 16.0
Canada United States
1967/68
1968/69
1969/70 2
1967/68
1968f69
1969/70 2
Million metric tons
Beginning stocks . . 15.7 18.1 23.1 11.6 14.7 22.3
Production 16.1 17.7 18.6 41.4 42.9 39.7
Domestic use 4.5 4.4 4.5 17.6 20.5 21.5
Exports 3 9.1 8.3 9.9 20.7 14.8 16.6
Ending stocks . . . . 18.1 23.1 27.3 14.7 22.3 23.9
Canada United States
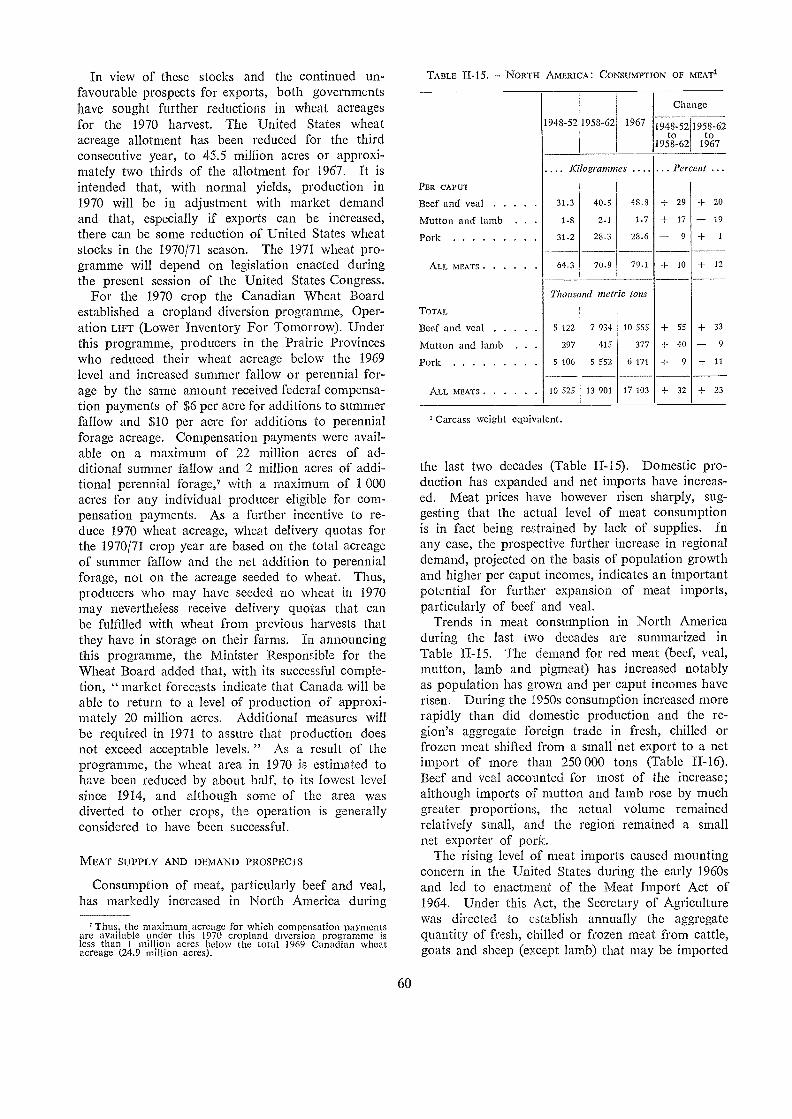
In view of these stocks and the continued un-favourable prospects for exports, both governmentshave sought further reductions in wheat acreagesfor the 1970 harvest. The United States wheatacreage allotment has been reduced for the thirdconsecutive year, to 45.5 million acres or approxi-mately two thirds of the allotment for 1967. It isintended that, with normal yields, production in1970 will be in adjustment with market demandand that, especially if exports can be increased,there can be some reduction of United States wheatstocks in the 1970/71 season. The 1971 wheat pro-gramme will depend on legislation enacted duringthe present session of the United States Congress.
For the 1970 crop the Canadian Wheat Boardestablished a cropland diversion programme, Oper-ation LIFT (Lower Inventory For Tomorrow). Underthis programme, producers in the Prairie Provinceswho reduced their wheat acreage below the 1969level and increased summer fallow or perennial for-age by the same amount received federal compensa-tion payments of $6 per acre for additions to summerfallow and $10 per acre for additions to perennialforage acreage. Compensation payments were avail-able on a maximum of 22 million acres of ad-ditional sumilier fallow and 2 million acres of addi-tional perennial forage,' with a maximum of 1 000acres for any individual producer eligible for com-pensation payments. As a further incentive to re-duce 1970 wheat acreage, wheat delivery quotas forthe 1970/71 crop year are based on the total acreageof summer fallow and the net addition to perennialforage, not on the acreage seeded to wheat. Thus,producers who may have seeded no wheat in 1970may nevertheless receive delivery quotas that canbe fulfilled with wheat from previous harvests thatthey have in storage on their farms. In announcingthis programme, the Minister Responsible for theWheat Board added that, with its successful comple-tion, " market forecasts indicate that Canada will beable to return to a level of production of approxi-mately 20 million acres. Additional measures willbe required in 1971 to assure that production doesnot exceed acceptable levels. " As a result of theprogramme, the wheat area in 1970 is estimated tohave been reduced by about half, to its lowest levelsince 1914, and although some of the area wasdiverted to other crops, the operation is generallyconsidered to have been successful.
MEAT SUPPLY AND DEMAND PROSPECTS
Consumption of meat, particularly beef and veal,has markedly increased in North America during
'Thus, the maximum acreage for which compensation paymentsare available under this 1970 cropland diversion programme isless than 1 million acres below the total 1969 Canadian wheatacreage (24.9 million acres).
60
TABLE II-15. - NORTH AMERICA: CONSUMPTION OF MEAT'
'Carcass weight equivalent.
the last two decades (Table II-15). Domestic pro-duction has expanded and net imports have increas-ed. Meat prices have however risen sharply, sug-gesting that the actual level of meat consumptionis in fact being restrained by lack of supplies. Inany case, the prospective further increase in regionaldemand, projected on the basis of population growthand higher per caput incomes, indicates an importantpotential for further expansion of meat imports,particularly of beef and veal.
Trends in meat consumption in North Americaduring the last two decades are summarized inTable II-15. The demand for red meat (beef, veal,mutton, lamb and pigmeat) has increased notablyas population has grown and per caput incomes haverisen. During the 1950s consumption increased morerapidly than did domestic production and the re-gion's aggregate foreign trade in fresh, chilled orfrozen meat shifted from a small net export to a netimport of more than 250 000 tons (Table II-16).Beef and veal accounted for most of the increase;although imports of mutton and larnb rose by muchgreater proportions, the actual volume remainedrelatively small, and the region remained a smallnet exporter of pork.
The rising level of meat imports caused mountingconcern in the United States during the early 1960sand led to enactment of the Meat Import Act of1964. Under this Act, the Secretary of Agriculturewas directed to establish annually the aggregatequantity of fresh, chilled or frozen meat from cattle,goats and sheep (except lamb) that may be imported
Change
PER CANJE
1948-52 1953-62 1967 1948-52to
1958-62
1958-62to
1967
.... Kilogrammes .... ... Per ent
I3eef and veal 31.3 40.5 48.8 + 29 -I- 20
Mutton and lamb 1.8 2.1 1.7 -I- 17 19
Pork 31.2 28.3 28.6 9 + 1
ALL MEATS 64.3 70.9 79.1 + 10 + 12
Thousand metric tons
TOTAL
Beef and veal 5 122 7 934 10 555 -I- 55 + 33
Mutton and lamb 297 415 377 + 40 9Pork 5 106 5 552 6 171 -I- 9 + 11
ALL MEATS 10 525 13 901 17 103 -I- 32 -I- 23
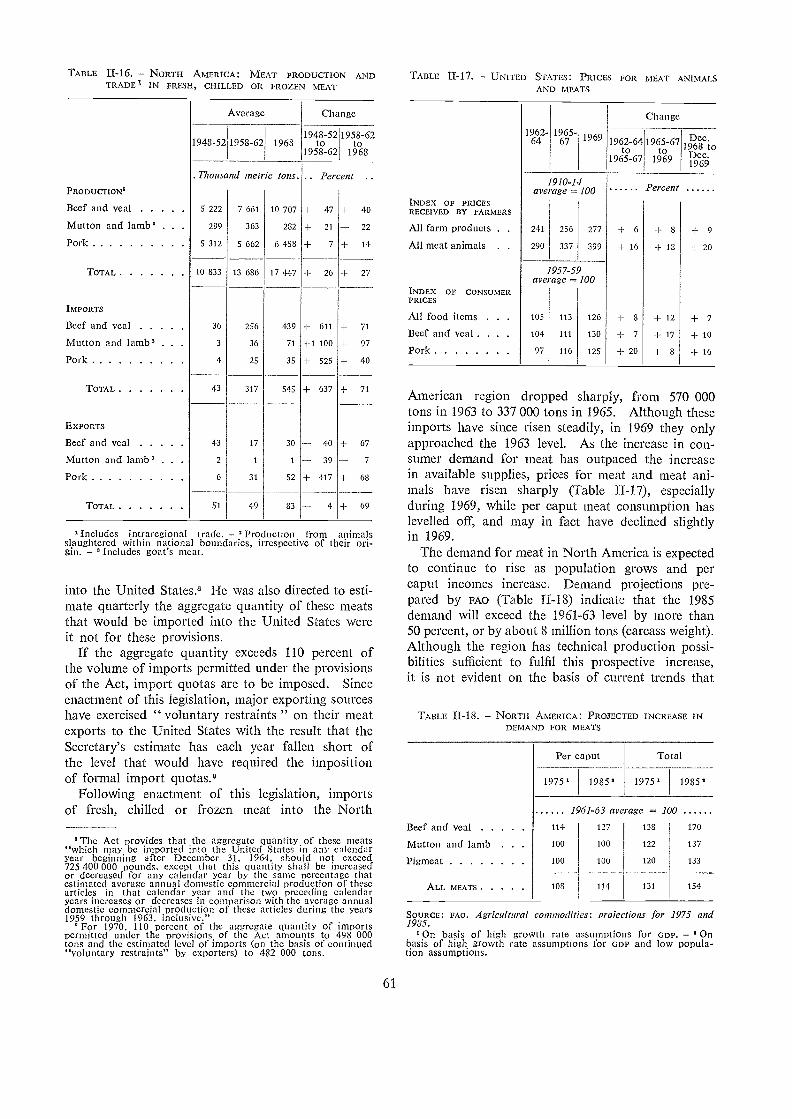
TABLE II-16. NORTFI AMERICA : MEAT PRODUCTION ANDTRADE 1 IN FRESH, CHILLED OR FROZEN MEAT
Includes intraregional trade. ' Productionfrom animalsslaughtered within national boundaries, irrespective of their ori-gin. Includes goat's meat.
into the United States.9 He was also directed to esti-mate quarterly the aggregate quantity of these meatsthat would be imported into the United States wereit not for these provisions.
If the aggregate quantity exceeds 110 percent ofthe volume of imports permitted under the provisionsof the Act, import quotas are to be imposed. Sinceenactment of this legislation, major exporting sourceshave exercised " voluntary restraints " on their meatexports to the United States with the result that theSecretary's estimate has each year fallen short ofthe level that would have required the impositionof formal import quotas.9
Following enactment of this legislation, importsof fresh, chilled or frozen rneat into the North
The Act provides that the aggregate quantityof these meats"which may be imported into the United States in any calendaryear beginning after December 31, 1964, should not exceed725 400 000 pounds, except that this quantity shall be increasedor decreased for any calendar year by the same percentage thatestimated average annual domestic commercial production of thesearticles in that calendar year and the two preceding calendaryears increases or decreases in comparison with the average annualdomestic commercial production of these articles during the years1959 through 1963. inclusive."
° For 1970. 110 percent of the aggregate quantity of importspermitted under the provisions of the Act amounts to 498 000tons and the estimated level of imports (on the basis of continued"voluntary restraints" by exporters) to 482 000 tons.
61
Beef and veal
Mutton and lamb . .
Pigmeat
ALL MEATS
19751
114
100
100
108
1985'
127
100
100
114
1975'
131
1961-63 average 100
American region dropped sharply, from 570 000tons in 1963 to 337 000 tons in 1965. Although theseimports have since risen steadily, in 1969 they onlyapproached the 1963 level. As the increase in con-sumer demand for meat has outpaced the increasein available supplies, prices for meat and meat ani-mals have risen sharply (Table II-17), especiallyduring 1969, while per caput meat consumption haslevelled off, and may in fact have declined slightlyin 1969.
The demand for meat in North America is expectedto continue to rise as population grows and percaput incomes increase. Demand projections pre-pared by FAO (Table II-18) indicate that the 1985demand will exceed the 1961-63 level by more than50 percent, or by about 8 million tons (carcass weight).Although the region has technical production possi-bilities sufficient to fulfil this prospective increase,it is not evident on the basis of current trends that
TABLE II-18. NORTH AmER1CA: PROJECTED INCREASE INDEMAND POR MEATS
1985'
170
137
133
154
SOURCE: FAO. Agricultural commodines: projections for 1975 and1985.
On basis of high growth rate assumptions for GDP, - Onbasis of high growth rate assumptions for GDP and low popula-tion assumptions.
1948-52 1958-62 19681948-52
to1958-62
1958-62to
1968
.Thousand met, ir tons. .. Per entPRODUCTION'
Beef and veal 5 222 7 661 10 707 + 47 + 40
Mutton and lamb' . . 299 363 282 + 21 -- 22
Pork 5 312 5 662 6 458 + 7 +
TOTAL 10 833 13 686 17 447 + 26 + 27
IMPORTS
Beef and veal 36 256 439 -I- 611 + 71
Mutton and lamb ' . . 3 36 71 +1 100 + 97
Pork 4 25 35 + 525 + 40
TOTAL 43 317 545 + 637 -E 71
EXPORTS
Beef and veal 43 17 30 40 67
Mutton and lamb ' . . . 2 1 1 39 7
Pork . 6 31 52 417 + 68
TOTAL 51 49 83 4 -I- 69
TABLE II-17. UNITED STATES: PRICES FOR MEAT ANIMALSAND MEATS
1962-64
1965-67 1969
Change
1962-64to
1965-67
1965-67to
1969
Dec.1968 toDec.1969
910-14average---- 100 Percent
INDE.X OF PRICESRECEIVED BY FARMERS
All farm products . 2-11 256 277 -1- 6 -E 8 + 9
All meat animals . . 290 337 399 + 16 + 18 + 20
95 7-5average 100
INDEX OF CONSUMERPRICES
All food items . . . 105 113 126 +8 + 12 +7Beef and veal . . . 104 111 130 + 7 + 17 + 10
Pork 97 116 125 + 20 +8 + 16
Average Change
Per caput Total
138
122
120
the domestic livestock industry will be able to com-pete for the labour and capital required even tomaintain the present level of self-sufficiency in meat,except at prices that would impose further burdenson the population as consumers and/or taxpayers.
GENERAL POLICIES AND PROGRAMMES
Except for the establishment of the cropland di-version programme in Canada described above, agri-cultural policies and programmes in North Americallave continued generally unchanged. They remainhowever the subject of wide-ranging discussion andreview in both countries.
This process has not led to major specific modifica-tions, although significant shifts seem to be emergingin the terms in which agricultural problems arebeing formulated and in the emphasis of the relatedprogrammes. The general direction of these suggestsa more broadly based approach, with a notablygreater concern for people (rather than for land)and for incomes (rather than for agricultural commod-ity price levels).
In Canada the review of agricultural policies andprogrammes has been led by the Task Force forAgriculture, established by the Government in 1967.The challenge facing Canadian agriculture in the1970s is seen by the Government as " long-termadjustment to ensure a commercially viable agri-cultural industry." 10 This adjustment is viewed asacceleration of the process that has been underway, at least since the 1930s, in order to bring aboutthe organization of a major portion of Canada'sagricultural resources into " the viable farms of thefuture and the successful transfer of the remainingresources into suitable non-farm employment." Areport to the Canadian. Agricultural Outlook Con-ference in November 1969 n estimated that continua-tion of recent trends would reduce the number ofCanadian farms from 431 000 in 1966 to approxi-mately 315 000 by 1980, but that this neverthelesswould be almost three times as many farms asthe anticipated gross value of production couldsupport.12
Concerning the array of present policies and mea-sures, this report adds that these " were if, itiatedfor a variety of social, economic and political rea-sons. Few of them were designed specifically toincrease the rate of adjustment on Canadian farms. . . It can be argued that some of these policieshave had an important effect on increasing the rate
" Statement to -press conference by Canadian Minister of Agri-culture Olson. 27 February 1970.
"Canadian Agricultural Outloolc Conference 1969. Vol. I. (Back-ground papers prepared by interdepartmental committees underthe leadership of the Callada Department of Agriculture.)
" On the assumption that farm production is to be the only sourceof an operator's income, and that this income is to provide atleast a $4 000 return to labour and management and a 6 percentreturn on the owner's equity in the farm business.
62
of adjustment. It can also be argued that some otherpolicies tended to keep Canadian agriculture dividedinto small units, freezing the pattern of productionand trapping people into low income situations inagriculture."
In the United States the newly appointed Secre-tary of Agriculture indicated" certain shifts in em-phasis that were to be expected in the general prob-lems and activities with which his Departmentwould be concerned: " .. it is quite evident that theDepartment of Agriculture is going to continue tobe involved, as it has been through all the years,with farm programmes and all of the activities asso-ciated therewith. But I think there are two newemphases that are clearly manifesting themselves... One is the effort to remove malnutrition fromour land ... parallel with this, and more long term,we are going to be increasingly involved in the wholearea of things that we call rural America ... activ-ities outside the metropolitan areas ... how we maybe able to improve the quality of living in ruralAmerica." These shifts in emphasis provide an im-portant part of ti-me context within which the Foodand Agriculture Act of 1965, the Agricultural Tradeand Development Act of 1954 (PL 480), and theFood Stamp Act of 1964 (all extended, in 1968, toexpire at the end of 1970) are being reconsideredby the present Congress.
Concerning ti-me Food and Agriculture Act of 1965,major points at issue include ti-me levels at whichagricultural commodity prices are to be supportedboth as these relate to " parity " and, in view ofthe importance attached to agricultural commodityexports, to world market prices; the establishmentof upper limits for ti-me total of government paymentsto individual farmers (or farms) under the commod-ity programmes ; and the advantages and disad-vantages of alternative means for converting excesscropland to other uses. Retirement of cropland ona long-term basis would be likely to be associatedwith an accelerated programme of tree-planting toextend ti-me area of private forest lands.
Extension of ti-me food stamp legislation is beingconsidered within the context of mounting concernabout the existence of hunger and malnutrition inthe United States14 and dissatisfaction with presentwelfare assistance programmes." In September 1969ti-me Secretary of Health, Education and Welfarestated" " that over the years cash assistance should
" In his statement to the National Agricultural Outlook Con-ference, February 1969.
" The White House Conference on Food. Nutrition and Health.2-4 December 1969, highlighted this concern and resulted in awide-ranging series of recorrunencfations for action.
"In August 1969, the President proposed a new approach towelfare problems that would largely replace traditional forms ofwelfare assistance with a new Family Assistance Plan that would"assure an income foundation throughout every section of Americafor all parents who cannot adequately support themselves andtheir chilcfren."
" During his appearance before the Select Committee on Nutri-tion and Human Needs, United States Senate, 15 September 1969.
eventually be substituted (in welfare assistance pro-grammes) for food stamp progranunes, " but that,during the period of transition, a notable extensionand expansion of present food assistance pro-arammes are necessary. Under existing legislation, thefood stamp programme has been expanded and itscoverage enlarged; appropriations for the fiscal year1970 were increased to $610 million, as comparedwith expenditures of $251 million during the previousfiscal year. Extending legislation, under considera-tion by the Congress in October 1970, would audio-rize further increases to $2 500 million during thefiscal year 1972.
It is not possible to foresee the effects which greateremphasis on nutrition and welfare and on ruralarea development may have on the form and con-tent of future agricultural commodity programmesin the United States. It is clear, however, that theproposed food assistance and welfare programmescannot be expected to increase total domestic foodrequirements by more than a few percentage points,or to absorb more than a small portion of the pres-ent excess food production capacity. By distin-guishing more clearly between the welfare problemsassociated with rural poverty17 and the economicand financial problems that confront commercialagricultural producers, the proposed new approachmay, however, significantly alter the terms in whichthe " farm problem " has traditionally been present-ed, and lead the search for solutions to take some-what different directions.
In the welfare context, the serious need for addi-tional and improved housing has distinct implica-
" On the basis of 1964 data, the President's National AdvisoryCommission on Rural Poverty reported in 1967 that the ruralPopulation (on farms and in small towns and villages) accountedfor approximately 40 percent of the "nation's poor"; that 25 per-cent of the rural population had incomes below the "povertyline" as compared with only 15 percent of the urban population.
Agricultural production in Oceania during 1969is estimated as slightly below the record 1968 level,with the small increase in New Zealand more thanoffset by a decrease of similar proportions in Aus-tralia. The value of agricultural exports increasedby 17 percent, recovering from the abnormally lowlevel of the previous year. Gross farm income forthe region was apparently higher in 1969. However,since production costs were also higher in bothcountries and Australian farm inventories of wheatrose sharply, realized net farm income is estimatedto have shown only a modest increase. Major objec-tives of agricultural policies and programmes in
63
tions for many forest products. In the UnitedStates, a goal of 26.2 million new housing unitshas been set for the period 1969 to 1978. Realiza-tion of this goal will require a doubling of the 1968level of construction, 1.5 million new units per year.In the longer term, demand for forest products isexpected to rise more rapidly than supplies; hence,better utilization in construction and manufacturingpractices, technological improvements in harvestingand processing, greater use of small-sized, low-quality timber, and greater intensification in forestmanagement are aimed at in order to narrow thedemand-supply gap in the United States and keepprices close to those prevailing in 1967. A NationalTask Force for Private Non-Industrial Forest Landshas been established to improve the more than 3million small private forest holdings which make up59 percent of United States commercial forest land.
The widespread concern about pollution and de-terioration of the environment is also likely to haveimportant longer term implications for the agricul-tural sectors, including forestry and fisheries. Re-duced tolerance levels and restrictions on the use ofchemicals (as pesticides, herbicides, food and feedadditives, etc.) may require modification of someproduction techniques and possibly involve additionalproduction costs. In at least some areas, additionalrequirements for recreational purposes, together withthe proposed retirement of excess cropland, maysignificantly alter present patterns of land use foragricultural and forestry purposes; Canada plansto establish 40 to 60 additional national parks be-fore 1985 and the United States has included 8rivers in its National System of Wild and ScenicRivers (created by legislative action in 1968) and isstudying another 27 rivers for possible designation.Reduced pollution of streams and coastal areas mayadd to fishery potentials in some localities.
Oceania
both countries continue to be the diversification ofproduction and the expansion of exports.
Economic activity continued at a high level through-out 1969 in both Australia and New Zealand.In New Zealand GDP at constant prices is estimatedto have increased by about 5 percent and in Austra-lia, with its minerals-based boom, by about 10 per-cent. Prices continued to rise, but at a lesser ratethan during 1968. Both investment and consump-tion demand continued strong; wages and salariesrose and interest rates remained high. Unemploy-ment continued at a low level while in NewZealand labour shortages appeared evident because
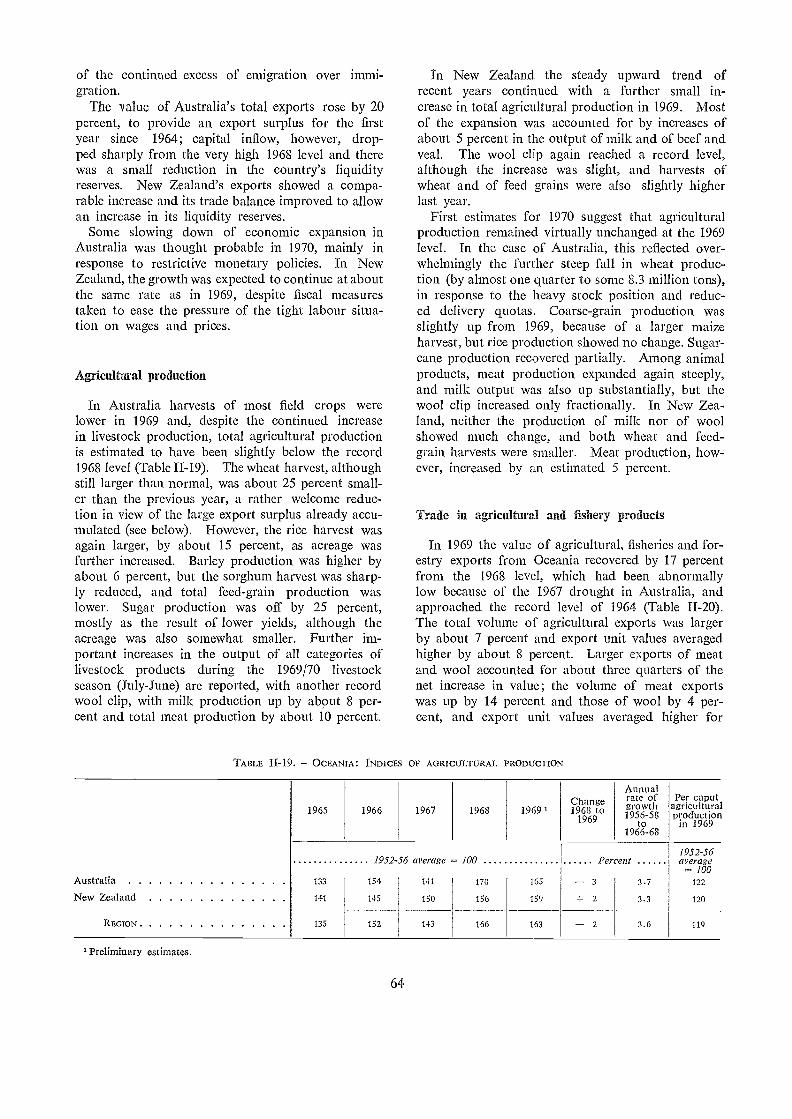
of the continued excess of emigration over immi-gration.
The value of Australia's total exports rose by 20percent, to provide an export surplus for the firstyear since 1964; capital inflow, however, drop-ped sharply from the very high 1968 level and therewas a small reduction in the country's liquidityreserves. New Zealand's exports showed a compa-rable increase and its trade balance improved to allowan increase in its liquidity reserves.
Some slowing down of economic expansion inAustralia was thought probable in 1970, mainly inresponse to restrictive monetary policies. In NewZealand, the growth was expected to continue at aboutthe same rate as in 1969, despite fiscal measurestaken to ease the pressure of the tight labour situa-tion on wages and prices.
Agricultural production
In Australia harvests of most field crops werelower in 1969 and, despite the continued increasein livestock production, total agricultural productionis estimated to have been slightly below the record1968 level (Table II-19). The wheat harvest, althoughstill larger than normal, was about 25 percent small-er than the previous year, a rather welcome reduc-tion in view of the large export surplus already accu-mulated (see below). However, the rice harvest wasagain larger, by about 15 percent, as acreage wasfurther increased. Barley production was higher byabout 6 percent, but the sorghum harvest was sharp-ly reduced, and total feed-grain production waslower. Sugar production was off by 25 percent,mostly as the result of lower yields, although theacreage was also somewhat smaller. Further im-portant increases in the output of all categories oflivestock products during the 1969/70 livestockseason (July-June) are reported, with another recordwool clip, with milk production up by abólit 8 per-cent and total meat production by about 10 percent.
'Preliminary estimates.
TABLE II-19. OCEANIA: INDICES OF AGRICULTURAL PRODUCTION
1952-56 average 100
64
In New Zealand the steady upward trend ofrecent years continued with a further small in-crease in total agricultural production in 1969. Mostof the expansion was accounted for by increases ofabout 5 percent in the output of milk and of beef andveal. The wool clip again reached a record level,although the increase was slight, and harvests ofwheat and of feed grains were also slightly higherlast year.
First estimates for 1970 suggest that agriculturalproduction remained virtually unchanged at the 1969level. In the case of Australia, this reflected over-whelmingly the further steep fall in wheat produc-tion (by almost one quarter to some 8.3 million tons),in response to the heavy stock position and reduc-ed delivery quotas. Coarse-grain production wasslightly up from 1969, because of a larger maizeharvest, but rice production showed no change. Sugar-cane production recovered partially. Among animalproducts, meat production expanded again steeply,and milk output WEIS also up substantially, but thewool clip increased only fractionally. In New Zea-land, neither the production of milk nor of woolshowed much change, and both wheat and feed-grain harvests were smaller. Meat production, how-ever, increased by an estimated 5 percent.
Trade in agricultural and fishery products
In 1969 the value of agricultural, fisheries and for-estry exports from Oceania recovered by 17 percentfrom the 1968 level, which had been abnormallylow because of the 1967 drought in Australia, andapproached the record level of 1964 (Table II-20).The total volume of agricultural exports was largerby about 7 percent and export unit values averagedhigher by about 8 percent. Larger exports of meatand wool accounted for about three quarters of thenet increase in value; the volume of meat exportswas up by 14 percent and those of wool by 4 per-cent, and export unit values averaged higher for
Change1968 to
1969
Annualrate ofgrowth1956-58
to1966-68
Per caputagriculturalproduction
in 1969
1952-56Percent average
==. 100Australia 133 154 141 170 165 3 3.7 122
New Zealand 141 145 150 156 159 + 2 3.3 120
REGION 135 152 143 166 163 2 3.6 119
1965 1966 1967 1968 1969
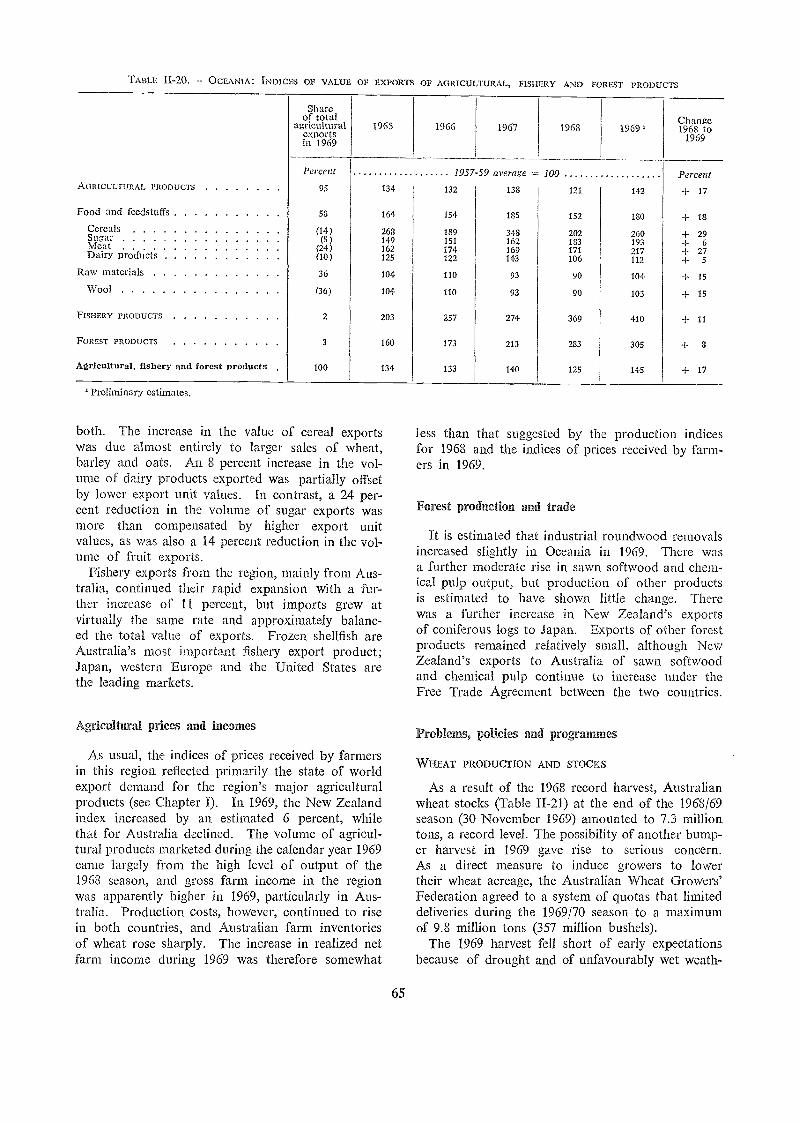
both. The increase in the value of cereal exportswas due ahnost entirely to larger sales of wheat,barley and oats. An 8 percent increase in the vol-ume of dairy products exported was partially offsetby lower export unit values. In contrast, a 24 per-cent reduction in the volume of sugar exports wasmore than compensated by higher export unitvalues, as was also a 14 percent reduction in the vol-ume of fruit exports.
Fishery exports from the region, mainly from Aus-tralia, continued their rapid expansion with a fur-ther increase of 11 percent, but imports grew atvirtually the same rate and approximately balanc-ed the total value of exports. Frozen shellfish areAustralia's most important fishery export product;Japan, western Europe and the United States arethe leading markets.
Agricultural prices and incomes
As usual, the indices of prices received by farmersin this region reflected primarily the state of worldexport demand for the region's major agriculturalproducts (see Chapter I). In 1969, the New Zealandindex increased by an estimated 6 percent, whilethat for Australia declined. The volume of agricul-tural products marketed during the calendar year 1969came largely from the high level of output of the1968 season, and gross farm income in the regionwas apparently higher in 1969, particularly in Aus-tralia. Production costs, however, continued to risein both countries, and Australian farm inventoriesof wheat rose sharply. The increase in realized netfarm income during 1969 was therefore somewhat
65
less than that suggested by the production indicesfor 1968 and the indices of prices received by farm-ers in 1969.
Forest production and trade
It is estimated that industrial roundwood removalsincreased slightly in Oceania in 1969. There wasa further moderate rise in sawn softwood and chem-ical pulp output, but production of other productsis estimated to have shown little change. Therewas a further increase in New Zealand's exportsof coniferous logs to Japan. Exports of other forestproducts remained relatively small, although NewZealand's exports to Australia of sawn softwoodand chemical pulp continue to increase under theFree Trade Agreement between the two countries.
Problems, policies an(1`, programmes
WHEAT PRODUCTION AND STOCKS
As a result of the 1968 record harvest, Australianwheat stocks (Table II-21) at the end of the 1968/69season. (30 November 1969) amounted to 7.3 milliontons, a record level. The possibility of another bump-er harvest in 1969 gave rise to serious concern.As a direct measure to induce growers to lowertheir wheat acreage, the Australian Wheat Growers'Federation agreed to a system of quotas that limiteddeliveries during the 1969/70 season to a maximumof 9.8 million tons (357 million bushels).
The 1969 harvest fell short of early expectationsbecause of drought and of unfavourably wet weath-
TABLE 11-20. OCEANIA: INDICES OF VALUE OF EXPORTS OF AGRICULTURAL, FISHERY AND FOREST PRODUCTS
Shareof total
agriculturalexportsin 1969
1965 1966 1967 1968 1969'Change1968 to
1969
Percent 1957-59 average 100 PercentAGRICULTURAL PRODUCTS 95 134 132 138 121 142 + 17
Food and fecdstuffs 58 164 154 135 152 180 -I- 18
CerealsSugarMeatDairy products
(14)(5)
(24)(10)
268149162125
189151174122
348162169143
202183171106
260193217112
+ 29+ 6+ 27+ 5
Raw materials 36 104 110 93 90 104 -I- 15
Wool (36) 104 110 93 90 103 -I- 15
FISHERY PRODuCTS 2 203 257 274 369 410 + 11
FOREST PRODuCTS 3 160 173 213 283 305 + 8
Agricultural, fishery and forest products 100 134 133 140 125 145 + 17
'Preliminary estimates.
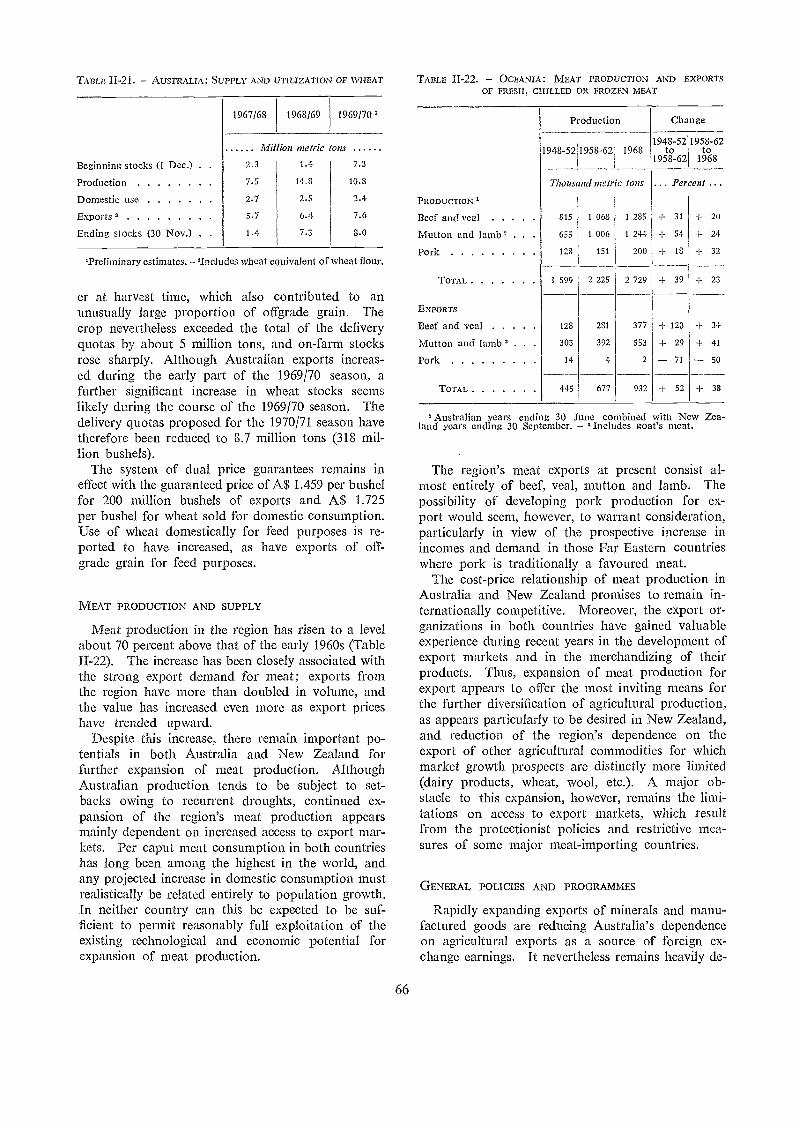
TABLE II-21. AUSTRALIA: SUPPLY AND UTILIZATION OF WHEAT
'Preliminary estimates. 'Includes wheat equivalent of wheat flour.
er at harvest time, which also contributed to anunusually large proportion of offgrade grain. Thecrop nevertheless exceeded the total of the deliveryquotas by about 5 million tons, and on-farm stocksrose sharply. Although Australian exports increas-ed during the early part of the 1969/70 season, afurther significant increase in wheat stocks seemslikely during the course of the 1969/70 season. Thedelivery quotas proposed for the 1970/71 season havetherefore been reduced to 8.7 million tons (318 mil-lion bushels).
The system of dual price guarantees remains ineffect with the guaranteed price of A$ 1.459 per bushelfor 200 million bushels of exports and A$ 1.725per bushel for wheat sold for domestic consumption.Use of wheat domestically for feed purposes is re-ported to have increased, as have exports of off-grade grain for feed purposes.
MEAT PRODUCTION AND SUPPLY
Meat production in the region has risen to a levelabout 70 percent above that of the early 1960s (TableII-22). The increase has been closely associated withthe strong export demand for meat; exports fromthe region have more than doubled in volume, andthe value has increased even more as export priceshave trended upward.
Despite this increase, there remain important po-tentials in both Australia and New Zealand forfurther expansion of meat production. AlthoughAustralian production tends to be subject to set-backs owing to recurrent droughts, continued ex-pansion of the region's meat production appearsmainly dependent on increased access to export mar-kets. Per caput meat consumption in both countrieshas long been among the highest in the world, andany projected increase in domestic consumption mustrealistically be related entirely to population growth.In neither country can this be expected to be suf-ficient to permit reasonably full exploitation of theexisting technological and economic potential forexpansion of meat production.
66
TABLE II-22. - OCEANIA: MEAT PRODUCTION AND EXPORTSOF FRESH, CHILLED OR FROZEN MEAT
Australian years et-alit g 30 June combined with New Zea-land years ending 30 September. Includes goat's meat.
The region's meat exports at present consist al-most entirely of beef, veal, mutton and lamb. Thepossibility of developing pork production for ex-port would seem, however, to warrant consideration,particularly in view of the prospective increase inincomes and demand in those Far Eastern countrieswhere pork is traditionally a favoured meat.
The cost-price relationship of meat production inAustralia and New Zealand promises to remain in-ternationally competitive. Moreover, the export or-ganizations in both countries have gained valuableexperience during recent years in the development ofexport markets and in the merchandizing of theirproducts. Thus, expansion of meat production forexport appears to offer the most inviting means forthe further diversification of agricultural production,as appears particularly to be desired in New Zealand,and reduction of the region's dependence on theexport of other agricultural commodities for whichmarket growth prospects are distinctly more limited(dairy products, wheat, wool, etc.). A major ob-stacle to this expansion, however, remains the limi-tations on access to export markets, which resultfrom the protectionist policies and restrictive mea-sures of some major meat-importing countries.
GENERAL POLICIES AND PROGRAMMES
Rapidly expanding exports of minerals and manu-factured goods are reducing Australia's dependenceon agricultural exports as a source of foreign ex-change earnings. It nevertheless remains heavily de-
1948-52 1958-62 19681948-52
to1958-62
1958-62to
1968
Thousand metric tons ... Percent ...PRODUCTION
Beef and veal 815 1 068 1 285 4- 31 4- 20
Mutton and lamb . . 655 1 006 1 244 -I- 54 + 24Pork 128 151 200 + 18 + 32
TOTAL 599 2 225 2 729 4- 39 -I- 23
EXPORTS
Beef and veal 128 231 377 4- 120 -I- 34
Mutton and lamb . . 303 392 553 -I- 29 -I- 41
Pork 14 4 2 71 50
TOTAL 445 677 932 -I- 52 -I- 38
1967/68 1968/69 1969/701
Mil ion metric toils
Beginning stocks (I Dec.) . . 2.3 1.4 7.3
Production 7.5 14.8 10.8
Domestic use 2.7 2.5 2.4
Exports 5.7 6.4 7.6
Ending stocks (30 Nov.) . 1.4 7.3 8.0
Production Change
pendent upon export markets as outlets for a majorpart of its agricultural production (particularly ofwool, wheat, rice, sugar, beef and veal). The rap-idly changing structure of its economy has notbrought important changes in Australia's agricul-tural policies.
The expansion and further diversification of exportmarkets for its traditional agricultural products re-main a major objective of the Goverrunent and ofthe various agricultural commodity boards. Domes-tically, the array of programmes and measures de-signed to increase efficiency of production and toensure competitive pricing of exports continues gen-erally unchanged. The Australian Wool MarketingCorporation, a statutory body established in 1970 toserve as the exclusive wool marketing agency, isscheduled to start its operations in the 1971/72 sea-son. The long-proposed programme for rationali-zation of the dairy industry continues to be discuss-ed between the federal and state governments; it isreported likely to come into operation during the1970/71 fiscal year.
The major agricultural problems confronting NewZealand continue also to be linked closely to chang-ing patterns in foreign demand for its traditionalexport products (meat, wool, dairy products, fruit,etc.). The renewed prospect of United Kingdommembership in the European Economic Communitygives rise to serious interest in arrangements to pro-vide New Zealand products (particularly butter,cheese and lamb) with continued access to the Unit-ed Kingdom market. In any case, diversificationof its export markets continues to be a major objec-tive of government policies, and programmes andmeasures for this purpose continue to constitutean important part of the activities of the variousagricultural commodity boards.
Early GDP estimates showed an increase for theregion as a whole of between 5 and 6 percent atconstant prices, compared with 5.5 percent in 1968and an average rate of 4.8 percent a year in 1961-67.Because of the very rapid growth of population,however, this was equal to an increase in per caputincome of only some 2 percent. Agriculture remainsthe lagging sector: production in.creased only slightly,and was insufficient to keep up with the rate ofgrowth of population.
Among the 20 countries for which 1969 data areavailable, there were 7 which showed increases inGDP of more than 6 percent (Argentina, Brazil,Colombia, Costa Rica, Mexico, Panama, and Trial-
67
The National Development Conference, which heldits second plenary session in May 1969, again stress-ed the need for further diversification of the NewZealand economy, particularly for industrialization,and emphasized development of the forestry sector.The output of forest products is expected to increasefrom 6.8 million cubic metres roundwood equiva-lent in 1968 to 9.6 million cubic metres by 1973.Even greater reliance will be placed on exotic soft-wood plantations, which already provide 80 percentof the timber consumed; it is plan.ned to increasethe annual planting rate from the present 15 000hectares to more than 18 000 hectares. Systems ofloans to private individuals and companies havebeen established to facilitate the proposed increasein planting activity. Forest industries are playingan increasingly important role and already generate12 percent of the income from industries in NewZealand, provide 41 percent of all manufacturedexports, employ 10 percent of the industrial labourforce and generate 4 percent of the GNP.
Efforts by the Agricultural Production Council topromote production adjustments to conform tochanges in export demand appear to be receivingsomewhat greater relative emphasis than in the past.Such adjustments include shifts from dairy to beefproduction, selective culling of flocks to improve thefineness of the wool produced, expansion of handlingand processing facilities for meat and fruit, etc.Credits, concessional interest rates and tax advan.-tages are the main incentives offered; however, the1969/70 national budget provided funds for grantsas incentives for shifting from dairy to beef. Estab-lishment of a grower-controlled wool marketingauthority, recommended in 1967 by a government-sponsored wool marketing study group, continuesto be discussed.
Lfì America
dad an.d Tobago), generally implying increases inper caput terms of between 2 and 3 percent. In6 other countries (Bolivia, Ecuador, Guatemala,Nicaragua, Paraguay and Venezuela) increases ofbetween 4 and 6 percent were recorded, while in theremaining 7 countries the GDP remained at levelswhich allowed little, if any, growth in the per caputlevel.
Though manufacturing accounts for the greatestshare of GDP in a few countries, particularly Argen-tina, Brazil, Chile and Mexico, the contribution ofthis sector has on the whole risen slowly, and agri-culture remains vital for the region.'s economy, par-ticularly in terms of employment. Some 45 percent
of the economically active population remains engag-ed in agriculture and, in a number of countries, theproportion reaches 60 percent. Furthermore, themajority of the Latin American countries earn overhalf of their foreign exchange from agricultural prod-ucts; only in Bolivia, Chile, Jamaica, Trinidad andTobago, and Venezuela are agricultural exports lessimportant.
Efforts to stabilize prices continued to bear fruitin a number of Latin American countries, and priceincreases were generally smaller in 1968 than hadbeen the rule until a few years ago. In Argentinaeffective wage and price policies restricted the risein food and other consumer prices to 6-7 percentcompared with increases of 25-30 percent in 1966and 1967, and in Peru the price rise was limited to6 percent. in Uruguay a wage and price freezereduced the increase in food prices from over 130percent in 1968 to only 12 percent in 1969. In-flation was stronger in Brazil, where overall consumerprices increased by some 25 percent; this was aboutthe same rate as in 1968, but much below that pre-vailing in the period of rapid inflation during theearlier 1960s. In some countries the lower farm out-put in 1968 tended to raise food prices. In Chileabove-average increases in food prices reflectednot only drought-induced shortages, but also thedevaluation of the escudo in 1969 and the institutionof higher guaranteed producer prices for a numberof products.
Vulnerability of agricultural exports to price andvolume changes in world markets, resulting fromthe heavy concentration of exports in terms of bothcommodity composition and destination, continuesto be one of the basic problems confronting LatinAmerican trade. Some 30 percent of the region'stotal shipments go to the United States, and in mostcountries exports continue to be dominated by afew primary products, such as coffee in Colombia(65 percent of total exports), bananas in Ecuador(57 percent), and sugar in Barbados (68 percent).
Growing unemployment is among the most press-ing economic and social problems the governmentsin the region are confronted with. This problemand suggestions to overcome it are a central topic ofa study presented by Raúl Prebisch to the InterAmerican Development Bank in 1970.
In it he calls for the achievement of an annualrate of economic growth of 8 percent by the endof the current decade. To attain this rate, whichcompares with an average annual increase in theGNP of 5.2 percent over the past two decades, theshare of the region's GNP devoted to investmentwould llave to increase from 18 percent at present toalmost 27 percent by 1980. In addition the demandfor consumer goods would have to be restructured infavour of the low-income groups, exports would
68
have to be increased significantly to obtain the foreignexchange necessary for the heavy capital goods im-ports required, and a major impetus should be givento regional economic integration.
Agricultural production
Although prod-uction in many countries recover-ed from the adverse weather conditions of 1967 and1968, the overall output increased only slightlyin 1969 (Table 11-23). Among individual coun-tries Argentina, the Dominican Republic, Ecuador,El Salvador and Guyana showed increases well aboveaverage, but in a number of others, includingBolivia, Brazil, Colombia and Uruguay, productionincreased less or even decreased as in. Barbados,Chile, Cuba, Guatemala, Jamaica and Mexico.
The total wheat harvest of the region, at over12 million tons, was 16 percent larger than in 1968.Output in Argentina, the main producing country,was up by 22 percent, and there was an increase of36 percent in Brazil, due to greater government ef-forts and in particular to unusually dry weather fa-vouring wheat production. Some other countries,however, experienced significant losses, in particularColombia and Uruguay. Maize production in theregion, at 32 million tons, was 6 percent lower thanin the previous year. Strong demand led to anotherexpansion of the feed-grain area in Argentina anda moderate recovery in prod.uction. Better harvests1,vere also reported from El Salvador, Guatemalaand Uruguay. In Brazil, however, depressed pricesat planting time encouraged farmers to shift frommaize to other crops, and drought at midyear re-duced yields. Bad weather also caused losses inMexico and especially in Chile, where the crop fellby one half. Regional rice production, at 9 milliontons, was 11 percent less than in 1968, primarilybecause of sharp declines in Chile and Brazil. Amongother producers, steep increases of about onefifth were recorded in Argentina and Uruguay,but the crops in Mexico and Colombia were smaller,mainly because of adverse weather.
The production of centrifugal sugar in the regionis estimated at 18.3 million, tons, slightly less thanin 1968. Output declined by 18 percent to 4.4million tons in Cuba, usually the largest producerof the region, and in Peru reduced supplies of irri-gation water resulted in the lowest crop recorded inrecent years. An increase in cane production in thenortheast of Brazil, on the other hand, more thanoffset the drought-caused redu.ction in the harvestin the south, and overall production increased by7 percent to 4.6 million tons. Also in CentralAmerica production recovered, and in Ecuador itcontinued to expand.
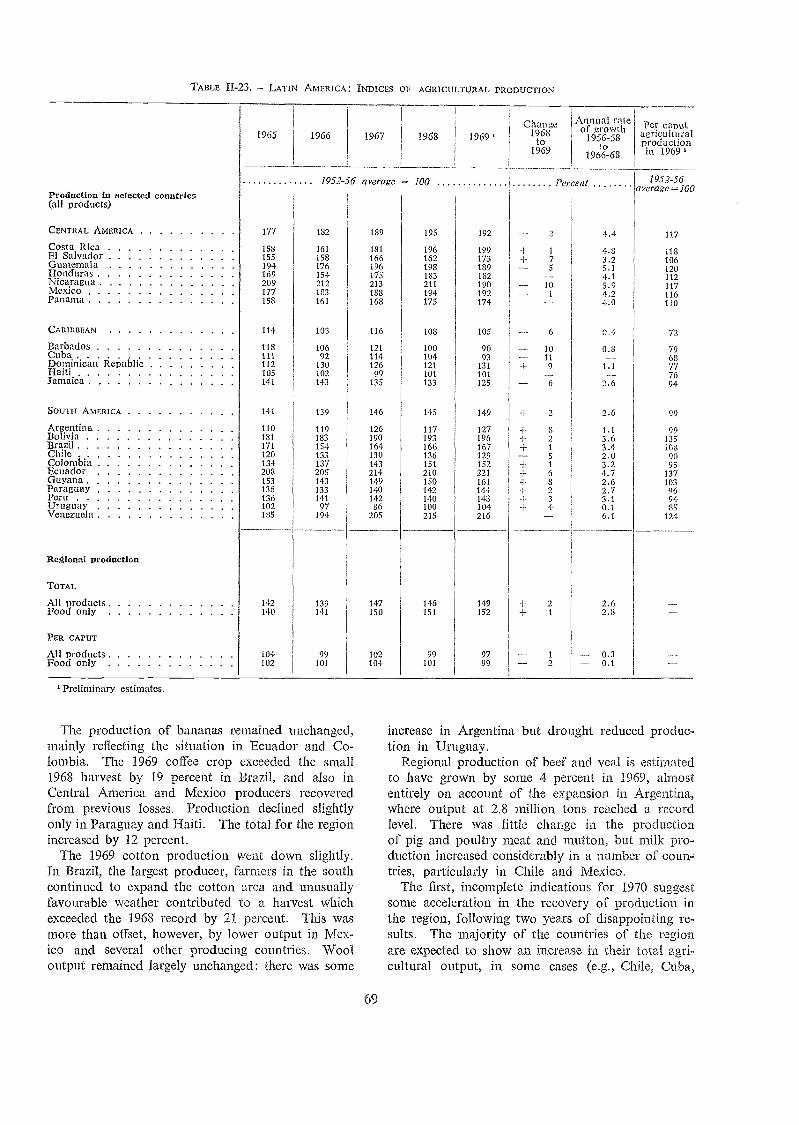
'Preliminary estimates.
The production of bananas remained unchanged,mainly reflecting the situation in Ecuador and Co-lombia. The 1969 coffee crop exceeded the small1968 harvest by 19 percent in Brazil, and also inCentral America and Mexico producers recoveredfrom previous losses. Production declined slightlyonly in Paraguay and Haiti. The total for the regionincreased by 12 percent.
The 1969 cotton production went down slightly.In Brazil, the largest producer, farmers in the southcontinued to expand the cotton area and unusuallyfavourable weather contributed to a harvest whichexceeded the 1968 record by 21 percent. This wasmore than offset, however, by lower output in Mex-ico and several other producing countries. Wooloutput remained largely unchanged: there was some
69
increase in Argentina but drought reduced produc-tion in Uruguay.
Regional production of beef and veal is estimatedto have grown by some 4 percent in 1969, almostentirely on account of the expansion in Argentina,where output at 2.8 million tons reached a recordlevel. There was little change in the productionof pig and poultry meat and mutton, but milk pro-duction increased considerably in a number of coun-tries, particularly in Chile and Mexico.
The first, incomplete indications for 1970 suggestsome acceleration in the recovery of production inthe region, following two years of disappointing re-sults. The majority of the countries of the regionare expected to show an increase in their total agri-cultural output, in some cases (e.g., Chile, Cuba,
TABLE LATIN AIVITRICA: INDICES OF AGRICULTURAL PRODUCTION
1965 1966 1967 1968 1969'Change
1968to
1969
Annual rateor growth
1956-58to
1966-68
Per caputagriculturalproductionin 1969
1952-56 average -- 100 Percent 1952-56average 100
Production in selected countries(all products)
CENTRAL AMERICA 177 182 189 195 192 2 4.4 117
Costa RicaEl SalvadorGuatemalaHondurasNicaraguaMexicoPanama
153155194169209177158
161158176154212183161
181166196175213183168
196162198183211194175
199173139182190192174
+ 1
+ 75
101
4.83.25.14.15.94.24.0
118106120112117116110
CARIBBEAN 114 103 116 108 105 6 0.4 72
BarbadosCubaDominican RepublicHaiti
118111112105
10692
130102
12111412699
100104121101
9093
131101
1011
4- 9
0.8
1.1
79687776Jamaica 141 143 135 133 125 6 2.6 94
SOUTH AMERIC;A 141 139 146 145 149 4- 2 2.6 99
ArgentinaBolivi
110181
119183
126190
117193
127196
-I- 8-I- 2
1.13.6
99135
13razil 171 154 164 166 167 -I- 1 3.4 103Chile 120 133 130 136 129 5 2.0 90Colombia 134 137 143 151 152 -I- 1 3.2 95Ecuador 208 205 214 210 221 4- 6 4.7 137Guyana 153 143 149 150 161 + 8 2.6 103Paraguay 136 133 140 142 144 4- 2 2.7 96Peru 136 141 142 140 143 -I- 3 3.1 94-Uruguay 102 97 86 100 104 4- 4- 0.1 SSVenezuela 135 194 205 215 216 -- 6.1 124
Reaional production
TOTAL
All products 142 139 147 146 149 4- 2 2.6Food only 140 141 150 151 152 + 1 2.3
PER CAPUT
All products 104 99 102 99 97 0.3Food only 102 101 104 101 99 2 0.1
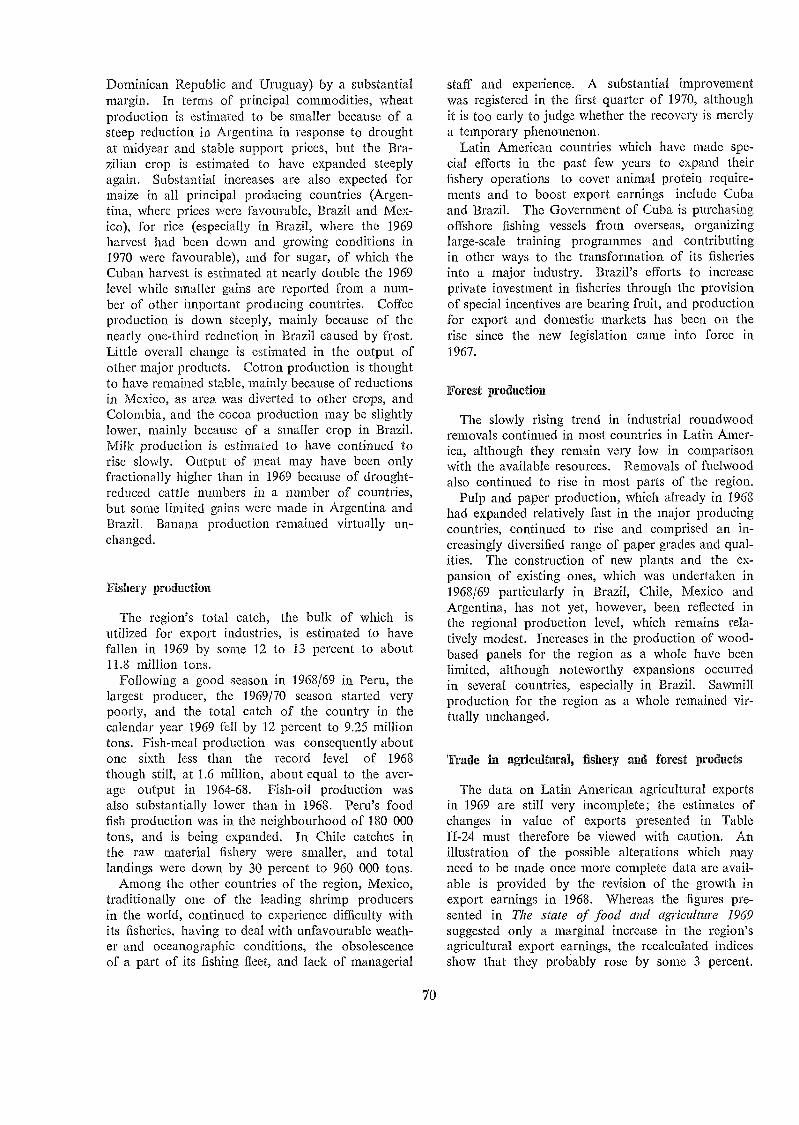
Dominican Republic and Uruguay) by a substantialmargin. In terms of principal commodities, wheatproduction is estimated to be smaller because of asteep reduction in Argentina in response to droughtat midyear and stable support prices, but the Bra-zilian crop is estimated to have expanded steeplyagain. Substantial increases are also expected formaize in all principal producing countries (Argen-tina, where prices were favourable, Brazil and Mex-ico), for rice (especially in Brazil, where the 1969harvest had been down and growing conditions in1970 were favourable), and for sugar, of which theCuban harvest is estimated at nearly double the 1969level while smaller gains are reported from a num-ber of other important producing countries. Coffeeproduction is down steeply, mainly because of thenearly one-third reduction in Brazil caused by frost.Little overall change is estimated in the output ofother major products. Cotton production is thoughtto have remained stable, mainly because of reductionsin Mexico, as area was diverted to other crops, andColombia, and the cocoa production may be slightlylower, mainly because of a smaller crop in 13razil.Milk production is estimated to have continued torise slowly. Output of meat may have been onlyfractionally higher than in 1969 because of drought-reduced cattle numbers in a number of countries,but some limited gains were made in Argentina andBrazil. Banana production remained virtually un-changed.
Fishery production
The region's total catch, the bulk of which isutilized for export industries, is estimated to havefallen in 1969 by some 12 to 13 percent to about11.8 million tons.
Following a good season in 1968/69 in Peru, thelargest producer, the 1969/70 season started verypoorly, and the total catch of the country in thecalendar year 1969 fell by 12 percent to 9.25 milliontons. Fish-rneal production was consequently aboutone sixth less than the record level of 1968though still, at 1.6 million, about equal to the aver-age output in 1964-68. Fish-oil production wasalso substantially lower than in 1968. Peru's foodfish production was in the neighbourhood of 180 000tons, and is being expanded. In Chile catches inthe raw material fishery were smaller, and totallandings were down by 30 percent to 960 000 tons.
Among the other countries of the region, Mexico,traditionally one of the leading shrimp producersin the world, continued to experience difficulty withits fisheries, having to deal with unfavourable weath-er and oceanographic conditions, the obsolescenceof a part of its fishing fleet, and lack of managerial
70
staff and experience. A substantial improvementwas registered in the first quarter of 1970, althoughit is too early to judge whether the recovery is merelya temporary phenomenon.
Latin American countries which have made spe-cial efforts in the past few years to expand theirfishery operation.s to cover animal protein require-ments and to boost export earnings include Cubaand Brazil. The Government of Cuba is purchasingoffshore fishing vessels from overseas, organizinglarge-scale training programmes and contributingin other ways to the transformation of its fisheriesinto a major industry. Brazil's efforts to increaseprivate investment in fisheries through the provisionof special incentives are bearing fruit, and productionfor export and domestic markets has been on therise since the new legislation came into force in1967.
Forest production
The slowly rising trend in industrial roundwoodremovals continued in most countries in Latin Amer-ica, although they remain very low in comparisonwith the available resources. Removals of fuelwoodalso continued to rise in most parts of the region.
Pulp and paper production, which already in 1968had expanded relatively fast in the major producingcountries, continued to rise and comprised an in-creasingly diversified range of paper grades and qual-ities. The construction of new plants and the ex-pansion of existing ones, which was undertaken in1968/69 particularly in Brazil, Chile, Mexico andArgentina, has not yet, however, been reflected inthe regional production level, which remains rela-tively modest. fncreases in the production of wood-based panels for the region as a whole have beenlimited, although noteworthy expansions occurredin several countries, especially in Brazil. Sawmillproduction for the region as a whole remained vir-tually unchanged.
Trade in agricultural, fishery and forest products
The data on Latin American agricultural exportsin 1969 are still very incomplete; the estimates ofchanges in value of exports presented in TableII-24 must therefore be viewed with caution. Anillustration of the possible alterations which mayneed to be made once more complete data are avail-able is provided by time revision of the growth inexport earnings in 1968. Whereas the figures pre-sented in The state of food and agriculture 1969suggested only a marginal increase in the region'sagricultural export earnings, the recalculated indicesshow that they probably rose by some 3 percent.
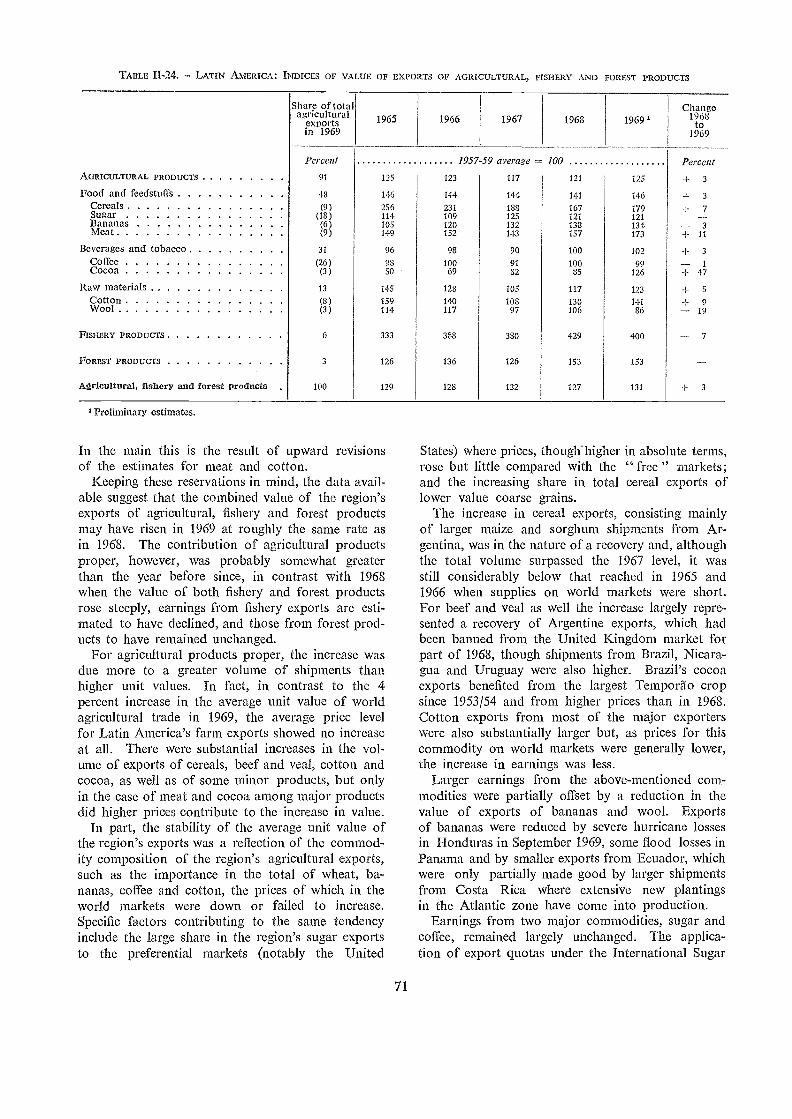
TABLE II-24. LATIN AMERICA: INDICES OF VALUE OF EXPORTS OF AGRICULTURAL, FISHERY AND FOREST PRODUCTS
In the main this is the result of upward revisionsof the estimates for meat and cotton.
Keeping these reservations in mind, the data avail-able suggest that the combined value of the region'sexports of agricultural, fishery and forest productsmay have risen in 1969 at roughly the same rate asin 1968. The contribution of agricultural productsproper, however, was probably somewhat greaterthan the year before since, in contrast with 1968when the value of both fishery and forest productsrose steeply, earnings from fishery exports are esti-mated to have declined, and those from forest prod-ucts to have remained unchanged.
For agricultural products proper, the increase wasdue more to a greater volume of shipments thanhigher unit values. In fact, in contrast to the 4percent increase in the average unit value of worldagricultural trade in 1969, the average price levelfor Latin America's farm exports showed no increaseat all. There were substantial increases in the vol-ume of exports of cereals, beef and veal, cotton andcocoa, as well as of some minor products, but onlyin the case of meat and cocoa among major productsdid higher prices contribute to the increase in value.
In part, the stability of the average unit value ofthe region's exports was a reflection of the commod-ity composition of the region's agricultural exports,such as the importance in the total of wheat, ba-nanas, coffee and cotton, the prices of which in theworld markets were down or failed to increase.Specific factors contributing to the same tendencyinclude the large share in the region's sugar exportsto the preferential markets (notably the United
71
States) where prices, though-higher in absolute terms,rose but little compared with the " free " markets;and the increasing share in total cereal exports oflower value coarse grains.
The increase in cereal exports, consisting mainlyof larger maize and sorghum shipments from Ar-gentina, was in the nature of a recovery and, althoughthe total volume surpassed the 1967 level, it wasstill considerably below that reached in 1965 and1966 when supplies on world markets were short.For beef and veal as well the increase largely repre-sented a recovery of Argentine exports, which hadbeen banned from the United Kingdom market forpart of 1968, though shipments from Brazil, Nicara-gua and Uruguay were also higher. Brazil's cocoaexports benefited from the largest Tempordo cropsince 1953/54 and from higher prices than in 1968.Cotton exports from most of the major exporterswere also substantially larger but, as prices for thiscommodity on world markets were generally lower,the increase in earnings was less.
Larger earnings from the above-mentioned com-modities were partially offset by a reduction in thevalue of exports of bananas and wool. Exportsof bananas were reduced by severe hurricane lossesin Honduras in September 1969, some flood losses inPanama and by smaller exports from Ecuador, whichwere only partially made good by larger shipmentsfrom Costa Rica where extensive new plantingsin the Atlantic zone have come into production.
Earnings from two major commodities, sugar andcoffee, remained largely unchanged. The applica-tion of export quotas under the International Sugar
Share of total Changeagricultural
exportsin 1969
1965 1966 1967 1968 1969 1968to
1969
Percent 1957-59 average 100 PercentAGRICULTURAL PRODUCTS . 91 125 123 117 121 125 + 3
Food and feedstuffs 48 146 144 144 141 146 -I- 3
CerealsSugar
(9)(18)
256114
231109
188125
167121
179121
-I- 7
Bananas (6) 105 120 132 138 134 3Meat (9) 149 152 143 157 173 -I- 11
Beverages and tobacco 31 96 98 90 100 102 -I- 3
Coffee (26) 98 100 91 100 99 1
Cocoa (3) 50 69 82 35 126 + 47Raw materials . 13 145 128 105 117 123 + 5
Cotton (3) 159 140 108 130 141 + 9Wool . (3) 114 117 97 106 86 19
FISHERY PRODUCTS 6 333 388 380 429 400 7FOREST PRODUCTS 3 126 136 126 153 153
Agricultural, fishery and forest products 100 129 128 122 127 131 -I- 3
' Preliminary estimates.
Agreement and the nonredistribution of the quotashortfalls caused a slight drop in the volume of sugarshipments, but this was offset by the higher pricesreceived under the agreement. Cuba is reported tohave exported about 4.8 million tons, slightly morethan in 1968, increasing its shipments to free marketdestinations, particularly Japan; its exports to theU.S.S.R. were the smallest since 1963.
The growth in the volume of coffee exports was alsoheld down by quota restrictions under the Inter-national Coffee Agreement and, although the fallingtrend of prices was reversed at midyear particularlyfor Latin American (as contrasted with African)coffees, the effect on the average price for the yearwas not very marked.
The information on Latin American 1969 importsis too incomplete to perinit a detailed examination,as there are still no official data for most major im-porting countries. On the whole it would seem,however, that cereal imports llave probably fallenbelow the peak level of 1968, when they liad risen to8 million tons, following several years of drought.The wheat purcha.ses of many major importing coun-tries are reported to llave declined in 1969. Brazil'simports were reduced by about 10 percent tobelow the 1966 level and following the improve-ment in agricultural production the wheat and wheatflour imports of the Caribbean countries probablylevelled off, and perhaps even declined, followingthe rise in 1968.
Following the sharp increase of the previous year,Latin American earnings from exports of fishery prod-ucts declined by 7 percent in 1969, mainly reflect-ing the sharp drop in fish-meal exports from Chileand Peru. Export prices for Peruvian fish mealwere about 20 percent above the level of the previousyear, but partly because production was reduced andpartly because of the substitution of soybean mealfor fish meal in feed rations in the United States,the volume of exports declined sharply. This reduc-tion more than offset the continued increase inPeruvian exports to European countries, where com-petition with other feed components is of less im-portance. Exports to the Federal Republic of Ger-many, Peru's most important fish-meal market in1969, were encouraged by a provision (rescinded,however, in December) which required that mixedfeeds include a fixed proportion of fish meal.
Peru's exports of -fishery products for human con-sumption were characterized by mixed trends, withfrozen fish and shrimp sales increasing and cannedfish (bonito) decreasing. Trends in Chilean exportsof fish meal followed a pattern similar to that ofPeru, and recently initiated attempts to sell freshhake in United States markets have liad only modestsuccess, although longer term prospects should bemore favourable.
72
Shrimp exports to the United States are the domi-nant element in the trade of the other countries ofthe region. India threatened to displace Mexico asthe leading supplier in this market, as Mexican ex-ports continued to decline because of disappointingresults in the fishery sector. Reduced quantities ofshrimp were also shipped to the United States fromthe Caribbean area, while Central American exportsremained at about the same level as in 1968. SouthAmerican suppliers, in contrast, succeeded in increas-ing their shrimp sales to the United States.
Earnings from forest products are estimated tohave remained unchanged in 1969, largely reflectingthe stable level of sawnwood exports which accountfor 70 percent of the total. Parand pine sawnwoodexports from Brazil to the United Kingdom fellsharply, but this was partly offset by higher exportsto other western European countries. Exports ofsawn hardwood to the United States from the mainsuppliers in the region Brazil, Colombia andEcuador expanded appreciably.
Livestock development
The contribution of livestock to the economies ofLatin America varies widely as between Argentina,Brazil, Mexico, Paraguay and Uruguay, where it is
a major agricultural activity, and the rest of theregion, where its contribution is less important(Table II-25).
Meat accounts for about 65 percent of the totalvalue of animal production in the region; milkand dairy products 20 percent; and eggs, wool,hides and skins 15 percent. The most importantanimals, cattle, increased in number from 213 millionin 1962/63 to 248 million in 1968/69 and accountfor about 70 percent of the region's meat productionand nearly all its milk. Pigmeat accounts for afurther 17 percent of the total meat output, the num-
TABLE 11-25. LATIN AMERICA: CONTRIBUTION OF TOTALAGRICULTURE AND LIVESTOCK TO GDP AND OF LIVESTOCK TO
AGRICULTURAL GDP IN SELECTED COUNTRIES, 1968
Totalagriculture,as percent
of GDP
Livestock production.as percent of
Total Agricultur-GDP al GDP
Percent
Argentina 15 7 48
Brazil 27 7 25
Mexico 16 5 30
Paraguay 33 10 35
Uruguay 13 lI 70
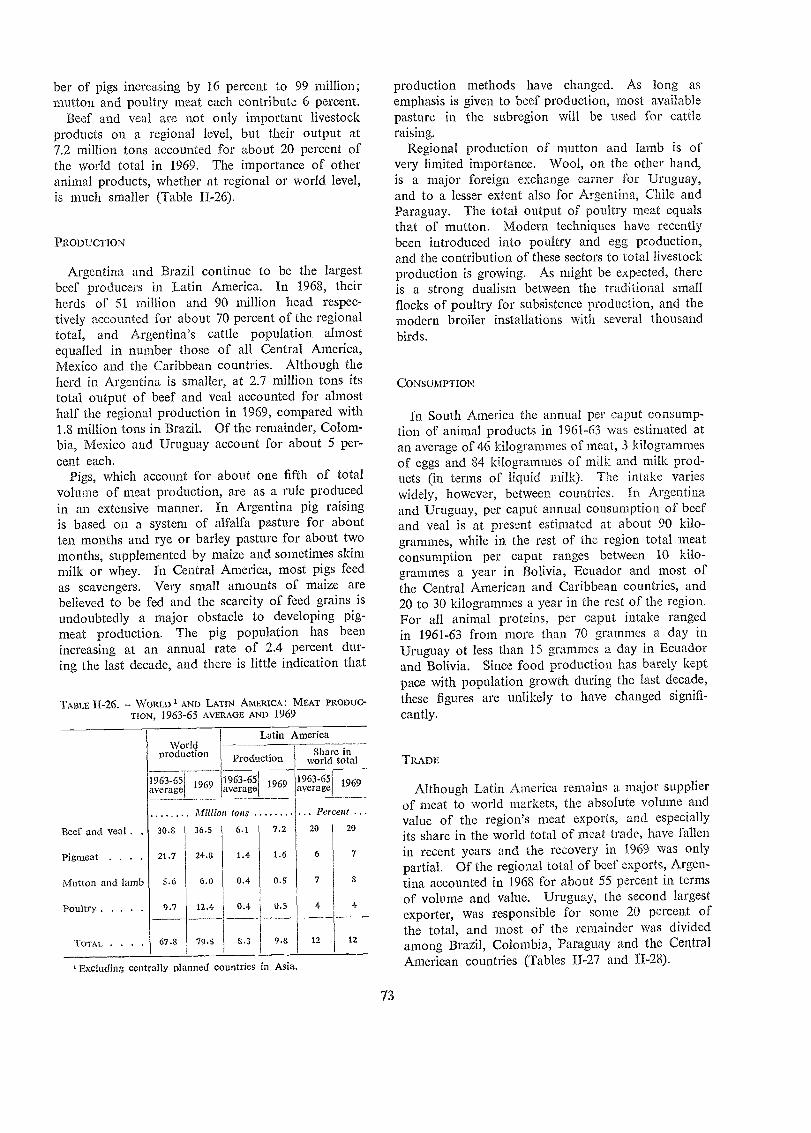
ber of pigs increasing by 16 percent to 99 million;mutton and poultry meat each contribute 6 percent.
Beef and veal are not only important livestockproducts on a regional level, but their output at7.2 million tons accounted for about 20 percent ofthe world total in 1969. The importance of otheranimal products, whether at regional or world level,is much smaller (Table II-26).
PRODUCTION
Argentina and Brazil continue to be the largestbeef producers in Latin America. In 1968, theirherds of 51 million and 90 million head respec-tively accounted for about 70 percent of the regionaltotal, and Argentina's cattle population almostequalled in number those of all Central America,Mexico and the Caribbean countries. Although theherd in Argentina is smaller, at 2.7 million tons itstotal output of beef and veal accounted for ahnosthalf the regional production in 1969, compared with1.8 million tons in Brazil. Of the remainder, Colom-bia, Mexico and Uruguay account for about 5 per-cent each.
Pigs, which account for about one fifth of totalvolume of meat production, are as a rule producedin an extensive rnanner. In Argentina pig raisingis based 011 a system of alfalfa pasture for aboutten months and rye or barley pasture for about twomonths, supplemented by maize and sometimes skimmilk or whey. In Central America, most pigs feedas scavengers. Very small amounts of maize arebelieved to be fed and the scarcity of feed grains isundoubtedly a major obstacle to developing pig-meat production. The pig population has beenincreasing at an annual rate of 2.4 percent dur-ing the last decade, and there is little indication that
TABLE 11-26. - WORLD 1 AND LATIN AMERICA: MEAT PRODUC-TioN, 1963-65 AVERAGE AND 1969
Worldproduction Production
Latin America
Excluding centrally planned countries in Asia.
Share inworld total
73
production methods have changed. As long asemphasis is given to beef production, most availablepasture in the subregion will be used for cattleraising.
Regional production of mutton and Iamb is ofvery limited importan.ce. Wool, ort the other hand,is a major foreign exchange earlier for Uruguay,and to a lesser extent also for Argentina, Chile andParaguay. The total output of poultry meat equalsthat of mutton. Modern techniques have recentlybeen introduced into poultry and egg production.,and the contribution of these sectors to total livestockproduction is growing. As might be expected, thereis a strong dualism between the traditional smallflocks of poultry for subsistence production, and themodern broiler installations with several thousandbirds.
CONSUMPTION
In South America the annual per caput consump-tion of animal products in 1961-63 was estimated atan average of 46 kilogrammes of meat, 3 kilogrammesof eggs and 84 kilogrammes of milk and milk prod-ucts (in terms of liquid milk). The intake varieswidely, however, between countries. In Argentinaand Uruguay, per caput annual consuniption of beefand veal is at present estimated at about 90 kilo-grammes, while in the rest of the region total meatconsumption per caput ranges between 10 kilo-grammes a year in Bolivia, Ecuador and most ofthe Central American and Caribbean countries, and20 to 30 kilogrammes a year in the rest of the region.For all animal proteins, per caput intake rangedin 1961-63 from more than 70 grammes a day inUruguay ot less than 15 grammes a day in Ecuadorand Bolivia. Since food production has barely keptpace with population growth during the last decade,these figures are unlikely to have changed signifi-cantly.
TRADE
Although Latin America remains a major supplierof meat to world markets, the absolute volume andvalue of the region's meat exports, and especiallyits share in the world total of meat trade, have fallenin recent years and the recovery in 1969 was onlypartial. Of the regional total of beef exports, Argen-tina accounted in 1968 for about 55 percent in termsof volume and value. Uruguay, the second largestexporter, was responsible for some 20 percen.t ofthe total, and most of the remainder was dividedamong Brazil, Colombia, Paraguay an.d the CentralAmerican countries (Tables 11-27 and II-28).
1963-65average 1969 1963-65
average 1969 1963-65average 1969
Million tons Percent
Beef and veal . 30.8 36.5 6.1 7.2 20 20
Pigmeat . . 21.7 24.8 1.4 1.6 6 7
Mutton and lamb 5.6 6.0 0.4 0.5 7 8
Poultry 9.7 12.4 0.4 0.5
TOTAL . . . 67.8 79.5 8.3 9.8 12 12
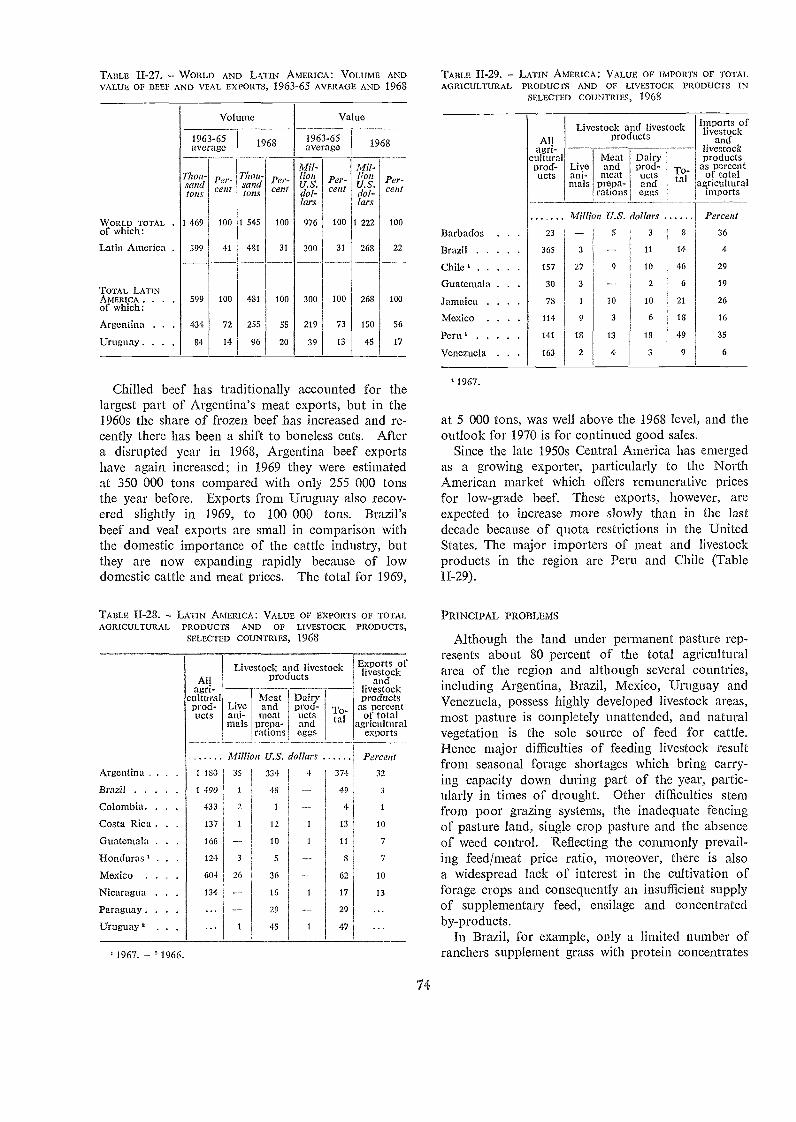
TABLE 11-27. WORLD AND LATIN AMERICA: VOLUME ANDVALUE OF BEEF AND VEAL EXPORTS, 1963-65 AVERAGE AND 1968
1963-65average
Volume
1968 1963-65average
Value
1968
Chilled beef has traditionally accounted for thelargest part of Argentina's meat exports, but in the1960s the share of frozen beef has increased and re-cently there has been a shift to boneless cuts. Aftera disrupted year in 1968, Argentina beef exportshave again increased; in 1969 they were estimatedat 350 000 tons compared with only 255 000 tonsthe year before. Exports from Uruguay also recov-ered slightly in 1969, to 100 000 tons. Brazil'sbeef and veal exports are small in comparison withthe domestic importan.ce of the cattle industry, butthey are now expanding rapidly because of lowdomestic cattle and meat prices. The total for 1969,
1967. ' 1966.
74
1967.
at 5 000 tons, was well above the 1968 level, and theoutlook for 1970 is for continued good sales.
Sin.ce the late 1950s Central America has emergedas a growing exporter, particularly to the NorthAmerican market which offers remunerative pricesfor low-grade beef. These exports, however, areexpected to increase more slowly than in the lastdecade because of quota restrictions in the UnitedStates. The rnajor importers of meat and livestockproducts in the region are Peru and Chile (TableII-29).
PRINCIPAL PROBLEMS
Although the land under permanent pasture rep-resents about 80 percent of the total agriculturalarea of the region and although several countries,including Argentina, Brazil, Mexico, Uruguay andVenezuela, possess highly developed livestock areas,most pasture is completely unattended, and naturalvegetation is the sole source of feed for cattle.Hence major difficulties of feeding livestock resultfrom seasonal forage shortages which bring carry-ing capacity down during part of the year, partic-ularly in times of drought. Other difficulties stemfrom poor grazing systems, the inadequate fencingof pasture land, single crop pasture and the absenceof weed control. 'Reflecting the commonly prevail-ing feed/meat price ratio, moreover, there is alsoa widespread lack of interest in the cultivation offorage crops and consequently an insufficient supplyof supplementary feed, ensilage and concentratedby-products.
In Brazil, for example, only a limited number ofranchers supplement grass with protein concentrates
Argentina . . 1 180 35 I 334 4 374 32
Brazil 1 490 1 48 49 3
Colombia. . 433 2 1 4 1
Costa Rica . 137 1 12 1 13 10
Guatemala . 166 10 1 11 7
Honduras'. 124 3 5 3 7
Mexico . . 604 26 36 62 10
Nicaragua . 134 16 17 13
Paraguay . . 29 29
Uruguay' . 1 45 47
Barbados . 23 5 3 8 36
Brazil 365 3 11 14 4
Chile 157 27 9 10 46 29
Guatemala . 30 3 2 6 19
Jamaica . . 73 1 10 10 21 26
Mexico . . 114 9 3 6 18 16
Peru 141 13 13 18 49 35
Venezuela . 163 2 4 3 9 6
Thou-sandtons
Per-cent
Thou-sandtons
Per-cent
Mil-110,,U.S.dol-lars
Per-cent
Mil-lionU.S.dol-lars
Per-cent
WORLD TOTAL .
of which:1 469 100 1 545 100 976 100 1 222 100
Latin America . 599 41 431 31 300 31 268 22
TOTAL LA1INAMERICA . . .
of which:599 100 481 100 300 100 268 100
Argentina . . . 434 72 255 55 219 73 150 56
Uruguay. . . . 84 14 96 20 39 13 45 17
TABLE II-29. LATIN AMERICA: VALUE OF IMPORTS OF TOTALAGRICULTURAL PRODUCTS AND OF LIVESTOCK PRODUCTS IN
SELECTED COUNTRIES, 1968
AllLivestock and livestock
productsImports oflivestock
andagii- livestock
Liveani-mals
Meatandmeat
prepa-rations
Dairyprod-uctsandeggs
To-tal
culturalprod-ucts
productsas percentof total
agriculturalimports
Million U.S. dollars Percent
TABLE 11-28. LATIN AMERICA: VALUE OF EXPORTS OF TOTALAGRICULTURAL PRODUCTS AND OF LIVESTOCK PRODUCTS,
SELECTED COUNTRIES, 1968
AhlLivestock and livestock
productsExports oflivestock
andagri- livestock
Meat Dairycultural productsprod-ucts
Liveani-mals
andmeat
prepa-rations
prod-uctsandeggs
To-tal
as percentof total
agriculturalexports
Million U.S. dollars Percent
or other feeds. There are no large-scale feedlotsfor fattening cattle, although the country produceslarge quantities of feed items, including molasses,cottonseed meal, cassava and maize. In CentralAmerican countries supplementary feeding of beefcattle is just beginning and most manufactured feedsare n.ow imported because of the scarcity of domes-tically produced grains.
Another major problem is the prevalence of ani-mal diseases and pests which, besides causing a largenumber of deaths, reduce yields of meat, milk andwool. For Brazil, it was estimated in the mid-1960sthat infections and parasitic diseases, togetherwith insufficient feed with an inadequate mineralcontent, are annually responsible for the death ofslightly over 3 million cattle, 10 million pigs andsome 2 million sheep and goats, valued at approxi-mately 55 000 million cruzeiros (at 1960 prices),equal to one quarter of the total value of livestockproduction. Foot-and-mouth disease control in Lat-in America suffers from serious deficiencies in thequality control of vaccines. The identification offield strains of virus and the general managementof field control campaigns also leave much to bedesired. Over the entire region there are not enoughwell-qualified veterinarians specialized in meat hy-giene, and in most countries meat hygiene regula-tions require revision. It should be noted, however,that Latin America is so far free from rinderpest,African horse sickness, African swine fever and manyof the arthropoid-borne diseases which exist in othercontinents.
Breeding limitations also militate against an increasein animal productivity. Although new breeds arebeing introduced in all countries, most of the cattle,particularly in Central America and in the Andeancountries, are of native breeds that have existedsince colonial times and which yield relatively littlemeat. The expansion of milk production is in manycases hampered by the lack of dairy cattle suitedto tropical conditions, the shortage of good bullsand an inadequate breeding policy in the geneticprogrammes followed by stock farmers, as well asby an inadequate supply of feedstuffs suitable forimproved stock.
POLICIES AND PROGRAMMES
Since the mid-1960s significant efforts have beenmade to support livestock development in the major-ity of the Latin American countries. Althoughsome countries, including Chile and Uruguay, haveincluded comprehensive livestock development pro-grammes in their general agricultural developmentplans, most activities in this field have resulted fromspecific livestock programmes and projects, mainlyfor beef and dairy cattle and poultry.
75
Argentina has recently formulated a general de-velopment plan to cover the period 1970-74. Itputs major emphasis on the livestock sector, includ-ing adequate price policies and a scheme for exportpromotion. Bolivia aims at pushing up beef pro-d.uction in the area of El Chaco and Santa Cruzby 20 000 tons over the next 10 years. The Agri-cultural Bank of Bolivia is planning to spend $7million on it, including a $5 million loan from theInter-American Development Bank (IDB).
The Brazilian Government is now stepping upcredit programmes that permit ranchers to borrowmoney for pasture improvement, construction ofwater facilities, etc. IBRD has lent Brazil $40 millionto be matched with an equal amount of Brazilianfunds for a livestock development programme incertain areas of Minas Gerais, Mato Grosso, SiloPaulo and Rio Grande do Sul. In March 1969,IDB approved a loan of $26 million, also to be match-ed with local funds, for a credit programme to expandbeef production in the States of Bahia, Minas Geraisand Espirito Santo. Both programmes involve super-vised credit and their short-range goals include increas-ing pasture-carrying capacity, improving weaningrates and reducing the time required to bring steersto slaughter weight.
In Chile the production of poultry, pigmeat andespecially milk reached record figures in 1969. The10 percent increase in milk production is said tobe mainly due to the more production-oriented pricepolicy of recent years and a loan for dairy develop-ment from IBRD. The current system of prohibit-ing the sale of beef for 11 days of each month,however, will be maintained throughout 1970 in orderto promote the consumption of locally producedmeat such as pigmeat, poultry and fish, and to reducebeef imports.
With the assistance of IDB, IBRD and bilateral aid,Colombia is promoting beef production on its Atlan-tic coast and dairy farming close to consumptionareas. According to its livestock development planand assisted by a dairy loan from IBRD, Ecuadorintends to utilize some 480 000 hectares near thecoast for beef and dairy production. Guyana alsointends to go in for beef production with the helpof an IBRD loan, and the Caribbean Free Trade Asso-ciation (CARIFTA) area is considered as a major po-tential market.
In Mexico, which gets financial assistance fromIBRD for its agricultural sector, livestock productionreceives greater attention now from both public andprivate investors. In 1969 an allocation of 110 millionpesos was made to the National Bank for Agricul-tural Credit, to provide loans to farmers for the ac-quisition of breeding animals, livestock installations,agricultural machinery and equipment for small-scale irrigation. In September 1969 the Govern-
ment of Paraguay established a livestock fund to beadministered by the Central Bank. This fund willhave resources of $8.3 million, provided by IBRDand United States bilateral assistance, and will grantloans through the National Development Bank,mainly for the expansion of livestock advisory ser-vices, including pasture improvement and eradica-tion of foot-and-mouth disease. During the lastnine years Uruguay improved more than 1 millionhectares of pasture land under its livestock develop-ment plan. The overall target will probably beincreased by applying improvement measures atthe rate of 250 000 hectares annually during theperiod 1970-75. Meat exports are expected to in-crease by 80 percent within the next five years.
In Central America, Guatemala is promoting beefproduction through the operation of livestock sta-tions, the import of breeding stock and an artificialinsemination programme. The National Agricul-tural Bank is operating beef production in AlbaVerapraz and the National Enterprise of EconomicDevelopment of Petén is encouraging beef productionin the development of this zone. The recent con-struction of a cattle feed manufacturing plant isexpected to contribute toward improving the qualityof export beef as well as helping to feed artimalsduring the dry SeaS011. Honduras obtained a 50-year $2.6 million interest-free loan from IDA to beused for extending long-term finance for ranch de-velopment. Nicaraguan beef production is beingencouraged by a joint venture of IDB and the Nica-raguan National Bank aimed at increasing the rateof reproduction, reducing mortality rates, achievinghigher meat yields and lowering the slaughtering ageof animals. IDB has also loaned the National Devel-opment Institute money for importing cattle whichare to be distributed on credit to farmers throughoutthe country. Panama is introducing new breeds ofanimals and a national campaign to fight diseaseas part of its livestock programme. Similar schemesare under way in Costa Rica and El Salvador.
Meat producers meeting at Montevideo in October1969 under the aegis of the Latin American FreeTrade Association (LAFTA) agreed on a 3-pointprogramme of joint action on exports. ft includesprovisions for concerted action on access to markets,obtaining better prices, and coordinating action onmeat with that on other agricultural exports.
Livestock development in the region is alsoassisted by a number of projects financed by the Spe-cial Fund of the United Nations Developme,nt Pro-gramme (uNDP/sF) and executed by FAO. As of Novem-ber 1969, there were 15 projects in operation, withthe help of a UNDP contribution of $15 million.Two thirds of the projects deal with research andtraining, including the Faculty of Veterinary Medi-cine and Animal Husbandry in Colombia, the In-
76
stitute for Tropical and High Altitude Research inPeru and veterirtary education in Mexico. Othersemphasize production aspects, as in the case of theprojects on the intensification of animal productionin Argentina and dairy and beef productivity inVenezuela.
FUTURE OUTLOOK
Biological and technical problems inherent in ani-mal production, the relatively low level of capitalinput, including that for pasture improvement, feed,fertilizers and other agricultural requisites, as wellas institutional problems stemming from a defec-tive agrarian structure, will continue to hamper thegrowth of the livestock sector in the region. Nat-ural factors are also certain to create setbacks in someyears, as was the case in 1968 and early 1969 when aprolonged drought affected a large part of LatinAmerica. However, the emphasis currently being plac-ed on livestock production gives ground for hope thrttthese problems can be gradually overcome. Cattleraising, particularly for beef cattle, is considered tohave the potential of becoming a significant enter-prise in a growing number of countries in the region..
Judging from past trends, most beef trade is likelyto remain. extraregional. In addition to the tradition-al beef exporters, Argentina and Uruguay, severalcountries, including Brazil, Colombia and Paraguay,are expected to become major exporters of beef.
Development plans and policies
In 1969 and in early 1970 development plans werestarted in Argentina, Barbados, Colombia, Costa Rica,Honduras, Jamaica, Nicaragua, Panama and Para-guay, and the current plan of Ecuador was revised.For the principal characteristics of these and otherplans being implemented in the region see Table II-30.
In an effort to improve the formulation and im-plementation of plans, several countries in the regionhave recently made changes in their institutions forplan formulation and execution. In Bolivia a RuralDevelopment Corporation has been created toassist the agrarian reform programme, particularlyin granting land titles. Panama set up a Ministryof Agriculture and Livestock, and established a Com-mittee on Agricultural Policies, composed of membersof the Institute of Economic Development, the Na-tional Bank, the Commission of Agrarian Reform,the Planning Office, the Livestock Institute and theFaculty of Agriculture, to coordinate and executethe 1969-74 development plan. Peru continues withthe revision of its rural institutions started in De-cember 1968; the functions of all the semiautono-
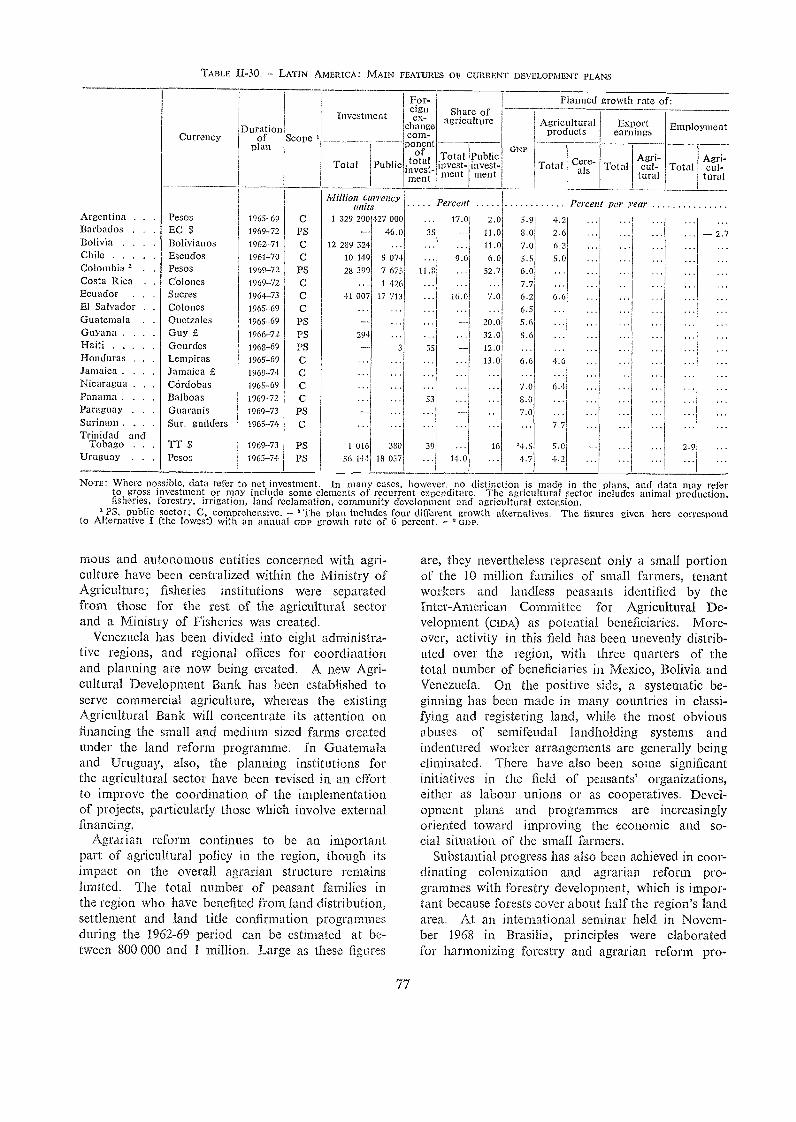
TABLE 11-30, - LATIN AMERICA: MAIN FEATURES OF CURRENT DEVELOPMENT PLANS
NOTE: Where possible, data refer to net investment. In many cascs, howcNer, no distinction is made in thc plans, and data may referto gross investment or may include some elements of recurrent expenditure. The agricultural sector includes animal production,fisheries, forestry, irrigation, land reclamation, community development and agricultural extension.
' PS, public sector; C. comprehensive. - 'The plan includes four different growth alternatives. The figures given here correspondto Alternative I (the lowest) with an annual GDP growth rate of 6 percent. - GI)P.
mous and autonomous entities concerned with agri-culture have been centralized within the Ministry ofAgriculture; fisheries institutions were separatedfrom those for the rest of the agricultural sectorand a Ministry of Fisheries was created.
Venezuela has been divided into eight administra-tive regions, and regional offices for coordinationand planning are now being created. A new Agri-cultural Development Bank has been established toserve commercial agriculture, whereas the existingAgricultural Bank will concentrate its attention onfinancing the small and medium sized farms createdunder the land reform programme. In Guatemalaand Uruguay, also, the planning institutions forthe agricultural sector have been revised in an effortto improve the coordination of the implementationof projects, particularly t.hose which involve external'financing.
Agrarian reform continues to be an importantpart of agricultural policy in the region, though itsinipact on the overall agrarian structure remainslimited. The total number of peasant families inthe region who have benefited from land distribution,settlement and latid title confirmation programmesduring the 1962-69 period can be estimated at be-tween 800 000 and 1 million. Large as these figures
77
are, they nevertheless represent only a small portionof the 10 million families of small farmers, tenantworkers and landless peasants identified by theInter-American Committee for Agricultural De-velopment (oDA) as potential beneficiaries. More-over, activity in this field has been unevenly distrib-uted over the region, with three quarters of thetotal number of beneficiaries in Mexico, Bolivia andVenezuela. On the positive side, a systematic be-ginning has been 'made in many countries in classi-fying and registering land, while the most obviousabuses of sernifeudal landholding systems andindentured worker arrangements are generally beingeliminated. There have also been some significantinitiatives in the field of peasants' organizations,either as labour unions or as cooperatives. Devel-opment plans and programmes are increasinglyoriented toward improving the economic and so-cial situation of the small farmers.
Substantial progress has also been achieved in coor-dinating colonization and agrarian reform pro-grammes with forestry development, which is impor-tant because forests cover about half the region's latidarea. At an international seminar held in Novem-ber 1968 in Brasilia, principles were elaboratedfor harmonizing forestry and agrarian reform pro-
CurrencyDuration
of Scope l
Investment
For-eignex-change
-COMponen
Share ofagriculture
Planned growth rate of:
GNP
Agriculturalproducts
Exportearnings Employment
Total Public, °,.1,
ii`i°,;.`,`"It_
Totalinvest-
Publicinvest- Total C ere-
als TotalAgri-cul- Total
Agri-cul-
ment ment ment tural tural
Million currencyunits Percent Percent per year
Argentina . . Pesos 1965-69 C 1 329 200 427 000 ... 17.0 2.0 5.9 4.2 ... ... ... ...Barbados . . EC $ 1969-72 PS 46.0 35 11.0 8.0 2.6 ... ... ... 2.7Bolivia . . . Bolivianos 1962-71 C 12 289 324 ... ... ... 11.0 7.0 6.3 ... ... ... ...Chile Escudos 1961-70 C 10 149 5 074 ... 9.0 6.0 5.5 5.0 ... ... ... ... ...:2010mbia 2 . Pesos 1969-72 PS 28 399 7 675 11.8 ... 52.7 6.0 ... ... ... .. . ... ...osta Rica . . Colones 1999-72 C
Ecuador . . . Sucres 1964-73 C 41 007 17 713 ... 16.0 7.0 6.2 6.6 ... ... ... ... ...El Salvador . . Colones 1965-69 C ... ... ... ... ... .. ...Guatemala . . Quetzales 1965-69 PS ... ...Guyana . . .
HaitiGuy 2,Gourdes
1966-72
1961-69
PSPS 3 35
. ..
Honduras . . Lempiras 1965-69 C ... ... ...Jamaica , . . . Jamaica 1969-74 C ... ... ... ... ... ... ... ... ... ... ... ...Nicaragua . . . Córdobas 1965-69 CPanama . . . . Balboas 1969-72 C ... ... 53 .
Paraguay . . . Guaranis 1969-73 PS ..iurinam . . . . Sur. guilders 1965-74 CFrinidad and
Tobago . . . TT $ 1969-73 PS 1 016 380 39 ... 16 k1.5 5.0 __
Uruguay . . . Pesos 1965-74 ps 56 144 18 057 ... 14.0 ... 4.7 4.2 ... ,.. ... ... ...
grammes in the legal, institutional, administrativeand technical fields.
Among recent actions, mention should be madeof the distribution in Mexico of 3.7 million hectaresof land to 63 000 peasant families in 1968/69. Thisbrings the total for the last six years to 16 millionhectares, distributed to over 300 000 smallholders.The emphasis is now shifting from land distributionto development efforts and the production of mar-ketable surpluses on the new holdings.
The latest reform decree in Peru, enacted in June1969, swept aside most constraints that stood in theway of more drastic reform, greatly simplifying ad-ministrative and legal proceedings. Under the newlaw the valuation of expropriated land is based solelyon the value declared by the original owner for taxpurposes during previous years, and extensive litiga-tion over expropriation can no longer delay thereform process as it has done previously. Anotherpolicy change is that cash compensation for fanninventories and buildings is no longer granted. Sim-ultaneously a new comprehensive water codewas adopted, which will facilitate the applicationof water development policies in the public interest,especially in the arid Costa region. Under the newlegislation, land will be distributed to 100 000 cam-pesinos in 1970-71, primarly in the intensive coastalplantation arcas rather than, as in the past, in thehighlands. In line with this policy, nine large sugar-cane estates in the Costa region were expropriat-ed during 1969 and titles were granted to 4 200families in agrarian reform zones.
FOREST POLICIES
There is a growing awareness of the role thatthe forestry sector can play in the economicdevelopment of the region, in view of the largeforest resources and the rapid growth of demandfor forest products, especially in Japan, the UnitedStates and western Europe. Inventories of thetropical forests of Latin America, in many casesmade with FAO help, show that their economicpotential is often better than had been expected.Efforts continue to strengthen the forest servicesand to coordinate the development of the forestryand forest industry sectors. "
In October 1969 Argentina proclaimed the 1970sthe forestry development decade, with the objectiveof changing the country from a heavy net importerof forest products to one with a balanced trade in thesecommodities. The Brazilian Institute of ForestryDevelopment, founded in 1968, has strengthened itsrelations with the country's regional planning bodies
"For a detailed discussion of the role of institutions in forestrydevelopment. see "Modernizing institutions to promote forestrydevelopment" in FAO, The state of food and agriculture 1969,Rome, 1969.
78
so as to stimulate coordinated forestry and forestindustries development. The response to a lawwhich provides up to 50 percent tax relief for invest-ments in reforestation designed specifically to assistin forest industries development is reported to bevery positive. In Chile the Forestry Division isestablishing a pilot scheme for forestry developmentin the Bio-Bio river area, thus strengthening thefield structure of its forest service, a traditionallyweak area in Latin America. The country is alsoplanning to afforest 300 000 hectares with Pimaracliata to provide the required raw material forexpanding the pulp and paper industry. Under arecent law, Costa Rica has established a GeneralDirectorate of Forestry in the Ministry of Agricul-ture, a National Forestry Council and a NationalForestry Fund. In Paraguay plans are being drawnup for the establishment of integrated forest indus-tries, which will allow fuller use of the forest re-sources of the eastern part of the country.
Regional economic integration
Economic integration schemes continue to bemore far-reaching in Latin America than in otherdeveloping regions, in terms of both their scope andtheir geographical coverage. The three major group-ings the Latin American Free Trade Association(LAFTA), the Central American Conunon Mar-ket (cAcm), and the Caribbean Free Trade Asso-ciation (CARIFTA) cover all countries of the regionexcept British Honduras, Panama, Surinam and someof the Caribbean countries, including the Bahamas,Cuba, the Dominican Republic, Haiti and time BritishVirgin Islands. Two other schemes the AndeanGroup and the Eastern Caribbean Common Mar-ket link smaller groups within LAFTA and CARIFTA.The first is concerned with the promotion of otherforms of economic integration, particularly integratedindustrial development, in addition to free trade ar-rangements which are the principal concern of LAFTA.The Eastern Caribbean Common Market is a unionof smaller CARIFTA countries, including St Luciaand Dominica, for the purpose of strengtheningtheir position vis-a-vis the larger members of thegrouping, such as Guyana, Jamaica, and Trinidadand Tobago.
Of the various schemes, CACM has had by far thegreatest impact on the trade of the member countries.While their total exports more than doubled between1961 and 1968 to $954 million, there was almost asevenfold increase in intratrade, which rose from $38million in 1961 to $259 million in 1968. This achieve-ment is particularly striking if compared with theslower growth of intratrade in Latin America as awhole (by 124 percent to $1 495 million) or within
LAFTA (by about 100 percent to $998 million), the latterincrease, in turn, being more than twice the growthof the total exports of the LAFTA countries to alldestinations. CARIFTA has only completed its firstfull year of operations, but preliminary data indicatethat trade between the member countries has alreadyexpanded considerably.
A further slowing down of the expansion of iatra-trade within the LAFTA area is likely to result fromthe failure of member countries to reach agreementon the "common list," on which the elimination ofintraregional tariffs and the establishment of a gen-uine free trade area depend. This failure necessitat-ed the postponement in December 1969 of the deadinefor the full operation of the free trade area from theend of 1973 to the end of 1980. At the same time31 December 1974 was set as the final date for theadoption of new procedures applicable to the workingout of the common list. In the meantime the meet-ing recommended that each member grant the othercontracting parties an annual 2.9 percent tariff re-duction on the goods listed in their respective na-tional schedules.
The Andean Group pact was also approved byLAFTA as being compatible with the Treaty of Mon-tevideo. In October 1969 the heads of the nationalplanning units of the Andean Group countries adopt-ed a resolution relating to joint planning in thefield of industrial development, and suggested thatthe Economic Commission for Latin America (EcLA)and the Latin American Planning Institute (n..PEs)be asked for assistance. The Group also proposedthat LAFTA extend its interests beyond the field of
Developing countries
Most developing countries of the region achieveda growth rate of real GNP between 5 and 7 percentin 1969, and those with a more developed industrialbase, such as China (Taiwan) and the Republic ofKorea, attained an even higher rate of expansion."Malaysia, too, recorded a 9 percent growth, mainlyas a result of the increased production and higherprices of its tin and rubber exports and its new in-dustries. Indonesia appears to have successfully over-come the inflationary pressures which at one timehad reached a rate of over 600 percent a year, andrecorded an estimated 5 percent growth in GNP.In India growth returned to the more normal level
" China (Taiwan) 8 percent, and the Republic of Korea 14percent.
79
trade and take action by 1973 in the broader fieldof economic integration. This should include thecoordination of development programmes and theplanning of joint new investment; the reduction ofexport taxes and of other barriers to intraregionaltrade; the establishment of a common externaltariff; the speeding up of rural development; theimprovement of the physical infrastructure; prefer-ential treatment for less developed members; andan institutional system which would ensure the real-ization of integration goals and the equitable dis-tribution of its benefits.
The aftereffects of the hostilities in July 1969 be-tween El Salvador and Honduras continue to upsetnormal trade patterns, and it is expected that overalltrade expansion in 1969 within CACM will have beenmuch less than in previous years. At a meetingheld in early December 1969 the foreign ministersof the member countries established tripartite ma-chinery to solve the problems related to the con-flict between the two countries and created an adhoc committee for the reorganization of the CACMinstitutional system.
The Caribbean Development Bank, inauguratedon 31 January 1970 and to be located in Bridgetown,Barbados, began operations with capital contribu-tions of $30 million from member countries in theCaribbean and $10 million each from Canada andthe United Kingdom. The United States has offer-ed to provide a soft loan fund. British Hondurashas joined the new bank an.d negotiations have beenstarted with a view to formulating terms for thecountry's entry into CARIFTA.
Far East
of 6 percertt, following the rapid increase in 1968after the poor harvests of the previous year.
While the total growth performance of most ofthe developing countries of the region thus fullymatched that of most high-income countries, thecontinuing high rate of population increase, esti-mated at an average of 2.6 percent,21 absorbed a fargreater share of the increase in GNP than in the devel-oped countries, and resulted in a much more moder-ate growth in per caput terms.
Although the rate of industrial growth was in manycases higher than that of agriculture, the latter,because of its broad base, nevertheless continuedto provide the main ground for growth. The majorpush in that sector is currently coming from the high-yielding cereal varieties, which have both raised the
" Excluding Japan and Mainland China.
marketable output of the commercial sectors andstimulated the predominantly subsistence sectors notonly with additional income and employment, butalso with heightened aspirations and motivations.In 1969, it is true, food production in the develop-ing countries of the region increased by 4 percent,somewhat less rapidly than in the previous two years.But, taking the last few years together, a turningpoint appears to have been reached in the majorityof countries of the region, with increases in basicfood production overtaking the rate of populationgrowth, and thus holding out prospects of self-sufficiency in cereals in a number of countries by1975-80. A substantial contribution to growth isalso being made by the forestry and fishery sectorsin several countries of the region, with rates of growthgenerally higher than those for the agricultural sector.Although these higher growth rates are on a smallerbase than that of the agricultural sector, their fastergrowth, and the shorter gestation periods for certainstages and types of fishery and forestry developmentmight merit for them a higher investment prioritythan hitherto accorded.
Favourable also was the improved performanceof the agricultural export sector, where earningsappear to have risen after five years of decline.Moreover, although many economies remain heavilydependent on primary agricultural exports as a sourceof foreign exchange, in some other countries lag-ging agricultural exports are increasingly being madeup by expanding exports of processed and manufac-tured goods. The trade situation of several coun-tries has also been eased by their ability to furtherreduce their cereal imports.
Although the higher prices of certain primaryexports (such as rubber and tin) led to an improve-ment in the balance of payments position of somecountries, the fall in prices of other exports (suchas rice and tea), together with the steeply risingdebt-service obligations of most countries, generallyaggravated the already tight balance of paymentsposition. The ratio of debt repaymen.ts to the valueof exports rose in 1969 to 9 percent in Ceylon and10 percent in the Philippines and to no less than28 percent in India and 20 percent in Pakistan, 22thus stressing the urgency of easing the terms offoreign aid in future.
AGRICULTURAL PRODUCTION
According to preliminary FAO indices, agriculturalproduction in the developing countries of the regionincreased in 1969 by 4 percent (Table 11-31). Ifconfirmed by final data, 23 this would represent a
"Estimate for 1970." The preliminary indices tend, however, toward an underesti-
mation of increases in output.
80
slight falloff from the growth of 5 percent of thepreceding year, though still substantially greater thanin the early 1960s. Particularly large increases wereregistered in West Malaysia, where the coming intoproduction of newly planted areas of high-yieldingrubber and oil palm led to an expansion of 13 percentin the total output, and in the Republic of Korea,where production recovered by 14 percent after thetwo drought years of 1967 and 1968.
Food production, which still remains the focusof attention of most developing countries in the re-gion, also registered an increase of 4 percent. Asidefrom the Republic of Korea, above-average increasesin food production were also achieved in India,Nepal, Thailand and Malaysia. Weather conditionswere fairly favourable, but other important factorswere the sustained policy and institutional measureswhich provided continued incentives and support forthe adoption of high-yielding varieties of cereals.
Rice production continued to expand rapidly, espe-cially in the importing countries. Within a totalincrease of 4 percent in 1969, the share of importingcountries rose from 58.5 percent of regional produc-tion in 1968 to 60.3 percent in 1969. Aside froma 24 percent recovery in the Republic of Korea,significant increases were also registered in Indonesia(6 percent), Nepal (7 percent), Pakistan (6 percent)and thc Philippines (12 percent).
Wheat production in the developing countries ofthe region increased by 10 percent. Output in India,which accounts for 70 percent of the total, increas-ed by 13 percent. Pakistan's growth rate declinedby 4 percent, following the extremely large increaseof 47 percent in 1968.
The production of barley in 1969 declined in theregion as a whole, while maize production rose by6 percent, with larger increases in India, Indonesia,Nepal and Thailand. There was a 7 percent increasein the production of millets and sorghum. Therecent development of hybrid maize and new vari-eties of millets and sorghum holds prospects ofhigher yields in respect of these cereals in future. Theproduction of oilseeds rose by 6 percent, reflectinga large increase in groundnut production, but thatof pulses fell by 10 percent, mainly in India, themajor producer.
Livestock production is estimated to contribute onlysome 4 percent of the total GDP of the region. Growthrates for this commodity group tend to be mislead-ing because the largest increases are mainly takingplace in the smaller countries from a relatively lowinitial level, while little change is taking place insome major countries because of religious foodtaboos. Over the longer period from 1963 to 1969,pigmeat, poultry meat and eggs have shown relativerapid annual rates of increase, of around 6 to 8
percent, mainly due to the growth of intensive pro-
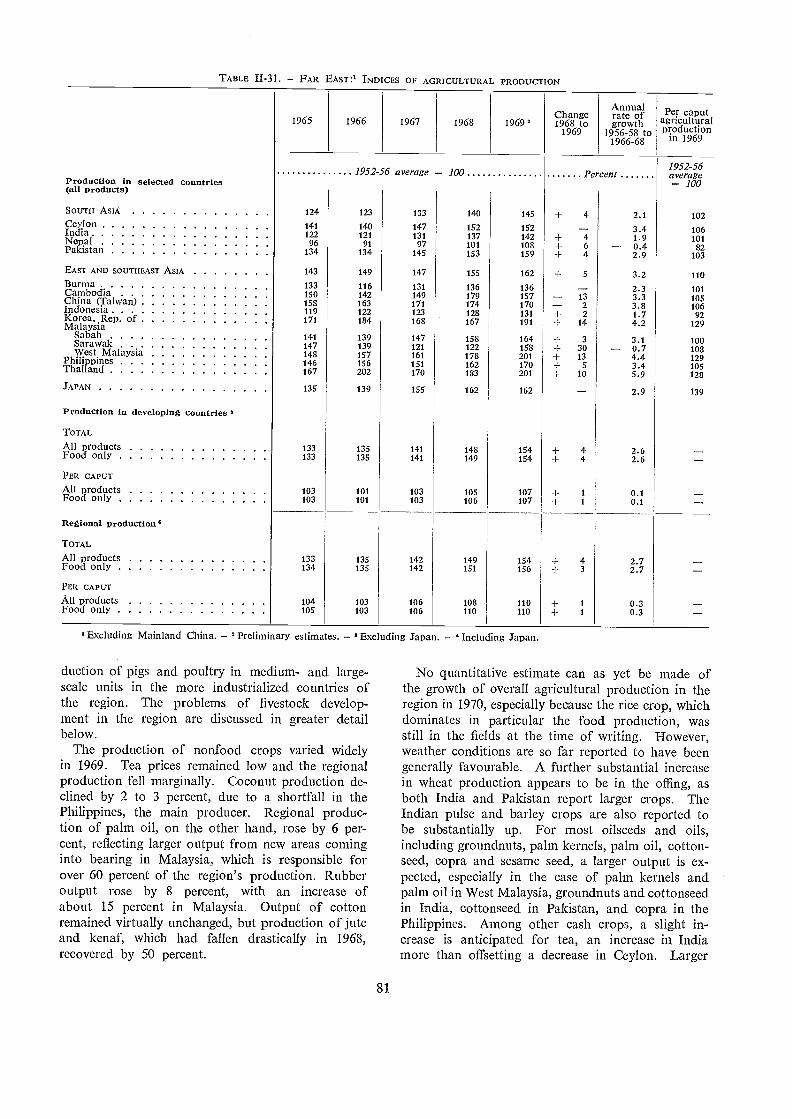
TABLE II-31. FAR EAST:1 INDICES OF AGRICULTURAL PRODUCTION
duction of pigs and poultry in medium- and large-scale units in the more industrialized countries ofthe region. The problems of livestock develop-ment in the region are discussed in greater detailbelow.
The production of nonfood crops varied widelyin 1969. Tea prices remained low and the regionalproduction fell marginally. Coconut production de-clined by 2 to 3 percent, due to a shortfall in thePhilippines, the main producer. Regional produc-tion of palm oil, on the other hand, rose by 6 per-cent, reflecting larger output from new areas cominginto bearing in Malaysia, which is responsible forover 60 percent of the region's production. Rubberoutput rose by 8 percent, with an increase ofabout 15 percent in Malaysia. Output of cottonremained virtually unchanged, but production of juteand kenaf, which had fallen drastically in 1968,recovered by 50 percent.
81
'Excluding Mainland China. 2Preliminary estimates. 'Excluding Japan. 'Including Japan.
No quantitative estimate can as yet be made ofthe growth of overall agricultural production in theregion in 1970, especially because the rice crop, whichdominates in particular the food production, wasstill in the fields at the time of writing. However,weather conditions are so far reported to have beengenerally favourable. A further substantial increasein wheat production appears to be in the offing, asboth India and Pakistan report larger crops. TheIndian pulse and barley crops are also reported tobe substantially up. For most oilseeds and oils,including groundnuts, palm kernels, palm oil, cotton-seed, copra and sesame seed, a larger output is ex-pected, especially in the case of palm kernels andpalm oil in West Malaysia, groundnuts and cottonseedin India, cottonseed in Pakistan, and copra in thePhilippines. Among other cash crops, a slight in-crease is anticipated for tea, an increase in Indiamore than offsetting a decrease in Ceylon. Larger
1965 1966 1967 1968 1969 2Change1968 to
1969
Annualrate ofgrowth
1956-58 to1966-68
Per caputagriculturalproduction
in 1969
1952-56 average 100 Percent1952-56averageProduction in selected countries
(all products) 100
SOUTH ASIA 124 123 133 140 145 4 2.1 102CeylonIndiaNepalPakistan
14112296
134
14012191
134
147131
97145
152137101153
152142108159
+ 4+ 6-I- 4
3.41.90.42.9
10610182
103
EAST AND SOUTHEAST ASIA 143 149 147 155 162 + 5 3.2 110BurmaCambodiaChina (Taiwan)IndonesiaKorea, Rep. ofMalaysia
133150158119171
116142163122184
131149171123168
136179174128167
136157170131191
132
-I- 2+ 14
2.33.33.81.74.2
10110510692
129SabahSarawakWest Malaysia
PhilippinesThailand
141147148146167
139139157156202
147121161151170
158122178162183
164158201170201
+ 3+ 30-F 13+ 5-I- 10
3.10.74.43.45.9
100108129105128
JAPAN 135 139 155 162 162 2.9 139
Production in developing countries $
TOTAL
All productsFood only
133133
135135
141141
148149
154154
+ 4+ 4
2.62.6
PER CAPUT
All productsFood only
103103
101101
103103
105106
107107
0.10.1
Regional production 4
TOTAL
All productsFood only
133134
135135
142142
149151
154156
-f- 4+ 3
2.72.7
PER CAPUT
All productsFood only
104105
103103
106106
108110
110110
+ 1
+ 1
0.30.3
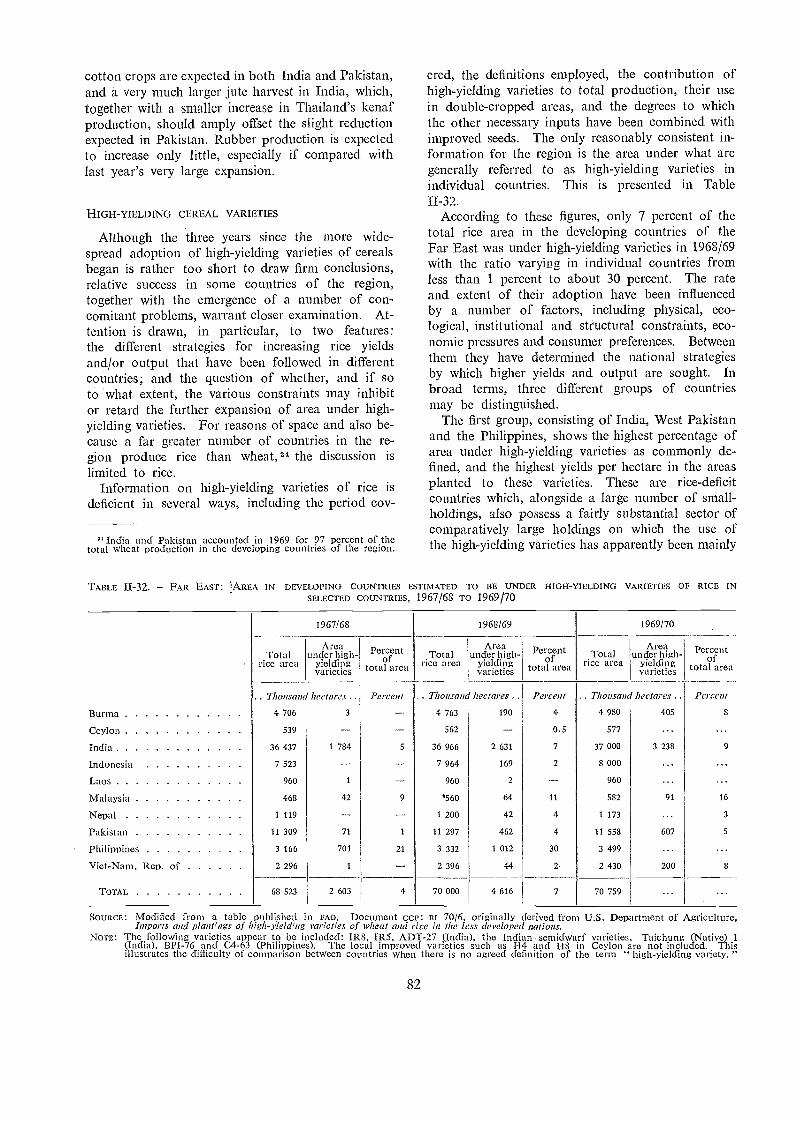
cotton crops are expected in both India and Pakistan,and a very much larger jute harvest in India, which,together with a smaller increase in Thailand's kenafproduction, should amply offset the slight reductionexpected in Pakistan. Rubber production is expectedto increase only little, especially if compared withlast year's very large expansion.
HIGH-YIELDING CEREAL VARIETIES
Although the three years since the more wide-spread adoption of high-yielding varieties of cerealsbegan is rather too short to draw firm conclusions,relative success in some countries of the region,together with the emergence of a number of con-comitant problems, warrant closer examination. At-tention is drawn, in particular, to two features:the different strategies for increasing rice yieldsand/or output that have been followed in differentcountries; and the question of whether, and if soto what extent, the various constraints rnay inhibitor retard the further expansion of area under high-yielding varieties. For reasons of space and also be-cause a far greater number of countries in the re-gion produce rice than wheat,24 the discussion is
limited to rice.Information on high-yielding varieties of rice is
deficient in several ways, including the period coy-
India and Pakistan accounted in 1969 for 97 percent of thetotal wheat production in the developing countries of the region.
82
ered, the definitions employed, the contribution ofhigh-yielding varieties to total production, their usein double-cropped areas, and the degrees to whichthe other necessary inputs have been combined withimproved seeds. The only reasonably consistent in-formation for the region is the area under what aregenerally referred to as high-yielding varieties inindividual countries. This is presented in TableII-32.
According to these figures, only 7 percent of thetotal rice area in the developing countries of theFar East was under high-yielding varieties in 1968/69with the ratio varying in individual countries fromless than 1 percent to about 30 percent. The rateand extent of their adoption have been influencedby a number of factors, including physical, eco-logical, institutional and structural constraints, eco-nomic pressures and consumer preferences. Betweenthem they have determined the national strategiesby which higher yields and output are sought. Inbroad terms, three different groups of countriesmay be distinguished.
The first group, consisting of India, West Pakistanand the Philippines, shows the highest percentage ofarea under high-yielding varieties as commonly de-fined, and the highest yields per hectare in the areasplanted to these varieties. These are rice-deficitcountries which, alongside a large number of small-holdings, also possess a fairly substantial sector ofcomparatively large holdings on which the use ofthe high-yielding varieties has apparently been mainly
TABLE II-32. FAR EAST: "..N.REA IN DEVELOPING COUNTRIES ESTIMATED TO BE UNDER HIGH-YIELDING VARIETIES OF RICE INSELECTED COUNTRIES, 1967/68 TO 1969/70
SOURCE : Modified from a table published in FAO, Document CCP: RI 70/6, originally derived from U.S. Department of Agriculture,Imports and plant'ngs of high-yiel&ns varieties of wheat and rice in the less developed nations.
NOTE: The following varieties appear to be included: IRS, IRS, ADT-27 (India), the Indian sernidwarf varieties, Taichung (Native) I(India), BPI-76 and C4-63 (Philippines). The local improved varieties such as H4 and EI8 in Ceylon are not included. Thisillustrates the difficulty of comparison between countries when there is no agreed definition of the term " high-yielding variety.
Burma
Ceylon
mdliIndonesia
Laos
Malaysia
Nepal
Pakistan
Philippines
Viet-Nam, Rep. of
TOTAL
1967/68 1968/69 1969/70
Totalrice area
Areaunder high-
Yieldingvarieties
Percentof
total areaTotal
rice area
Areaunder high-
Yieldingvarieties
Percentof
total ar .eaTotal
rice area
Areaunder nigh_yieldingvarieties
Percentof,total area
.. Thousand
4 706
539
36 437
7 523
960
468
1 119
11 309
3 166
2 296
hectares .
3
1 784
1
42
71
701
1
Percent
5
9
1
21
.. Thousand
4 763
562
36 966
7 964
960
*560
1 200
11 297
3 332
2 396
hedores ..190
2 631
169
2
64
42
462
1 012
44
Percent
4
0.5
7
2
11
4
4
30
2
.. Thousand
4 980
577
37 000
8 000
960
582
1 173
11 558
3 499
2 430
hectares ..
405
...3 238
......91
...607
...200
Percent
8
...9
...16
3
5
...8
68 523 2 603 4 70 000 4 616 7 70 759
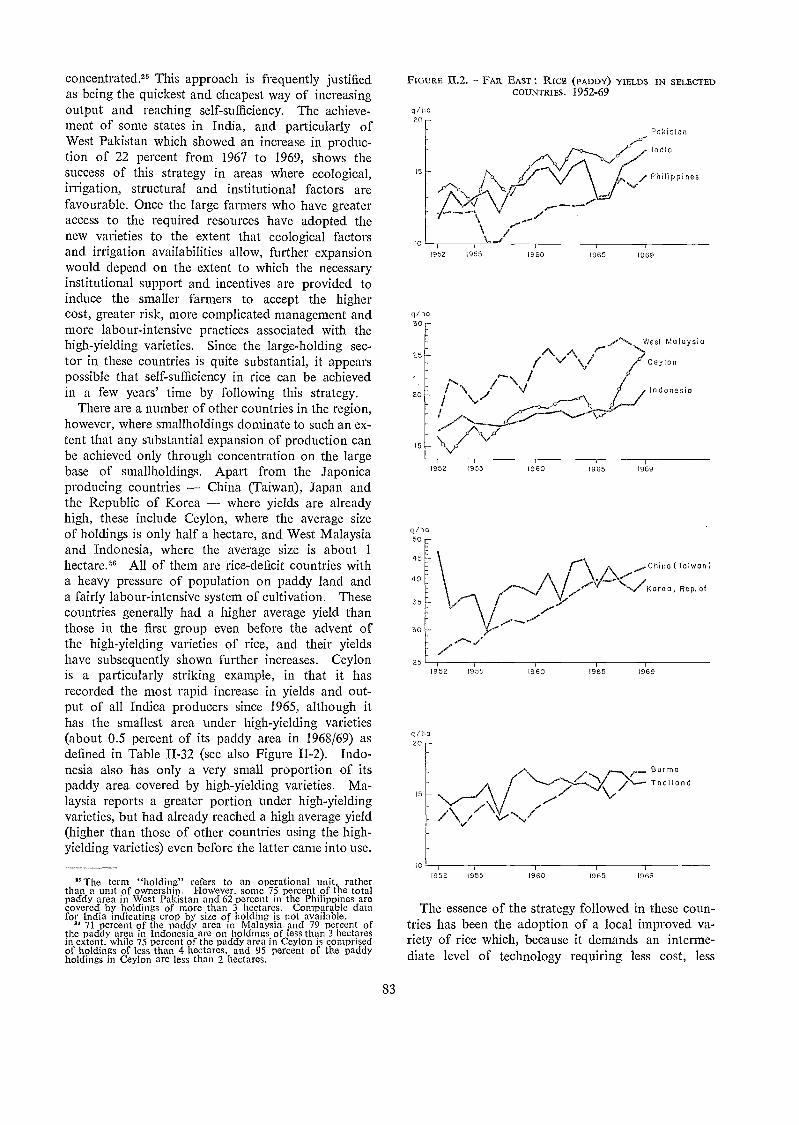
concentrated:26 This approach is frequently justifiedas being the quickest and cheapest way of increasingoutput and reaching self-sufficiency. The achieve-ment of some states in India, and particularly ofWest Pakistan which showed an increase in produc-tion of 22 percent from 1967 to 1969, shows thesuccess of this strategy in areas where ecological,irrigation, structural and institutional factors arefavourable. Once the large farmers who have greateraccess to the required resources have adopted thenew varieties to the extent that ecological factorsand irrigation availabilities allow, further expansionwould depend on the extent to which the necessaryinstitutional support and incentives are provided toinduce the smaller farmers to accept the highercost, greater risk, more complicated management andmore labour-intensive practices associated with thehigh-yielding varieties. Since the large-holding sec-tor in these countries is quite substantial, it appearspossible that self-sufficiency in rice can be achievedin a few years' time by following this strategy.
There are a number of other countries in the region,however, where smallholdings dominate to such an ex-tent that any substantial expansion of production canbe achieved only through concentration on the largebase of smallholdings. Apart from the Japonicaproducing countries China (Taiwan), Japan andthe Republic of Korea where yields are alreadyhigh, these include Ceylon, where the average sizeof holdings is only half a hectare, and West Malaysiaand Indonesia, where the average size is about 1hectare.26 All of them are rice-deficit countries witha heavy pressure of population on paddy land anda fairly labour-intensive system of cultivation. Thesecountries generally had a higher average yield thanthose in the first group even before the advent ofthe high-yielding varieties of rice, and their yieldshave subsequently shown further increases. Ceylonis a particularly striking example, in that it hasrecorded the most rapid increase in yields and out-put of all Indica producers since 1965, although ithas the smallest area under high-yielding varieties(about 0.5 percent of its paddy area in 1968/69) asdefined in Table II-32 (see also Figure II-2). Indo-nesia also has only a very small proportion of itspaddy area covered by high-yielding varieties. Ma-laysia reports a greater portion under high-yieldingvarieties, but had already reached a high average yield(higher than those of other countries using the high-yielding varieties) even before the latter came into use.
"The term "holding" refers to an operational unit, ratherthan a unit of ownership. However, some 75 percent of the totalpaddy area in West Pakistan and 62 percent in the Philippines arecovered by holdings of more than 3 hectares. Comparable datafor India indicating crop by size of holding is not available.
" 71 percent of the paddy arca in Malaysia and 79 percent ofthe paddy area in Indonesia are on holdings of less than 3 hectaresin extent. while 75 percent of the paddy area in Ceylon is comprisedof holdings of less than 4 hectares, and 95 percent of the paddyholdings in Ceylon are less than 2 hectares.
83
FIGURE 11.2. FAR EAST : RICE (PADDY) YIELDS IN SELECTEDCOUNTRIES. 1952-69
q/ho20
15
10
q/ho
15
q/ho50
45
35
1952 i955 1960
1952 1955 1960
West Malaysia
1965 1969
1965 19169
Pakistan
India
/ Philippines
Ceylon
Indonesia
China (Taiwan)
<area, Rep. of
BurmaThailand
The essence of the strategy followed in these coun-tries has been the adoption of a local improved va-riety of rice which, because it demands au interme-diate level of technology requiring less cost, less
1952 1955 1965 1969
30
a v/' "\ / V
/
risk and less labour discipline than the new high-yielding varieties, is assimilable by a wide base ofsmallholdings. This strategy, however, requires rel-atively more in the line of an integrated set of in-centives, institutions and services. In Ceylon as muchas 72 percent of the paddy land in the main cropseason 1969 was planted to the local improved varie-ties, H4 and 1-18, and yields have risen extremelyrapidly since 1965. Those favouring this strategysuggest that, where the necessary institutional frame-work is provided, it gives rise to a broader, quickerand more sustained increase in productivity, as hasbeen demonstrated earlier by Japan and China (Tai-wan). They also point out that the initial adoptionof an intermediate level of technology can pave theway for a more sophisticated technology at a laterstage. The rationale of this approach is that, as anational strategy to obtain the highest increase inproduction, the aim need not necessarily be theattainment of the highest possible yields on individ-ual holdings or in parts of the country, but mayalso be the achievement of the highest possible aver-age yield on a country-wide basis. The wider pro-duction base inherent in the latter strategy may alsohave social and political advantages over a strategybased on concentration of the efforts to raise yields ononly the larger or technically more advanced farms.
Finally, a third group of countries can be distin-guished, which have a relatively low pressure ofpopulation on paddy land and, consequently, byAsian standards, a predominance of large or medium-sized holdings. These are the traditional rice-ex-porting countries of the region Thailand, Burma,Cambodia which have today virtually the lowestyields per hectare, depending for their export sur-plus on an extensive system of agriculture." Thehigh-yielding varieties have so far gained little foot-hold in these countries, due to adverse ecologicalconditions (flooding), lack of adequate incentives, inparticular low prices and low institutional supportto farmers, as well as the poor consumer appealof the new varieties. The scarcity of labour in re-lation to the size of farms and to the intensive labourrequirements of the high-yielding varieties has prov-ed another inhibiting factor.
While it is thus possible to distinguish three broadlines of strategy, each arising from different condi-tions and leading to different results, it is importantto recognize that these strategies are neither univer-sally followed in each country, nor mutually exclusive.For instance in the first group of countries, Indiaand Pakistan have, in addition to an intensive high-
"This is reflected in the low level of fertilizer utilization perhectare (nutrient tons) in Burma and Thailand on rice lands, whichis one third of that in India and Pakistan, and 5 percent of thatin Malaysia and Ceylon. The use of insecticides and of labour-intensive practices such as weeding, transplanting, etc., are alsolow.
84
yielding varieties programme in areas with well-controlled irrigation facilities, an extensive programmefor the spread of locally improved varieties. In thesecond group of countries, basically following astrategy of intermediate technology, areas with op-timum irrigation and suitable ecological conditionsare now beginning to be planted to IRS and IR8or to their successors. In the third group of coun-tries, Thailand has recently announced its intentionto spread a locally adapted irnproved variety, whileBurma has already sown at least 4 percent of itsrice area with high-yielding varieties. The purposeof drawing attention to the differences in the broadstrategies is merely to illustrate, in a concrete way,the influence of the ecological, economic and otherfactors on the extent to which the new high-yield-ing and improved varieties have been adapted, inconformity with the special requirements and condi-tions of each country.
Whether expansion of the high-yielding varietiesand the new technology will enable most rice-deficitcountries to achieve self-sufficiency by 1975-80will depend on the degree to which the variousknown constraints will become critical impediments.An important potential constraint is the limited avail-ability of further irrigated land. Generally speak-ing, however, the potential of existing irrigationworks 28 and the possibility of supplementary irri-gation to meet the needs of the high-yielding varie-ties 29 have not yet been exhausted, except possiblyin China (Taiwan).
A major ecological constraint in many countriesis that most of the known high-yielding varietiesof rice are not ideally suited to the irregular rainfallor flooding of the main monsoonal sowing. And,although the present varieties can grow ideally underthe controlled irrigation of the dry season, the latterin some countries is too short for a second crop tobe had from the existing varieties. The develop-ment of a shorter maturing variety has recentlybeen announced in Ceylon and, if it proves success-ful, it may provide for a very rapid increase in pro-duction within the next few years.
The poor milling properties and lesser consumerappeal of IR5 and IR8 than of traditional varietieshave hitherto inhibited their adoption in the mainexporting countries, and have tended to depress theirprices. The recent introduction of new varieties suchas IR20 and IR22 with superior milling quality,better palatability and greater resistance to stem-borer disease may well ensure the wider adoptionof high-yielding rice.
" For example, there is still scope for the expansion of the croparca under the high-yielding varieties in major irrigation schemes,through double cropping in Ceylon and Malaysia.
" India, Pakistan and the Philippines have shown the feasibilityof rapidly increasing minor or supplementary irrigation throughsurface, pump and tube-well irrigation.
As regards possible institutional constraints, themajority of countries have now introduced variousproduction incentives and institutional support mea-sures. High internal prices and purchasing arrange-ments for rice,30 together with the supply and sub-sidization of necessary inputs such as fertilizer andpesticides,31 have been introduced in most countries,while Pakistan is subsidizing the installation of tubewells. Almost all countries are providing farmerswith credit at lower than market rates, in many casesthrough organizations such as cooperatives or farm-ers' associations, while many have established spe-cial lending institutions for this purpose." Manycountries are expanding, retraining and reorganizingtheir agricultural extension staff to disseminate thenew technology more effectively. Arrangements forsupervised credit have been made in some coun-tries.33 Few, however, have gone further in regardto adequate or effective tenurial incentives or riskprotection measures such as crop insurance. More-over in many countries, although measures of insti-tutional reform have been introduced, the incentives,supporting institutions, services and inputs are notin practice available in a coordinated manner atfarm level to provide the farmers with the motivation,means and risk-bearing ability required to sustainthem in the innovation and investment associatedwith high-yielding varieties.
FISHERY PRODUCTION
Fishery production in the region increased byabout 3 percent. Gains were made by all majorfish-producing countries, with the increase in twocountries Thailand and the Republic of Viet-Nam being in excess of 10 percent.
The four largest fish producers India, Indonesia,Thailand, and the Philippines catch fish primarilyfor the home market, although shipments of highunit-value finfish and shrimp to foreign marketshave rapidly expanded in recent years. Productionfor export is of even greater importance in the Re-public of Korea and in China (Taiwan) which ranknext among the fish-producing countries of the re-gion. To be able to compete in production andmarketing, these two countries have had to establishmodern offshore fishing fleets and shore installations.In contrast, countries producing primarily for thehome market are giving emphasis to improvements
In Ceylon, China (Taiwan), India, Indonesia, Japan, the Re-public of Korea, Malaysia. Pakistan and the Philippines (floorprice).
"In Ceylon, Indonesia, Malaysia and Pakistan. However.Pakistan has recently reduced its fertilizer subsidy from 50 percentto 35 percent of cost. while India has introduced a 10 percent taxon fertilizer once farmer acceptance and demand for fertilizer havebeen established.
"This applies to Ceylon, China (Taiwan). India, Indonesia,Japan. the Republic of Korea, Pakistan, Philippines and Thailand.
" These include Philippines and Hong Kong (on a limited scale).
85
in inshore operations, and also assistance to subsis-tence fisheries which are important to local foodsupply and employment.
In several of the leading fish-producing countriesof the region, rapidly declining catch rates on tradi-tional fishing grounds and the need to protect thestocks are necessitating the introduction of fishingcontrols and encouraging exploration of offshorewaters for new resources. Until exploratory activi-ties produce significant results, the landings of thesecountries are not likely to expand in line with recenttrends. Growing caution in the authorization of newinvestments which would tend to increase the fishingpressure on easily depleted resources is evident fromIndonesia's recent nonacceptance of foreign in-vestment in shrimping. In the gulf of Thailand andin Manila bay, where the most alarming declines incatch rates have taken place, proposals for the controlof trawling are currently under consideration.
FOREST PRODUCTION
The forest resources of the region are primarilythe substantial but underutilized natural forest re-serves of Indonesia, eastern Malaysia, Cambodiaand Laos, and the still extensive but dwindling forestareas of Burma, Thailand and West Malaysia. Shift-ing cultivation and the accompanying destruction ofnatural forests are continuing fairly generally through-out the region at the rate of an estimated 8.5 millionhectares annually. In an endeavour to reduce thisencroachment the Republic of Korea, for example,has resettled tribal populations, while other develop-ing countries are endeavouring to establish moreeffective control and management of their nationalforest reserves.
In several developing countries notably China(Taiwan), India, the Republic of Korea, Pakistan,the Philippines and Thailand increased effort isnow being directed toward the establishment of man-made forests. In addition to meeting prospectiveinternal demand for timber, fuel and other forestproducts, the afforestation policies of these develop-ing countries indicate growing official recognition ofthe need for much more effective soil and waterconservation programmes in the region as well asthe importance of closer cooperation in the futurebetween agriculture and forest services.
Primary forest production, as measured by theremoval of industrial roundwood, rose by some 6percent in 1969 with notable increases in Indonesia,the Philippines and Malaysia. Production of mostforest products also rose appreciably in 1969. Amongthe more noteworthy features was the increase insawn hardwood production in Malaysia and Singa-pore, and of hardwood plywood production in theRepublic of Korea an.d China (Taiwan) as well
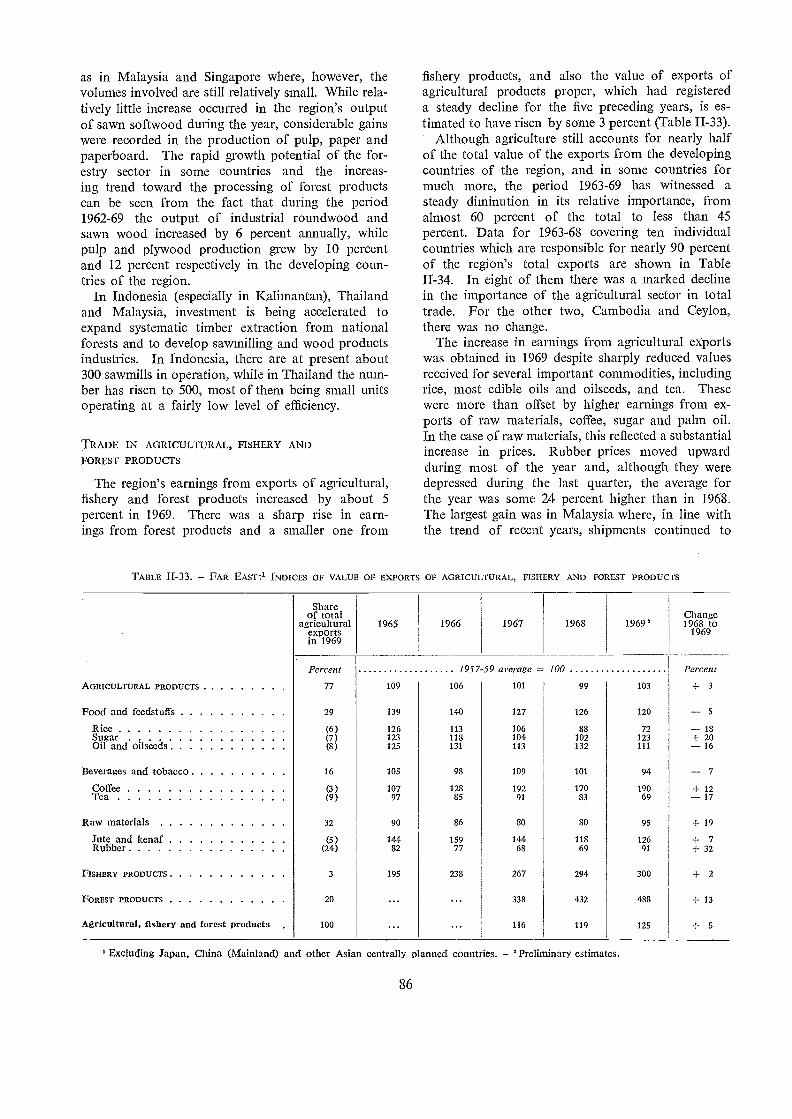
as in Malaysia and Singapore where, however, thevolumes involved are still relatively small. While rela-tively little increase occurred in the region's outputof sawn softwood during the year, considerable gainswere recorded in the production of pulp, paper andpaperboard. The rapid growth potential of the for-estry sector in some countries and the increas-ing trend toward the processing of forest productscan be seen from the fact that during the period1962-69 the output of industrial roundwood andsawn wood increased by 6 percent annually, whilepulp and plywood production grew by 10 percentand 12 percent respectively in the developing coun-tries of the region.
In Indonesia (especially in Kalimantan), Thailandand Malaysia, investment is being accelerated toexpand systematic timber extraction from nationalforests and to develop sawmilling and wood productsindustries. In Indonesia, there are at present about300 sawmills in operation, while in Thailand the num-ber has risen to 500, most of them being small unitsoperating at a fairly low level of efficiency.
TRADE IN AGRICULTURAL, FISHERY ANDFOREST PRODUCTS
The region's earnings from exports of agricultural,fishery and forest products increased by about 5percent in 1969. There was a sharp rise in earn-ings from forest products and a smaller one from
86
fishery products, and also the value of exports ofagricultural products proper, which had registereda steady decline for the five preceding years, is es-timated to have risen by some 3 percent (Table II-33).
Although agriculture still accounts for nearly halfof the total value of the exports from the developingcountries of the region, and in some countries formuch more, the period 1963-69 has witnessed asteady diminution in its relative importance, fromalmost 60 percent of the total to less than 45percent. Data for 1963-68 covering ten individualcountries which are responsible for nearly 90 percentof the region's total exports are shown in TableII-34. In eight of them there was a marked declinein the importance of the agricultural sector in totaltrade. For the other two, Cambodia and Ceylon,there was no change.
The increase in earnings from agricultural exportswas obtained in 1969 despite sharply reduced valuesreceived for several important commodities, includingrice, most edible oils and oilseeds, and tea. Thesewere more than offset by higher earnings from ex-ports of raw materials, coffee, sugar and palm oil.In the case of raw materials, this reflected a substantialincrease in prices. Rubber prices moved upwardduring most of the year and, although they weredepressed during the last quarter, the average forthe year was some 24 percent higher than in 1968.The largest gain was in Malaysia where, in line withthe trend of recent years, shipments continued to
' Excluding Japan, China (Mainland) and other Asian centrally planned countries. 'Preliminary estimates.
TABLE II-33. FAR EAST:1 INDICES OF VALUE OF EXPORTS OF AGRICULTURAL, FISHERY AND FOREST PRODUCTS
Shareof total
agriculturalexportsin 1969
1965 1966 1967 1968 1969'Change1968 to
1969
Percent 1957-59 average = 100 Percent
AGRICULTURAL PRODUCTS . 77 109 106 101 99 103 +3FoocI and feedstuffs 29 139 140 127 126 120 5
Rice (6) 126 113 106 88 72 18Sugar (7) 123 118 104 102 123 + 20Oil and oilseeds (8) 125 131 113 132 111 16
Beverages and tobacco 16 105 98 109 101 94 7Coffee (3) 107 128 192 170 190 + 12Tea (9) 97 85 91 83 69 17
Raw materials 32 90 86 80 80 95 1- 19
Jute and kenaf (5) 144 159 144 118 126 +7Rubber (24) 82 77 68 69 91 + 32
FISHERY PRODUCTS 3 195 233 267 294 300 +2FOREST PRODUCTS 20 338 432 488 + 13
Agricultural, fishery and forest products 100 116 119 125 +5
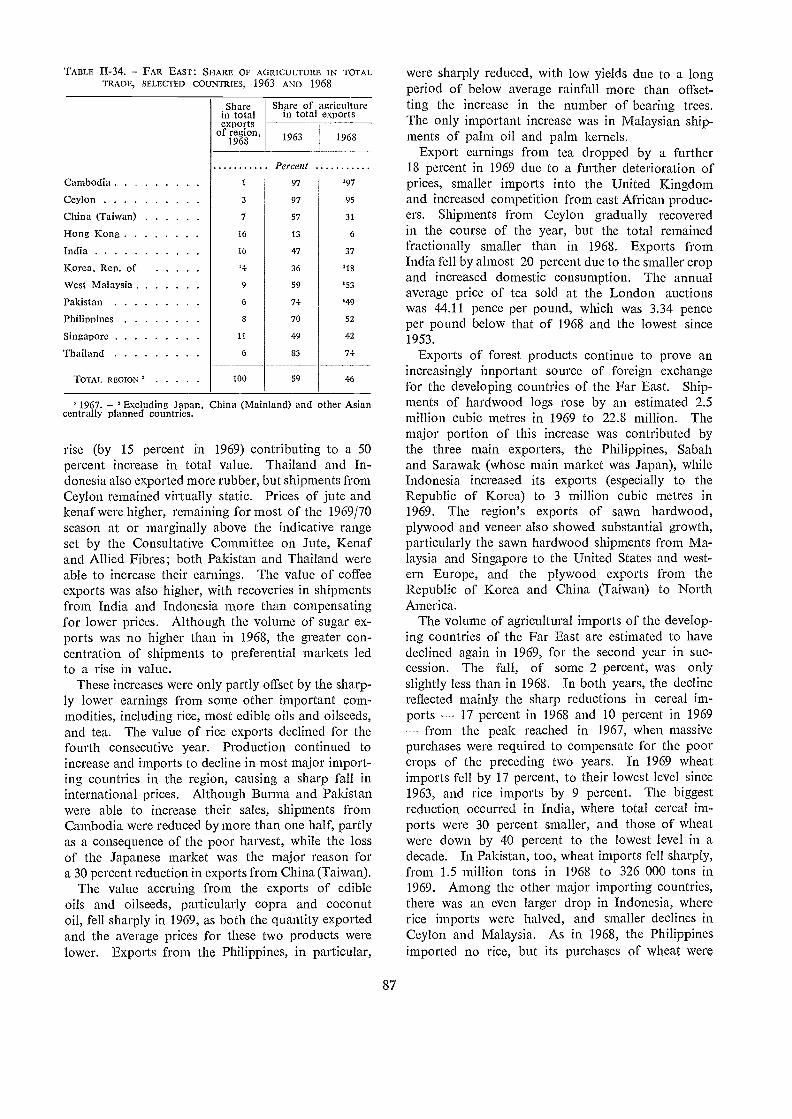
TABLE II-34. FAR EAST: SIIARE OF AGRICULTURE IN TOTALSELECTED 1963 ANO 1968TRADE, COUNTRIES,
'1967 Excluding Japan, China (Mainland) and other Asiancentrally planned countries.
rise (by 15 percent in 1969) contributing to a 50percent increase in total value. Thailand and In-donesia also exported more rubber, but shipments fromCeylon remained virtually static. Prices of jute andkenaf were higher, remaining for most of the 1969/70season at or marginally above the indicative rangeset by the Consultative Committee on Jute, Kenafand Allied Fibres; both Pakistan and Thailand wereable to increase their earnings. The value of coffeeexports was also higher, with recoveries in shipmentsfrom India and Indonesia more than compensatingfor lower prices. Although the volume of sugar ex-ports was no higher than in 1968, the greater con-centration of shipments to preferential markets ledto a rise in value.
These increases were only partly offset by the sharp-ly lower earnings from some other important com-modities, including rice, most edible oils and oilseeds,and tea. The value of rice exports declined for thefourth consecutive year. Production continued toincrease and imports to decline in most major import-ing countries in the region, causing a sharp fall ininternational prices. Although Burma and Pakistanwere able to increase their sales, shipments fromCambodia were reduced by more than one half, partlyas a consequence of the poor harvest, while the lossof the Japanese market was the major reason fora 30 percent reduction in exports from China (Taiwan).
The value accruing from the exports of edibleoils and oilseeds, particularly copra and cocon.utoil, fell sharply in 1969, as both the quantity exportedand the average prices for these two products werelower. Exports from the Philippines, in particular,
87
were sharply reduced, with low yields due to a longperiod of below average rainfall more than offset-ting the increase in the number of bearing trees.The only important increase was in Malaysian ship-ments of palm oil and palm kernels.
Export earnings from tea dropped by a further18 percent in 1969 due to a further deterioration ofprices, smaller imports into the United Kingdomand increased competition from east African produc-ers. Shipments from Ceylon gradually recoveredin the course of the year, but the total remainedfractionally smaller than in 1968. Exports fromIndia fell by almost 20 percent due to the smaller cropand in.creased domestic consumption.. The annualaverage price of tea sold at the London auctionswas 44.11 pence per pound, which was 3.34 penceper pound below that of 1968 and the lowest since1953.
Exports of forest products continue to prove anincreasingly important source of foreign exchangefor the developing countries of tbe Far East. Ship-ments of hardwood logs rose by an estimated 2.5million cubic metres in 1969 to 22.8 million. Themajor portion of this increase was contributed bythe three main exporters, the Philippines, Sabahand Sarawak (whose main market was Japan), whileIndonesia increased its exports (especially to theRepublic of Korea) to 3 million cubic metres in1969. The region's exports of sawn hardwood,plywood and veneer also showed substantial growth,particularly the sawn hardwood shipments from Ma-laysia and Singapore to the United States and west-ern Europe, and the plywood exports from theRepublic of Korea and China (Taiwan) to NorthAmerica.
The volume of agricultural imports of the develop-ing countries of the Far East are estimated to havedeclined again in 1969, for the second year in suc-cession. The fall, of some 2 percent, was onlyslightly less than in 1968. In both years, the declinereflected mainly the sharp reductions in cereal im-ports 17 percent in 1968 and 10 percent in 1969
from the peak reached in 1967, when massivepurchases were required to compensate for the poorcrops of the preceding two years. In 1969 wheatimports fell by 17 percent, to their lowest level since1963, and rice imports by 9 percent. The biggestreduction occurred in India, where total cereal im-ports were 30 percent smaller, and those of wheatwere down by 40 percent to the lowest level in adecade. In Pakistan, too, wheat imports fell sharply,from 1.5 million tons in 1968 to 326 000 tons in1969. Among the other major importing countries,there was an even larger drop in Indonesia, whererice imports were halved, and smaller declines inCeylon and Malaysia. As in 1968, the Philippinesimported no rice, but its purchases of wheat were
Sharein totalexports
of region,1968
Share of agriculturein total exports
1963 1968
Percent
Cambodia 1 97 197
Ceylon 3 97 95
China (Taiwan) 7 57 31
Hong Kong 16 13 6
India 16 47 37
Korea. Rep. of '4 36 '18
West Malaysia 9 59 153
Pakistan 6 74 '49
Philippines 3 70 52
Singapore 11 49 42
Thailand 6 83 74
TOTAL REGION 2 100 59 46
increased by about a third. China (Taiwan) andthe Republic of Korea continued to increase theircereal imports in line with the trend of recent years.The wheat imports of China (Taiwan) were up bymore than 50 percent. The Republic of Korea in-creased its purchases even more wheat by 65 per-cent, while those of rice were two and a half timeslarger than in 1968 reflecting the smaller cropsof 1967 and 1968.
Among other food imports, those of sugar andmeat fell (by 20 and 6 percent, respectively) belowthe peak levels of 1968, when they had increased bysome 40-45 percent. The rising trend in imports ofdaily products and fruit continued.
LIVESTOCK DEVELOPMENT
Role of livestock in agriculture
Published statistics indicate that livestock plays arelatively minor role in farm production and in theeconomies of the developing countries of Asia andthe Far East. In 1969 its contribution to the totalGDP of the region was estimated at only 4 percent,equal to 12 percent of the agricultural componentof GDP." The apparently widespread underrecord-ing of domestic backyard production for family sub-sistence and local village use, however, deflates thelivestock production statistics, while the under-utilization of cattle, particularly in India, tends todepress the recorded aggregates and trends.
Existing statistical data also omit some of theless obvious but economically important contri-butions made by livestock. More than half thetotal energy employed in farming in the regionis provided by draught cattle and buffalo. Theheavy dependence of peasant farmers on their live-stock is unlikely to be appreciably reduced in theforeseeable future by any acceleration in mechani-zation. And, as the traditional source of organicfertilizer in the region, farmyard manure continuesto play an important part in maintaining soil fertil-ity and productivity.
Although livestock production statistics in the re-gion convey a somewhat misleading impression of theimportance of livestock in most countries, recenttrade returns nevertheless tend to confirm that progressin animal husbandry generally lags behind the re-gion's requirements. Steadily increasing imports oflivestock products have been recorded by mostcountries in the region. Including interregional trade,but excluding Japan's trade and that of MainlandChina, total imports of pork increased from 5 340tons in 1963 to more than 24 000 tons in 1968, while
" Compared with an average of 7 percent of total GDP for the64 countries covered by IwP studies and 22 percent of the agricul-tural component of GDP in those countries.
88
during the same period poultry meat imports increas-ed 225 percent to 27 695 torts. Much more moder-ate increases occurred in the imports of other meats,with beef and veal recording a 14 percent advanceto 12 900 tons, and mutton and lamb increasing by22 percent to 7 000 tons. Compared with the overallproduction and consumption of meat in the region,these imports are marginal. Moreover, the overallpicture is heavily dominated by the increasing im-ports of Singapore and Hong Kong; currently about97 percent of the region's total imports of pork,mutton and lamb, about 80 percent of beef andveal, and over 90 percent of poultry meat are ac-counted for by these two city states, both of whichare building up their entrepôt trade in meat products.The imports of dairy produce, however, are muchmore evenly spread, with Ceylon, China (Taiwan),the Republic of Korea, Malaysia, Pakistan and thePhilippines, for example, each taking substantialportions of the steady increase in this trade.
Increasing livestock production in the region wouldcurb the growth of food imports and make for asignificant savings in foreign currency. Given, how-ever, the current heavy concentration of the im-ports in these two city states, an even more compel-ling reason for greater emphasis on livestock produc-tion lies in the existing nutritional deficiencies ofrapidly increasing populations relying on rice andwheat for their staple food supplies. At presentonly 10 percent of the protein intake of the region'spopulation is supplied by livestock products, a pro-portion significantly lower than that of any otherregion.
Greater emphasis on livestock development is alsoone of the preconditions for more balanced progressin agricultural and industrial development generally.The introduction and spread of leguminous and grainfodder crops, especially in rotations for continuouscropping in irrigated areas, would not only supporthighly advantageous types of farming diversificationand new agro-industries, but would also improvestandards of efficiency in soil and water manage-ment. The current trend toward self-sufficiency infood-grain production in most countries of Asia,moreover, points to the emergence in some countriesof surpluses of rice and wheat of qualities and in quan-tities difficult to export, while also releasing landsfor production of green fodder and pasture legumes.The systematic utilization of such grain surplusesand fodder for stock feeding could provide the basisfor new intensive livestock farming programmes inseveral countries. The way Thailand was able todevelop a substantial maize export industry to supplyfeed for Japan's livestock indicates that, in severalAsian countries, there is scope for developing feedproduction, mainly from highly productive hybridmaize and sorghum varieties.
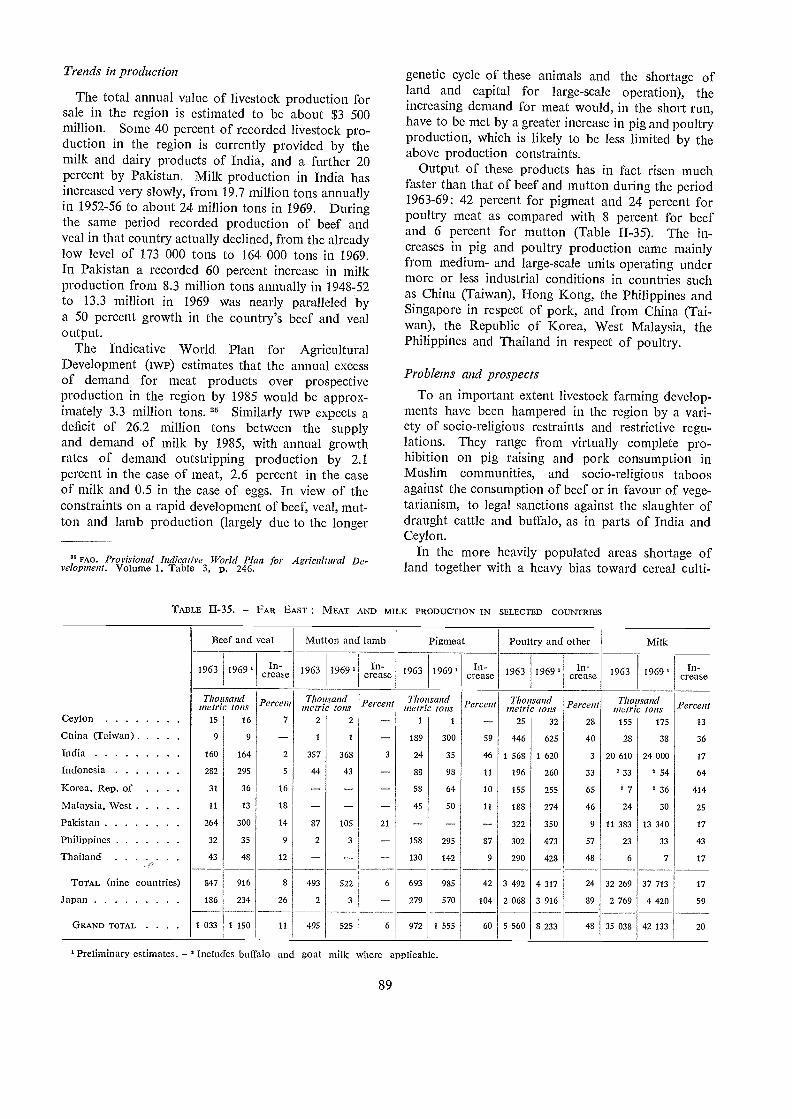
Trends in production
The total annual value of livestock production forsale in the region is estimated to be about $3 500million. Some 40 percent of recorded livestock pro-duction in the region is currently provided by themilk and dairy products of India, and a further 20percent by Pakistan. Milk production in India hasincreased very slowly, from 19.7 million torts annuallyin 1952-56 to about 24 million tons in 1969. Duringthe same period recorded production of beef andveal in that country actually declined, from the alreadylow level of 173 000 tons to 164 000 tons in 1969.In Pakistan a recorded 60 percent increase in milkproduction from 8.3 million tons annually in 1948-52to 13.3 million in 1969 was nearly paralleled bya 50 percent growth in the country's beef and vealoutput.
The Indicative World Plan for AgriculturalDevelopment (1w) estimates that the annual excessof demand for meat products over prospectiveproduction in the region by 1985 would be approx-imately 3.3 million tons. 35 Similarly IWP expects adeficit of 26.2 million tons between the supplyand demand of milk by 1985, with annual growthrates of demand outstripping production by 2.1percent in the case of meat, 2.6 percent in the caseof milk and 0.5 in the case of eggs. In view of theconstraints on a rapid development of beef, veal, mut-ton and lamb production (largely due to the longer
" FAO. Provisional Indicative World Plan for Agricultural De-velopment. Volume 1, Table 3, p. 246.
TABLE II-35. FAR EAST : MEAT AND MILK PRODUCTION IN SELECTED COUNTRIES
Preliminary estimates. 'Includes buffalo and goat milk where applicable.
89
genetic cycle of these animals and the shortage ofland and capital for large-scale operation), theincreasing demand for meat would, in the short run,have to be met by a greater increase in pig and poultryproduction, which is likely to be less limited by theabove production constraints.
Output of these products has in fact risen muchfaster than that of beef and mutton during the period1963-69: 42 percent for pigmeat and 24 percent forpoultry meat as compared with 8 percent for beefand 6 percent for mutton (Table II-35). The in-creases in pig and poultry production came mainlyfrom medium- and large-scale units operating undermore or less industrial conditions in countries suchas China (Taiwan), Hong Kong, the Philippines andSingapore in respect of pork, and from China (Tai-wan), the Republic of Korea, West Malaysia, thePhilippines and Thailand in respect of poultry.
Probletns and prospects
To an important extent livestock farming develop-ments have been hampered in the region by a vari-ety of socio-religious restraints and restrictive regu-lations. They range from virtually complete pro-hibition on pig raising and pork consumption inMuslim communities, and socio-religious taboosagainst the consumption of beef or in favour of vege-tarianism, to legal sanctions against the slaughter ofdraught cattle and buffalo, as in parts of India andCeylon.
In the more heavily populated areas shortage ofland together with a heavy bias toward cereal culti-
Beef and veal Mutton and lamb Pigmeat Poultry and other Milk
1963 1969' In-crease 1963 1969' In-crease 1963 1969 ' In-
crease 1963 1969' In-crease 1963 1969' In-crease
Thor sand Thor sand Thor sandmetric tons Percent metric tons Percent metric tons Percent nTichtorricsatiordns Percent nTlel it roricsalon,dis Percent
Ceylon 15 16 7 2 2 1 1 25 32 28 155 175 13
"china (Taiwan) 9 9 1 1 189 300 59 446 625 40 28 38 36
India 160 164 2 357 368 3 24 35 46 1 568 1 620 3 20 610 24 000 17
Indonesia 232 295 5 44 43 88 98 11 196 260 33 ' 33 ' 54 64
Korea, Rep. of 31 36 16 58 64 10 155 255 65 2 7 " 36 414
Malaysia, West 11 13 IS 45 50 11 188 274 46 24 30 25
Pakistan 264 300 14 87 105 21 322 350 9 11 383 13 340 17
Philippines 32 35 9 2 3 158 295 87 302 473 57 23 33 43
Thailand 43 48 12 130 142 9 290 428 48 6 7 17
TOTAL (nine countries) 847 916 8 493 522 6 693 985 42 3 492 4 317 24 32 269 37 713 17
fapan 186 234 26 2 3 279 570 104 2 068 3 916 89 2 769 4 420 59
GRAND TOTAL . . 1 033 1 150 11 495 525 6 972 1 555 60 5 560 8 233 48 35 038 42 133 20
vation leaves little scope for pasture or fodder cropson smallholdings. General preoccupation with cere-al production in official food sector programmes,parallel with a monoculture of tree crops in theplantation sector in some Asian countries, has ag-gravated the problem. Since open grazing land isgenerally scarce, and since more than 80 percentof the livestock industry at present consists of back-yard or smallholding production, the types of ani-mal husbandry most practicable and profitable arethose based on a highly intensive land use. Re-markable results have been achieved in this way,for instance in China (Taiwan) and Hong Kong.
This does not mean that all land potentially usefulfor livestock rearing has been so utilized. Areaswith potential for grazing include parts of the outerislands of Indonesia and the Philippines, and mar-ginal hill country in China (Taiwan), the Republicof Korea and Thailand. These countries are nowconsidering or are already implementing programmesfor pasture development. Considerable advanceswould also be possible through greater integrationof cattle with coconut farming on existing coconutplantations in Ceylon and the Philippines, and thedevelopment of dairying on these lands is nowbeing initiated. By and large, however, the short-age of land will continue to act as a general constrainton the development of cattle grazing and sheep farm-ing in the region.
In view of this limitation, efforts could logicallybe channelled in two directions. In the short runan expansion of livestock production could beachieved on the broad base of the existing backyardfarming methods, where output could be increasedby the addition of one or two animals per unit, withlittle practical increase in the cost of inputs sincethe animals are fed on forage and crop or domesticwaste. While not adding much to the marketedoutput, such an expansion would nevertheless makepossible a much needed increase in the home con-sumption of animal proteins.
Longer term development of animal husbandry inareas lacking scope for pasture development lies inpromoting intensive dairying and beef fattening bas-ed on the stall-feeding of concentrates and pasturecrops as well as intensive pig and poultry opera-tions. Essential for such a development, however,is that a more appropriate relationship be establish-ed between the prices of feed grains and of live-stock products. One of the factors so far inhibit-ing progres3 in the 1 vestock industries of severalAsian countries has been the provision of high pricesfor cereals, which may at times be combined withcontrolled, uneconomically low prices for livestockproducts imposed to restrain the rising cost of liv-ing in urban communities. Prospective increases inwheat and rice production may, however, result in
90
cereal surpluses in several countries in the comingyears. Increased yields and higher cropping inten-sity will enable the diversification of land to pasture(even if only within a crop rotation pattern) whilelower cereal prices may make economic the stall-feeding of grain to livestock.
A further factor limiting meat output in Asiancountries is the low rate of conversion of feed to bodyweight. This is partly a function of the geneticqualities of the animals, which cannot be improvedrapidly except in the case of pigs and poultry. Inthe interim, improved nutrition and better stockmanagement would ensure higher ratios of carcassto live weight than currently apply, while improve-ments in slaughtering, finishing, processing andmarketing could ensure more profitable production.Success in this field requires appropriate govern-ment action for the establishment of the necessaryveterinary and slaughtering facilities, and for theinitiation of efficient services for meat inspectionand control.
Technical and institutional requirements
The predominance of small-size production unitswith inadequately developed supporting services(such as credit, extension and marketing) has tend-ed to retard livestock production. Even to expandproduction on small- and medium-scale units, sub-stantially increased technical and institutional supportfrom governments would be necessary, includingcredit for livestock production, extension education,marketing, the supply of inputs and veterinary fa-cilities more or less as has been done with con-siderable success in the case of cerea/s. Considerabletechnical and institutional support will also be requiredby the medium- or large-scale commercial livestockfarming projects which will have to meet the greaterpart of the mounting consumer demand in future.
The provision of technical advice and breedingmaterial has contributed substantially to the up-grading of stock on smallholdings in countries suchas Burma, Ceylon, Malaysia, the Philippines andThailand, where improved breeding stock may beexchanged for local stock on a weight to weightbasis. The intensive cattle development projects inIndia, through their "key village" schemes, providestud services and artificial insemination in well-defined breeding areas. In Pakistan, too, govern-ment stud farms and the provision of breeding stockand land to breeders have played an important partin upgrading local herds. Day-old chicks and weanerpigs of improved breeds have also been distributedto small farmers and rural households for egg pro-duction, breeding, or fattening for market. Qualitybreeding is thus combined with inexpensive rearingon domestic waste or low-cost feed, while repurchas-
ing and marketing by a large-scale cooperative ordistributing agency make production on a small scalecommercially viable. Such attempts to overcome thelimitations of scale in production have proved eco-nomically viable in, for instance, Ceylon, China (Tai-wan), the Philippines and Thailand.
Animal health services, necessary in any case, areeven more important to small farmers because ofthe congested conditions under which livestock areoften raised in the region. Most countries havestrengthened their animal health services recently,emphasis being put as much on the prevention ofdisease as on its cure.
Incentives through better prices or reduced costs(including subsidized inputs) are practical ways inwhich governments foster additional production onsmallholdings. Although it has appeared to be po-litically inexpedient for most governments to allowsignificant price increases in livestock products, somehave been willing to subsidize the cost of feed whichcan constitute as much as 70 percent of total inputcosts. Such subsidies have been provided in Cey-lon, China (Taiwan), Japan, the Republic of Korea,Pakistan and the Philippines. In India, under theintensive cattle development projects, fodder banksare being created in various areas to sustain dairyherds in the periurban areas.
A planned programme of short-term agriculturalcredit for current inputs as well as for medium andlonger term loans for the purchase of stock and con-struction of housing facilities is also required. Suchcredit has not been available to livestock producers(especially to small operators) as it has been to cerealproducers, and this has not only made marketingdifficult but has also inhibited long-term invest-ment in livestock development. Medium and longerterm credit is required especially for medium andlarger scale poultry, pig or dairy development, whilespecial programmes are necessary for the smallerproducer who may be the owner of milk cattle but,being landless, is otherwise denied access to credit.At present, credit for these purposes is being madeavailable in China (Taiwan), India, Japan, the Re-public of Korea and the Philippines.
In the extension field, also, animal husbandryhas not received the same attention as crop produc-tion. The type of technical training and servicesavailable in the livestock sector in several of theformer colonial countries continues to emphasize theveterinary rather than the production aspects ofhusbandry and so lacks the integrated approachnecessary for profitable livestock production. TheIntensive Cattle Development programme in Indiais an example of such an integrated approach com-bining veterinary extension with support in breedingservices and in the supply of credit and inputs, aswell as in marketing.
91
Given the still largely small-scale basis of thelivestock industry in Asia, marketing improvementsprovide a key factor in development. Several coun-tries including Ceylon, Malaysia, Thailand and thePhilippines have established governmen.t-spon-sored marketing arrangements for the collection andmarketing of milk and eggs. Other countries haveprogressed in the same direction through cooperativemarketing arrangements. The dairy developmentcooperatives in India, as in the case of the Anandproject, and the farmers' associations and coopera-tives in China (Taiwan) and Japan respectively, areamong the better known examples.
DEVELOPMENT PLANNING
Among the many problems that planners continu-ously face, two have attracted particular attentionin the current plan periods in the region. One isthe problem of the appropriate allocation of resourcesas between long and short gestation period invest-ment. There are instances where an inappropriatechoice or combination has led to a disproportion-ately low increase in GNP relative to the invest-ment. It is now being increasingly recognized bothin theoretical an.d practical planning approaches thatfor economies in early stages of development whichare aiming at a rapidly rising rate of investment,it is advantageous to lay stress on short gestationperiod investment. At the same time, the demandsfor infrastructure investment, where usually the ges-tation period is long, tend to be particularly pressingat the earlier stages of growth. To arrive at a suit-able combination of the two types of investment inorder to obtain the specific growth, accumulationand consumption targets are a challenge to the tech-nical skills and ingenuity of planners.
The second problem is that of implementation.Shortfalls in this regard remain the rule rather thanthe exception. Various causes can be cited, suchas limited absorptive capacity in some sectors, de-cline in domestic savings, reduced foreign aid orexport earnings, organizational and institutionalbottlenecks, and sometimes too high targets relativeto known constraints.
Current development plans ended in 1969 in Bur-ma, Nepal, Pakistan an.d the Philippines. Availabledata on plan performance illustrate both of the prob-lems described above. As Table I1-36 indicates,both total GNP and GNP in agriculture lagged behindtargets in these countries with the exception of thePhilippines. In Pakistan there was a slight shortfallin export earnings in relation to targets, and a moresizable setback in investment; only just over 70 per-cent of the total planned outlay was actually spent,and in the agricultural sector (excluding water develop-ment) only 68 percent. These shortfalls, in turn,
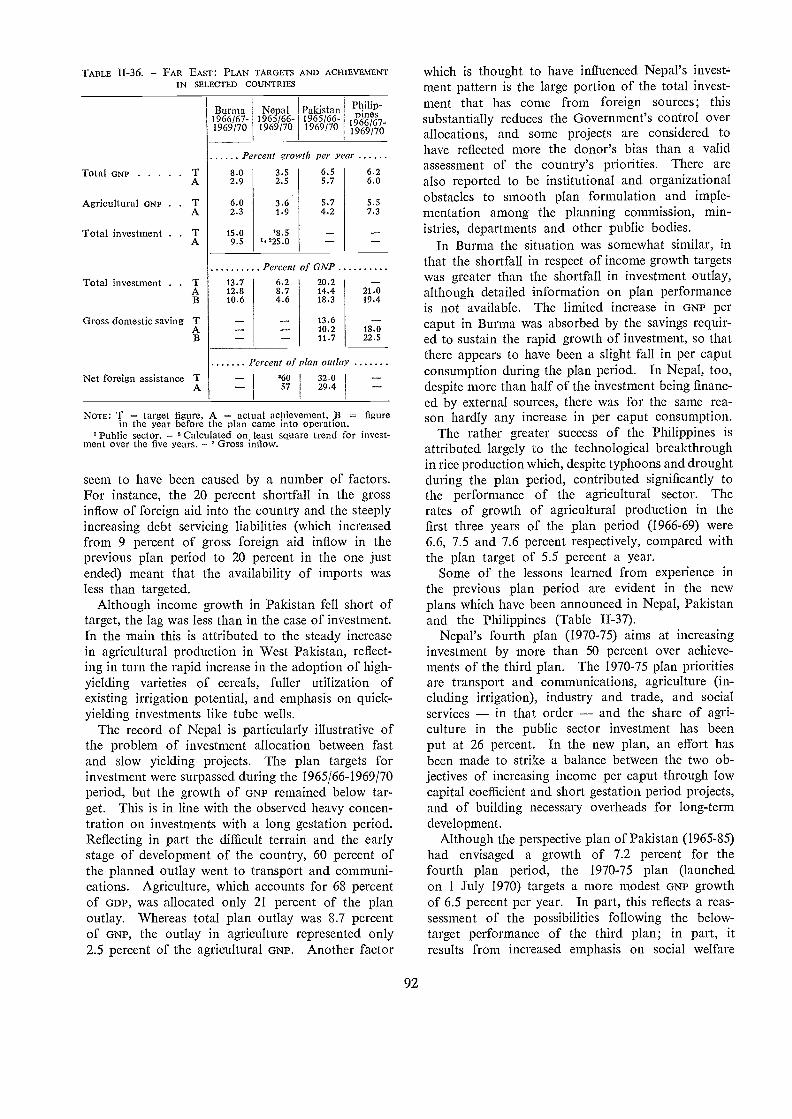
TABLE - FAR EAST: PLAN TARGETS AND ACHIEVEMENTIN SELECTED COUNTRIES
NOTE: T target figure, A = actual achievement, B = figurein the year before the plan came into operation.
Public sector. - 3Calculated on least square trend for invest-ment over the five years. - 3 Gross inflow.
seem to have been caused by a number of factors.For instance, the 20 percent shortfall in the grossinflow of foreign aid into the country and the steeplyincreasing debt servicing liabilities (which increasedfrom 9 percent of gross foreign aid inflow in theprevious plan period to 20 percent in the one justended) meant that the availability of imports wasless than targeted.
Although income growth in Pakistan fell short oftarget, the lag was less than in the case of investment.In the main this is attributed to the steady increasein agricultural production in West Pakistan, reflect-ing in turn the rapid increase in the adoption of high-yielding varieties of cereals, fuller utilization ofexisting irrigation potential, and emphasis on quick-yielding investments like tube wells.
The record of Nepal is particularly illustrative ofthe problem of investment allocation between fastand slow yielding projects. The plan targets forinvestment were surpassed during the 1965/66-1969/70period, but the growth of GNP remained below tar-get. This is in line with the observed heavy concen-tration on investments with a long gestation period.Reflecting in part the difficult terrain and the earlystage of development of the country, 60 percent ofthe planned outlay went to transport and communi-cations. Agriculture, which accounts for 68 percentof GDP, was allocated only 21 percent of the planoutlay. Whereas total plan outlay was 8.7 percentof GNP, the outlay in agriculture represented only2.5 percent of the agricultural GNP. Another factor
92
which is thought to have influenced Nepal's invest-ment pattern is the large portion of the total invest-ment that has come from foreign sources; thissubstantially reduces the Government's control overallocations, and some projects are considered tohave reflected more the donor's bias than a validassessment of the country's priorities. There arealso reported to be institutional and organizationalobstacles to smooth plan formulation and imple-mentation among the planning commission, min-istries, departments and other public bodies.
In Burma the situation was somewhat similar, inthat the shortfall in respect of income growth targetswas greater than the shortfall in investment outlay,although detailed information on plan performanceis not available. The limited increase in GNP percaput in Burma was absorbed by the savings requir-ed to sustain the rapid growth of investment, so thatthere appears to have been a slight fall in per caputconsumption during the plan period. In Nepal, too,despite more than half of the investment being financ-ed by external sources, there was for the same rea-son hardly any increase in per caput consumption.
The rather greater success of the Philippines isattributed largely to the technological breakthroughin rice production which, despite typhoons and droughtduring the plan period, contributed significantly tothe performance of the agricultural sector. Therates of growth of agricultural production in thefirst three years of the plan period (1966-69) were6.6, 7.5 and 7.6 percent respectively, compared withthe plan target of 5.5 percent a year.
Some of the lessons learned from experience inthe previous plan period are evident in the newplans which have been announced in Nepal, Pakistanand the Philippines (Table II-37).
Nepal's fourth plan (1970-75) aims at increasinginvestment by more than 50 percent over achieve-ments of the third plan. The 1970-75 plan prioritiesare transport and communications, agriculture (in-cluding irrigation), industry and trade, and socialservices - in that order - and the share of agri-culture in the public sector investment has beenput at 26 percent. In the new plan, an effort hasbeen made to strike a balance between the two ob-jectives of increasing income per caput through lowcapital coefficient and short gestation period projects,and of building necessary overheads for long-termdevelopment.
Although the perspective plan of Pakistan (1965-85)had envisaged a growth of 7.2 percent for thefourth plan period, the 1970-75 plan (launchedon 1 July 1970) targets a more modest GNP growthof 6.5 percent per year. In part, this reflects a reas-sessment of the possibilities following the below-target performance of the third plan; in part, itresults from increased emphasis on social welfare
Burma1966/67-1969/70
Nepal1965/66-1969/70
Pakistan1965/66-1969/70 19 66/67-
1969/70
Percent gro vth per year
Total GNP T 8.0 3.5 6.5 6.2A 2.9 2.5 5.7 6.0
Agricultural GNP . T 6.0 3.6 5.7 5.5A 2.3 1.9 4.2 7.3
Total investment . T 15.0 38.5 -A 9.5 3,325.0
Percent of GNPTotal investment . . T 13.7 6.2 20.2 -
A 12.8 8.7 14.4 21.010.6 4.6 18.3 19.4
Gross domestic saving T 13.6 --A 10.2 18.0
11.7 22.5
Percent of plan outlay
Net foreign assistance T 360 32.0A 57 29.4
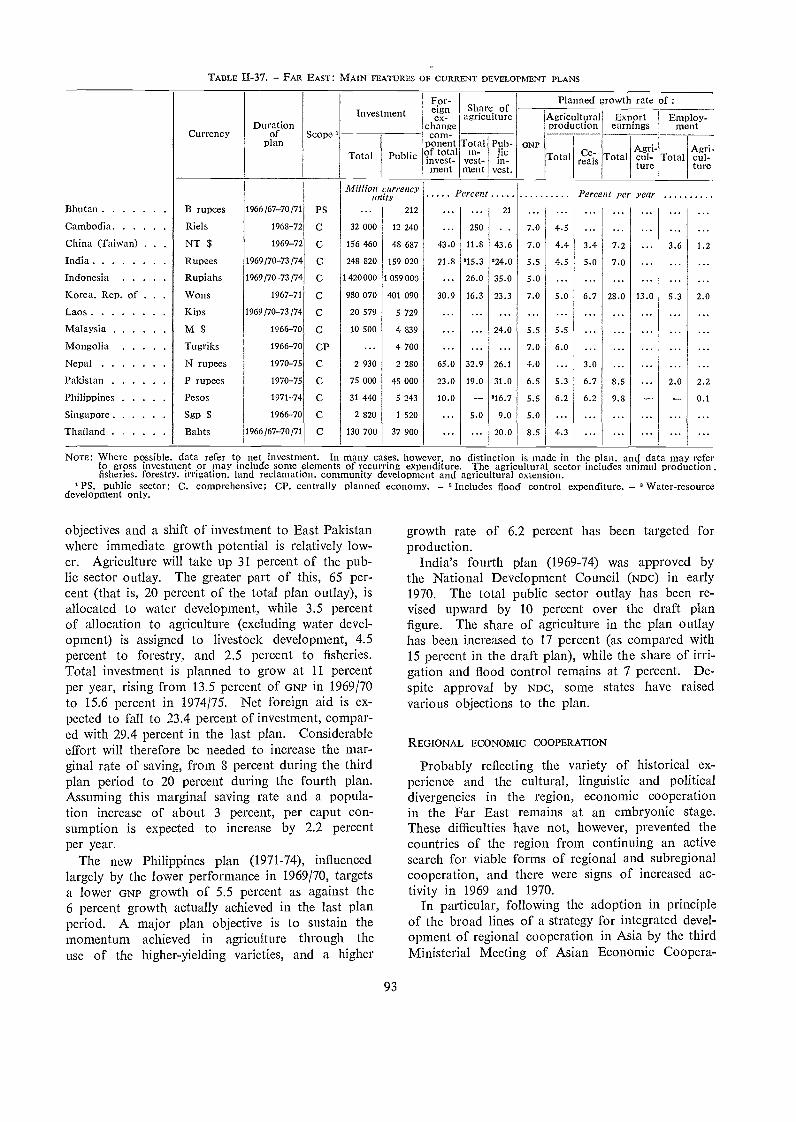
TABLE H-37. - FAR EAST : MAIN FEATURES OF CURRENT DEVELOPMENT PLANS
objectives and a shift of investment to East Pakistanwhere immediate growth potential is relatively low-er. Agriculture will take up 31 percent of the pub-lic sector outlay. The greater part of this, 65 per-cent (that is, 20 percent of the total plan outlay), isallocated to water development, while 3.5 percentof allocation to agriculture (excluding water devel-opment) is assigned to livestock development, 4.5percent to forestry, and 2.5 percent to fisheries.Total investment is planned to grow at 11 percentper year, rising from 13.5 percent of GNP in 1969/70to 15.6 percent in 1974)75. Net foreign aid is ex-pected to fall to 23.4 percent of investment, compar-ed with 29.4 percent in the last plan. Considerableeffort will therefore be needed to increase the mar-ginal rate of saving, from 8 percent during the thirdplan period to 20 percent during the fourth plan.Assuming this marginal saving rate and a popula-tion increase of about 3 percent, per caput con-sumption is expected to increase by 2.2 percentper year.
The new Philippines plan (1971-74), influencedlargely by the lower performance in 1969/70, targetsa lower GNP growth of 5.5 percent as against the6 percent growth actually achieved in the last planperiod. A major plan objective is to sustain themomentum achieved in agriculture through theuse of the higher-yielding varieties, and a higher
93
NOTE: Where possible, data refer to net investment. In many cases, however, no disti tction is made in the p an, and data may referto gross investment or may include some elements of recurring expenditure. The agricultura sector includes animal productionfisheries, forestry, irrigation, land reclamation. community development and agricultural extension.
' PS, public sector; C. comprehensive; CP, centrally planned economy. - Includes flood control expenditure. - ° Water-resourcedevelopment only.
growth rate of 6.2 percent has been targeted forproduction.
India's fourth plan (1969-74) was approved bythe National Development Council (NDc) in early1970. The total public sector outlay has been re-vised upward by 10 percent over the draft planfigure. The share of agriculture in the plan outlayhas been increased to 17 percent (as compared with15 percent in the draft plan), while the share of irri-gation and flood control remains at 7 percent. De-spite approval by NDC, some states have raisedvarious objections to the plan.
REGIONAL ECONOMIC COOPERATION
Probably reflecting the variety of historical ex-perience and the cultural, linguistic and politicaldivergencies in the region, economic cooperationin the Far East remains at an embryonic stage.These difficulties have not, however, prevented thecountries of the region from continuing an activesearch for viable forms of regional and subregionalcooperation, and there were signs of increased ac-tivity in 1969 and 1970.
In particular, following the adoption in principleof the broad lines of a strategy for integrated devel-opment of regional cooperation in Asia by the thirdMinisterial Meeting of Asian Economic Coopera-
Bhutan
Cambodia
China (Taiwan)
India
Indonesia
Korea, Rep. ofLaos
Malaysia
Mongolia
Nepal
Pakistan
Philippines
Singapore
Thailand
B rupees
Riels
NT $Rupees
Rupiahs
Wons
Kips
M $
Tugriks
N rupees
P rupees
Pesos
Sep $Bahts
1966 /67-70 /71
1908-72
1969-72
1969/70-73/74
1969 /70-73 /74
1967-71
1969/70-73/74
1966-70
1966-70
1970-75
1970-75
1971-74
1966-70
1966/67-70/71
PS
C
C
C
C
C
C
C
CP
C
C
C
C
C
32 000
156 460
248 820
1 420000
980 070
20 579
10 500
2 930
75 000
31 440
2 820
130 700
212
12 240
48 687
159 020
1 059000
401 090
5 729
4 839
4 700
2 280
45 000
5 243
1 520
37 900
...43.0
21.8
...30.9
65.0
23.0
10.0
250
11.8
115.3
26.0
16.3
32.9
19.0
5.0
21
.
43.6
'24.0
35.0
23.3
24.0
26.1
31.0
'16.7
9.0
20.0
7.0
7.0
5.5
5.0
7.0
5.5
7.0
4.0
6.5
5.5
5.0
8.5
4.5
4.4
4.5
5.0
5.5
6.0
...5.3
6.2
...4.3
3.4
5.0
6.7
3.0
6.7
6.2
7.2
7.0
28.0
8.5
9.8
13.0
3.6
5.3
2.0
1.2
2.0
2.2
0.1
For- Planned growth rate ofInvestment eign
ex-Share ofagriculture Agricultural Export Employ-
CurrencyDuration
ofplan
Scopechangecom-
ponentof totalinvest-ment
GNP
Production earnings ment
Total PublicTotal
in-vest-ment
Pub-licin-
vest.Total Ce-
reals TotalAgri-cul-ture
TotalAgri-cul-ture
Million currencyunits Percent Percent per year
tion (now called the Council of Ministers for AsianEconomic Cooperation) at the end of 1968, specificwork on the content and implications of such astrategy was started in 1969. The first phase of theprogramme of work, carried out by a task force setup within the secretariat of the Economic Commissionfor Asia and the Far East (EcAFE) and by nationalunits, includes a " commodity flow exercise " (com-modity and country profiles), and studies of tech-niques of trade liberalization, of possible paymentsmechanisms to support them, and of a commercialinfrastructure for trade.
A preliminary draft programme on Asian tradedevelopment and liberalization has already beendrawn up. Under it participating countries would,among other things, endeavour to increase theirintraregional trade by an agreed annual target dur-ing an initial preparatory phase. Possible tradedevelopments and payments arrangements were con-sidered at expert consultations in March 1970 andfurther meetings on this subject are expected to takeplace during the year to finalize proposals for atrade liberalization programme in late 1970 orearly 1971, and its adoption later that year.
At subregional level, the member countries of theAssociation of South-East Asian Nations (ASEAN) haveset up an intergovernmental advisory committeewhich has commissioned certain studies (currentlybeing carried out by the United Nations and itsspecialized agencies) to ascertain the extent, specificareas and means by which economic cooperation inagriculture, industry and trade can be fostered amongthemselves. Although the economies of most of thecountries are not complementary (Singapore, forexample, is the only country not producing rawmaterials), there seems to be adequate room for agreater exchange of goods through tariff cuts, pay-ments agreements and the removal of exchange con-trol restrictions.
Little progress has been made in promoting re-gional cooperation on a commodity-by-commoditybasis. The Asian Coconut Community (Acc) heldits first two meetings in 1969 and 1970, and hasrequested assistance in the identification and for-mulation of projects from the United Nations De-velopment Programme and the specialized agen-cies. The intergovernmental consultations conductedin early 1970 on the possibilities of regional cooper-ation in respect of rice proved abortive. Therehas also been only limited progress toward the estab-lishment of the proposed Rubber Producers' As-sociation (which would include Ceylon, Indonesia,Malaysia, the Philippines and Thailand) which wouldaim at stabilizing rubber prices. This is due partlyto higher world prices for natural rubber and partlyto technical disagreements over the mechanism tobe adopted for tbe arrangernent. The Indo-Ceylon
94
tea agreement on collaboration in the packagingand export promotion of tea may have received asetback as a result of India's decision to removethe export taxes on tea.
Japan
The Japanese economy continued its rapid ex-pansion, with a rise in real GNP of 13 percent in1969, resulting in a per caput national income ofSi 270 an increase of 12 percent over 1968. In1970, the growth is estimated to have continued vir-tually at the same rate.
Agricultural production remained at the same levelas in 1968. To a large extent this reflects the struc-tural adjustments now being implemented in thefarm sector. Faced with an increasing rice surplusthe Government decided to freeze the purchase priceof rice, which hitherto had risen rapidly, and outputfell from 18.8 million tons in 1968 to 18.2 milliontons in 1969. The production of barley declined by52 percent in 1969 and that of wheat by 25 percent.However, in line with the recent shift toward highervalue products, milk production increased by 10 per-cent in 1969 and that of beef, pig,meat and poultrymeat by 4 percent.
In 1970, output may have risen fractionally, despitea further fall, to about 17 million tons, in the ricecrop. There was some recovery in wheat and barleyproduction, and meat and milk output continuedto rise.
Japan's agricultural exports have long since beencompletely dwarfed by its imports. In 1969 theirtotal value (excluding fishery and forest products)was only $407 million compared with an agriculturalimport bill of about $3 700 million, an increase ofnearly 8 percent compared with 1968. The mainincrease in imports arose from larger value of im-ports of raw sugar, meat products (especially pig-meat) and natural rubber. Also the value of soy-beans registered an increase in 1969 and those ofwheat and maize, the principal cereal imports, reach-ed peak levels. Although nearly 20 percent lesscotton was imported than in 1968, it remained thelargest agricultural import in value terms.
Fishery production declined somewhat below the1968 level, but was characterized by an increase inthe proportion of the catch used for industrial pur-poses. Although Japan retains its position asthe world's second largest producer of fish, thevolume and value of imports have been increas-ing and imports now account for some 10 percentof domestic consumption. Given the continuedstrong preference for fish in the diet, this trend isexpected to continue. A significant change in thepattern of trade in 1969 was the decline in tuna ex-
ports, hitherto an important source of raw materialto -United States canneries, and an increase by onequarter in tuna imports. To forestall a further de-terioration in the country's position in the UnitedStates markets, investigations have been started ofpossible ways to improve the efficiency of Japan'stuna fishing operations.
Despite a drop in removals of nearly all categoriesof domestic roundwood, Japanese wood processingindustries appreciably expanded their output of sawn-wood and plywood and of pulp and paper products.This was made possible by continued expansion in im-ports of hardwood logs from southeast Asia, andof pulpwood chips from North America, as wellas by partly offsetting the 1 million cubic metrereduction of coniferous log imports from the UnitedStates by increased coniferous supplies from theU.S.S.R. and New Zealand. Facilities were beingset up to ship hardwood chips from southeast Asiaand Australia, and possibilities of a further supplyfrom Brazil were being investigated. Imports ofchemical pulp also increased substantially. Japandominates industrial forest production in the re-gion, accounting for three quarters or more of theoutput of most processed categories.
In line with the general buoyancy of the economy,average farm household incomes in 1968/69 rose by10 percent to the equivalent of $3 135. However,the greater part of farrn household income comesfrom nonfarm sources and in 1968/69 this compo-nent increased by 17 percent, while the agriculturalcomponent rose by only 3 percent.
PRINCIPAL PROBLEMS AND POLICIES
Reflecting the continued increase in rice production(until 1968) in the face of a steady reduction in percaput consumption (at an annual rate of about 2percent), the stocks of old crop rice have grownrapidly in recent years. In 1969 they rose by 16percent to 5.5 million tons (milled), and a furtherincrease to about 8 million tons was expected by31 October 1970.
To counter this tendency the Government re-cently announced a policy under which rice produc-tion would be reduced by 1.36 million tons, equal toabout 11 percent of the 1969 crop. Some 354 000hectares or 11 percent of the 1969 paddy area wereto be switched from rice to other uses during 1970-71 by means of the disincentive of freezing thepurchase price of rice and by the incentive of thepayment of premiums for the diversification ofpaddy land to other crops or to nonagricultural uses.
The second major problem in Japan's agriculturearises from the fact that the growth of productivityof Japanese agriculture appears to be reaching itslimits under the present farm size structure, dominat-
95
ed by small farms. The need for structural changeis accentuated by the increasing shortage of labourin agriculture, and the further spread of part-timefarming. 3°
Various measures aiming at the creation of largerfarming units and a shift from rice to other cropsand livestock production have been taken underthe Basic Directives of Structural Policy publishedin 1961. Existing legal restrictions, however, in par-ticular those arising from some features of the post-war land reform, now appear to have outlived theirpurpose and are hindering changes in the scale andflexibility of Japanese agriculture. In April 1970 theDiet therefore abolished the existing limitations onthe maximum size of tenancy holdings and on thelevels of rents, and approved measures which willallow the ownership and management of land bynonfarming landlords and agricultural cooperatives.It is hoped that these measures will enable theGovernment to achieve its 1977 target of a minimumholding of 4 to 5 hectares on rice land (comparedwith the present average of 0.7 hectare) and to ex-pand the average herd of dairy farms from the pres-ent 4.4 cows to 20 cows. Thereby it is also expect-ed to increase the average farm household incometo $5 500, which would equal the projected non-farm household income by 1977.
Mainland China
By the end of 1969, Mainland China's economyseemed well on the way to recovery after the threeyears of upheavals associated with the " culturalrevolution." Reports on agriculture suggest a sig-nificant increase in production over 1968. Foodgrains are estimated to have occupied 80 percentof the total planted area, and FAO estimates cerealproduction (including potatoes and sweet potatoesat food-grain equivalent) to have amounted to 222million tons against some 214 million tons in 1967and 212 million tons in 1968.3' The productionof paddy, which accounts for 50 percent of the total,is estimated at 95 million tons, 4 million tons morethan in 1968. Increases are also reported in othercrops such as sugarcane, soybeans, tea, silk andvegetables. However, production of cotton, the ma-jor industrial crop, barely maintained the 1968 level,while tobacco production declined. Cattle and sheepproduction is thought to have responded to favourableweather conditions in the pastoral regions, and pigproduction is reported to have increased in both the
" In 1969, 80 percent of farm householders were part-time farm-ers. Only 5 percent of the 3.5 million farm households whichsell paddy to the Government owned more than 2 hectares of paddYland, and only 3.4 percent of dairy-producing households ownedmore than 15 cows.
The FAO tnethod of estidiating cereal production in MainlandChina is explained in The state of food and agriculture 1968. pase 14.
collectives and the limited private holdings. Al-though some farm products still continue to be ra-tioned, the general increase of production in 1969appears to have done away with many of the short-ages of the past few years.
Earlier efforts to expand the area under cultiva-tion by large-scale land reclamation are no longerbeing actively pursued, since the uncultivated land,although extensive, is known to be of poor quality."There appears to have been little or no increase inarea sown in 1969, and the increases in pro-duction appear, therefore, to have been achievedthrough higher yields and agricultural intensifica-tion. This, in turn, has necessitated the use of great-er quantities of fertilizer and other inputs. Nodata regarding total fertilizer supplies are availablesince 1966, when they are reported to have reached8.5 million tons, compared with 2.2 million tons in1961. More than half of the 1966 figure is saidto have been imported, but local fertilizer productionis also reported to have been increased substantially,on the basis of small-scale rural plants." A shortageof overall supplies is suggested, however, by thecall on farmers in 1968 to increase the collection andapplication of organic manure.
October 1969 saw the official announcement ofthe outline of a new economic development planfor Mainland China. This was the first overalleconomic policy statement since the commence-ment of the cultural revolution in 1966. ft enun-
" Only 12 percent of the national land area is now cultivated;only a further 3 percent is classified as " cultivable wasteland,"which it would be slow and costly to reclaim.
" Large fertilizer plants exist in Hopei and Shensi, the latterbeing reported to be the first modern plant using a noncarboni-zation process.
Near East
Despite the political tension in the region, therehas been marked progress in the overall economicgrowth in a number of countries. In 1969 GDP
grew by more than 10 percent in Iran, Israel andLibya, by about 10 percent in Cyprus and by 7 per-cent in Turkey. Oil production in the region as awhole rose considerably (by 11.5 percent), with theheaviest gains secured by Iran, Libya and SaudiArabia. The contribution of agriculture to GDP
growth was generally low, reflecting the effect onagricultural output of adverse climatic conditions,although there were also exceptions as in the caseof Cyprus where the overall growth rate was posi-tively affected by a 14 percent increase in agricul-tural production. Good progress in the adoption ofhigh-yielding varieties of cereals continued to be
96
ciates a comparatively balanced concept of economicdevelopment, moving away from the former concen-tration on heavy industries toward relatively greaterinvestment in light industries and especially in agri-culture. It also envisages a more dispersed growth,including rural development programmes geared tolocal needs, with rural industrialization through smallfactories for the manufacture of chemical fertilizersand farm machinery.
As regards agrarian structure, 1969 witnessed somelimited moves toward decentralization. The man-agement of rural credit and trade was handed overto communes and brigades, as were also the tractorsfrom the disbanded tractor stations. Some decen-tralization of the administration was also carriedout. Despite announcements to the contrary in1968, farmers are still reported to be allowed to con-tinue production on their intensively cultivated pri-vate lots, and to continue with subsidiary sidelineoccupations. At the other end of the scale, experi-mental mergers of production teams and brigadesinto larger units were tried out on a limited scale,as in the previous year.
Mainland China's foreign trade, which had de-clined in 1967-68, improved markedly in the latterhalf of 1969. The value of food exports exceededthat of food imports for the fourth consecutive year,mainly because of reduced wheat imports. Therewas a further increase of trade with the non-Com-munist world; Hong Kong, Japan and Singaporewere the main trade partners, and rice, soybeans,livestock products, sugar and vegetables the mainexports. On the other hand, Mainland China'strade with other centrally planned countries prob-ably reached an all-time low.
sustained in Afghanistan, Iran, Iraq, Turkey andthe United Arab Republic. In the institutional field,the completion of the land redistribution stage ofagrarian reform in Syria has left the Governmentfree to concentrate on establishing cooperatives,while in the United Arab Republic the limitationof lan.d ownership to 50 feddans (20 hectares) perperson has led to an increase in the number bene-fiting from land reform.
Agricultural production
Over the decade from 1956-58 to 1966-68, agricul-tural production in the Near East region grew ata rate of 3.1 percent a year the highest for all
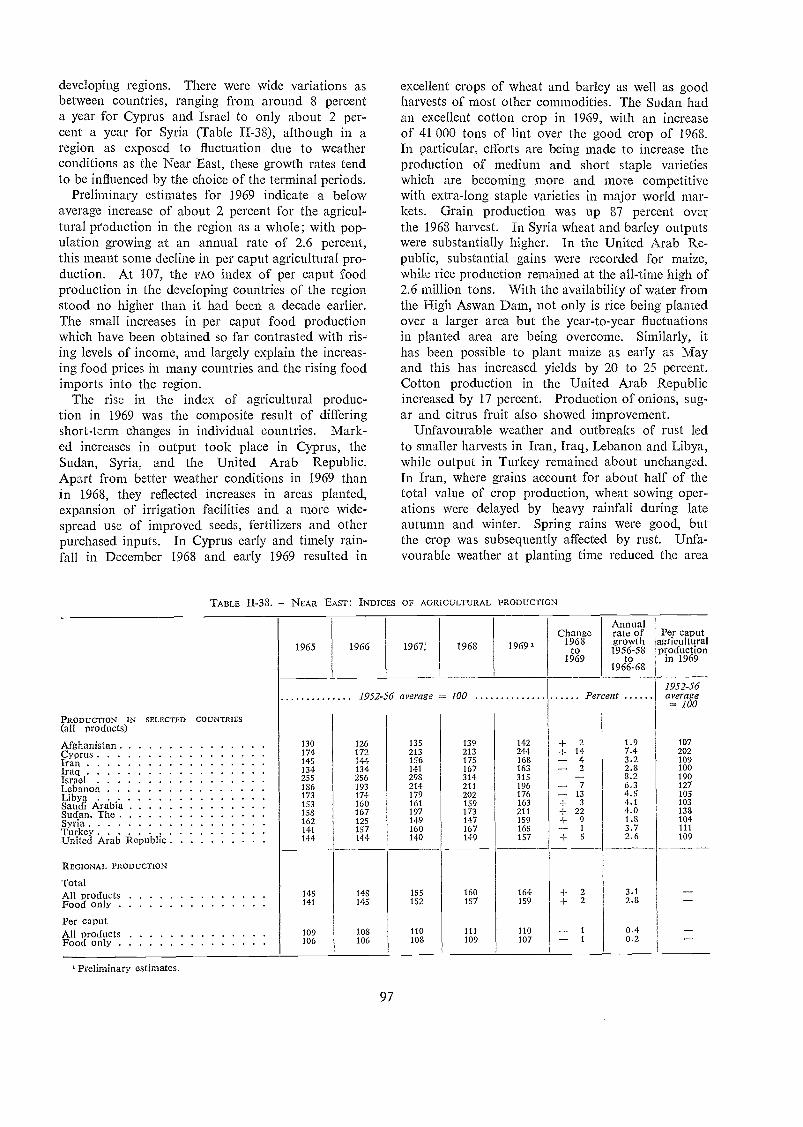
developing regions. There were wide variations asbetween countries, ranging from around 8 percenta year for Cyprus and Israel to only about 2 per-cent a ycar for Syria (Table II-38), although in aregion as exposed to fluctuation due to weatherconditions as the Near East, these growth rates tendto be influenced by the choice of the terminal periods.
Preliminary estimates for 1969 indicate a belowaverage increase of about 2 percent for the agricul-tural production in the region as a whole; with pop-ulation growing at an annual rate of 2.6 percent,this meant sonic decline in per caput agricultural pro-duction. At 107, the FAO index of per caput foodproduction in the developing countries of the regionstood no higher than it had been a decade earlier.The small increases in per caput food productionwhich have been obtained so far contrasted with ris-ing levels of income, and largely explain the increas-ing food prices in many countries and the rising foodimports into the region.
The rise in the index of agricultural produc-tion in 1969 was the composite result of differingshort-term changes in individual countries. Mark-ed increases in output took place in Cyprus, theSudan, Syria, and the United Arab Republic.Apart from better weather conditions in 1969 thanin 1968, they reflected increases in areas planted,expansion of irrigation facilities and a more wide-spread use of improved seeds, fertilizers and otherpurchased inputs. In Cyprus early and timely rain-fall in December 1968 and early 1969 resulted in
' Preliminary estimates.
TABLE 11-33. NEAR EAST: INDICES OF AGRICULTURAL PRODUCTION
1965 1966
97
excellent crops of wheat and barley as well as goodharvests of most other commodities. The Sudan liadan excellent cotton crop in 1969, with an increaseof 41 000 tons of lint over the good crop of 1968.In particular, efforts are being made to increase theproduction of medium and short staple varietieswhich are becoming more and more competitivewith extra-long staple varieties in major world mar-kets. Grain production was up 87 percent overthe 1968 harvest. In Syria wheat and barley outputswere substantially higher. In the United Arab Re-public, substantial gains were recorded for maize,while rice production remained at the all-time high of2.6 million tons. With the availability of water fromthe High Aswan Dam, not only is rice being plantedover a larger area but the year-to-year fluctuationsin planted area are being overcome. Similarly, ithas been possible to plant maize as early as Mayand this has increased yields by 20 to 25 percent.Cotton production in the United Arab Republicincreased by 17 percent. Production of onions, sug-ar and citrus fruit also showed improvement.
Unfavourable weather and outbreaks of rust ledto smaller harvests in Iran, Iraq, Lebanon and Libya,while output in Turkey remained about unchanged.In Iran, where grains account for about half of thetotal value of crop production, wheat sowing oper-ations were delayed by heavy rainfall during lateautumn and winter. Spring rains were good, butthe crop was subsequently affected by rust. Unfa-vourable weather at planting time reduced the area
1952-56 average = 100
PRODUCTION IN SELECTED COUNTRIES(all products)
100
AfghanistanCyprusIranIraqIsraelLebanonLibyaSaudi ArabiaSudan, TheSyriaTurkeyUnited Arab Re ublic
130174145134255186173153158162141144
126172144134256193174160167125157144
135213156141298214179161197149160140
139213175167314211202159173147167149
142244168163315196176163211159165157
4- 24- 1427
13-F 3+ 22
9
+ 5
1.97.43.22.88.26.34.54.14.01.83.72.6
107202109100190127105103138104111109
REGIONAL PRODUCTION
TotalAll productsFood only
145141
148145
155152
160157
164159
-I- 24- 2
3.12.8
Per caputAll productsFood only
109106
108106
110108
111109
110107
1
10.40.2
AnnualChange rate of Per caput
1969 1968to
growth1956-58
agriculturalproduction
1969 to in 19691966-68
1952-56Percent average
1967; 1968
under barley. The total grain output was conse-quently down by 16 percent. Cotton productionwas up by some 3 percent. By contrast, rice pro-duction increased significantly, in line with thelonger term upward trend, primarily because of anexpansion in crop area and better cultural practices.
In Iraq adverse weather and an attack of rustreduced the wheat crop to 1.2 million tons, fromthe record crop of 1.4 million tons in 1968. Ofthe other main cereals, rice also registered a signif-icant decline, but a record crop of nearly 1.3
million tons of barley was harvested. Adverse weath-er conditions in Iraq were also responsible for asubstantial decline in horticultural production.
In Turkey a cool spring and a sudden dry spellin May kept wheat production far below the expect-ed level. This, together with lower production ofcotton, olives, oilseeds, fruit and nuts, contributedto the decline of the index of agricultural productionin 1969, which the increases in production of barley,maize, vegetables, pulses and livestock products wereinsufficient to offset.
The 7 percent decrease in Lebanon reflected mainlythe steep fall in the production of eggs, the exportmarkets for which are shrinking, and of fruit, partic-;ularly apples, which was affected by the bad weather.
In terms of principal commodities, the limitedgrowth of agricultural production in the region in1969 was mainly attributable to increases in produc-tion of cereals, particularly barley and to a lesserextent wheat, and of cotton, which reached a rec-ord level of nearly 1.5 million tons, mainly reflect-ing the increases in the Sudan and the United ArabRepublic. These increases more than outweighedthe effect on the index of the fall in production ofvegetable oils, sugar and horticultural crops. In linewith the very slow rate of growth of the past, pro-duction of meat and of other livestock products isestimated to have increased only marginally in 1969.
Data on production in 1970 are too scarce topermit any quantitative estimation of the overalloutput in the region. Cereal production may, how-ever, be down, with smaller crops of wheat in Syria andTurkey, and barley in Turkey and Iraq. Little changewas expected in the production of rice and maize or ofvegetables and fruit. Cotton production, however,was thought likely to be smaller in some of the majorproducing countries, except the United Arab Republic.
High-yielding varieties of cereals
There was some further progress in the adoptionof high-yielding varieties of cereals, particularly inAfghanistan, Iran, Iraq, Turkey and the UnitedArab Republic but so far they have failed to makea decisive impact on production. In Afghanistan
98
areas with irrigation and mild winters appear verysuitable for the semidwarf wheats such as LermaRojo 64 and Mexipak. An area slightly exceeding120 000 hectares, or 6 percent of the total wheatarea, was sown with these varieties in 1969, andthis is reported to have contributed to the somewhathigher production obtained in the past season.
Under the impact programme for wheat in Iran,Mexican and Russian seed varieties are supplied tocontracting farmers, who are also provided withfertilizers on credit, and the relevant extension ser-vices. The Russian winter varieties are reportedto give high yields under rainfed conditions in areaswith more than 400 millimetres of annual precipita-tion. About 100 000 hectares were sown with Mex-ican seed in 1969/70, as against a target of 124 000hectares. The target for 1970/71 is 130 000 hect-ares, which would constitute about 3 percent ofthe total wheat area. Apart from those farmerswho have obtained seed from official sources, othershave obtained it from contracting farmers, so thatthere has been some spread effect especially forMexican varieties. In addition to the wheat pro-gramme, a rice project has recently been initiatedwhich includes distribution of improved seeds, acredit programme (partly in cash and partly in kind)and extension services. In 1969, an initial 18 000hectares were brought under improved rice varieties,and recently imported high-yielding rice varietiesfrom China (Taiwan) are being tested.
In Iraq about 10 000 hectares were seeded withMexipak wheat in 1969, and the estimate for 1970is about 70 000 hectares. For the 1969 rice crop100 tons of IR8 seed were imported from thePhilippines, of which about 60 tons were sown overan area of about 600 hectares. Systematic production,certification and distribution of high-yielding seedsof wheat, barley and rice are contributing to in-creased production in the country.
In Turkey there was a rapid spread of the areaunder Mexican varieties in 1969, the total area cov-ered being about 800 000 hectares, but yields weredisappointing due to rust and inadequate and lateapplication of fertilizer. In 1970 slightly under700 000 hectares, or approximately 11 percent of thetotal wheat area, were sown to high-yielding varieties.
In the United Arab Republic, where seed distri-bution has reached an advanced level, the locallydeveloped high-yielding and disease-resistant vari-ety Giza 155 is expected to cover about three quar-ters of the wheat area in 1970/71, compared withless than 15 percent in 1968/69. In fact, 60 000 tonsof seeds were distributed for the 1969/70 season,enough to plant 430 000 hectares. To increase thereturn from wheat growing, the producer price ofwheat has been increased by LE. 6.6 per ton (26percent) for the 1970 crop.
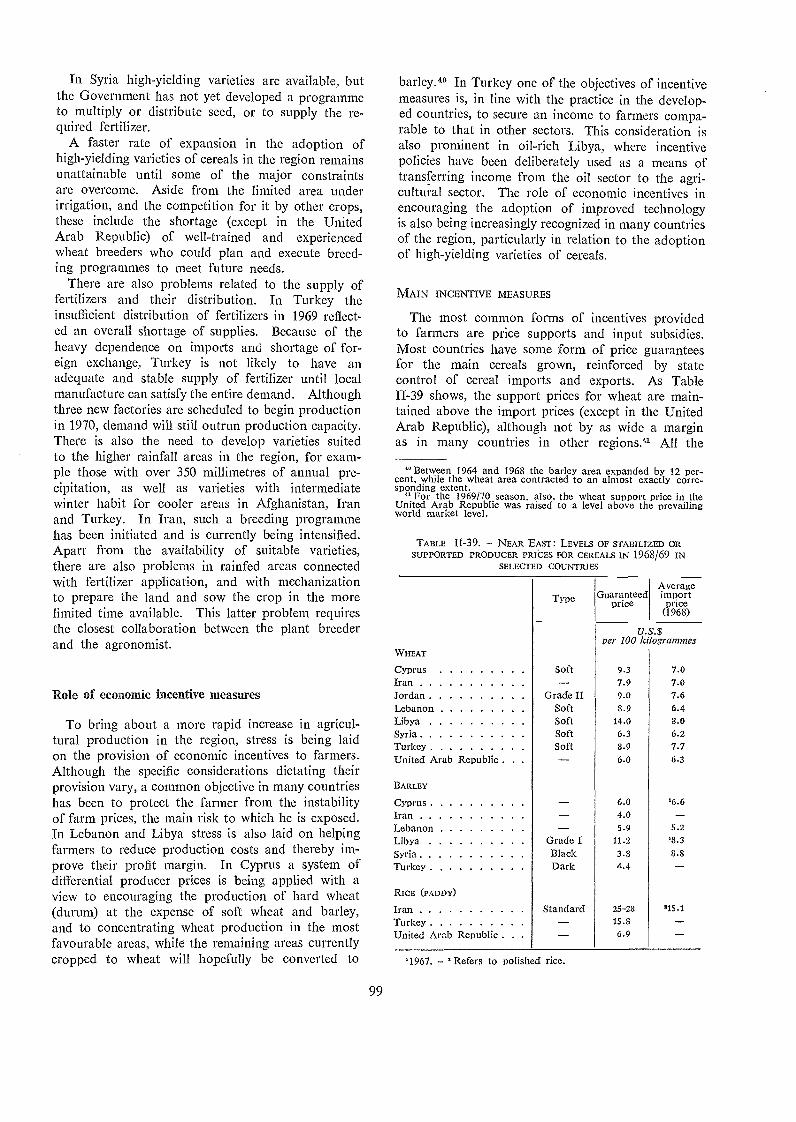
In Syria high-yielding varieties are available, butthe Government has not yet developed a programmeto multiply or distribute seed, or to supply the re-quired fertilizer.
A faster rate of expansion in the adoption ofhigh-yielding varieties of cereals in the region remainsunattainable until some of the major constraintsare overcome. Aside from the limited area underirrigation, and the competition for it by other crops,these include the shortage (except in the UnitedArab Republic) of well-trained and experiencedwheat breeders who could plan and execute breed-ing programmes to meet future needs.
There are also problems related to the supply offertilizers and their distribution. In Turkey theinsufficient distribution of fertilizers in 1969 reflect-ed an overall shortage of supplies. Because of theheavy dependence on imports and shortage of for-eign exchange, Turkey is not likely to have anadequate and stable supply of fertilizer until localmanufacture can satisfy the entire demand. Althoughthree new factories are scheduled to begin productionin 1970, demand will still outrun production capacity.There is also the need to develop varieties suitedto the higher rainfall areas in the region, for exam-ple those with over 350 millimetres of annual pre-cipitation, as well as varieties with intermediatewinter habit for cooler areas in Afghanistan, Iranand Turkey. In Iran, such a breeding programmehas been initiated and is currently being intensified.Apart from the availability of suitable varieties,there are also problems in rainfed areas connectedwith fertilizer application, and with mechanizationto prepare the land and sow the crop in the morelimited time available. This latter problem requiresthe closest collaboration between the plant breederand the agronomist.
Role of economic incentive measures
To bring about a more rapid increase in agricul-tural production in the region, stress is being laidon the provision of economic incentives to farmers.Although the specific considerations dictating theirprovision vary, a common objective in many countrieshas been to protect the farmer from the instabilityof farm prices, the main risk to which he is exposed.In Lebanon and Libya stress is also laid on helpingfarmers to reduce production costs and thereby im-prove their profit margin. In Cyprus a system ofdifferential producer prices is being applied with aview to encouraging the production of hard wheat(durum) at the expense of soft wheat artd barley,and to concentrating wheat production in the mostfavourable areas, while the remaining areas currentlycropped to wheat will hopefully be converted to
99
barley." In Turkey one of the objectives of incentivemeasures is, in line with the practice in the develop-ed countries, to secure an income to farmers compa-rable to that in other sectors. This consideration isalso prominent in oil-rich Libya, where incentivepolicies have been deliberately used as a means oftransferring income from the oil sector to the agri-cultural sector. The role of economic incentives inencouraging the adoption of improved technologyis also being increasingly recognized in many countriesof the region, particularly in relation to the adoptionof high-yielding varieties of cereals.
MAIN INCENTIVE MEASURES
The most common forms of incentives providedto farmers are price supports and input subsidies.Most countries have some form of price guaranteesfor the main cereals grown, reinforced by statecontrol of cereal imports and exports. As TableII-39 shows, the support prices for wheat are main-tained above the import prices (except in the UnitedArab Republic), although not by as wide a marginas in many countries in other regions:a All the
"Between 1964 and 1968 the barley area expanded by 12 per-cent, while the wheat area contracted to an almost exactly corre-sponding extent.
" For the 1969/70 season, also, the wheat support price in theUnited Arab Republic was raised to a level above the prevailingworld market level.
TABLE 11-39. - NEAR EAST: LEVELS OF STABILIZED ORSUPPORTED PRODUCER PRICES FOR CEREALS IN 1968/69 IN
SELECTED COUNTRIES
'1967. - Refers to polished rice.
TYPe Guaranteedprice
Averageimportprice
(1968)
U.S.$per 100 kilo grammes
WHEAT
Cyprus Soft 9.3 7.0Iran - 7.9 7.0Jordan Grade II 9.0 7.6Lebanon Soft 8.9 6.4Libya Soft 14.0 8.0Syria Soft 6.3 6.2Turkey Soft 8.9 7.7United Arab Republic 6.0 6.3
BARLEY
Cyprus 6.0 '6.6Iran 4.0 --Lebanon 5.9 5.2
Libya Grade I 11.2 '8.3Syria Black 3.8 8.8
Turkey Dark 4.4
RICE (PADDY)
Iran Standard 25-28 '15.1
Turkey 15.8
United Arab Republic . . . 6.9

countries (except Syria in years of good crops) havebeen importers to a greater or lesser extent, and theprincipal purpose of keeping support prices relativelyhigh is that of expanding domestic production. Inthe United Arab Republic the policy has been toensure a price which, while remunerative to theproducer, is reasonable to the consumer as well;price supports for wheat are therefore accompaniedby regulations which require that at least 40 percentof the land be put under wheat. In Libya, forreasons mentioned above, a very high level of supportprice is combined with subsidies on consumer prices.
The guaranteed prices for barley are on the wholemore in line with the international market prices,except in Libya and to a lesser extent in Lebanon.Turkey has ceased to be an importer since 1955,and Iran since 1966. The generally low supportprices reflect a policy of encouraging the use ofbarley as livestock feed.
Other important crops for which guaranteed priceshave been established in some countries of the re-gion are sugar beet (Iran, Lebanon and Turkey)and cotton (Afghanistan, Syria, Turkey and the UnitedArab Republic). For sugar beet, the practice hasgenerally been to fix the price the factories have topay to the producer. With regard to cotton, themain export crop of the region, the scope for priceintervention by governments is limited by the needto maintain a competitive position in world markets.The naain objective is therefore the seasonal stabiliza-tion of prices.
Since the prices of purchased inputs in the regionare generally high relative to the more developedcountries and in relation to farm product prices,their use, particularly of fertilizers and improvedseeds, is subsidized in some countries. Thus, theCereals Office in Lebanon distributes certified wheatand hybrid maize seeds at low prices. Fertilizerprices have been lowered and made uniform through-out Syria, and in Iraq the price of ammoniumsulphate has been reduced by as much as 30 percent.In line with the policy emphasis already described,Libya operates a particularly comprehensive pro-gramme of input subsidies, with most purchasedinputs made available at prices reduced by 50 or25 percent, and with subsidies offered also to meeta substantial part of the cost of connexion of farmswith electric power supplies, the drilling of wellsand construction of water reservoirs.
Input subsidies, however, llave not generally beenfavoured to the same extent as price supports, bothbecause of the burden they impose on the nationalbudget and because experience shows that they aredifficult to abolish or reduce even after the use ofthe inputs has become widespread.
In addition to state control over imports of cereals,tariffs and other trade policies are used in some
100
countries to supplement input subsidies and as directprice supports of some other commodities. Thus inLebanon restrictions are imposed on imports ofcertain products, including olives, potatoes, onionsand skim milk, to protect local producers, while agri-cultural inputs such as farm machinery, insecticidesand pesticides, selected and certified seeds, and feedhave been exempt from import duties.
EFFECTIVENESS OF INCENTIVE MEASURES
It is difficult to assess the effectiveness of incentivemeasures at the farm level. Judging by the increaseduse of such inputs as fertilizers, improved seeds andfarm machinery in many countries of the region,however, the farmers' response has been generallyfavourable. Fertilizer consumption in Libya hasmore than doubled since subsidies were introduced in1966; the lowering of fertilizer prices in Syria result-ed in a 30 percent expansion of consumption between1968 and 1969, although the extension service alsoplayed an important role in this. The same is trueabout fran where, under the impact programme forwheat discussed above, the distribution of high-yielding varieties of wheat seeds at low prices waspart of an input package including credit and ex-tension services.
Implementation of price guarantees for basic foodshas generally been found to be more difficult thanfor commercial crops such as cotton and sugar beet.While the commercial crops are produced in well-defined areas and by a limited number of farmers,a large proportion of cereal farmers live too farfrom official purchasing points to take advantage ofthe guaranteed price. The principal exception in theregion is the -United Arab Republic, where there isa network of cooperative societies, where a fixedquota of wheat has to be delivered to the Govern-ment and where the Government is the sole buyerof rice. Insufficient storage facilities also often limitthe effectiveness of price supports. This is a majorproblem in grain price stabilization in Syria, especiallyin the high-producing Gezira area.
Trade in agricultural, fishery and forest products
The value of agricultural exports from the develop-ing countries of the Near East increased only slightlyin 1969 over the level of the previous year, whenthey had risen by 5 percent (Table II-40). Thevolume of shipments fell by 2 percent, reflectingreduced exports of all major commodities except rice,which maintained the steady upward trend of recentyears. There was a substantial rise in the prices ofsome commodities, notably cotton and citrus fruit,but only for the latter were earnings higher. The ex-
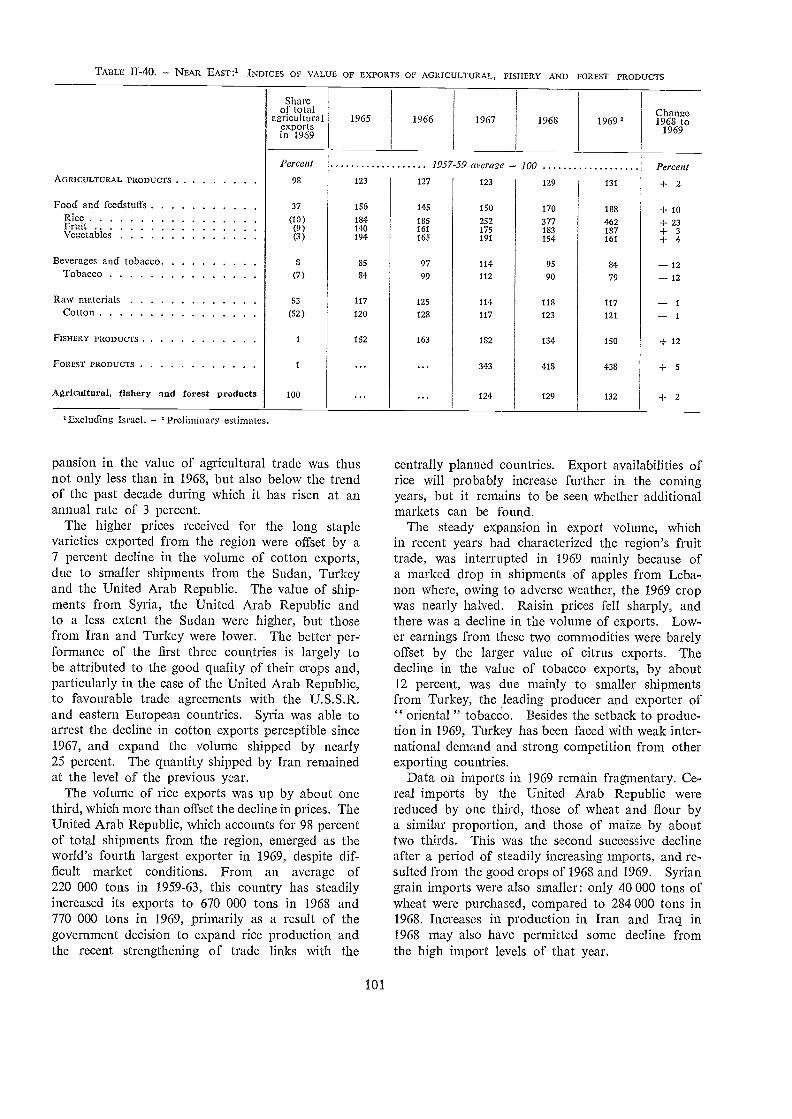
TABLE II-40. - NEAR EAST:1 INDICES OF VALUE OF EXPORTS OF AGRICULTURAL, FISHERY AND FOREST PRODUCTS
pansion in the value of agricultural trade was thusnot only less than in 1968, but also below the trendof the past decade during which it has risen at anannual rate of 3 percent.
The higher prices received for the long staplevarieties exported from the region were offset by a7 percent decline in the volume of cotton exports,due to smaller shipments from the Sudan, Turkeyand the United Arab Republic. The value of ship-ments from Syria, the United Arab Republic andto a less extent the Sudan were higher, but thosefrom Iran and Turkey were lower. The better per-formance of the first three countries is largely tobe attributed to the good quality of their crops and,particularly in the case of the United Arab Republic,to favourable trade agreements with the U.S.S.R.and eastern European countries. Syria was able toarrest the decline in cotton exports perceptible since1967, and expand the volume shipped by nearly25 percent. The quantity shipped by Iran remainedat the level of the previous year.
The volume of rice exports was up by about onethird, which more than offset the decline in prices. TheUnited Arab Republic, which accounts for 98 percentof total shipments from the region, emerged as theworld's fourth largest exporter in 1969, despite dif-ficult market conditions. From an average of220 000 tons in 1959-63, this country has steadilyincreased its exports to 670 000 tons in 1968 and770 000 tons in 1969, primarily as a result of thegovernment decision to expand rice production andthe recent strengthening of trade links with the
101
centrally planned countries. Export availabilities ofrice will probably increase further in the comingyears, but it remains to be seen whether additionalmarkets can be found.
The steady expansion in export volume, whichin recent years had characterized the region's fruittrade, was interrupted in 1969 mainly because ofa marked drop in shipments of apples from Leba-non where, owing to adverse weather, the 1969 cropwas nearly halved. Raisin prices fell sharply, andthere was a decline in the volume of exports. Low-er earnings from these two commodities were barelyoffset by the larger value of citrus exports. Thedecline in the value of tobacco exports, by about12 percent, was due mainly to smaller shipmentsfrom Turkey, the leading producer and exporter of" oriental " tobacCo. Besides the setback to produc-tion in 1969, Turkey has been faced with weak inter-national demand and strong competition from otherexporting countries.
Data on imports in 1969 remain fragmentary. Ce-real imports by the United Arab Republic werereduced by one third, those of wheat and flour bya similar proportion, and those of maize by abouttwo thirds. This was the second successive declineafter a period of steadily increasing imports, and re-sulted from the good crops of 1968 and 1969. Syriangrain imports were also smaller: only 40 000 tons ofwheat were purchased, compared to 284 000 tons in1968. Increases in production in Iran and Iraq in1968 may also have permitted some decline fromthe high import levels of that year.
Shareof total
agriculturalexportsin 1969
1965 1966 1967 1968 1969'Change1968 to
1969
Percent 1957-59 average 100 PercentAGRICULTURAL PRODUCTS . 98 123 127 123 129 131 + 2
Food and feedstuffs 37 156 145 150 170 188 + 10RiceFruitVegetables
(10)(9)(3)
184140194
185161165
252175191
377183154
462187161
-I- 23+ 3+ 4
Beverages and tobacco 8 85 97 114 95 84 12Tobacco (7) 84 99 112 90 79 12
Raw materials 53 117 125 114 118 117 1
Cotton (52) 120 128 117 123 121 1
FISHERY PRODUCTS 1 152 163 182 134 150 + 12
FoREST PRODUCTS 1 343 418 438 + 5
Agricultural, fishery and forest products 100 124 129 132 + 2
'Excluding Israel. 'Preliminary estimates.
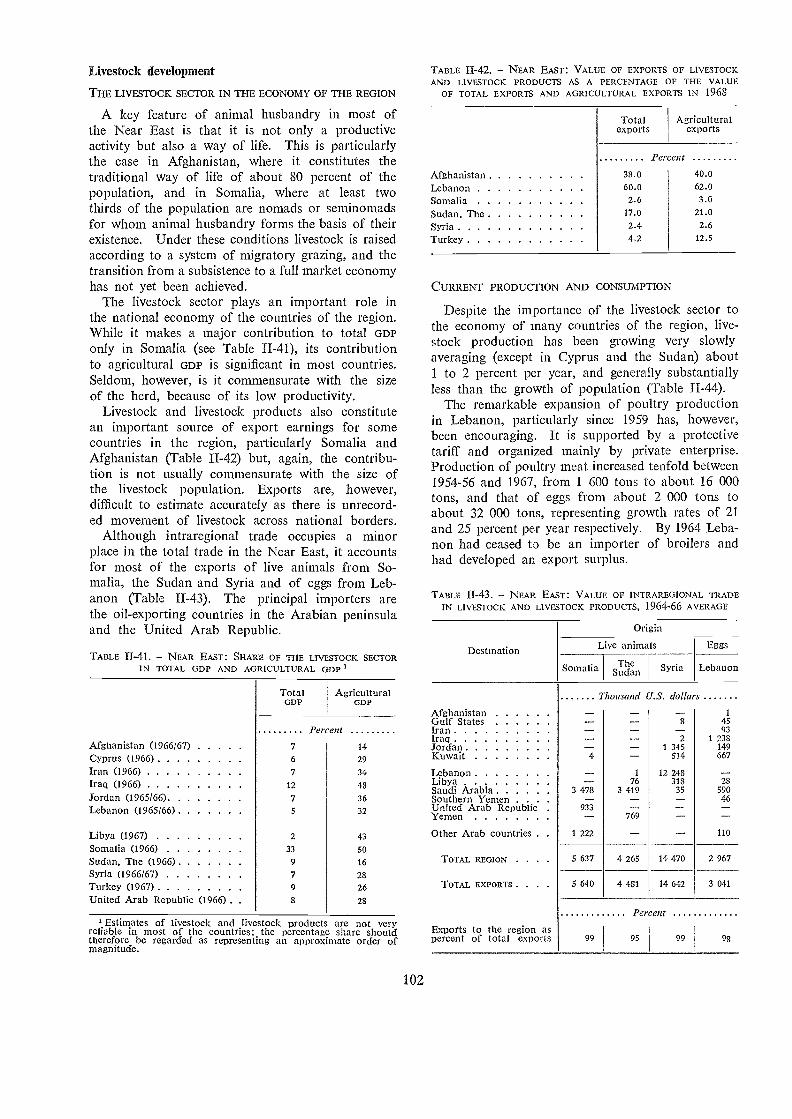
Livestock development
THE LIVESTOCK SECTOR IN THE ECONOMY OF THE REGION
A key feature of animal husbandry in most ofthe Near East is that it is not only a productiveactivity but also a way of life. This is particularlythe case in Afghanistan, where it constitutes thetraditional way of life of about 80 percent of thepopulation, and in Somalia, where at least twothirds of the population are nomads or seminomadsfor whom animal husbandry forms the basis of theirexistence. Under these conditions livestock is raisedaccording to a system of migratory grazing, and thetransition from a subsistence to a full market economyhas not yet been achieved.
The livestock sector plays an important role inthe national economy of the countries of the region.While it makes a major contribution to total GDPonly in Somalia (see Table II-41), its contributionto agricultural GDP is significant in most countries.Seldom, however, is it commensurate with the sizeof the herd, because of its low productivity.
Livestock and livestock products also constitutean important source of export earnings for somecountries in the region, particularly Somalia andAfghanistan (Table II-42) but, again, the contribu-tion is not usually commensurate with the size ofthe livestock population. Exports are, however,difficult to estimate accurately as there is umecord-ed movement of livestock across national borders.
Although intraregional trade occupies a minorplace in the total trade in the Near East, it accountsfor most of the exports of live animals from So-malia, the Sudan and Syria and of eggs from Leb-anon (Table II-43). The principal importers arethe oil-exporting countries in the Arabian peninsulaand the United Arab Republic.
TABLE 11-41. - NEAR EAST: SIIARE OF THE LIVESTOCK SECTORIN TOTAL GDP ANO AGRICULTURAL GDP '
Estimates of livestock and livestock products are not veryreliable in most of the countries; the percentage share shouldtherefore be regarded as representing an approximate order ofmagnitude.
102
TABLE II-42. - NEAR EAST: VALUE OF EXPORTS OF LIVESTOCKAND LIVESTOCK PRODUCTS AS A PERCENTAGE OF THE VALUE
OF TOTAL EXPORTS AND AGRICULTURAL EXPORTS IN 1968
Destination
AfghanistanGulf StatesIranIraqJordanKuwait
LebanonLibyaSaudi ArabiaSouthern Yemen .United Arab RepublicYemen
Other Arab countries .
TOTAL REGION . . . .
TOTAL EXPORTS . . .
Exports to the region aspercent of total exports
Somalia
5 637
5 640
CURRENT PRODUCTION AND CONSUMPTION
Despite the importance of the livestock sector tothe economy of many countries of the region, live-stock production has been growing very slowlyaveraging (except in Cyprus and the Sudan) about1 to 2 percent per year, and generally substantiallyless than the growth of population (Table II-44).
The remarkable expansion of poultry productionin Lebanon, particularly since 1959 has, however,been encouraging. It is supported by a protectivetariff and organized mainly by private enterprise.Production of poultry meat increased tenfold between1954-56 and 1967, from 1 600 tons to about 16 000tons, and that of eggs from about 2 000 tons toabout 32 000 tons, representing growth rates of 21and 25 percent per year respectively. By 1964 Leba-non had ceased to be an importer of broilers andhad developed an export surplus.
TABLE II-43. - NEAR EAST: VALUE OF INTI2AREGTONAL TRADEIN LIVESTOCK AND LIVESTOCK PRODUCTS, 1964-66 AVERAGE
TheSudan
Origin
Thousand U.S. dollars
763 419
769
4 265
4 481
Syria
14 470
14 642
Lebanon
2 967
3 041
Percent
TotalGDP
AgriculturalGDP
Per entAfghanistan (1966/67) 7 14
Cyprus (1966) 6 29
Iran (1966) 7 34
Iraq (1966) 12 48
Jordan (1965/66) 7 36
Lebanon (1965/66) 32
Libya (1967) 2 43
Somalia (1966) 33 50
Sudan. The (1966) 9 16
Syria (1966/67) 7 28Turkey (1967) 9 26
United Arab Republic (1966) . . 8 28
Percent
Afghanistan 38.0 40.0
Lebanon 60.0 62.0
Somalia 2.6 3.0
Sudan. The 17.0 21.0
Syria 2.4 2.6
Turkey 4.2 12.5
Total Agriculturalexports exports
Live animals Eggs
99 95 99 98
1,-
4
3 478
933
1 222
8
21 345
514
12 24831835
-^
1
4593
1 238149667
2859046
110
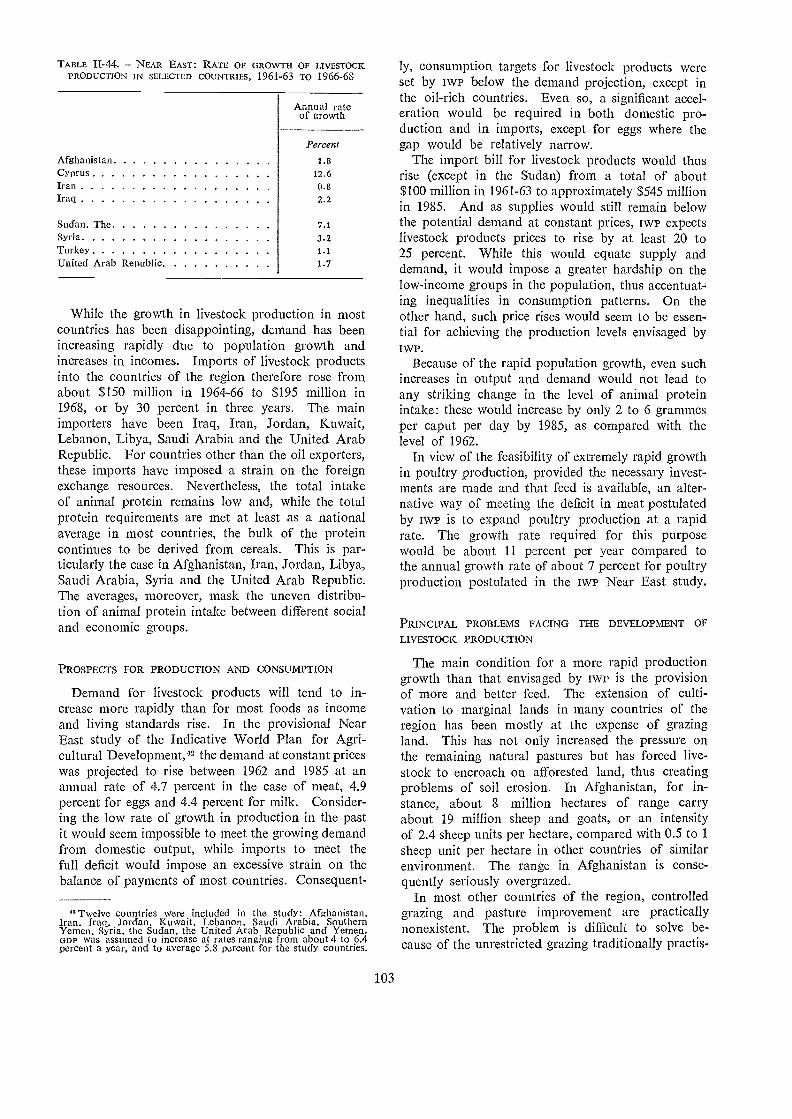
TABLE II-44. NEAR EAST: RATE OF GROWTH OF LIVESTOCKPRODUCTION IN SELECTED COUNTRIES, 1961-63 TO 1966-63
While the growth in livestock production in mostcountries has been disappointing, demand has beenincreasing rapidly due to population growth andincreases in incomes. Imports of livestock productsinto the countries of the region therefore rose fromabout $150 million in 1964-66 to $195 million in1968, or by 30 percent in three years. The mainimporters have been Iraq, Iran, Jordan, Kuwait,Lebanon, Libya, Saudi Arabia and the United ArabRepublic. For countries other than the oil exporters,these imports have imposed a strain on the foreignexchange resources. Nevertheless, the total intakeof animal protein remains low and, while the totalprotein requirements are met at least as a nationalaverage in most countries, the bulk of the proteincontinues to be derived from cereals. This is par-ticularly the case in Afghanistan, Iran, Jordan, Libya,Saudi Arabia, Syria and the United Arab Republic.The averages, moreover, mask the uneven distribu-tion of animal protein intake between different socialand economic groups.
PROSPECTS FOR PRODUCTION AND CONSUMPTION
Demand for livestock products will tend to in-crease more rapidly than for most foods as incomeand living standards rise. In the provisional NearEast study of the Indicative World Plan for Agri-cultural Development,42 the demand at constant priceswas projected to rise between 1962 and 1985 at anannual rate of 4.7 percent in the case of meat, 4.9percent for eggs and 4.4 percent for rnilk. Consider-ing the low rate of growth in production in the pastit would seem impossible to meet the growing demandfrom domestic output, while imports to meet thefull deficit would impose an excessive strain on thebalance of payments of most countries. Consequent-
"Twelve countries were included in the study: Afghanistan.Iran, Iraq, Jordan. Kuwait, Lebanon, Saudi Arabia, SouthernYemen, Syria, the Sudan. the United Arab Republic and Yemen.GDP was assumed to increase at rates ranging from about 4 to 6.4percent a year, and to average 5.8 percent for the study countries.
103
ly, consumption targets for livestock products wereset by IWP below the demand projection, except inthe oil-rich countries. Even so, a significant accel-eration would be required in both domestic pro-duction and in imports, except for eggs where thegap would be relatively narrow.
The import bill for livestock products would thusrise (except in the Sudan) from a total of about$100 million in 1961-63 to approximately $545 millionin 1985. And as supplies would still remain belowthe potential demand at constant prices, IWP expectslivestock products prices to rise by at least 20 to25 percent. While this would equate supply anddemand, it would impose a greater hardship on thelow-income groups in the population, thus accentuat-ing inequalities in consumption patterns. On theother hand, such price rises would seem to be essen-tial for achieving the production levels envisaged byIWP.
Because of the rapid population growth, even suchincreases in output and demand would not lead toany striking change in the level of animal proteinintake: these would increase by only 2 to 6 grammesper caput per day by 1985, as compared with thelevel of 1962.
In view of the feasibility of extremely rapid growthin poultry production, provided the necessary invest-ments are made and that feed is available, an alter-native way of meeting the deficit in meat postulatedby Iva, is to expand poultry production at a rapidrate. The growth rate required for this purposewould be about 11 percent per year compared tothe annual growth rate of about 7 percent for poultryproduction postulated in the iwr Near East study.
PRINCIPAL PROBLEMS FACING THE DEVELOPMENT OFLIVESTOCK PRODUCTION
The main condition for a more rapid productiongrowth than that envisaged by twn is the provisionof more and better feed. The extension of culti-vation to marginal lands in many countries of theregion has been mostly at the expense of grazingland. This has not only increased the pressure onthe remaining natural pastures but has forced live-stock to encroach on afforested land, thus creatingproblems of soil erosion. In Afghanistan, for in-stance, about 8 million hectares of range carryabout 19 million sheep and goats, or an intensityof 2.4 sheep units per hectare, compared with 0.5 to 1sheep unit per hectare in other countries of similarenvironment. The range in Afghanistan is conse-quently seriously overgrazed.
In most other countries of the region, controlledgrazing and pasture improvement are practicallynonexistent. The problem is difficult to solve be-cause of the unrestricted grazing traditionally practis-
Annual rateof growth
Percent
Afghanistan 1.8Cyprus 12.6Iran 0.8Iraq 2.2
Sudan. The 7.1Syria 3.2Turkey 1.1
United Arab Republic 1.7
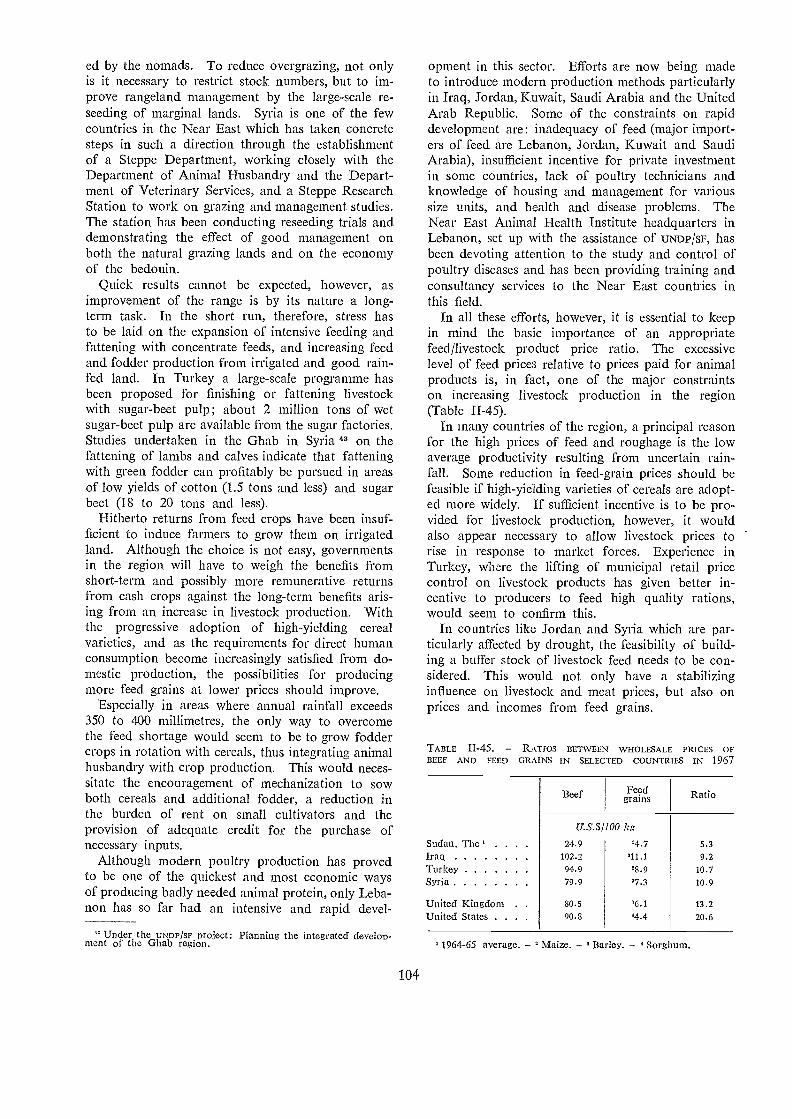
ed by the nomads. To reduce overgrazing, not onlyis it necessary to restrict stock numbers, but to im-prove rangeland management by the large-scale re-seeding of marginal lands. Syria is one of the fewcountries in the Near East which has taken concretesteps in such a direction through the establishmentof a Steppe Department, working closely with theDepartment of Animal Husbandry and the Depart-ment of Veterinary Services, and a Steppe ResearchStation to work on grazing and management studies.The station has been conducting reseeding trials anddemonstrating the effect of good management onboth the natural grazing lands and on the economyof the bedouin.
Quick results cannot be expected, however, asimprovement of the range is by its nature a long-term task. In the short run, therefore, stress hasto be laid on the expansion of intensive feeding andfattening with concentrate feeds, and increasing feedand fodder production from irrigated and good rain-fed land. In Turkey a large-scale programme hasbeen proposed for finishing or fattening livestockwith sugar-beet pulp; about 2 million tons of wetsugar-beet pulp are available from the sugar factories.Studies undertaken in the Ghab in Syria 43 on thefattening of lambs and calves indicate that fatteningwith green fodder can profitably be pursued in areasof low yields of cotton (1.5 tons and less) and sugarbeet (18 to 20 tons and less).
Hitherto returns from feed crops have been insuf-ficient to induce farmers to grow them on irrigatedland. Although the choice is not easy, governmentsin the region will have to weigh the benefits fromshort-term and possibly more remunerative returnsfrom cash crops against the long-tenn benefits aris-ing from an increase in livestock production. Withthe progressive adoption of high-yielding cerealvarieties, and as the requirements for direct humanconsumption become increasingly satisfied from do-mestic production, the possibilities for producingmore feed grains at lower prices should improve.
Especially in areas where annual rainfall exceeds350 to 400 millimetres, the only way to overcomethe feed shortage would seem to be to grow foddercrops in rotation with cereals, thus integrating animalhusbandry with crop production. This would neces-sitate the encouragement of mechanization to sowboth cereals and additional fodder, a reduction inthe burden of rent on small cultivators and theprovision of adequate credit for the purchase ofnecessary inputs.
Although modern poultry production has provedto be one of the quickest and most economic waysof producing badly needed animal protein, only Leba-non has so far had an intensive and rapid devel-
"Under the UNDP/SF project: Planning the integrated develoP-ment of the Ghab region.
104
opment in this sector. Efforts are now being madeto introduce modern production methods particularlyin Iraq, Jordan, Kuwait, Saudi Arabia and the UnitedArab Republic. Some of the constraints on rapiddevelopment are: inadequacy of feed (major import-ers of feed are Lebanon, Jordan, Kuwait and SaudiArabia), insufficient incentive for private investmentin some countries, lack of poultry technicians andknowledge of housing and management for varioussize units, and health and disease problems. TheNear East Animal FIealth Institute headquarters inLebanon, set up with the assistance of UNDP/SF, hasbeen devoting attention to the study and control ofpoultry diseases and has been providing training andconsultancy services to the Near East countries inthis field.
In all these efforts, however, it is essential to keepin mind the basic importance of an appropriatefeed/livestock product price ratio. The excessivelevel of feed prices relative to prices paid for animalproducts is, in fact, one of the major constraintson increasing livestock production in the region(Table II-45).
In many countries of the region, a principal reasonfor the high prices of feed and roughage is the lowaverage productivity resulting from uncertain rain-fall. Some reduction in feed-grain prices should befeasible if high-yielding varieties of cereals are adopt-ed more widely. If sufficient incentive is to be pro-vided for livestock production, however, it wouldalso appear necessary to allow livestock prices to -
rise in response to market forces. Experience inTurkey, where the lifting of municipal retail pricecontrol on livestock products has given better in-centive to producers to feed high quality rations,would seem to confirm this.
In countries like Jordan and Syria which are par-ticularly affected by drought, the feasibility of build-ing a buffer stock of livestock feed needs to be con-sidered. This would not only have a stabilizinginfluence on livestock and meat prices, but also onprices and incomes from feed grains.
TABLE 11-45. - RATIOS BETWEEN WHOLESALE PRICES OF
BEEF AND FEED GRAINS IN SELECTED COUNTRIES IN 1967
'1964-65 average. Maize. Barley. ' Sorghum.
Beef Fee dgrains Ratio
U.S.$/100 kg
Sudan. The 24.9 '4.7 5.3Iraq 102.2 011.1 9.2Turkey 94.9 28.9 10.7
Syria 79.9 07.3 10.9
United Kingdom . 80.5 '6.1 13.2
United States . . . 90.8 44.4 20.6
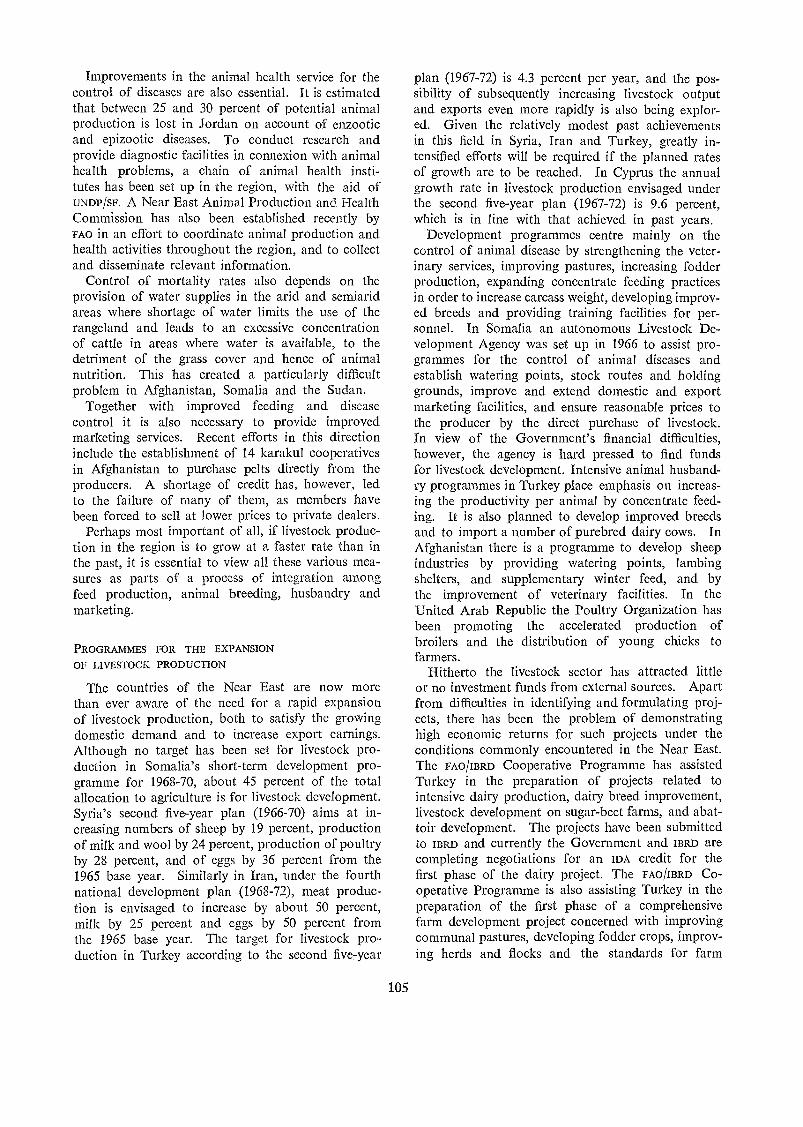
Improvements in the animal health service for thecontrol of diseases are also essential. It is estimatedthat between 25 and 30 percent of potential animalproduction is lost in Jordan on account of enzooticand epizootic diseases. To conduct research andprovide diagnostic facilities in connexion with animalhealth problems, a chain of animal health insti-tutes has been set up in the region, with the aid ofUNDP/SF. A Near East Animal Production and HealthCommission has also been established recently byFAO in an effort to coordinate animal production andhealth activities throughout the region, and to collectand disseminate relevant information.
Control of mortality rates also depends on theprovision of water supplies in the arid and semiaridareas where shortage of water limits the use of therangeland and leads to an excessive concentrationof cattle in areas where water is available, to thedetriment of the grass cover and hence of animalnutrition. This has created a particularly difficultproblem in Afghanistan, Somalia and the Sudan.
Together with improved feeding and diseasecontrol it is also necessary to provide improvedmarketing services. Recent efforts in this directioninclude the establishment of 14 karakul cooperativesin Afghanistan to purchase pelts directly from theproducers. A shortage of credit has, however, ledto the failure of many of them, as members havebeen forced to sell at lower prices to private dealers.
Perhaps most important of all, if livestock produc-tion in the region is to grow at a faster rate than inthe past, it is essential to view all these various mea-sures as parts of a process of integration amongfeed production, animal breeding, husbandry andmarketing.
PROGRAMMES FOR THE EXPANSION
OF LIVESTOCK PRODUCTION
The countries of the Near East are now morethan ever aware of the need for a rapid expansionof livestock production, both to satisfy the growingdomestic demand and to increase export earnings.Although no target has been set for livestock pro-duction in Somalia's short-term development pro-gramme for 1968-70, about 45 percent of the totalallocation to agriculture is for livestock development.Syria's second five-year plan (1966-70) aims at in-creasing numbers of sheep by 19 percent, productionof milk and wool by 24 percent, production of poultryby 28 percent, and of eggs by 36 percent from the1965 base year. Similarly in Iran, under the fourthnational development plan (1968-72), meat produc-tion is envisaged to increase by about 50 percent,milk by 25 percent and eggs by 50 percent fromthe 1965 base year. The target for livestock pro-duction in Turkey according to the second five-year
105
plan (1967-72) is 4.3 percent per year, and thc pos-sibility of subsequently increasing livestock outputand exports even more rapidly is also being explor-ed. Given the relatively modest past achievementsin this field in Syria, Iran and Turkey, greatly in-tensified efforts will be required if the planned ratesof growth are to be reached. In Cyprus the annualgrowth rate in livestock production envisaged underthe second five-year plan (1967-72) is 9.6 percent,which is in line with that achieved in past years.
Development programmes centre mainly on thecontrol of animal disease by strengthening the veter-inary services, improving pastures, increasing fodderproduction, expanding concentrate feeding practicesin order to increase carcass weight, developing improv-ed breeds and providing training facilities for per-sonad. In Somalia an autonomous Livestock De-velopment Agency was set up in 1966 to assist pro-grammes for the control of animal diseases andestablish watering points, stock routes and holdinggrounds, improve and extend domestic and exportmarketing facilities, and ensure reasonable prices tothe producer by the direct purchase of livestock.In view of the Government's financial difficulties,however, the agency is hard pressed to find fundsfor livestock development. Intensive animal husband-ry programmes in Turkey place emphasis on increas-ing the productivity per animal by concentrate feed-ing. It is also planned to develop improved breedsand to import a number of purebred dairy cows. InAfghanistan there is a programme to develop sheepindustries by providing watering points, lambingshelters, and supplementary winter feed, and bythe improvement of veterinary facilities. In the-United Arab Republic the Poultry Organization hasbeen promoting the accelerated production ofbroilers and the distribution of young chicks tofarmers.
Hitherto the livestock sector has attracted littleor no investment funds from external sources. Apartfrom difficulties in identifying and formulating proj-ects, there has been the problem of demonstratinghigh economic returns for such projects under theconditions commonly encountered in the Near East.The FAO/IBRD Cooperative Programme has assistedTurkey in the preparation of projects related tointensive dairy production, dairy breed improvement,livestock development on sugar-beet farms, and abat-toir development. The projects have been submittedto IBRD and currently the Government and IBRD arecompleting negotiations for an IDA credit for thefirst phase of the dairy project. The FAO/IBRD Co-operative Programme is also assisting Turkey in thepreparation of the first phase of a comprehensivefarm development project concerned with improvingcommunal pastures, developing fodder crops, improv-ing herds and flocks and the standards for farm
buildings, and improving infrastructure facilities suchas roads and markets. The Agricultural Develop-ment Fund of Iran has been granted an IBRD loanof $6.5 million, the bulk of which is to be used forlivestock development.
Livestock development has also been greatly as-sisted by the United Nations Development Programme(uNDP), including the Special Fund, and the WorldFood Programme. By end-1969 UNDP had contributedabout $13 million for pasture and livestock develop-ment through 16 Special Fund projects in the region.This is the largest contribution to any regionexcept Latin America.
The projects deal with various facets of animalproduction, such as pasture and fodder crops; animalhusbandry and animal health; education, researchand training; livestock marketing; and the utilizationof hides and skins. There is also a comprehensiveprogramme for research into animal diseases, vaccineproduction, personnel training, and the repair andmaintenance of equipment, which is under the aegisof the Near East Animal Health Institutes' Coor-dinating Unit located in Beirut.
World Food Programme aid to Near East countriesin the fields of animal production and dairy develop-ment has been substantial; as of January 1970, itamounted to about $62 million. Assistance in theform of feed (barley, oats and maize) has been sup-plied to enable the bedouin to cooperate with theirgovernment in renewing natural pastures, fatteninglivestock and reducing mortality in times of drought,developing and expanding the feed industry, and im-proving conditions in the livestock industry as awhole.
According to the findings of a mission sent toevaluate wFP-assisted bedouin settlement and nomad-ic livestock development projects in the Near East,the results of WFP assistance toward the stabilizationand improvement of livestock and range manage-ment have not come up to expectations." More ef-fective use has been made of WFP food aid for bed-ouin settlement schemes because specific work pro-grammes such as land and water development andconservation works have been identified and execut-ed easily, whereas livestock and pasture improvementschemes, being spread over vast areas of rangeland,have been difficult to implement. The evaluationmission also pointed out that, by reducing livestockmortality during years of drought, WFP aid has ledto increases in stock numbers, thereby contributingto the problem of overgrazing, for example in thenorthwest coastal area of the United Arab Republic.The mission has therefore stressed the need for devis-ing a marketing system for the offtake of livestockfrom range.
" Submitted to the sixteenth session of the IntergovernmentalCommittee of the Word Food Programme in October 1969.
106
The findings of the evaluation mission thus em-phasize the difficulty of providing a solution to thefundamental problem of limiting stock numbers tothe carrying capacity of the range. This is in factthe crux of the problem of livestock development.Measures which are not geared in this directioncannot provide a final solution to the problems ofthe arid and semarid areas of the region, and thepeople who inhabit them.
Development planning
In 1970 new plans are being initiated by Iraq,Israel, Saudi Arabia, the Sudan and the UnitedArab Republic (Table H-46). Under Iraq's five-year development plan (1970-74) total expenditurewill amount to 1 144 million dinars, 40 percentabove the total planned investment in the previousplan. Oil revenues will finance about 80 percent ofgovernment expenditures, and foreign loans about11 percent. The share of agriculture in total publicinvestment will remain approximately the same asin the previous plan. Of the investment in thissector, 42 percent is destined for irrigation anddrainage projects, 22 percent for agricultural services,15 percent for water storage, 13 percent for agri-cultural production, 5.5 percent for agricultural mar-keting and 2.5 percent for underground water proj-ects. The envisaged annual rate of growth of grossnational product (7.1 percent) falls between the 8 per-cent growth targeted for 1965-69 and the 5 per-cent actually achieved. The target for the agricul-tural sector has been set at 7 percent, comparedwith 7.5 percent under the previous plan and the4.5 percent achieved. Actual outlays during the period1965-69 have averaged 55 percent of programmeddevelopment expenditures for the economy as awhole, and 32 percent of that in the agriculturalsector. The speeding up of growth toward the ratesnow targeted for 1970-75 will require a substantialacceleration in project implementation.
A new section for economic studies an.d planninghas been established in the Agricultural Division ofthe Ministry of Planning. This section will be incharge of project appraisal and studies relevant toland reclamation, farm management, mechanization,and foreign trade in agricultural commodities.
Israel's new development plan (1971-75) providesfor a gross investment of 1£ 24 000 million. About40 percent of this total investment will be financedby domestic savings, and the remainder by externalaid. Exports are expected to expand at a rate of14 percent per year, whereas imports will increaseby only 7.9 percent. Interest payments on theexternal debt will rise at a rate of 4.8 percentyearly.
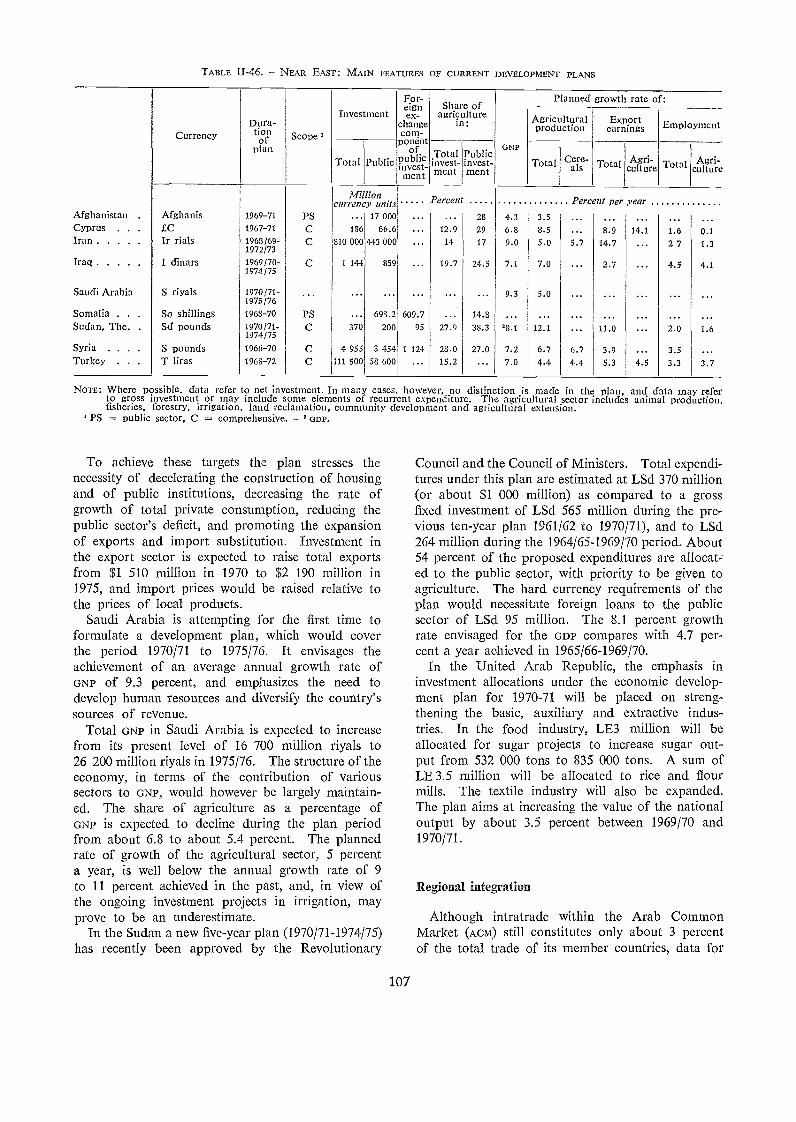
TABLE II-46. - NEAR EAST: IVIAIN FEATURES OF CURRENT DEVELOpMENT PLANs
To achieve these targets the plan stresses thenecessity of decelerating the construction of housingand of public institutions, decreasing the rate ofgrowth of total private consumption, reducing thepublic sector's deficit, and promoting the expansionof exports and import substitution. Investment inthe export sector is expected to raise total exportsfrom $1 510 million in 1970 to $2 190 million in1975, and import prices would be raised relative tothe prices of local products.
Saudi Arabia is attempting for the first time toformulate a development plan, which would coverthe period 1970/71 to 1975/76. It envisages theachievement of an average annual growth rate ofGNP of 9.3 percent, and emphasizes the need todevelop human resources and diversify the country'ssources of revenue.
Total GNP in Saudi Arabia is expected to increasefrom its present level of 16 700 million riyals to26 200 million riyals in 1975/76. The structure of theeconomy, in terms of the contribution of varioussectors to GNP, would however be largely maintain-ed. The share of agriculture as a percentage ofGNP is expected to decline during the plan periodfrom about 6.8 to about 5.4 percent. The plannedrate of growth of the agricultural sector, 5 percenta year, is well below the annual growth rate of 9to 11 percent achieved in the past, and, in view ofthe ongoing investment projects in irrigation, mayprove to be an underestimate.
In the Sudan a new five-year plan (1970/71-1974/75)has recently been approved by the Revolutionary
107
NOTE: Where possible, data refer to net investment. In many cases however, no distinction is made in the plan, and data may referto gross investment or may include some elements of recurrent expenditure. The agricultural sector includes animal production,fisheries, forestry, irrigation, land reclamation, community development and agricultural extension.
' PS - public sector. C comprehensive. - 'GDI'.
Council and the Council of Ministers. Total expendi-tures under this plan are estimated at LSd 370 million(or about $1 000 million) as compared to a grossfixed investment of LSd 565 million during the pre-vious ten-year plan 1961/62 to 1970/71), and to LSd264 million during the 1964/65-1969/70 period. About54 percent of the proposed expenditures are allocat,ed to the public sector, with priority to be given toagriculture. The hard currency requirements of theplan would necessitate foreign loans to the publicsector of LSd 95 million. The 8.1 percent growthrate envisaged for the GDP compares with 4.7 per-cent a year achieved in 1965/66-1969/70.
In the United Arab Republic, the emphasis ininvestment allocations under the economic develop-ment plan for 1970-71 will be placed on streng-thening the basic, auxiliary and extractive indus-tries. In the food industry, LE3 million will beallocated for sugar projects to increase sugar out-put from 532 000 torts to 835 000 tons. A sum ofLE 3.5 million will be allocated to rice and flourmills. The textile industry will also be expanded.The plan aims at increasing the value of the nationaloutput by about 3.5 percent between 1969/70 and1970/71.
Regional integration
Although intratrade within the Arab CommonMarket (Acm) still constitutes only about 3 percentof the total trade of its member countries, data for
Afghanistan . Afghanis 1969-71 PS 17 000 28 4.3 3.5CY-Prus . . EC 1967-71 C 186 66.6 12.9 29 6.8 8.5 8.9 14.1 1.6 0.1Iran Ir rials 1965/69- C 810 000 443 000 14 17 9.0 5.0 5.7 14.7 27 1.3
1972/73
Iraq I dinars 1969/70-1974/75
C 1 144 859 19.7 24.5 7.1 7.0 2.7 4.5 4.1
Saudi Arabia S riyals 1970/71- 9.3 5.01975 /76
Somalia . . So shillings 1968-70 PS 698.2 609.7 14.8Sudan, The. . Sd pounds 1970/71- C 370 200 95 27.9 38.3 '8.1 12.1 11.0 2.0 1.6
1974/75
Syria S pounds 1966-70 C 4 955 3 454 1 124 28.0 27.0 7.2 6.7 6.7 3.9 3.5Turkey . . . T liras 1968-72 C Ill 500 58 600 15.2 ... 7.0 4.4 4.4 5.3 4.5 3.3 3.7
CurrencyDura-tionof Scope
InvestmentFor-eignex-
cha ngecom-ponént
Share ofagriculture
in:
Planned growth rate of:
Agriculturalproduction
Exportearnings Employment
Total PublicTotal
invest-ment
Public*nvest-ment
Total Cere-als Total Agri-
culture Total Agri-culture
plan ofPublicinvest-ment
GNP
Millioncurrency unit Percen Percent per year
the years up to 1968 indicate that some modestacceleration may be taking place, mainly in exportsfrom Iraq, Jordan and the United Arab Republic.Whereas intratrade declined up to 1965, when thedecision to implement the free trade area was taken,it subsequently expanded by 4 percent in 1966,8 percent in 1967 and by 20 percent in 1968, thelatest year for which data are available. In 1967 and1968, moreover, intratrade grew more rapidly thanthe total exports of the area.
It is difficult to determine, however, to what extentthese increases can be attributed to trade liberaliza-tion measures. Although liberalization has proceed-ed rapidly, numerous constraints still exist whichprevent the more rapid growth of intratrade. Tariffsare still applied on a number of important products,and in many cases administrative restrictions preventthe movement of competitive products even wheretariffs have been removed. In contrast to Jordanand Kuwait, foreign trade in Iraq, Syria and theUnited Arab Republic is controlled by the Govern-ment. On the whole, it would seem that the impactof ACM will remain limited until some wider formof economic integration is achieved.
Some of the measures taken by ACM in 1969 mayrepresent such a move, for instance toward transform-ing the Common Market, at present functioning asa free trade area, into a customs union. The no-menclature for customs tariffs has been standardiz-ed and it has been proposed that an average of thetariffs applied by member countries in November1968 be used for the uniform external tariff. Theestablishment of a central customs organization toimplement the unified tariff system is under consid-eration. Proposals have also been made regard-
Africa
In 1969 most of the region experienced averageconditions for agriculture. Overall, agricultural pro-duction is estimated to have remained at the 1968level, with food crops possibly showing a slightreduction. This decrease was, however, largely dueto a 3 percent fall in cereal production, mainly inthe Maghreb countries, where yields fell back steeplyfrom the unusually high levels of 1968. Food cropproduction showed a satisfactory recovery in westAfrica following the 1968 drought conditions. Incontrast with the somewhat disappointing overallperformance of the food crops, production of themain export crops, except olive oil, recorded sub-stantial increases over 1968.L, .General economic growth in the region as a wholemay have been somewhat higher than the 4 percentachieved in 1968. The Democratic Republic of the
108
ing the application of a system of multilateralinvestment insurance against noncommercial risks,the mobilization of Arab capital, and the coor-dination of plans, particularly in the agriculturaland industrial sectors. Work is also proceeding onthe establishment of an Arab Paymen.ts Union, whichwould serve as a clearinghouse for member coun-tries and extend short-term credit facilities to them.Present plans call for capital of 15 million Arabdinars ($42 million).
The Kuwait Fund for Arab Economic Develop-ment has continued to expand its lending activitieswithin the limitations of the present political situa-tion. The fund is now in its ninth year of opera-tion and has provided 19 loans totalling $201 mil-lion to 9 Arab countries of which one third is tobe used in the agricultural sector. About two thirdsof the loans have already been disbursed and 10projects completed.
Increased economic cooperation is taking placebetween Libya, the Sudan and the United ArabRepublic. Technical and economic agreementsamong the three countries aim at the expansion ofagricultural trade, the formation of joint agriculturalcompanies and projects, and the encouragement oftechnical exchanges.
Regional Cooperation for Development (RcD)continues to concentrate on the establishment ofjoint industrial projects rather than on the liberaliza-tion of trade. By January 1970 13 such projectswere operating, while 4 others will be in productionby end 1970. The RCD regional planning councilhas called for the provision of more incentives tothe private sector to boost the establishment of jointindustrial enterprises.
Congo and Zambia enjoyed very high prices forcopper, while mineral exports from several othercountries continued to grow; and the ending of hos-tilities in Nigeria was followed by speedy rehabili-tation of the oil industry and a resumption of oilexports. Favourable international markets, notablyfor coffee and cocoa, were reflected in the econom-ic performance of Ghana, Ivory Coast and Kenya.
As reported below, development of the region'slivestock potential is slowly gaining impetus. Thereis also encouraging evidence of the growing adoptionof modern agricultural technology in most of thedeveloping countries of Africa. Overall the use ofsuch inputs as fertilizers, improved seeds, tractors,etc., remains low, but improved varieties are alreadywidely used in the production of export crops suchas cotton, sugarcane and oil palm. Mechanized
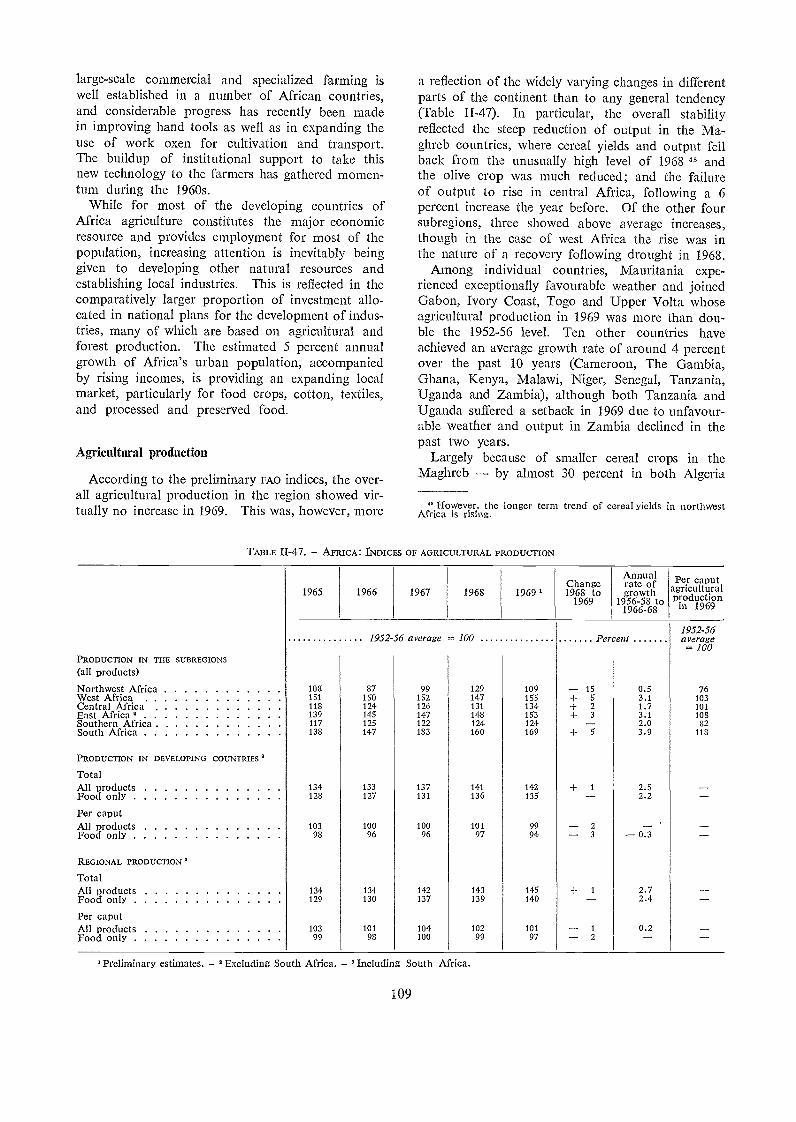
large-scale commercial and specialized farming iswell established in a number of African countries,and considerable progress has recently been madein improving hand tools as well as in expanding theuse of work oxen for cultivation and transport.The buildup of institutional support to take thisnew technology to the farmers has gathered momen-tum during the 1960s.
While for most of the developing countries ofAfrica agriculture constitutes the major economicresource and provides employment for most of thepopulation, increasing attention is inevitably beinggiven to developing other natural resources andestablishing local industries. This is reflected in thecomparatively larger proportion of investment allo-cated in national plans for the development of indus-tries, many of which are based on agricultural andforest production. The estimated 5 percent annualgrowth of Africa's urban population, accompaniedby rising incomes, is providing an expanding localmarket, particularly for food crops, cotton, textiles,and processed and preserved food.
Agricultural production
According to the preliminary FAO indices, the over-all agricultural production in the region showed vir-tually no increase in 1969. This was, however, more
TABLE II-47. AFRICA : INDICES OF AGRICULTURAL PRODUCTION
'Preliminary estimates. 'Excluding South Africa. 'Including South Africa.
109
a reflection of the widely varying changes in differentparts of the continent than to any general tendency(Table 1I-47). In particular, the overall stabilityreflected the steep reduction of output in the Ma-ghreb countries, where cereal yields and output fellback from the unusually high level of 1968 45 andthe olive crop was much reduced; and the failureof output to rise in central Africa, following a 6percent increase the year before. Of the other foursubregions, three showed above average increases,though in the case of west Africa the rise was inthe nature of a recovery following drought in 1968.
Among individual countries, Mauritania expe-rienced exceptionally favourable weather and joinedGabon, Ivory Coast, Togo and Upper Volta whoseagricultural production in 1969 was more than dou-ble the 1952-56 level. Ten other countries haveachieved an average growth rate of around 4 percentover the past 10 years (Cameroon, The Gambia,Ghana, Kenya, Malawi, Niger, Senegal, Tanzania,Uganda and Zambia), although both Tanzania andUganda suffered a setback in 1969 dite to unfavour-able weather and output in Zambia declined in thepast two years.
Largely because of smaller cereal crops in theMaghreb by almost 30 percent in both Algeria
" However, the longer term trend of cereal yields in northwestAfrica is rising.
1965 1966 1967 1968 1969Change1968 to
1969
Annualrate ofgrowth
1956-58 to1966-68
Per caputagriculturalproductionin 1969
1952-561952-56 average = 100 Percent average
100PRODUCTION IN THE SUBREGIONS
(all products)
Northwest Afric 108 87 99 129 109 15 0.5 76West Africa 151 150 152 147 155 + 5 3.1 103Central Africa 118 124 126 131 134 + 2 1.7 101East Africa 139 145 147 148 153 + 3 3.1 108Southern Africa 117 125 122 124 124 2.0 82South Africa 138 147 183 160 169 -F 5 3.9 118
PRODUCTION IN DEVELOPING COUNTRIES
TotalAll products 134 133 137 141 142 + 1 2.5Food only 128 127 131 136 135 2.2
Per caputAll products 103 100 100 101 99 2Food only 98 96 96 97 94 3 0.3
REGIONAL PRODUCTION
TotalAll products 134 134 142 143 145 2.7Food only 129 130 137 139 140 2.4
Per caputAll products 103 101 104 102 101 1 0.2Food only 99 98 100 99 97 2
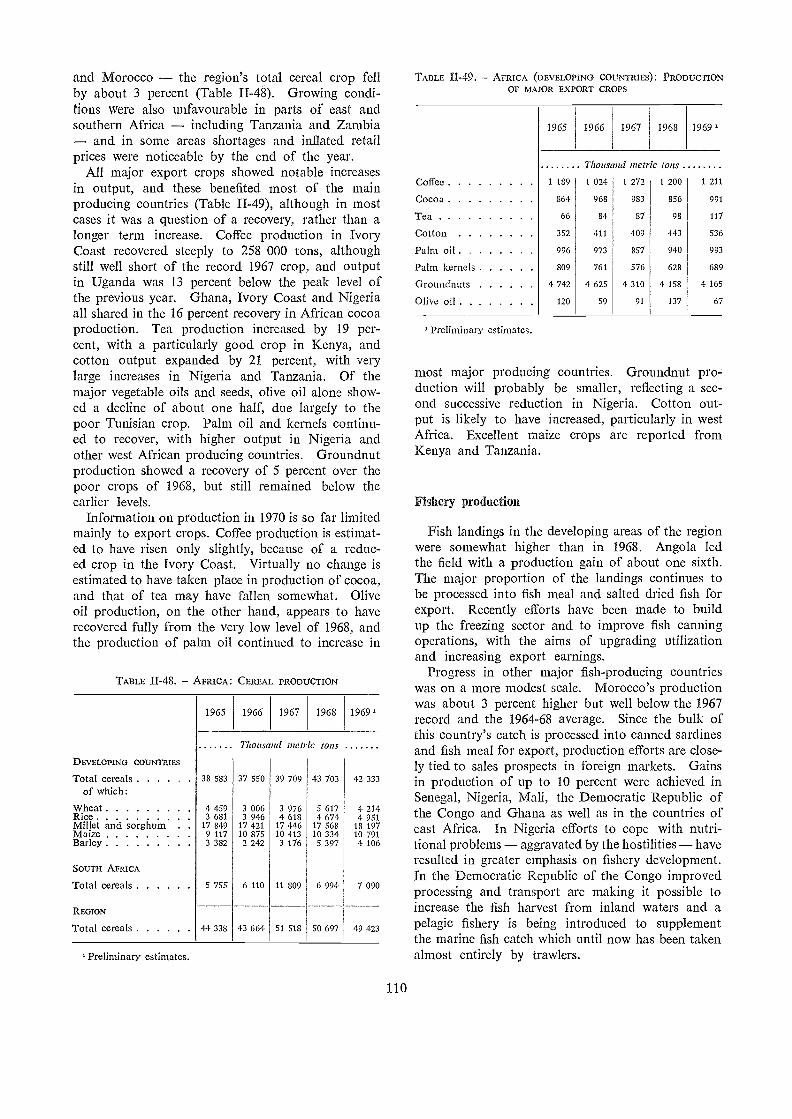
and Morocco the region's total cereal crop fellby about 3 percent (Table II-48). Growing condi-tions were also unfavourable in parts of east andsouthern Africa including Tanzania and Zambia
and in some areas shortages and inflated retailprices were noticeable by the end of the year.
All major export crops showed notable increasesin output, and these benefited most of the mainproducing countries (Table II-49), although in mostcases it was a question of a recovery, rather than alonger term increase. Coffee production in IvoryCoast recovered steeply to 258 000 tons, althoughstill well short of the record 1967 crop, and outputin Uganda was 13 percent below the peak level ofthe previous year. Ghana, Ivory Coast and Nigeriaall shared in the 16 percent recovery in African cocoaproduction. Tea production increased by 19 per-cent, with a particularly good crop in Kenya, andcotton output expanded by 21 percent, with verylarge increases in Nigeria and Tanzania. Of themajor vegetable oils and seeds, olive oil alone show-ed a decline of about one half, due largely to thepoor Tunisian crop. Palm oil and kernels continu-ed to recover, with higher output in Nigeria andother west African producing countries. Groundnutproduction showed a recovery of 5 percent over thepoor crops of 1968, but still remained below theearlier levels.
Information on production in 1970 is so far limitedmainly to export crops. Coffee production is estimat-ed to llave risen only slightly, because of a reduc-ed crop in the Ivory Coast. Virtually no change isestimated to have taken place in production of cocoa,and that of tea may have fallen somewhat. Oliveoil production, on the other hand, appears to haverecovered fully from the very low level of 1968, andthe production of palm oil continued to increase in
TABLE H-48. AFRICA: CEREAL PRODUCTION
DEVELOPING COUNTRIES
Total cerealsof which:
WheatRiceMillet and sorghumMaizeBarley
SOUTH AFRICA
Total cereals
REGION
Total cereals
'Preliminary estimates.
1965
44 338
1966
Thousand me t/ je tons
43 664
1967
51 518
1968 1969'
50 697 49 423
110
TABLE II-49. - AFRICA (DEVELOPING COUNTRIES): PRODUCTIONOF MAJOR EXPORT CROPS
Coffee
Cocoa
Tea
Cotton
Palm oil
Palm kernels
Groundnuts
Olive oil
Preliminary estimates.
most major producing countries. Groundnut pro-;duction will probably be smaller, reflecting a sec-ond successive reduction in Nigeria. Cotton out-put is likely to have increased, particularly in westAfrica. Excellent maize crops are reported fromKenya and Tanzania.
Fishery production
Fish landings in the developing areas of the regionwere somewhat higher than in 1968. Angola ledthe field with a production gain of about one sixth.The major proportion of the landings continues tobe processed into fish meal and salted dried fish forexport. Recently efforts have been made to buildup the freezing sector and to improve fish canningoperations, with the aims of upgrading utilizationand increasing export earnings.
Progress in other rnajor fish-producing countrieswas on a more modest scale. Morocco's productionwas about 3 percent higher but well below the 1967record and the 1964-68 average. Since the bulk ofthis country's catch is processed into canned sardinesand fish meal for export, production efforts are close-ly tied to sales prospects in foreign markets. Gainsin production of up to 10 percent were achieved inSenegal, Nigeria, Mali, the Democratic Republic ofthe Congo and Ghana as well as in the countries ofeast Africa. In Nigeria efforts to cope with nutri-tional problems aggravated by the hostilities haveresulted in greater emphasis on fishery development.In the Democratic Republic of the Congo improvedprocessing and transport are making it possible toincrease the fish harvest from inland waters and apelagic fishery is being introduced to supplementthe marine fish catch which until now has been takenalmost entirely by trawlers.
1965 1966 1967 1968 1969
Thousand tnetr'c tons
1 189 1 024 1 272 1 200 1 211
864 968 983 856 991
66 84 87 98 117
352 411 409 443 536
996 973 857 940 993
809 761 576 628 689
4 742 4 625 4 310 4 158 4 165
120 59 91 137 67
38 583
4 4593 681
17 8499 1173 382
5 755
37 550
3 0063 946
17 42110 8752 242
6 110
43 703 42 333
5 617 4 2144 674 4 951
17 568 18 19710 334 10 7915 397 4 106
6 994 7 090
39 709
3 9764 618
17 44610 4133 176
11 809
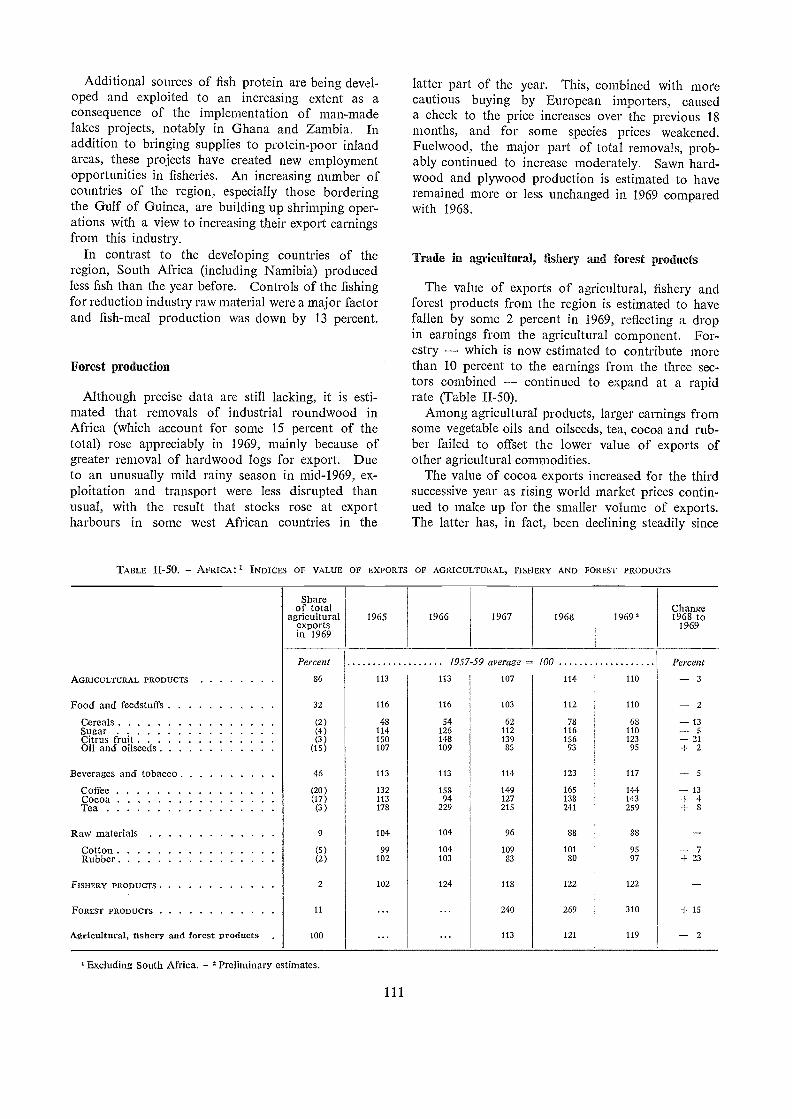
Additional sources of fish protein are being devel-oped and exploited to an increasing extent as aconsequence of the implementation of man-madelakes projects, notably in Ghana and Zambia. Inaddition to bringing supplies to protein-poor inlandareas, these projects have created new employmentopportunities in fisheries. An increasing number ofcountries of the region, especially those borderingthe Gulf of Guinea, are building up shrimping oper-ations with a view to increasing thcir export earningsfrom this industry.
In contrast to the developing countries of theregion, South Africa (including Namibia) producedless fish than the year before. Controls of the fishingfor reduction industry raw material were a major factorand fish-meal production was down by 13 percent.
Forest production
Although precise data are still lacking, it is esti-mated that removals of industrial roundwood inAfrica (which account for some 15 percent of thetotal) rose appreciably in 1969, mainly because ofgreater removal of hardwood logs for export. Dueto an unusually mild rainy season in mid-1969, ex-ploitation and transport were less disrupted thanusual, with the result that stocks rose at exportharbours in some west African countries in the
TABLE II-50. - AFRICA: 1 INDICES OF VALUE OF EXPORTS OF AGRICULTURAL, FISHERY AND FOREST PRODUCTS
Shareof total
agriculturalexportsin 1969
'Excluding South Africa. - 'Preliminary estimates.
1965
Percent
latter part of the year. This, combined with morecautious buying by European importers, causeda check to the price increases over the previous 18months, and for some species prices weakened.Fuelwood, the major part of total removals, prob-ably continued to increase moderately. Sawn hard-wood and plywood production is estimated to haveremained more or less unchanged in 1969 comparedwith 1968.
Trade in agricultural, fishery and forest products
The value of exports of agricultural, fishery andforest products from the region is estimated to havefallen by some 2 percent in 1969, reflecting a dropin earnings from the agricultural component. For-estry which is now estimated to contribute morethan 10 percent to the earnings from the three sec-tors combined continued to expand at a rapidrate (Table II-50).
Among agricultural products, larger earnings fromsome vegetable oils and oilseeds, tea, cocoa and rub-ber failed to offset time lower value of exports ofother agricultural commodities.
The value of cocoa exports increased for the thirdsuccessive year as rising world market prices contin-ued to make up for the smaller volume of exports.The latter has, in fact, been declining steadily since
1957-59 average - 100
111
1968 1969'Change1968 to
1969
Percent
AGRICULTURAL PRODUCTS 86 113 113 107 114 110 - 3Food and feedstuffs ....... , . . . 32 116 116 103 112 110 - 2
Cereals (2) 48 54 62 78 68 -13Sugar (4) 114 126 112 116 110 - 5Citrus fruit (3) 150 148 139 156 123 - 21Oil and oilseeds (15) 107 109 93 95 + 2
Beverages and tobacco 46 113 113 114 123 117 - 5Coffee (20) 132 158 149 165 144 - 13Cocoa (17) 113 94 127 138 143 + 4Tea (3) 178 229 215 241 259 + 3
Raw materials 9 104 104 96 88 38 -Cotton (5) 99 104 109 101 95 - 7Rubber (2) 102 103 83 80 97 ±23
FISHERY PRODUCTS 2 102 124 118 122 122
FOREST PRODUCTS 11 240 269 310 + 15
Agricultural, fishery and forest products . 100 113 121 119 - 2
1966 1967
1965, and in 1969 was 35 percent below the levelof that year. Lower production in west Africa hasbeen responsible for this decline, and in 1969 ex-cessive rain added to the longer term problems ofdeterioration in maintenance and disease. In Ghana,which accounts for more than one third of regionalcocoa earnings, the 1968/69 crop was the smallestsince 1959/60.
The volume of coffee exports also declined in 1969,as smaller shipments from Angola, Cameroon, IvoryCoast and Madagascar more than offset increasesfrom Ethiopia, Kenya and Uganda. There was,however, no offsetting increase in the average ex-port unit value; prices rose in the second half ofthe yew, but not enough to make up for the earlierdecline. The value of coffee exports was thereforesome 13 percent smaller than in 1968.
Shipments of oils and oilseeds were lower, reflect-ing primarily poor groundnut crops throughout theregion, but the shortage brought higher prices andthe value of exports was higher. The volume of palmkernel exports again registered a modest increase,reflecting the continued recovery of Nigerian produc-tion, but prices were lower and earnings decreased.
The continued growth of tea production in theregion, by nearly 50 percent over the past five years,brought a further increase in tea exports in 1969,both for the region as a whole and for all the mainproducing countries. This more than offset the declinein prices, and earnings were up by some 8 percent.
Despite higher production of cotton, the volumeof exports from the region remained unchanged and,with lower prices, the value of exports declined. Sisalexports were also smaller (by about 8 percen.t) butthis was partly compensated by increased exports ofmanufactured goods. Prices were somewhat abovethe very depressed level of 1968, partly due to thevoluntary price and quota arrangement betweenproducing countries and the principal users, but notenough to raise the total value received.
Information on the agricultural imports of theregion in 1969 are still incomplete. Available datasuggest, however, that there was a further reductionin cereal imports from the peak level of 1967. In1968, wheat imports liad been reduced slightly, andthose of coarse grains halved, primarily as a resultof the recovery of output in North Africa and thegrowing production of maize in Kenya. This trendgenerally seems to have continued in 1968. Thanksto good harvests in 1967 and 1968, Morocco's grainimports, which amounted to some 906 000 tons in1967, were reduced to 622 000 tons in 1968 and to142 000 tons in 1969. For the same reason, Alge-rian imports, which had reached their peak in 1966,are reported to have declined in 1969. In Tunisia,however, wheat imports are estimated to have risento over 300 000 tons from 260 000 tons in 1968.
112
Zambia's wheat imports were reduced from 59 000to 46 000 tons.
There was no change in the value of trade in fisheryproducts in 1969 for the developing countries of theregion as a whole, but the sector did make a growingcontribution to the earnings of a number of countriesinvolved in the exploitation of shrimp fishing in theGulf of Guinea. The value of exports of fisheryproducts from Morocco, the region's leading export-er, recovered in the second half of 1969, and forthe year as a whole the total was virtually the sameas in 1968. Angola's exports recovered remarkablyfrom the slump of recent years primarily because ofthe doubling of fish-meal exports. Mali's exports ofdried fish to neighbouring countries has continuedto grow, and is currently the third largest exportcommodity.
While the region continues to be dependent ona very limited number of agricultural export commod-ities, the continued rapid growth in export earningsfrom forestry is noteworthy. There was a majorexpansion of exports of tropical hardwood logs in1969 mainly from west Africa. The volume is esti-mated at 7.2 million cubic metres, some 18 percentmore than in 1968." Exports of sawn hardwood,plywood and veneers are estimated to have increasedonly slightly, despite the strong growth of westernEuropean imports of these products. In the caseof sawn hardwood, it may be that the prices andspecifications of southeast Asian utility hardwoodsmade them more competitive, though it should alsobe noted that in 1969 there was an appreciable dropin the total imports of the United Kingdom, thelargest single buyer of tropical sawn hardwood andplywood from Africa.
Technological progress
Although the level of agricultural technology re-mains low in most of the region, there are encourag-ing signs of a progressive introduction and adapta-tion of more modern techniques to the varied farm-ing, forestry and fishery systems of Africa. Thusthe region is increasingly expanding its own produc-tion of fertilizers and pesticides and the manufactureof farming equipment to meet local needs. Pro-duction of fertilizers increased by 14 percent to390 000 tons in 1968/69, almost entirely phosphateproduced mainly in Morocco and Tunisia. A con-siderable part of the total continued to be exported.Fertilizer use in the developing countries of theregion also rose by 13 percent to some 544 000tons following a 16 percent increase in 1968. All
"The 1968 figures exclude transfers of logs from EquatorialGuinea (formerly Spanish Guinea) to Spain, which in recent yearshave amounted to about 400 000 cubic metres a year.
countries, with the exception of Algeria, Senegaland Madagascar, participated, the largest increasesbeing in Cameroon, Chad, Congo (Brazzaville), theDemocratic Republic of the Congo, Ivory Coast,Mali, Senegal and Tunisia.
The number of tractors in the African developingcountries again increased by 7 percent, to 119 000 in1968. One third of the new machines, however,went to the northwestern countries where almosthalf of all tractors in the region are located. Dur-ing 1969 two more tractor and agricultural ma-chinery plants were set up in Algeria, to cater for the2.8 million hectares now cultivated mechanically.More tractors were also required in Morocco be-cause of the development of irrigated agricultureand to implement the Fertilizer and Ploughing Pro-gramme covering 300 000 hectares of cereals. Tractornumbers increased by 6 percent in Tunisia, but thiswas insufficient to raise agricultural production tothe plan target.
Some increase in mechanization has also takenplace in central African countries. Although theoverall use of machinery is still limited, implementa-tion of some intensive agricultural and forestryschemes brought about a doubling of the tractornumbers in Gabon. In the Democratic Republicof the Congo, however, the recently established trac-tor plants have not yet made a great impact on farmmechanization. In the coastal zones of west Africaand in east Africa expansion of machine utilizationis continuing, notably in Ivory Coast which liad a14 percent increase in 1968 due to the implementa-tion of some large farming operations (for examplethe cultivation of oil palms and of coffee). Tanzaniaand Malawi also increased the use of mechanicalpower for farming, by 21 percent and 38 percentrespectively, and Malawi has established a tractorhire system.
Mechanization of forestry through the use of powersaws in logging operations is increasing rapidly.This is resulting both in higher productivity per manand in higher yields. Progress has been made inmethods of transporting timber through the expandeduse of articulated four-wheeled skidders in somecountries, for instance in Gabon where 140 of themare now in use.
Use of improved planting material remains forthe moment restricted mainly to export crops, andconsiderable progress has been made in that sector.Most of the cotton now grown in Africa is fromselected seed; the new plantations of oil palms, no-tably in Ivory Coast, use carefully bred high-yield-ing varieties; and the rehabilitation and extensionof cocoa are largely based on early maturing, high-yielding clonal strains. The new International In-stitute for Tropical Agriculture established at Iba-dan, Nigeria, by the Ford and Rockefeller Founda-
113
tions is a major new research resource for developingAfrican agriculture.
However, attention is increasingly focusing on theneed to expand cereal production to counter theregion's growing dependence on imports. Specialattention is being given to Mexican wheat in northwestAfrica and to high-yielding strains of rice in westAfrica and also in the Democratic Republic of theCongo, where satisfactory plant breeding resultshave already been achieved with upland rainfedvarieties yielding more than 2 tons per hectare. On thewest coast, from The Gambia to Sierra Leone, swamprice is gaining importance and at Rokupr in SierraLeone yields of up to 5 tons per hectare have alreadybeen reported with improved varieties. Further re-search work is being conducted in Nigeria, Guineaand Niger, and in Mali, at the Office of the NigerArea, rice varieties have been selected for varyingWater levels. Rice seed production schemes are re-ported to be operating in the Central African Re-public, the Democratic Republic of the Congo andThe Gambia, but seed certification and distributionboth need to be improved.
Maize breeding in Kenya continues to show goodresults. New hybrids developed from Mexican andColombian lines yield 40 percent more than localimproved varieties. Maize breeding programmes arealso under way in Nigeria and Rhodesia. In Malawi,in the Lunzu-Liranguru settlement scherne, maizehybrids have increased the average yield fourfold.Sorghum breeding programmes are reported to beunder way in Ghana, northern Nigeria, Zambia,Senegal and Tanzania.
Forestry is also benefiting from high-yieldingvarieties and, with the increasing importance of man-made forests, the identification and breeding ofsuitable high-yielding varieties are becoming of greaterimportance. FAO has given financial support toseveral tropical pine seed collection expeditions (twoin 1969) organized by the Forest Research Institute,Canberra, Australia, and the Commonwealth For-estry Institute, Oxford, England. In Nigeria and Zam-bia, work was intensified in 1969 on the productionof eucalyptus hybrids, some of which show greatpromise of combining the high yield and good formof one parent with the drought resistance of the other.
Desert locust control
After the alarm in 1968 and the subsequent suc-cessful antilocust campaigns, 1969 was a compara-tively calm year. In early January 1969 scatteredswarms were again reported in Morocco, Algeria,Mauritania, Mali, Niger and Chad. Mature swarmsand newly hatched hoppers were also reported inthe countries on both sides of the Red Sea. Pre-
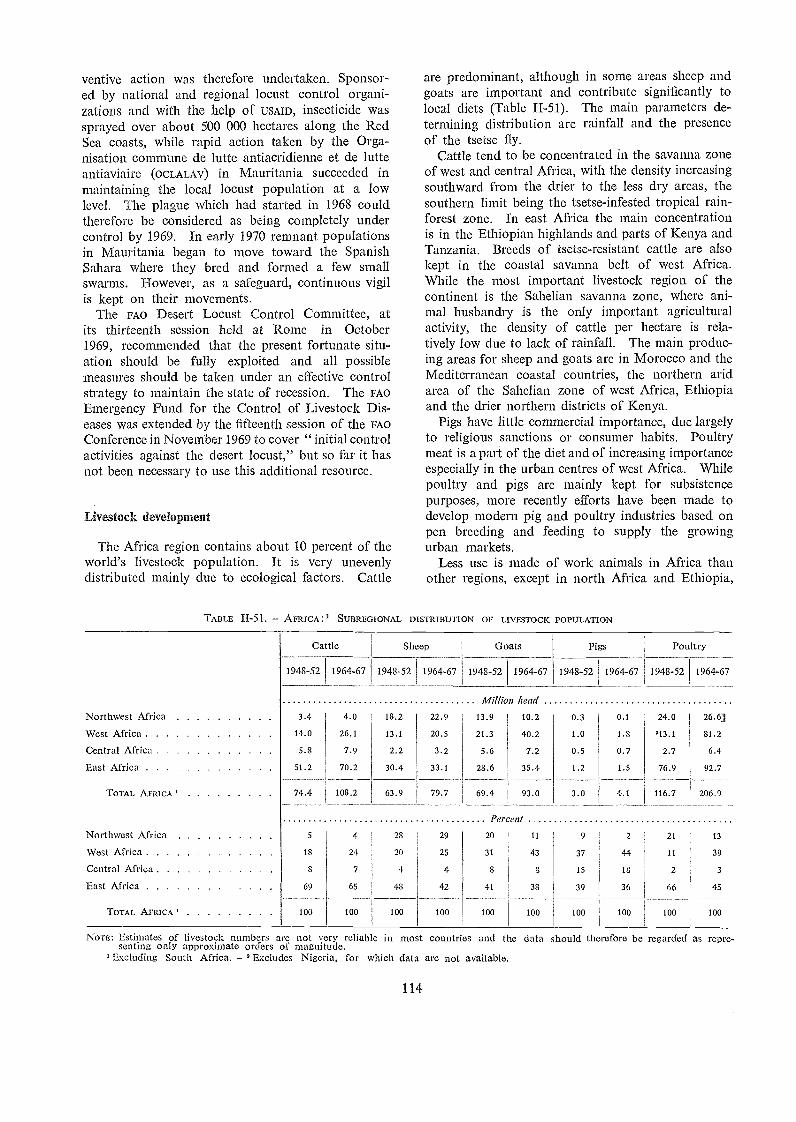
ventive action was therefore undertaken. Sponsor-ed by national and regional locust control organi-zations and with the help of USAID, insecticide wassprayed over about 500 000 hectares along the RedSea coasts, while rapid action taken by the Orga-nisation commune de lutte antiacridienne et de lutteantiaviaire (ocLALAv) in Mauritania succeeded inmaintaining the local locust population at a lowlevel. The plague which had started in 1968 couldtherefore be considered as being completely undercontrol by 1969. In early 1970 remnant populationsin Mauritania began to move toward the SpanishSahara where they bred and formed a few smallswarms. However, as a safeguard, continuous vigilis kept on their movements.
The FAO Desert Locust Control Committee, atits thirteenth session held at Rome in October1969, recommended that the present fortunate situ-ation should be fully exploited and all possiblemeasures should be taken under an effective controlstrategy to maintain the state of recession. The FAOEmergency Fund for the Control of Livestock Dis-eases was extended by the fifteenth session of the FAOConference in November 1969 to cover " initial controlactivities against the desert locust," but so far it hasnot been necessary to use this additional resource.
Livestock development
The Africa region contains about 10 percent of theworld's livestock population. It is very unevenlydistributed mainly due to ecological factors. Cattle
TABLE II-51. - AFRICA:1 SUBREGIONAL DISTRIBuTION OF LIVESTOCK POPULATION
are predominant, although in some areas sheep andgoats are important and contribute significantly tolocal diets (Table 11-51). The main parameters de-termining distribution are rainfall and the presenceof the tsetse fly.
Cattle tend to be concentrated in the savanna zoneof west and central Africa, with the density increasingsouthward from the drier to the less dry areas, thesouthern limit being the tsetse-infested tropical rain-forest zone. In east Africa the main concentrationis in the Ethiopian highlands and parts of Kenya andTanzania. Breeds of tsetse-resistant cattle are alsokept in the coastal savanna belt of west Africa.While the most important livestock region of thecontinent is the Sahelian savanna zone, where ani-mal husbandry is the only important agriculturalactivity, the density of cattle per hectare is rela-tively low due to lack of rainfall. The main produc-ing areas for sheep and goats are in Morocco and theMediterranean coastal countries, the northern aridarea of the Sahelian zone of west Africa, Ethiopiaand the drier northern districts of Kenya.
Pigs have little commercial importance, due largelyto religious sanctions or consumer habits. Poultrymeat is a part of the diet and of increasing importanceespecially in the urban centres of west Africa. Whilepoultry and pigs are mainly kept for subsistencepurposes, more recently efforts have been made todeve/op modern pig and poultry industries based onpen breeding and feeding to supply the growingurban markets.
Less use is made of work animals in Africa thanother regions, except in north Africa and Ethiopia,
114
Non: Estimates of livestock numbers are not very reliable in most countries and the data should therefore be regarded as repre-senting only approximate orders of magnitude.
Excluding South Africa. - 2 Excludes Nigeria, for which data are not available.
1948-52 1964-67 1948-52 1964-67 1948-52 1964-67 1948-52 1964-67 1948-52 1964-67
Million head
Northwest Africa 3.4 4.0 18.2 22.9 13.9 10.2 0.3 0.1 24.0 26.61
West Africa 14.0 26.1 13.1 20.5 21.3 40.2 1.0 1.8 '13.1 81.2
Central Africa 5.8 7.9 2.2 3.2 5.6 7.2 0.5 0.7 2.7 6.4
East Africa 51.2 70.2 30.4 33.1 28.6 35.4 1.2 1.5 76.9 92.7
TOTAL AFRICA 74.4 108.2 63.9 79.7 69.4 93.0 3.0 4.1 116.7 206.9
Per eta
Northwest Africa 5 4 28 29 20 11 9 2 21 13
West Africa 18 24 20 25 31 43 37 44 11 39
Central Africa 8 7 4 4 8 8 15 18 2 3
East Africa 69 65 48 42 41 38 39 36 66 45
TOTAL AFRICA 100 100 100 100 100 100 100 100 100 100
Cattle Sheep Goats Pigs Poultry
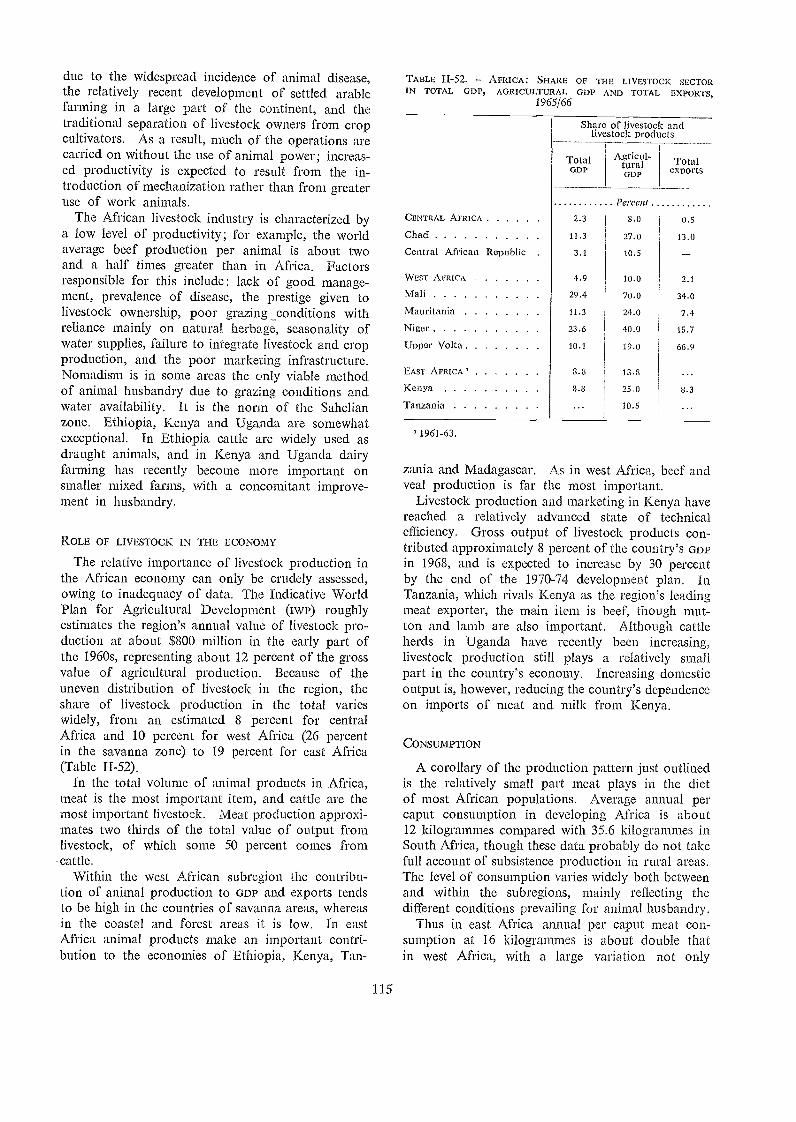
due to the widespread incidence of animal disease,the relatively recent development of settled arablefarming in a large part of the continent, and thetraditional separation of livestock owners from cropcultivators. As a result, much of the operations arecarried on without the use of animal power; increas-ed productivity is expected to result from the in-troduction of mechanization rather thart from greateruse of work animals.
The African livestock industry is characterized bya low level of productivity; for example, the worldaverage beef production per animal is about twoand a half times greater than in Africa. Factorsresponsible for this include: lack of good manage-ment, prevalence of disease, the prestige given tolivestock ownership, poor grazing_conditions withreliance mainly on natural herbage, seasonality ofwater supplies, failure to integrate livestock and cropproduction, and the poor marketing infrastructure.Nomadism is in some areas the only viable methodof animal husbandry due to grazing conditions andwater availability. It is the norm of the Sahelianzone. Ethiopia, Kenya and Uganda are somewhatexceptional. In Ethiopia cattle are widely used asdraught animals, and in Kenya and Uganda dairyfarming has recently become more important onsmaller mixed farms, with a concomitant improve-ment in husbandry.
ROLE OF LIVESTOCK IN THE ECONOMY
The relative importance of livestock production inthe African economy can only be crudely assessed,owing to inadequacy of data. The Indicative WorldPlan for Agricultural Development (iwl)) roughlyestimates the region's annual value of livestock pro-duction at about $800 million in the early part ofthe 1960s, representing about 12 percent of the grossvalue of agricultural production. Because of theuneven distribution of livestock in the region, theshare of livestock production in the total varieswidely, from an estimated 8 percent for centralAfrica and 10 percent for west Africa (26 percentin the savanna zone) to 19 percent for east Africa(Table II-52).
In the total volume of animal products in Africa,meat is the most important item, and cattle are themost important livestock. Meat production approxi-mates two thirds of the total value of output fromlivestock, of which some 50 percent comes fromcattle.
Within the west African subregion the contribu-tion of animal production to GDP and exports tendsto be high in the countries of savanna areas, whereasin the coastal and forest areas it is low. In eastAfrica animal products make an important contri-bution to the economies of Ethiopia, Kenya, Tan-
115
TABLE II-52. - AFRICA: SHARE OF THE LIVESTOCK SECTORIN TOTAL GDP, AGRICULTURAL GDP AND TOTAL EXPORTS,
1965/66
1961-63.
zania and Madagascar. As in west Africa, beef andveal production is far the most important.
Livestock production and marketing in Kenya havereached a relatively advanced state of technicalefficiency. Gross output of livestock products con-tributed approximately 8 percent of the country's GDPin 1968, and is expected to increase by 30 percentby the end of the 1970-74 development plan. InTanzania, which rivals Kenya as the region's leadingmeat exporter, the main item is beef, though mut-ton and lamb are also important. Although cattleherds in Uganda have recently been increasing,livestock production still plays a relatively smallpart in the country's economy. Increasing domesticoutput is, however, reducing the country's dependenceon imports of meat and milk from Kenya.
CONSUMPTION
A corollary of the production pattern just outlinedis the relatively small part meat plays in the dietof most African populations. Average annual percaput consumption in developing Africa is about12 kilogrammes compared with 35.6 kilogrammes inSouth Africa, though these data probably do not takefull account of subsistence production in rural areas.The level of consumption varies widely both betweenand within the subregions, mainly reflecting thedifferent conditions prevailing for animal husbandry.
Thus in east Africa annual per caput meat con-sumption at 16 kilogrammes is about double thatin west Africa, with a large variation not only
Share of livestock- andlivestock products
TotalGDP
Agricul-turalGDP
Totalexports
PercentCENTRAL AFRICA 2.3 8.0 0.5
Chad 11.3 27.0 13.0
Central African Republic . 3.1 10.5
VVEST AFRICA 4.9 10.0 2.1
Mali 29.4 70.0 34.0
Mau ritan i a 11.3 24.0 7.4
Niger 23.6 40.0 15.7
Upper Volta 10.1 19.0 66.9
EAST AFRICA 8.8 13.8
Kenya 8.3 25.0 8.3
Tanzania 10.5
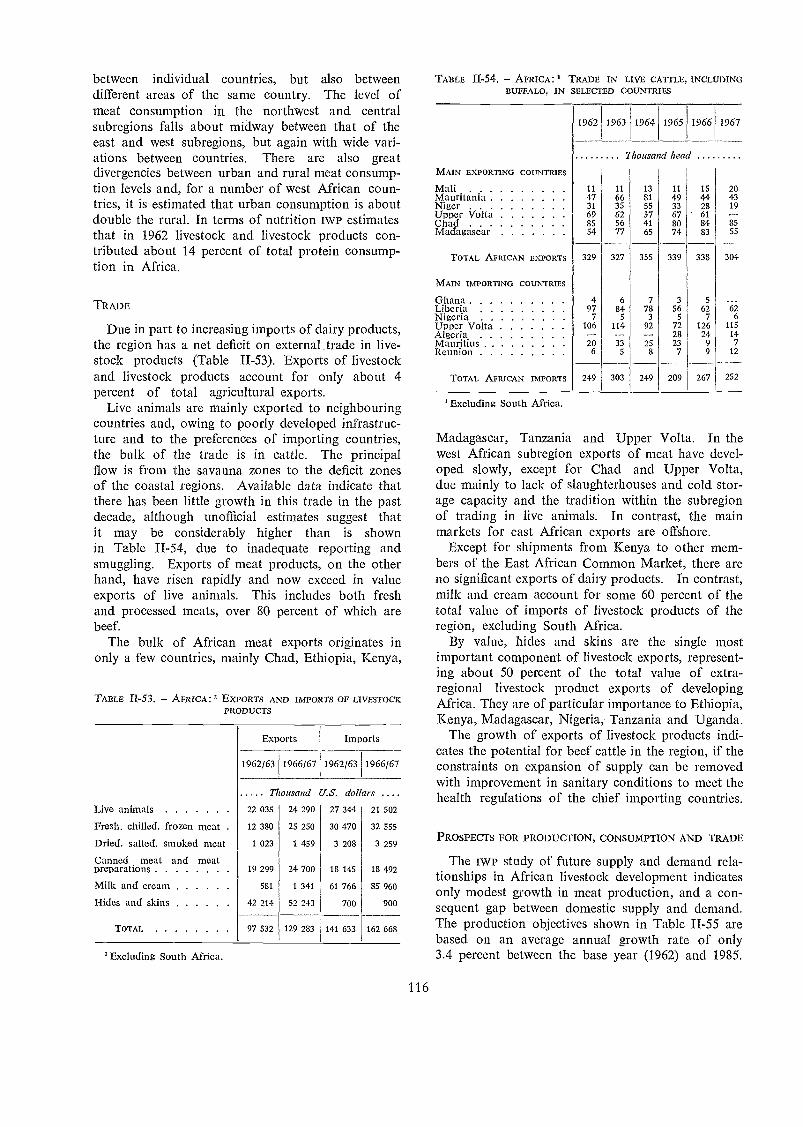
between individual countries, but also betweendifferent areas of the same country. The level ofmeat consumption in the northwest and centralsubregions falls about midway between that of theeast and west subregions, but again with wide vari-ations between countries. There are also greatdivergencies between urban and rural meat consump-tion levels and, for a number of west African coun-tries, it is estimated that urban consumption is aboutdouble the rural. In terms of nutrition iwr estimatesthat in 1962 livestock and livestock products con-tributed about 14 percent of total protein consump-tion in Africa.
TRADE
Due in part to increasing imports of dairy products,the region has a net deficit on external trade in live-stock products (Table II-53). Exports of livestockand livestock products account for only about 4percent of total agricultural exports.
Live animals are mainly exported to neighbouringcountries and, owing to poorly developed infrastruc-ture and to the preferences of importing countries,the bulk of the trade is in cattle. The principallbw is from the savanna zones to the deficit zonesof the coastal regions. Available data indicate thatthere has been little growth in this trade in the pastdecade, although unofficial estimates suggest thatit may be considerably higher than is shownin Table II-54, due to inadequate reporting andsmuggling. Exports of meat products, on the otherhand, have risen rapidly and now exceed in valueexports of live animals. This includes both freshand processed meats, over 80 percent of which arebeef.
The bulk of African meat exports originates inonly a few countries, mainly Chad, Ethiopia, Kenya,
TABLE 1/-53. AFRICA: EXPORTS AND IMPORTS OF LIVESTOCKPRODUCTS
'Excluding South Africa.
116
TABLE 11-54. AFRICA: 1 TRADE IN LIVE CATTLE, INCLUDINGBUFFALO, IN SELECTED COUNTRIES
Madagascar, Tanzania and Upper Volta. In thewest African subregion exports of meat have devel-oped slowly, except for Chad and Upper Volta,due mainly to lack of slaughterhouses and cold stor-age capacity and the tradition within the subregionof trading in live animals. In contrast, the mainmarkets for east African exports are offshore.
Except for shipments from Kenya to other mem-bers of the East African Common Market, there areno significant exports of dairy products. In contrast,milk and cream account for some 60 percent of thetotal value of imports of livestock products of theregion, excluding South Africa.
By value, hides and skins are the single mostimportant component of livestock exports, represent-ing about 50 percent of the total value of extra-regional livestock product exports of developingAfrica. They are of particular importance to Ethiopia,Kenya, Madagascar, Nigeria, Tanzania and Uganda.
The growth of exports of livestock products indi-cates the potential for beef cattle in the region, if theconstraints on expansion of supply can be removedwith improvement in sanitary conditions to meet thehealth regulations of the chief importing countries.
PROSPECTS FOR PRODUCTION, CONSUMPTION AND TRADE
The IWP study of future supply and demand rela-tionships in African livestock development indicatesonly modest growth in meat production, and a con-sequent gap between domestic supply and demand.The production objectives shown in Table II-55 arebased on an average annual growth rate of only3.4 percent between the base year (1962) and 1985.
Thousand head
MAIN EXPORTING COUNTRIES
Mali 11 11 13 11 15 20Mauritania 47 66 81 49 44 43Niger 31 35 55 33 28 19Upper Volta 69 62 57 67 61Chad 85 56 41 80 84 85Madagascar 54 77 65 74 83 55
TOTAL AFRICAN EXPORTS 329 327 355 339 338 304
MAIN IMPORTING COUNTRIES
Ghana 4 6 7 3 5Liberia 97 84 78 56 62 62Nigeria 7 5 3 5 7 6Upper Volta 106 114 92 72 126 115Algeria 28 24 14Mauritius 20 33 25 23 9 7
Reunion 6 5 8 7 9 12
TOTAL AFRICAN IMPORTS 249 303 249 209 267 252
Excluding South Africa.
Exports Imports
1962/63 1966/67 1962/63 1966/67
TI ousand U.S. dol ars . . . .
Live animals 22 035 24 290 27 344 21 502
Fresh, chilled, frozen meat 12 380 25 250 30 470 32 555
Dried, salted, smoked meat 1 023 1 459 3 208 3 259
Canned meat and meatpreparations 19 299 24 700 18 145 18 492
Milk and cream 581 1 341 61 766 85 960
Hides and skins 42 214 52 243 700 900
TOTAL 97 532 129 283 141 633 162 668
1962 1963 1964 1965 1966 1967
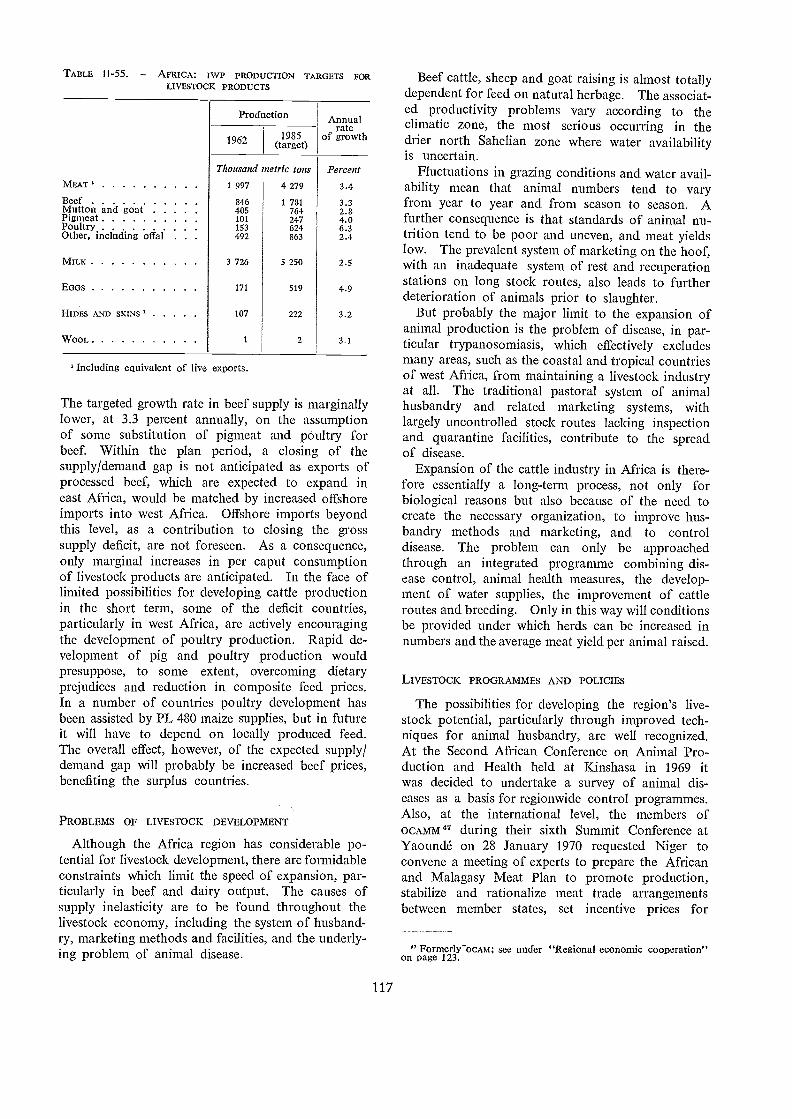
TABLE 11-55. AFRICA: IWP PRODUCTION TARGETS FORLIVESTOCK PRODUCTS
'Including equivalent of live exports.
The targeted growth rate in beef supply is marginallylower, at 3.3 percent annually, on the assumptionof some substitution of pigmeat and poultry forbeef. Within the plan period, a closing of thesupply/demand gap is not anticipated as exports ofprocessed beef, which are expected to expand ineast Africa, would be matched by increased offshoreimports into west Africa. Offshore imports beyondthis level, as a contribution to closing the grosssupply deficit, are not foreseen. As a consequence,only marginal increases in per caput consumptionof livestock products are anticipated. In the face oflimited possibilities for developing cattle productionin the short term, some of the deficit countries,particularly in west Africa, are actively encouragingthe development of poultry production. Rapid de-velopment of pig and poultry production wouldpresuppose, to some extent, overcoming dietaryprejudices and reduction in composite feed prices.In a number of countries poultry development hasbeen assisted by PL 480 maize supplies, but in futureit will have to depend on locally produced feed.The overall effect, however, of the expected supply/demand gap will probably be increased beef prices,benefiting the surplus countries.
PROBLEMS OF LIVESTOCK DEVELOPMENT
Although the Africa region has considerable po-tential for livestock development, there are formidableconstraints which limit the speed of expansion, par-ticularly in beef and dairy output. The causes ofsupply inelasticity are to be found throughout thelivestock economy, including the system of husband-ry, marketing methods and facilities, and the underly-ing problem of animal disease.
117
Beef cattle, sheep and goat raising is almost totallydependent for feed on natural herbage. The associat-ed productivity problems vary according to theclimatic zone, the most serious occurring in thedrier north Sahelian zone where water availabilityis uncertain.
Fluctuations in grazing conditions and water avail-ability mean that animal numbers tend to varyfrom year to year and from season to season. Afurther consequence is that standards of animal nu-trition tend to be poor and uneven, and meat yieldslow. The prevalent system of marketing on the hoof,with an inadequate system of rest and recuperationstations on long stock routes, also leads to furtherdeterioration of animals prior to slaughter.
But probably the major limit to the expansion ofanimal production is the problem of disease, in par-ticular trypanosomiasis, which effectively excludesmany areas, such as the coastal and tropical countriesof west Africa, from maintaining a livestock industryat all. The traditional pastoral system of animalhusbandry and related marketing systems, withlargely uncontrolled stock routes lacking inspectionand quarantine facilities, contribute to the spreadof disease.
Expansion of the cattle industry in Africa is there-fore essentially a long-term process, not only forbiological reasons but also because of the need tocreate the necessary organization, to improve hus-bandry methods and marketing, and to controldisease. The problem can only be approachedthrough an integrated programme combining dis-ease control, animal health measures, the develop-ment of water supplies, the improvement of cattleroutes and breeding. Only in this way will conditionsbe provided under which herds can be increased innumbers and the average meat yield per animal raised.
LIVESTOCK PROGRAMMES AND POLICIES
The possibilities for developing the region's live-stock potential, particularly through improved tech-niques for animal husbandry, are well recognized.At the Second African Conference on Animal Pro-duction and Health held at Kinshasa in 1969 itwas decided to undertake a survey of animal dis-eases as a basis for regionwide control programmesAlso, at the international level, the members ofocAmm47 during their sixth Summit Conference atYaoundé on 28 January 1970 requested Niger toconvene a meeting of experts to prepare the Africanand Malagasy Meat Plan to promote production,stabilize and rationalize meat trade arrangementsbetween member states, set incentive prices for
" Forinerly-ocAm; see under "Regional economic cooperation"on page 123.
Production Annualrate
of growth1962 1985(target)
Thousand metric tons PercentMEAT 1 997 4 279 3.4
Beef 846 1 781 3.3Mutton and goat 405 764 2.8Pitoneat 101 247 4.0Poultry 153 624 6.3Other, including offal 492 863 2.4
MILK 3 726 5 250 2.5
EGGS 171 519 4.9
HIDES AND SKINS ' 107 222 3.2
WOOL 1 2 3.1
farmers and ensure supplies to meet the require-ments of importing member countries. The EntenteGroup in coordination with OCAMM is settingup an Interstate Meat Board with the same aimsas OCAMM. The continuing regionwide JP 15 anti-rinderpest eradication programme, which has beenunder way for several years, has demonstrated thesuccess of coordinated multinational action to controlanimal disease.
At the national level the priority must continueto be given to animal health measures, notablyprophylactic inoculations against pleuropneumoniaand dipping and spraying programmes for the con-trol of tick-borne diseases. A relatively advancedveterinary programme is operating in Kenya, whichhas well-established animal health and husbandryservices. Most of the major cattle-keeping Africancountries have established institutions providing vet-erinary training to a subprofessional level, whileKenya has a university faculty of veterinaryscience. Generally there is a severe shortage ofprofessional veterinarians and technically trainedcadres, and this is currently being offset as far aspossible by the large numbers of foreign veterinarypersonnel provided under multinational and bilat-eral assistance.
While pilot activities are being undertaken inseveral countries, notably Zambia, to ma.ke tsetse-infested areas safe for cattle raising, it is unfortu-nately apparent that, with existing technology, theeradication of the tsetse fly will be very costly. Duringthe 1970s it is likely that resources and prioritieswill only allow tsetse clearance in selected limitedareas. However, a sustained programme of research,using techniques ranging froni male fly sterilizationto prophylactic immunization, should continue tobe given the highest priority. A breakthrough intsetse eradication would have as great an effect onAfrica as the "green revolution" is having on Asia.
All countries where pastoral cattle keeping isimportant are undertaking programmes to improvetheir husbandry techniques and to increase offtake.In the SalleHan zone of west Africa better rangeutilization is dependent on the provision of watersupplies and the development plans of Chad, Mali,Mauritania and Upper Volta include programmesfor well boring in order to utilize groundwater.
In the east African subregion more attention isbeing given to range management, together withsome stratification of the cattle industry by drawingoff store cattle from the more extensive and lessproductive pastoral areas for finishing with more in-tensive feeding. The development of the ranch sys-tem is noteworthy in Ethiopia, Kenya, Madagascar,Tanzania, Uganda and Zambia, and has involvedconsiderable investment, including IBRD assistance.In addition to providing very considerable increases
118
in beef supply, these schemes will tend to converta largely nomadic society into settled communities.
The expansion of dairy production, particularlyto supply urban centres, has been initiated with anumber of schemes benefiting from the UnitedNations Children's Fund (UNICEF) and World FoodProgramme (vvEr) assistance. Schemes to collectmilk from accessible producers for central treatmentor processing and orderly marketing are well estab-lished in Kenya, Tanzania and Uganda undernational dairy boards, while in Ethiopia a similarscheme is operating to supply milk to Addis Ababa.
Cattle breeds and types are being improved boththrough selection from local stock, such as the Boranof Kenya-Ethiopia, and grading up ranch herdswith Hereford blood, while increased use is beingmade of exotic dairy breeds such as the Friesianin more intensive dairy operations in east Africa.Considerable use is also being made of artificialinsemination in a number of east African countries;deep-frozen semen of improved stock is being madeavailable in Kenya and Madagascar.
The development of more intensive cattle-raisingtechniques involves both farm specialization and theintegration of food and feed crops and animal hus-bandry. In Kenya, where one of the side effects ofthe use of high-yielding cereals has been a sudden sur-plus of maize, a pilot cattle-fattening project todetermine the feasibility and relative advantage ofutilizing this surplus for beef production instead offor export may indicate very interesting prospectsfor an intensive beef cattle industry. Feasibilitystudies for a number of irrigation projects atSokoto (Nigeria), Awash valley (Ethiopia), Mubuku(Uganda) and Pangani-Wami (Tanzania) haveshown that intensive fodder crop production in ahigh output value rotation may be profitable.
Where conditions for expanding the cattle industryare less favourable, particularly in the coastal andtropical zones of west Africa, more attention hasbeen given to promoting the consumption of eggsand poultry meat. Modem commercial poultry pro-duction using exotic hybrid stock has enabled manyAfrican countries to meet increased urban demand.In Ghana and the Western State of Nigeria thegreatly expanded and regular supply of eggs from thenew modern poultry system has resulted in somereduction in market prices from their originally highlevels. A similar development exists in Zambia wherepoultry and egg production increased from 625 000
dressed birds and 1 800 000 dozen eggs in 1964 to7 700 000 dressed birds and 7 800 000 dozen eggsin 1969.
The development of more intensive livestock hus-bandry for fattening beef cattle and improving dairy,pig and poultry production is generally limited byinadequate feed supplies. A great deal of crop

residues and processing by-products suitable foranimal feed are wasted or not fully utilized. Thearowth of agricultural processing industries in anumber of African countries, for example pressingof groundnuts and other oilseeds and cereal mill-ing, is enabling associated livestock feed industriesto be set up. While experiments continue towardthe creation of feed rnixes incorporating locallyavailable by-products such as molasses, increasedWFP supplies would allow earlier trials and the pilotdevelopment of intensive husbandry systems.
Cattle marketing is generally less well developed,particularly for domestic trade. Considerable fundsare being spent on slaughterhouse and cold storagedevelopment. In west Africa, where the traditionalmarketing flows consist of live animals being drivenfrom north to south, the main slaughterhouse de-velopment is in the importing coastal countries.Ivory Coast is planning relatively large modernslaughterhouses and storage plants in the main con-suming areas, with a system of small regional slaugh-terhouses. Ghana has two large modern slaughter-houses and refrigeration plants, one of which iscurrently working at only some 10 percent of capac-ity, and the other at only about 2 percent. Moreefficient use of these plants, perhaps tied in withranch development, would not only increase localmeat supplies but significantly affect retail prices.
In the eastern subregion, slaughterhouse develop-ment is partially linked to the development of exports.Because of sanitary regulations in the importingcountries, the emphasis at present is on processingplants for the production of canned meats and ex-tracts rather than on freezing facilities. In an endeav-our to break into the higher price fresh meat ex-port market, Kenya is considering the establishmentof quarantine areas through which cattle would passprior to slaughter and export, which would satisfythe regulations of the importing countries.
For a number of countries, particularly in theeast African subregion, development of the cattleindustry offers an important means of agricul-tural diversification. Schemes to expand milk andmeat production in Mauritius are aimed at re-ducing the island's heavy dependence on imports.For Ethiopia, Kenya, Madagascar and Tanzania,increased exports of canned meat are making asignificant contribution to foreign exchange earnings.
The importance given to increased meat productionin the African region is reflected in the level of re-sources devoted to it. Multilateral assistance iscurrently approaching $30 million. 1BRD and IDAcredits currently amount to $14.4 million, with afurther $17.0 million of projects being formulated.Current uNDP/rAo Special Fund projects in theregion amount to over $12 million, while the AfricanDevelopment Bank has some $16 million in loan
119
applications for livestock development under consid-eration.
Resources obtained from UNDP have tended tobe heavily weighted toward animal health projects,but range management and development are gettingincreasing attention. The main concentration hasbeen in east Africa, particularly Kenya, accountingfor some 25 percent of UNDP contributions. Outof the $14.4 million in current IBRD and IDA loansand credits, all but $1.2 million are committed to eastAfrica, and nothing as yet to the western subregion,although a number of projects are currently beingstudied. However, recent livestock identification mis-sions have provisionally recommended a number ofprojects in west Africa suitable for IBRD loans, particu-larly for the development of water resources, ranch-ing schemes and the improvement of marketinginfrastructure. Some emphasis is also being givento livestock development in bilateral aid programmes.The United States Agency for International Develop-ment (usAm) has given particular attention to cattledevelopment. France and the European EconomicCommunity (EEc) have provided funds mainly forcountries in west Africa.
WILDLIFE UTILIZATION
The value of African wildlife, as a basis for thetourist industry and as a source of protein food, isbeing increasingly recognized, and there is a growingdesire to undertake improved conservation measuresto protect and enhance this valuable resource. Thereis a perceptible movement toward the practice ofmodern wildlife management, improved harvestingmethods and the marketing of wild animal products.Much of the potential still remains untapped; butwithin the last five years many encouraging develop-ments have taken place. A number of countrieshave improved legislation, formed organizations orgovernmen.t departments responsible for wildlife,created new national parks and reserves, given pro-fessional training to specialized staff and constructedtourist facilities.
Proper planning for the use of this resource ismade difficult by lack of data on the contributionof wildlife to the economy (as food, employment,export earnings, etc.) and its costs (in terms of com-petition for grazing, damage to crops, spread ofdisease, etc.). That the value is considerable is,however, indisputable. In east Africa, where wildlifeattractions are best known and commercially devel-oped, foreign exchange earnings from tourism al-ready make a significant contribution to the economy.For Kenya they were estimated at about $40 millionin 1968, 10 percent of the total export earnings, andare expected to grow by 15 percent annually to $100million (17 percent of the total) by the end of the
new development plan in 1974. Associated localbenefits include a wide variety of employment oppor-tunities, small village industries for tourist trade, andthe sale of higher value food items required by thetourist hotels.
In east Africa, in particular, a considerable in-vestment is being made in the tourist industry. InKenya alone these investments will amount to $18million during the current plan period. Some prog-ress has also been made in west Africa, for instancein Cameroon, but in most cases improved manage-ment of wildlife populations and their habitat isrequired in order to develop the potential of thisresource.
Considerable foreign exchange is also earned bythe export of hides and skins and other animal prod-ucts, and of animals for zoos and for experimentalpurposes. For example, the East African Commu-nity ivory exports annually exceed $1 million. Someof these products are poorly handled and could easilyrealize more income under proper management.
In the meantime, the domestic use of wild animalsan.d their products remains quite considerable, al-though poorly documented. In Botswana and therural areas of Ghana, about 60 percent of the animalprotein consumed annually is estimated to be derivedfrom wildlife. In southern Nigeria the estimatedvalue of game meat sold in 1966 was not less than$50 million. These statistics from west Africa aresurprising considering that many of the larger mam-mals have been virtually eliminated. The intensiveuse of wildlife is largely sustained by several smallerspecies with a high fecundity rate. In several coun-tries game meat is preferred to that of domesticanimals.
For the successful development of wildlife resourcesfor tourism a multinational approach is required.Game does not recognize international boundaries;and protection from excessive hunting and frompoachers requires coordinated action by neighbour-ing countries. Tourist programmes, too, requireplanning to cover wildlife attractions in adjoiningcountries. Another multinational aspect is in thetraining of personnel. The East African College ofWildlife Management at Mweka, Tanzania, has forthe past six years produced competent staffs for thegame departments and national parks administra-tions of the east African and most other English-speaking African countries. A similar wildlife train-ing institution, to cater for French-speaking per-sonnel, has recently been opened at Garoua, Cam-eroon.
The systematic utilization of wildlife for meat andother products involves the harvesting of wildlife ona basis comparable to that for domestic stock. Thistype of wildlife utilization has been in progress ineast and central Africa and it seems to offer good
120
economic possibilities, particularly in the arid andsemiarid areas not now used by, or unsuitable for,domestic stock.
Game farming of wildlife in semidomesticatedconditions is also of potential value, as demonstratedby the Sambar deer of Mauritius, the hippopotamiof Uganda and eland in a number of countries.UNDP assistance is now being sought to examine thefeasibility of husbanding mixed herds of livestockand certain selected species of wildlife. Problemsarise, however, from the ever-increasing pressure onthe land. Fortunately wildlife areas can often beallocated on land that is not very productive from anagricultural or forestry point of view, including areaswhich are at present infested with the tsetse fly orotherwise unsuitable for domestic livestock. Ex-perience in North America indicates that nationalparks and other wildlife areas can be a sound invest-ment. This is already true in certain parts of Africa,for example Nairobi park, and will undoubtedlybe more so as increasing numbers_of tourists visitwildlife areas.
Development plans and policies
During 1969, 8 African countries (Algeria, Ken-ya, Madagascar, Malawi, Niger, Senegal, Swazi-land and Tanzania) announced new plans for eco-nomic development (see Table II-56) and 15 othercountries 48 are reported to be either revising theirplans or formulating new ones. The share of agri-culture in total planned investment under the newplans varies widely, though most commonly it isof the order of 20 to 25 percent. Most of them shownot only absolute increases in planned investmentfunds allocated to agriculture, but also in the rela-tive share of agriculture in total and public develop-ment expenditure. An exception is Kenya, wherethe share has dropped from 26 to 21 percent. Aparticularly large increase in the share of agriculturalinvestment in the total was reported in Madagascar,where it doubled to 24 percent. In Tanzania, whilepublic sector finance for agriculture is increasedfrom 14.5 to 23 percent, gross fixed agriculturalcapital formation is planned at 13.8 percent com-pared with 15.8 percent in the first plan. A muchsmaller proportion of annual budgets is generallyallocated for recurrent expenditure on agriculture;it rarely exceeds 10 percent, accounting more gener-ally for 3 to 6 percent of the total. In the case ofone major agricultural country, the share is as lowas 2.6 percent.
" Cameroon, Central African Republic, Chad, Dahomey. Gabon,Ghana, Ivory Coast, Lesotho, Mauritius. Niger, Sierra Leone,Togo, Uganda. Upper Volta and Zambia.
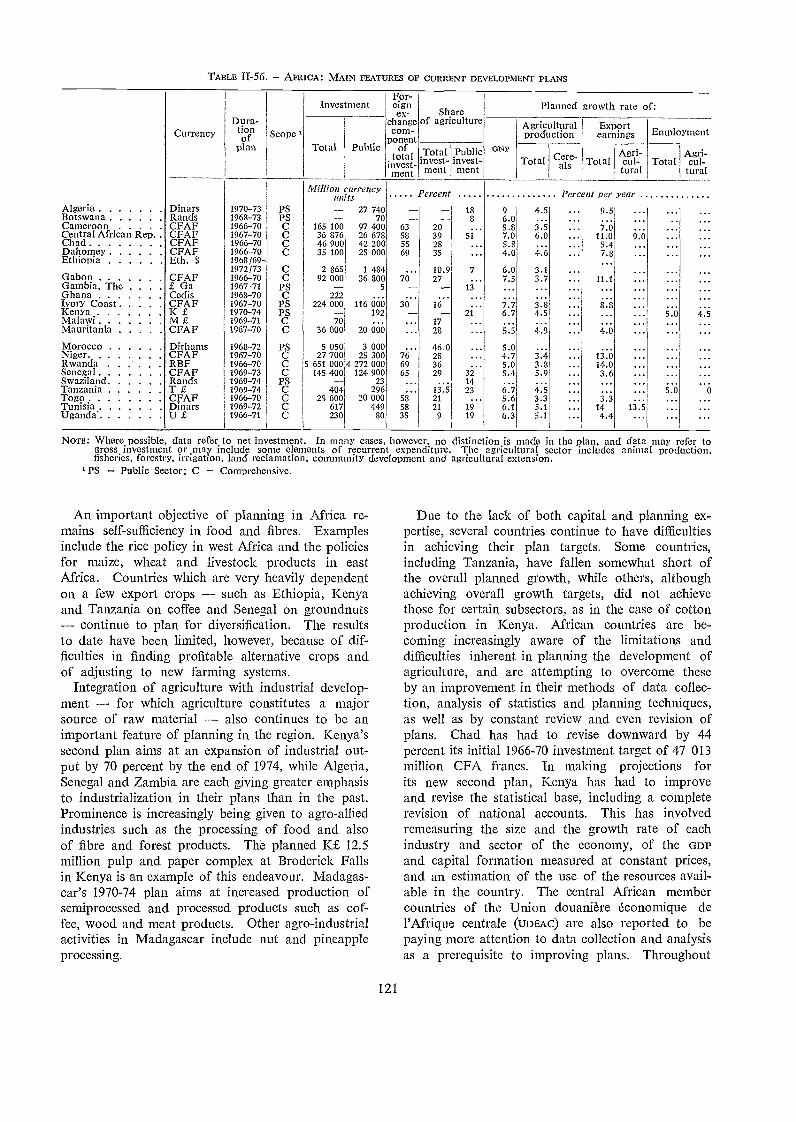
NoTE: Where possible, data refer to net investment. In ma ly cases, however, no distinction is made in the plan, and data may refer togross investment or may include some elements of recurrent expenditure. The agricultural sector includes animal production,fisheries, forestry, irrigation, land reclamation, coffununity development and agricultural extension.
PS - Public Sector; C = Comprehensive.
An important objective of planning in Africa re-mains self-sufficiency in food and fibres. Examplesinclude the rice policy in west Africa and the policiesfor maize, wheat and livestock products in eastAfrica. Countries which are very heavily dependenton a few export crops - such as Ethiopia, Kenyaand Tanzania on coffee and Senegal on groundnuts- continue to plan for diversification. The resultsto date have been limited, however, because of dif-ficulties in finding profitable alternative crops andof adjusting to new farming systems.
Integration of agriculture with industrial develop-ment - for which agriculture constitutes a majorsource of raw material - also continues to be animportant feature of planning in the region. Kenya'ssecond plan aims at an expansion of industrial out-put by 70 percent by the end of 1974, while Algeria,Senegal and Zambia are each giving greater emphasisto industrialization in their plans than in the past.Prominence is increasingly being given to agro-alliedindustries such as the processing of food and alsoof fibre and forest products. The planned K. 12.5million pulp and paper complex at Broderick Fallsin Kenya is an example of this endeavour. Madagas-car's 1970-74 plan aims at increased production ofseiniprocessed and processed products such as cof-fee, wood and meat products. Other agro-industrialactivities in Madagascar include nut and pineappleprocessing.
121
Due to the lack of both capital and planning ex-pertise, several countries continue to have difficultiesin achieving their plan targets. Some countries,including Tanzania, have fallen somewhat short ofthe overall planned growth, while others, althoughachieving overall growth targets, did not achievethose for certain subsectors, as in the case of cottonproduction in Kenya. African countries are be-coming increasingly aware of the limitations anddifficulties inherent in planning the development ofagriculture, and are attempting to overcome theseby an improvement in their methods of data collec-tion, analysis of statistics and planning techniques,as well as by constant review and even revision ofplans. Chad has had to revise downward by 44percent its initial 1966-70 investment target of 47 013million CFA francs. In making projections forits new second plan, Kenya has had to improveand revise the statistical base, including a completerevision of national accounts. This has involvedremeasuring the size and the growth rate of eachindustry and sector of the economy, of the GDPand capital formation measured at constant prices,and an estimation of the use of the resources avail-able in the country. The central African membercountries of the Union douanière économique del'Afrique centrale (upEnc) are also reported to bepaying more attention to data collection and analysisas a prerequisite to improving plans Throughout
For-Investment eign
ex- Share Planned growth rate of:
CurrencyDura-ti
of Scope 'changecom-
ponent
of agriculture Agriculturalproduction
Exportearnings Employment
plan Total Public oftotal
invest-ment
Totalinvest-ment
Publicinvest-ment
GNPTotal Cere-
als TotalAgri-cul-tural
TotalAgri-cul-tural
Million currencYun'ts Percent Percent per year
Algeria Dinars 1970-73 PS - 27 740 - - 18 9 4.5 ... 9.5 ...Botswana Rands 1968-73 PS - 70 - - 8 6.0 . .. ... ...Cameroon CFAF 1966-70 C 165 100 97 400 63 20 ... 5.8 3.5 ... 7.0 .Central African Rep CFAF 1967-70 C 36 876 26 678 53 39 51 7.0 6.0 11.0 9:0Chad CFAF 1966-70 C 46 900 42 200 55 28Dahomey CFAF 1966-70 C 35 100 25 000 69 35Ethiopia Eth. $ 1968/69-
1972/73 C 2 865 1 484 ... 10.9 7 6.0 3.1 ... ...Gabon CFAF 1966-70 C 92 000 36 800 70 27 ... 7.5 3.7 ... 11.1 ... ...Gambia, The . . . . £ Ga 1967-71 PS - 5 - - 13 ... ... ... ... ...Ghana Cedis 1968-70 C 222
'... ... ... ... ... ... ...
Ivory Coast CFAF 1967-70 PS 224 000 116 666 36 16 ::: 7.7 3.8 . 8.8 ...Kenya K £ 1970-74 PS - 192 - - 21 6.7 4.5 ... 5.0 4.5Malawi M £ 1969-71 C 70 ... 17 ... ... ... ... ... ... ...Mauritania CFAF 1967-70 C 36 000 20 666 28 ... 5.5 4.9 4.0 ... ...Morocco Dirbarns 1968-72 PS 5 050 3 000 ... 46.0 . ...Niger. . CFAF 1967-70 C 27 700 25 300 76 28 ... 4.7 3.4 ... 13.0 ... ...Rwanda RBF 1966-70 C 5 651 000 4 272 000 69 36
.
.. 5.0 3.8 14.0Senegal CFAF 1969-73 C 145 400 124 900 65 29 32 5.4 5.9 3.6 ... ...Swaziland Rands 1969-74 PS - 23 ...... 14 14 ... ... ... ... ... ...Tanzania T £ 1969-74 C 404 296 ... 13.5 23 6.7 4.5 ... .
.... 5.0 o
Togo CFAF 1966-70 C 28 600 20 000 58 21... 5.6 3.3 3.3 ...... ...
Tunisia Dinars 1969-72 C 617 449 58 21 19 6.1 5.1 ... 14 13.5Uganda' U £ 1966-71 C 230 80 35 9 19 6.3 5.1 ... 4.4 ...
TABLE II-56 - AFRICA: MAIN FEATURES OF CURRENT DEVELOPME P ANS
the region, however, there is still a need to streng-then planning institutions. A move in this direc-tion is the setting up of economic planning unitsin at least six ministries of agriculture, while severalother countries are considering doing so.
Regional planning has become an important tech-nique for spreading national wealth more evenlywithin a country. Tanzania has devised regionalplanning units, and a plan for the social and eco-nomic development of the Mwanza region has beenformulated as part of the second plan, to make theimplementation of the latter more effective. Kenyahas also established regional planning units for theformulation and implementation of regional projectswithin the national plan, while Ivory Coast hasestablished a development commission for the centralregion. These are only a few of the many examplesof endeavours to decentralize planning in order topromote wider participation and particularly tosecure more effective implementation.
For many African countries first priority is stillgiven to the development of economic and socialinfrastructure which continues to receive the majorshare of development financing, and provides majorindirect benefits also for agriculture. A survey ofinfrastructure requirements of the Shashi complexin Botswana is an example, and the dam construc-tion at Trip in the Democratic Republic of the Congois another. The Kossou dam in Ivory Coast isanother venture that will affect agricultural develop-ment, including animal husbandry and fishing, aswell as providing hydroelectric power. A major aimof Madagascar's 1970-74 plan is the improvement ofthe country's infrastructure, emphasis being given toproduction zones.
Basic infrastructural services such as roads, rail-ways, harbours and airways have been allocated 46percent of the total development expenditure inKenya. Tanzania is undertaking the developmentof an extensive system of trunk and network roads(including the Tanzania railway project being under-taken by Mainland China), while Senegal and Algeriaare also investing heavily in roads, harbours andairports. The planned construction in Algeria of aroad from El Golea to In Salah (which will takemost of the 300 million dinars allocated to roadbuilding) will establish a link between Algeriaand Africa south of the Sahara and promote intra-regional trade and facilities for tourism. Malawi'snew plan also emphasizes infrastructure development,and ME 31 million (44 percent) are to be spenton rail and road development. Most of this willbe used to build a 270-kilometre road from Zombato Lilongwe, and a 200-kilometre road from Mau tonear Monkey Bay; ME 14.3 million are to be allo-cated to the development of railways and rollingstock.
122
While tackling the postwar problems of rehabili-tating the damaged areas of the country, Nigeria hascommenced longer term development planning toestablish a national framework which will take intoaccount the varying priorities of each state and en-sure that their programmes are properly coordinatedand integrated within one national reconstruction anddevelopment plan. It is estimated that Nigeria willneed a total fixed investment of EN 1 825 million duringthe next five-year plan period, of which about 60percent will be invested in the public sector. Thisinvestment is expected to produce an overall growthrate of 6 percent in the GDP which, based upon apopulation growth rate not exceeding 2.5 percent,should ensure an increase in per caput annual in-come from EN 25 in 1970 to EN 98 by the end ofthe next five-year plan. These assumptions relyupon a projected investment coefficient of 18
percent of GDP and a capital/output ratio of 3:0.
FOREST POLICIES
Africa's natural forest resources, although stilllarge, are rapidly dwindling. Uncontrolled shiftingcultivation continues to destroy forests at the annualrate of 8 million hectares, and, with the growthof population, the problem is continually gettingworse.
Forest fires pose a serious problem especially inthe dry savan.na and steppe areas. Some furthersteps such as the delineation of forest areasreinforced with appropriate legal instrumentshave been taken by a number of countries, includingEthiopia, Ivory Coast, Mali and Senegal, to preserveand protect areas most suited to forest productionand to replenish stocks by regeneration and affor-estation. Mauritania and some other countrieshave devoted special attention to forest fires, but inmost countries the high cost of fire control is a hand-icap. In 1969 approximately 80 000 hectares wereadded to the existing 1.3 million hectares of forestplantations in east Africa. Such man-made forestsin that area usually enjoy good fire protection throughan effective system of firebreaks and warning, andthe application of modern equipment.
In a number of west African countries increasingattention is also being given to ensuring the availa-bility of logs over the longer term, and the sup-ply of raw materials to domestic industries. Theneed to increase exports of processed forest productsof a higher unit value and to utilize more fully thelesser known species are also increasingly recog-nized. To this end, Ivory Coast announced its inten-tion to limit the annual cut of a number of speciesand to raise export taxes on logs on 1 Jan.uary 1970.Cameroon will also tax log exports more heavily,
while the Democratic Republic of the Congointen.ds to divert logs from export to its own process-ing industries. It will be some time, however, be-fore the effects of these measures on total Africanlog availability can be gauged.
Regional economic cooperation
Political interest in subregional cooperation con-tirtues. In general, however, efforts are character-ized more by a search for economically meaningfuland politically cohesive groupings and forms of or-ganization than by the implementation of concretemeasures. At the end of 1969 there were at least40 official bodies set up to promote multinational in-terests in widely varying fields and excludingthe 3 major river basin commissions which havecontinued their fruitful work at least 9 of these canbe considered as having broad economic and politicalintegration goals. Studies of the possibilities forpromoting subregional trade and cooperation arebeing undertaken by the United Nations EconomicCommission for Africa, and reports covering eachof the four major subregions are expected to be pub-lished in 1970.
One of the most cohesive groupings within the re-gion is the former Organization of African and Ma-lagasy States (ocAm), renamed at the conferenceheld in January 1970 after the joining of Mauritiusthe Joint Afro-Malagasy and Mauritian Organization(ocAmm). Two of the decisions taken at the confer-ence are of particular interest because they offerfurther evidence of the search for forms of regionalcooperation on the basis o f individual commodities,pending the completion of more comprehensivearrangements. Thus, the member countries of OCAMMagreed that Niger should convene a meeting of ex-perts to draw up arrangements for the launching in1971 of the Africart and Malagasy Meat Plan, withthe objectives, inter alia, of boosting meat production,stabilizing and rationalizing the meat trade amongmember countries, establishing price levels to encour-age production, and ensuring the availability ofsupplies to meet the needs of the meat-importing mem-ber countries. Some important changes were also
123
made in the Organization's sugar agreement establish-ed in 1966. In particular, it was decided that theimporting members would henceforth purchase 80percent of their sugar from other OCAMM countries,rather than 70 percent as hitherto.
Another example of regional cooperation on a com-modity basis was the meeting in September 1969of 13 west African countries interested in expandingtheir rice production, to discuss possibilities for co-operation in research and development activities.The meeting was supported by UNDP, FAO, countriesinterested in providing bilateral assistance, and foun-dations. At this meeting it was agreed that a WestAfrica Rice Development Association (wARDA) shouldbe established following a preliminary study and rec-ommendations to be made with UNDP/FAO assistance.
The new customs union agreements of Botswana,Lesotho and Swaziland with South Africa came intooperation in March 1970, but were backdated toApril 1969. Taking recent trade patterns as a guide,the agreement will mean that Botswana, Lesotho andSwaziland will receive a much larger, and SouthAfrica a smaller, share of the duty revenues thanthey did under the old agreement. Under the newagreement Botswana, Lesotho and Swaziland butnot South Africa may levy additional duties onimports to meet competition from other manufactur-ers in the common customs area in order to protectinfant industries.
In the meantime, cooperation between variousAfrican groupings and EEC is being further strength-ened. it is true that the Arusha Convention be-tween the East African Community and EEC, signed inSeptember 1969, is still awaiting ratification. Butnegotiations have already started for the progressiveutilization of the $918 million of financial assistanceto be made available for the ocAmm countries by theEuropean Development Fund and the EuropeanInvestment Bank under the renewed Yaoundé Con-vention of May 1969. Moreover, a partial associa-tion agreement between Tunisia and Morocco andEEC, signed in March 1969, came into effect the fol-lowing September, permitting Tunisian and Moroc-can industrial products imported into EEC countriesto receive certain advantages, such as tax exemptionand reduced import duty.
Chapter III. - AGRICULTURE AT TT-IE THRESHOLDOF ThI SECOU DEVET C 3MENT DECADE
The year 1970 provides an appropriate opportunityto take stock of the past performance of agricultureand look at future prospects. It is now a quarterof a century since FAO was founded at the end ofthe second world war. The Second United NationsDevelopment Decade is about to be launched. Agri-culture in the developing countries appears to havereached a crucial turning point. Moreover, a wealthof new material is at hand for the examination offuture prospects, especially through the ProvisionalIndicative World Plan for Agricultural Develop-ment (iwl)), published at the end of 1969, and thework being done on the strategy for the SecondDevelopment Decade. The situation and prospectsfor world agriculture have just been discussed inthe very wide forum of the Second World Food Con-gress, held at The Hague in June 1970.
During such a long period as 25 years there havenaturally been numerous changes in the food andagriculture situation. On the broadest plane, therehave been at least two major swings in the generalprospects for the future. At the end of the warthere was widespread confidence that the intensiveapplication of modern technology could quickly solvethe food and agricultural problems of the develop-ing countries. Indeed, for a few years the recoveryfrom wartime devastation brought a very rapid in-crease in agricultural production in these countries.But this was soon succeeded by a long period ofdisappointingly slow progress. Not only did theincrease in agricultural production slow down, butthere was a sharp acceleration in population growthto rates unknown before anywhere in the world.In many developing countries the increase in foodproduction failed to match the growth of populationand in still more it fell behind the demand for foodat constant prices, which resulted in a combinationof increased prices and increased imports. At thesame time, nutritional studies increasingly revealedthe extent to which the effective demand for foodfailed to cover the nutritional needs of the poorerpopulation groups.
This period of slow progress lasted a long time,culminating in the very poor harvests of 1965 and1966, when in several countries disaster was onlynarrowly averted by massive food aid. Since then
125
there has been a rapid recovery, which seems tohold out the possibility of a more adequate and sus-tained growth of food production in the developingcountries. In a number of them, mostly in Asia,a major transformation of food production is underway, mainly as a result of the introduction of thenew high-yielding varieties of cereals, coincidingwith an enhanced government commitment to agri-culture and with the emergence of a progressive classof farmers in response to the long years of develop-ment effort. The main questions now are whetherand how soon this transformation can be extendedto other countries and other crops, whether the"second generation" problems inevitably stemmingfrom a major innovation can be satisfactorily dealtwith, and whether the protein supplies that are sovital for the development of young children can beincreased at a rate not too far behind the increasein calorie supplies.
The problems of agricultural development havebeen studied more closely than ever before duringthe past 25 years. To a greater or lesser degreeagricultural development is now "plann.ed" in almostall of the developing countries, as part of an overallplanning of the national economy. Much has beenlearned both about the crucial role of agriculturein the process of development and about the specialdifficulties of achieving rapid progress in this tradition-bound sector.
Greater appreciation of the essential contributionsof agriculture has in the last few years brought amore balanced approach to economic developmentin some of those countries which had hitherto thoughtthat rapid industrialization could be achieved withouta sound agricultural base. It seems likely that inthese countries the agricultural sector will now beable to come nearer to playing its full potential rolein their development
In at least one of agriculture's essential contribu-tions, the earning of foreign exchange, such increasedcommitment by the domestic government, however,is not sufficient by itself. Better access to the mainimport markets in high-income countries and theorganization of world commodity markets, two ofthe main needs, obviously depend on intergovernmental agreement and cooperation. This is an area
in which progress has been distressingly slow, espe-cially in relation to the high hopes entertained atthe time of the Havana Charter negotiations justafter the end of the war.
A major lesson of agricultural development duringthe postwar period is that technology by itself isnot enough. It is first of all necessary that inputsupplies, credit and extension advice are availableto give farmers the knowledge and the physicalpossibility to make use of a given technological im-provement. This is difficult enough, especially inview of the limited resources of finance and of ad-ministrative as well as technical skills in develop-ing countries. But the second essential is even moredifficult to provide. In addition to the physicalpossibility of increasing production, farmers needthe incentive to do so. This has implications forsuch complex fields as land tenure, marketing, andprice and taxation policy.
While the need for a suitable economic, socialand institutional environment for farmers is nowgenerally well recognized, it remains very difficultto achieve in practice. Institution-building is a veryslow process it is probable that the recent upsurgein agricultural production in some of the countriesof the Far East is in large part due to the cumulativeeffect of many years of institution-building, whichensured that sufficient farmers were both able andwilling to make good use of the new high-yieldingseeds when they became available. As already men-tioned, it makes heavy demands on scarce govern-ment resources. Some aspects, such as land reform,come up against powerful vested interests, so thatthere are few examples of their fully successful imple-mentation during the postwar period.
In addition to these factors in the sphere of do-mestic governments, there are perhaps three principalfeatures of the wider scene that have particularlyinfluenced agricultural development during the pastquarter century, and will continue to do so duringthe Second Development Decade and most likelybeyond. These are the unparalleled growth of popu-lation in the developing countries, the equallyunparalleled rate of technological change, and thepostwar phenomenon of development assistance.
The population of the developing countries isnow r;sing by 2.6 percent a year, which means itdoubles in 27 years, and in a number of countries,especially in Central America, the annual growthis not much less than 4 percent. In recent yearsthe failure of food production in so many develop-ing countries to forge steadily ahead of populationgrowth has been the main reason for the increasinglywidespread conviction of the need for populationcontrol, and for making family planning informationartd facilities available for those who wish to makeuse of them. During the Second Development De-
126
cade and for some time after that, if the hoped foreasing of the food situation is accomplished, prob-lems of unemployment an.d underemployment arelikely to become the main difficulties caused by therapid population growth in the developing countries.These new problems could even place in jeopardythe achievement of the recently improved food pro-duction possibilities.
Another lesson of the last few years is that prob-lems such as employment are not necessarily takencare of simply by naaximizing the growth of thenational income. More attention is now being paidto the need to secure a more equitable distributionof income-earning and employment opportunities.This is particularly important in the agriculturalsector, where modern technology can easily widenthe gap between large and small farmers.
Although, as already noted, technological improve-ments have to be strongly backed up by improvementsin the economic, social and institutional fields, it isnevertheless further technological progress that offersthe main hope of coping with the problems posedby rapid population growth. Indeed, it is mainlythe technological breakthrough represented by thehigh-yielding varieties of cereals which is responsiblefor the present welcome breathing space in the long-standing food crisis.
Most of the remarkable techn.ological progress ofthe past 25 years, and much of that accumulatedbefore then, has still had its principal or even itsonly applicatiort in the industrialized countries. Manyimprovements in agricultural technology are tailoredto the labour-scarce economies of these countries,or are otherwise unsuitable for use by small farmersin developing countries. A major need during theSecond Development Decade is to follow up thehighly successful example of the high-yielding cerealvarieties with a massive research effort specificallydirected to the problems of the developing countries.
It is the use and abuse of modern technology,combined with the population explosion, that llavemainly given rise to the worsening pollution anddegradation of the human environmen(;,which llavebegun to arouse considerable concern in the lastfew years. This is an area where the developingcountries can learn much from the mistakes made bythe industrialized countries.
Finally, development assistance has been a uniqueproduct of the postwar period. A sizable networkof bilateral and multilateral programmes has grownup for the provision of technical, financial and mate-rial assistance to the developing countries. Thefood surpluses of the developed countries have givenrise to a new form of aid. The spectrum of aiddonors has also been broadened to include voluntarygroups as well as governments and intergovernmentalorganizations, for example through the Freedom
from Hunger Campaign. Developing countries aremaking stronger efforts to help one another, espe-cially through subregional schemes for economiccooperation. Many recommendations to improvethe effectiveness of the whole international develop-ment effort have recently been made in the Pearsonand Jackson reports, and the Second United NationsDevelopment Decade will be a crucial test for thisinternational effort.
The purpose of this chapter is to examine some ofthe main aspects, as summarized above, of the posi-tion and problems of agriculture in the developing
A full-scale historical review of agricultural de-velopment since the second world war is beyond thescope of a single chapter in The state of food andagriculture, especially if it is to leave room for alook at the future as well. Moreover, much of thepostwar period has already been reviewed at lengthin previous issues of this report.' Only a brief ac-
When the performance of agriculture in the de-veloping countries is considered, stress is most com-monly placed on aspects suggesting relative failure.Indeed, many facts can be marshalled to supportsuch a view. In per caput terms, there has beenlittle increase in food production in the developingcountries as a whole. Their food imports havetherefore risen steeply, and their previous net ex-port of cereals has turned into a large net import.Even so, there has been only limited improvementin food consumption and nutrition, and rising foodprices have been a source of inflation in many coun-tries, or have necessitated stringent controls. Al-though a large part of the increase in food importshas been on concessional terms, involving the useof little or no foreign exchange, at least un.til re-cently commercial food imports have grown atsuch a rate as to affect the ability of the develop-ing countries to import other urgently needed goods.This has been made all the more serious by the failureof their agricultural export earnings to rise rapidly.Agriculture has thus in many cases acted as a dis-tin.ct brake on development. While the technicallevel of farming has steadily improved, the long-awaited technological breakthrough, which would
' The first postwar decade was reviewed in The state of food andagriculture 1955, and the second in The state of food and agricul-ture 1965 (FA°, Rorne, 1955 and 1965).
127
countries at the threshold of the Second Develop-ment 'Decade. Although the developed countrieshave their own agricultural problems, the chapteris confined to the developing countries, which arethe focus of the Development Decade. After abricf review of postwar trends, four problem areas(food crop production, livestock production, agri-cultural export earnings, and rural employment)are discussed in some detail. A concluding sec-tion looks at some of the principal implicationsof these problems for domestic policies and alsofor international cooperation.
POSTWAR TRENDS
count is therefore presented here: first of the perfor-mance of agriculture in developing countries in respectof production, trade, incomes and nutrition, secondof the progress of agricultural technology, and thirdof some of the main policy approaches that havedetermined the development efforts of national gov-ernments and the international community.
Performance of agriculture in developing countries
fundamentally alter production prospects, has startedonly recently and so far in only a few countries.Moreover, the developing countries remain unableto cope with the major harvest failures that occurfron-i time to time as a result of bad weather, andthese have thus led to severe food emergencies,calling for massive international assistance.
Agricultural production
In view of such trends, it is hardly surprising thatso much of the postwar discussion of the agriculturalsituation in developing countries has been colouredby pessimism. Yet a look at the record of productiongrowth suggests that not all has been failure. Tak-ing all the developing countries together, total agri-cultural production has expanded over the pasttwo decades or so (1952-54 to 1967-69) at an annualaverage rate of 2.9 percent. This has been a credit-able performance both historically (no other periodis known when such a rapid growth of agriculturalproduction was shown by any large number of coun-tries) and in comparison with the developed countries,whose agricultural production rose no faster.
Moreover, these figures refer only to crop andlivestock production; the performance of the smallerbut nonetheless important fishery and forestry sec-

tors has been particularly impressive. Fish produc-tion has increased by some 9 percent a year for twodecades (1948-52 to 1967-69) although, especiallyin Latin America and Africa, much of the expansionhas been for industrial uses and so contributes onlyindirectly to the food supply. As regards the growthof forestry production in the developing countries,there has been a very rapid increase in their output ofhigh-value products such as plywood (9 percent ayear between 1954-56 and 1967-69), pulp (16 percent),and newsprint (18 percent).
There are a number of reasons why the overallpicture is nevertheless one of relative failure. Oneis the uneven performance as between individual
128
countries - in a number of countries, includingsome of the larger ones, agricultural productionhas increased very slowly. Another is the urteven per-formance over time - while production increasedrapidly in the recovery period immediately after thesecond world war and has done so again with therecovery from the widespread bad harvests of 1965and 1966, there was a long period in between whenoverall progress was extremely slow. Most importantof all is the rapid and in many countries still acceler-ating growth of population, which in per caput termshas often largely wiped out the production gains.
The basic long-term trends are evident from Fig-ure TH-1, which shows the postwar (1952-54 to
TABLE - AVERAGE ANNUAL GROWTFI OF AGRICULTURAL PRODUCTION IN 75 DEVELOPING COUNTRIES COMPARED WITH'FHE LEVEL OF GDP PER CAPUT AND WITH THE RATE OF GROWTH OF GDP
1966. - 1965. 7 '1955-66.-
" 1958-67. - ° 1958-65. - ° 1955-63. - 1963. - " 1957-66. - ° Excluding Libya and Venezuela. -'° 1958-1963. - " 1958-66. - " 1955-64.
Averageannual
growth ofagricultural
Per caputGm" at
factor cost
Averageannualgrowth
Averageannual
growth ofagricultural
Per caputGDP at
factor
Average]annualgrowth
production'1952-54to 1967-69
in 1967 Of GDP,1955-67
production,1952-54
to 1967-69
costin 1967 Of GDP.1955-67
Percentper year U.S . dollars Percent
per yearPercentper year U.S. dollars Percent
per yearEcuador 6.3 218 4.5 Iraq 2.9 '390 06.8Ivory Coast 6.1 '223 ... Ethiopia 2.9 '61 ...Upper Volta 5.7 '44 ...Venezuela 5.5 935Nicaragua 5.4 339 5.4 COUNTRIES ABOVE AVERAGE
RATE OF GROWTH OF AGRI-CULTURAL PRODUCTION . . 4.1 "221 5.3
Sudan, The 5.2 '91 '4.32.9 0212 4.6Cyprus
Mexico5.15.0
670520
'5.56.3
AverageGuatemala 4.8 285 5.1Thailand 4.6 140 6.2 COUNTRIES BELOW AVERAGE
RATE OF GROWTH OF AGRI-CULTURAL PRODUCTION . . 1.5 200 3.5
Bolivia 4.5 176 4.2Malawi 4.4 50 63.2Costa Rica 4.3 394
.Colombia 2.8 '313 4.4
Korea. Rep. of 4.3 146 6.3 Pakistan 2.8 123 4.8Niger 4.3 082 ... Saudi Arabia 2.7 '227 ...
Malaysia: Sarawak . 2.7 '251 ...Paraguay 2.5 211 3.7
Malaysia: West 4.2 '283 '5.2Cameroon 4.2 '126 ... Peru 2.5 263 "6.0Senegal 4.2 '195 Jamaica 2.5 493 ...Honduras 4.1 226 5.1 Afghanistan 2.5 755 ...Libya 4.1 1 062 . Syria 2.5 212 ...
Morocco 2.4 172 2.0
Rhodesia 4.1 222 4.6 India 2.4 '81 '3.4El Salvador 4.0 261 Burma 2.2 63 3.9Panama 4.0 553 7.0 Guinea 2.2 '96 ...Ghana 4.0 231 Chile 2.1 539 4.5China (Taiwan) 3.9 238 8.5 Dominican Republic . 2.0 251 3.9
Indonesia 1.8 '94 '18Iran 3.8 287 Nigeria 1.8 '75 "5.6Brazil 3.7 '273 '5.0 Chad 1.7 '69 ...Kenya 3.7 111 ... Argentina 1.5 0758 3.0Mozambique 3.7 '68 Dahomey 1.4 '69 ...Gambia, The 3.6 '85 ...
Mauritius 1.4 225 ...Southern Yemen 1.2 "194 ...
PhilippinesSomaliaTurkey
3.53.53.4
259'65315
'4.4"'5.8
LesothoYemenCuba
0.90.30.2
'78......
...
...
...Malaysia: SabahUganda
3.43.4
'28787
...3.7 Nepal
Tunisia0.20.2
94186
...
...Barbados 0.1 '383 ..Haiti 79 1.6Cambodia 3.3 '127 ...
Madagascar 3.1 103 Botswana - 0.1 '94 .. .Guyana 3.0 '309 Congo, Dem. Rep, of the . - 0.2 '96 ..United Arab Republic . . . 3.0 '167 '5.7 Uruguay - 0.3 '551 00.6Ceylon 3.0 140 3.6 Algeria - 0.8 '203 ...
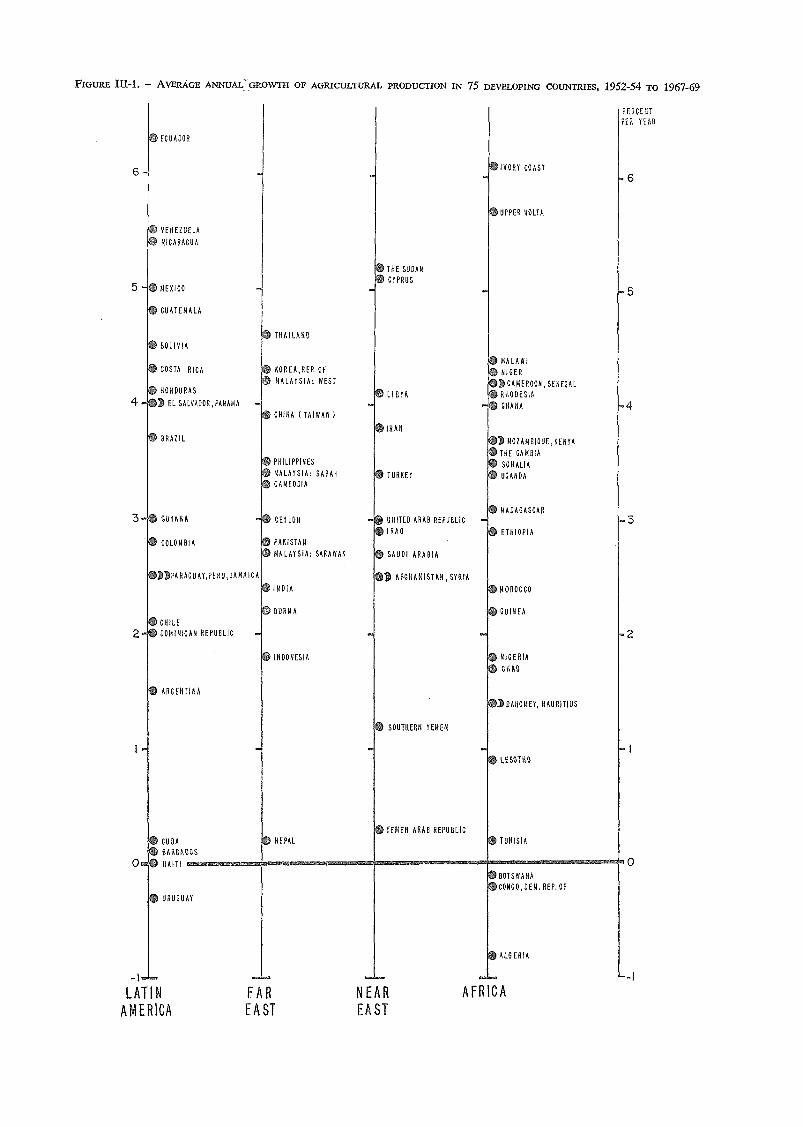
FIGURE AVERAGE ANNUAL-GROWTH OF AGRICULTTJRAL PRODUCTION IN 75 DEVELOPING COUN'TRIES, 1952-54 TO 1967-69
ECUADOR
VENEZUELA
CARAGUA
EXICO
GUATEMALA
BOLIVIA
COSTA RICA
HONDURAS
EL SALVADOR, PANAMA
BRAZIL
GUYANA
CHILE
DOMINICAN REPuBLIC 2
ARGENTINA
CUBA
e BARBADOS
AITI
ARAGU AY, PERU ,JAMA ICA
URUGUAY
NAILAND
KOREA,REP. Of
NALAYSI A: WEST
CHINA I TAIWAN /
PHILIPPINES
1ALAYSIA: SABAH
CAMBODIA
I AFGHANISTAN, syRIA,
INDIA S MOROCCO
BURMA S GUINEA
INDONESIA
EPAL
THE SUDAN
CYPRUS
I BOA
RAN
TURKEY
SOUTHERN YEMEN
REMEN ARAR REPUBLIC
IVORY COAST
UPPER VOLTA
MALAWI
NIGER
St CAMEROON , SENEGAL
RHODESIA
GHANA
1110ZAMBIQUE,KENYA
THE GAMBIA
SOMALIA
UGANDA
A DAGASCAR
CEYLON 1A UNITER ARAB REPUBLIC
IRAQ ETHIOPIAONBIA 110 PAKISTAN
ALAYSIA: SARAWAK S SAUDI ARABIA
NIGERIA
CHAD
DAHOMEY, HAURITIUS
LESOT1i0
....' BOTSWANA
CONGO, OEM. REP. OF
A LG ERIA
o
LATIN FAR NEAR AFRICA
AMERICA EAST EAST
PERCEUT
PER YEAR
6
5
4
3
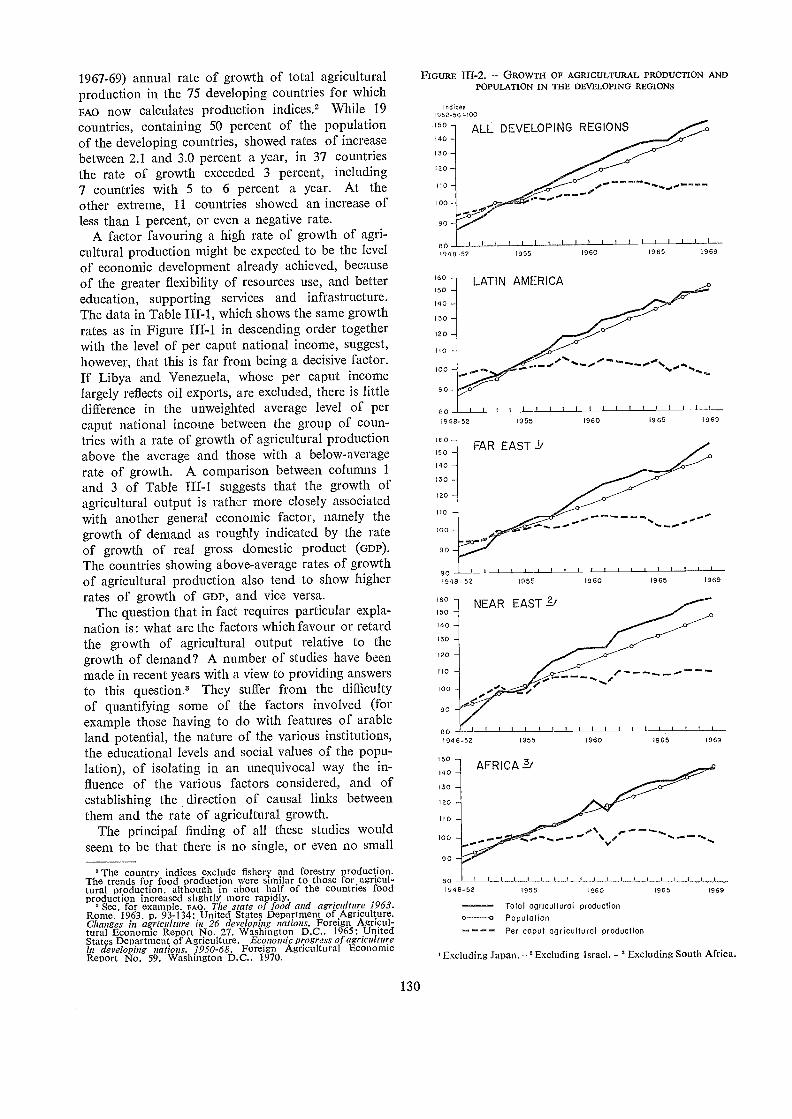
1967-69) annual rate of growth of total agricultural FIGURE 1H-2. GROWTH OF AGRICULTURAL PRODUCTION AND
production in the 75 developing countries for whichFAO now calculates production indices.' While 19countries, containing 50 percent of the population 50 ALL DEVELOPING REGIONSof the developing countries, showed rates of increase 140
between 2.1 and 3.0 percent a year, in 37 countries 130
the rate of growth exceeded 3 percent, including 120
7 countries with 5 to 6 percent a year. At theother extreme, 11 countries showed an increase ofless than 1 percent, or even a negative rate.
A factor favouring a high rate of growth of agri-cultural production might be expected to be the levelof economic development already achieved, becauseof the greater flexibility of resources use, and better 160
150
education, supporting services and infrastructure. 140
The data in Table ITT-1, which shows the same growth 130
rates as in Figure 111-1 in descending order togetherwith the level of per caput national income, suggest,however, that this is far from being a decisive factor.If Libya and Venezuela, whose per caput incomelargely reflects oil exports, are excluded, there is littledifference in the unweighted average level of percaput national income between the group of coun-tries with a rate of growth of agricultural productionabove the average and those with a below-averagerate of growth. A comparison between columns 1and 3 of Table Iff-1 suggests that the growth ofagricultural output is rather more closely associatedwith another general economic factor, namely thegrowth of demand as roughly indicated by the rateof growth of real gross domestic product (GDP).The countries showing above-average rates of growthof agricultural production also tend to show higherrates of growth of GDP, and vice versa.
The question that in fact requires particular expla-nation is: what are the factors which favour or retardthe growth of agricultural output relative to thegrowth of demand? A number of studies have beenmade in recent years with a view to providing answersto this question.° They suffer from the difficultyof quantifying some of the factors involved (forexample those having to do with features of arableland potential, the nature of the various institutions,the educational levels and social values of the popu-lation), of isolating in an unequivocal way the in-fluence of the various factors considered, and ofestablishing the direction of causal links betweenthem and the rate of agricultural growth.
The principal finding of all these studies wouldseem to be that there is no single, or even no small
'The country indices exclude fishery and forestry production.The trends for food production were similar to those for agricul-tural production, although in about half of the countries foodproduction increased slightly more rapidly.
See, for example, Fno, The state of food and agriculture 1963.Rome, 1963, p. 93-134; United States Department of Agriculture.Changes in agriculture in 26 developing nations. Foreign Agricul-tural Economic Report No. 27, Washington D.C., 1965; UnitedStates Department of Agriculture. Economic progress of agriculturein developing nations, 1950-68, Foreign Agricultural EconomicReport No. 59, Washington D.C., 1970.
130
Indices1952-56 s/00
1948-5
1948-52
160
150
140
130
120
110
100
90
801948-52 1955
160 NEAR EAST 1/150
140
130
120
110
100
90
80
80
150
1 60
130
120
110
1948-52
90
POPULATION IN THE DEVELOPING REGIONS
LATIN AMERICA
I..% 4. 1aart yr- " 0111.
1955
1955
AFRICA
Ittt/
ee/ ee """"111
1960
1960
1960
1965
1965
1965
I 1 I
1969
/969
1969
Total agricultural production0 0 Population
Per caput agricultural production
' Excluding Japan. - Excluding Israel. - ' Excluding South Africa.
1948-52 1955 1960 1965 1969
o
100
90
eo1955 1960 1965 1969
120
110
100
90
80
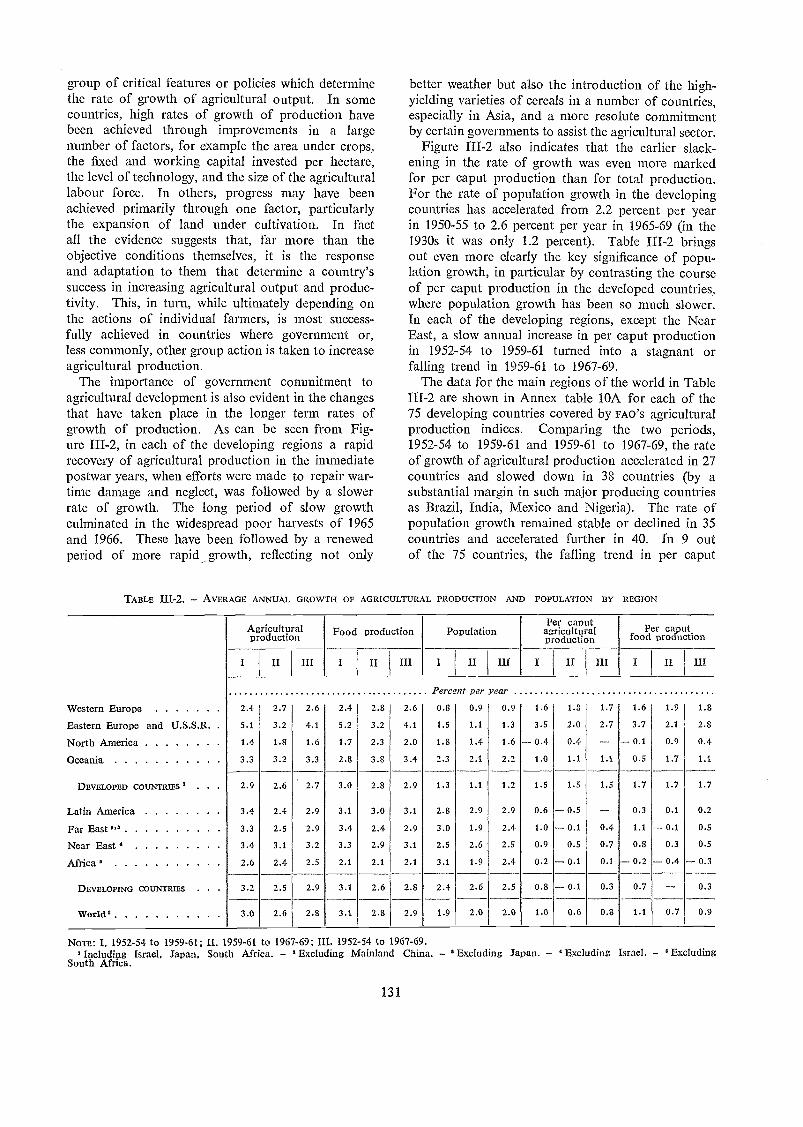
group of critical features or policies which determinethe rate of growth of agricultural output. In somecountries, high rates of growth of production havebeen achieved through improvements in a largenumber of factors, for example the area under crops,the fixed and working capital irtvested per hectare,the level of technology, and the size of the agriculturallabour force. In others, progress may have beenachieved primarily through one factor, particularlythe expansion of land under cultivation. In factall the evidence suggests that, far more than theobjective conditions themselves, it is the responseand adaptation to them that determine a country'ssuccess in increasing agricultural output and produc-tivity. This, in turn, while ultimately depending onthe actions of individual farmers, is most success-fully achieved in countries where government or,less commonly, other group action is taken to increaseagricultural production.
The importance of government commitment toagricultural development is also evident in the changesthat have taken place in the longer term rates ofgrowth of production. As can be seen from Fig-ure in each of the developing regions a rapidrecovery of agricultural production in the immediatepostwar years, when efforts were made to repair war-time damage and neglect, was followed by a slowerrate of growth. The long period of slow growthculminated in the widespread poor harvests of 1965and 1966. These have been followed by a renewedperiod of more rapid_ growth, reflecting not only
TABLE - AVERAGE ANNUAL GROWTH OF AGRICULTURAL PRODUCTION AND POPULATION BY REGION
131
better weather but also the introduction of the high-yielding varieties of cereals in a number of countries,especially in Asia, and a more resolute commitmentby certain governments to assist the agricultural sector.
Figure III-2 also indicates that the earlier slack-ening in the rate of growth was even more markedfor per caput production than for total production.For the rate of population growth in the developingcountries has accelerated from 2.2 percent per yearin 1950-55 to 2.6 percent per year in 1965-69 (in the1930s it was only 1.2 percent). Table III-2 bringsout even more clearly the key significance of popu-lation growth, in particular by contrasting the courseof per caput production in the developed countries,where population growth has been so much slower.In each of the developing regions, except the NearEast, a slow annual increase in per caput productionin 1952-54 to 1959-61 turned into a stagn.ant orfalling trend in 1959-61 to 1967-69.
The data for the main regions of the world in Table¡II-2 are shown in Annex table 10A for each of the75 developing countries covered by FAO'S agriculturalproduction indices. Comparing the two periods,1952-54 to 1959-61 and 1959-61 to 1967-69, the rateof growth of agricultural production accelerated in 27countries and slowed down in 38 countries (by asubstantial margin in such major producing countriesas Brazil, India, Mexico and Nigeria). The rate ofpopulation growth remained stable or declined in 35countries and accelerated further in 40. In 9 outof the 75 countries, the falling trend in per caput
Norg: I, 1952-54 to 1959-61; H, 1959-61 to 1967-69; III. 1952-54 to 1967-69.Including Israel, Japan. South Africa. - Excluding Mainland China. - ' Excluding Japan. - Excluding Israel. - ' Excluding
South Africa.
Percent per year
Western Europa 2.4 2.7 2.6 2.4 2.8 2.6 0.8 0.9 0.9 1.6 1.8 1.7 1.6 1.9 1.8
Eastern Europe and U.S.S.R. . 5.1 3.2 4.1 5.2 3.2 4.1 1.5 1.1 1.3 3.5 2.0 2.7 3.7 2.1 2.8
North America 1.4 1.8 1.6 1.7 2.3 2.0 1.8 1.4 1.6 -0.4 0.4 -0.1 0.9 0.4
Oceania 3.3 3.2 3.3 2.8 3.8 3.4 2.3 2.1 2.2 1.0 1.1 1.1 0.5 1.7 1.1
DEVELOPED COUNTRIES'. 2.9 2.6 2.7 3.0 2.8 2.9 1.3 1.1 1.2 1.5 1.5 1.5 1.7 1.7 1.7
Latin America 3.4 2.4 2.9 3.1 3.0 3.1 2.8 2.9 2.9 0.6 -0.5 -- 0.3 0.1 0.2
Far East I,' 3.3 2.5 2.9 3.4 2.4 2.9 3.0 1.9 2.4 1.0 -0.1 0.4 1.1 -0.1 0.5
Near East 3.4 3.1 3.2 3.3 2.9 3.1 2.5 2.6 2.5 0.9 0.5 0.7 0.8 0.3 0.5
Africa 2.6 2.4 2.5 2.1 2.1 2.1 3.1 1.9 2.4 0.2 -0.1 0.1 -0.2 -0.4 -0.3
DEVELOPING COUNTRIES . . 3.2 2.5 2.9 3.1 2.6 2.8 2.4 2.6 2.5 0.8 -0.1 0.3 0.7 0.3
World, 3.0 2.6 2.8 3.1 2.8 2.9 1.9 2.0 2.0 1.0 0.6 0.8 1.1 0.7 0.9
Agriculturalproduction Food production Population
Per caputagriculturalproduction
Per caputfood production
III II III II ill Ir II
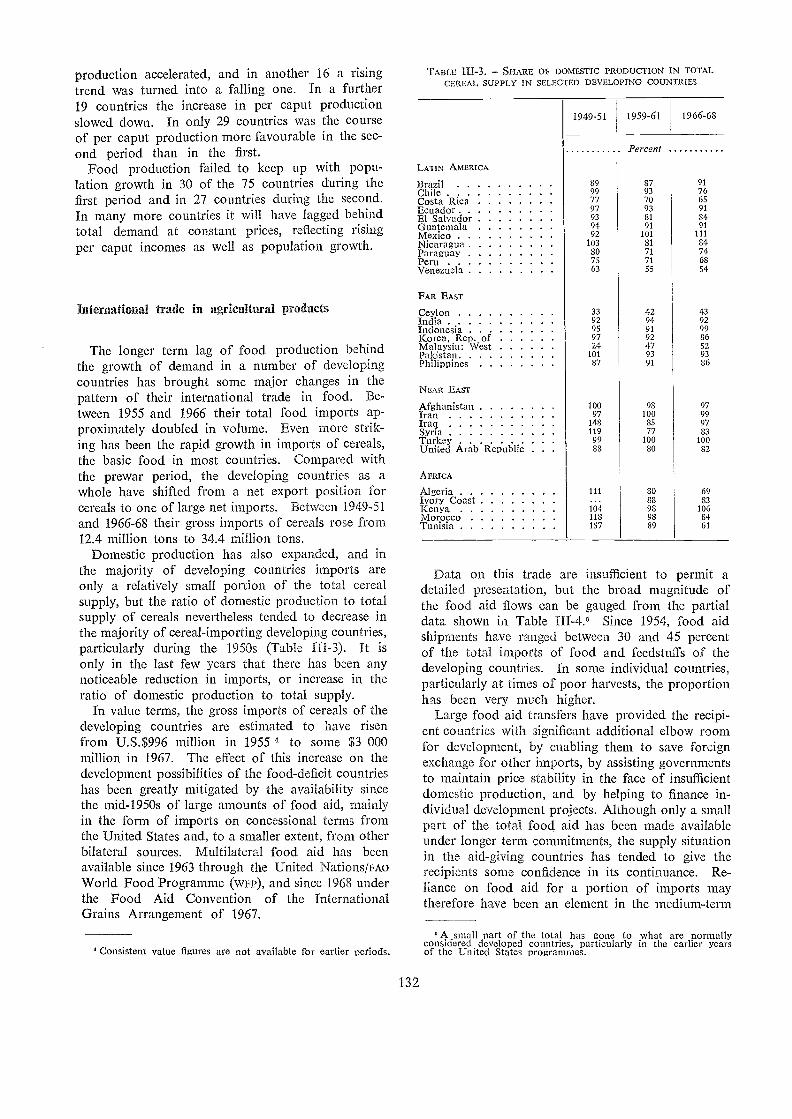
production accelerated, and in another 16 a risingtrend was turned into a falling one. In a further19 countries the increase in per caput productionslowed down. In only 29 countries was the courseof per caput production more favourable in the sec-on.d period than in the first.
Food production failed to keep up with popu-lation growth in 30 of the 75 countries during thefirst period and in 27 countries during the second.In many more countries it will have lagged behindtotal demand at constant prices, reflecting risingper caput incomes as well as population growth.
International trade in agricultural products
The longer term lag of food production behindthe growth of demand in a number of developingcountries has brought some major changes in thepattern of their international trade in food. Be-tween 1955 and 1966 their total food imports ap-proximately doubled in volume. Even more strik-ing has been the rapid growth in imports of cereals,the basic food in most countries. Compared withthe prewar period, the developing countries as awhole have shifted from a net export position forcereals to one of large net imports. Between 1949-51and 1966-68 their gross imports of cereals rose from12.4 million tons to 34.4 million tons.
Domestic production has also expanded, and inthe majority of developing countries imports areonly a relatively small portion of the, total cerealsupply, but the ratio of domestic production to totalsupply of cereals nevertheless tended to decrease inthe majority of cereal-importing developing countries,particularly during the 1950s (Table ITI-3). It isonly in the last few years that there has been anynoticeable reduction in imports, or increase in theratio of domestic production to total supply.
In value terms, the gross imports of cereals of thedeveloping countries are estimated to have risenfrom U.S.$996 million in 1955 4 to some $3 000million in 1967. The effect of this increase on thedevelopment possibilities of the food-deficit countrieshas been greatly mitigated by the availability sincethe mid-1950s of large amounts of food aid, mainlyin the form of imports on concessional terms fromthe United States and, to a smaller extent, from otherbilateral sources. Multilateral food aid has beenavailable since 1963 through the United Nations/FAoWorld Food Programme (wFP), and since 1968 underthe Food Aid Convention of the InternationalGrains Arrangement of 1967.
Consistent value figures are not available for earlier period's.
132
TABLE - SHARE OF DOMESTIC PRODUCTION IN TOTALCEREAL SUPPLY IN SELECTED DEVELOPING COUNTRIES
Data on this trade are insufficient to permit adetailed presentation, but the broad magnitude ofthe food aid flows can be gauged from the partialdata shown in Table III-4.6 Since 1954, food aidshipments have ranged between 30 and 45 percentof the total iniports of food and feedstuff's of thedeveloping countries. In some individual countries,particularly at times of poor harvests, the proportionhas been very much higher.
Large food aid transfers have provided the recipi-ent countries with significant additional elbow roomfor development, by enabling them to save foreignexchange for other imports, by assisting governmentsto maintain price stability in the face of insufficientdomestic production, and by helping to finalice in-dividual development projects. Although only a smallpart of the total food aid has been made availableunder longer term commitments, the supply situationin the aid-giving countries has tended to give therecipients some confidence in its continuan.ce. Re-liance on food aid for a portion of imports maytherefore have been an element in the medium-term
A small part of the total has gone to what are normallYconsidered developed countries, particularly in the earlier yearsof the United States programmes.
1949-51 1959-61 1966-68
Percent
LATIN AMERICA
Brazil 89 87 91
Chile 99 93 76Costa Rica 77 70 65
Ecuador 97 93 91El Salvador 93 81 84Guatemala 94 91 91
Mexico 92 101 111
Nicaragua 103 81 84Paraguay 80 71 74Peru 75 71 68Venezuela 63 55 54
FAR EAST
Ceylon 33 42 43India 92 94 92Indonesia 95 91 99Korea, Rep. of 97 92 86Malaysia: VVest 24 47 52Pakistan 101 93 93Philippines 87 91 86
NEAR EAST
Afghanistan 100 98 97Iran 97 100 99Iraq 148 85 97Syri 119 77 83Turkey 99 100 100United Arab Republic . 88 80 82
AFRICA
Algeria 111 80 69Ivory Coast 83 83Kenya i(ii 98 106Morocco 118 98 84Tunisi 157 89 61
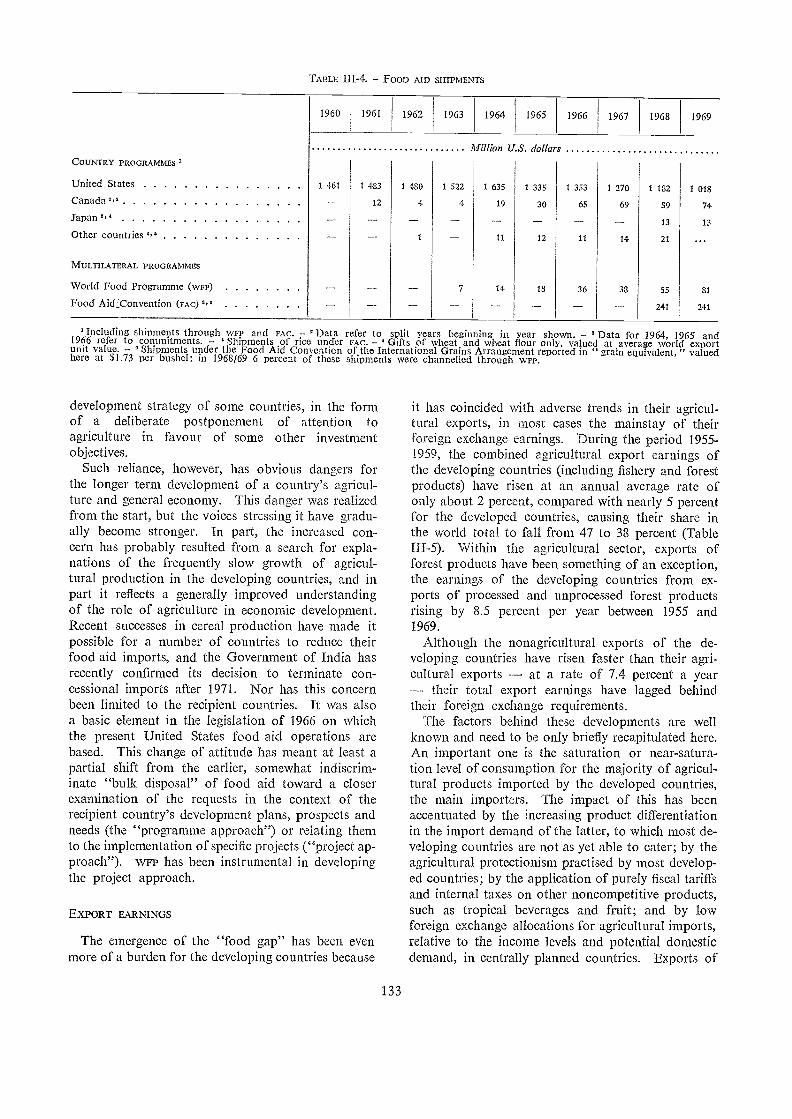
COUNTRY PROGRAMMES
United States
Canada
Japan ",'
Other countries
MULTILATERAL PROGRAMMES
World Food Programme (wFr)
Food Aid.:Convention (FAO',"
TABLE 111-4. FOOD AID SHIPMENTS
1960 1961
development strategy of some countries, in the formof a deliberate postponement of attention toagriculture in favour of some other investmentobjectives.
Such reliance, however, has obvious dangers forthe longer term development of a country's agricul-ture and general economy. This danger was realizedfrom the start, but the voices stressing it have gradu-ally become stronger. In part, the increased con-cern has probably resulted from a search for expla-nations of the frequently slow growth of agricul-tural production in the developing countries, and inpart it reflects a generally improved understandingof the role of agriculture in economic development.Recent successes in cereal production have made itpossible for a number of countries to reduce theirfood aid imports, and the Government of India hasrecently confirmed its decision to terminate con-cessional imports after 1971. Nor has this concernbeen limited to the recipient countries. It was alsoa basic element in the legislation of 1966 on whichthe present United States food aid operations arebased. This change of attitude has meant at least apartial shift from the earlier, somewhat indiscrim-inate "bulk disposal" of food aid toward a closerexamination of the requests in the context of therecipient country's development plans, prospects andneeds (the "programme approach") or relating themto the implementation of specific projects ("project ap-proach"). WFP has been instrumental in developingthe project approach.
EXPORT EARNINGS
The emergence of the "food gap" has been evenmore of a burden for the developing countries because
133
1962 1963 1964
Million U S. dollars
1965 1966
1 353
65
11
36
1967
1 270
69
33
14
1968
1 182
59
13
21
55
241
1969
1 018
74
13
81
241
' Including shipments through wFP and FAC. Data refer to split years beginning in year shown. Data foi 1964, 1965 and1966 refer to commitments. Shipments of rice under FAC. n Gifts of wheat and wheat flour only. valued at average world exportunit value. Shipments under the Food Aid Convention of the International Grains Arrangement reported in " grain equivalent, " valuedhere at $1.73 per bushel; in 1968/69 6 percent of these shipments \rue channelled through WEI,.
it has coincided with adverse trends in their agricul-tural exports, in most cases the mainstay of theirforeign exchange earnings. During the period 1955-1959, the combined agricultural export earnings ofthe developing countries (including fishery and forestproducts) have risen at an annual average rate ofonly about 2 percent, compared with nearly 5 percentfor the developed countries, causing their share inthe world total to fall from 47 to 38 percen.t (TableIII-5). Within the agricultural sector, exports offorest products have been something of an exception,the earnings of the developing countries from ex-ports of processed and unprocessed forest productsrising by 8.5 percent per year between 1955 and1969.
Although the nonagricultural exports of the de-veloping countries have risen faster than their agri-cultural exports at a rate of 7.4 percent a year
their total export earnings have lagged behindtheir foreign exchange requirements.
The factors behind these developments are wellknown and need to be only briefly recapitulated here.An important one is the saturation or near-satura-tion level of consumption for the majority of agricul-tural products imported by the developed countries,the main importers. The impact of this has beenaccentuated by the increasing product differentiationin the import demand of the latter, to which most de-veloping countries are not as yet able to cater; by theagricultural protectionism practised by most develop-ed countries; by the application of purely fiscal tariffsand internal taxes on other noncompetitive products,such as tropical beverages and fruit; and by lowforeign exchange allocations for agricultural imports,relative to the income levels and potential domesticdemand, in centrally planned countries. Exports of
1 461 1 483
12
1 480
4
1 522
4
1 635
19
1 335
30
12
7 14 18
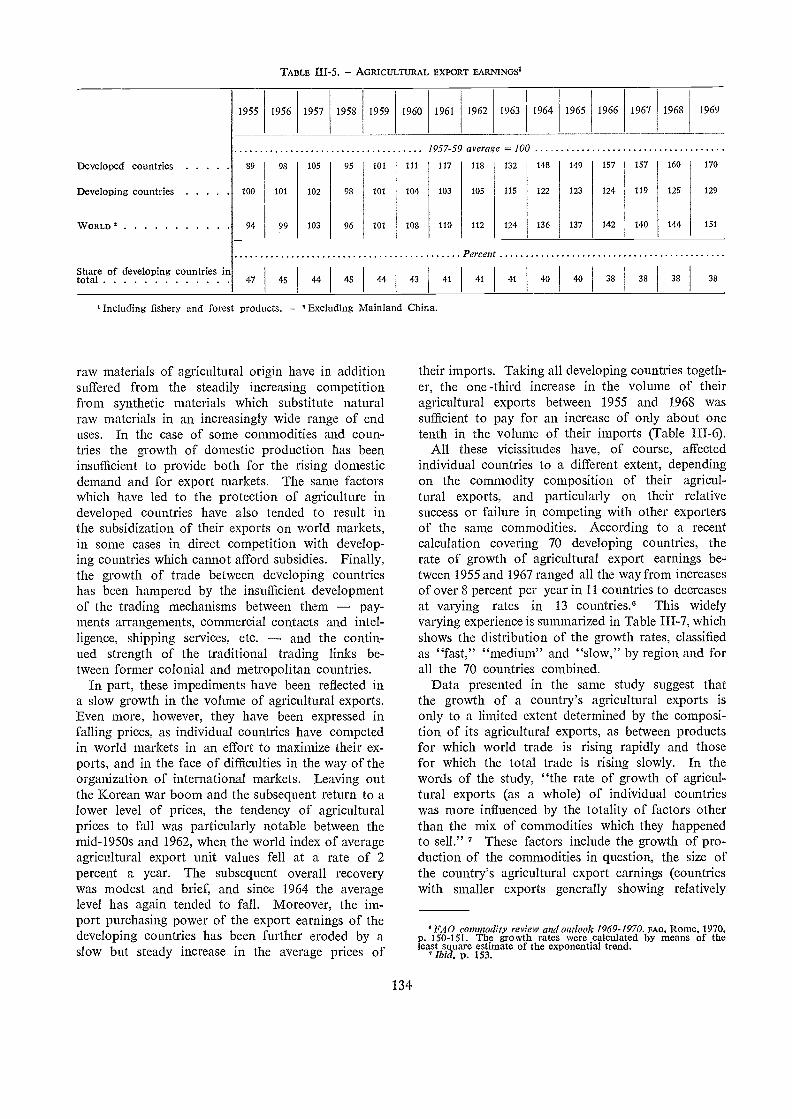
TABLE 111-5. - AGRICULTURAL EXPORT EAR11INGS1
Including fishery and forest products. 'Excluding Mainland China.
raw materials of agricultural origin have in additionsuffered from the steadily increasing competitionfrom synthetic materials which substitute naturalraw materials in an increasingly wide range of enduses. In the case of some commodities and coun-tries the growth of domestic production has beeninsufficient to provide both for the rising domesticdemand and for export markets. The same factorswhich have led to the protection of agriculture indeveloped countries have also tended to result inthe subsidization of their exports on world markets,in some cases in direct competition with develop-ing countries which cannot afford subsidies. Finally,the growth of trade between developing countrieshas been hampered by the insufficient developmentof the trading mechanisms between them pay-ments arrangements, commercial contacts and intel-ligence, shipping services, etc. and the contin-ued strength of the traditional trading links be-tween former colonial and metropolitan countries.
In part, these impediments have been reflected ina slow growth in the volume of agricultural exports.Even more, however, they have been expressed infalling prices, as individual countries have competedin world markets in an effort to maximize their ex-ports, and in the face of difficulties in the way of theorganization of international markets. Leaving outthe Korean war boom and the subsequent return to alower level of prices, the tendency of agriculturalprices to fall was particularly notable between themid-1950s and 1962, when the world index of averageagricultural export unit values fell at a rate of 2percen.t a year. The subsequent overall recoverywas modest and brief, and since 1964 the averagelevel has again tended to fall. Moreover, the im-port purchasing power of the export earnings of thedeveloping countries has been further eroded by aslow but steady increase in the average prices of
134
their imports. Taking all developing countries togeth-er, the one -third increase in the volume of theiragricultural exports between 1955 and 1968 wassufficient to pay for an increase of only about onetenth in the volume of their imports (Table III-6).
All these vicissitudes have, of course, affectedindividual countries to a different extent, dependingon the commodity composition of their agricul-tural exports, and particularly on their relativesuccess or failure in competing with other exportersof the same commodities. According to a recentcalculation covering 70 developing countries, therate of growth of agricultural export earnings be-tween 1955 and 1967 ranged all the way from increasesof over 8 percent per year in 11 countries to decreasesat varying rates in 13 countries.° This widelyvarying experience is summarized in Table III-7, whichshows the distribution of the growth rates, classifiedas "fast," "medium" and "slow," by region and forall the 70 countries combined.
Data presented in the same study suggest thatthe growth of a country's agricultural exports isonly to a limited extent determined by the composi-tion of its agricultural exports, as between productsfor which world trade is rising rapidly and thosefor which the total trade is rising slowly. In thewords of the study, "the rate of growth of agricul-tural exports (as a whole) of individual countrieswas more influenced by the totality of factors otherthan the mix of commodities which they happenedto sell." These factors include the growth of pro-duction of the commodities in question, the size ofthe country's agricultural export earnings (countrieswith smaller exports generally showing relatively
° FAO conunodity review and outlook 7969-1970. FAO, Rome, 1970.p. 150-151. The growth rates were calculated by means of theleast square estimate of the exponential trend.
Ibid. p. 153.
1955 1956 1957 1958 1959 1960 1961 1962 1963 1964 1965 1966 1967 1968 1969
1957-59 average 100
Developed countries 89 98 105 95 101 111 117 118 132 148 149 157 157 160 170
Developing countries 100 101 102 98 101 104 103 105 115 122 123 124 119 125 129
WORLD 94 99 103 96 101 108 110 112 124 136 137 142 140 194 151
Percen
Share of developing countries intotal 47 45 94 45 43 41 41 41 40 40 38 38 38 38
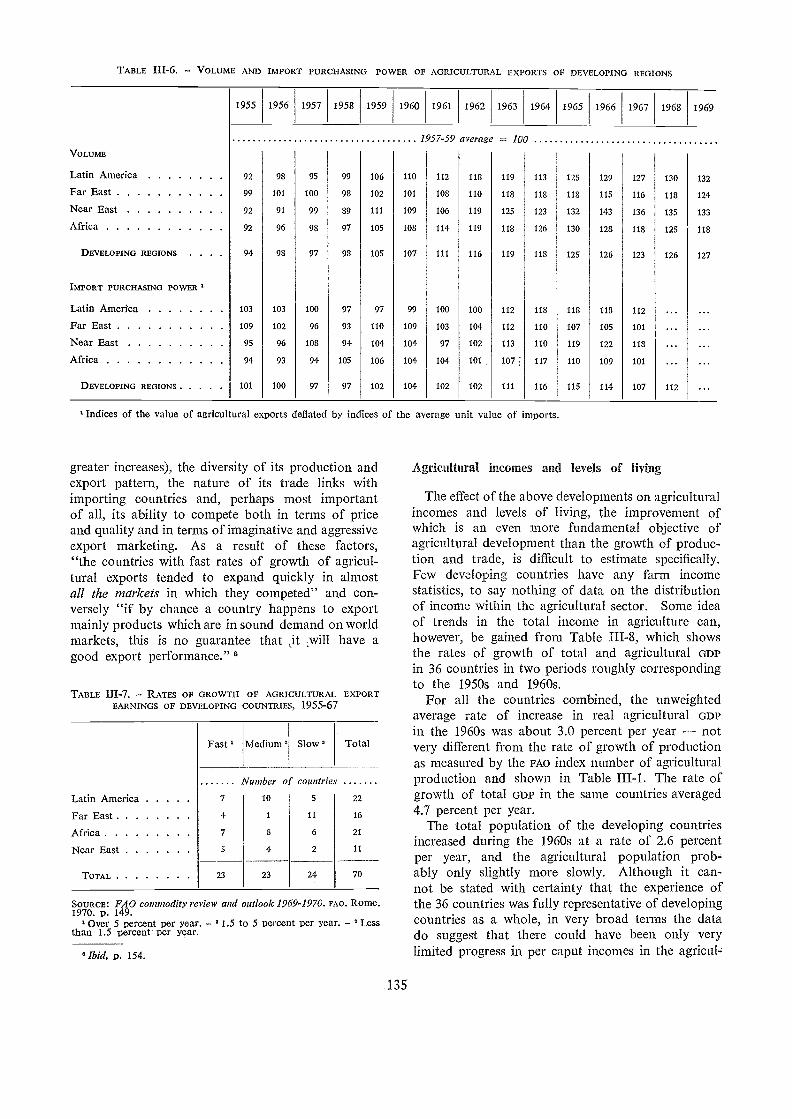
TABLE 111-6. VOLUME AND IMPORT PURCHASING POWER OF AGRICLTLTURAL EXPORTS OF DEVELOPING REGIONS
greater increases), the diversity of its production andexport pattern, the nature of its trade links withimporting countries and, perhaps most importantof all, its ability to compete both in terms of priceand quality and in terms of imaginative and aggressiveexport marketing. As a result of these factors,"the countries with fast rates of growth of agricul-tural exports tended to expand quickly in almostall the markets in which they competed" and con-versely "if by chance a country happens to exportmainly products which are in sound demand on worldmarkets, this is no guarantee that ,it Lwill have agood export performance." a
TABLE 111-7. RATES OF GROWTH OF AGRICULTURAL EXPORTEARNINGS OF DEVELOPING COUNTRIES, 1955-67
Souace: FAO commodity review and outlook 1969-1970. FAO, Rome,1970. D. 149.
Over 5 percent per year. 3 1.5 to 5 percent per year. °Lessthan 1.5 percent per year.
° Ibid. p. 154.
135
Indices of the value of agricul ural exports deflated by indices of the average unit value of imports.
Agricultural incomes and levels of living
The effect of the above developments on agriculturalincomes and levels of living, the improvement ofwhich is an even more fundamental objective ofagricultural development than the growth of produc-tion and trade, is difficult to estimate specifically.Few developing countries have any farm incomestatistics, to say nothing of data on the distributionof income within the agricultural sector. Some ideaof trends in the total income in agriculture can,however, be gained from Table 111-8, which showsthe rates of growth of total and agricultural GDPin 36 countries in two periods roughly correspondingto the 1950s and 1960s.
For all the countries combined, the unweightedaverage rate of increase in real agricultural GDPin the 1960s was about 3.0 percent per year notvery different from the rate of growth of productionas measured by the FAO index number of agriculturalproduction and shown in Table III-1. The rate ofgrowth of total GDP in the same countries averaged4.7 percent per year.
The total population of the developing countriesincreased during the 1960s at a rate of 2.6 percentper year, and the agricultural population prob-ably only slightly more slowly. Although it can-not be stated with certainty that the experience ofthe 36 countries was fully representative of developingcountries as a whole, in very broad terms the datado suggest that there could have been only verylimited progress in per caput incomes in the agricul-
1955 1956 1957 1958 1959 1960 1961 1962 1963 1964 1965 1966 1967 1968 1969
1957-59 average 100
VOLUME
Latin America 92 98 95 99 106 110 112 118 119 113 125 129 127 130 132
Far East 99 101 100 98 102 101 108 110 118 118 118 115 116 118 124
Near East 92 91 99 89 111 109 106 119 125 123 132 143 136 135 133
Africa 92 96 98 97 105 108 114 119 118 126 130 128 118 125 118
DEVELOPING REGIONS . . . 94 98 97 98 105 107 111 116 119 118 125 126 123 126 127
IMPORT PURCHASING POwER 1
Latin America 103 103 100 97 97 99 100 100 112 118 118 118 112
Far East 109 102 96 93 110 109 103 104 112 110 107 105 101
Near East 95 96 108 94 104 104 97 102 113 110 119 122 118
Africa
DEvELOPING REGIONS
94
101
93
100
94
97
105
97
106
102
104
104
104
102
101 ,
102
107
111
117
116
110
115
109
114
101
107 112
Fast " Medium° Slow 3 Total
Number of countrie
Latin America 7 10 5 22
Far East 4 1 11 16
Africa 7 8 6 21
Near East 5 4 2 11
TOTAL 23 23 24 70
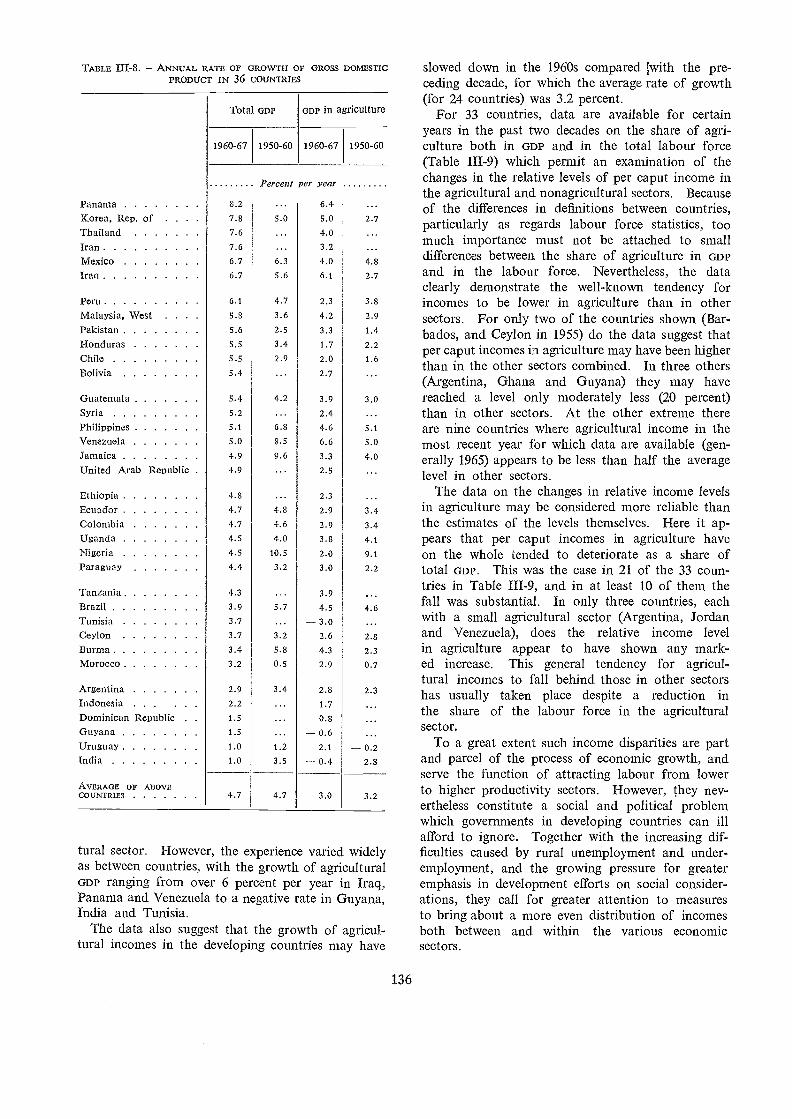
TAI3LE - ANNUAL RATE OF GROWTH OF GROSS DONIF-STICPRODUCT IN 36 COUNTRIES
tural sector. However, the experience varied widelyas between countries, with the growth of agriculturalGDP ranging from over 6 percent per year in Iraq,Panama and Venezuela to a negative rate in Guyana,India and Tunisia.
The data also suggest that the growth of agricul-tural incomes in the developing countries may have
136
slowed down in the 1960s compared with the pre-ceding decade, for which the average rate of growth(for 24 countries) was 3.2 percent.
For 33 countries, data are available for certainyears in the past two decades on the share of agri-culture both in GDP and in the total labour force(Table III-9) which permit an examination of thechanges in the relative levels of per caput income inthe agricultural and nonagricultural sectors. Becauseof the differences in definitions between countries,particularly as regards labour force statistics, toomuch importance must not be attached to smalldifferences between the share of agriculture in GDPand in the labour force. Nevertheless, the dataclearly demonstrate the well-known tendency forincomes to be lower in agriculture than in othersectors. For only two of the countries shown (Bar-bados, and Ceylon in 1955) do the data suggest thatper caput incomes in agriculture may have been higherthan in the other sectors combined. In three others(Argentina, Ghana and Guyana) they may havereached a level only moderately less (20 percent)than in other sectors. At the other extreme thereare nine countries where agricultural income in themost recent year for which data are available (gen-erally 1965) appears to be less than half the averagelevel in other sectors.
The data on the changes in relative income levelsin agriculture may be considered more reliable thanthe estimates of the levels themselves. Here it ap-pears that per caput incomes in agriculture haveon the whole tended to deteriorate as a share oftotal GDP. This was the case in 21 of the 33 coun-tries in Table III-9, and in at least 10 of them thefall was substantial. In only three countries, eachwith a small agricultural sector (Argentina, Jordanand Venezuela), does the relative income levelin agriculture appear to have shown any mark-ed increase. This general tendency for agricul-tural incomes to fall behind those in other sectorshas usually taken place despite a reduction inthe share of the labour force in the agriculturalsector.
To a great extent such income disparities are partand parcel of the process of economic growth, andserve the function of attracting labour from lowerto higher productivity sectors. However, they nev-ertheless constitute a social and political problemwhich governments in developing countries can illafford to ignore. Together with the increasing dif-ficulties caused by rural unemployment and under-employment, and the growing pressure for greateremphasis in development efforts on social consider-ations, they call for greater attention to measuresto bring about a more even distribution of incomesboth between and within the various economicsectors.
1960-67 1950-60 1960-67 1950-60
Percent per year
Panama 8.2 6.4
Korea. Rep. of 7.8 5.0 5.0 2.7
Thailand 7.6 4.0
Iran 7.6 3.2
Mexico 6.7 6.3 4.0 4.8
Iraq 6.7 5.6 6.1 2.7
Peru 6.1 4.7 2.3 3.8
Malaysia, West 5.8 3.6 4.2 2.9
Pakistan 5.6 2.5 3.3 1.4
Honduras 5.5 3.4 1.7 2.2
Chile 5.5 2.9 2.0 1.6
Bolivia 5.4 2.7
Guatemala 5.4 4.2 3.9 3.0Syria 5.2 2.4
Philippines 5.1 6.8 4.6 5.1
Venezuela 5.0 8.5 6.6 5.0
Jamaica 4.9 9.6 3.3 4.0United Arab Republic . 4.9 2.5
Ethiopia 4.8 2.3
Ecuador 4.7 4.8 2.9 3.4Colombia 4.7 4.6 2.9 3.4Uganda 4.5 4.0 3.8 4.1
Nigeria 4.5 10.5 2.0 9.1
Paraguay 4.4 3.2 3.0 2.2
Tanzania 4.3 3.9Brazil 3.9 5.7 4.5 4.6Tunisia 3.7 -3.0Ceylon 3.7 3.2 2.6 2.8Burma 3.4 5.8 4.3 2.3Morocco 3.2 0.5 2.9 0.7
Argentina 2.9 3.4 2.8 2.3Indonesia . . . 2.2 1.7Dominican Republic . . 1.5 0.8Guyana 1.5 -- 0.6Uruguay 1.0 1.2 2.1 - 0.2India 1.0 3.5 -- 0.4 2.8
AVERAGE OF ABOVECOUNTRIES 4.7 4.7 3.0 3.2
Total GDP GDP in agriculture
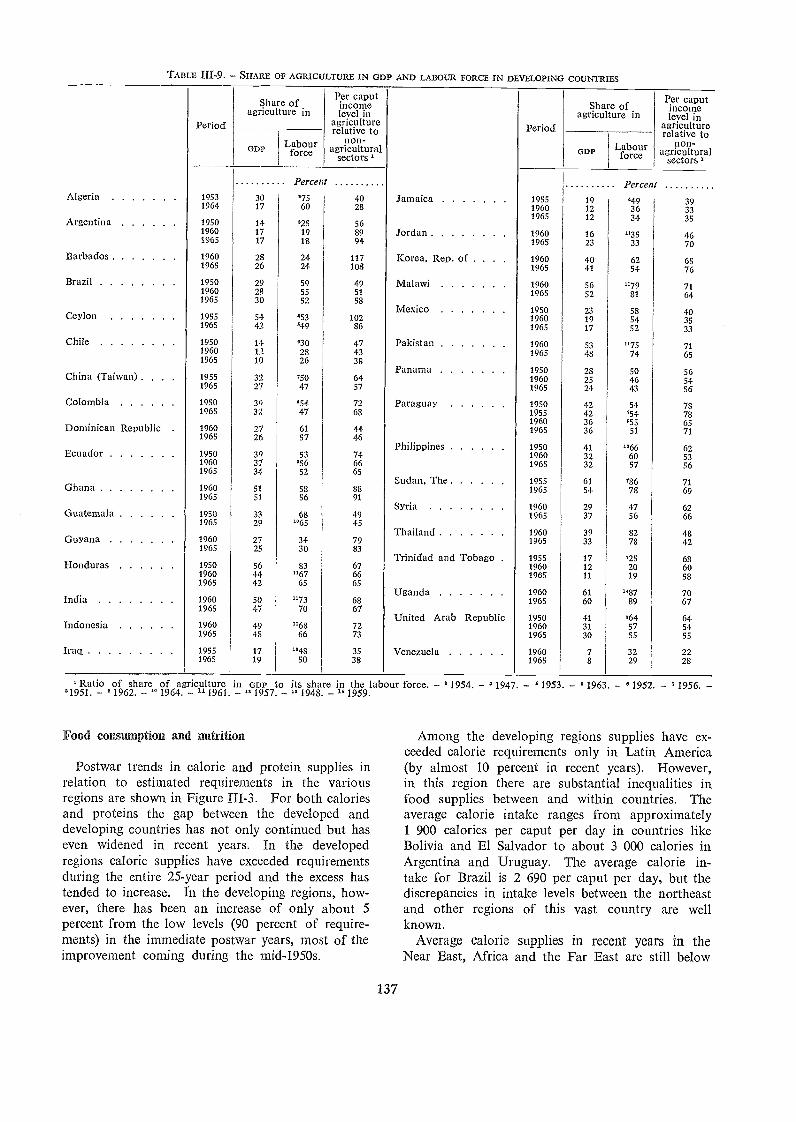
Food consumption and nutrifion
Postwar trends in calorie and protein supplies inrelation to estimated requirements in the variousregions are shown in Figure III-3. For both caloriesand proteins the gap between the developed anddeveloping countries has not only continued but haseven widened in recent years. In the developedregions calorie supplies have exceeded requirementsduring the entire 25-year period and the excess hastended to increase. In the developing regions, how-ever, there has been an increase of only about 5percent from the low levels (90 percent of require-ments) in the immediate postwar years, most of theimprovement coming during the mid-1950s.
TABLE SHARE OF AGRICULTURE IN GDP AND LABOUR FORCE IN DEVELOPING COUNTRIES
° Ratio of share of agriculture in GDP tO its share in the labour force. 1954. 1947. 1953. 1963. 1952. 1956.1951. 1962. " 1964. 111961. " 1957. " 1948. 1" 1959.
137
Among the developing regions supplies have ex-ceeded calorie requirements only in Latin America(by almost 10 percent in recent years). However,in this region there are substantial inequalities infood supplies between and within countries. Theaverage calorie intake ranges from approximately1 900 calories per caput per day in countries likeBolivia and El Salvador to about 3 000 calories inArgentina and Uruguay. The average calorie in-take for Brazil is 2 690 per caput per day, but thediscrepancies in intake levels between the northeastand other regions of this vast country are wellknown.
Average cah)rie supplies in recent years in theNear East, Africa and the Far East are still below
Period
Share ofagriculture in
Per caputincomelevel in
agriculturerelative to Period
Share ofagriculture in
Per caputincomelevel in
agriculturerelative to,
GD'Labourforce
non-agricultural
sectors "GDP Labour
forcenon-
agriculturalsectors °
Percent PercenAlgeria 1953 30 '75 40 Jamaica 1955 19 '49 391964 17 60 28 1960 12 36 33
Argentina 1950 14 '25 561965 12 34 35
1960 17 19 89 Jordan 1960 16 "35 461965 17 18 94 1965 23 33 70
Barbados 1960 28 24 117 Korea, Rep. of . . . . 1960 40 62 651965 26 24 108 1965 41 54 76Brazil 1950 29 59 49 Malawi 1960 56 "79 711960
19652830
5552
5158
1965 52 81 64
Mexico 1950 23 58 40.7eylon 1955 54 '53 102 1960 19 54 351965 42 '49 86 1965 17 52 33
:hile 1950 14 '30 47 Pakistan 1960 53 "75 711960 12 28 43 1965 48 74 651965 10 26 38Panama 1950 28 50 56Thina (Taiwan) . . . 1955 32 '50 64 1960 25 46 541965 27 47 57 1965 24 43 56
2.olombia 1950 39 '54 72 Paraguay 1950 42 54 781965 32 47 68 1955 42 754 73
Dominican Republic 1960 27 61 4419601965
3636
°SS51
6571
1965 26 57 46Philippines 1950 41 "66 62Ecuador 1950 39 53 74 1960 32 60 53
1960 37 '56 66 1965 32 57 561965 34 52 65
Sudan, The 1955 61 736 713hana 1960 51 58 88 1965 54 78 691965 51 56 91
Syria 1960 29 47 623uatemala 1950 33 68 49 1965 37 56 661965 29 1065 45
Thailand 1960 39 82 483uyana 1960 27 34 79 1965 33 78 421965 25 30 83
Trinidad and Tobago . 1955 17 725 68ionduras 1950 56 83 67 1960 12 20 60
1960 44 "67 66 1965 11 19 581965 42 65 65
Uganda 1960 61 i487 70ndia 1960 50 "73 68 1965 60 89 67
1965 47 70 67
ndonesia 1960 49 "68 72United Arab Republic 1950
19604131
x6457
6454
1965 48 66 73 1965 30 55 55
rag 1955 17 "48 35 Venezuela 1960 7 32 221965 19 50 38 1965 8 29 28
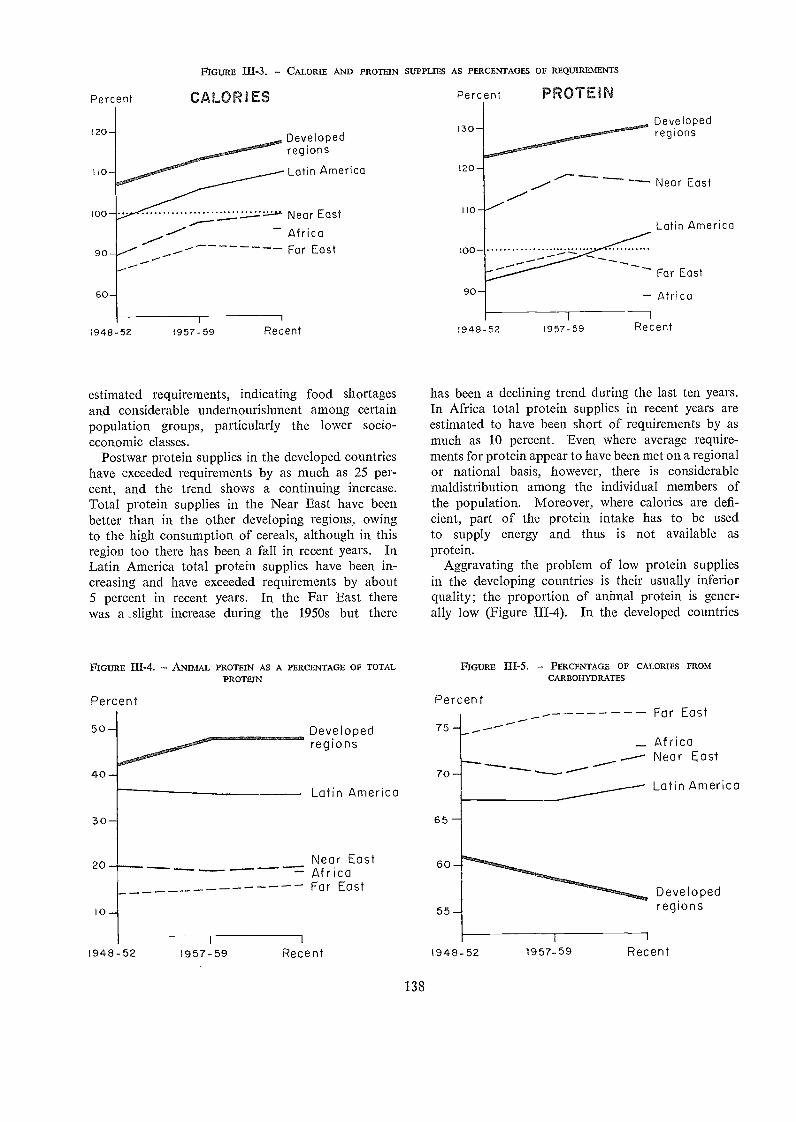
Percent
20-
I00
90
194 8 - 52
estimated requirements, indicating food shortagesand considerable undernourishment among certainpopulation groups, particularly the lower socio-economic classes.
Postwar protein supplies in the developed countrieshave exceeded requirements by as much as 25 per-cent, and the trend shows a continuing increase.Total protein supplies in the Near East have beenbetter than in the other developing regions, owingto the high consumption of cereals, although in thisregion too there has been a fall in recent years. InLatin America total protein supplies have been in-creasing and have exceeded requirements by about5 percent in recent years. In the Far East therewas a _ slight increase during the 1950s but there
FIGURE TIT-4. ANIMAL PROTEIN AS A PERCENTAGE OF TOTALPROTEIN
Percent
50
40
1957-59
FIGURE - CALORIE AND PROTEIN SUPPLIES AS PERCENTAGES OF REQUIREMENTS
CALOR I ES
Developedregions
Latin America
Near East
AfricaFar East
138
Percent
I 3 0
120
110
100
90
Percent
has been a declining trend during the last ten years.In Africa total protein supplies in recent years areestimated to have been short of requirements by asmuch as 10 percent. Even where average require-ments for protein appear to have been met on a regionalor national basis, however, there is considerablemaldistribution among the individual members ofthe population. Moreover, where calories are defi-cient, part of the protein intake has to be usedto supply energy and thus is not available asprotein.
Aggravating the problem of low protein suppliesin the developing countries is their usually inferiorquality; the proportion of animal protein is gener-ally low (Figure 111-4). In the developed countries
FIGURE TIT-5. - PERCENTAGE OF CALORIES FROMCARBOHYDRATES
PROTEIN
Near East
Latin America
Far East
Africa
Africa--- Near East
Deve lopedreg ions
For East
Latin America
Developedregions
Developed'011=111
75
regions
70
Latin America
65
Near East 60AfricaFar East
55
1948-52 1957-59 Recent 1948-52 1957-59 Recent
1948-52 1957-59 Recent
30
20
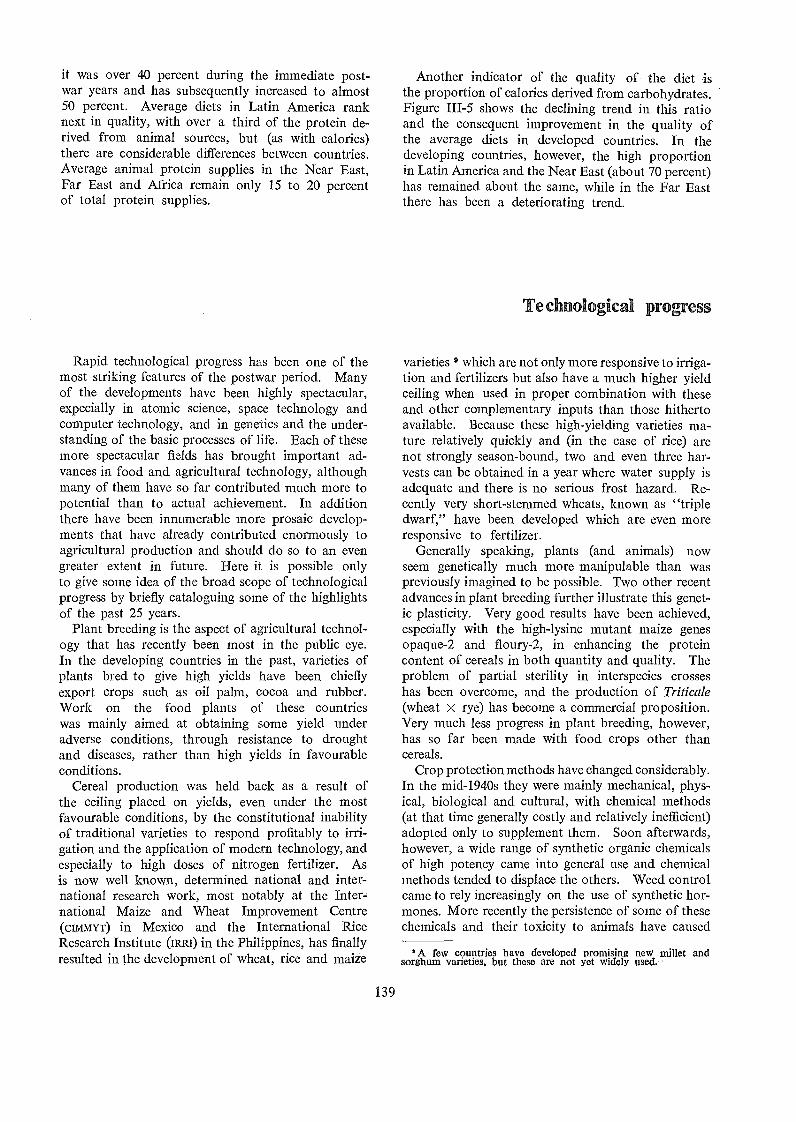
t was over 40 percent during the immediate post-war years and has subsequently increased to almost50 percent. Average diets in Latin America ranknext in quality, with over a third of the protein de-rived from animal sources, but (as with calories)there are considerable differences between countries.Average animal protein supplies in the Near East,Far East and Africa remain only 15 to 20 percentof total protein supplies.
Rapid technological progress has been one of themost striking features of the postwar period. Manyof the developments have been highly spectacular,expecially in atomic science, space technology andcomputer technology, and in genetics and the under-standing of the basic processes of life. Each of thesemore spectacular fields has brought important ad-vances in food and agricultural technology, althoughmany of them have so far contributed much more topotential than to actual achievement. In additionthere have been innumerable more prosaic develop-ments that have already contributed enormously toagricultural production and should do so to an evengreater extent in future. Here it is possible onlyto give some idea of the broad scope of technologicalprogress by briefly cataloguing some of the highlightsof the past 25 years.
Plant breeding is the aspect of agricultural technol-ogy that has recently been most in the public eye.In the developing countries in the past, varieties ofplants bred to give high yields have been chieflyexport crops such as oil palm, cocoa and rubber.Work on the food plants of these countrieswas mainly aimed at obtaining some yield underadverse conditions, through resistance to droughtand diseases, rather than high yields in favourableconditions.
Cereal production was held back as a result ofthe ceiling placed on yields, even under the mostfavourable conditions, by the constitutional inabilityof traditional varieties to respond profitably to irri-gation and the application of modern technology, andespecially to high doses of nitrogen fertilizer. Asis now well known, determined national and inter-national research work, most notably at the Inter-national Maize and Wheat Improvement Centre(cimmv.r) in Mexico and the International RiceResearch Institute ORO in the Philippines, has finallyresulted in the development of wheat, rice and maize
139
Another indicator of the quality of the diet isthe proportion of calories derived from carbohydrates.Figure III-5 shows the declining trend in this ratioand the consequent improvement in the quality ofthe average diets in developed countries. In thedeveloping countries, however, the high proportionin Latin America and the Near East (about 70 percent)has remained about the same, while in the Far Eastthere has been a deteriorating trend.
Technological progress
varieties ° which are not only more responsive to irriga-tion and fertilizers but also have a much higher yieldceiling when used in proper combination with theseand other complementary inputs than those hithertoavailable. Because these high-yielding varieties ma-ture relatively quickly and (in the case of rice) arenot strongly season-bound, two and even three har-vests can be obtained in a year where water supply isadequate and there is no serious frost hazard. Re-cently very short-stemmed wheats, known as "tripledwarf," have been developed which are even moreresponsive to fertilizer.
Generally speaking, plants (and animals) nowseem genetically much more manipulable than waspreviously imagined to be possible. Two other recentadvances in plant breeding further illustrate this genet-ic plasticity. Very good results have been achieved,especially with the high-lysine mutant maize genesopaque-2 and floury-2, in enhancing the proteincontent of cereals in both quantity and quality. Theproblem of partial sterility in interspecies crosseshas been overcome, and the production of Triticale(wheat x rye) has beconae a commercial proposition.Very much less progress in plant breeding, however,has so far been made with food crops other thancereals.
Crop protection methods have changed considerably.In the mid-1940s they were mainly mechanical, phys-ical, biological and cultural, with chemical methods(at that time generally costly and relatively inefficient)adopted only to supplement them. Soon afterwards,however, a wide range of synthetic organic chemicalsof high potency came into general use and chemicalmethods tended to displace the others. Weed controlcame to rely increasingly on the use of synthetic hor-mones. More recently the persistence of some of thesechemicals and their toxicity to animals have caused
'A few countries have developed promising new millet andsorghum varieties, but these are not yet widely used.
widespread fears, as part of the growing concern at theworsening pollution of the environment. The de-velopment of resistance in pests has also caused prob-lems. Thus there has been an intensified searchfor new and safer methods of pest control, includinga revival of interest in biological control and muchattention to systems of integrated control, involvingthe balanced use of a combination of methods so asto maximize benefits and minimize harmful effects.
Fertilizer technology has made great strides.Manufacturing costs have been reduced, particularlythrough the use of natural gas in the synthesis ofammonia. Costs of application have been reducedthrough the development of liquid fertilizers, bulk-blended fertilizers, and materials for multiple-hoppertruck spreading. The increased concentration offertilizers has reduced the heavy transport costs ofsuch bulky materials the most highly concentratedfertilizer now available contains 60 percent phospho-ric acid and 15 percent nitrogen. Slow-workingfertilizers, which eliminate the need for more thanone application, are increasingly being developed.Micronutrient fertilizers are being produced. Con-siderable progress has been made in determining therequirements for nutrients and micronutrients, andthe optimum timing and placement for fertilizerapplications.
The last 25 years have seen a substantial expansionand improvement in the use of aerial photographyfor soil survey and assessment. In water use andirrigation a number of spectacular developments inwhich high hopes were originally placed, includingthe artificial inducement of rainfall, the control ofevaporation from reservoirs and the desalinizationof seawater, have proved somewhat disappointing.While desalinization has become feasible for urbanand industrial use, it is still far too costly for agri-culture. Good progress has been made in other areas,however, such as watershed management, the in-ventory of water resources, and the development andoperation of systems to optimize water utilization.Techniques for reclaiming saline and waterloggedland remain costly, but there has been good progressin the prevention of such conditions. There hasbeen important progress in the exploration and eco-nomic exploitation of groundwater resources, whilerefinements in the techniques of sprinkler irrigationand such new inventions as trickling irrigation havebrought substantial reductions in the water require-ments for crop production.
Most of the advances in farm machinery havebeen of main interest to the developed countries,with their overriding need to economize in the useof costly labour. Power units have increased insize and versatility. Particularly spectacular ad-vances have been made in horticultural and fruitharvesting equipment, and in the almost complete
140
mechanization of the feeding and care of animals.Much less progress has been made with the improve-ment of the hand and animal-drawn implements chief-ly of interest to small farmers in developing countries.
Animal breeding has relied increasingly on artificialinsemination, combined with improved techniquesfor the long-term preservation of semen. Muchprogress has been made in the production of balancedlivestock feeds, including the use of protein supple-ments such as urea and synthetic amino acids.Intensive management systems have been evolved,particularly for large-scale broiler poultry and eggproduction, and these are now spreading to thedeveloping countries.
Veterinary science has made substantial progress.It is now technically possible to control most of themore important animal diseases, although logisticaland other problems still generally make this verydifficult in practice. An especially promising achieve-ment in developing countries has been with the JP 15Rinderpest Programme in Africa. New techniques,such as the use of tissue culture mediums, havemade possible the rapid bulk production of betterand cheaper vaccines. Combined or polyvalentvaccines are increasingly being produced.
As regards fisheries, improvements in design andconstruction have resulted in more versatile andefficient fishing craft. Large stern trawlers havebeen developed which freeze and process at seaand can thus fish in distant waters for long periods.In many developing countries engines have increas-ingly been installed in small craft. Progress in thedesign, construction and operation of fishing gearand auxiliary equipment, and the application of elec-tronics to fish detection have made possible substan-tial increases in productivity. An important de-velopment has been the almost complete switch tosynthetic fibres for net materials.
Some of the main advances in forest technologyhave concerned plantations of quick-growing spe-cies, including improvements in tree breeding, withspecial emphasis on very fast-growing poplar hybrids,making intensive forestry possible on an increasinglywidespread basis. Important advances have beenmade in the utilization of tropical forest resources,for example for pulpwood. Improvements in equip-ment have included the rapid spread of petrol-pow-ered saws. New logging techniques and equipmentare resulting in more conversion at the raw materialsource. Aerial photography has increasingly beenused in forest inventory work.
Methods and equipment for the processing of agri-cultural products have developed rapidly. Whilemuch of the new equipment has tended to be increas-ingly labour saving, a trend of particular importanceto the developing countries has been the construc-tion of smaller equipment. Advances in processing
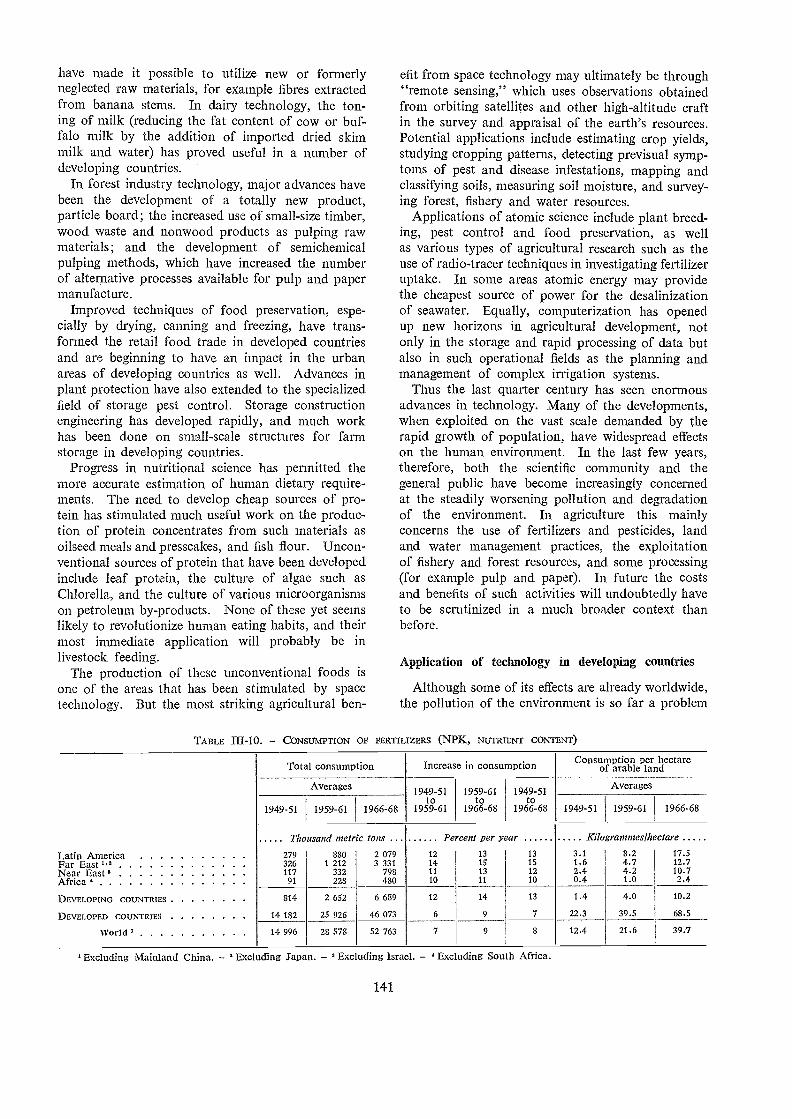
have made it possible to utilize new or formerlyneglected raw materials, for example fibres extractedfrom banana stems. In dairy technology, the ton-ing of milk (reducing the fat content of cow or buf-falo milk by the addition of imported dried skimmilk and water) has proved useful in a number ofdeveloping countries.
In forest industry technology, major advances havebeen the development of a totally new product,particle board; the increased use of small-size timber,wood waste and nonwood products as pulping rawmaterials; and the development of semichemicalpulping methods, which have increased the numberof alterna.tive processes available for pulp and papermanufacture.
Improved techniques of food preservation, espe-cially by drying, canning and freezing, have trans-formed the retail food trade in developed countriesand are beginning to have an impact in the urbanareas of developing countries as well. Advances inplant protection have also extended to the specializedfield of storage pest control. Storage constructionengineering has developed rapidly, and much workhas been done on small-scale structures for farmstorage in developing countries.
Progress in nutritional science has permitted themore accurate estimation of human dietary require-ments. The need to develop cheap sources of pro-tein has stimulated much useful work on the produc-tion of protein concentrates from such materials asoilseed meals and presscakes, and fish flour. Uncon-ventional sources of protein that have been developedinclude leaf protein, the culture of algae such asadore11a, and the culture of various microorganismson petroleum by-products. None of these yet seemslikely to revolutionize human eating habits, and theirmost immediate application will probably be inlivestock feeding.
The production of these unconventional foods isone of the areas that has been stimulated by spacetechnology. But the most striking agricultural ben-
Excluding Mainland China. ' Excluding Japan. Excluding Israel. Excluding South Africa.
141
efit from space technology may ultimately be through"remote sensing," which uses observations obtainedfrom orbiting satellites and other high-altitude craftin the survey and appraisal of the earth's resources.Potential applications include estimating crop yields,studying cropping patterns, detecting previsual symp-toms of pest and disease infestations, mapping andclassifying soils, measuring soil moisture, and survey-ing forest, fishery and water resources.
Applications of atomic science include plant breed-ing, pest control and food preservation, as wellas various types of agricultural research such as theuse of radio-tracer techniques in investigating fertilizeruptake. In some areas atomic energy may providethe cheapest source of power for the desalinizationof seawater. Equally, computerization has openedup new horizons in agricultural development, notonly in the storage and rapid processing of data butalso in such operational fields as the planning andmanagement of complex irrigation systems.
Thus the last quarter century has seen enormousadvances in technology. Many of the developments,when exploited on the vast scale demanded by therapid growth of population, have widespread effectson the human environment. In the last few years,therefore, both the scientific community and thegeneral public have become increasingly concernedat the steadily worsening pollution and degradationof the environment. In agriculture this mainlyconcerns the use of fertilizers and pesticides, landand water management practices, the exploitationof fishery and forest resources, and some processing(for exEtmple pulp and paper). In future the costsand benefits of such activities will undoubtedly haveto be scrutinized in a much broader context thanbefore.
Application of technology in developing countries
Although some of its effects are already worldwide,the pollution of the environment is so far a problem
Thousand nzetric tons Percent per y ar Kilogrammeslhectare
Latin America 279 880 2 079 12 13 j 13 3.1 8.2 17.5Far East 326 1 212 3 331 14 15 15 1.6 4.7 12.7Near East 117 332 798 11 13 12 2.4 4.2 10.7Africa 91 228 480 10 11 10 0.4 1.0 2.4
DEVELOPING COUNTRIES 814 2 652 6 689 12 14 13 1.4 4.0 10.2
DEVELOPED COUNTRIES 14 182 25 926 46 073 6 9 7 22.3 39.5 68.5
VVorld' 14 996 28 578 52 763 7 9 8 12.4 21.6 39.7
TABLE CONSUmPTION OF FERTILIZERS (NPK, NUTRIENT CONTENT)
Total consumption Increase in consumption Consumption per hectareof arable land
Averages 1949-51 1959-61 1949-51Averages
to to to1949-51 1959-61 1966-68 1959-61 1966-68 1966-68 1949-51 1959-61 1966-68
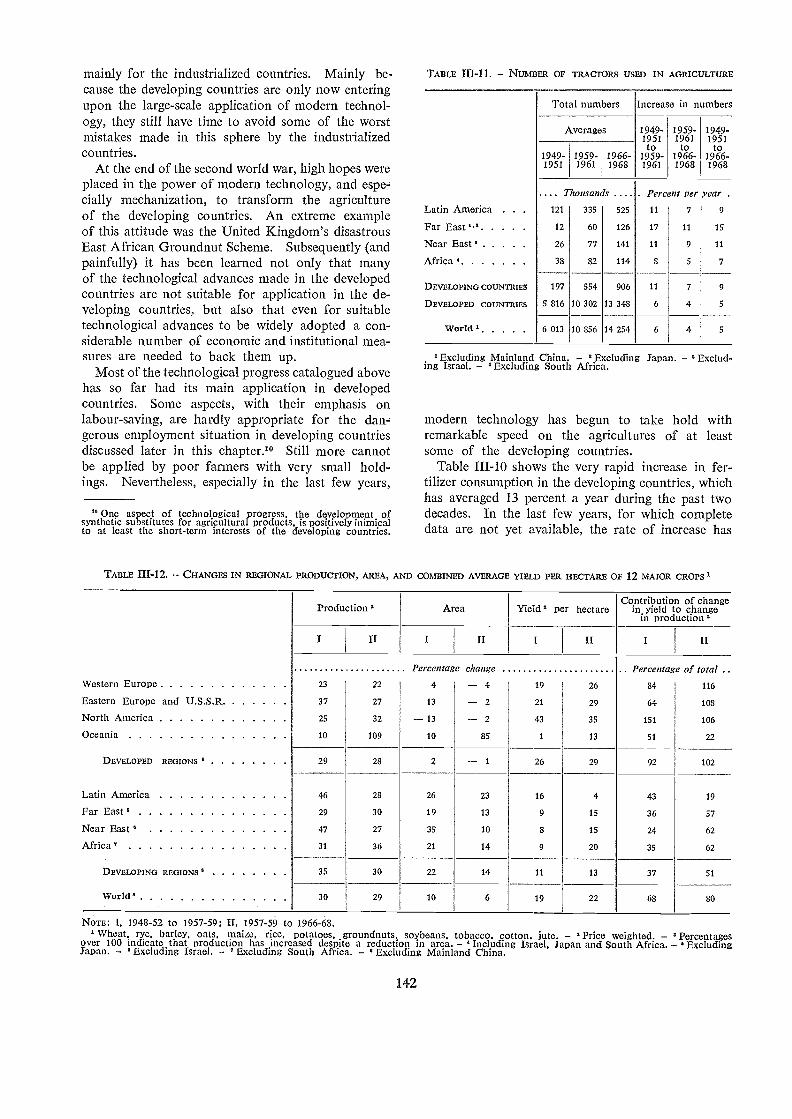
mainly for the industrialized countries. Mainly be-cause the developing countries are only now enteringupon the large-scale application of modern technol-ogy, they still have time to avoid some of the worstmistakes made in this sphere by the industrializedcountries.
At the end of the second world war, high hopes wereplaced in the power of modern technology, and espe-cially mechanization, to transform the agricultureof the developing countries. An extreme exampleof this attitude was the United Kingdom's disastrousEast African Groundnut Scheme. Subsequently (andpainfully) it has been learned not only that manyof the technological advances made in the developedcountries are not suitable for application in the de-veloping countries, but also that even for suitabletechnological advances to be widely adopted a con-siderable number of economic and institutional mea-sures are needed to back them up.
Most of the technological progress catalogued abovehas so far had its main application in developedcountries. Some aspects, with their emphasis onlabour-saving, are hardly appropriate for the dan-gerous employment situation in developing countriesdiscussed later in this chapter." Still more cannotbe applied by poor farmers with very small hold-ings. Nevertheless, especially in the last few years,
" One aspect of technological progress, the development ofsynthetic substitutes for agricultural products, is positively inimicalto at least the short-terra interests of the developing countries.
Production '
142
TABLE III-11. NUMBER OF TRACTORS USED IN AGRICULTURE
Area
Total numbers
Averages
Yield ' per hectare
Increase in numbers
1949-1951to
1959-1961
Excluding Mainland China. ° Excluding Japan. ° Exclud-ing Israel. Excluding South Africa.
modern technology has begun to take hold withremarkable speed on the agricultures of at leastsome of the developing countries.
Table III-10 shows the very rapid increase in fer-tilizer consumption in the developing countries, whichhas averaged 13 percent a year during the past twodecades. In the last few years, for which completedata are not yet available, the rate of increase has
TABLE 111-12. CHANGES IN REGIONAL PRODUCTION, AREA, AND COMBINED AVERAGE YIELD PER HECTARE OF 12 MAJOR CROPS 1
Contribution of changein yield to change
in production '
1949-1951to
1966-1968
Non: I, 1948-52 to 1957-59; II. 1957-59 to 1966-68.Wheat, rye, barley, oats, maize, rice, potatoes, groundnuts. soybeans, tobacco. cotton, jute. ' Price weighted. Percentagesover 100 indicate that production has increased despite a reduction in area. Including Israel, Japan and South Africa. ExcludingJapan. ° Excluding Israel. ' Excluding South Africa. ' Excluding Mainland China.
I II II II II
Percentage change Percentage of total ..Western Europe 23 22 4 4 19 26 34 116
Eastern Europe and USSR 37 27 13 2 21 29 64 108
North America 25 32 13 2 43 35 151 106
Oceania 10 109 10 85 1 13 51 22
DEVELOPED REGIONS 29 28 2 26 29 92 102
Latin America 46 28 26 23 16 4 43 19
Far East ' 29 30 19 13 9 15 36 57
Near East 47 27 35 10 15 24 62
Africa 31 36 21 14 9 20 35 62
DEVELOPING REGIONS 35 30 22 14 11 13 37 51
World ° 30 29 10 6 19 22 68 80
.... Thousands .... Percent per year .
Latin America 121 335 525 11 7 9
Far East '," 12 60 126 17 11 15
Near East ' 26 77 141 11 9 11
Africa 38 82 114 8 5 7
DEVELOPING COUNTRIES 197 554 906 11 7 9
DEVELOPED COUNTRIES 5 816 10 302 13 348 6 4 5
World 6 013 10 856 14 254 6 4 5
1949- 1959- 1966-1951 1961 1968
1959-1961to
1966-1968
accelerated substantially in a number of countries,particularly in the Far East. Fertilizer consumptionper hectare of arable land in the developing countriesas a whole was seven times as great in 1966-68 asin 1949-51, although still only one seventh of thatin the developed countries.
Tractor numbers have increased almost as rap-idly (Table III-11). For pesticides, irrigated area,tube wells and other inputs, comprehensive data arenot available, but here too there have been very
Partly conditioning the trends discussed above,partly in response to them, there have been a seriesof changes during the past 25 years in the policies,approaches and attitudes to development of govern-ments and the international community.
The present section examines some of the principalpolicy areas. It begins with an account of agricul-tural pluming, which is now a major tool of develop-ment in almost all of the developing countries. Theneed for changes in the rural institutional frameworkis one of the main postwar lessons in agriculturaldevelopment, and this is the second topic to be takenup. Population policy is next discussed, since attitudesto this crucial subject are so closely tied to thoseon agricultural development. Finally, there is somediscussion of the two main areas that involve the de-veloped as well as the developing countries: inter-national trade policies and development assistance.
Agricultural planning
A principal feature of the postwar period has beenthe adoption of national planning by developingcountries. While the early example of planning inthe U.S.S.R. and the efforts of the developed coun-tries to mobilize resources for the war effort andpostwar reconstruction were no doubt influential,the impelling force has been the urge to overcomeeconomic backwardness and promote social advance,especially in countries that have recently achievedpolitical independence.
By the second half of the 1950s, the formulation ofplans, generally for five years, liad become establishedpractice through much of the Far East, and wasrapidly spreading in the Near East and Africa. Thelast to enter the field, on the whole, were the countriesof Latin America, most of which drew up theirfirst plans only in the first half of the 1960s. An
143
rapid increases. In general the farmers of the de-veloping countries are coming to rely more and moreon the use of purchased inputs, and this, togetherwith the growing proportion of their output that ismarketed, is bringing them further into the monetaryeconomy.
Another indication of the increasing role of moderntechnology is the growing contribution of risingyields, as opposed to the extension of area, in theexpansion of production (Table 111-12).
Agricultuural development policies
important stimulus to the widespread adoption ofplanning has come from the economic survey mis-sions of the International Bank for Reconstructionand Development (mRD), which in some countries(for example Iraq and Tanzania) provided the firstelements for national plans. Bilateral aid agencies,anxious to ensure that the resources made availableby them are used efficiently, have been anotherstimulus. The spread of planning in Latin Americain particular owes much to the insistence of the Unit-ed States on national development plans as a condi-tion for participation in the Alliance for Progress,established in 1961.
Many of the earlier plans tended to neglect agri-culture in comparison with other sectors of the econ-omy. One reason was the special difficulties ofplanning for the agricultural sector. Because of thebiological nature of agricultural production, it isdifficult to predict the level of output from a givenlevel of input; the output is affected by exogenousfactors such as weather, and pests and diseases.Because of the large number of small productionunits, it is necessary to influence the production deci-sions of many individual farmers in order to reachplanned targets.
Another reason for the neglect of agriculture wasthe concentration on rapid industrialization as themost obvious means of modernizing the economy,and the failure to realize the extent to which thiscould be jeopardized by the absence of a sound agri-cultural base. One of the more promising featuresof the 1960s was a growing realization, generallythrough painful experience, of the crucial role ofagriculture in overall economic development. Inmany countries lagging agricultural productionbrought rising food prices (and thus an inflation ofindustrial wages) and rising food imports (whichdiverted scarce foreign exchange from the purchaseof the capital goods needed for industrialization).
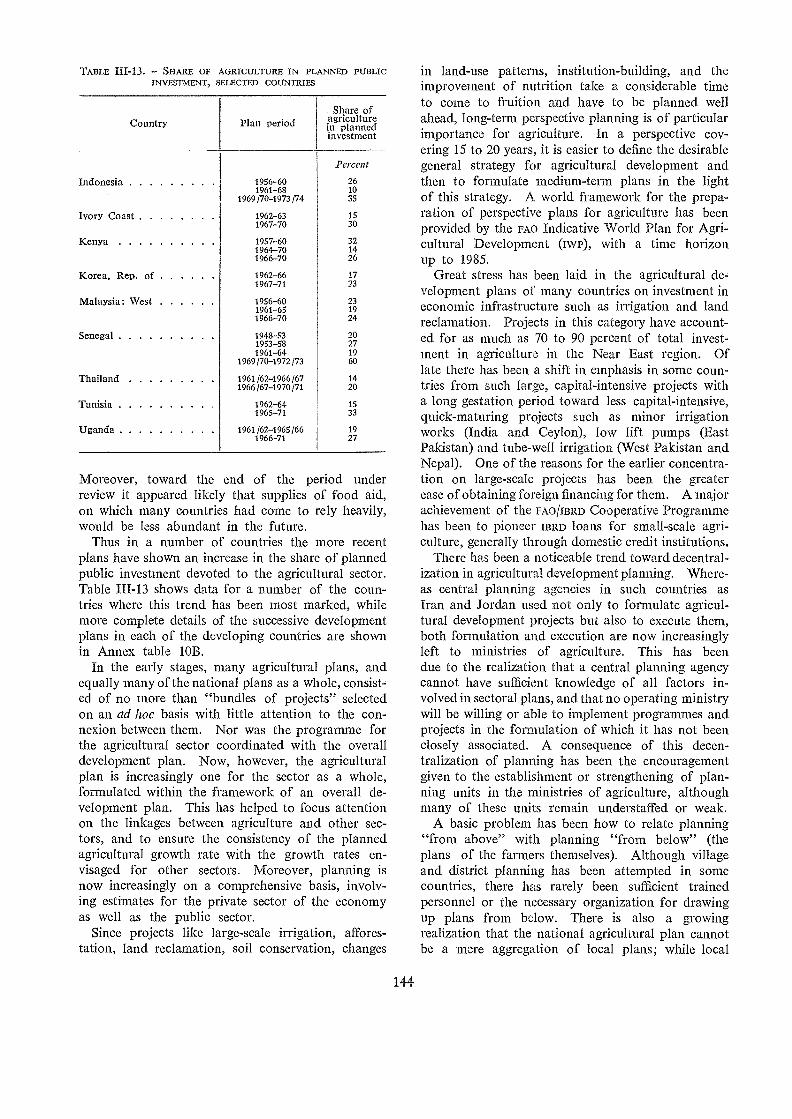
TAI3LE 111-13. - SHARE OF AGRICULTURE IN PLANNED PUBLICINVESTMENT, SELECTED COUNTRIES
Country
Indonesia
Ivory Coast
Kenya
Korea, Rep. of
Malaysia: West
Senegal
Thailand
Tunisia
Uganda
Plan periodShare of
agriculturein plannedinvestment
Percent
1956-60 261961-68 10
1969 /70-1973 /74 35
1962-63 151967-70 30
1957-60 321964-70 141966-70 26
1962-66 171967-71 23
1956-60 231961-65 191966-70 24
1948-53 201953-58 271961-64 19
1969 /70-1972 /73 60
1961 /62-1966 /67 141966 /67-1970 /71 20
1962-64 151965-71 33
1961/62-1965/66 191966-71 27
Moreover, toward the end of the period underreview it appeared likely that supplies of food aid,on which many countries had come to rely heavily,would be less abundant in the future.
Thus in a number of countries the more recentplans have shown an increase in the share of plannedpublic investment devoted to the agricultural sector.Table 111-13 shows data for a number of the coun-tries where this trend has been most marked, whilemore complete details of the successive developmentplans in each of the developing countries are shownin Annex table 10B.
In the early stages, many agricultural plans, andequally many of the national plans as a whole, consist-ed of no more than "bundles of projects" selectedon an ad hoc basis with little attention to the con-nexion between them. Nor was the programme forthe agricultural sector coordinated with the overalldevelopment plan. Now, however, the agriculturalplan is increasingly one for the sector as a whole,formulated within the framework of an overall de-velopment plan. This has helped to focus attentionon the linkages between agriculture and other sec-tors, and to ensure the consistency of the plannedagricultural growth rate with the growth rates en-visaged for other sectors. Moreover, planning isnow increasingly on a comprehensive basis, involv-ing estimates for the private sector of the economyas well as the public sector.
Since projects like large-scale irrigation, affores-tation, land reclarnation, soil conservation, changes
144
in land-use patterns, institution-building, and theimprovement of nutrition take a considerable timeto come to fruition and have to be planned wellahead, long-term perspective planning is of particularimportance for agriculture. In a perspective cov-ering 15 to 20 years, it is easier to define the desirablegeneral strategy for agricultural development andthen to formulate medium-term plans in the lightof this strategy. A world framework for the prepa-ration of perspective plans for agriculture has beenprovided by the FAO Indicative World Plan for Agri-cultural Development (twP), with a time horizonup to 1985.
Great stress has been laid in the agricultural de-velopment plans of many countries on investment ineconomic infrastructure such as irrigation and landreclamation. Projects in this category have account-ed for as much as 70 to 90 percent of total invest-ment in agriculture in the Near East region. Oflate there has been a shift in emphasis in some coun-tries from such large, capital-intensive projects witha long gestation period toward less capital-intensive,quick-maturing projects such as minor irrigationworks (India and Ceylon), low lift pumps (EastPakistan) and tube-well irrigation (West Pakistan andNepal). One of the reasons for the earlier concentra-tion on large-scale projects has been the greaterease of obtaining foreign financing for them. A majorachievement of the FAO/IBRD Cooperative Programmehas been to pioneer IBRD loans for small-scale agri-culture, generally through domestic credit institutions.
There has been a noticeable trend toward decentral-ization in agricultural development planning. Where-as central planning agencies in such countries asIran and Jordan used not only to formulate agricul-tural development projects but also to execute them,both formulation and execution are now increasinglyleft to ministries of agriculture. This has beendue to the realization that a central planning agencycannot have sufficient knowledge of all factors in-volved in sectoral plans, and that no operating ministrywill be willing or able to implement prograrrunes andprojects in the formulation of which it has not beenclosely associated. A consequence of this decen-tralization of planning has been the encouragementgiven to the establishment or strengthening of plan-ning units in the ministries of agriculture, althoughmany of these units remain understaffed or weak.
A basic problem has been how to relate planning"from above" with planning "from below" (theplans of the farmers themselves). Although villageand district planning has been attempted in somecountries, there has rarely been sufficient trainedpersonnel or the necessary organization for drawingup plans from below. There is also a growingrealization that the national agricultural plan cannotbe a mere aggregation of local plans; while local

plans should be reflected in the national plan, theymust be consistent with the overall objectives andsubject to the availability of investment resources.
While some improvements in the techniques andorganization of agricultural development planninghave taken place over the years, the record of planimplementation in most developing countries hasbeen unsatisfactory. Actual achievements have fre-quently fallen short of the targets set, sometimesbecause the targets themselves were unrealistic, butmore often because of ineffective implementation.In a number of countries the realized investmenthas not reached the planned .targets, either becauseof the slow pace of implementation or because ofinability to raise the necessary funds. In others,the investment targets have been more or less achievedbut not the output targets, since the complementaryinvestments needed have not taken place or the re-quired inputs have not been provided. This has beenparticularly noticeable in respect of large-scale irri-gation, the disappointing results of which in a numberof countries have mainly been due to failure to pro-vide adequate drainage and latid levelling for satis-factory water use, or to encourage the intensive useof irrigated land.
Nor has there been a close coordination betweenthe development plan and the annual budget, throughwhich the necessary financial resources are madeavailable to implement the plan. In the majorityof developing countries insufficient attention has beenpaid to using the budget as the financial counter-part of the plan, both providing for the planned publiccapital and current expenditures and showing thetotal financial resources available for .the public sectorof the plan.
The gap between sectoral planning and the prepa-,ration of projects has also been responsible for weak-nesses in implementation. While ambitious targetshave been set for the agricultural sector, they haveseldom been translated into viable projects, with theresult that the targets have not been realized. Thecurrent state of project identification, preparation,selection and appraisal in the developing countriesis still far from satisfactory, although improvementsare gradually taking place, due especially to pressurefrom bilateral and multilateral aid agencies as wellas from national planning organizations.
Closely linked to these difficulties has been theshortage o.f trained personnel for the preparationand execut.ion of projects, which has often beeninsufficiently considered when targets have beenset. The lack of such personnel has been one of thereasons why actual expenditures on programmes andprojects have fallen short of planned allocations.
A major weakness in the implementation of mostagricultural plans has been the lack of appropriatepolicies and measures in such fields as extension,
145
credit, marketing and prices, to ensure the effectiveimplementation of investment projects and the achieve-ment of planned targets. In many countries no attempthas been made to relate the targets to the policiesand measures needed to achieve them, although inrecent years, as discussed in the following section,there have been some hnprovements in this regard.
There seems to be increasing recognition, both inthe developing countries themselves and among theinternational and bilateral aid agencies, that differentcountries require very different approaches to plan-ning. There is a wide variety of situations as regardsexperience with planning and the availability of thenecessary administrative, organizational and statis-tical bases for it. While a few countries have reach-ed a level where plans can be formulated on thebasis of sophisticated techniques and implementedwith reasonable efficiency, many others are at astage where only the most rudimentary planning ispossible. The great majority of developing coun-tries probably fall somewhere between these extremes.There is now greater awareness than before of theneed for improving statistical information and admin-istrative structure, and training additional personnelto undertake the various tasks of planning.
The harmonization of plans, on a regional orsubregional basis, is increasingly seen as a means ofcreating wider markets and making more rational useof resources. The number of economic cooperationor integration schemes in varying degrees of progressin the developing world has increased steadily. Untilrecently, however, there had been some tendencyto neglect the agricultural aspects of such intra-regional cooperation.
Rural institutions
Not only did many of the earlier developmentplans pay insufficient attention to the policies andmeasures needed to secure the achievement of plannedtargets but there was also a tendency, especiallyin the immediate postwar years, to try to introducetechnological improvements without the institutionalmeasures needed to back them up.
In reeen.t years the need for changes in the eco-nomic, social and institutional environment in whichfarmers live and work has been increasingly recog-nized. However, success in this field has provedparticularly difficult to achieve. It is highly demand-ing not only on the financial resources of govern-ments but also on their administrative skills, whichare sometimes even scarcer. It is a difficult field forforeign assistance, because rural institutions mustfit very closely the particular circumstances of eachcountry. Progress in some aspects is bound tobe too slow to have much attraction for politicians.
The crucial field of land reform comes up againstpowerful vested interests.
In spite of these difficulties, soine progress hasbeen achieved. There has been, for example, aconsiderable expansion in facilities for trainingfarmers, and for the training and education of thepersonnel required to staff government agriculturalservices. Generally speaking, however, the educa-tion systems in developing countries are still modelledmuch too closely on those that have been evolvedin the developed countries, with their vastly differentresources and needs.
This is particularly reflected in the difficulty ofobtaining well-qualified staff to work in the agricul-tural field services, and especially in the all-importantextension services. Even when suitable staff canbe attracted, the effectiveness of the extension servicesis often seriously reduced by insufficient equipment,transport and other facilities. Only a few developingcountries have so far made a beginning in usingmodern methods of farm broadcasting and televisionto reach the millions of scattered farmers, thoughthe development of increasingly cheap transistorradios suggests that, in future, this will be an im-portant method in most countries.
One of the principal changes in the agricultureof the developing countries during the past 25 yearshas been the steady transition from production mainlyfor the subsistence of the farmer and his familyto more market-oriented production. The increas-ing purchase of production requisites has alsobrought farmers further into the money economy.Consumers have increasingly been concentrated inlarge towns, and their consumption has been diver-sified as their incomes have risen. All these trendshave meant increasing demands on the marketingsector, in the supply of farm inputs as well as thedistribution of the output.
In most countries the private sector has providedmost of the additional marketing facilities and ser-vices required, although governments have had tofurnish them in such areas as price stabilization,market regulations, grades and standards, research,extension, market information, and the provisionof infrastructure and certain facilities. Some gov-ernments have attempted to take over large sectionsof the marketing chain, often with poor results interms of efficiency. In fact, a fairly general lessonof the past 25 years has been that governments woulddo well to make use of existing facilities and servicesas far as possible, working through the market mech-anism and correcting it when necessary, and reserv-;ing their own limited resources for the activitiesthat only they can undertake.
There have been substantial changes in governmentprice policies for agricultural products. In theearlier postwar years these were mainly aimed in
146
developing countries at securing low food pricesfor consumers. Governments were generally waryof the cost of incentive farm price policies, whilethere was also a widespread belief that small semi-subsistence producers did not increase their produc-tion in response to price changes. However, thepersistent lag in domestic food production, combinedwith increasing evidence of producers' response toprices, has caused more and more countries, espe-cially in the Far East, in the last few years to adoptor strengthen in.centive price policies, or at leastprice stabilization schemes to remove the major dis-incentive of highly fluctuating prices. Incentive pricesappear to have made an important contributionto the recent upsurge of food production in a numberof Far Eastern countries.
Most developing countries still have considerabledifficulty in implementing price stabilization schemesin such a way as to reach the great mass of smallfarmers. This becomes even more important inview of the delicate problems of price policy posedby the high-yielding varieties of cereals, as discussedlater in this chapter. Another indication of thechanging situation is that, whereas many govern-ments have found subsidies on inputs such as fertil-izers helpful in promoting their more widespreaduse, some of them are now considering the taxationof inputs as a means of mobilizing some of the pro-ceeds of the newly profitable cereal production. In-dia, for example, introduced a 10 percent tax onfertilizers in 1969. Some countries, especially inLatin America, have recently been experimentingwith systems of land taxation designed to encouragemaximum productivity and penalize the unproduc-tive use of land.
Farmers' needs for credit have increased steadilyas their production has become more dependent onthe use of purchased inputs. Many new sourcesof institutional credit have been set up during thepast 25 years, although noninstitutional sourcessuch as private traders, moneylenders and relativesstill predominate heavily. In most countries it hasproved difficult for institutional sources, in spite oftheir much lower interest rates, to compete with thespeed, lack of formalities, and additional servicesfurnished by noninstitutional sources. Moreover,in general, the banking system has not so far beenvery effective in mobilizing the savings of the ruralpopulation, and has thus had to rely heavily on finan-cial support from the government for its agriculturallending operations.
Supervised credit has enjoyed a vogue in manycountries, especially in Latin America. While itsusefulness is now generally accepted, it is however,usually too costly for widespread application.
Most governments have attempted to developviable farmers' organizations suited to the circum-
stances of the country. Cooperatives were initiallychosen, especially in newly independent countries,as a promising approach to the creation of a moredemocratic and equitable society. Mainly becauseof the lack of trained cooperative managers, however,it is now generally recognized that, at least for sometime to come, these organizations are more likelyto be associations operated cooperatively by thegovernment and local farmers than true cooperatives.Much attention has been devoted to emulating thehighly successful farmers' associations of China(Taiwan) and Japan, which combine a number ofimportant fun.ctions, including marketing, input sup-ply, storage, credit, savings, extension, and the pro-vision of a focal point for farmers' active participationin development. Cooperative farming, sometimesincluding the pooling of land and other resources,is finding increasing favour in some countries, not-withstanding serious setbacks due primarily to inex-perience and lack of managerial competence.
Many attempts have been made to alter the out-m.oded systems of land tenure which in many coun-tries not only hamper production but are also anoffence to human justice. Many well-prepared landreform schemes have come to nothing because oflack of the necessary political will to hnplement themeffectively. Equally, in some cases when the polit-ical will has been there, land reform has failed tohave its proper impact because its technical aspectswere ill prepared. An important lesson that has beenlearned is that the redistribution of holdings is onlythe beginning of land reform, and that this mustbe followed up by a variety of measures to help thenew lan.downers increase their production.
Especially in Africa the gradual process of modern-ization and commercialization of production hasitself brought changes in land tenure. Some successhas also been achieved in the less spectacular fieldsof land tenure improvement, such as the regulationof tenancy and sharecropping. These regulationshave, however, proved very difficult to enforce in manycountries. They are particularly important in areaswhere cereal production has become newly profit-able with the high-yielding varieties and some erst-while noncultivating landlords are seeking to re-cover lan.d from their tenants.
There has been much study of how best to deploythe limited resources of the government for pro-viding farmers with essential facilities and services.An important problem is the need to advance onall fron.ts at once, because of the complementarityof the different elements in the "package" of inputs,services and policies. A frequent solution, usedmost notably in India and Pakistan, has been toconcentrate the scarce government resources in lim-ited favourable areas, instead of spreading then-ithinly over the whole country.
147
Government services to agriculture have generallytended to be unduly concentrated at headquarterslevel in the national and provincial capitals and indistrict centres. All too few resources are availableat field level, in the market towns and villages thatare in close touch with farmers and their problems.
Population -policy
Just as the so-called population explosion in thedeveloping countries has been one of the most in-fluential phenomena of the past quarter century, onthe plane of policies and attitudes a major develop-ment of the latter part of this period has been anincreasingly widespread recognition of the need inmost of these countries for governments to encourageand assist family planning.
This change in attitudes has been particularlymarked within the international community. Pop-ulation problems have been an important field ofactivity for the United Nations from its very incep-tion (the Population Commission was establishedin 1946 to advise the Economic and Social Council),but it was only in the 1960s that the widespread needfor active population policies in the developing coun-tries became sufficiently urgently felt to bring abouta shift in the international approach from study toaction.
Many factors have contributed to the gradual accep-tance of the necessity to act. These include theacceleration of the population growth rates them-selves, and the increasing flow of information andstudies about population problems and prospectsemanating over the years from the United Nationsand other bodies. A major influence has been thegradual realization that economic development islikely to be a slower process than was thought inthe earlier postwar years, and that the limited prog-ress being made is all too often largely nullified byrapid population growth. In particular, great con-cern has been felt at the disappointingly slow growthof agricultural production in many developing coun-tries, which seemed seriously to raise doubts as towhether these countries (or even the world as awhole) would be able to feed themselves properlyin the long run. Increasingly, however, the argumenthas shifted from rather academic discussions of theultimate carrying capacity of the world or of in-dividual countries to the practical effects of rapidrates of population growth in sparsely and denselypopulated countries alike.
The recent evidence of a technological break-through in agriculture in some of the developingcountries may have somewhat reduced the fears ofan imminent food crisis. But in the meantime otheradverse consequences of high rates of population
growth have become better understood and morewidely known, giving continued urgency to activitiesin this field. These include the problems of unem-ployment and underemployment discussed later intnis ,ehapter.
iel with the development of international poli-I. this field, family .planning has emerged as a
policy instrument in an increasing number of develop-ntries. India and Pakistan had already es-
-:1 national family planning programmes in1955 respectively, but it was not until
.Jsiltat a significant number of other govern-'undertook such programmes. Family plan-
..eceived its initial stimulus in Asia, where byo-19 the majority of governments had adopted
oolicies. In Africa only a small number ofcountries have family planning programmes, and amajor need is to develop basic data and to analysepoptI,tion trends in relation to resources. FamilypliTitiog facilities are being promoted in an increas-ing number of countries in Latin America, wherethere are very high rates of population growth butwhere low population densities for a long time keptpolicies focused on the colonization of empty areas.Activities in this region are still, however, basedmainly on health considerations and run by nongov-ernmental organizations.
fieies
Considerable international efforts have been madeto expand the rate of growth of world trade in agri-cultural products (especially that of the developingcountries) in the face of the numerous obstaclesdiscussed earlier in this chapter and to reduce thefluctuations in the volume and value of this trade.So far, however, these efforts have met with onlylimited success.
To some extent, the limited progress reflects theeconomic and technological inevitability of someof the forces that have shaped postwar trends intrade, in particular the saturation level of the con-sumption of many products in the developed coun-tries, and the development of new chemical processesthat llave led to a host of synthetic substitutes foragricultural raw materials. But a major reason hasalso been the political and economic intractabilityof the problems of domestic agricultural adjustmentin :.sy developed countries, which has led to the
..caiince and even the expansion of agricultural
The iirst attempt to create comprehensive inter-national machinery to deal with the world's tradeproblems was tiir! drawing up in 1947 of the Havana
which to serve as the basis of an Inter-national Trade Organization. Following the fail-
148
-tire of a sufficient number of countries to ratifythe charter, efforts to solve trade problems llave beenpursued under the complex network of institutionalarrangements that has gradually evolved in linewith changing requirements and pressures. Broadly,these efforts have fallen into three categories: mea-sures to liberalize trade through negotiations ontariffs, quotas and other obstacles to trade; inter-national commodity agreements and arrangements;and comrnodity consultations. More recently, therehave been renewed attempts to search for broadersolutions, as in the two United Nations Conferenceson Trade and Development (1964 and 1963), through.the grzno.ing of generalized preferences by developedcountries, and through a call for policy discussionsamong governments aimed at the "internationaladjustment' of production and trade policies; butthese, llave not so far led to much concrete progress.
The principal instrument of tariff and trade nego-tiations has been the General Agreement on Tariffsand Trade (GATT). Concluded in 1947 after thefailure to ratify the Havana Charter, it covers thoseparts of the charter which set out a general "codeof conduct" in international trade relations: the prin-cipie of nondiscrimination in trade relations, the"most-favoured nation" clause, the spir.it and methodsof tariff cutting (negotiations with principal suppliersproduct by product, based on reciprocity of conces-sions), and the prohibition in principle of quantitativerestrictions.
These principles have been implemented througha series of tariff and trade negotiations, culminat-ing with the Kennedy Round that concluded in1967. While progress has been .made over the yearsin lowering tariffs and eliminating quotas on tradein. manufactured products, success with regard toagricultural products has been limited either becauseprotection has taken forms not considered to comeunder the competence of GATT or because countrieshave continued to maintain restrictions thraugh vari-ous waivers permitted under GATT, or in plain con-tradiction of it.
Equally important, .it has become increasinglyclear that .many of the principles Of GATT are notwell suited to the needs of the developing countries.Thus the developing countries pointed out that therule of reciprocity in trade negotiations soon leftthem with little to offer in return for concessions,and their participation in the successive tariff nego-tiations in fact gradually diminished. More .fun-damentally, they objected that formal reciprocity be-tween two economically unequal partners was not aguarantee of equal treatment.
The developing countries also objected to the pro-hibition of quantitative restrictions, because of theirgreater flexibility as compared with tariffs. At thesame time, tariffs generally remain an important
source of revenue for the developing countries, andare frequently maintained even while quotas areimposed. In practice, however, the various excep-tions to the prohibition of quotas, 'mainly on thebasis of balance of payments difficulties, have en-abled develo ping countries to maintain their structureof quotas largely intact.
Finally, developing countries have objected to theprinciple of nondiscrimination in trade relations,because by preventing them from discriminating infavour of each other (except through the creationof free trade areas and customs unions) it has, intheir view, hindered them from expanding tradewith other developing countries.
Under the pressure of events and the growing nu-merical and political weight of the developing countriesin international forums, the work of GATT has in-creasingly taken these objections into account. Inparticular, following the first United Nations Con-ference on Trade and Development (uNc-rAD) in1964, the Contracting Parties of GATT approved inearly 1965 a new chapter of the agreement dealingwith trade and development, and the establishmentof a permanent committee to take action under it.And following the clear failure of the developingcountries (and agricultural exporters in general) tobenefit in any significant measure from the protractedKennedy Round of trade negotiations, the Contract-ing Parties took new initiatives to liberalize and ex-pand trade in farm products in 1967, by reactivatingthe Special Group on Tropical Products and byestablishing a new Agricultural Committee. Thelatter has been active in collecting and analysinginformation on national production and trade poli-cies for a wide range of products, with a view toextending trade liberalization to them.
Similar changes have taken place with regard tothe philosophy and techniques of commodity agree-ments. The principles originally included under Chap-ter VI of the Havana Charter were 'taken over asguidelines for action in this field by ECOSOC and byits Interim Co-ordinating Committee on InternationalCommodity Agreements (tccicA), established inMarch 1947. In keeping with prewar experience,the charter envisaged the conclusion of commodityagreements principally in situations where either"a burdensome surplus of a primary commodity" or"widespread imem,ployment or underemploy.ment inconnexion with a primary commodity ... has de-veloped or is expected to develop" ancl which "wouldnot be corrected by normal market forces in timeto prevent ... hardship."
The success of commodity arrangements underthis philosophy has, as far as developing countriesare concerned, been limited. The International SugarAgreement, first negotiated in 1953, proved unableto cope with really large changes in the balance of
149
supply an.d demand. It became inoperative in 1961,though it has recently been renegotiated on a some-what different basis.
Even the basic principles of the .Havan.aare no longer considered adequate to 'meet the tnninproblems of the developing countries. As the down-ward trend of the prices of many prinia,-.,! productshas continued and as the export efire,.ins of thedeveloping countries have failed to increw:: connont-handy with their import needs, thes::, noinniva,have increasingly realized the necessi.ty.for commodityagreements to guarantee not only the s'eoct- :unitstability of prices but also a predictalr.1::: :u'onithof export earnings, and requested suchas preventive action rather than only ai; a m ce;rescuing exporters from emergency situnrons.
The new, development-oriented philosol-; ,7 c.rmodity arrangements found coliereni: e;:pecssio.the first time in the Final Act of the 1.
This specified, in addition, that conirnenii;y n,Tange-inents should be made more comprehen:::ve in scopeand include provisions not only on pric. and quan-tities but also on the "coordination of eation'production and consumption policies, ... realisticguarantees to developing countries of terms of accessto markets of developed countries ensuring o f:ii.and reasonable share of the market and of rnarl-growth," and on market promotion andment.
Application of the new princit,tEven, in the case of commodities i':.)!!plementation of an arrangementpart on the importing countries,at a workable agreement. l'he o,.cation so 'far is the International Cofirst negotiated in 1962, and evert here ps.ogi cltasbeen slow. Not until 1968, !
study of the production potentiol andcies for diversification away from co;t.ber of countries, were specific
pro(:andan internationally finan.cedtion Fund established to assist in. ..m.The latest agreement gives the conncil the powerto refuse increases in export quotas to countrieswhich are not moving toward agreed productiongoals.
The new International Sugar Agreement,tiated in 1968, contains some provisions which en.einnean element of preference in favour of develoyIngcountries, for example in the distri'oution of quoto.increases. However, neither this areemen.',- ior thebilateral agreements covering the ()filet ior of theworld sugar trade make much co'; ibid ion 'to a long-er term equilibrium.
The Food Aicl Convention of the.Grains Arrangement of 1967 includes nfavouring developing countries. This Prov'. e
at least 25 percent of the cash contributions under theconvention should be used for purchases from devel-oping countries, which should amount to a minimumof 200 000 tons of grain per year (or 4.7 percentof the total).
The postwar history of commodity consultationscan also be traced back to the Havana Charter, whichenvisaged their function as to "investigate the pro-duction, consumption and trade situation in regardto the commodity" in connexion with "special diffi-culties which exist or may be expected to arise"(Article 58). Aside from commodity councils ad-ministering commodity arrangements, there are nowa total of 14 commodity consultative or study groups,3 of them dating from before 1939 (rubber;cotton; and wool) and 11 (bananas; citrus fruit;cocoa; grains; hard fibres; jute, kenaf and alliedfibres; meat; oilseeds, oils and fats; rice; tea; wineand wine products) set up by the FAO Committee onCommodity Problems (ccr).
None of the commodity study groups has so farled to the negotiation of a formal commodityarrangement, but work done in the group on cocoaand in the ad hoc consultations on tea and earlieron olive oil has provided a valuable basis for furthernegotiations. Studies and consultations under thecommodity groups, together with intergovernmentaldiscussions in the broader groups such as the CCPitself and the Committee on International CommodityTrade (cic-r), have also contributed to the stabilityof commodity markets by the exchange of statisticaland other information, and by developing a betterunderstanding of the problems involved.
Two recent developments suggest that the role ofsuch groups may acquire additional significance inthe future. First, although the CCP principles gov-errting the establishment of study groups basicallyreflect the Havana Charter's philosophy of action inresponse to a crisis, the considerations which prompt-ed the recent establishment of a Study Group onMeat, as well as the discussions in recent years inthe groups dealing with rice and fats and oils, suggestthat here too the pressures from the developing coun-tries are tending to transform them increasinglyinto development-oriented instruments for the ex-pansion of trade.
Secondly, some study groups have recently founda new dimension for their activities in the promotionof informal understandings between producing andconsuming countries on appropriate price levels andmarketed quantities. The FAO groups on jute andallied fibres and on hard fibres have made useful prog-ress in this regard in the complex situation createdby the increasingly heavy competition from syntheticproducts in a widening range of end uses. Teaexporters have also agreed on an informal quotaarrangement for 1970. Such informal understandings
150
may have a growing role in the future, either as analternative to a formal and binding commodityarrangement or as an intermediate stage.
The search for broader solutions to the trade prob-lems of the developing countries has been a featureof the international scene throughout the past 25years witness the early attempts to set up anInternational Trade Organization and the successiveefforts within FAO at about the same time to establisha World Food Board and an International Commo-dity Clearing House. The principal recent initiativeof this kind is the establishment of UNCTAD as ablanket organization under which such policies canbe pursued. Specific attempts include those withinGATT and UNCTAD to draw up a generalized systemof preference in favour of developing countries.
Efforts have also been made to mitigate the impactof fluctuating export earnings on the economies ofthe developin.g countries. The first concrete stepin this direction was taken by the InternationalMonetary Fund (imr) in 1963 with the introductionof machinery for compensatory financing. Thoughexpanded and liberalized in 1966, this is confined to theprovision of short-term balance of payments sup-port to reduce the impact of fluctuations in exportearnings. It has become increasingly clear thatsuch support is inadequate to deal with cases wheredevelopment plans are jeopardized by adverse trendsin export proceeds. The IBRD proposals for provid-ing supplementary financing now being consideredby an intergovernmental group set up by UNCTADwould go a considerable way toward guaranteeingthe projected export earnings of individual developingcountries at the level required for the implementationof agreed development.
Development assistance
Except for the limited efforts made by the colonialpowers and by the League of Nations and the Inter-national Labour Office (Iw) in the 1930s, develop-ment assistance is a postwar phenomenon. Thepurchase of the capital goods needed for acceler-ated economic and social development has involvedsubstantial financial loans and grants to augmentthe foreign exchange earned by exports, especiallyin view of the adverse trends in these earnings discuss-ed earlier. Another main need of the developingcountries has been for technical assistance to aug-ment their supplies of trained manpower.
The bulk of international assistance remains bilat-eral. Although the share of multilateral aid hasincreased, even today it accounts for no more than10 percent of the total.
In quan.titative terms, the flow of finance to devel-oping countries initially..grew rapidly, from an average
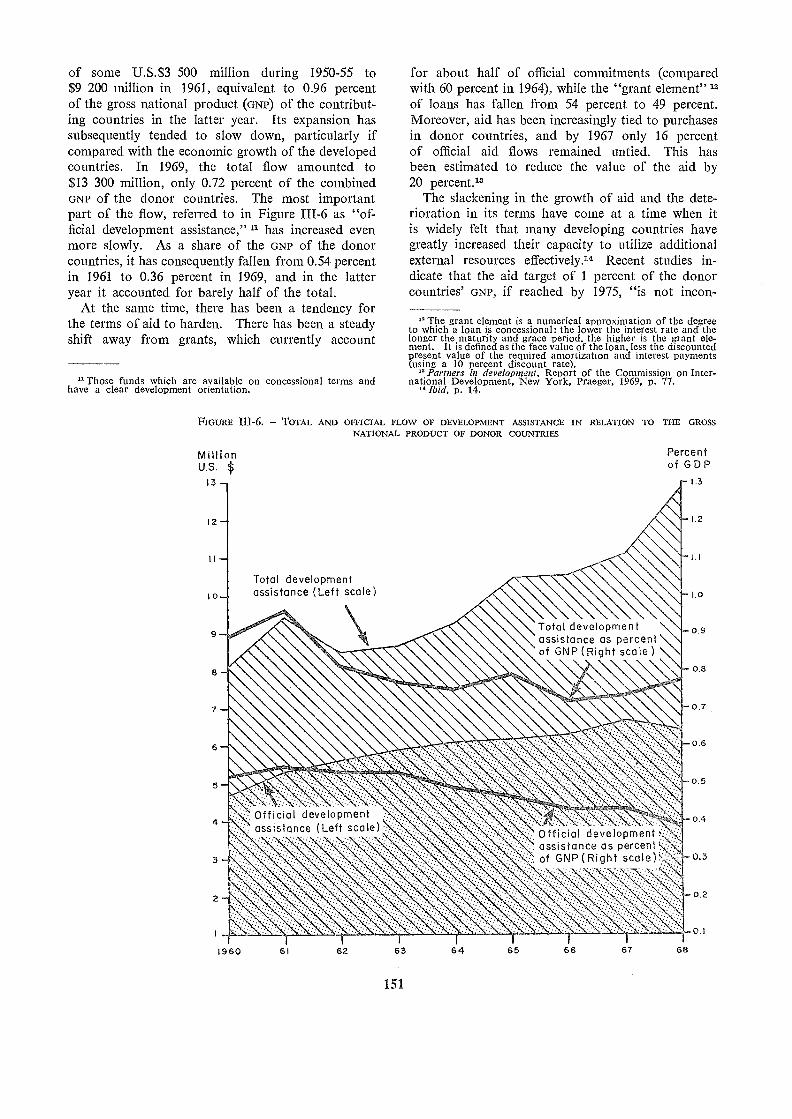
of some U.S.$3 500 million during 1950-55 to$9 200 million in 1961, equivalent to 0.96 percentof the gross national product (GNP) of the contribut-ing countries in the latter year. Its expansion hassubsequently tended to slow down, particularly ifcompared with the economic growth of the developedcountries. In 1969, the total flow amounted to$13 300 million, only 0.72 percent of the combinedGNP of the donor countries. The most importantpart of the flow, referred to in Figure III-6 as "of-ficial development assistance," u has increased evenmore slowly. As a share of the GNP of the donorcountries, it has consequently fallen from 0.54 percentin 1961 to 0.36 percent in 1969, and in the latteryear it accounted for barely half of the total.
At the same time, there has been a tendency forthe terms of aid to harden.. There has been a steadyshift away from grants, which currently account
" Those funds which are available on concessional terms andhave a clear development orientation.
MillionU.S. $
13
Total developmentassistance (Left scale)
1960 151 6 2
151
for about half of official commitments (comparedwith 60 percent in 1964), while the "grant element" 12of loans has fallen from 54 percent to 49 percent.Moreover, aid has been increasingly tied to purchasesin donor countries, and by 1967 only 16 percentof official aid flows remained untied. This hasbeen estimated to reduce the value of the aid by20 percent.13
The slackening in the growth of aid and the dete-rioration in its tei ins have come at a time when itis widely felt that many developing countries havegreatly increased their capacity to utilize additionalexternal resources effectively.14 Recent studies in-dicate that the aid target of 1 percent of the donorcountries' GNP, if reached by 1975, "is not incon-
" The grant element is a numerical approximation of the degreeto which a loan is concessional: the lower the interest rate and thelonger the maturity and grace period, the higher is the grant ele-ment. It is defined as the face value of the loan, less the discountedpresent value of the required amortization and interest payments(using a 10 percent discount rate).
"Partners in development, Report of the Commission on Inter-national Development, New York, Praeger, 1969, p. 77.
" Ibid, p. 14.
FIGURE 111-6. TOTAL AND OFFICIAL FLOW OF DEVELOPMENT ASSISTANCE IN RELATION TO THE GROSSNATIONAL PRODUCT OF DONOR COUNTRIES
63 64 66 67 68
Percentof G D
1.3
N. .. Official developmentassistance (Left scale).
Total developmentassistance as percentof GNP (Right scale )
Official development ,,assistance as percentof GNP (Right scale)'.,,(
2
o
0.9
0.8
0.7
0.6
0.5
0.4
0.3
0.2
0.1
sistent with some not wholly unreasonable guessesabout possible growth rates, exports and/or savingsperformance of developing countries and consequen-tial external resource requirements." " Moreover,the recent technological breakthroughs in the agricul-ture of some of the developing countries make aidto this sector more likely to lead to concrete resultsthan in the past.
At the same time, the rapid rise in the foreignindebtedness of the developing countries has madeit essential that a larger portion of financial assis-tance be provided on concessional terms. The totalexternal public debt outstanding for 79 developingcountries rose from $21 600 million at the end of1961 to $47 500 million in mid-1968. During thesame period, their annual debt service payments rosefrom $2 300 million to slightly more than $4 000million. In several countries the ratio of publicdebt service to export earnings exceeds 15 percent,and for the years 1965-67 debt service was equal to73 percent of all public and private lending fromabroad in Africa and 87 percent in Latin America."
A more positive element has been a gradual in-crease in the share of international assistance directedto agricultural development. United States assis-tance to the agricultural sector was doubled between1965 and 1967, rising from $250 million to $504million, and is estimated to have reached $800 mil-lion in 1969. In 1968 IBRD announced that, whileits total lending activities were to be doubled overa period of five years, the financing of agriculturewas to increase fourfold. The three regional develop-ment banks have also given priority to providingfinance to the agricultural sector.
Despite the increased attention to agriculture byboth bilateral and multilateral aid programmes,exact data on the total flow of assistance to thissector do not exist. Estimates made by the Devel-opment Assistance Committee (DAc) for a periodcovering roughly 1962-66 indicated that of the majoraid-giving countries' official bilateral commitments,about 12 percent, or $3 303 million, was for agricul-tural development." The share of IBRD loans andcredits to agriculture was roughly similar up to 1966/67, when it totalled $87 million. Subsequently, how-ever, it has increased strikingly to $367 million in1968/69, accounting for 21 percent of the total toall sectors. The oldest of the regional developmentbanks, the Inter-American Developmen.t Bank (TDB),provided $834 million in loans to agriculture duringthe period 1961-69, almost a quarter of the total (in1969 as much as one third of the total, or $632million). Of the total loans of the Asian Develop-ment Bank (ASDB) 20 percent has gone to agricul-
OECD. Development assistance, 7969 revieiv, Paris, 1969, p. 123." Partners in development, op. cit., p. 73-74." OECD, Aid lo agriculture in developing countries, Paris, 1968, p. 11.
152
ture and related industries since operations began in1966, and almost 30 percent in 1969, while the bankhas announced its intention to double the funds goingto agriculture in 1970.
In contrast to the flow of financial aid, technicalassistance has expanded during the past decad.e bymore than 10 percent a year, and now representsmore than 20 percent of the total aid to developingcountries. Most of the technical assistance is bilat-eral, the United States providing about 40 percentof the total, France 30 percent, and the United Na-tions system 12 percent.
United Nations technical assistance activities weregiven the financial possibilities for substantial ex-pansion when the United States, following the fa-mous "Point Four" declaration by President Trumanin his inaugural address in 1949, offered to contrib-ute to what after 1950 became known as the Ex-panded Technical Assistance Programme. In 1959, theUnited Nations Special Fund (uNsF) was establishedto finance preinvestment projects surveys, feasibilitystudies, training and research required to en-courage the subsequent investment of private or publiccapital for development projects. Expenditures onprojects under the technical assistance prograinmeexpanded from an average of $38.2 million during1959-63 to $60.5 million during 1964-68, while fundsearmarked under UNSF grew from $57 million to$129 million during the same period. Throughout,FAO has been the most important single executingagency for these operations, accounting for some 24percent of technical assistance :project expendituresand for 37 percent of the Special Fund project ex-penditures during the past decade.
Although over time past 20 years the :flow of de-velopment assistance has equalled only about 2 per-cent of the total income of the developing countries,"this contribution has in many ways been crucialfor their development efforts. Aid has accountedfor about 10 percent of their overall investment, andfor very much more in some individual countries. Ithas financed about 20 percent of their total imports.
Two major reexaminations of aid policies andpractices were launched in 1968-69: that undertakenby the Pearson Commission on behalf of the WorldBank, and the Ca:pacity Study " conducted by SirRobert Jackson, which deals specifically with thedevelopment assistance activities of the United Na-tions system.
The starting point of the Pearson Report is that"international support for development is nowflagging; in some of the rich countries its feasibility,even its very purpose, is in question. The climatesurrounding foreign aid programmes is heavy with
" Partners in development, op. cit., p. 49." A study of the capacity of the United Nations development system.
United Nations, GelleVa, 1969.
disillusion and distrust. This is not true every-where. Indeed, there are countries in which theopposite is true. Nevertheless, we have reached apoint of crisis." 20 After reviewing the past recordand achievements of interrtational development aid,the Pearson Commission presents a wide-ranging,prescription for a new effort at creating a partnershipfor development. In addition to matters directlyconcerned with aid, its 68 recommendations coversuch important related fields as international tradepolicies, policies for private foreign investment, andpopulation policy.
The commission recommends that each industrial-ized country raise its resource transfers to low-income countries to the level recomme.nded byUNCTAD in 1968, that is to a minimum of 1 percentof its GNP, as soon as possible and in no case laterthan 1975. Such a level, the report points out, isconsistent with the external resource requirementsof the developing countries' present developmentobjectives. However, it also stresses that there is
an even greater need to increase the flow of aid inthe sense of concessional transfers. After pointingout that transfers of this nature have recently fallento less than 0.4 percent of the rich countries' GNP,the commission recommends that they be raised,in net terms, to 0.7 percent of GNP by 1975 or shortlythereafter. To reached this target would require anaverage increase in net disbursements of 14 percenta year a return to the rate of growth of officialdevelopment assistance witnessed in 1956-61.
At the same time, the commission recommends thatthe donor countries increase their contributions tomultilateral programmes from the present 10 percentof the total flow of official development assistance to20 percent. This would require an increase of 23percent a year, from just over $600 million to$3 200 million. in 1975. Considerations whichled the commission to make this recommendationinclude the conviction that multilateral assistance isfree of the tones of "charity and interventionism"
Partners in development, op. cit., p. 4.
SOME A
The above account of agricultural development inthe past quarter century and more particularly dur-ing the 1960s, which were designated as the FirstUnited Nations Development Decade, provides thesetting for the role and problems of the agriculturalsector during the Second Development Decade,due to begin in January 1971.
153
which have sometimes in the past embittered theaid process, an.d that an increase in time importanceof multilateral flows will ensure that all developingcountries whose performance warrants the receiptof assistance will receive it.
Finally, the report contains a number of importantrecommen.dations aimed at making both bilateraland multilateral assistance more efficient. Thus itcalls l'or a review of procedures and regulations af-fecting the granting and use of aid, in both donorand recipient countries, with a view to making themmore effective and uniform. It also stresses the im-portance of a reasonable continuity of aid, and thatits forms should be adapted to the needs and levelof development of the recipient country. Sugges-tions are made for ways of untying aid aproblem of particular importance if, as is foreseenby the commission, there is a shift from food aid.to other forms of aid. An important recommenda-t ion concerning the multilateral programmes relatesto the need for improved machinery for aid coordi-nation "capable of relating aid and developmentpolicies to other relevant areas of foreign economicpolicy, towards standardized assessments of develop-
performance, making clear, regular and reason-ably authoritative estimates of aid requirements, andproviding balanced impartial reviews of donor aidpolicies and programs." 21
These recommendations are closely related to theprincipal proposals of the Capacity Study on the ca-pacity of the United Nations system to use effec-tively mc present resources of the United Nationsrv,-...lo,ar,ent Programme, and to handle a much
programme in the future. The mostiinl7a.a-ft.a.t recommendation of the study is probablyt11. lnl-ocluction of the "country programming"of technical assistance and preinvestment activities,integrating as far as possible all the inputs from thevarious components of the United Nations develop-
system, and gearing them closely with .thedevrjopment plans and objectives of each country.
" !bid, p. 230.
URAL PROBLEMS IN THE-3EVELOPMENT DECADE
Larget set for the First Development Decadewas the achievement of a miniinum annual rate ofgrowth of national income of 5 percent by all thedeveloping countries combined by the end of theperiod. Although some efforts were made in thecourse of the decade to examine the implications ofthis target for the various other principal magnitudes
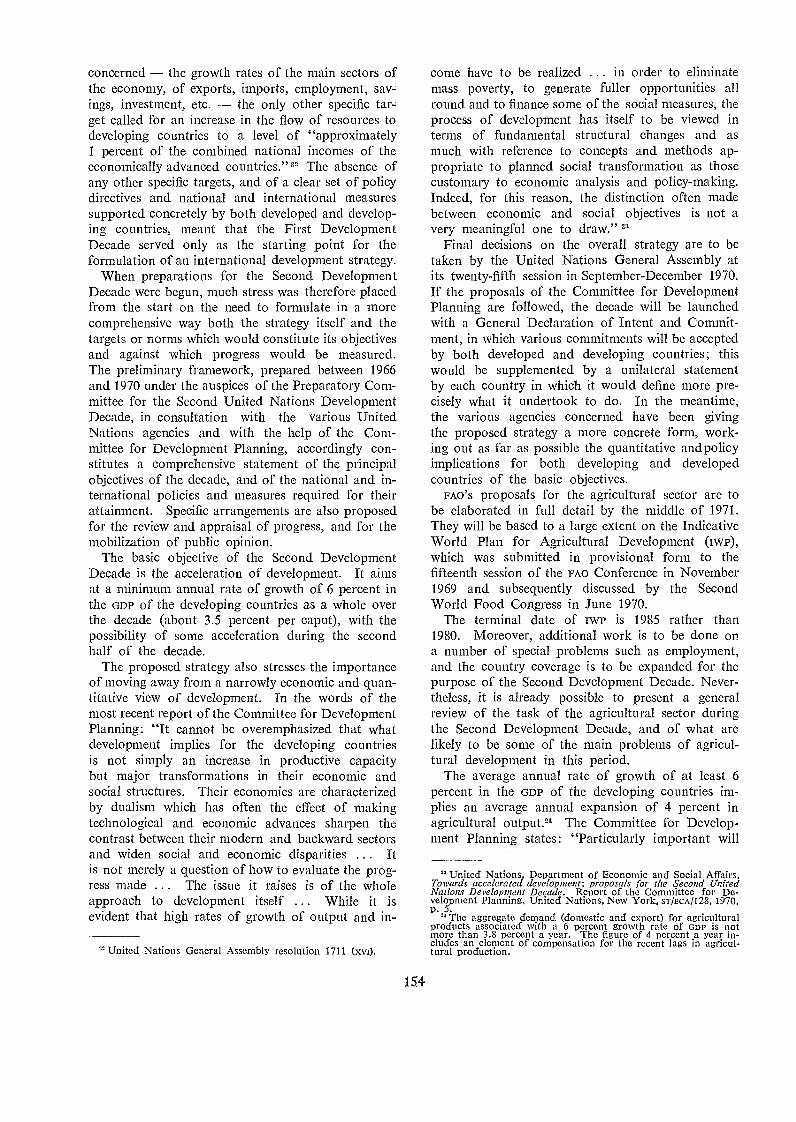
concerned the growth rates of the main sectors ofthe economy, of exports, imports, employment, sav-ings, investment, etc. the only other specific tar-get called for an increase in the flow of resources todeveloping countries to a level of "approximately1 percent of the combined n.ational incomes of theeconomically advanced countries." The absence ofany other specific targets, and of a clear set of policydirectives and national and international measuressupported concretely by both developed and develop-ing countries, meant that the First DevelopmentDecade served only as the starting point for theformulation of an international development strategy.
When preparations for the Second DevelopmentDecade were begun, much stress was therefore placedfrom the start on the need to formulate in a morecomprehensive way both the strategy itself and thetargets or norms which would constitute its objectivesand against which progress would be measured.The preliminary framework, prepared between 1966and 1970 under the auspices of the Preparatory Com-mittee for the Second United Nations DevelopmentDecade, in consultation with the various UnitedNations agencies and with the help of the Com-mittee for Development Planning, accordingly con-stitutes a comprehensive statement of the principalobjectives of the decade, and of the national and in-ternational policies and measures required for theirattainment. Specific arrangements are also proposedfor the review and appraisal of progress, and for themobilization of public opinion.
The basic objective of the Second DevelopmentDecade is the acceleration of development. It aimsat a minimum annual rate of growth of 6 percent inthe GDP of the developing countries as a whole overthe decade (about 3.5 percent per caput), with thepossibility of some acceleration durirtg the secondhalf of the decade.
The proposed strategy also stresses the importanceof moving away from a narrowly economic and quan-titative view of development. In the words of themost recent report of the Committee for DevelopmentPlanning: "It cannot be overemphasized that whatdevelopment implies for the developing countriesis not simply an increase in productive capacitybut major transformations in their economic andsocial structures. Their economies are characterizedby dualism which has often the effect of makingtechnological and economic advances sharpen thecontrast between their modern and backward sectorsand widen social and economic disparities ... itis not merely a question of how to evaluate the prog-ress made ... The issue it raises is of the wholeapproach to development itself ... While it isevident that high rates of growth of output and in-
" United Nations General Assembly resolution 1711 (xvI).
154
come have to be realized ... in order to elimin.atemass poverty, to generate fuller opportunities allround and to finance some of the social measures, theprocess of development has itself to be viewed interms of fundamental structural changes and asmuch with reference to concepts and methods ap-propriate to planned social transformation as thosecustomary to economic analysis and policy-making.Indeed, for this reason, the distinction often madebetween economic and social objectives is not avery meaningful one to draw." "a
Final decisions on the overall strategy are to betaken by the United Nations General Assembly atits twenty-fifth session in September-December 1970.If the proposals of the Committee for DevelopmentPlanning are followed, the decade will be launchedwith a General Declaration of Intent and Commit-ment, in which various commitments will be acceptedby both developed and developing countries; thiswould be supplemented by a unilateral statementby each country in which it would define more pre-cisely what it undertook to do. In the meantime,the various agencies concerned have been givingthe proposed strategy a more concrete form, work-ing out as far as possible the quantitative and policyimplications for both developing and developedcountries of the basic objectives.
FAO'S proposals for the agricultural sector are tobe elaborated in full detail by the middle of 1971.They will be based to a large extent on the IndicativeWorld Plan for Agricultural Development (iwP),which was submitted in provisional form to thefifteenth session of the FAO Conference in November1969 and subsequently discussed by the SecondWorld Food Congress in June 1970.
The terminal date of twr is 1985 rather than1980. Moreover, additional work is to be done ona number of special problems such as employment,and the country coverage is to be expanded for thepurpose of the Second Development Decade. Never-theless, it is already possible to present a generalreview of the task of the agricultural sector duringthe Second Development Decade, and of what arelikely to be some of the main problems of agricul-tural development in this period.
The average annual rate of growth of at least 6percent in the GDP of the developing countries im-plies an average annual expansion of 4 percent inagricultural output.24 The Committee for Develop-ment Planning states: "Particularly irnportan.t will
" United Nations, Department of Economic and Social Affairs.Towards accelerated development: proposals for the Second UnitedNations Development Decade. Report of the Committee for De-velopment Planning, United Nations, New York, sT/EcA/128. 1970,p. 5.
" The aggregate demand (domestic and export) for agriculturalproducts associated with a 6 percent growth rate of GDP is notmore than 3.8 percent a year. The figure of 4 percent a year in-cludes an element of compensation for the recent lags in agricul-tural production.
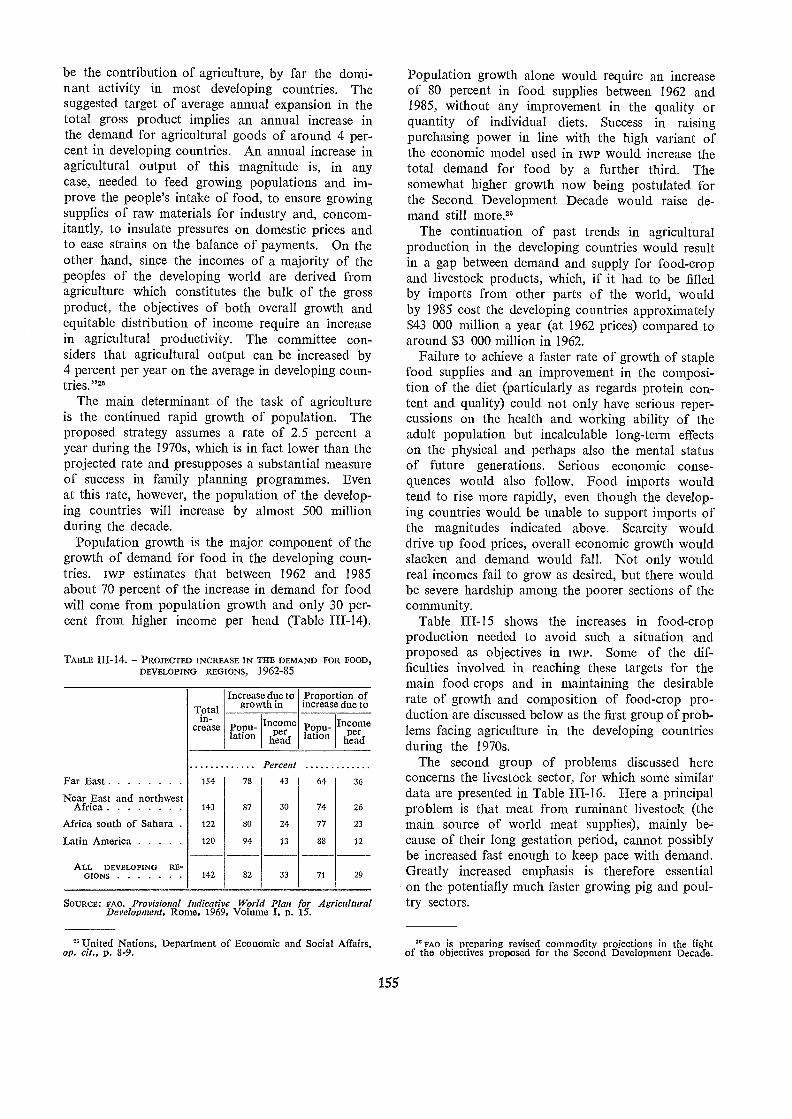
be the contribution of agriculture, by far the domi-nant activity in most developing countries. Thesuggested target of average annual expansion in thetotal gross product implies an annual increase inthe demand for agricultural goods of around 4 per-cent in developing countries. An annual in.crease inagricultural output of this magnitude is, in anycase, needed to feed growing populations and im-prove the people's intake of food, to ensure growingsupplies of raw materials for industry and, concom-itantly, to insulate pressures on domestic prices andto ease strains on the balance of payments. On theother hand, since the incomes of a majority of thepeoples of the developing world are derived fromagriculture which constitutes the bulk of the grossproduct, the objectives of both overall growth an.dequitable distribution of income require an increasein agricultural productivity. The committee con-siders that agricultural output can be increased by4 percent per year on the average in developing coun-tries.""
The main determinant of the task of agricultureis the continued rapid growth of population. Theproposed strategy assumes a rate of 2.5 percent ayear during the 1970s, which is in fact lower than theprojected rate and presupposes a substantial measureof success in family planning programmes. Evenat this rate, however, the population of the develop-ing countries will increase by almost 500 millionduring the decade.
Population growth is the major component of thegrowth of demand for food in the developing coun-tries. IWP estimates that between 1962 and 1985about 70 percent of the increase in demand for foodwill come from population growth and only 30 per-cent from higher income per head (Table HI-14).
TABLE 111-14. PROJECTED INCREASE 1N THE DEMAND FOR FOOD,DEVELOPING REGIONS, 1962-85
Totalin-
crease
SOURCE: FAO. Provisional Indicative World Plan for AgriculturalDevelopment, Rome, 1969, Volume I. p. 15.
" United Nations, Department of Economic and Social Affairs,op. cit., D. 8-9.
155
Population growth alone would require an increaseof 80 percent in food supplies between 1962 and1985, without any improvement in the quality orquantity of individual diets. Success in raisingpurchasing power in line with the high variant ofthe economic model used in Iva) would increase thetotal deman.d for food by a further third. Thesomewhat higher growth now being postulated forthe Second Development Decade would raise de-mand still more."
The continuation of past trends in agriculturalproduction in the developing countries would resultin a gap between demand and supply for food-cropand livestock products, which, if it had to be filledby imports from other parts of the world, wouldby 1985 cost the developing countries approximately$43 000 million a year (at 1962 prices) compared toaround $3 000 million in 1962.
Failure to achieve a faster rate of growth of staplefood supplies asid an improvement in the composi-tion of the diet (particularly as regards protein con-tent and quality) could not only have serious reper-cussions on the health and working ability of theadult population but incalculable long-term effectson the physical and perhaps also the mental statusof future generations. Serious economic conse-quences would also follow. Food imports wouldtend to rise more rapidly, even though the develop-ing countries would be unable to support imports ofthe magnitudes indicated above. Scarcity woulddrive up food prices, overall economic growth wouldslacken and demand would fall. Not only wouldreal incomes fail to grow as desired, but there wouldbe severe hardship among the poorer sections of thecommunity
Table IH-15 shows the increases in food-cropproduction needed to avoid such a situation andproposed as objectives in IWP. Some of the dif-ficulties involved in reaching these targets for themain food crops and in maintaining the desirablerate of growth and composition of food-crop pro-duction are discussed below as the first group of prob-lems facing agriculture in the developing countriesduring the 1970s.
The second group of problems discussed hereconcerns the livestock sector, for which some similardata are presented in Table 111-16. Here a principalproblem is that meat from ruminant livestock (themain source of world meat supplies), mainly be-cause of their long gestation period, cannot possiblybe increased fast enough to keep pace with deman.dGreatly increased emphasis is therefore essentialon the potentially much faster growing pig and poul-try sectors.
" FAO is preparing revised commodity projections in the lightof the objectives proposed for the Second Development Decade.
Far East 154 78 43 64 36
Near East and northwestAfrica 143 87 30 74 26
Africa south of Sahara 122 80 24 77 23
Latin America 120 94 13 88 12
ALL DEVELOPING RE-GIONS 142 82 33 71 29
Increase due togrowth in
Proportion ofincrease due to
Popu-lawn
Incomeper
headPopu-lation
Incomeper
head
Percent
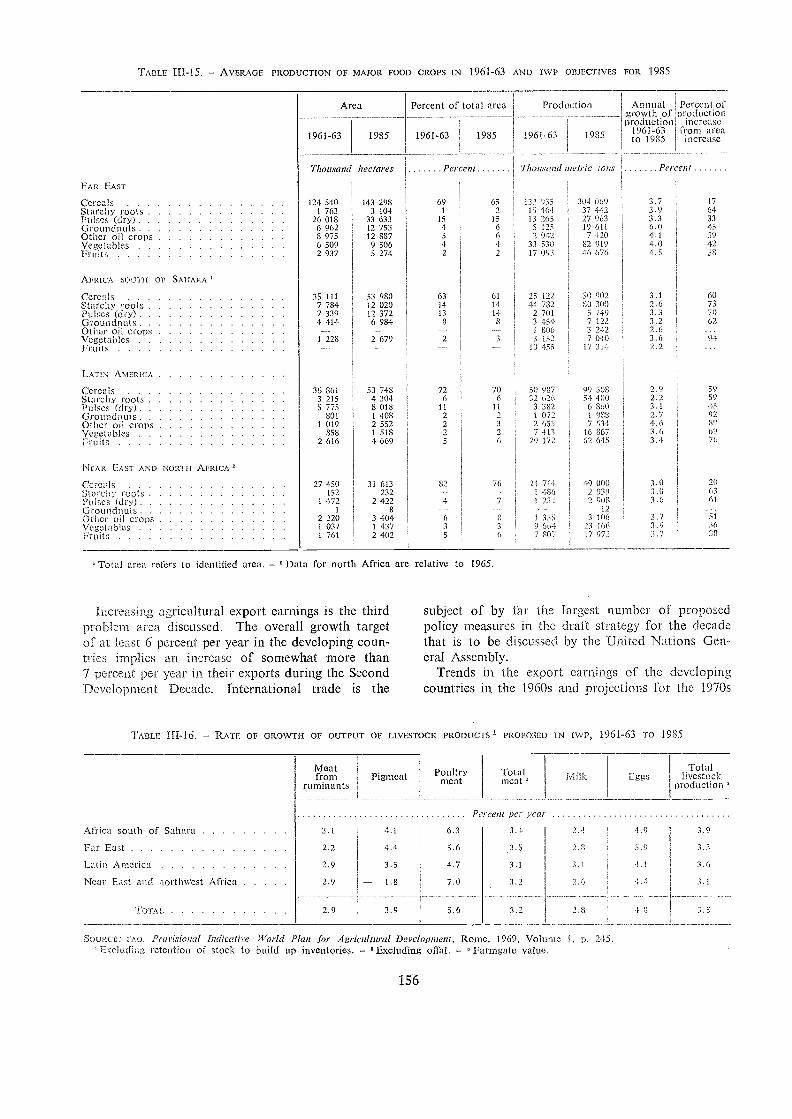
TABLE I[1-15. -- AVERAGE PRODUCTION OF MAJOR FOOD CROPS IN 1961-63 ANO IWP OBJECT1vES FOR 1985
Increasing agricultural export earnings is the thirdproblem crea discussed. The overall growth targetof at least 6 percent per year in the developing coun-tries implies an increase of somewhat more than7 percent per year in their exports during the SecondDevelopment Decade. International trade is the
Meatfrom Pigmeat
ruminants
156
Percent
Total area refers to identified area. - Data for north Africa are relative to 1965.
subject of by far the largest number of proposedpolicy measures in the draft strategy for the decadethat is to be discussed by the United Nations Gen-eral A.ssembly.
Trends in the export earnings of the developingcountries in the 1960s and projections for the 1970s
TABLE 111-16. - RATE OF GROWTH OF OUTPUT OF LIVESTOCK PRODUCTS' PROPOSED IN twr, 1961-63 TO 1985
Production Annual Percent ofgrowth of productionproduction increase
1961-63 1985 1961-63 from arcato 1985 increase
Milk Eggs
SOURCE: l'AO. 14A011.510//a/ Indicative World Plan for Agricultural Development, Rome, 1969, Volt me I. p. 245.' Exclucting retention of stock to build up inventories. - 'Excluding offal. - Farmgate value.
Totallivestock
production
17643315394258
60737062
94
5959
811
6976
20E3
513633
Ptrcent per year
Africa south of Sahara 3.1 4.1 6.3 3.4 2.4, 4.9 3.9
Far East 2.2 4.1 5.6 .3.5 2.8 5.9 3.3
Latin America 2.9 3.5 4.7 3.1 3,1 4.1 3.6
Near EaSt and nortbviest Africa 2.9 ^a- 1.8 7.0 3.2 2.8 4.4 3.1
TOTAL 2.9 3.9 5.6 3.2 2.8 4.8 3.5
1961-63 1985 1961-63
Percent
1985
Thou,s.and metric IonsThousand hectares
FAR EAST
Cereals 124 540 143 298 69 65 132 935 304 069Starchy roots 1 763 3 104 1 ' 15 454 37 442Puls,.:s (dry) 26 018 33 633 15 15 13 265 27 963Groundnuts 6 962 12 753 4 6 5 125 19 611Other oil crops 8 975 12 887 5 (, 2 942 7 420Vegetables 6 509 9 506 4 4 33 530 82 919Fruits 2 937 5 274 2 2 17 093 46 675
AFRICA souTil or SAIIARA
Cereal9 35 111 53 980 63 01 25 122 Si) 902Starchy roots 7 784 12 020 14 14 44 782 110 300
Pulses (dry) 7 339 12 372 13 14 2 701 5 749Groundnuts 4 414 6 984 8 3 454 7 122Ofter oil crop --- -- 1 806 3 242Vegetables I 228 2 679 2 3 3 152 7 040Fruits 10 455 17 314
LATIN AMI-RICA
Cereals 36 861 53 748 72 50 087 99 508Starchy roots 3 215 4 304 6 32 54-100Pulses (dry) 5 775 8 018 11 3.11)2 6
Grou udii u s 801 1 408 2 2 1 5,2Other oil crop- 1 019 2 552 2 3 2 855 7 511-
Vegetables 858 1 518 2 2 7 413 16 1157
Frnits
h1r AR EAST AND NORTH AFRICA
2 616 4 669 5 6 29 172 62 645
27 450 31 613 82 76 24 714 49 000roo/ 152 232 1 486 2 939
(dry) I 472 2 4228
4__
1 234 2 908-- 12
(hher oil crops 2 220 3 404 6 1 1 355 3 106VC `F,,Aabies I 037 1 437 3 3 9 564 23 156
I 761 2 402 5 7 807 17 973
Area Percent of total arca
3.73.93.36.04.14.04.5
3.12.63.33.22.63.62.2
2.92.23.12.74.63.03.4
3.03.03.6
3.73.93.7
Poultry Totalmeat meat I
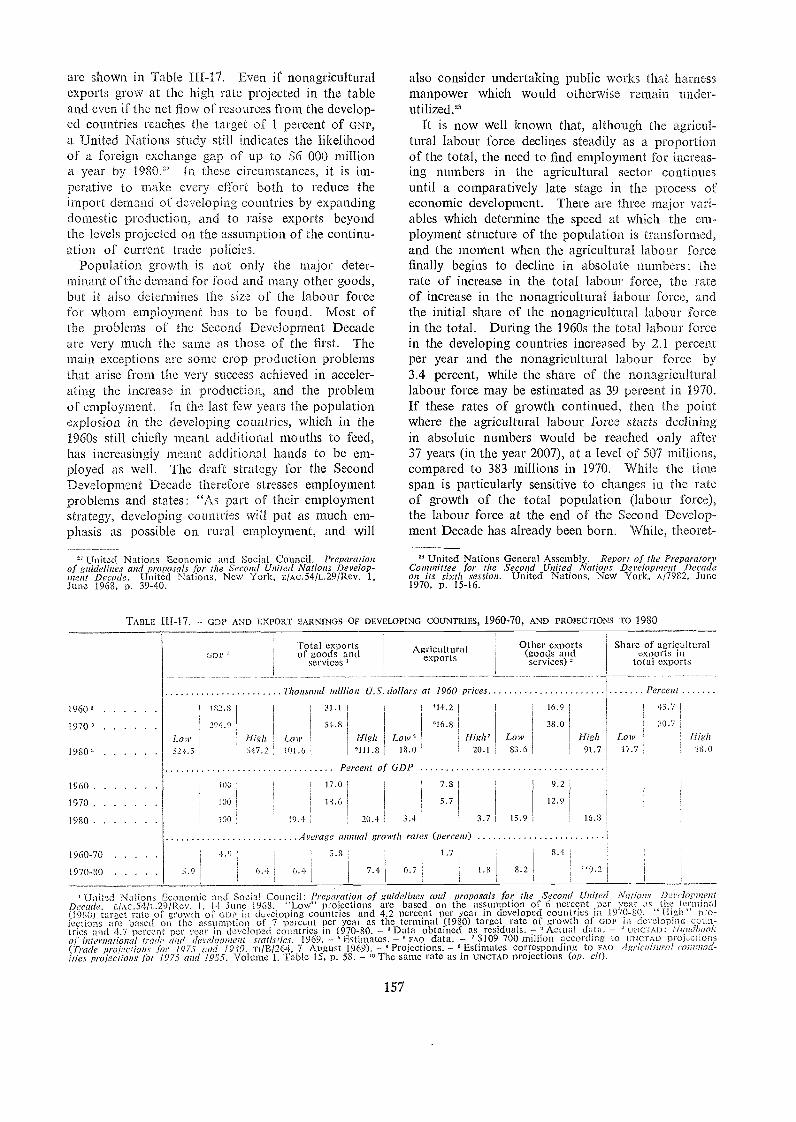
are shown in Table 11147. Even if nonagriculturalexports grow at the high rate projected in the tableand even if the net flow of resources from the develop-ed countries reaches the target of 1 percent of GNP,a United Nations study still indicates the likelihoodof a foreign exchange gap of .up to $6 000 milliona year by 1980." in these circumstances, it is im-perative to make every effort both to reduce theimport deinand of developing countries by expandingdomestic production, and to raise exports beyondthe levels projected on the assumption of the continu-ation of current trade policies.
Population growth is not only the major deter-minant of demand for food and many other goods,but it also determines the size of the labour forcefor whom employment has to be found. Most ofthe problems of thc.' Second Development Decadeare very much the same as those of the first. Themain exceptions are some crop production problemsthat arise from the very success achieved in acceler-ating the increase in production, and the problemof employment. In the last few years the populationexplosion in the developing countries, which in the1960s still chiefly meant additional mouths to feed,has increasingly meant additional hands to be em-ployed as well. The draft strategy for the SecondDevelopment Decade therefore stresses employmentproblems and states: "As part of their employmentstrategy, developing countries will put as much em-phasis as possible on rural employment, and will
United Nations Economic and Social Council. Preparationof guidelines and proposals for ¡he Second United Nations Develop-ment Decade. United Nations, New York, E/Ac.54/L.29/Rev. I.June 1968, p. 39-40.
TABLE 111-17. - GDP AND EXPORT EARNINGS OF DEVELOPING COUNTRIES, 1960-70, ANO PROJECTIONS TO 1980
157
also consider undertaking public works that harnessmanpower which would otherwise remain under-utilized."
It is now well known that, although the agricul-tural labour force declines steadily as a proportionof the total, the need to fin.d employment for increas-ing numbers in the agricultural sector continuesuntil a comparatively late stage in the process ofeconomic development. There are three major vari-ables which determine the speed at which the em-ployment structure of the population is transformed,and the moment when the agricultural labour forcefinally begins to decline in absolute ntunbers: therate of increase in the total labour force, the rateof increase in the nonagricultural labour force, andthe initial share of the nonagricultural labour forcein the total. During the 1960s the total labour forcein the developing countries increased by 2.1 percentper year and the nonagricultural labour force by3.4 percent, while the share of the nonagriculturallabour force may be estimated as 39 percen.t in 1970.If these rates of growth continued, then the pointwhere the agricultural labour force starts decliningin absolute numbers would be reached only after37 years (in the year 2007), at a level of 507 millions,compared to 383 millions in 1970. While the timespan is particularly sensitive to changes in the rateof growth of the total population (labour force),the labour force at the end of the Second Develop-ment Decade has already been born. While, theoret-
" United Nations General Assembly. Report of ¡he PreparatouCommittee for the Second United Nations Development Decadeon its sixth session. United Nations, New York, A/7982, June1970, p. 15-16.
' United Nations Economic and' Social. Council: Preparation of guidelines and proposals for the Second United Nations 'relopmentDecode. EIAC.5,1/L.29/Rev. 1. 14 June 1968. "Low" projections are based on the :.issumption of 6 percent per year .ss(1980) target rate or growth of GDP in developing countries and 4.2 percent per year in developed countries in 1970411. " pro-jections are on the assumption of 7 percent per year as the terminal (1980) target rate of growth of GDP iii ii:CVelOpi L.,.un-tries and 4.7 1),..rc,:m in developed countries in 1970-80. - 2 Data obtained as residuals. -' Actual dota. - rAD
of international tra,1:, asid development statistics, 1969. - Estimates. - FAO data. - ' 8109 700 ;Pillion according to una) AD p.or(Trade projections for 1975 and 191)0, Ti/B/264, 7 August 1969). - Projections. - 'Estimates corresponding to FAO Ag4cilliuro'Wes projections for 1975 asid 1955, Voltune 1, Table 15, p. 58. - "The same rate as in UNCTAD projections (op. cif).
1960'
1970'
1980'
1960
1970
1980
1960-70
1970-80
cup'
! 182.8
I 294.9
Low521.5 1
100
100
1-9
5.9
High547.2
6.4
Totalof
Thousand
Low101.6
!
I
19.41
6 .4
services
verage
exportsgoods and
million
31.1
54.8
17.0
18.6
5.8
Percent
annual
U. Y.
High'111.8
o
i
20.4
7.4
growth
dollars
Loll,'18.0
GDP
3.4
rates
0.7
Agriculturalexports
at 1960'14.2
q 6.8
7.8
5.7
1.7
Other(goodsservices)
exportsasid
16.9
38.0
9.2
12.9
8.4
High91.7
16.8
"9.2
Share
total
Low17.7
Percent
exportsof agricultural
exports
43.7
30.7
in
High18.0
(percent)
prices
High'20.1
3.7
1.8
Low83.6
15.9
8.2
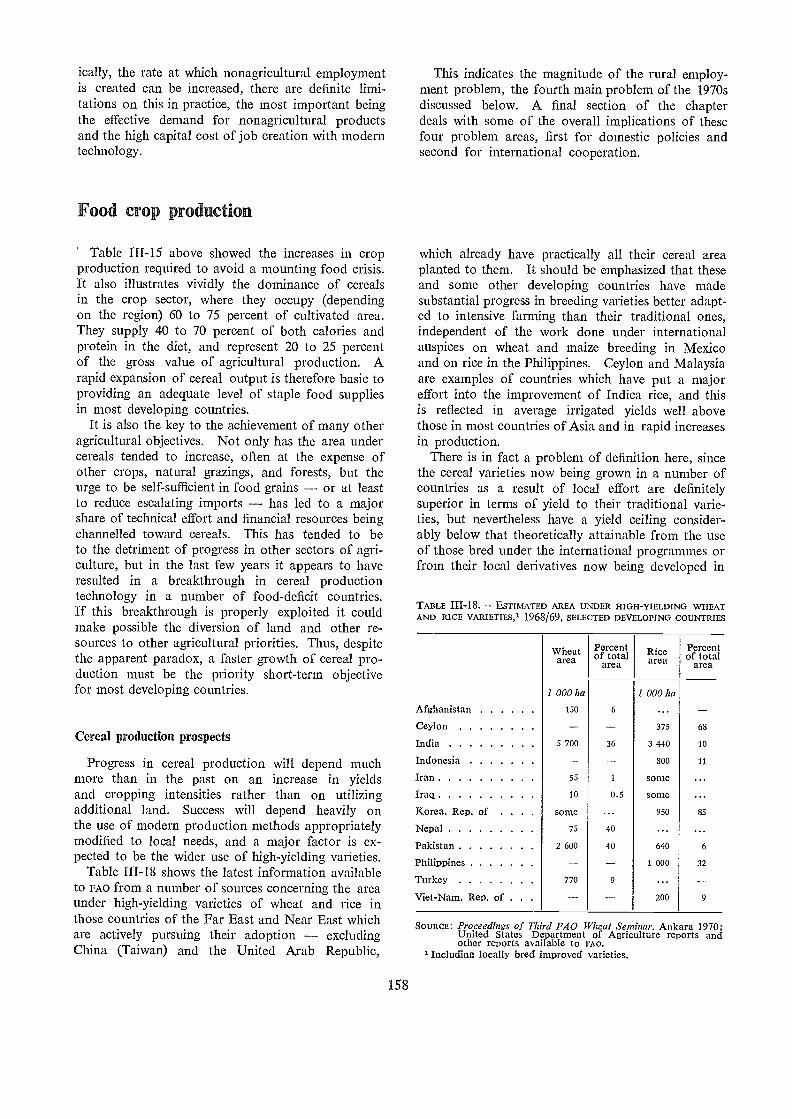
ically, the rate at which nonagricultural employmentis created can be increased, there are definite limi-tations on this in practice, the most important beingthe effective demand for nonagricultural productsand the high capital cost of job creation with moderntechnology.
Food crop production
Table 111-15 above showed the increases in cropproduction required to avoid a mounting food crisis.It also illustrates vividly the dominance of cerealsin the crop sector, where they occupy (dependingon the region) 60 to 75 percent of cultivated area.They supply 40 to 70 percent of both calories andprotein in the diet, and represent 20 to 25 percentof the gross value of agricultural production. Arapid expansion of cereal output is therefore basic toproviding an adequate level of staple food suppliesin most developing countries.
It is also the key to the achievement of many otheragricultural objectives. Not only has the area undercereals tended to increase, often at the expense ofother crops, natural grazings, and forests, but theurge to be self-sufficient in food grains or at leastto reduce escalating imports has led to a majorshare of technical effort and financial resources beingchannelled toward cereals. This has tended to beto the detriment of progress in other sectors of agri-culture, but in the last few years it appears to haveresulted in a breakthrough in cereal productiontechnology in a number of food-deficit countries.If this breakthrough is properly exploited it couldmake possible the diversion of land and other re-sources to other agricultural priorities. Thus, despitethe apparent paradox, a faster growth of cereal pro-duction must be the priority short-term objectivefor most developing countries.
Cereal production prospects
Progress in cereal production will depend muchmore than in the past on an increase in yieldsand cropping intensities rather than on utilizingadditional land. Success will depend heavily onthe use of modern production methods appropriatelymodified to local needs, and a major factor is ex-pected to be the wider use of high-yielding varieties.
Table 111-18 shows the latest information availableto FAO from a number of sources concerning the areaunder high-yielding varieties of wheat and rice inthose countries of the Far East and Near East whichare actively pursuing their adoption excludingChina (Taiwan) and the United Arab Republic,
158
This indicates the magnitude of the rural employ-ment problem, the fourth main problem of the 1970sdiscussed below. A final section of the chapterdeals with some of the overall implications of thesefour problem areas, first for domestic policies andsecond for international cooperation.
which already have practically all their cereal areaplanted to them. It should be emphasized that theseand some other developing countries have madesubstantial progress in breeding varieties better adapt-ed to intensive farming than their traditional ones,independent of the work done under internationalauspices on wheat and maize breeding in Mexicoand on rice in the Philippines. Ceylon and Malaysiaare examples of countries which have put a majoreffort into the improvement of Indica rice, and thisis reflected in average irrigated yields well abovethose in most countries of Asia and in rapid increasesin production.
There is in fact a problem of definition here, sincethe cereal varieties now being grown in a number ofcountries as a result of local effort are definitelysuperior in terms of yield to their traditional varie-ties, but nevertheless have a yield ceiling consider-ably below that theoretically attainable from the useof those bred under the international programmes orfrom their local derivatives now being developed in
TABLE 111-18. ESTIMATED AREA UNDER HIGH-Y1ELDING WHEATAND RICE VARIETIES,' 1968/69, SELECTED DEVELOPING COUNTRIES
SOURCE: Proceedings of Th.rd FAO Wheat Sen mar. Ankara 1970;United States Department of Agriculture reports andother reports available to FAO.
'Including locally bred improved varieties.
Wheatarea
Percentof total
areaRicearea
Percentof total
area
1 000 ha 1 000 ha
Afghanistan 150 6
Ceylon 375 68
India 5 700 36 3 440 10
Indonesia 800 11
Iran 55 some
Iraq 10 0.5 some
Korea, Rep. of some 950 85
Nepal 75 40
Pakistan 2 600 40 640 6
Philippines 1 000 32
Turkey 770 9
Viet-Nam, Rep. of . 200 9
some countries. The critical factor is probablyresponse to nitrogen fertilizer, in terms both of theamount that can be applied before the variety fallsover and of the economic response in kilogrammes ofgrain per kilogramme of nutrient applied Sometraditional, and most locally-bred improved varietiesrespond economically to up to 60 kilogrammes ofnitrogen per hectare; high-yielding ones up to 120kilogrammes per hectare. While this is a somewhatoversimplified definition, it is essential to emphasizethat there are many parts of the world where va-rieties in the last category cannot be grown for eco-logical reasons, and others where they need not begrown for economic reasons, so that the fact thata country has not yet adopted high-yielding varietieson a large scale is not necessarily indicative of lackof initiative by either farmers or national planners.
An overall estimate would be that wheat varietieswith a potential justifying the label "high-yielding"under the above definition now cover about 40around of the total wheat area in the Far East and8 percent of that in the Near East.2° The latter,however, includes the United Arab Repub/ic wherewheat is mainly irrigated; the area sown to high-yielding varieties in the remaining 10 million hect-ares of largely rainfed wheat in the region is atpresent only about 2 percent. In addition Turkeyhas some 800 000 hectares (roughly 10 percent of itstotal area) under such varieties, principally in thewarmer zones. In the case of rice the estimates varymore widely, but in the Far East (including Indonesiaand the Republic of Viet-Nam), about 11 percentof the total area is now believed to be under inter-mediate- to high-yielding varieties disseminated since1965/66, with (again excepting the United Arab Re-public) a relatively insignificant area in the NearEast and northwest Africa.
In addition the use of high-yielding varieties ofcoarse grains, especially maize, is gaining momen-tum in the Far East. In order to overcome seedproduction bottlenecks and farmers' objections tohaving to renew hybrid seed every year, countriesare tending to concentrate on developing improvedopen-pollinated or "composite" rather than hybridvarieties, accepting a slightly lower yield in exchangefor a more rapid rate of adoption. Except in theUnited Arab Republic, where hybrid maize is widelygrown, they seem so far to be hardly used at all inthe Near East.
In Africa and Latin America progress in the adop-tion of high-yielding varieties has been patchy (al-though here again there are problems of definition).Mexico now has the bulk of its wheatland underdwarf varieties, and the area in Brazil is expandingrapidly. Mexico and some other Latin American
" See countries included in Table III-19 for definition.
159
countries are moving forward with hybrid maize,which, in Africa, has been outstandingly successfulin Kenya and is increasingly being used in Malawiand Zambia. Madagascar has about half its ricearea under improved varieties, and there has beenencouraging progress in breeding swamp rice inwest Africa with yields up to 4 tons per hectare. Inirrigated areas of western Latin America and in RioGrande do Sul in Brazil, modern techniques of riceproduction are being used and high average yieldsobtained. These, however, are islands in a sea ofgenerally backward farming methods. At the sametime it must be recognized that pressure on land isgenerally less severe in these regions, and that anadditional disincentive to intensifying production inLatin America is the inequitable distribution of landand income, which also places a constraint on thedemand for food.
It is difficult to calculate precisely the contributionof high-yielding varieties to additional productionbecause of the rapidity of their spread over a shortperiod, weather fluctuations, interactions with irri-gation, fertilizer an.d other inputs, and expansion ofarea (including double cropping). Some provisionalestimates for south and southeast Asia suggest addi-tions of the order of 9 and 20 percent respectivelyto rice and wheat production in that region in 1968/69(equivalent to around 22 million tons of foodgrains).3° The cumulative value of rice productionincreases resulting from the development of newvarieties in Asia since 1966 has been put at $1 500million.31 For India the additional gross value ofwheat production over three years (mainly attributedto high-yielding varieties and related inputs) may beabout $1 850 million at current prices.32
Although these are certainly no mean achieve-ments, a generous estimate of the addition to overallfood-grain output in the developing world arising in1969/70 from the area sown to varieties deserving thelabel "high-yielding" would not exceed 10 percent.This hardly seems the massive breakthrough in foodproduction pictured in many reports. However, itmust be remembered that the area sown to thesevarieties outside Mexico, the United Arab Republic,and the Japonica rice countries of east Asia and theMediterranean totalled only 15 000 hectares in 1965/66,and that it has now risen to around 17 millionhectares. This is equal to almost a quarter of thetotal cereal area in western Europe or the UnitedStates, and has been achieved by the so-called develop-ing countries in four years, largely by their own effortsfollowing the initial injection of seed from the
" J. W. Willett. The impact of new varieties of rice and wheatin Asia. AID Spring Review, Washington. May 1969.
" Synzposium on ceience and foreign i alley the Green Revolution.United States Government Printing Office, Washington, 1970,p. 22.
" R. G. Anderson. Wheat improvement and production in India.FAO Wheat Breeding Seminar, Ankara, 1970.
ders in 1965. The expansion of area Linde:-wheat in Mexico and hybrid maize in the UStates took 15 years; the agricultural revolution. inwestern Europe took considerably longer.
Moreover, the psychological impact of the high-yielding varieties on both governments and farn-,er;in the developing world may outweigh their filmic:-diate material benefits. To governments they havegiven renewed hope and shown that irivestment iagriculture (and particularly in properly coi-,ffiictedresearch) can pay handsomely. To farmers C-1have given new incentives and motivations, prevt..i-ing a market orientation even to the smaller cui:.:-vator, and proving that food crops can also beprofitable cash crops. Most important oí all, theyhave made them more receptive to innovation, andthis should accelerate the adoption of new technol-ogy for cereals (given adequate institutional support),and also permit its later use as an important tooltoward diversification.
From what has been said above it will be seen that,while the evolution of the high-yielding varietiesand related improvements in other cereal productiontechniques offer the .means of achieving a more ade-quate level of consumption of staple foods and somestabilization of urban food prices, their significancelies mainly in their future potential. Given a con-tinuation of current rates of growth in productionover a protracted period, large cereal surpluses couldbe generated, particularly by some Asian countrieswhich are now net importers. This could cansedifficult economic problems, not only for establishdexporters but also for the new countries tryintibreak into the market.
Prediction or projection is always hazardous, but.particularly so in a highly dynamic situation. Inthe case of south Asia (the major deficit area) therewas a sharp drop in cereal production as a resultof two disastrous years in 1965 and 1966, which hasexaggerated the growth rates since 1966 the periodof adoption of the high-yielding varieties. TableIII-19 shows that a continuation of 1964-66 to 1967-69growth rates in these countries would result by1975 not merely in self-sufficiency but in a massivesurplus of 26 millions tons, which would be mainlyof rice and wheat. This would be far in excessof that considered likely even on optimistic technicalassumptions by IWP, and clearly could be absorbedneither by exports nor by increases in domesticdemand as a result of lower prices.
On the other hand, analysis over a longer pe.riodwhich includes 1965 and 1966 may iinerva";,..fechange in the situation. On this basis the Farregion as a whole would remain a net deficit area,and only Thailand (a traditional exporter) and pos-sibly Pakistan would have more to export. N"ever-theless, self-sufficiency ratios in most countries would
160
rise, and 1975 cereal imports would be below their1966 peak of 14.5 million tons despite the largeincrease in the population. The extent to whichthis would cause difficulties for the established riceexporters or the region is uncertain since althoughprices are beginning to fall, there is evidence that,with more and cheaper rice, consumers tend to shiftfroni other cereals, while income elasticity is highamong the poorer classes and in rural areas.33 Actualconsumption of rice in 1975 may therefore be higherthan that projected by FAO, which used a constantprice assumption and did not take income distribu-tion into account.
The situation in the Near East appears somewhatparallel. The growth of cereal production has ac-celerated since 1964-66, and a continuation of therecent rapid growth, particularly in Iran and Iraq,would lead to a 6.5 million ton net surplus by 1975,again mainly of wheat and rice. Extrapolation ofthe 1961-63 to 1967-69 growth rates would resultin an impoit requirement of 3 million tons by 1975,although the annual increase in imports would beslower than the 10 percent registered between 1955and 1965.
The rapid expansion of wheat and rice productionin the Near East has been partly clue to increasedarea (over 1 million hectares in the case of wheat)but, as in the Far East, yield improvement has alsocontributed much more than in the past. Since thearea under high-yielding varieties is insignificant inthe Near East (except in the United Arab Republic),it seerns probable that high prices for food grainshave induced farmers to use improved techniquesand especially fertilizers on existing varieties, particu-larly in the case of wheat, where there has been con-siderable varietal improvement at the national level.In contrast, the area and yield of feed grains, forwhich relative prices are generally lower than forwheat, have virtually stagnated, and it will be difficultto expand their output to meet the objectives oflivestock programmes in the absence of higher yield-ing varieties of barley and sorghum, and in the faceof the fixation on food-grain self-sufficiency whichbiases government price support policies in favourof wheat and rice. Food-grain surplus countriesmight have to consider using a greater proportionof wheat for feed, and at least for poultry this wouldbe very suitable; but even deficit countries mightfind it economically sound to import cheap grainrather than expensive livestocic products.
To generate surpluses of the magnitude shown incolumn 8 of Table II1-19 would require that growthrates of around 6 percent be sustained in the majorcereal-producing countries of the Far East and Near
" Rece;; t trends and patterns in rice trade, awl possible linesof action. FA° Committee on Commodity Problems. Study Groupon Rice. ccr : itt 70/6. April 1970.
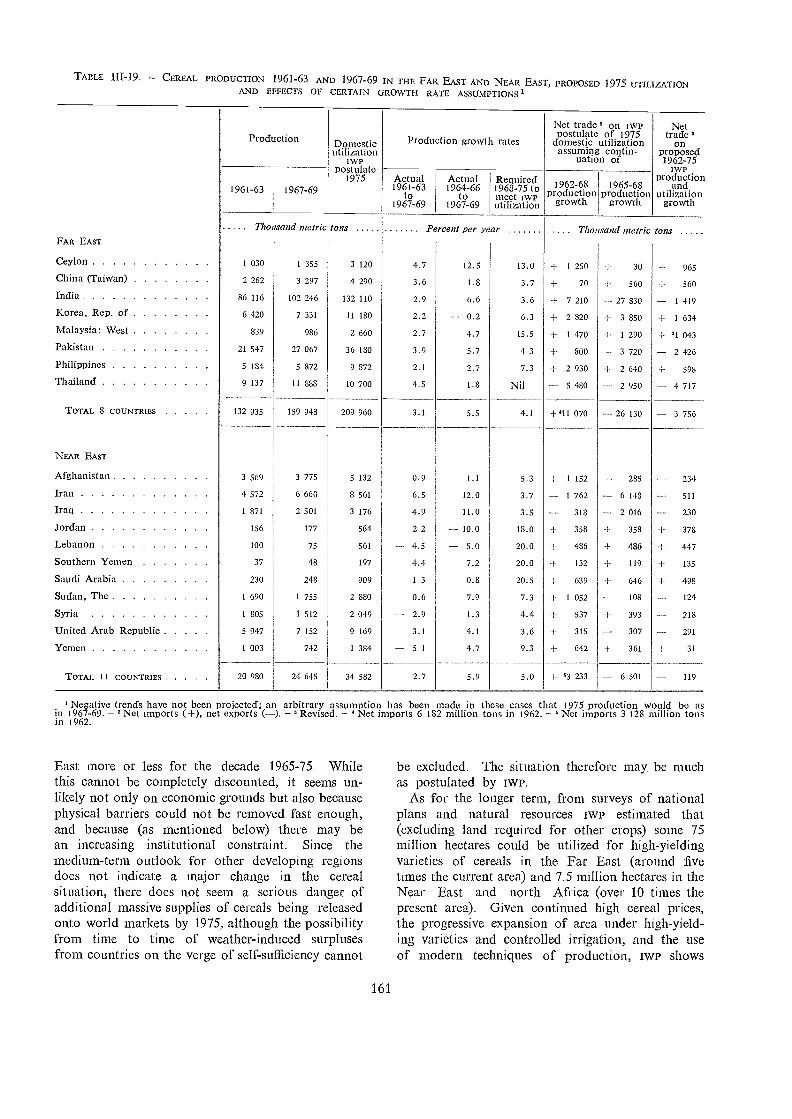
TABLE 1H-19. - CEREAL PRODUCTION 1961-63 AND 1967-69 IN THE FAR EAST AND NEAR EAST, PROPOSED 1975 UTILIZATIONAND EFFECTS OF CERTAIN GROWTH RATE ASSUMPTIONS'
FAR EAST
Ceylon
China (Taiwan)
India
Korea, Rep. of
Malaysia: West
Pakistan
Philippines
Thailand
TOTAL 8 COUNTRIES
NEAR EAST
Afghanistan
Iran
Iraq
Jordan
Lebanon
Southern Yemen
Saudi Arabia
Sudan, The
Syria
United Arab Republic
Yemen
TOTAL 11 COUNTRIES
Production Domesticutilization
1W?Postulate
1975
Thor sand metric tons
East more or less for the decade 1965-75. Whilethis cannot be completely discounted, it seems un-likely not only on economic grounds but also becausephysical barriers could not be removed fast enough,and because (as mentioned below) there may bean increasing institutional constraint. Since themedium-term outlook for other developing regionsdoes not indicate a major change in the cerealsituation, there does not seem a serious danger ofadditional massive supplies of cereals being releasedonto world markets by 1975, although the possibilityfrom time to time of weather-induced surplusesfrom countries on the verge of self-sufficiency cannot
161
Production growth rates
Actual1961-63
to1967-69
Actual1964-66
to1967-69
Required1968-75 tomeet pvputilization
Percent per year
1 030 1 355 3 120 4.7 12.5 13.0 - 1 250 -I- 30 + 965
2 262 3 297 4 290 3.6 1.8 3.7 + 70 + 560 + 560
86 116 102 246 132 110 2.9 6.6 3.6 + 7 210 - 27 330 - 1 4196 420 7 331 11 180 2.2 - 0.2 6.3 + 2 820 -I- 3 850 + 1 634
839 986 2 660 2.7 4.7 15.5 1 470 I- 1 290 + '1 04321 547 27 067 36 180 3.9 5.7 4.3 I- 800 - 3 720 - 2 4265 184 5 872 9 872 2.1 2.7 7.3 -I- 2 930 + 2 640 + 598
9 137 11 888 10 700 4.5 1.8 Nil - 5 480 - 2 950 - 4 717
132 935 159 948 209 960 3.1 5.5 4.1 +'11 070 -26 130 - 3 756
3 569 3 775 5 132 0.9 1.1 5.3
4 572 6 660 8 561 6.5 12.0 3.7
1 871 2 501 3 176 4.9 11.0 3.5
156 177 564 2.2 -- 10.0 18.0
100 75 561 4.5 -- 5.0 20.0
37 48 197 4.4 7.2 20.0
230 248 909 1.3 0.8 20.5
1 690 1 755 2 880 0.6 7.9 7.3
1 805 1 512 2 049 2.9 1.3 4.4
5 947 7 152 9 169 3.1 4.1 3.6
1 003 742 1 384 5.1 4.7 9.3_
20 980 24 645 34 582 2.7 5.9 5.0
Net trade 3 on iwppostulate of 1975
domestic utilizationassuming contin-
uation of
1962-68production
growth
-I- 1 152
1 762
318
+ 358
-I- 486
-i- 132
-I- 639
+ 1 052
I- 537
+ 315
+ 642
+ '3 233
1965-68production
growth
Thor sand metric tons
6 501
Nettrade
onproposed
1962-75WP
productionand
utilizationgrowth
234
511
230
-I- 378
447
135
-I- 498
124
218
291
-I- 31
119
Negative trends have not been projected; an arbitrary assumption has been made in these cases that 1975 production would be asin 1967-69. - 2 Net imports (+), net exports (-). -3 Revised. - Net imports 6 182 million tons in 1962. - 'Net imports 3 128 million tonsin 1962.
be excluded. The situation therefore may, be muchas postulated by IWP.
As for the longer term, from surveys of nationalplans and natural resources Iva, estimated that(excluding land required for other crops) some 75million hectares could be utilized for high-yieldingvarieties of cereals in the Far East (around fivetimes the current area) and 7.5 million hectares in theNear East and north Africa (over 10 times thepresent area). Given continued high cereal prices,the progressive expansion of area under high-yield-ing varieties and controlled irrigation, an.d the useof modern techniques of production, twr shows
1961-63 1967-69
285
6 148
2 016
-I- 358
-I- 486
-f- 119
-I- 646
108
-I- 393
307
361
that much larger "export availabilities" of wheat,rice, and possibly feed grains are technically feasibleby 1985. In the light of the future prospects fortrade in rice and wheat, however, export marketsare unlikely to be available for supplies of this mag-nitude, even assuming restricted domestic productionof cereals in developed countries.
Thus the outlook for staple food supplies in thedeveloping countries, while in many respects morehopeful, gives no grounds for complacency. Anyslackening of current efforts to increase cereal pro-duction could lead to a further increase in imports;any major "overshoot," once approximate self-suffi-cien.cy had been achieved in deficit countries, couldbe almost as expensive to those countries and perhapseven more disastrous to traditional cereal exporters.
SOCIAL DILEMMA OF THE HIGH-YIELDING VARIETIES
The problems of cereal production, however, arenot concerned solely with the level of supplies. Thehigh prices which have provided a major incentiveto farmers to invest in hig,h-yielding varieties andother yield-increasing inputs will have to be reducedto prevent overproduction and distortions of theland-use pattern in countries with the physical andtechnical potential to develop surpluses. This willalso be necessary if the increased levels of concentratefeeding required to achieve the rapid growth of live-stock production needed to meet future demand areto be economic.
This poses a most difficult dilemma since, whilefrom an examination of input-output relationshipsit appears feasible gradually to reduce cereal pricesin areas where high-yielding varieties can be grownsuccessfully by, say, 20 percent without creating adisincentive large enough for farmers to abandonthe use of modern technology, these varieties canprobably be grown on no more than one third of thetotal cereal area. Moreover, although in theory thehigh-yielding varieties are neutral with respect to scale,this appears not to be true in practice. Certainlysmall farmers can use these varieties successfullyand (relative to nonusers) can get high yields withappropriate complementary irrigation, -fertilizer andpesticide applications with or without mechani-zation. Experience in east Asia has proved this.Nevertheless, efficient and timely sowing at properdepths and spacing with the aid of mechanical equip-ment, and efficient and timely harvesting, threshingand drying would probably raise yields still further.Tractors and other equipment have been speciallydesigned for work on small farms, but even so thereare economies of scale and effectiveness where hold-ings are larger and unfragmented a rare phenomenonin many countries of the Far East, Near East andnorth Africa. Finally, all purchased inputs require
162
capital from the farmer, and even if fertilizer andpesticides do not represent a major cost comparableto a tractor, they do require that the farmer spendsmore money and thus incurs more risk. Manysmaller farmers do not have ready access to money,and tenant farmers are often not considered credit-worthy where institutional credit does exist. Risksof loss can be reduced by private investment inirrigation where this is not provided by government,and by efficient mechanization and pest control, butthis only completes the vicious circle by which thosewith capital (which generally means the larger farm-ers) can benefit relatively more than others from thehigh-yieldin.g varieties.
Experience in the Philippines suggests that as anincreasing number of farmers adopt high-yielding vari-eties the average level of yields from these varietiesdeclines, as does the use of inputs." If this were toprove generally true, it could lead to a gradual reduc-tion in the impact of the high-yielding varieties andother improved .techniques, with a correspondingdecline in the rate of expansion of output. In orderto prevent this, high priority must be given to build-ing integrated institutional services in which allfarmers can participate, irrespective of size of owner-ship, as well as to practical mesasures to providesome of the benefits of scale to the smaller farmersby means of structural changes. This, along with cou-rageous taxation meas ures to redistribute excessiveprofits and prevent unnecessary labour displacementby mechanization, would do much to enable allfarmers in areas of high potential to share in andbenefit from the green revolution. It would alsohelp to cushion the effects of a decline in cerealprices, and to avert the gloomier prophecies of socialupheaval.
An equally tough problem lies in the low potentialareas where high-yielding varieties cannot be grown,but which nevertheless are predominantly devotedto cereal culture. Farmers here have very littleflexibility for absorbing price cuts either by attempt-ing to raise yields by increasing efficiency, or byretrenching on nonfixed costs. Their possibilitiesand incomes are rigidly fixed by the harsh realitiesof nature. Any fall in cereal prices would bearespecially severely on them, and although some sys-tem of two-tier price support such as was introducedin Mexico might prove a palliative, a major priorityfor future development policy both at the nationallevel and for international aid should be to findmeans of improving their lot without sacrificing theoverall objectives of faster economic growth and anadequate level of food supply for the bulk of thepopulation.
" R.W. Barker. EC07101711C aspects of high-yielding varieties ofrice. 111R1 Report. FAO Study Group on Rice, thirteenth session,cer au 69/12. March 1969.
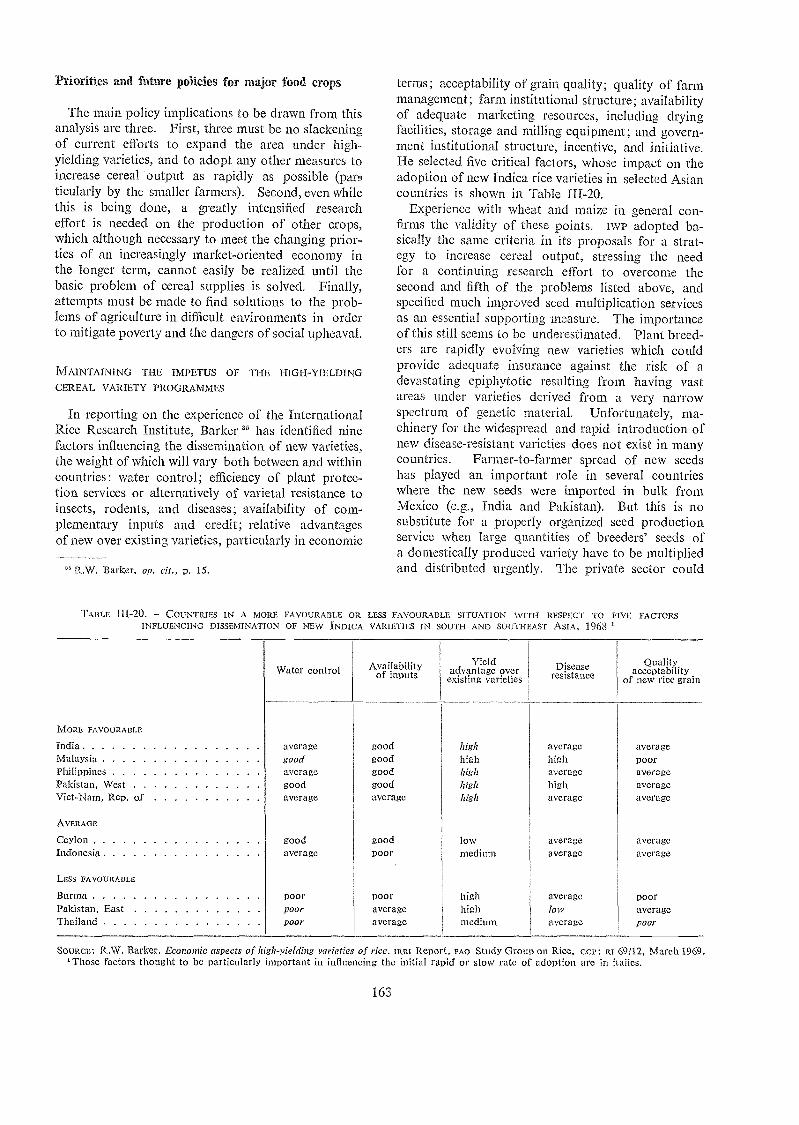
Priorities ami future policies for major food crops
The main policy implications to be drawn from thisanalysis are three. First, three must be no slackeningof current efforts to expand the area tinder high-yielding varieties, and to adopt any other measures toincrease cereal 'output as rapidly as possible (par!ticularly by the smaller farmers). Second, even whilethis is being done, a greatly intensified researcheffort is needed on the production of other crops,which although necessary to meet the changing prior-ties of an increasingly market-oriented economy inthe longer term, cannot easily be realized until thebasic problem of cereal supplies is solved. Finally,attempts must be made to find solutions to the prob-lems of agriculture in difficult environments in orderto mitigate poverty and the dangers of social upheaval.
MAINTAINING TFIE IMPETUS OF THE HIGH-Y1ELDINGCEREAL VARIETY PROGRAMMES
In reporting on the experience of the InternationalRice Research Institute, Barker " has identified ninefactors influencing the dissemination of new varieties,the weight of which will vary both between and withincountries: water control; efficiency of plant protec-tion services or alternatively of varietal resistance toinsects, rodents, and diseases; availability of com-plementary inputs and credit; relative advantagesof new over existing varieties, particularly in economic
" R.W. Barker, op. cit.. p. 15.
TABLE 111-20. COUNTRIES IN A MORE FAVOURABLE OR LESS FAVOURABLE SITUATION WITH RESPECT TO FIVE FACTORSINFLUENCING DISSEMINATION OF NEW INDICA VARIETIES IN SOUTH AND SOUTHEAST ASIA, 1968 1
SOURCE: R.W. Barker. Economic aspects of high-yielding varieties of rice. IRRI Report. FAO Study Group on Rice, ccp: Ri 69/12. March 1969.'Those factors thought to be particularly important in influencing the initial rapid or slow rate of adoption are in italics.
163
terms; acceptability of grain quality; quality of farmmanagement; farm institutional structure; availabilityof adequate marketing resources, including dryingfacilities, storage and milling equipment; and govern-ment institutional structure, incentive, and initiative.He selected five critical factors, whose impact on theadoption of new Indica rice varieties in selected Asiancountries is shown in Table III-20.
Experience with wheat and maize in general con-firms the validity of these points. IWP adopted ba-sically the same criteria in its proposals for a strat-egy to increase cereal output, stressing the needfor a continuing research effort to overcome thesecond and fifth of the problems listed above, andspecified much improved seed multiplication servicesas an essential supporting measure. The importanceof this still seems to be underestimated. 'Plant breed-ers are rapidly evolving new varieties which couldprovide adequate insurance against the risk of adevastating epiphytotic resulting from having vastareas under varieties derived from a very narrowspectrum of genetic material. Unfortunately, ma-chinery for the widespread and rapid introduction ofnew disease-resistant varieties does not exist in manycountries. Farmer-to-farmer spread of new seedshas played an important role in several countrieswhere the new seeds were imported in bulk fromMexico (e.g., India and Pakistan). But this is nosubstitute for a properly organized seed productionservice when large quantities of breeders' seeds ofa domestically produced variety have to be multipliedand distributed urgently. The private sector could
MORE FAVOURABLE
IndiaMalaysiaPhilippinesPakistan, WestViet-Nam. Rep, of
AVERAGE
CeylonIndonesil
LESS FAVOURABLE
BurmaPakistan, EastThailand
Water control Availabilityof i nputs
Yie ldadvantage over
existing varietiesDisease
resista ceQuality
acceptabilityof new rice grain
averagegoodaveragegoodaverage
goodaverage
poorpoorpoor
goodgoodgoodgoodaverage
goodpoor
pooraverageaverage
highhighhighhighhigh
lowmedium
highhighmedium
averagehighaveragehighaverage
averageaverage
averagelowaverage
averageBOOT
averageaverageaverage
averageaverage
BOOT
averagePoor
play an important role here, as it does in the developedcountries, with the government acting mainly in asupervisory capacity. Experience in the developingcountries has not so far been encouraging, privateenterprise often being expected to operate on toosmall profit margins, but a reexamination of poten-tial benefits in the light of opportunity costs forother uses of scarce government resources couldjustify allowing more favourable terms to firms willingto invest.
Results so far achieved with the three crops forwhich major international research centres have beenset up (wheat, maize, and rice) have demonstratedthat a major multidisciplinary effort can yield sub-stantial benefits. Although cost-benefit ratios cannoteasily be estimated in this type of work, the economicresults of the Mexican wheat breeding and UnitedStates hybrid maize and sorghum programmes, aswell as the more recent work on rice and wheatin Asia, all suggest that the payoff at the nationallevel can be extremely high."
Nevertheless, the development of the new varietieshas not been an unmitigated success story, and toconsolidate, improve on, and extend the progressmade so far is a precondition of continued agricul-tural expansion in many developing countries. Quiteapart from the marked regional disparities in theiradoption referred to earlier, existing varieties ofwheat, maize and, especially, of rice are far fromperfect. Plant genetic improvement is a process ofcontinuing evolution. While initial problems ofpalatability and consumer acceptance appear wellon the way to solution, an unremitting effort willbe required to overcome pest, disease and environ-mental problems in order to raise cropping inten-sities and to extend their coverage to new areas.Even where the new varieties are in wide use byfarmers, much adaptive research remains to be doneto determine the optimum rates of water and fertilizeruse, crop protection requirements, suitability forintensive rotations, and the possibilities of newtechniques such as ratooning which give promiseof very high rates of feed-grain production per year.This implies not only "outreach" programmes frommajor international or regional research centres,but also in many cases strengthened and better coor-dinated national research.
In addition there are important gaps in breedingprogrammes which remain to be covered by research.Comparatively little has yet been done to improvevarieties of barley or of the winter hardy or durum
" See T.W. Schultz. The allocation of resources to research.University of Chicago, Agricultural Economics Paper No. 68:16,1969. This shows the social rate of return on a discounted cashflow analysis above a 10 percent discount rate to be 700 on hybridmaize research and 360 on hybrid sorghum research in the UnitedStates, and 750 and 300 respectively on the hybrid wheat and maizeresearch programmes in Mexico. The International Rice ResearchInstitute estimates a return of $400 million in 1968 alone on a totalresearch expenditure of $20 million.
164
wheats which are grown under rainfed conditions inlarge areas of the Near East and north Africa.Only about 20 percent of world rice output nowcomes from land adequately equipped with controlledirrigation and protected from deep flooding, whichare prerequisites for the successful use of the dwarfIndica varieties. This area will increase, as develop-ment programmes are implemented, but there willremain a large area under upland, swamp, and deepwater rice varieties to which little research and ex-tension effort have so far been directed. Perhapsthe highest priority of all is to increase yields ofsorghum and millet, which occupy 30 million hectares(over half of the total cereal area) in Africa south ofthe Sahara and also large parts of Asia and LatinAmerica. In many areas it is not feasible to sub-stitute these by other cereals for ecological reasons,nor is it nutritionally or economically desirable.
One further priority must be stressed in respectof cereals. Since for full success the high-yieldingvarieties require a suitable physical environment,with freedom from drought or deep flooding and anassured and adequate supply of water, their use isclosely linked to programmes for land and waterdevelopment. In many developing countries newland is so scarce that practically the only way ofexpanding production is through irrigation, drainage,terracing and similar investments designed to facili-tate more intensive use of existing areas of cul-tivated land.
IMPROVING YIELDS OF ROOTS AND TUBERS
While so much attention has been concentratedon cereals, it is essential not to overlook the significantrole of roots, tubers, and other starchy products suchas plantains, in the diet of many people. Almostthe entire world production of cassava, yams andplantains, and 80 percent of sweet potatoes, is pro-duced and consumed in the developing countries,approximately half of it in Africa, where 80 millionpeople in the humid tropical zone depend almostentirely on cassava and yams for their staple food.Hitherto such crops have been largely neglected inresearch and development programmes, and acceler-ated and better coordinated effort is a major priority,particularly for Africa. Fortunately, there are prom-ising indications that yield and possibly also proteincontent could be increased significantly over pres-ent low levels by the selection of better plantingmaterial and the improvement of cultural practices.
Cassava has generally been reckoned to be of poornutritive value, despite its ability to produce morecalories per hectare than any other crop in the humidtropics and its good keeping qualities. However,the young leaves can contain up to 18 percent pro-
tein, and plant collection work has isolated rootswith up to 6 percent protein which could form thebasis for a clonal propagation programme. Whereland remains plentiful and it is difficult to find suit-able alternative food crops (as in equatorial Africa),cassava will probably continue to be grown as amain subsistence crop under extensive conditions,and priority must be given to the diffusion of im-proved clones resistant to cassava mosaic and otherdiseases, and with higher protein content. In areaswith strong population pressure, on the other hand,the objective should be to attain very high yields,possibly involving the systematic use of fertilizer.Numerous experiments have shown that average an-nual yields of about 30 tons per hectare (five timespresent national averages) can be achieved, but morestudy of the economics of fertilizer use under Africanconditions is required.
Yams and sweet potatoes also offer considerableopportunities for intensive market gardening typeproduction, as well as for improvements in tuberquality. The main problem with the former is highwastage in storage. Sweet potatoes offer a particu-larly promising field of work for Asian countries,as they fit well into multiple cropping systems, havelimited susceptibility to insect pests and diseases,a relatively low water requirement, and can givegood yields even in soils of medium fertility. Em-phasis should be given to the improvement of theexisting yellow varieties with relatively high proteinand carotene content. Further study is also re-quired to investigate the potential and identify theconstraints on the wider use of cocoyams, whichare resistant to disease, store well, and have a higherdry-matter, crude protein and amino-acid contentthan cassava, yams or sweet potatoes, but which atpresent are only cultivated on a limited scale.
IMPROVING PROTEIN SUPPLIES
While the recent technical progress in respect ofcereals holds out the hope that it may be feasibleto meet both economic demand and nutritional re-quirements for calories in many developing countries,the task appears much more formidable in the caseof protein. This is not merely due to inequalitiesof distribution although these are much morepronounced in the case of protein-rich foods than ofthose supplying mainly calories but also becausethe gap between available protein and nutritionalneeds is often much larger than that between suppliesand effective demand.
Despite arguments that cultivated land should beused to produce food for direct human consumptionrather than processing it relatively inefficientlythrough livestock, most people have a preference for
165
animal protein. FIowever, their ability to expressthis desire is constrained by ecological factors andby price, income distribution, and marketing channels.Although demand at constant prices is projectedto rise rapidly, this is unlikely to be met becauseof the timelag involved in increasing livestock output,particularly from ruminants, and because of a re-source barrier to rapidly expanding catches of con-ventional fish species. Prices of animal protein aretherefore likely to rise sharply during the SecondDevelopment Decade, and unless supplies of high-quality vegetable protein can be increased and con-current measures taken to promote its consumption,severe malnutrition could well increase despite theimprovement anticipated in calorie supplies. A rapidexpansion of output of vegetable protein is particularlycrucial among the lower income groups and vul-nerable classes in countries such as India where over40 percent of the population is vegetarian for religiousreasons, and in rural areas of predominantly subsis-tence agriculture where the weight of ecological con-straints is greatest and income-generated improvementsin the diet likely to be slowest.
There is, of course, the possibility of manufac-turing nonconventional proteins or synthetic aminoacids, to which a good deal of industrial researchis being devoted in developed countries. Someprocesses have now reached the commercial produc-tion stage, but because of uncertainty as to the effectson human health as well as problems of taste andconsumer acceptance, their application in the imme-diate future is expected to be mainly as livestock feed.This could have particular attractions for developingcountries with petroleum industries, but there areclearly long-term implications for agricultural pro-ducers both on the credit and debit side which sofar appear to have received little attention.
Two concurrent lines of attack are required withvegetable protein: first, to attempt to increase thetotal protein content and quality of cereals; and sec-ond, to increase the area, yield, and protein qualityof protein-rich crops, including both grain legumesand leguminous oilseeds such as groundnuts andsoybeans.
In the case of cereals, research on maize has alreadyresulted in relatively high-yielding varieties richer inessential amino acids (via backcrossing from thehigh-lysine mutants opaque-2 and floury-2). It hasalso been shown that total protein per hectare canbe increased substantially with high levels of nitrogenfertilizer. This could solve the problems of proteinmalnutrition associated with maize-based diets. Itmay also eventually lead to a reduced demand forhigh-protein concentrates such as soybean meal inlivestock feeds. Progress with other cereals hasbeen more limited in respect of protein quality,although total protein content has been increased
significantly by wheat breeding, and the range ofgenetic variation in both protein content and qualityin most cereals appears wide enough to offer hopeof further improvement. For wheat, millet andsorghum, research should aim first at developinghigh-lysine varieties because of the wide gap be-tween the primary and secondary limiting aminoacids. This could significantly increase the proteinintake of poorer people who do not have access tothe 20 to 25 percent of pulses or animal productsneeded to offset the lysine deficit in their staple food.The quest for varieties with a higher total protein con-tent is less urgent because diets based largely on thesecrops are generally adequate as .far as the protein-calorie ratio is concerned.
For rice, the research priorities in respect of pro-tein are reversed. Increasing the lysine content willafford only a limited gain in protein value becausethe gap between the primary and secondary limitingamino acids is narrower. Conversely, therefore,selective breeding should aim at raising the totalprotein content in order to augment the protein-calorie ratio of rice diets without altering the pres-ent amino-acid pattern. For example, the replace-ment by 1985 of half the rice consumed in Asiaby a new variety with good consumer acceptabilityand a protein content of 11 percent would raisethe per caput protein intake by some 10 percent.
A further interesting possibility is "genetic en-gineering" to create stable intergeneric hybrids, ofwhich Triticale (wheat x rye) is the most promisingexample so far. Work on this has reached the stagewhere there is a distinct probability of being ableto release commercially within the current decadea plant with high-yielding capacity, short straw,excellent resistance to wheat rusts, good droughtand cold tolerance, and a protein content of 20percent with a quality equivalent to that of skimmilk. Strains of Triticale are alread.y under trialin the FAO Near East wheat and barley nurseries,with initially a view to their introduction as hardyfeed grains, and further breeding work is in progress.
As regards the leguminous crops, research on grainlegumes in most developing countries is still ex,tremely inadequate, with the result that their yieldshave hardly increased since the mid-1950s. Highpriority needs to be given to chick-peas and len.tils(mainly in drier areas of the Near East and southAsia), to cowpeas (mainly in tropical latitudes andpredominantly in Africa), and to haricot beans(genus Phaseohis). Significant progress in ground-nut production has been made as a result of researchand extension programmes in some countries ofAfrica, but yields in Asia (the largest producingregion) have long remained static; nor have averageyields in the main soybean-producing countries ofthe developing world shown much improvement.
166
These two crops are of particular importance, notonly because of their direct contribution to the diet,the value of their oil for exports or import substi-tution, and the indirect value of protein-rich caketo livestock nutrition, but also because of their poten-tial significance as sources of formulated proteinfoods and dietary supplements, including weaningfoods.
Improved and often simple cultural practices (thatis, optimum sowing dates, planting distances and seedrates, weed control, and better harvesting techniques)could do much to improve yields of many of thefood legumes in the immediate future, as couldmoderate levels of fertilizer application combinedwith better crop protection practices. Experience ina number of countries suggests that reasonably high-yielding varieties of certain high-protein crops (peas,Phaseolus species, groundnuts and soybeans) alreadyexist, but that their potential is not being achievedbecause .their agronomy is not properly understoodby the farmers, and because so many research workersare obsessed by the "philosopher's stone" of breedingnew varieties. An imaginative national programmeof collaboration between research and extension work-ers to test and demonstrate better cultural methodscould often double yields over a relatively shortperiod at low cost to the farmer and to the economy.A further avenue of approach showing promise isthe development of quick-maturing varieties suitablefor inclusion in rotations with cereals and othercrops in the irrigated and higher rainfall areas.
A long-term international programme to explorethe genetic potential and develop better varietiesnevertheless appears essential for chick-peas andlentils, the subtropical grain legumes grown mostwidely in south Asia and the Near East, where dis-ease limits the potential for irrigation and fertilizeruse, and also for the wide range of annual and pe-rennial species native to the tropics on which littleimprovement has so far been attempted.
FRUIT AND VEGETABLE PRODUCTION
Demand for fruit and vegetables will rise morerapidly during the next decade than for any otherfood crops. The main stimulus will come from ur-banization, which implies more systematic marketingand higher quality standards.
Despite significant progress in recent years in com-mercial vegetable production in parts of Asia andnorth Africa, and in developing fruit exports fromAfrica and Latin America, the bulk of horticulturalproduction in developing countries is still grownmainly for subsistence, and the use of modern tech-niques is exceptional. Many of the varieties grownare unsuitable or low-yielding, vegetable seeds import-
ed from abroad without adequate trial have oftengiven poor results, and research to develop adaptedvarieties and cultural practices is generally inadequate.Farmers' attitudes also require changing if significantprogress is to be made; in most cases fruit and veg-etables are regarded as backyard crops rather thana potentially important source of income.
A main problem is how best to select well-adaptedhigh-yielding varieties from among the very widerange of species, and demonstrate the results to thefarmers. In this connexion it may be important toexamine the potential not only of existing cultivatedplants, but also of "unconventional" species. InAfrica, for example, it has been found that over athousand native species are eaten as vegetables, andmuch more work needs to be done to determinethe nutritive value of such species and their rolein the diet. In order to achieve maximum impact,technical effort and improved planting material shouldbe concentrated initially on key zones (for exampleirrigation projects or areas close to urban centres).
What has been said concerning vegetables is alsoto a large extent true of fruit and nuts which (ex-cept where an export trade has been developed andin areas that serve main population centres) arealso largely grown on a haphazard basis. Fruit area cheap natural source of 'minerals and vitamins,and tropical AfrIca is, on the whole, particularlypoor in this sector of agriculture. Higher priorityneeds to be given to diversifying the range of speciesfor domestic consumption, if necessary by introductionof exotic species from comparable ecological areasin other continents.
NTENSIFICATION THROUGH MULTIPLE-CROPPING SYSTEMS
A wider spectrum for increasing output even thanthat created by the high-yielding varieties has beenopened up by the concept of maximum productionper unit area per unit of time through multiple crop-ping, based on an almost continuous cycle of crops,each needing the land for a comparatively shortperiod. Research workers in Asia have been obtain-ing 20 tons of dry matter per hectare by the use ofthis technique, whereas the most which could be ex-pected from a conventional double-crop rotation basedlargely on cereals would be around 10 tons." Quiteapart from the much better nutritional balance ob-tainable from the varied range of crops which can befitted into a multiple-cropping system, economicstudies have shown that significant increases in in-come and employment are also possible through theintroduction of intensive systems. As long as ade-
" As is noted later, even higher yields of dry matter have beenobtained with forage crops grown for animal feed and harvested8 to 12 times a year.
167
quate credit and institutional support can be provided,these systems appear best suited to adoption by thesmaller farnily-sized farmers who can give the closesupervision and year-round care essential to success.
So far, however, really intensive multiple cropping,as practiced in Hong Kong and experimentally inIndia, China (Taiwan) and the Philippines, hasreceived little attention in international and nationalresearch programmes, and only the fringe of theapparent potential has been explored. Not onlydo the correct combinations of crops and culturaltechniques which would optimize water and fertilizeruse, minimize pest and disease problems, and yieldthe highest income from the system need to be de-termined, but many of the techniques involved willbe novel to the average farmer an.d will have to beincorporated into management practices. Consid-erable skill and judgement are required in soil andwater use, choice of crops, use of the appropriateinputs, timing of cultivations, and selective mechani-zation, and these will not be learned easily. Require-ments for both fixed and working capital are high,and while the net returns from well-managed smallfarms making full use of resources, including theuse of by-products for livestock, are also high,38the risk factor could deter many farmers unlessthey are well trained and well supported by govern-ment services.
Not only is successful multiple cropping exactingfor farmers and supporting services, but it cannotbe adopted in areas without adequate water supplyand drainage, or where there is a pronounced coldseason. While it is therefore no general panacea,the potential for increasing food supplies and improv-ing nutrition over the long term is still very large.If significant progress toward its realization is to bemade before the end of the Second DevelopmentDecade, accelerated research and extension workwill be essential, with strong emphasis on manage-ment advice, input supply, credit and the provisionof marketing channels designed to cope with a variedflow of produce.
Strategy for the modernization of production
In many developing countries the use of modernagricultural technology has until recently been con-fined largely to production for export or industrialuse, and has hardly touched domestic food produc-tion. The impact of population and income growthhas raised the demand for most foodstuffs to a levelwhich can only be matched by the transformation
" Thc annual net income from farms covered in a sample surveymade in Hong Kong for 1961-65 varied between $800 and $1 000per hectare.
of traditional production techniques through theuse of high-yielding varieties, quality seeds, improvedcultivation methods, and purchased inputs such asfertilizer, pesticides, and improved equipment (wheth-er hand or mechanical). Farmers in Asia havealready exploded the myth that they are not respon-sive to the use of varieties or other improvementswhich give clearly demonstrable benefits, providedthat price relationships are satisfactory and othermajor disincentives do not prevent them from inno-vating. A very rapid growth both in capital invest-ments and in the use of purchased inputs is clearlyessential for the achievement of the food productionobjectives of the Second Development Decade. Mea-sures to assist farmers in adopting efficient meth-ods appropriate to their local conditions thereforerepresent a major priority. This is also necessaryif adequate returns are to be obtained on the capitalinvested in development.
The improvement of traditional agriculture doesnot, however, imply a single giant leap from thesickle to the combine harvester. It should in mostcases be one of progressive modernization, in-volving a number of relatively simple improvementsin technology which do not depart too radicallyfrom tradition or require large units of new invest-ment, and which can be introduced quickly and ef-fectively to farmers by intermediate-level field ex-tension workers. The opportunity costs of theiruse in relation to foreign exchange requirementsand the employment situation are important consider-ations, as well as the use of labour wherever feasibleas a substitute for material inputs."
In broad terms low-cost inputs such as qualityseeds and improved tools should be emphasized incountries with relatively ample reserves of land andlabour, as in much of Africa and Latin America(except where there is a need to intensify more rapidlyin relation to a specific project), or where technicalservices are still in an early stage, farming standardsprimitive, and production largely for subsistence.High transport and marketing costs bear severelyon land-locked countries with a limited croppingrange, such as the west African savanna countries(particularly for bulky commodities such as fertilizersand fuels), and on the use of purchased inputs onthe lower priced crops. Under these circumstances,because of relatively low transport costs per unitapplied per hectare, chemical crop protection maywell be a more economic means of obtaining increas-ed production than fertilizer application orjnechani-zation.
" The increase in the labour force was until recently the mainfactor contributing to increased output in India, and has also beenof major importance in the achievement of high yields and croppingintensities in the United Arab Republic and in eastern Asia. Sub-stitutability becomes less, however, as production grows more in-tensive, and labour and cash inputs interact to raise productivityper worker and per hectare.
168
Mechanization should be directed wherever possibletoward creating additional jobs by opening up newland and raising yields and cropping intensitiesrather than toward economizing in labour. In thepast there has been a tendency for developing coun-tries to adopt techniques and machines much alongthe lines followed in industrialized countries wherethe reasons for mechanizing were different. In thefuture attention needs to be focused much more onadapting both systems of agriculture and productiontechnology to the specific needs of the developingcountries, for most of which a labour-intensiveapproach is man.datory.
Provisional estimates for identified costs of pur-chased inputs revised from nvi, calculations suggestthat, by the end of the present decade, annual expen-diture on seed, fertilizer, pesticides, and fuel andspares for machinery in the crop sector would haveto rise to $15 000 million over three times thelevel of 1962 to meet the Plan's proposed targets.While these estimates cover not only food but alsoplantation and industrial crops, about half of thecumulative estimated costs of inputs during theSecond Development Decade would be expended onraising cereal production. This arises from the basicconcept underlying the development of the high-yielding varieties, which was to produce a plant typeresponsive to higher standards of farming (and par-ticularly to irrigation and fertilizers), instead of accept-ing the tacit assumption, which had coloured mostearlier plant breeding work, that farmers in develop-ing countries required only varieties suited to tradi-tional low-input levels or a limiting environment.Eloquent testimony to the success of this conceptcomes from the rapid rise in private tube-well invest-ment and input use in countries now using high-yielding cereal varieties on a large scale. Fertilizerconsumption in the 16 major rice producers amongdeveloping countries rose at 11 percent per yearbetween 1960 and 1964, but at over 16 percent peryear between 1964 and 1968. In India and Pak-istan the 1965-68 growth rate was 31 percent per year,and in Turkey consumption on wheat rose from286 000 tons to 1.15 million tons between 1966and 1969. A rapid rise in pesticide use has alsobeen reported from several Asian countries.
The sharp increase in the use of agricultural chem-icals in some developing countries has begun toarouse fears of environmental pollution of the typealready evident in developed countries. This, how-ever, does not seem a hazard for many years to come,especially in comparison with that arising from in-dustry, automobiles and aircraft, concerning whichthe developed world has so far been unable to putits own house in order. For one thing, the use ofchemicals on other major food crops in developingcountries is expected to rise much less rapidly than
their use on cereals in the period up to 1980, becauseof the lack of high-yielding varieties of most of thesecrops, the lack of special government programmes,and the primitive conditions under which they areoften grown. Even for cereals the present use perhectare is still very low, while the current rapid ratesof increase for fertilizer and pesticides are expected toslacken somewhat because of institutional and struc-tural constraints.
Even if the high levels postulated by fwr wereto be attained, overall consumption per hectare inthe developing countries by 1985 would be wellbelow that current today in most developed countries.The hazard should therefore be regarded as a long-term one which can be solved gradually by cooper-ation in research and manufacture between the in-dustrialized and developing countries. It should notgive rise to panicky short-run palliatives such as ban-ning DDT in developing countries, which can only setback their efforts to raise output without touchingthe real core of the overall pollution problem whichvery largely lies elsewhere.
Improving productivity in difficult enviromnents
Most research work, as well as the allocation ofextension, credit, inputs and other scarce resources,is now concentrated on developing high-yieldingvarieties and on the adoption of modern technologysuited mainly to areas of relatively high agriculturalpotential with the object of raising productivity asrapidly as possible. This is understandable, andprobably correct priority setting in the light of thedesperate need for food and foreign exchange earn-ings in many developing countries. But it is leadingto a widening income gap between farmers in areasof high potential and those elsewhere, with explosivesocial and political implications. These problemscan no longer be safely ignored, and specific pro-grammes need to be launched to tackle the admittedlydifficult problems of the poorer areas, which mainlyaffect three broad zones: the semiarid to subhumidzones, the mountain areas, and the humid tropics.
The semiarid to subhumid zones with 250 to 750millimetres of erratic rainfall per year are marginalfor cultivation at the lower end of the scale and havea strongly cereal-fallow dominated farming patternthroughout the arable area. This includes the north-west Indo-Gangetic plain, most of the Near East andthe Mediterranean basin, and Africa immediatelynorth and south of the Sahara. Part of the area isupland, with cold winters which do not permit theuse of existing nonwinter-hardy high-yielding cerealvarieties even where precipitation is adequate, althoughcertain varieties of U.S.S.R. and North Americanorigin now under test in areas of continental climate
169
in Iran and Turkey are showing considerable promise.Developments in commercial raided farming inSouth Australia and experimental evidence in northAfrica and parts of the Near East call into questionthe whole system of agriculture currently practisedin these zones, and in particular the economics of thecereal-fallow rotation with a crop only once in twoyears, and the almost complete divorce of crop andlivestock husbandry. As noted in the followingdiscussion of livestock production, the aim shouldbe to develop a "stratified" system of rearing animalson the range (particularly sheep, since there is a mark-ed consumer preference for mutton in many arid-zone countries), and finishing them to better weightson leguminous fodders grown instead of a fallowin rotation with cereals on rainfed or even irrigatedland. Technically this seems perfectly feasible, eco-nomically it has been shown to be profitable, and ithas beneficial effects on soil structure, fertility and cropyields. The fact that it has not yet become standardfarm practice suggests that structural, institutionaland marketing problems may be the main constraints.
The mountain areas have been largely neglected byresearch programmes (except in parts of Latin Amer-ica), possibly because the problems are localizedand the total population affected is not very great.Despite the poverty stricken nature of many mountainareas under traditional systems of mismanagement,there is evidence that they often represent an under-utilized resource, capable of supporting a more pro-ductive forest/farming/grazing association under ra-tional exploitation. In such areas a basically similarapproach might have to be adopted to that proposedabove, the difference being that "stratification"would be from higher to lower altitudes, with forestor grazing at higher altitudes, fodders and fruittrees in terraced agriculture on lower slopes, andarable cropping in the valleys.
Much of the world's unutilized land resources liesin the humid tropics. Development of these resourcesis difficult, partly because of climatic conditions andpartly because of the chemical and physical natureof their soils. With increasing population pressures,shifting cultivation (the basic system in these areas)is becoming inadequate from both the social and theeconomic viewpoint. Solutions must be found tothe management problems of fertility, erodabilityand waterholding capacity of these soils beforethey can be brought under permanent cultivationfor annual crops on any large scale. Permanenttree crops can offer a partial solution, but the foodneeds of the local population and the absorptivecapacity of the world market set limits to this.
Although the environmental constraints differ,all three of these zones have a number of featuresin common, including an "unsettled" type of agri-culture (nomadism, transhumance, or shifting culti-
vation), problems arising from social customs andmisuse of physical resourCes, and levels of livingand education which are some of the lowest in theworld. It must be faced from the outset that anyresearch and development programmes will haveto be system- and problem-oriented rattler than ona narrow technical basis, and multidisciplinary andlong-term in their character. Because of the long-term nature of the problems of attempting to mit-igate income disparities arising from differencesin agricultural potential within countries, it is diffi-cult to accept arguments that efforts to exploit theimmediate potential for increasing food supplyshould be cut back while solutions to these problemsare fou.nd. Inequalities have always existed be-;
tween arcas of high and low potential, and there havebeen some spectacular failures in both developingand developed countries in trying to iron them out.What is required is a strategy which attempts to max-imize comparative advantages within any given en-vironment, as well as to exploit cornplementaritiesbetween and within countries, rather than tryingto equalize the unequalizable.
In terms of planning future food produ.ction, thisimplies concentrating cereal production in the shortterm to the fullest extent possible into the morepromising areas where the full genetic potential ofthe high-yielding varieties can be realized. Thereare a number of other important crops for whichhigh-yielding varieties have not yet been adapted foruse in developing countries and which therefore can-not profit to the same extent from conditions ofhigh fertility, including most grain legumes, oilseeds,and many fruit and nuts. These generally havehigher unit prices than cereals, and under limitingconditions where the high-yielding cereal varietiescannot be grown could possibly yield a larger net
Livestock
Nearly a decade ago a chapter in The state offood and agriculture was devoted to the livestockindustry of the less developed countries.° This con-cluded by looking ahead to the next decade, and itis hardly encouraging to find that almost all of theproblems identified at that time are still importanttoday.
In fact, the livestock situation in the developingcountries seems to have worsened: the increase inanimal production in the 1960s was less than thegrowth of population, and in each of the developing
4' FAO, The state of food and agriculture 1962. Rome. 1962.p. 129-160.
170
return to the farmer. Efforts might therefore bedirected to shifting land use away from cereals to-ward those crops in such areas, or alternatively to-ward productive forestry or livestock rearing alongthe lines indicated earlier.
This puts a premium on sound land-use planningbased on ecological and economic studies to determinethe type of thrust required and, once this has beendecided, on policies to encourage farmers to coop-erate. These should probably involve not merelytechnical measures, but works programmes to con-struct terraces and watering points, plant trees, andbuild roads, as well as grants or loans to tide thefarmers over while trees came into bearing, or topurchase animals. The establishment of appropriateagro-allied industries could be an important growthstimulant, and food aid might be directed to support-ing specific objectives within the programme.
In time a reversal of this process can be envisaged,at least as far as annual crops are concerned, as aresult of pressures from the changing pattern ofdemand for food, and through continued research.The latter could result in the development of high-yielding varieties of other annual crops which wouldcompete effectively with cereals in the better areas.Conversely, the evolution of more efficient rainfedcereal-fodder farming systems, and of cereal varietiesmore tolerant of cold and drought and more respon-sive to fertilizers, would raise the profitability ofcereals in arcas of lower potential and enable thoseareas to increase their contribution to national ce-real output. In m.any countries the area suited toreally high-yielding cereal varieties is limited, butthe scope for raising cereal yields in other areas hasnot been fully exploited, and they will be unableto meet long-term demand unless means can be foundof raising the productivity of rainfed land.
regions except Latin America it dropped below therate achieved during the previous decade. Improvedper caput incomes widened the gap still further be-tween domestic production and demand at constarttprices, resulting in higher prices and increased im-ports of livestock products in many developingcountries.
Although there is some uncertainty as to the exactrate of growth of demand for livestock products,there is no doubt that it will continue to rise rapidly,especially in urban areas. To meet this demand, aswell as to improve protein intakes, it will be neces-sary to expand livestock production much faster thanin the past.
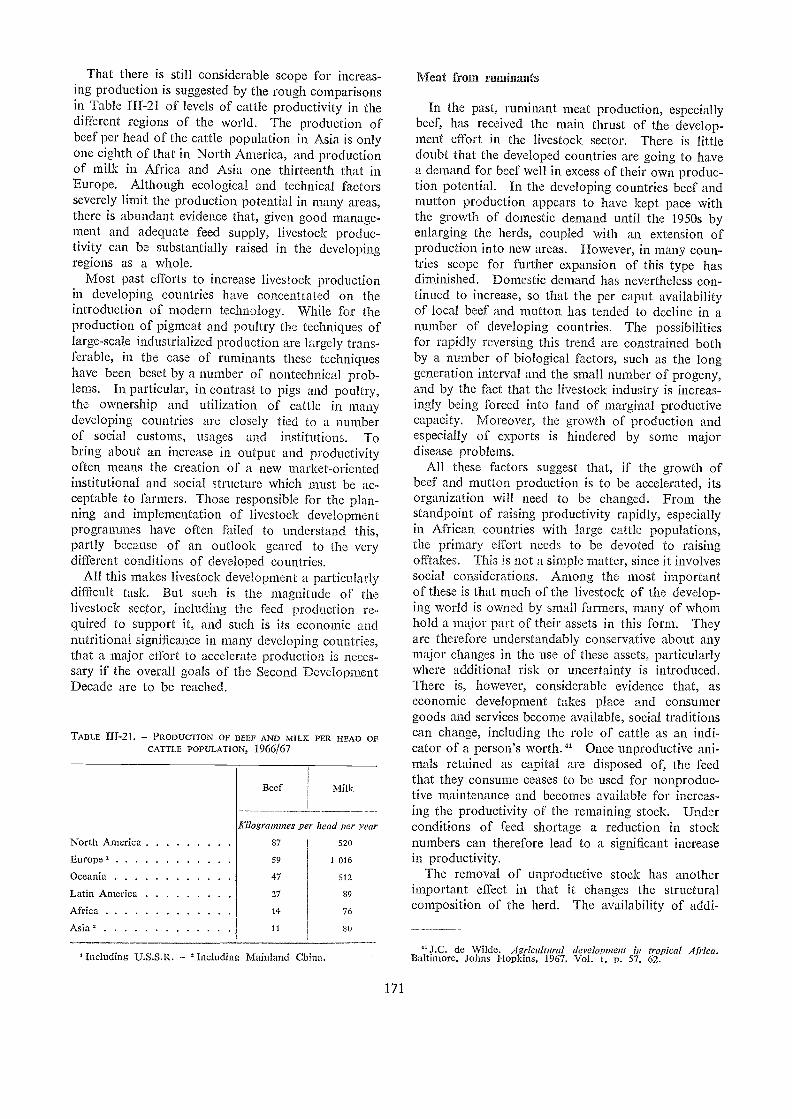
That there is still considerable scope for increas-ing production is su.ggested by the rough comparisonsin Table III-21 of levels of cattle productivity in thedifferent regions of the world. The production ofbeef per head of the cattle population in Asia is onlyone eighth of that in North America, and productionof milk in Africa and Asia one thirteenth that inEurope. Although ecological and technical factorsseverely limit the production potential in many areas,there is abundant evidence that, given good manage-ment and adequate feed supply, livestock produc-tivity can be substantially raised in the developingregions as a whole.
Most past efforts to increase livestock productionin developing countries have concentrated on theintroduction of modern technology. While for theproduction of pigmeat and poultry the techniques oflarge-scale industrialized production are largely trans-ferable, in the case of ruminants these techniqueshave been beset by a number of nontechnical prob-lems. In particular, in contrast to pigs and poultry,the ownership and utilization of cattle in manydeveloping countries are closely tied to a numberof social customs, usages and institutions. Tobring about an increase in output and productivityoften means the creation of a new market-orientedinstitutional and social structure which must be ac-ceptable to farmers. Those responsible for the plan-ning and implementation of livestock developmentprogrammes have often :failed to understand this,partly because of an outlook geared to the verydifferent con.ditions of developed countries.
All this makes livestock development a particularlydifficult task. But such is the magnitude of thelivestock sector, including the feed production re-quired to support it, and such is its economic andnutritional significance in many developing countries,that a major effort to accelerate production is neces-sary if the overall goals of the Second DevelopmentDecade are to be reached.
TABLE III-21. PRODUCTION OF BEEF AND MILK PER HEAD OFCATTLE POPULATION, 1966/67
'Including U.S.S.R. 'Including Mainland China.
171
Meat from ruuninants
In the past, ruminant meat production, especiallybeef, has received the main thrust of the develop-ment effort in the livestock sector. There is littledoubt that the developed countries are going to havea demand for beef well in excess of their own produc-tion potential. In the developing countries beef andmutton production appears to have kept pace withthe growth of domestic demand until the 1950s byenlarging the herds, coupled with an extension ofproduction into new areas. However, in many coun-tries scope for further expansion of this type hasdiminished. Domestic deman.d has nevertheless con-tinued to increase, so that the per caput availabilityof local beef and mutton has tended to decline in anumber of developing countries. The possibilitiesfor rapidly reversing this trend are constrained bothby a number of biological factors, such as the longgeneration interval and the small number of progeny,and by the fact that the livestock industry is increas-ingly being forced into land of marginal productivecapacity. Moreover, the growth of production andespecially of exports is hindered by some majordisease problems.
All these factors suggest that, if the growth ofbeef and mutton production is to be accelerated, itsorganization will need to be changed. From thestandpoint of raising productivity rapidly, especiallyin African countries with large cattle populations,the primary effort needs to be devoted to raisingofftakes. This is not a simple matter, since it involvessocial considerations. Among the most importantof these is that much of the livestock of the develop-ing world is owned by small farmers, many of whomhold a major part of their assets in this form. Theyare therefore understandably conservative about anymajor changes in the use of these assets, particularlywhere additional risk or uncertainty is introduced.There is, however, considerable evidence that, aseconomic development takes place and consumergoods and services become available, social traditionscan change, including the role of cattle as an indi-cator of a person's worth." Once unproductive ani-mals retained as capital are disposed of, the feedthat they consume ceases to be used for nonproduc-tive maintenance and becomes available for increas-ing the productivity of the remaining stock. Underconditions of feed shortage a reduction in stocknumbers can therefore lead to a significant increasein productivity.
The removal of unproductive stock has anotherimportant effect in that it changes the structuralcomposition of the herd. The availability of addi-
"J.C. de Wilde. Agricultural development in tropical Africa.Baltimore, Johns Hopkins, 1967, Vol. 1. p. 57, 62.
Beef Milk
Kilogrammes per head per year
North America 37 520
Europe ' 59 1 016
Oceania 47 512
Latin America 27 89
Africa 14 76
Asia" 11 80
tional feed enables fattening animals to be finishedat an earlier stage, thus reducing the grazing pressurestill further. This permits the breeding herd to beenlarged in size and, provided the expansion in cownumbers is carefully controlled, a new herd equilib-rium can arise with a much higher productivityper head of stock.
From the long-term standpoint this measure alonewill not suffice and a major increase in production,especially in Latin America, will necessitate an expan-sion in livestock inventories. In many countries thiswill be difficult to achieve in the face of a strongmarket demand for livestock products and a lowcurrent return on capital invested in stock. However,a study of some recent credit programmes for live-stock development in Latin America indicates thatthe in.troduction of new technology can result in anattractive return on new investment in the livestocksector. Because this return takes some years to berealized, a critical factor in stimulating investmentin livestock production is the need to generate greaterconfidence among farmers in the long-term futureof the beef industry. It will therefore be essentialto put beef production on an economic basisby eliminating controls on prices and allowingthem to rise. Apart from such an increase inred meat prices, it may require direct incentivesfrom governments, such as a subsidy on breedingstock or a long-term market guarantee, as wellas the provision of development credit, beforefarmers will agree to build up their breedingherds.
Another importan.t problem in this connexionarises from the fact that in the early stages of rumi-nant development a great deal of emphasis is com-monly given to genetic improvement, frequently inisolation from parallel environinental and managerialchanges. Yet, if advanced techniques are used andsufficient feed of adequate quality is made available,the most rapid progress is often made (except in verysevere environments) by upgrading with exotic breeds,rather than by concentrating solely on the use ofgenotypes historically adapted to the environment.While every effort should be made to preserve uniquegerm plasm for long-term work, in the short runthe prospects for increasing productivity through itsuse in the developing countries are often vastly over-rated in relation to the potential for improvementfrom environmental and husbandry changes. Geneticprogress can seldom result in increases in outputof more than 1 percent per year. Using modernmanagerial practices over a period of four to six years,on the other hand, progressive farmers in a numberof developing countries have achieved improvementssuch as increasing the crop of weaned calves from40-50 percent to 70-80 percent per year, raisingaverage weaning weights by 40 to 50 kilogrammes
172
and reducing the age of slaughter from 5 to21/2 years.
Progress of this nature has, in the main, been as-sociated with increased feed supplies, improved feedquality, and more efficient feed utilization. It en-compasses not only simple improvements in fencingand watering facilities on undeveloped rangelands,but also the provision of more sophisticated inputs(such as certified seeds and fertilizers) on intensive,rotationally grazed improved pastures. The value ofthese inputs is often underestimated, although bothtropical and temperate grasses have been shown tobe generally more efficient converters of solar energyinto harvestable material than are cultivated crops.Pennisetum putpureum even outperforms sugarcanein this respect, with over 80 tons of dry matter perhectare reported from Central America and theCaribbean. Yields of over 40 tons have been record-ed in a number of tropical countries from Panictanmaximum and Digitaria decumbens.
In practice, however, most intensive tropical grass-land production has been associated with controlled,rather than zero grazing. Nevertheless meat yieldsas high as 1 ton of meat per hectare per year havebeen recorded under grazing conditions on commer-cial farms. This level is many times that encounteredon most improved tropical pastures (and is well inexcess of the best reported yields from temperatezones) so that there is obviously a great deal of scopefor revolutionizing grassland farming in the wettropics. The future seems to hold considerable pos-sibilities for high-nitrogen zero-grazing systems forintensive beef or dairy production in irrigated orhigh-rainfall areas where price relationships makethe use of nitrogen fertilizer economic. In thoseareas where such highly intensive practices are noteconomic, there are good possibilities for the expandeduse of pasture legumes. An outstanding example ofsuccess with a tropical legume concerns the intro-duction of Townsville lucerne (Stylosanthes humilis),which, in conjun.ction with light phosphate dressings,has both raised carrying capacities and increasedliveweight gains per unit area in the spear grasscountry which covers large areas of subtropicalQueensland, Australia.
Cultivated fodder crops grown on irrigated landat present provide a very small part of the total feedintake of ruminan.ts in developing countries, and itis not uncommon to see intensive cereal productionside by side with primitive livestock husbandry onsmall farms in irrigated areas. For such areas thereis an urgent need to develop a "systems" approachcovering the farm as a whole, which clearly distin-guishes between operations such as dairying and fat-tening that may be economically feasible on irrigatedpastures and operations such as breeding beef cattlethat are not financially viable under such conditions.
For the time being, however, most of the feedintake in the arid zones of the world comes fromcrop residues and from rangelands. During periodicdroughts ort these lands, large numbers of stockfight for survival on a submaintenance ration andtheir productivity is very low. In fact, in spite ofimproved disease control, the development of stockwatering points, and the establishment of feed reservesand supplementary feeding (sometimes with food aid),animal production is actually declining in many suchareas as stock numbers have been built up so fastthat the natural vegetation has become overgrazed.The problem is associated with the unrestricted graz-ing traditionally practised by nomads and villagers,the dichotomy between farmers and graziers, an.dthe almost total lack of government organization tocope with it.
A fundamental solution for improving produc-tivity from such arid rangelands lies in limiting stocknumbers. Difficult though it may be to achieveimproved control of rangeland grazing, the cheap-ness of range feed and the vastness of this resourcemake it imperative that they are rationally exploited.A major constrain.t, however, is inadequate knowl-edge of the range feed resources, which must bemapped and evaluated in order to guide managementchanges.
Among the more promising activities that couldease the pressure on the range is the developmentof the feedlot fattening of ruminants. This could pro-vide the means and the incentive to get animals offthe range at an earlier age, and also to reduce thelosses associated with seasonal migrations. However,the practicality of such a measure is highly depen-dent on meat/feed-grain price ratios, and usuallyinvolves recognition that the higher quality meatproduced in this way will necessitate a premium price.Work on the feedlot fattening of cattle is showinginteresting results in Kenya and Malawi, and similarwork on sheep is under way in Iran and Syria. TheMalawi scheme is of particular interest in that itinvolves smallholders and relies heavily on the use ofmaize bran., one of the by-products referred to later.
Planning for improved rangeland utilization iscomplicated by land-tenure problems, since it is dif-ficult to attain a correct relationship between feedresources and livestock numbers on communally own-ed lands. Aside from the development of feedlots,an approach to which a number of African countrieshave recently been devoting some attention is theestablishment of cattle ranching enterprises. A par-ticular attraction is that the structure of large ranch-ing-type operations (whether private groups or com-munally owned) makes it easier for them to obtainaccess to credit for their development. In Africasuch ranches as are under consideration at presentoften appear to be public or semipublic enterprises
173
with little relationship to the current activities ofmost livestock owners. However, by the establish-ment of group, communal and cooperative types ofranching enterprises certain governmen.ts, particu-larly in east Africa, are attempting both to changethe structure of traditional rangeland utilization andto spread more widely the income created by newerfarming systems.
The ranch development work in Kenya is of par-ticular interest in that it involves a rationalizationof land use designed to maximize productivity. Thisis leading to a stratification of the beef industry aswell as changing the land-tenure structure on therange. The pattern of production beginning to emergeis of intensive fattening in feedlots on the betterlands, and the use of the less productive rangelandsfor rearing weaners. Such rationalization of ruminantproduction seems to have a promising potential inmany parts of the world. In west Africa, for example,the presence of the tsetse fly restricts the possibilitiesfor raising cattle in some of the areas of high grass-land potential but not for finishing them (with theaid of prophylactic drugs), whereas feed shortageslimit the finishing possibilities in the drier sub-Sahelianrearing areas.
Such stratification also offers the possibility ofrationalizing ruminant production under agrarianreform programmes. This is particularly importantin Latin America, where the breakup of latifundiacan lead to the creation of new farms without suf-ficient grazing resources to continue the traditionalpattern of both rearing and fattening on the samefarm.
In many parts of the Far East (except for areassuch as parts of West Pakistan, northeast Thailand,the dry zone of Ceylon and the island of Mindanaoin the Philippines) the prospects for stratification seemmore limited, since the primary role of the bovineduring the 1970s is likely to remain the provision ofenergy for agriculture. In addition to better feeding,a good deal could be done to increase the productivityand working efficiency of these animals by improve-ments in the design of animal-drawn equipment.There are, however, important cost and psychologicalbarriers which limit the speed at which such improvedequipment can be introduced. The situation will berendered more difficult by the increasing subdivi-sions of holdings likely to result from the continuedgrowth of the rural population. In the long run theonly solution seems to be a drastic programme toenlarge the effective size of operational units. Thiswould both increase the efficiency of use of workinganimals (which are currently often kept on holdingsof uneconomic size) and improve the opportunitiesfor mechanization.
So far little mention has been made of animaldisease, although its importance as a constraint on
production is well recognized. As described earlierin this chapter, encouraging progress in disease con-trol has been made in certain fields in the 1960s.Apart from continuing existing programmes, thereare two animal health problems which warrant muchmore attention in future. The first is foot-and-mouth disease, which prevents a number of potentialbeef exporters from gaining entry to the expandingmarkets of the high-income countries. In additionto the technical problems involved, effective controlof this disease is likely to be difficult unless someform of international understanding can be reachedto ensure that market access is not impeded oncesatisfactory health levels have been attained. Thisquestion is taken up again in the final section of thechapter.
The second animal health problem concerns theprogressive elimination of the tsetse fly, which coversvast areas of the African continent. Eliminationof the fly, although probably a long-term task, couldopen the way for a more rational land-use patternand facilitate the stratification of livestock produc-tion. This in turn, particularly in west Africa, couldprovide a model for a new land-tenure structureand open up new opportunities for increasing in-come and employment in areas where they arebadly needed.
A final factor of importance for the beef produc-tion and export policies of the developing countriesis the price of beef. This has been rising in interna-tional markets at about 6 percent per year duringthe 1960s. In many developing countries prices havebeen maintained as a matter of consumer price policybelow the world market price, and their low levelhas been insufficient to .provide the necessary incen-tive for additional investment in raising production.In these circumstances, if developing countries areto take advantage of the available export markets,they will have little alternative to allowing beef pricesin domestic markets to rise. Although data are notavailable on the price elasticity of demand for beefin developing countries, such evidence as there ison related products suggests that it is high. Effortsto raise beef production and exports with the helpof higher prices are thus likely to put beef out of thereach of all but the highest income groups in thesecountries.
Since pig and poultry production can be increasedmore rapidly and at lower cost than beef production,many developing countries may find it desirable tomake the deliberate policy decision of deriving alarger share of their expanding meat supplies fordomestic use from the pig and poultry sectors,while orienting their ruminant sector, particularlybeef, increasingly toward export markets. The ex-pansion of pig and poultry production, however, alsohas its problems.
174
Pigs and poultry
Since the highest conversion rates for grain utili-zation are obtained in pig and poultry production,and since these species also offer the best opportunityfor a rapid growth of production, IWP has proposedthat they should be given very heavy emphasis duringthe 19705.1' Certain countries have already achievedremarkable progress in pig and poultry productionin recent years. In Spain fresh poultry meat intakerose from 0.4 kilogramme per head per year (under3 percent of total meat consumption) in the mid-1950s to 8.1 kilogrammes (22 percent of meat intake)by 1967. In Lebanon poultry meat intake per headrose from 1 kilogramme per year in 1956 to 9 kilo-grammes in 1966, Or from 5 percent to 26 percentof the total. In Japan poultry meat productionincreased almost fortyfold between 1948 and 1968,an annual growth rate of nearly 20 percent, whileegg production grew thirtyfold.
These countries have been able to assist the develop-ment of their poultry industries by shopping for feedin the world market. This is an approach whichmost developing countries, suffering from shortagesof foreign exchange and often having significantcereal production potential of their own, are unlikelyto choose. As discussed earlier in this chapter, theprospect of cereal self-sufficiency and possible export-able surpluses, caused by the increasing adoptionof the high-yielding varieties, is bringing with it anumber of problems. Because of the anticipatedample supply situation, the prospects for the develop-ing countries to dispose of their cereal surpluses inthe world market are not very good. Given theneed for increasing amounts of livestock productsin most developing countries, an obvious alternativein many cases will be to divert excess productioncapacity into coarse grains, which are more suitablefor animal feed than are wheat and rice.
The feed supplies for pig and poultry productioncould be further expanded by making greater use ofthe large quantities of various agricultural by-productssuitable for animal feeding which are currentlywasted. Not only are there large quantities of prod-ucts such as rice bran and molasses, but betteruse could also be made of several less known by-products (for example citrus, olive and grape waste,and certain oilseed residues) whose value is oftenunderappreciated as a result of poor processing tech-niques and the inadequate compounding of rations.
" mg developed a theoretical model to indicate that the cerealtargets of the plan could provide enough coarse grains to raisepig and poultry production in the developing countries to thelevel required to satisfy the projected demand of the plan for allmeat. In order to do this, poultry production would need togrow at about 10 percent per year and pig production at 5 percentper year. By 1980 pig and poultry meat in all develouing coun-tries combined would comprise over 40 percent of meat intake,as compared with only 24 percent in 1962.
There are a number of problems and dangers inattempting a rapid expansio.n of the pig and poultryindustries, particularly when the availability of feed-stuffs rises rather suddenly as the result of cerealproduction surplus to human requirements. Thusthere will be little knowledge of the likely magnitudeof future year-to-year variations in the availabilityand price of feed grains, particularly as there is likelyto be a shortage of storage facilities which wouldenable buffer stocks to be maintained. Experiencesuggests that it may take a long time to regain theconfidence of farmers who have suffered economiclosses for such reasons. It is therefore importantthat livestock development programmes based onthe use of cereal surpluses emerging from homeproduction should be very carefully planned andclosely integrated with national cereal programmes.
A key factor determining whether or not an expand-ing pig and poultry sector can be built on such abasis will be the relationship between the prices forlivestock products and those for feed supplies. Thefrequent combination of price controls on livestockproducts and high support prices for cereals hitsthe pig and poultry sector particularly hard. Like-wise, in those parts of Africa and Latin Americawhere feed grains are not produced and ruminantproducts fetch a low price on the open market, it ishardly practical to advocate the promotion of pigsand poultry. The main determining factor willobviously be the price levels for ruminant products,since these vary from country to country much morethan the prices of pig and poultry meats producedunder modern systems.
Studies of price interrelationships between thecereal and livestock sectors are so far extremely limit-ed in developing countries. However, since feed costsrepresent about 70 percent of current costs in pigand poultry production, while in modern enterprisesthe proportion of cereal amounts to about 60 to 70percent of total feed costs, it may be estimated thata possible fall of 20 percent in farm prices of cerealscould result in an 8 to 10 percent reduction of cur-rent costs in the production of pig and poultry prod-ucts. The lowering of feed prices would clearlyaccelerate the substitution of pork and poultry prod-ucts for beef. rt would also be a factor of someimportance in determining national research priori-ties for increasing livestocic production -- for exam-ple in deciding on the relative emphasis to be givento genetic research on maize, as opposed to fertilizertrials on pasture with the object of increasing beefor milk production.
A disturbing feature of the likely development ofpoultry production is that successful poultry industrydevelopment, whether in the public or in the privatesector, is mainly taking place in large-scale unitspractising modern technology and subject to econo-
175
mies of scale. Indeed large poultry units (and alsovery large pig units), whether in developing or develop-ed countries, are essentially industrial and capital-intensive in nature. This tends to limit the prospectsfor a significant growth in egg production fromsmall units, except under subcontract and for on-farmconsumption. Nevertheless, small units can alsoprofit from using improved technology. However,the impact of very small units of 10 to 20 layingbirds is likely to be mainly on the nutrition of thefarm family rather than on the flow of urban eggsupplies. Larger units of 50 to 500 birds can havea greater impact in this respect, but only if bothfeed supplies and egg marketing are organized effi-ciently. For small broiler units the prospects aremore limited, since it seems essential to integrateproduction into a hatchery/processing complex. Pigproduction is less industrialized, and (provided thereare suitable marketing facilities) this sector may beexpected to channel more cash income directly tosmall production units, especially in the Far East.
Dairy development
The demand for milk and milk products seems tobe growing fairly rapidly in many developing coun-tries, especially in urban areas. Since milk pro-duction is labour-intensive and has a high growthpotential on small farms (unlike beef, pig and poultryproduction), it could help to alleviate problems ofrural unemployment and uneven income distribution.In ad.dition, meat from dairy cattle can meet animportant part of the domestic demand, permittingthe specialized beef farmer to concentrate on produc-ing higher quality stock for the more remunerativeurban and export markets.
However, the results achieved in dairy developmentprogrammes have often been disappointing. Thistype of development not only needs a complex inte-grated package of inputs but is also highly dependentupon the existence of adequate processing and dis-tribution systems. The most successful programmesseem to have been those in which early efforts haveconcentrated on strengthening the marketing systemin areas possessing a good production potential.Strong incentives and ease in marketing are necessaryto encourage the exploitation of this potential, whichnecessitates developing a system of farming involv-ing twice-daily milking seven days a week. Neverthe-less, unless these changes can be induced, a majorcapital asset of time small farmer will continue to beunderutilized and a major opportunity to reducerural underemployment and improve income distri-bution will remain untapped.
The difficulties of getting an indigenous milk in-dustry off the ground have in many countries neces-
sitated the establishment of milk plants with foreignassistance, producing mainly reconstituted milk fromimported raw materials. Unfortunately this approachmay ignore the need to develop domestic milk pro-duction simultaneously. Indeed, a basic problemfor many developing countries remains how to coor-dinate the growth of domestic milk production andof a dairy industry using irnported raw materialswith the growth of demand, in such a manner thatexcessive import requirements are not built up anddomestic production is not discouraged. This ismade particularly difficult by the fact that domes-tically produced milk may initially cost far morethan imported and reconstituted milk.
The need to combine good marketing arrangementswith the concentration of production in ecologicallysuited areas suggests that the future of the dairyindustry in developing countries lies not so much ina general expansion as in the establishment of care-fully planned production projects in the vicinity ofconsumption centres or around strategically sitedprocessing plants in areas particularly suited for milkproduction. This type of programme must havestrong govern.ment support in such fields as veterinaryservices, dairy husbandry extension, milk processingand the training of supporting technical staff. Atthe same time, it requires a change in the criteriahitherto frequently applied by the developed coun-tries in assisting the establishment of dairy plan.ts,so that these are seen as part of an effort to get viabledomestic industries off the ground. There are toomany examples of badly located and uneconomicdonated milk plants which operate only at partialcapacity, and this mainly by using butterfat andmilk powder provided by food aid.
Livestock on the small farm
Unfortunately, the livestock sector in general doesnot lend itself well to labour-intensive operations.Indeed, in the developed countries the labour inputper head of stock tends to be reduced on larger units,and there has been a strong tendency in recent yearsfor livestock farms to fall in number although produc-
Agricultural ex:c earnings
As was pointed out earlier, the agricultural exportearnings of the developing countries have grownslowly during the past decade or more, whethercompared with those of the developed countries orwith the growth of nonagricultural trade, as well asrelative to the expanding import needs of the develop-ing countries. As a result, the share of developing
176
tivity per unit has improved due to increases in bothfarm size and productivity per animal. While sucha change may be inevitable in a highly industrializedsociety where employment in agriculture is constantlydeclining, it is far from desirable in most developingcountries, where the majority of the farms are verysmall in size. By their very nature, these farms aremixed, often growing subsisten.ce and cash crops,and using animals that serve as suppliers of draught,milk and ultimately beef. Especially in Asia andparts of Latin America and Africa, these animalsaccount for the overwhelming majority of the livestockpopulation because they are so numerous and because,without livestock for draught, the farmer cannotgrow enough food to feed his family. Because ofthe complex interrelationship between animal andcrop production, the modernization of their produc-tion is an immensely complicated task.
The transition from the traditional pattern to amore modern type of fanning probably lies throughthe commen.cement of specialized production, imply-ing the development of an economy with a market-ing structure able to handle the disposal of theproducts of this type of agriculture. Where suchmarketing involves a large number of srnall unitsthere are clearly advantages in establishing some typeof cooperative approach. This has sometimes beensuccessfully achieved, as with milk in India andbeef in Hungary and Yugoslavia, although in manyother countries livestock cooperatives have failed.The conventional cooperative is, however, not theonly approach to this problem and there seems tobe a great deal of scope for the more flexible typeof integration represented by a contractual relation-ship. This has achieved considerable success in thepoultry sector of many countries and has also beensuccessfully introduced in the beef and veal sectorin Yugoslavia. Considering the particularly stronginterest that many developing countries have in agrar-ian reform, such an approach, with the establish-ment of small but industrialized ruminant produc-tion units, would seem to be worth consideringon a much wider scale especially for resettledfarms which may be too small to contain economicgrazing units.
countries in world agricultural trade has fallen steep-ly, as has the contribution of agricultural primaryexports to the total foreign exchange earnings of thedeveloping countries (see Table III-17 above).
The reasons for this sluggish performance werebriefly reviewed in an earlier part of the chapter.There are no signs that any major changes in the
factors fundamentally responsible for it are likely inthe near future, except for the improvement in thegrairt trade position of the developing countries thatshould result from the accelerated expansion of theirdomestic production. On the contrary, all the avail-able quantitative projections and outlook studiessuggest that, unless major changes are made in exist-ing policies, past trends are likely to continue oreven worsen. According to the FAO commodityprojections, the primary agricultural export earningsof developing countries are likely to grow up to1975 at a rate of 0.7 to 1.8 percent per year," com-pared with 1.7 percent in the decade of the 1960s.This is in strong contrast to the United Nationsprojections for the nonagricultural exports of thesecountries, which range between 8.2 and 9.2 percentper year, or roughly in line with the past trend (8.4percent per year)." At these rates, by 1980 agricul-tural primary products would account for no morethan about 20 percent of the total value of develop-ing countries' exports, compared with 46 percent in1960 and over 30 percent today though in manyindividual countries the share of agricultural exportswould remain very much higher. Moreover, asnoted above, even if foreign aid were to reach therecommended target, the developing countries wouldstill be left with a foreign exchange gap of up toU.S.$6 000 million per year by 1980.
The very approximate nature of these projections,which vary in coverage, methodology and assump-tions, must be stressed. Nevertheless, they give abroad indication of the magnitude of the challengefacing developing countries in their efforts to securethe foreign exchange necessary for their growth dur-ing the Second Development Decade. Essentially,they will need to aim at raising their total exportearnings, both agricultural and nonagricultural, wellbeyortd the projected rates.
That the developing, countries, taken together, havethe productive capacity to make available substan-tially larger exportable supplies of agricultural prod-ucts is clear from IWP, according to which the exportavailability of primary agricultural products in de-veloping countries could increase during the next 10years at a rate of 3.3 percent per year.45 Althoughthe two exercises are not strictly comparable, theexcess of this figure over the demand projection of0.7 to 1.8 percent already cited at least suggests thatgrowth at such a rate, would make a substantial con-
" FAO, Agricultural commodities: projections for 1975 and 1985.Rome 1967, Volume 1, p. 53. Since these figures refer to thenet import demand of high-income countries, larger increasesmight result from the expansion of trade between developing coun-tries, which is examined later. All demand projections cited aroat constant prices.
" United Nations Economic and Social Council. Preparationof guidelines and proposals for the Second United Nations Develop-ment Decade. (United Nations, New York. E/Ac.54/L.29/Rev.1June 1968)
" FAO, Provisional Indicative World Plan for Agricultural Develop-ment, Rome 1969, Volume 2, p. 626.
177
tribution toward closing the anticipated foreignexchange gap. Broadly, therefore, the problem fac-ing the international community is how to facilitatethe absorption by importing countries of agriculturalprimary products at a rate significantly in excess ofthat projected on the _basis of the continuation ofpresent policies.
Because of the very different nature of the factorsaffecting trade in various agricultural primary prod-ucts, it may help an orderly discussion of the variouspolicy problems if they are divided into the followingbroad areas:
Agricultural commodities produced in direct com-petition by both developed and developing coun-tries. These inelude mainly basic foodstuffs,such as wheat, coarse grain.s, rice, meat, fish,sugar, oilseeds and oils, some fruit, as well astobacco and pulp and paper.
Agricultural raw materials. The competition hereis not only with identical or close substitute com-modities produced in the developed countries(wool, cotton, hides and skins, some primaryforest products) but even more with syntheticsubstitutes for these products and for rubber.
Tropical products. In the markets for tropicalbeverages (cocoa, tea, coffee), spices, some fruitand some tropical timbers, there is little or nocompetition with producers in developed coun-tries, and the developing countries as a groupenjoy, in theory, a monopoly position.
Minor agricultural products. Little is knowneither statistically or analytically about the greatnumber of nonstaple primary exports, exceptthat as a group they are significant and that theirexports are probably expanding more rapidlythan most staple exports. Because such productstend to cater to specialized demand, or dependfor their success on export promotion and market-ing skill, many of the usual market constraintsdo not apply to them.
Trade between the developing countries themselves.This is a separate problem area. In terms oftotal potential market demand, it is no doubta fast rising sector, but the growth of trade ishampered by lack of trade infrastructure, foreignexchange shortages, and other reasons for pro-moting national self-sufficiency.
Processed agricultural products. Finally, thereare stron.g reasons for efforts to in.crease tradein processed agricultural products. The obsta-cles are considerable, however, and policy for-mulation is particularly difficult because of theabsence of basic economic intelligence.
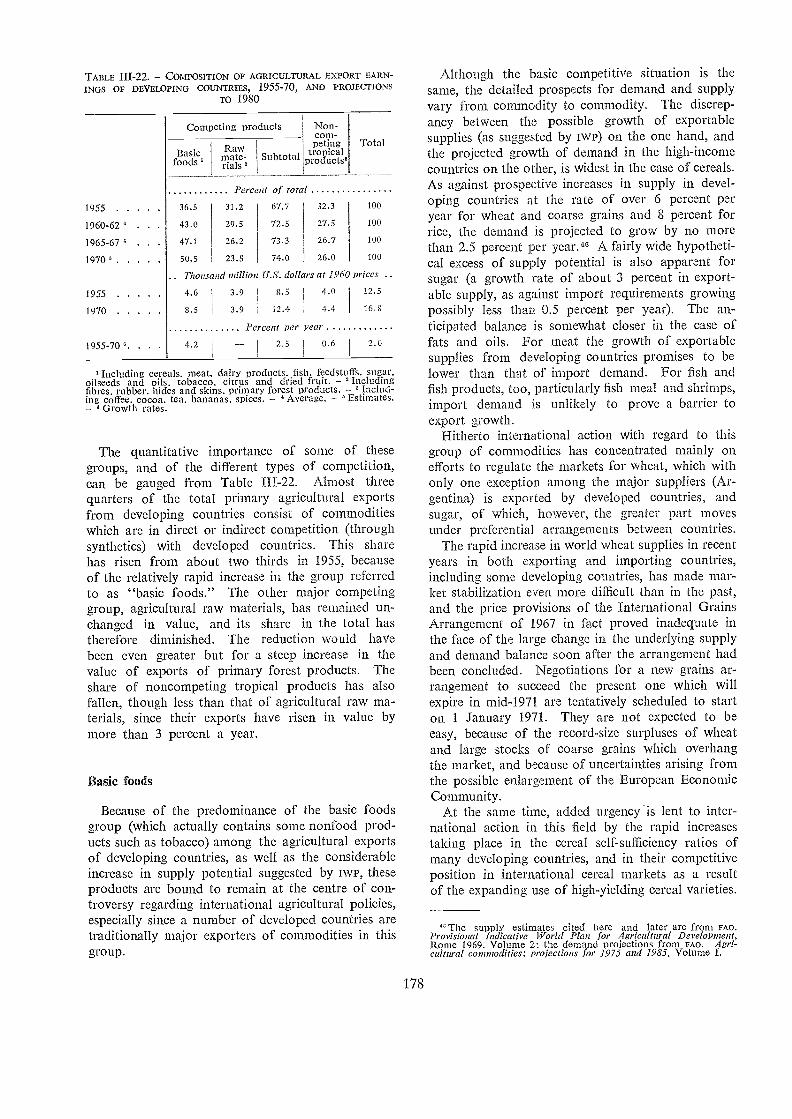
TABLE 1H-22. - COMPOSITION OF AGRICULTURAL EXPORT EARN-INGS OF DEVELOPING COUNTRIES, 1955-70, AND PROJECTIONS
1955
1960-62 4 .
1965-67 .
1970 2
1955
1970
1955-70 . .
Including cereals, meat. dairy products, fish, feedstuffs, sugar.oilseeds and oils, tobacco, citrus and dried fruit. - Includingfibres, rubber, hides and skins, primary forest products. - Includ-ing coffee, cocoa, tea, bananas, spices. - 'Average. - °Estimates.- ° Growth rates.
The quantitative importance of some of thesegroups, an.d of the different types of competition,can be gauged from Table III-22. Almost threequarters of the total primary agricultural exportsfrom developing countries consist of commoditieswhich are in direct or indirect competition (throughsynthetics) with developed countries. This sharehas risen from about two thirds in 1955, becauseof the relatively rapid increase in the group referredto as "basic foods." The other major competinggroup, agricultural raw materials, has remained un-changed in value, and its share in the total hastherefore diminished. The reduction would havebeen even greater but for a steep increase in thevalue of exports of primary forest products. Theshare of noncompeting tropical products has alsofallen, though less than that of agricultural raw ma-terials, since their exports have risen in value bymore than 3 percent a year.
Basic foods
Because of the predominance of the basic foodsgroup (which actually corttains some nonfood prod-ucts such as tobacco) among the agricultural exportsof developing countries, as well as the considerableincrease in supply potential suggested by twr, theseproducts are bound to remain at the centre of con-troversy regarding international agricultural policies,especially since a number of developed countries aretraditionally major exporters of commodities in thisgroup.
178
Although the basic competitive situation is thesame, the detailed prospects for demand and supplyvary from commodity to commodity. The discrep-ancy between the possible growth of exportablesupplies (as suggested by twr) on. the one hand, andthe projected growth of demand in the high-incomecountries on the other, is widest in the case of cereals.As against prospective increases in supply in devel-oping countries at the rate of over 6 percent peryear for wheat and coarse grains and 8 percertt forrice, the demand is projected to grow by no morethan 2.5 percent per year." A fairly wide hypotheti-cal excess of supply potential is also apparent forsugar (a growth rate of about 3 percent in export-able supply, as against import requirements growingpossibly less than 0.5 percent per year). The an-ticipated balance is somewhat closer in the case offats and oils. For meat the growth of exportablesupplies from developing countries promises to belower than that of import demand. For fish andfish products, too, particularly fish meal and shrimps,import demand is unlikely to p.rove a barrier toexport growth.
Hitherto international action with regard to thisgroup of commodities has concentrated mainly onefforts to regulate the markets for wheat, which withonly one exception among the major suppliers (Ar-gentina) is exported by developed countries, andsugar, of which, however, the greater part movesunder preferential arrangements between countries.
The rapid increase in world wheat supplies in recentyears in both exporting and importing countries,including some developing countries, has made mar-ket stabilization even more difficult than in the past,and the price provisions of the International GrainsArrangement of 1967 in fact proved inadequate inthe face of the large change in the underlying supplyand demand balance soon after the arrangement hadbeen concluded. Negotiations for a new grains ar-rangement to succeed the present one which willexpire in mid-1971 are tentatively scheduled to starton 1 January 1971. They are not expected to beeasy, because of the record-size surpluses of wheatand large stocks of coarse grains which overhangthe market, and because of uncertairtties arising fromthe possible enlargement of the European EconomicCommunity.
At the same time, ad.ded urgency is lertt to inter-national action in this field by the rapid increasestaking place in the cereal self-sufliciency ratios ofmany developing countries, and in their competitiveposition in intern.ational cereal markets as a resultof the expanding use of high-yielding cereal varieties.
" The supply estimates cited here and later are from FAO.Provisional indicative World Plan for Agricultural Development,Rome 1969, Volume 2; the demand projections from FAO, Agri-cultural commodities: projections for 1975 and 1985, Volume I.
TO 1980
Competing products Non-com-pcting
tropicalproducts'
TotalBasic
foods 'Raw
mate-rials 2
Subtotal
Percent of total
36.5 31.2 67.7 32.3 100
43.0 29.5 72.5 27.5 100
47.1 26.2 73.3 26.7 100
50.5 23.5 74.0 26.0 100
Thous nd minim. U.S. dollars at 1960 prices . .
4.6 3.9 8.5 4.0 12.5
8.5 3.9 12.4 4.4 16.8
Percent per year .
4.2 - I 2.5 I 0.6 I 2.0
This change is affecting not only wheat wheresome additional developing countries are likely toemerge as exporters but also rice, which is tra-ditionally exported mainly by developin.g countries.
Space does not permit a detailed examination ofthe various possible forms of international actionfor the basic foods that have been or are beingconsidered in different forums. In addition to com-modity arrangements, they include trade liberaliza-tion, compensatory payments for the benefit of de-veloping country exporters, internationally financedfood aid and buffer stock operations for fats and oils;the extension of bilateral arrangements for sugaralong the lines followed by the Un.ited Kingdom andthe United States; and a combination of measures toupgrade disease control and slaughterhouse hygienein developing countries with some form of guaranteedaccess to high-income markets for meat exports fromthe developing countries."
From the nature of the competition for this groupof commodities it follows, however, that most of themeasures for increasing the export earnings of thedeveloping countries would entail some curtailmentin the output or in the degree of self-sufficiency ofthe high-income countries. Experience with com-modity arrangements suggests, moreover, that pricearrangements without stockholding obligations and,ultimately, provisions for production control will notbe sufficient to guarantee remunerative and stableprices in the face of major changes in the internationalsupply and demand balance. In the final analysis,the longer term success of international action inthis area will therefore depend on the readiness ofthe countries concerned to make appropriate adjust-ments in production and trade at the national levels.
As for action by individual developing countries,this will depend essentially on whether they are ableto offer goods of acceptable quality at competitiveprices. The example of Thailand, which within ashort span of years has emerged as a major exporterof maize, mainly to Japan, indicates what can bedone, especially in expanding markets like those forcoarse grains. With the improving level of agricul-tural technology in developing countries, particularlyin cereal production, other countries may be ableto emulate this example, even though the overallcereal market situation is likely to remain highlycompetitive. A general lesson in this regard may bedrawn from the results of the study of the exportperformance of developing countries quoted earlier
"Possible forms of international action on grains are examinedin detail in a forthcoming FAO study: The stabilization of interna-tional trade in grains - an assessment of problems and possiblesolutions. International action on rice has been discussed at therecent sessions of the FAO Study Group on Rice (FAo documentsCCP:Rl 70/6, CCP 69/5 and CCP 70(7), and on oilseeds, oils and fatsin the FAO study group concerned with that group of con-unodities(FAo documents CCP:OF 68/5/1-5, CCP:OF 70/3 and 4, and CCP70/5),
179
in this chapter, namely that an individual country'sagricultural export performance is likely to dependjust as much on its general competitive ability as onthe tren.ds for its principal export commodities inthe world market.
Agricultural raw materials
With the significant exception of primary forestproducts, the demand for which is rising rapidlyand making an ever-increasing contribution to thedeveloping countries' export earnings, this is the agri-cultural commodity group which faces the most seriouscompetition in international markets. Overall, IWPsuggests that the export Etvailability of commodities inthis group might rise between now and 1980 at a rateof some 2.5 percertt per year, while the import demandis projected to shrink by 0.7 to 1.9 percent per year.
For one major commodity in this group, namelycotton, considerations of international adjustmentsomewhat akin to those discussed above might apply,though it should be noted that the United States,the principal high-income exporting country, alreadytends to have assumed the position of a " residualsupplier " in the world markets. More generally,however, the competitive picture is dominated bythe need for the natural products to compete. withman-rnade substitutes. Nor is this competition limitedto the markets in developed countries, since manydeveloping countries are also increasingly replacingimports of agricultural raw materials with domesti-cally produced or imported synthetics.
It would appear unrealistic to expect major na-tional or international action to restrict the develop-ment of technology at least beyond the UNCTADrecommendation that developed countries should notdeliberately subsidize the development of man-madesubstitutes which will replace imports of natural prod-ucts from developing countries. The hopes fordeveloping countries to slow down or reverse thefalling trend of earnings from this group of productswould therefore seem to lie in two main directions.
In the first place, attempts can be continued toreach the kind of informal arrangements regardingminimum prices and export quotas that have beenoperated under FAO auspices for hard fibres and forjute, kertaf and allied fibres. While these arrange-ments have contributed to market stability in recentyears, they remain subject to the basic dilemma ofhow to make them sufficiently binding to withstandmajor market shifts, while maintaining the flexibilitythat is one of their essential features.
Secondly, the producers of natural raw materialscan make continued efforts to improve the competi-tive position of their products through technologicalimprovements in cultivation and processing, so as to
'make the natural product cheaper and more suitablefor its industrial uses, and through more researchinto new end uses and into production and market-ing. Perhaps the best example of the success ofsuch policies is natural rubber, the output of whichhas con.tinued to expand steadily despite continuedchallenge by synthetic substitutes. The main ele-ment here has been the replanting of large areas withhigh-yielding clonal varieties, but an important con-tribution has also been made by research which hasmade it possible to develop processed forms of nat-ural rubber more directly competitive with syntheticsin specific end uses. Much progress has also beenmade in the treatment of cotton and wool to givethem some of the characteristics which originallygave advantages to synthetic fibres." That the im-portance of such action is being increasingly recogniz-ed is suggested by the decision of governments partici-pating in the two informal FAO arrangements justmentioned to request UNDP assistance for feasibilitystudies on the establishment of international researchinstitutes for the two groups of fibres.
Processed agricultural products
Perhaps most important of all, the developing coun-tries must be enabled to raise continuously the degreeof processing at which their products whetheragricultural raw materials or other commoditiesare exported. This will not only enable them toobtain a greater part of the value of the final prod-uct, but will also make a significant contributionto their industrialization. It is of course alreadytaking place and, to the extent that the stagnant pasttrend and anticipated reduction in raw materialexports reflect a shift to exports of processed andmanufactured goods, it gives a misleading picture ofthe true economic trend. With aggressive market-ing techniques and good end-use research, it shouldbe possible to accelerate this change, and for anincreasing number of developing countries to produceprocessed and manufactured goods that closely matchthe sophisticated and varied demands of the developedcountries that are the major markets. The recentmajor successes in this field of some Far Easterncountries, such as Hong Kong and the Republic ofKorea, and the establishment of forest products in-dustries of the more advanced type in a number ofcountries, bear eloquent testimony to the potential,even in the face of often heavy protection in thehigh-income countries.
For a widespread and rapid change in this regard,however, it is essential that importing countries lower
" An example of successful market promotion is the use ofthe Woolmark to differentiate wool from its lower-priced syntheticcompetitors.
180
the barriers which most of them still maintain toprotect their own frequently antiquated and low-productivity industries. Hitherto, progress in thisarea has not been very encouraging. Even. the Ar-rangement Regarding International Trade in CottonTextiles, negotiated under the General Agreement onTariffs and Trade (GATT) and possibly about to beextended, while conceding the developing countriesan agreed share of the market growth, is frequentlycriticized for the slowness of the increase in importsit permits, relative to the growth of the manufactur-ing and export capacity of the developing countries.Recent progress toward the granting of generalizedpreferences by developed countries for imports fromdeveloping countries is an encouraging sign in thisarea, though the real chances for rapid progress stillremain uncertain.
To speed up the process two national measuresmay be worth con.sideration. For one thing, a closerexamination in developed countries of the costs andbenefits of a more deliberate policy of industrialadjustment, away from areas where developing coun-tries are becoming relatively more competitive intomore modern, internationally oriented and high pro-ductivity fields, might reveal that in many areas theystand to gain as regards both foreign exchange andnational income, and that most of the costs wouldbe purely temporary budgetary outlays for facilitat-ing the adjustments required.
Developing countries themselve.s, on the otherhand, might find it opportune to take a still more ag-gressive marketing approach, both singly and jointly,including the mounting of export promotion cam-paigns, publicity campaigns to inform the consumersin high-income countries of the benefits which wouldaccrue to them from the reduction of trade barriers,and the financing or preparation and disseminationof studies of the extent and nature of adjustmentsthat would be required in the developed countries."It would also appear worth examining closely towhat extent it might be possible to find a confluen.ceof interests in this area between developing countryproducers and governments on the one hand andlarge multinational corporations or national distri-bution chains on the other.
Tropical beverages
The growth of export demand for tropical bever-ages is restricted by the already high levels of percaput consumption of many of them in a numberof countries, the large role of habit in determiningthe level of consumption, and the slow population
This type of activity would help developing countries to boosttheir exports of primary as well as processed agricultural productsto the developed countries.
growth in the high-income countries. Overall exportdemand is projected to grow in the 1970s by onlysome 2 to 2.3 percent per year. Given, however,the virtual monopoly position of the developing coun-tries as a group as suppliers of these commodities,and the low price elasticity of demand rela.tive to theimport price of tea and especially coffee (but notcocoa), in theory it should be possible for the develop-ing countries to bring about an organization of themarkets for these products in such a way as to maxi-mize their export earnings.
That this is much more difficult in practice thanin theory is amply demonstrated by the recent historyof commodity arrangements in this field. Only forcoffee has it been possible to negotiate and imple-ment an international agreement. The InternationalCoffee Agreement has not only been relatively suc-cessful in maintaining prices at the agreed level, buthas in many ways (such as control of imports fromnonmember countries and the planning of productionin exporting member countries) gone much furthertoward genuine market control 1:han any previousinternational commodity agreement. Even this agree-ment, however, carne under great strain in 1969/70when frost damage to the Brazilian crop caused pricesto rise even after the maximum upward adjustmentsin export quotas liad been made.
The principal reasons for the difficulty in arrivingat agreements for such commodities, despite the ap-parent monopoly position of exporters, would seemto be three. First of all, the widely varying costs ofproduction among exporting countries and the naturaltendency for the lower cost producers to expand theirshare of the market, combined with governmentencouragement of smallholder production on socialrather than economic grounds, constitute built-infactors tending to push total supply beyond the marketdemand. They also make it difficult to agree onthe distribution of export quotas among participants,and on a procedure for periodic quota adjustmentsthat satisfies both the older and the newer exporters.A long-term remedy for this problem could be adetermined effort by the higher cost producers eitherto make their output more efficient, or to find alterna-tive uses for the land and labour now engaged inthe industry, especially in the marginally productiveareas. Neither of these alternatives will be easy,because of the congested state of world markets formost products and the limited alternative uses forthe freed resources. However, the fact that interna-tional financial assistance may be available for suchdiversification, as well as for buffer stock operationsthat may be required as a part of a commodity agree-ment, should make them somewhat easier.
Secondly, recent experience with regard to cocoasuggests that the exporting countries may in certaininstances be tempted to take an excessively short-
181
term view of the need for commodity arrangements,with their interest in reaching an agreement fluctuat-ing in inverse proportion to the current and short-term prospective world market prices. Thoughperhaps understandable, vacillation of this naturetends to undermine the long-term confidence of thepotential importing country participants in the seri-ousness of the exporting countries' interest in anagreement.
This is important because the participation of im-porting countries is needed for the discipline essentialto the successful operation of a commodity agree-ment. Clearly, the nonparticipation of importerswould place under serious strain the discipline ofexporting countries agreeing to join in a monopolisticarrangement. Even when virtually all the exportingcountries are participants, as in the InternationalCoffee Agreement, it has proved necessary to enlistthe importing countries to police the arrangementby the operation of a " stamp " system. But thefact that the participation of importing countries isthus required automatically weakens the bargainingposition of the exporting countries. The better thediscipline among the exporters, therefore, the bettertheir bargaining position as regards prices and otherelements of an agreement.
Finally, whereas importing countries participatingin or negotiating commodity arrangements tend tocount only the additional foreign exchange cost andother immediate consequences that would resultfrom a higher and more stable price, a morerealistic assessment of the impact of such arrange-ments should also take account of the effect of thespending of the additional export earnings by theexporting countries themselves, which in the presentworld situation will soon result in larger exportsfrom the high-income countries.
Minor agricultural exports
Most of the above discussion has dealt with speci-fied major agricultural exports, broadly groupedaccording to the nature of the competition they facein world markets. rn addition to these major prod-ucts there is a substantial trade in a wide varietyof minor products, which has never been systemati-cally studied, but which appears to be expandingrapidly." A comparison between the data shownin Table 111-22 and the total value of agriculturalexports (including forestry and fisheries) from devel-oping countries suggests that minor exports whichare not individually covered by FAO statistics accountfor about 15 percent of the total. The standard
"A study of the trade in these products is about to be under-taken by FAO.
coverage of FAO'S commodity analysis is even nar-rower, leaving some $4 500 -million worth of minorexports unstudied.51
The problem is not confined to agricultural trade,but is of a more general nature. According to onerecent study,52 in 1960-63 minor 63 exports bothagricultural and nonagricultural accounted for 34percent of the total exports of 29 developing coun-tries. They were, moreover, responsible for most ofthe export growth of these countries between 1950-53and 1960-63. About two thirds of the minor exportswere estimated to consist of miscellaneous agriculturalitems such as mushrooms from China (Taiwan) ortomatoes from Mexico.51
Trade between developing countries
Compared to their trade with developed countries,the trade in agricultural products among develop-ing countries remains small. Up-to-date statisticaldata on these trade flows are not available, but datafor 1961-63 calculated by FAO estimated the shareat about 17 percent of the total agricultural trade ofthe developing countries.
There are reasons to believe that this trade offersimportant opportunities for future growth. First, itis in the developing countries that the most rapidgrowth of the total demand for agricultural products
" Estimate based on FAO commodity review 1968, p. 5, supple-mented by fish and foresr exports.
" B.A. De Vries, The ex-port experience of developing countries.World Bank Occasional Papers, No. 3, 1967, p. 18.
" Minor to the country concerned." B.A. De Vries, op. cit. p. 26.
It is clear from the data quoted earlier that themajority of developing countries will unavoidablyhave an increasing agricultural labour force duringthe Second Development Decade and for some timebeyond that. This necessitates close attention tothe employment-creating effects of the policies andmeasures chosen for the agricultural sector. Peopleare the main productive resource which is at a lowlevel of utilization in most developing countries, andlow levels of productivity and per caput income area direct reflection of the underutilization or misuseof this major resource.
Income distribution will also closely follow thedistribution of opportunities for employment in pro-ductive work. Given the great importance of a wideincome distribution for thc creation of internal de-mand to act as a motor for development, measures to
182
is to be expected in future and, although the greaterpart of this increase will no doubt be met by do-mestic production, some could well be met by im-ports. Given the small share of imports in thetotal supply of agricultural products in time develop-ing countries, even small increases in the part ofdemand met through imports would mean substan-tial expansion in the value of the intratrade. Secondly,where regional cooperation and integration amongdeveloping countries have been developed furthest,as in particular among the countries of the CentralAmerican Common Market, the exchange of agri-cultural products has accelerated rapidly.
Reasons for the hitherto limited extent and ap-parently slow growth of this trade are fairly clear, andprovide guidance for national and international actionto accelerate its growth. A principal factor is thetraditional direction and composition of the tradebetween the developing former colonies and thedeveloped metropolitan countries, which have dic-tated the form of the infrastructure so necessary fortrade shipping and railway lines, trading con-tacts, payments arrangements, market intelligence,etc. This would seem to apply particularly to timegrowth of trade between different developing regions.
As for trade within developing regions, while ittoo can be improved in this way, a more potentmeasure is likely to be the promotion of regionalin.tegration arrangements. The possibilities they offerfor increased trade between participating countriesare demonstrated by the experience of the CentralAmerican Common Market countries whose totalintratrade rose (admittedly from a small base) seven-fold between 1961 and 1968.
improve the distribution of employment opportunitiesare as important as measures for their creation.
Recent very rapid rates of urban growth have giventhe impression that this will help to relieve the pres-sure on rural employment. In reality, much ofthe swelling of the urban population has come throughthe influx of rural people who remain just as unem-ployed or underemployed as they were in the ruralareas. Thus it is estimated that in certain LatinAmerican cities the number of unemployed or under-employed has been growing considerably faster thanthe total urban population. This volatile and easilyvisible problem group created by a premature ruralexodus is drawing increasing attention to time needto ensure sufficient employment opportunities andadequate levels of income and welfare to providethe incentive for people to remain in rural areas.
Ru aiT21
Difficulties in increasing agricultural employment
Especially in those countries where the growthof the total labour force is rapid and the share of theagricultural sector is large, the need to pursue allagricultural development policy oriented to employ-ment creation is imperative. In overall terms, thedeveloping world will have to increase agricultural.employment during the Second Development De-cade by about 13 percent, equal to an addition of48 million jobs to the 1970 level. If past trendsprevail, nonagricultural employment will increase dur-ing this period by 40 percent, or 98 million jobs. Thecrux of the problem is that the expansion in agricul-tural employment has to take place at the same timeas this large expansion in nonagricultural employment,so that the two sectors compete for political supportand resources. In addition to this competition,the growth of agricultural employment is hamperedby a number of other factors.
The eventual solution to the agricultural employ-ment problem is to transform the structure of theeconomy and thereby reduce the share of the agri-cultural sector in total employment. This, however,requires large investments in the nonagricultural sec-tors, where the average cost of creating new jobsis relatively high, especially in the modem segmentof industry which spearheads the increase in produc-tivity. This has tended to starve agriculture of re-sources, especially of investment funds, in the hopethat the nature of the agricultural production processwould permit both the absorption of an increasinglabour force and an increase in production withoutsubstantial use of such resources as domestic sav-ings, foreign exchange and skilled manpower, ofwhich the economy is in short supply.
In those countries where the cultivated area couldbe substantially expanded with traditional technol-ogy, this involved no great technical difficulty. Thenatural increase in the rural population could beaccommodated by expansion of the cultivated area,without the need to raise yields through the use ofpurchased inputs or to turn to methods of extendingthe area which required more than hand tools andfire for bush clearing.
However, in those countries where land and waterresources are already utilized to a high degree, thishas become a much more difficult problem. Therehas been a rapid lowering of the land/man ratio,not only for the population as a whole but also forthe agricultural population." The resulting pressuresfor intensification call in turn for much higher levelsof investments and inputs, which often need to comein a form which has high opportunity costs. Modern
"IWP findings for the Far East indicate that between 1950 and1965 arable land per person declined from 0.36 to 0.30 hectare,and that even with the large land development proposals in IWPthe ratio would drop to 0.19 hectare per person by 1985.
183
irrigation schemes, fertilizers, plant protection, agri-cultural research and administration all consumeresources in direct competition with the other sec-tors of the economy.
In other situations the expansion of the cultivatedarea is not limited by shortages of new land andwater resources, but by antiquated and unsuitableinstitutional structures, including land-tenure con-ditions. These not only hamper the developmentof new agricultural land, but they also often keepland under extensive uses with very low employmentpotential, such as extensive grazing on land whichcould economically support intensive crop production.
Just as in industrial production, much of the newtechnology for agriculture is labour saving, or atbest neutral with respect to employment creation.On the one hand, improved technology increaseslabour requirements per hectare because of the ad-ditional activities to be performed (such as fertilizerapplication) and because of multiple cropping. Onthe other hand, the tremendous yield increases tendto reduce labour requirements per unit of output.Thus the net effect on employment depends on wheth-er the relative increase in total output outweighsthe relative fall in lEtbour requirements per unit ofoutput.
The effects of mechanization may be complex.Mechanization is often cited as the main technologicaldevelopment which tends to replace labour. Whilethis is true in many instances, in others, as discussedlater, carefully applied mechanization can createadditional employment instead of reducing it.
However, even if all the technical and institutionalbarriers can be overcome, the expansion of agricul-tural employment is restricted by the ceiling whicheffective demand sets for agricultural production.Recent work on IWP confirms that at the aggregatelevel the long-term growth of agricultural productionin the developing countries suffers from a definitedemand ceiling. The analysis also shows that therecent, often -unsatisfactory, growth rates which haveled in many countries to increasing unemployment(both in agriculture and in the rest of the economy)and to increasing imports of foodstuffs, are onlyabout 0.5 to 1 percent below the ceiling on growthrates iinposed over the longer run by demand con-straints. Income redistribution to the low-incomegroups is one of the main ways of lifting the demandceiling, and the close interrelationships of such poli-cies with employment policies will be discussed later.
Another difficulty is that much has still to be learn-ed about the exact nature of the rural employmentproblem before answers can be found. Many pastfailures to come to grips with the problem stem partlyfrom an insufficient understanding of the complexof relationships which need to be accommodatedor altered to achieve success. Not least is the present
inability even to measure meaningfully the phenom-enon which it is desired to change. Although themagnitude of the task can easily be shown in approx-imate fashion, and is increasingly accepted as oneof the important facets of development, definitionsof employment, unemployment, underemploymentand labour force are still hazy. This makes it diffi-cult to use existing information in an.alysing theproblem. Other areas where better information is ur-gently required include elasticities of labour supplyand demand to wage changes, the factors influencinglabour mobility, and the labour-saving or creatingeffects of technological changes and of differentagricultural policies.
Labour-intensive agricultural production techniques
The difficulty and the magnitude of the problem aresuch that all possible avenues must obviously beexplored for its solution. However, the main focusof this effort must be on influencing the amountof labour used in crop production, since this is thesource of the overwhelming bulk of agriculturalemployment. The case study of six Asian countriesmade for IWP showed that crop production generatedas much as 81 percent of total GDP from agriculturein 1962.
Two major lines of action need to be followed inattempting to maximize employmen.t in crop produc-tion. One may be termed a defensive action, focusedon preventing less labour-intensive technologies fromsubstituting other inputs for labour in the productionprocess. The other consists in actually intensifyinglabour use through modern agricultural technology.
The main defensive actions relate to mechanization.The employment estimates in the Iva) case study al-ready include an estimate of the substitution of labourthrough mechanization. This would raise the sub-stituted portion of total labour requirements from0.9 percent in 1962 (when mechanization was negli-gible in the countries studied, with the exception ofCeylon and Malaysia) to 5.3 percent in 1985. Whilethis is a sixfold increase in mechanization, it stillrepresents only a minute proportion of the total la-bour requirements for crop production.
The crucial question is whether the needed agricul-tural production could be obtained without the sub-stitution of labour by machines. To answer it there-fore involves specifying the functions which mecha-nization is expected to perform. In some operationsthe substitution between human labour, draughtanimals and machines is only a question of cost.If high shadow prices are used for foreign exchange,then this comparison will often favour an agricul-ture powered by men and draught animals. How-ever, if the timeliness and quality of naany operations,
184
especially in soil preparation and seeding, are consider-ed, then it appears that machines have importantadvantages which are often crucial in achieving thehigh production targets which most developingcountries need to meet. In arcas of low and unre-liable rainfall, the timeliness and speed of operationscan determine success or failure in crop production.The whole question of power inputs becomes evenmore vital when multiple cropping is introduced,with only a short time available between the harvestof one crop and preparations for the next. Bymakin.g possible in this way the intensification ofproduction, mechanization can have a very positiveeffect on labour requirements. Moreover, in manyparts of the developing world, especially whereclimate or shortage of feed does not permit thekeeping of draught animals, mechanization canstrongly affect the total area harvested by reducingfallows and enlarging the arable area.
This already takes the argument into the consider-ation of those production techniques which have apositive effect on labour use. In the developed coun-tries modern agriculture is nearly always identifiedwith a technology which aims predominantly at thesubstitution of capital (including new technology)for labour, thus raising the productivity of agriculturallabour and bringing it closer to that in the othersectors of the economy. in developing countriesthe role of modern technology should more oftenbe to make possible the more intensive use of labourand at the same time raise its productivity, althoughadmittedly not at the rate that could be achievedthrough labour-saving technology.
In this respect, a basic issue is whether the high-yielding varieties of cereals have a positive or negativeinfluence on labour use. Those who take the viewthat the negative sirle is stronger argue that, byenabling farmers in the irrigated areas with better soilsto supply the market to a degree which will depressprices, the high-yielding varieties will in fact penalizefaimers in marginal areas where land and labourrepresent an overwhelming share of total inputs. Thisin turn will reduce total labour use in the productionof the same volume of product. It is also claimedthat, by providing higher incomes for the inno-vating group, the high-yielding varieties create incen-tives for them to mechanize, and will thus depressthe demand for labour and increase rural inequalities.
The opposite view holds that the greatly increasingdemand for agricultural products will require the fullproductive potential both of areas under high-yield-ing varieties and of other areas in order to reachproduction targets. This argument gains furthersupport from the opportunities opened up by risingincomes for the production of other food and feedcrops to satisfy the growing demand for a higherquality and more diversified diet.
It is also necessary to remember that, because ofthe highly labour-intensive nature of harvesting andthreshing operations in nearly all parts of the develop-ing world (especially in Asia), the demand for labourwill be increased by greater yields. Higher labourrequirements also arise from improved operationssuch as line sowing or planting, and better cropcare. The new varieties produce their greatly su-perior yields only if supported by an optimal soiland water environment, but this very same environ-ment is also optimal for weed growth, which in turnwill require a greatly increased labour input for itscontrol.
Very little exact quantitative information is avail-able at present on the differences between labourrequirements for traditional technologies and thoseusing high-yielding varieties. In. the IWP study somevery tentative estimates were made for the relationbetween yield levels and labour requirements. Theelasticity of labour to yields averaged 0.37, rangingfrom 0.25 to 0.60 for the different crops, dependingmainly on the weight of harvest labour in total labourrequirements. The average additional labour result-ing from the proposed higher yields came to 30labour days per harvested hectare, representing a40 percent increase over the 76 labour days/hectareaverage for 1962. This rate, however, also includedincreases in labour use arising out of the changesproposed in the cropping pattern, which for 1985contained a smaller proportion of those cereals withlow labour requirements.
As regards livestock the employment implicationsof modernized production are rather gloomy, withthe main exception of the dairy sector, the futuregrowth of which, however, suffers from many lim-itations, as discussed earlier in the chapter. Thecommercialized forms of livestock production, suchas cattle ranching and modern large-scale pig, poultryand egg production, use little labour, although thereis some scope for the use of labour-intensive practicessuch as manual feeding and egg collection. In ad-dition, the pig and poultry enterprises may be locat-ed away from rural areas, while because of theirlarge scale they have little beneficial income distri-bution effects. Small-scale livestock production, on theother hand, when carried out as an integral part ofthe general farming operations, yields a better la-bour distribution both seasonally and between mem-bers of the family and is the source of additional in-come, but it fails to create sufficient employmentopportunities to retain additional people in the agri-cultural sector.
Employment in forest production, especially inman-made forests, can create substantial employ-ment potential in forest areas, the more so if theuse of machinery is lirnited to those operations whereits efficiency is greatly superior to human _labour.
185
An important side-effect of forestry in employmentcreation is its support for pioneer settlement in forest-ed areas, through the provision of a flow of incomein the early stages of settlement before returns areavailable from crop or livestock production.
Man.-made forests, whether established for soiland water conservation or for production, or forboth purposes, can play an important supplementaryrole in the provision of employment. Often theyoffer work in the off-season periods of crop produc-tion, requiring labour not only in their establish-ment but also in their care and harvesting.
Present labour intensities in logging operations intropical high forests cover an extremely wide range,with examples ranging from fully manual patternsto full mechanization, and with the manpower needsof the latter possibly ranging from SOO to 1 000 man-,days per 1 000 cubic metres logged volume to aquarter of this. There are some examples of mis-placed emphasis on efficiency of operations, whenfrom the point of view of the national economy trueefficiency might consist in a better use of resourcesof low opportunity cost, such as labour.
While the effect of technological change on employ-ment in the fishing industry is similar to that in crop,livestock and forest production, fisheries offer thepossibility of a rapid jump from a simple, peasant-type canoe fishery to a modern industrialized deep-seafishery. The fisheries of a number of developingcountries now exhibit this sharp dichotomy, althoughseveral countries are following the more gradualpolicy used in developing the Japanese fishing in-dustry. The effects on employment, however, areunlikely in most cases to be significant, since thecanoe fishery and the industrial deep-sea fishery repre-sent different enterprises relying on different resourcebases. Although on the market there may be somecompetition between these two sectors, the rapidlygrowin.g demand for fish gives ample opportunity fora dynamic deep-sea fishery development without en-croaching on the markets of the traditional sector,or reducing the total labour employed in fishing.
But the most dynamic employment-creating sectorin the fishery industry is fish culture, whether in in-land, brackish or marine waters. In these enterprisesproduction operations are an important labour-intensive addition to the traditional harvesting oper-ations of fisheries. The cultivation of molluscsin marine waters is particularly labour-intensive andis already well established in a number of countries.Given the markets, these activities are capable ofexpansion on a significant scale. ft should be re-membered, however, that the livestock, forestry andfishery sectors are extremely small as compared withcrop production.
The most important question remaining is whatmethods to use to influence the use of modern pro-
duction technology so that, while contributing toincreased production, it will not replace labour.Taxation is a widely used method, especially throughduties on imported materials. Import duty policyis generally influenced by the need to protect do-mestic industries, to minimize the costs of productionfor export crops, and to save foreign exchange.Employment should be added as an importan.t consid-eration to this list of policy criteria. A special prob-lem arises, however, when there is too little infor-mation on the employment effects of the new technol-ogy, and the choice is made on a purely politicalbasis under the influence of pressure groups. Equal-ly, there is too little information on the effects onlabour supply and demand of changes in wage ratesand in the prices of other factors of production.
Legislation for the discouragement or prohibitionof labour-replacing technology has been attemptedin a number of situations, but the results have usuallybeen disappointing. In most countries the mostimportant need is probably to avoid factor pricedistortion, whereby an overvalued exchange ratehas stimulated technologies based on imported capitalequipment.
Direct incentives may be the most useful policytool for achieving a labour-intensive pattern of agri-cultural production. These may take the form ofsubsidizing those modern inputs and investmentswhich have a positive labour-creating effect, forexample fertilizers, plant protection, and land impro-vements such as irrigation, drainage and flood control.The question is complex for there is even evidencefrom some areas that fertilizers, for example, mayactually be substituted for labour. Especially wherethe demand for labour is depressed by minimumwage legislation, there may even be a need for adirect subsidy on the employment of labour.
In addition to direct subsidies, the necessary mea-sures may also include the building up of institutionswhich will help to bring about the wider use of labour-intensive production. processes. Such institutionsare even more important in achieving any substantialincreases in the employment opportunities in ruralareas through public works programmes or throughrural industrialization.
Nonagricultural employment opportunitiesin rural areas
A widely advocated avenue for reducing ruralunemployment and underemployment is to provideopportunities for nonagricultural jobs in rural areas,either part-time or full-time. Part-time farming isalready widespread in developed countries and isbecoming important in a number of developingones. It is likely to become increasingly the pattern
186
in developing countries, especially where there is
heavy population pressure, as it enables familieswith subsistence-size holdings to enjoy more thansubsistence levels of living.
Many hopes have been raised concerning non-agricultural employment in rural arcas, and manyfailures have attested to the difficulty of this approach.The major means for creating these jobs are publicworks, rural industrialization., and rural services.Many of them, although strictly nonagricultural,are very closely allied to agricultural production.
Public works programmes have already been usedfor a long time in attempting to relieve ruralunemployment and low incomes. The famine reliefwork programmes of India are early examples, andmany of the present food-aid supported projectsare in this field. There are some well-known success-ful examples, which prompt one to ask why theyhave not grown faster, and what are the factors whichlimit them."
The most fundamental difficulty is the competitionwith other development projects for certain re-sources. Although with careful planning this competi-tion can be lessened, it cannot be fully eliminated.It concerns not only financial resources and adminis-trative capacity, but also voluntary effort.
The difficulties encountered in food-aid assistedprojects include problems of strain on the adminis-trative and food distribution systems, which showthemselves most frequently in delays, losses, andincreased costs. Another problem is the generaltendency of rural people to prefer cash wages tofood, an.d the increasing proportion of wages pro-vided in food-for-worlc projects attests to the widerrealization of this fact. The composition or qualityof the food available may not be attractive or accept-able to the workers. These difficulties are, however,to some extent outweighed by the advantages, inparticular the ready availability of food aid evenwhen other types of aid are declining.
The competition for administrative capacity is acomplex issue, and has given r.ise to controversialviews. Some maintain that food-for-worlc projectsneed only a minimum administrative resource be-cause they are simple and can be kept close to thelocal community level where solutions are found inan informal manner." This view ignores the factthat there may be a very large number of smallprojects, whose administrative needs will increasebecause of geographical dispersal and because of therelatively difficult management problerns when manysmall projects are involved. These problems are
'Even one of the most successful examples of this kind of pro-gramme, the Moroccan Promotion nationale, has provided lessthan 5 percent of the total agricultural employment, althoughin some arcas its impact was sufficient to halve the unemploymentrates in agriculture.
G. Ardant, A plan for full employment. International LabourReview. 88 (1), July 1963.
often compounded by the assumption that the impo-sition of this extra workload will not impair the per-formance of the administrative machinery in itsexisting functions, or in functions with a higherdevelopment priority than labour-intensive projects.
A further resource competed for is the willingnessof people to work for the common good either volun-tarily or at wages below market rates. This will-ingness has definite limits, and in most countriesso many calls have been made on it, often formisplaced goals or projects, that rural people areboth weary and wary of exhortations to further volun-tary effort. On the other hand, where such efforthas brought visible returns this may often reinforcepeople's willingness to make additional voluntaryefforts.
One problem is the difficulty of finding projectswhich are suitable vehicles for the creation of employ-ment and at the same time conforin to other develop-ment criteria, especially with respect to economicreturns. In addition to being economically attrac-tive, these projects need to have features which makethe people in the local community feel identifiedwith their goals.
High on the list of suitable projects are those con-cerned with the building of infrastructures, especiallyroads, irrigation, land improvement, and soil andwater conservation. The labour component in thistype of project is high, the distribution of benefitsis wide, and the results are visible and easy to under-stand. It is also importan.t that they increase em-ployment not so much through the labour requiredfor their implementation as through the demand forlabour in the greatly intensified agriculture theymake possible. In India, for example, the buildingof 1 hectare of irrigation ca.pacity may create demandfor 800 days of labour; the intensification permittedby the irrigation will raise labour requirements tosuch an extent that in approximately 10 years anequivalent number of additional labour days will berequired on this area for agricultural productionand for the upkeep and management of the irrigationsystem.58
The factors limiting the widespread use of publicworks programmes also include the lack of suitableinstitutions. Undoubtedly the public works typeof investment is economically attractive only if thefacilities built are efficiently utilized and kept up.This requires sound and widely accepted institutions
" The following assumptions were made for this calculation:construction costs per hectare, $1 000. of which $400 for labourat the rate of 50 cents per day for a total of 800 days; preirrigationlabour requirements 35 days per hectare with a cropping intensitYof 95 percent and total annual labour requirements 32 days/hectare;under irrigation labour use per cropped hectare to rise to 60 daysand cropping intensity to 150 percent, with a total labour require-ment of 90 days per year: upkeep and management of the irriga-tion system calculated at 50 percent of 2 percent of the original in-vestment costs, equal to $10/hectare or 20 labour days; total addi-tional labour days per hectare. 78.
187
through which individuals will be able to participatein the community effort both for constructing andusing the improved infrastructure. The level ofdevelopment and stage of social organization are alsocrucial in defining the kind of public works whichcan be built for a useful purpose and the supportwhich can be marshalled for their construction. Edu-cational efforts are necessary to support such pro-grammes.
Rural industrialization is another major avenueadvocated for increasing nonagricultural rural em-ployment. An important distinction needs to bemade between the part-time, seasonal, artisan typeof industry, and the type of industrialization whichcreates full-time industrial workers residing andworking in rural areas. While the first alternativehas often been upheld as an important opportunityfor creating employment through part-time cottage-industry type occupations, its effects are greatlylimited by its very low productivity as comparedwith industrial production, with which it often hasto compete. Thus in the final analysis it has to belimited to the type of industrial production wherethe label "hand-made" is an advantage. Successfulexamples are cottage weaving, as in India, and thesilk weaving revival in Thailand. ft is not to beoverlooked that this type of employment is trulysupplementary to agriculture so that, once labourutilization in agriculture itself is better organized,much of the cottage industry declines because itcannot even reach the productivity levels of labourused in agriculture.
Thus it appears that in the longer run industriali-zation in rural areas must be based on combiningmore modern technology and capital with labour.The industries which are attractive from this pointof view are those based on agricultural raw materials,for example sugar manufacture, cotton ginning, oilextraction, feed mixing, canning and other foodprocessing. However, most of these industries arehighly seasonal so that their capital/labour ratiomay still be relatively high.
Government action to support rural industriali-zation will largely define its location. It is the pro-vision of infrastructural services, together with taxconcession.s and direct subsidies, which are the mainweapons in the government's armoury for creatingincentives for rural industrialization.
During the Second Development Decade the in-dustries and services ancillary to agriculture may beof particular importance in increasing employmentin rural areas. Major features of agricultural devel-opment in the stage it has now reached in most de-veloping countries are rapid increases in sales of agri-cultural products and in purchases of inputs. Thesewill give rise to substantially increased employmentin the marketing of agricultural products, and in
the marketing and in many cases also the manufactureof the inputs required for improved technology.Many of the most important employment effects ofthe high-yielding varieties will be of this indirect kind.
Another potentially substantial source of ruralemployment is in the construction of the housingand other infrastructure required for the developmentof decentralized rural towns, which would be awelcome alternative to the continued sprawl ofexisting cities. It has recently been suggested thatsuch construction might be financed by internation-ally guaranteed mortgages,6° and the urgent needto increase rural employment in developing countrieswould seem to provide a powerful additional justi-fication for such 'a course. Such decentralized ruraltowns would not only provide markets for the agri-cultural produce of surrounding areas, but alsocentres from which to furnish the various necessarygovernment services for farmers.
Overall policy considerations in increasingrural employment
Measures to increase employment opportunitiesdo not necessarily contribute to the improvement ofincome distribution. For example, most of themeasures discussed earlier apply only to farmerswho have some link with the market economy.Subsistence farmers, who produce almost entirelyfor consumption within their own family, cannot bereached in this way. They must first be broughtinto some contact with the market economy. Al-though it can usually be assumed that most of theseisolated communities have a reasonable food base,they are some of the worst examples of under-employment. Unless they can increase their productiv-ity, usually through an increased input of labour,they cannot produce a surplus for sale and therebyincrease their incomes and levels of living.
In other cases the problems of providing increasedemployment opportunities become very difficult be-
" Barbara Ward. Tho poor world's cities. The Economist,6 December 1969, p. 56-70.
Some policy implications
As was stressed at the outset, the above reviewof some of the main agricultural problems of the1970s is far from complete. It does make it possible,however, to distinguish some of the main prioritiesboth for domestic agricultural policies in the develop-ing countries and for international cooperation andassistance during the Second Development Decade.
188
cause of the poor resource base of areas such as thosediscussed earlier in connexion with crop production.In these situations the main thrust of an employ-ment policy must of necessity be oriented towardgiving skills to people to enable them to migrate toother areas. Sometimes there are opportunities forrural industrialization, but in general even these areless attractive than in areas with a good agriculturalpotential, and thus a higher income and biggerlocal market, together usually with a better com-munications infrastructure.
To conclude, it must be stressed that optimalchoices between development policies involving differ-ent employment effects require that the costs andbenefits of the alternatives are reasonably well known.There is far too little information on the trade-offbetween production and employment objectives.
The benefits and costs have to be looked at fromthree angles, namely economic, social welfare andpolitical. There is a close relationship betweenthese, which is sometimes complementary but moreoften than not competitive. The complementarity ofeconomic and welfare considerations for an employ-ment-oriented development policy is clear if it resultsin an improved income distribution which both satis-fies social welfare goals and helps development by in-creasing internal demand for many consumption goods.The social welfare and political goals of employmentpolicies may also strongly reinforce each other.
Just as in a cost/benefit analysis for multipurposeriver development, some of the major problemsof rural unemployment arise from the difficulty ofmeasuring some of the costs and some of the benefits,which forces the decision-maker to use well-informedjudgement both in estimating the benefits and costsand in the final decision. Because of this need forjudgement, and because of the strong emotionalimplications of unemployment, these decisions aredifficult and controversial. One of the most impor-tant tasks in future is to narrow down the range ofvariables which need to be based on judgement, thuscreating a more objective framework for decisions.This requires the development of improved conceptsand an increased availability of reliable information.
Agricultural policies in developing countries
As regards domestic policies, the first essential isfor governments to continue to give high priorityto agricultural development. Agricultural productionpossibilities are now greatly improved in a numberof countries, but these possibilities will never be
realized if, in the mistaken belief that the food pro-duction problem is already all but solved, agricultureis once again starved of resources.
The provision of the necessary support for agri-cultural development will severely strain govern-ment resources of finance, trained manpower, andadministrative infrastructure. Imports of essentialinputs such as fertilizers and pesticides will makeheavy calls on foreign exchange budgets. A reso-lute govern.ment commitment is therefore indispen-sable.
The agricultural production of most of the develop-ing countries is either already passing through oris about to enter a highly dynamic stage. It istherefore essential to maintain an equally dynamicattitude in future planning. This implies the avoid-ance of fixed concepts of location or the acceptanceof the status quo as defined bypr esent technology,environmental limitations, land use, factor avail-ability or land tenure. The need for flexibility andimagination cannot be overemphasized. If the pro-posed procedures for the review and appraisal ofprogress during the Second Development Decadeprove effective, it should be easier to foresee thepolicy adjustments that are needed and apply themin good time.
Agricultural policies in developing countries dur-ing the Second Development Decade should havetwo main aims. First, they will need to be designedto keep up the impetus of the so-called green rev-olution or, in those countries where it has notyet begun, to lay the foundations for it. Second,they will have to take care of the side-effects ofrapid agricultural change that could react back andslow down its impetus. In both cases, economicand institutional measures are of paramount im-portance.
Concerning the first aspect, institutions and ser-vices must be modernized and developed in order tosupport technological advance and the intensifica-tion of agriculture. The institutional frameworkembraces the en.tire economic and social climate inwhich the farmer lives and works. But in the pres-ent context some of the most important individualinstitutions are those concerned with extension andeducation, prices and marketing, credit, land tenureand farmers' associations. All of the technologicalimprovements on which such high hopes are nowpinned are of no avail if extension services are inad-equate to assist farmers with the problems of moderniz-ing their production, if credit is not available toenable them to purchase the fertilizers and otherinputs on which a modern productive agriculturedepends or if, as a result of inappropriate price poli-cies, inefficient marketing and outmoded systems ofland tenure, they do not have the incentive to in-crease their production.
189
The methods required to obtain optimum benefitsfrom the use of high-yielding varieties are still unfa-miliar to most farmers, and the effective use of irri-gation water or of newly cultivated land is outsidethe experience of many others. Such techniquesmust be learned quickly, if there is to be an adequatereturn at the national level to the investments inland and water development required to meet fu-ture needs for agricultural growth in developingcountries." This implies both a massive farmertraining programme to spread the results of adap-tive research and adequate institutional backstopping.These are at present lacking in many developingcountries, where their absence has led to the failureof many settlement and irrigation schemes and theconsequent disillusionment of both individual farmersand national planners.
The continued rapid increase in the use of purchasedinputs in the agricultural production of the develop-ing countries will require a vast expansion in thesupply of institutional credit, especially if the smallerfarmers are not to be left behind. Rural bankinginstitutions will need considerable adaptation ifthey are to play their full role in the mobilizationof the savings accruing to farmers who have benefitedfrom innovation. Marketing institutions and storagefacilities must keep up with the growing volume anddiversity of marketed supplies.
Price policies (and related subsidy and taxationpolicies) are a particularly crucial area, and form animportant link between the measures needed tokeep up the impetus of change and those needed tomitigate its less desirable consequences. On theone hand, especially for cereals, they must ensurethat farmers contin.ue to have the incentive to usethe fertilizers and other purchased inputs that arethe mainspring of the recent more encouraging prog-ress in production. At the same time, however,they must provide for gradual reduction.s in cerealprices, so that consumers may benefit from the pro-duction improvements, and so that cereals may eco-nomically be used for livestock feed and (in some cases)exported.
It is clear that the expansion of opportunities forproductive employment must increasingly become aspecific goal of government policies. Moreover,there must also be a dramatic improvement in ruralamenities if there is to be any chance of stemmingthe premature flow of rural people to urban areasbefore jobs are available for them. Ways mustbe found of using the enthusiasm and energy ofyoung people for productive purposes, instead ofallowing them merely to become prone to dissatis-faction and frustration.
"Estimated by FAO at about $30 000 million, or 40 percent ofall investment in agriculture, forestry and fisheries proposed forthe Second Development Decade.
Governments must seriously examine whether thelooming problems of unemployment and under-employment can ever be solved without a reductionin the present rapid rates of population growth, andwhether such a reduction can be obtained in timewithout their assistance through the provision ofinformation and facilities for those wishing to prac-tise family planning.
Deliberate policies will also be needed to limit theinequalities that seem likely to widen in rural areas,as a result of the high-yielding varieties and relatedimprovements. These could have important con-sequences for the overall strategy of agricultural de-velopment in certain countries.
In order to stimulate the rapid expan.sion of inputuse required to achieve production objectives, tosimplify the task of extension workers and to obtainmaximum benefit from the complementarity ofinputs, a number of countries have found it usefulto launch special programmes. These provide an ap-propriate "package" of inputs and cultivation prac-tices as a spearhead for development in certain keycrops and areas, supported by reinforced credit andmarketing services. While it is not suggested that suchstrategies of concentration should be abandoned infavour of thinly spreading scarce resources overthe whole country, it does seem important to considervery carefully their likely effects on rural inequalities.Above all, every effort should be made to see thata package programme is accessible to all producersin a given area and not just to the larger ones orthose who are otherwise more favourably placed.
In many countries the most powerful tool forreducing rural inequalities lies in land reform, whichnot only enables the mass of the population to par-ticipate more fully in developrnent but also stimulatesthe higher consumption levels needed for more rapiddevelopment. Even in countries where a substantialredistribution of landed property is not considerednecessary, tenancy reforms will often be needed inorder to remove some of the disadvantages of thesmaller producers.
A central problem in most developing countrieswill continue to be to make the most effective useof the limited resources available. Improvements innational planning and in the identification and prep-aration of specific projects will therefore be essen-tial. Short- and medium-term planning for the agri-cultural sector will increasingly need to be developedwithin the framework of longer term perspectiveplans, so as to take account of the long-term natureof many agricultural projects and of the longer runchanges that are occurring in the domestic and inter-national demand for agricultural products. Theharmonization of national plans with those of othercountries will be a major need, especially where multi-national approaches are being developed.
190
International cooperation and assistance
Just as the governments of the developing coun-tries must give high priority to agricultural develop-ment, so must the donors of foreign assistance.
High on the list of the main priority areas for inter-national action must come the intensification andbroadening of the international cooperation in agri-cultural research that has proved so successful indeveloping the high-yielding varieties of cereals.This striking success has made national and inter-national financing bodies more r,xeptive to requestsfor assistance to research. Moreover, the UnitedNations Advisory Committee on the Application ofScience and Technology to Development has recentlyrecommended that developed countries should devote5 percent of their nonmilitary research expenditureto time problems of time developing countries.
A major task is to increase the yields of those ce-real species not adequately covered by existing inter-national-cum-national research programmes. It ap-pears that a good deal of the need could be met bygiving additional support to existing internationalcentres and regional programmes, for example tothe International Maize and Wheat ImprovementCentre (cimmvT) in Mexico for work on winter anddurum wheats and barley, in cooperation with FAO'SNear East wheat and barley programme. Similarly,the International Rice Research Institute (IRRI) inthe Philippines might extend its coverage to deep-water, upland and swamp rice, cooperating with theInternational Centre for Tropical Agriculture (ma')in Colombia, and with the West African Rice Devel-opment Association (wAnDA). Some of the high-yielding varieties developed in Asia and America havealready shown promise under African conditions, butmuch remains to be done and WARDA appears ofgreat potential importance as a guideline for regionalaction in tackling key food production problems. Asimilar cooperative approach might be considered forsorghum and millet, possibly centred on time newlyestablished International Institute of Tropical Agri-culture (irrA) in Nigeria, or alternatively on theexpansion of an existing regional or national station.
It will probably be necessary to establish an inter-national centre to focus a major part of its attentionon tropical roots and tubers, in order to supplementthe work of national stations. Africa should re-ceive first priority, and coordinated research betweenIITA and national stations such as the Institut nationalpour l'étude agronomique du Congo (INEAc), whereconsiderable progress has already been made withcassava breeding, could result in a major break-through in improving dietary levels and health inthe region, especially if it were linked to a programmeto provide supplementary protein through time im-provement of grain legumes and their introduction
into rotations with starchy roots. For tropical le-gumes international research might be centred onCIAT or IITA, but for Mediterranean and subtropicalspecies a special centre might have to be set up inAfrica or Asia. It is also necessary to establishregional or subregional horticultural research pro-grammes with international su.pport.
To ensure the rapid exploitation of the vast po-tential of multiple cropping, both international andnational research centres working on the majorfood crops should strengthen their activities in re-lation to intensive cropping systems wherever the en-vironment makes their introduction feasible. Thiswill need to be supported by economically-orientedpilot projects. FAO could make a major contributionrere, both through the adaptation of existing UNDPprojects and through establishing new ones specificallyaimed at fostering multiple cropping. Care shouldbe taken to ensure that inputs are available togetherwith supporting credits and advice OR managementwhen required, and that marketing arrangementsare adequate to cope with a varied flow of producethroughout the year.
The exploration, conservation and ecological adap-tation of genetic resources are other areas whereinternation.al collaboration is highly desirable. Atpresent only about 1 percent of the genetic potentialof cultivated plants has been employed in plant breed-ing, the raw material of which is found in the numerouscrop races unconsciously created over centuries ofcultivation by primitive man. These are rapidlybecoming extinct under the pressure of modernimproved varieties and no substitute source of ge-netic raw materials exists.G1 It is therefore essentialthat a systematic approach be adopted to the conser-vation, exploration and rational exploitation of exist-ing resources. Evaluations of collections of prim-itive cultivars which have revealed highly desirablefeatures (such as high protein, changes in amirto-acid balance, disease resistance, and suitability forprocessing) suggest that the Mexican wheat-breedingexperience is not a fortunate accident unlikely tobe repeated, but rather a pattern that can be pursuedthrough the systematic use of genetic resources.This will depend, however, on the coordinated ex-change of plant material and information on a largescale, and presupposes a standardized approach todata storage and retrieval, as through FAO'S GeneticResources Information Centre. A number of re-gional gene banks are already in the course of estab-lishment, and the promotion of further effort alongthese lines will be required.
Considerable international assistance will be neededif the developing countries are to be able to obtain
"This does not mean that the possibilities of inducing geneticchanges by the use of chemicals, radiation, etc. should be ignored.These methods, however, are only one of the tools of plant breed-ing. and the results are largely unpredictable.
191
the vast quantities of inputs on which the moderni-zation of their agriculture depends. At present most ofthe fertilizers, pesticides and machinery they requirehave to be imported from the developed countries,and these imports may well constitute an even greaterdrain on their scarce foreign exchange resourcesduring the Second Development Decade than didthe rising imports of cereals, much of them availableon concessional terms, that characterized the FirstDevelopment Decade. The Second World FoodCongress has therefore recommended that an in-creasing proportion of foreign assistance should bein the form of food production resources, and hasrevived the earlier proposal for a multilateral pro-gramme of this kind. Assistance in the develop-ment of appropriate techniques for input manufac-ture, formulation or assembly, which might be lesscapital intensive than those used in highly industrial-ized countries but would still provide inputs tofarmers at reasonable prices, could be a major objec-tive of aid programmes for the Second DevelopmentDecade. Where a number of countries are cooperat-ing in a development programme (such as WARDA)economies of scale could be achieved through thecooperative purchase or manufacture of inputs.
IWP has suggested that, with the decline in foodaid in the form of food grains that may be expectedas a result of increased production in developingcountries, milk products might replace food grainsas the main item in food-aid programmes. Thisseems logical, not only because of the developingcountries' need for protein and the difficulty of build-ing up their own dairy industries, but also becausemilk products are heavily in surplus in the developedcountries, owing to structural characteristics oftheir agriculture which can be changed only gradually.Stepping up food aid in the form of milk productswould, however, be a complex matter for both do-nors and recipients. From the long-term point ofview it would seem desirable to link the productionpolicies of the major dairy countries to the oppor-tunities for assisting developing countries in theirefforts to set up a viable dairy industry. The Inter-national Dairy Development Scheme proposed byFAO sets out to do this. Such an approach wouldalso offer opportunities for certain centrally plannedcountries to increase their aid flows without encoun-tering hard currency problems.
A major area in which international action wouldseem to be a precondition for success is the expan.sionof beef exports from the developing countries. Aprincipal obstacle, aside from the supply situation,is the unsatisfactory state of disease control andabattoir hygiene in most potential beef-exportingcountries in the developing world. Without im-provements in these fields it would be unrealisticto expect the high-income markets, with their valuable
domestic livestock industries, to open their doorsto imports from new sources. Indeed, the progressbeing made in Europe in eradicating foot-and-mouthdisease suggests that veterinary import regulationsmay be expected to become more stringent, ratherthaneasier, in future.
From the technical point of view, improved abattoirhygiene should not be too difficult to achieve; indeedsome existing exporters have made great strides inthis direction. Effective disease control is muchmore complex and costly. Much good work isalready being done in the developing countries, butthe total resources devoted to disease control, par-ticularly foot-and-mouth disease, remain limited rel-ative to the losses that it is reported to cause andthe potential benefits that would accrue from theopening of export outlets. However, without theassurance of entry to high-income markets for theirmeat, it may be difficult to induce developing coun-tries to invest heavily in disease control. The onlyway to solve this would seem to be the promotionof some kind of international arrangement underwhich those developing countries that undertake toproduce meat of acceptable hygienic standards aregiven a reasonable assurance of market outlets inthe high-income countries.
Livestock products, being one of the more prom-ising foreign exchange earners for developing coun-tries, provide a link with the third main problemarea for the 1970s selected for discussion in thischapter. Greater foreign exchange earnings for thedeveloping countries depend to a great extent onpolicy changes in the developed countries that aretheir main market. This is a fact that was muchstressed in the recommendations of the SecondWorld Food Congress, and it is to be hoped thatthe Second Development Decade will see muchmore progress in this regard. Some of the waysin which FAO and other international agencies canhelp in the difficult process of international adjust-ment include studies of the economic and technicalfactors determining the current market situation;exploration of the possibility of developing, in con-sultation with governments, agreed criteria or guide-lines to determine how the burden of production andtrade adjustment might be shared among countries;promotion of informed discussions to foster greaterunderstanding between governments; and furtherattempts at broader trade negotiations along the linesof the initial plans for the Kennedy Round, whereaccount would also be taken of nontariff barriersto trade, including the level of agricultural support.
The Second World Food Congress, in additionto calling for a dismantling of protectionism, es-pecially of processed products, urged developedcountries to pledge themselves never to raise tariffsor reduce quotas for products from developing coun-
192
tries, even if balance of payments difficulties necessi-tated such measures against imports from other de-veloped countries. it also called for a study of com-parative advantages in the production of agriculturalcommodities in the light of both short- and long-termopportunity costs. The need was stressed for thefurther development of international commodityagreements and their extension to additional com-modities, including not only formal agreements butalso less formal arrangements of the type developedunder FAO auspices for jute and hard fibres. FAO
and other international organizations might be ableto contribute to an improved atmosphere for thenegotiation of commodity arrangements by makingstudies of the trade Rows resulting from the additionalexport earnings of developing countries.
A very important aspect of international coopera-tion during the Second Development Decade willbe among the developing countries themselves, instrengthening the existing schemes for subregionaleconomic cooperation and integration and establish-ing additional ones. Such schemes provide a soundbasis for the expansion of trade between develop-ing countries. They require assistance in the basicstudies that must precede effective action, perhapsalong the lines of that provided by FAO to the CentralAmerican Common Market, and in the establish-ment of the necessary trading infra.structure. Morespecialized fields for international assistance mightinclude financial assistance for the establishment ofregional or interregional payments arrangements (suchas the proposed Asian Regional Payments Union);the creation of a link between the Special DrawingRights of the International Monetary Fund anddevelopment finance would greatly help in this.
The analysis in this chapter also suggests that in-ternational agencies such as FAO and GATT, as wellas individual developing countries, should give in-creased attention to market analysis for minor com-modities both for the immediate benefit of exportersand to provide a basis for policy-oriented studiesof agricultural diversification in countries relyingheavily on a few major exports.
Concerning rural employment, the fourth problemarea discussed, a principal need is for a better under-standing of this comparatively new problem, includ-ing its nature and magnitude and even the basicconcepts of unemployment and underemployment.Here international assistance in the necessary re-search can be most valuable. The DevelopmentCentre of the Organization for Economic Coop-eration and Development (oEcD) is already conducting a substantial programme of research in thisfield, and studies are also in preparation by FAO,ILO and other bodies.
In the long run, the main attack on the employ-ment problem will probably have to be through
population policy. Rapid population growth is themain factor delaying the moment when the agricul-tural labour force filially begins to decline in abso-lute numbers. Just as, during the First DevelopmentDecade, food production difficulties constituted oneof the most powerful arguments for a reduction inpopulation growth, in the Second Development De-cade employment problems seem likely to assumemajor importance in this regard. As with foodproduction difficulties, employment problems besetsparsely and densely populated countries alike. Evenwhere there is unused land its exploitation is usuallyvery costly, and the resources involved could betterbe used to raise the living levels of a less rapidlygrowing population. Bilateral and multilateral assis-tance to countries wishing to slow down their popu-lation growth by means of family planning hasexpanded rapidly in the last few years, but will needto be stepped up much more substantially duringthe Second Development Decade.
Another fruitful area for international assistancewould be in guaranteeing mortgages for housingand other construction required in the development ofdecentralized rural towns. This would not only addsubstantially to rural employment opportunities, butwould also assist in the establishment of rural centresthat would be important sources of demand for agri-cultural products and a suitable channel for the manyservices that governments must furnish to farmers.
Foreign assistance to agriculture has in the pastoften tended to go mainly to large-scale projects, suchas irrigation schemes, and thus to favour the larger andmore fortunately placed farmers. If rural inequalitiesare not to be further widened, ways must be foundof channelling an increasing proportion of foreignassistance so that it will benefit small farmers. Inparticular, there is considerable scope for the de-velopment of additional ways of assisting agriculturalcredit institutions, as have been pioneered in recentyears by the FAO/IBRD Cooperative Programme.
In addition to this bilateral and multilateral assis-tance in the public sector, assistance from the privatesector will, as stressed by the Second World FoodCongress, have a crucial role to play in the attain-ment of the objectives of the Second DevelopmentDecade, especially in such fields as processing in-dustries and the production and distribution ofinputs. A neglected area in many developing coun-tries which may well depend mainly on the supportof the private sector is the seed industry, which isessential for the sustained use of the high-yieldingvarieties and other improved seeds.
* * *
Even from this incomplete review of agriculturalprogress in the developing countries during the past25 years, and of some of the areas which are likely
193
to be among the main agricultural problems duringthe Second United Nations Development Decade, anumber of broad conclusions can be drawn. It isclear that in many developing countries the agricul-tural sector constituted one of the principal dragson overall economic and social development duringthe First Development Decade. Fortunately, manylessons about the crucial role of agriculture havebeen learned from this experience. Fortunately, too,the end of the decade has seen a remarkable spurtin the pace of agricultural modernization in a numberof countries, so far mainly in Asia.
Thus there is sorne reason to hope that the perfor-mance of agriculture in the developing countriesduring the Second Development Decade will be agood deal more successful than it was during thefirst. But hopes must not be set too high. It seemsfairly sure that during the next decade good progresscan be made in overcoming the quantitative caloriedeficiencies in diets that have been one of the worstblots on the postwar record. But as one generationof problems is overcome it either breeds anotheror at least makes it possible to concentrate on thosethat previously had to take a lower priority. Evenif the worst calorie deficiencies can be met, prog-ress is bound to be much slower with the proteindeficiencies that so gravely affect the physical andpossibly even the mental development of youngchildren. While it will, it seems, be a little easierthan in the recent past to keep up with the foodneeds of a rapidly growing population, it is goingto be more difficult than ever before to keep up withits needs for productive employment. Inequalitiesin rural areas seem likely to widen. And unrestcaused by problems of employment and income distri-bution could easily react back on and place in jeop-ardy the possibilities for improving food production.
The Second Development Decade can thereforedo little more than lay the foundations for the eventualsolution of many of the problems that at presentbeset mankind. It may well prove, however, thelast chance for these foundations to be laid. It isessential to use the breathing space granted by thehigh-yielding varieties and related agricultural im-provements to plan the necessary measures for better-balanced diets in the developing countries, to in-troduce really effective family planning programmesbefore it is too late, and to take the social and othermeasures needed to secure a more equitable distri-bution of employment and income-earning opportu,nities. All this requires not only resolute action by thegovernments and people of the developing countriesthemselves, but much more attention to their prob-lems by governments and people in richer countries,including a massive increase in financial and otherassistance within the framework of the strategy agreedfor the Second United Nations Development Decade.
ANNEX TABLES

Production index numbers
The indices of agricultural production have beenrecalculated on a calendar year basis. They aretherefore not comparable with the indices for cropyears published in the 1966 and prior issues of thisreport.
The indices are calculated by applying regionalweights, based on 1952-56 farm price relationships,to the production figures, which are adjusted toallow for quantities used for feed and seed. Theindices for food products exclude coffee, tea, tobacco,inedible oilseeds, animal and vegetable fibres, andrubber.
For fishery production, quantities are weightedby the average unit values of fishermen's landingsin 1957-59. For forest production, roundwood pro-duction is weighted by 1952-56 prices.
Trade index numbers
The indices of agricultural trade were revised in1968, and the present series are not comparablewith the indices for earlier years published in previousissues.
For full details, including a list of weights, see FAO, ProductionYearbook 1968, Rome, 1969, p. viii and 693-697.
FAO index numbers of agricultural, fishery, and forest production and trade
EXPLANATORY NOTE
196
In calculating the indices of the volume of ex-ports and imports of agricultural products, the vol-ume figures for individual products are weightedby average unit values in 1957-59.
Average unit values are calculated on a regionalbasis, using quantity and value data covering a mini-,mum of 85 percent of the region's total trade ineach product. The unit values for individual prod-.ucts are weighted by the average volume of tradein 1957-59.
As far as possible, the indices for trade in fisheryand forest products are calculated in the same wayas those for agricultural products.
Regional coverage
The coverage of most of the regional groupingsis self-explanatory. It should be noted, however,that western Europe is defined as including Yugo-slavia, and the Near East as extending from Cyprusand Turkey in the northwest to Afghanistan in theeast, and including from the African continent Libya,the Sudan, and the United Arab Republic. ForChina (Mainland) no estimates are included untilmore complete data are available.
Because of difficulties concerning exchange ratesand the pricing of barter transactions, the trade ofeastern Europe and the U.S.S.R. has been priced atthe world average export unit values.
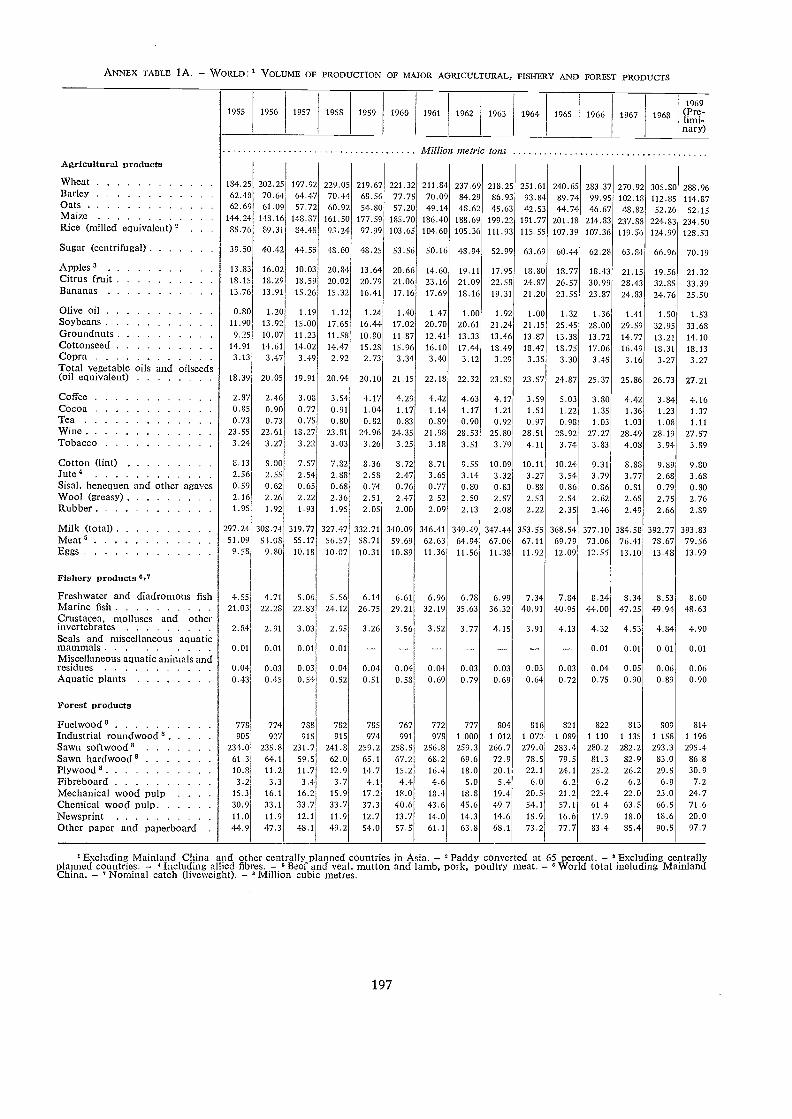
ANNEX TABLE 1A. - WORLD: VOLUME OF PRODUCTION OF MAJOR AGRICULTURAL, FISHERY AND FOREST PRODUCTS
' Excluding Mainland China and other centrally p armed countr'es in Asia. - Paddy converted at 65 percent. - Excluding centrallyplanned countries. - ' Including allied fibres. - 5 Beef and veal, mutton and lamb, pork, poultry meat. - World total including MainlandChina. - 'Nominal catch (liveweight). - Million cubic metres.
197
1955 1956 1957 1958 1959 1960 1961 1962 1963 1964 1965 1966 1967 1968
1969
M:nary)
Million metric tonsAgricultural products
VVheat 184.25 202.25 197.92 229.05 219.67 221.32 211.84 237.69 218.25 251.61 240.65 283.37 270.92 305.80 288.96Barley 62.48 70.64 64.47 70.44 68.56 77.75 70.09 84.29 86.93 93.84 89.74 99.95 102.18 112.85 114.87Oats 62.69 61.09 57.72 60.92 54.80 57.20 49.14 48.62 45.63 42.53 44.74 46.67 48.82 52.26 52.15Maize 144.24 148.16 148.87 161.50 177.59 185.70 186.40 188.69 199.22 191.77 201.18 214.83 237.88 224.83 234.50Rice (milled equivalent)2 35.76 89.31 84.48 93.24 97.99 103.65 104.60 105.36 111.93 115.55 107.39 107.36 119.56 124.99 128.53
Sugar (centrifugal) 39.50 40.42 44.55 48.60 48.25 53.56 50.16 48.94 52.99 63.69 60.44 62.28 63.84 66.96 70.19
A pples 3 13.83 16.02 10.03 20.84 13.64 20.66 14.60 19.11 17.95 18.80 18.77 18.43 21.15 19.56 21.32Citrus fruit 18.15 18.29 18.59 20.02 20.79 21.06 23.16 21.09 22.58 24.87 26.57 30.99 28.43 32.85 33.39Bananas 13.76 13.91 15.26 15.32 16.41 17.16 17.69 18.16 19.31 21.20 23.55 23.87 24.83 24.76 25.50
Olive oil 0.80 1.20 1.19 1.12 1.24 1.40 1.47 1.00 1.92 1.00 1.32 1.36 1.41 1.50 1.53Soybeans 11.90 13.92 15.00 17.65 16.44 17.02 20.70 20.61 21.24 21.15 25.45 28.00 29.59 32.95 33.63Groundnuts 9.25 10.07 11.23 11.58 10.80 11.87 12.41 13.33 13.46 13.87 13.38 13.72 14.77 13.21 14.10Cottonseed 14.91 14.61 14.02 14.47 15.28 15.96 16.10 17.44 13.49 18.47 18.75 17.06 16.49 18.31 18.13Copra 3.13 3.47 3.49 2.92 2.73 3.34 3.40 3.12 3.29 3.35 3.30 3.45 3.16 3.27 3.27Total vegetable oils and oilseeds(oil equivalent) 18.39 20.05 19.91 20.94 20.10 21.15 22.18 22.32 23.52 23.57 24.87 25.37 25.86 26.73 27.21
Coffee 2.87 2.46 3.08 3.54 4.17 4.29 4.42 4.63 4.17 3.59 5.03 3.80 4.42 3.84 4.16Cocoa 0.85 0.90 0.77 0.91 1.04 1.17 1.11 1.17 1.21 1.51 1.22 1.35 1.36 1.23 1.37Tea 0.73 0.73 0.75 0.80 0.82 0.83 0.89 0.90 0.92 0.97 0.98 1.03 1.03 1.08 1.11Wine 23.55 22.61 18.27 23.81 24.96 24.35 21.98 28.53 25.80 28.51 28.92 27.27 28.49 28.19 27.57Tobacco 3.24 3.27 3.22 3.03 3.26 3.25 3.18 3.51 3.79 4.11 3.74 3.83 4.08 3.94 3.89
Cotton (lint) 8.13 8.00 7.57 7.82 8.36 8.72 8.71 9.55 10.09 10.11 10.24 9.31 8.88 9.89 9.80Jule 4 2.56 2.55 2.54 2.88 2.58 2.47 3.65 3.14 3.32 3.27 3.54 3.79 3.77 2.68 3.68Sisal. henequen and other agaves 0.59 0.62 0.65 0.68 0.74 0.76 0.77 0.80 0.83 0.88 0.86 0.86 0.81 0.79 0.80Wool (greasy) 2.16 2.26 2.22 2.36 2.51 2.47 2.52 2.50 2.57 2.53 2.54 2.62 2.65 2.75 2.76Rubber 1.95 1.92 1.93 1.95 2.05 2.00 2.09 2.13 2.08 2.22 2.35 2.46 2.49 2.66 2.89
Milk (total) 297.24 308.74 319.77 327.47 332.71 340.09 346.41 349.49 347.44 353.55 363.54 377.10 384.58 392.77 393.83Meats 51.09 51.08 55.17 56.57 58.71 59.69 62.63 64.94 67.06 67.11 69.79 73.06 76.41 78.67 79.56Eggs 9.58 9.80 10.18 10.07 10.31 10.89 11.36 11.56 11.38 11.92 12.09 12.55 13.10 13.48 13.99
Tqshery products8,7
Freshwater and diadromous fish 4.55 4.71 5.06 5.56 6.14 6.61 6.96 6.78 6.99 7.34 7.84 8.24 8.34 8.53 8.60Marine fish 21.03 22.28 22.83 24.12 26.75 29.21 32.19 35.63 36.32 40.91 40.95 44.00 47.25 49.94 48.63Crustacea, molluscs and otherinvertebrates 2.84 2.91 3.03 2.95 3.26 3.56 3.52 3.77 4.15 3.91 4.13 4.32 4.53 4.84 4.90Seals and miscellaneous acgiaticmammals 0.01 0.01 0.01 0.01 -- -- -- -- -- -- -- 0.01 0.01 0.01 0.01Miscellaneous aquatic animals andresidues 0.04 0.03 0.03 0.04 0.04 0.04 0.04 0.03 0.03 0.03 0.03 0.04 0.05 0.06 0.06Aquatic plants 0.43 0.45 0.54 0.52 0.51 0.58 0.69 0.79 0.69 0.64 0.72 0.75 0.90 0.89 0.90
Forest products
Fuelwoods 778 774 788 782 785 767 772 777 804 816 821 822 813 809 814Industrial roundwood 8 905 927 915 915 974 991 978 1 000 1 012 1 072 1 089 1 110 1 135 1 153 1 196Sawn softwoods 234.0 235.8 231.7 241.8 259.2 258.5 256.8 259.3 266.7 279.0 283.4 280.2 282.2 293.3 295.4Sawn hardwood' 61.3 64.1 59.5 62.0 65.1 67.2 68.2 69.6 72.9 78.5 79.5 81.3 82.9 83.0 86.8Plywoods 10.8 11.2 11.7 12.9 14.7 15.2 16.4 18.0 20.1 22.1 24.1 25.2 26.2 29.5 30.9Fibreboard 3.2 3.3 3.4 3.7 4.1 4.4 4.6 5.0 5.4 6.0 6.2 6.2 6.2 6.9 7.2Mecluinical wood pulp . . . 15.3 16.1 16.2 15.9 17.2 18.0 18.4 18.8 19.4 20.5 21.2 22.4 22.0 23.0 24.7Chemical wood pulp 30.9 33.1 33.7 33.7 37.3 40.6 43.6 45.6 49.7 54.1 57.1 61.4 63.5 66.5 71.6Newsprint 11.0 11.9 12.1 11.9 12.7 13.7 14.0 14.3 14.6 15.9 16.6 17.9 18.0 18.6 20.0C)ther paper and paperboard . 44.9 47.3 43.1 49.2 54.0 57.5 61.1 63.8 68.1 73.2 77.7 83.4 85.4 90.5 97.7
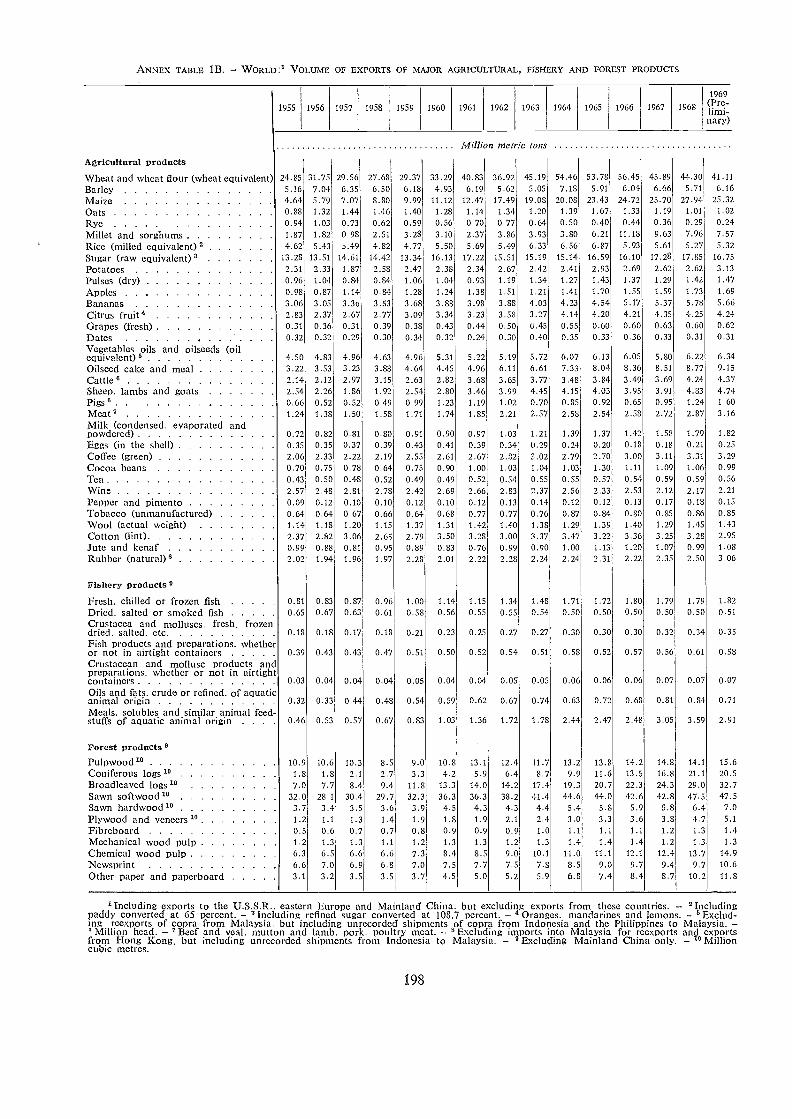
ANNEX TABLE 1B. - WORLD:1 VOLUME OF EXPORTS OF MAJOR AGRICULTURAL, FISHERY AND FOREST PRODUCTS
3 Including exports to the U.S.S.R., eastern Europe and Mainland China, but excluding exports from these countries. - 2 Includingpaddy converted at 65 percent. - Including refined sugar converted at 108.7 percent. - Oranges, mandarines and lemons. -Exclud-ing reexports of copra from Malaysia, but including unrecorded shipments of copra from Indonesia and the Philippines to Malaysia. -° Million head. - Beef and veal, mutton and lamb, pork, poultry meat. - ° Excluding imports into Malaysia for reexports and exportsfrom Hong Kong, but including unrecorded shipments from Indonesia to Malaysia. - ° Excluding Mainland China only. - 3° Millioncubic metres.
198
1955 1956 1957 1958 1959 1960 1961 1962 1963 1964 1965 1966 1967 1968
1969(i 113mr ei :
nary)
Million metric tons
Agricultural proclucts
VVheat and vvheat flour (wheat equivalen ) 24.85 31.75 29.56 27.68 29.37 33.29 40.83 36.92 45.19 54.46 53.78 56.45 45.89 44.30 41.11
Barley 5.16 7.04 6.35 6.50 6.18 4.93 6.19 5.62 5.05 7.18 5.91 6.04 6.66 5.71 6.16
Maize 4.64 5.79 7.07 8.80 9.99 11.12 12.47 17.49 19.08 20.08 23.43 24.72 25.70 27.94 25.32Oats 0.88 1.32 1.44 1.46 1.40 1.28 1.14 1.34 1.20 1.39 1.67 1.33 1.19 1.01 1.02
Rye 0.94 1.03 0.73 0.62 0.59 0.56 0.70 0.77 0.64 0.50 0.40 0.44 0.36 0.29 0.24
Millet and sorghums 1.87 1.82 0 98 2.51 3.28 3.10 2.37 3.86 3.93 3.80 6.21 11.18 9.63 7.96 7.57
Rice (milled equivalent) 2 4.62 5.43 a .49 4.82 4.77 5.50 5.69 5.49 6.33 6.56 6.87 5.93 5.61 5.27 5.32
Sugar (raw equivalent) 3 13 28 13.51 14.61 14.42 13.34 16.13 17.22 15.51 15.19 15.14 16.59 16.10 17.28 17.85 16.75
Potatoes 2.31 2.33 1.87 2.58 2.47 2.38 2.34 2.67 2.42 2.41 2.93 2.69 2.62 2.62 3.13Pulses (dry) 0.96 1.04 0.84 0.84 1.06 1.04 0.93 1.19 1.34 1.27 1.43 1.37 1.29 1.42 1.47
Apples 0.98 0.87 1.14 0.84 1.28 1.24 1.38 1.51 1.21 1.41 1.70 1.55 1.59 1.73 1.69
Bananas 3.06 3.05 3.3o 3.53 3.68 3.88 3.98 3.83 4.03 4.23 4.54 5.17 5.37 5.78 5.66Citrus fruit 4 2.83 2.37 2.67 2.77 3.09 3.34 3.23 3.58 3.27 4.14 4.20 4.21 4.35 4,25 4.24Grapes (fresh) 0.31 0.36 0.31 0.39 0.38 0.43 0.44 0.50 0.45 0.55 0.60 0.60 0.63 0.60 0.62Dates 0.32 0.32 0.29 0.30 0.34 0.32 0.24 0.30 0.40 0.35 0.33 0.36 0.33 0.31 0.31
Vegetables oils and oilseeds (oilequivalent) 5 4.50 4.83 4.96 4.63 4.96 5.31 5.22 5.19 5.72 6.07 6.13 6.05 5.80 6.22 6.34Oilseed cake and meal 3.22 3.53 3.23 3.88 4.64 4.45 4.96 6.11 6.61 7.33 8.04 8.36 8.51 8.77 9.15
Cattle 5 2 14 2.12 2.97 3.15 2.63 2.82 3.68 3.65 3.77 3.48 3.84 3.49 3.69 4.24 4.37Sheep, lambs and goats 2 54 2.26 1.86 1.92 2.54 2.80 3.46 3.99 4.45 4.15 4.03 3.95 3.91 4.83 4.74Pigs a 0 66 0.52 0.52 0.49 0.99 1.23 1.19 1.02 0.70 0.85 0.92 0.65 0.95 1.24 1.60Meat 7 1 24 1.38 1.50 1.58 1.71 1.74 1.85 2.21 2.57 2.58 2.54 2.58 2.72 2.87 3.16Milk (condensed, evaporated andpowdered) 0 72 0.82 0.81 0.80 0.91 0.90 0.97 1.03 1.21 1.39 1.37 1.42 1.58 1.79 1.82Eggs (in the shell) 0 35 0.35 0.37 0.39 0.43 0.41 0.39 0.34 0.29 0.24 0.20 0.18 0.18 0.21 0.25Coffee (green) 2 06 2.33 2.22 2.19 2.55 2.61 2.67 2.82 3.02 2.79 2.70 3.00 3.11 3.31 3.29Cocoa beans 0 70 0.75 0.78 0.64 0.75 0.90 1.00 1.03 1.04 1.03 1.30 1.11 1.09 1.06 0.99Tea 0 43 0.50 0.48 0.52 0.49 0.49 0.52 0.54 0.55 0.55 0.57 0.54 0.59 0.59 0.56Wine 2 57 2.48 2.81 2.78 2.42 2.69 2.66 2.83 2.37 2.56 2.33 2.53 2.12 2.17 2.21Pepper and pimento 0 09 0.12 0.10 0.10 0.12 0.10 0.12 0.13 0.14 0.12 0.12 0.13 0.17 0.18 0.15Tobacco (unmanufactured) 0 64 0.64 0.67 0.66 0.64 0.68 0.77 0.77 0.76 0.87 0.84 0.80 0.85 0.86 0.85Wool (actual weight) 1 14 1.18 1.20 1.15 1.37 1.31 1.42 1.40 1.38 1.29 1.39 1.40 1.29 1.45 1.43Cotton (lint) 2.37 2.82 3.06 2.65 2.79 3.50 3.28 3.00 3.37 3.47 3.22 3.36 3.25 3.28 2.95Jute and kenaf 0 99 0.88 0.81 0.95 0.89 0.83 0.76 0.99 0.90 1.00 1.13 1.20 1.07 0.99 1.08Rubber (natural)' 2 02 1.94 1.96 1.97 2.28 2.01 2.22 2.28 2.24 2.24 2.31 2.22 2.35 2.50 3.06
Fishery products 0
Fresh, chilled or frozen fish 0 81 0.83 0.87 0.96 1.00 1.14 1.15 1.34 1.48 1.71 1.72 1.80 1.79 1.79 1.82Dried, salted or smoked fish 0 65 0.67 0.63 0.61 0.58 0.56 0.55 0.55 0.54 0.50 0.50 0.50 0.50 0.50 0.51Crustacea and molluscs, fresh, frozen,dried, salted, etc . 0 18 0.18 0.17 0.18 0.21 0.23 0.25 0.27 0.27 0.30 0.30 0.30 0.32 0.34 0.35Fish products and preparations, whetheror not in airtight containers 0 39 0.43 0.43 0.47 0.51 0.50 0.52 0.54 0.51 0.58 0.52 0.57 0.56 0.61 0.58Crustacean and mollusc products andpreparations, whether or not in airtightcontainers 0.03 0.04 0.04 0.04 0.05 0.04 0.04 0.05 0.05 0.06 0.06 0.06 0.07 0.07 0.07Oils and fats, crude or refined, of aquaticanimal origin 0.32 0.33 0.44 0.48 0.54 0.59 0.62 0.67 0.74 0.63 0.72 0.68 0.81 0.84 0.71Meals, solubles and similar animal feed-stuffs of aquatic animal origin . . . . 0.46 0.53 0.57 0.67 0.83 1.03 1.36 1.72 1.78 2.44 2.47 2.48 3.05 3.59 2.91
Forest productsPulpwood " 10.9 10.6 10.3 8.5 9.0 10.8 13.1 12.4 11.7 13.2 13.8 14.2 14.8 14.1 15.6Coniferous logs " 1.8 1.8 2.1 2.7 3.3 4.2 5.9 6.4 8.7 9.9 11.6 13.5 16.8 21.1 20.5Broadleaved logs 1° 7.0 7.7 8.4 9.4 11.8 13.3 14.0 14.2 17.4 19.3 20.7 22.3 24.3 29.0 32.7Sawn softwood " 32.0 28.1 30.4 29.7 32.3 36.3 36.3 39.2 41.4 44.6 44.0 42.6 42.8 47.5 47.5Sawn hardwood " 3.7 3.4 3.5 3.6 3.9 4.5 4.3 4.3 4.4 5.4 5.8 5.9 5.8 6.4 7.0Plywood and veneers " 1.2 1.1 1.3 1.4 1.9 1.5 1.9 2.1 2.4 3.0 3.3 3.6 3.8 4.7 5.1Fibreboard 0.5 0.6 0.7 0.7 0.8 0.9 0.9 0.9 1.0 1.1 1.1 1.1 1.2 1.3 1.4Mechanical wood pulp 1.2 1.3 1.3 1.1 1.2 1.3 1.3 1.2 1.3 1.4 1.4 1.4 1.2 1.3 1.3Chemical wood pulp 6.3 6.5 6.6 6.6 7.3 8.4 8.5 9.0 10.1 11.0 11.1 12.1 12.4 13.7 14.9Newsprint 6.6 7.0 6.9 6.8 7.0 7.5 7.7 7.5 7.8 8.5 9.0 9.7 9.4 9.7 10.6
Other paper and paperboard 3.1 3.2 3.5 3.5 3.7 4.5 5.0 5.2 5.9 6.8 7.4 8.4 8.7 10.2 11.8
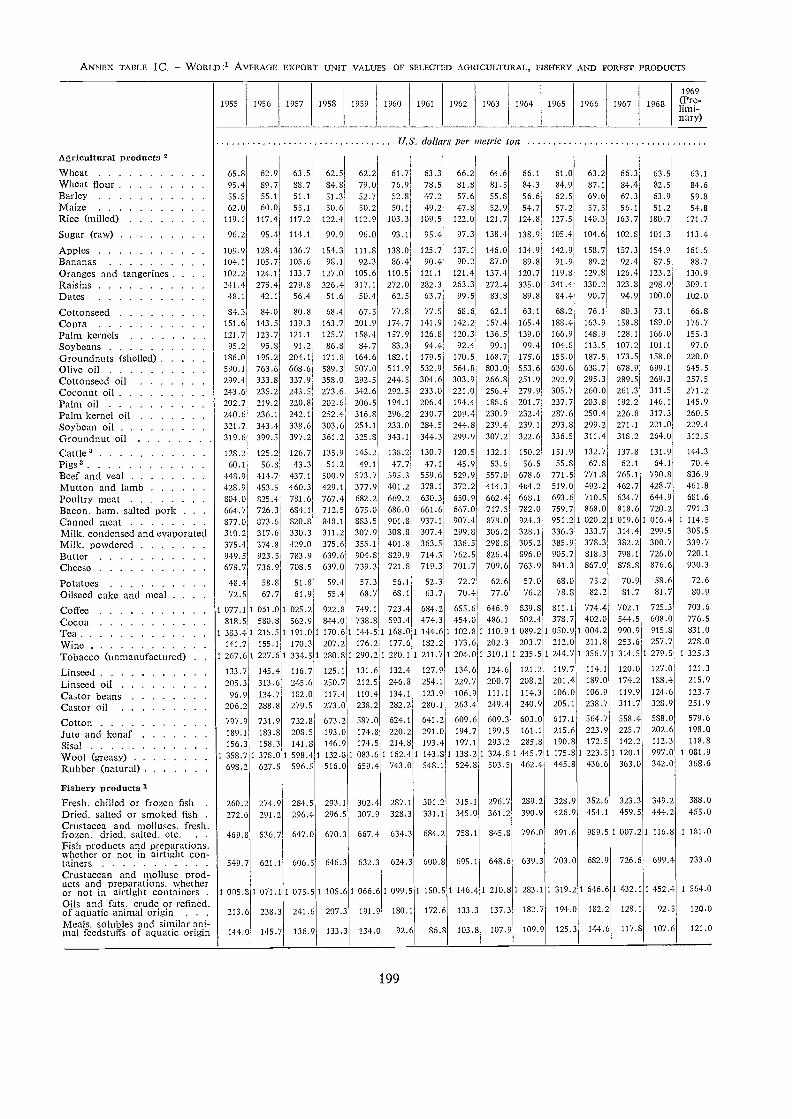
ANNEX TABLE 1C. - WORLD:' AVERAGE EXPORT UNIT VALUES OF SELECTED AGRICULTURAL, FISIrERY AND FOREST PRODUCTS
199
1955 1956 1957 1958 1959 1960 1961 1962 1963 1964 1965 1966 1967 1968
1969(Pre-
nary)
U.S. dollars per netric ton
Agricultural products 2VVheat 65.8 62.9 63.5 62.5 62.2 61.7 63.3 66.2 64.6 66.1 61.0 63.2 66.3 63.5 63.1Wheat flour 95.4 89.7 88.7 84.8 79.0 76.9 78.5 81.8 81.5 84.3 84.9 S7.1 84.4 82.5 84.6Barley 55.5 55.1 51.1 51.3 52.7 52.8 47.2 57.6 55.8 56.6 62.5 69.6 67.3 63.9 59.8Maize 62.0 60.0 55.1 50.6 50.2 50.1 49.2 47.8 52.9 54.7 57.2 57.5 56.1 51.2 54.8Rice (milled) 119.1 117.4 117.2 122.4 112.9 103.3 109.5 122.0 121.7 124.8 127.5 140.3 163.7 180.7 171.7
Sugar (raw) 96.2 95.4 114.1 99.9 96.0 93.1 95.4 97.3 138.4 138.9 105.4 104.6 102.8 101.3 113.4
AuPles 109.9 128.4 136.7 154.3 111.8 138.0 125.7 137.1 146.0 134.9 142.9 158.7 157.3 154.9 161.5
Bananas 104.1 105.7 105.6 98.1 92.3 86.4 90.4 90.2 87.0 89.8 91.9 89.2 92.4 87.5 88.7Oranges and tangerines . . . . 102.2 124.1 133.7 127.0 105.6 110.5 121.1 121.4 137.4 120.7 119.8 129.8 126.4 123.2 130.9
Raisins 241-4 275.4 279.8 326.4 317.1 272.0 282.3 263.3 272.4 335.0 341.4 330.2 323.8 298.9 309.1Dates 48.1 42.1 56.4 51.6 50.4 62.5 63.7 99.5 83.8 89.8 84.4 90.7 94.9 100.0 102.0
Cottonseed 84.3 84.0 80.8 68.4 67.5 77.8 77.5 68.6 62.1 63.1 68.2 76.1 80.3 73.1 66.8Copra 151.6 143.5 139.3 163.7 201.9 174.7 141.9 142.2 157.4 165.4 188.4 163.9 158.8 189.0 176.7
Palm kernels 121.7 123.7 121.1 125.7 158.4 157.9 126.8 120.3 136.5 139.0 166.9 148.9 128.1 166.0 155.3
Soybeans 95.2 95.8 91.2 86.8 84.7 83.3 94.4 92.4 99.1 99.4 104.8 113.5 107.2 101.1 97.0
Groundnuts (shelled) 186.0 195.2 2041. 171.8 164.6 182.1 179.5 170.5 168.7 175.6 155.0 187.5 173.5 158.0 220.0
Cllive oil 590.1 763.6 668.6 589.3 507.0 511.9 532.9 564.8 803.0 553.6 630.6 638.7 678.9 699.1 645.5
Cottonseed oil 299.4 333.8 337.9 358.0 292.5 244.5 304.6 303.9 266.8 251.9 292.9 295.3 289.5 269.3 257.5
Coconut oil 243.6 235.2 243.5 273.6 342.6 292.5 233.0 221.0 256.4 279.9 305.7 260.0 261.3 311.5 271.2
Palni Oil 2027. 219.2 220.8 2026. 206.5 194.1 206.4 194.4 188.6 201.7 237.7 203.8 192.2 146.1 145.9
Palm kernel oil 240.6 236.1 242.1 252.4 316.8 296.2 230.7 209.4 230.9 232.4 287.6 250.4 216.8 317.3 260.5
Soybean oil 321.7 343.4 338.6 303.6 254.1 233.0 234.5 244.8 239.4 239.1 293.8 299.2 271.1 221.0 229.4
Groundnut oil 319.6 399.5 397.2 361.2 325.8 343.1 344.3 299.9 307.2 322.6 336.5 311.4 318.2 264.0 312.5
Cattle 3 128.2 125.2 126.7 135.9 145.2 138.2 130.7 120.5 132.1 150.2 151.9 132.7 137.8 131.9 144.3
Pigs' 60.1 56.8 43.3 51.2 49.1 47.7 47.1 45.9 53.6 56.5 55.8 67.8 62.1 64.1 70.4I3eef and veal 448.9 414.7 437.1 500.9 573.7 595.3 559.6 529.9 557.0 678.6 771.5 771.8 765.1 790.8 836.9
Mutton and lamb 428.9 453.5 460.3 429.1 377.9 401.2 378.1 372.2 414.3 404.2 519.0 492.2 462.7 428.7 461.8
Poultry meat 804.0 825.1 781.6 767.4 682.2 669.2 630.3 650.9 662.4 668.1 693.6 710.5 634.7 644.9 681.6
Bacon, harn, salted pork . . . 664.7 726.3 684.1 712.5 675.0 686.0 661.6 667.0 717.5 782.0 759.7 868.0 818.6 720.2 791.3
Canned meat 877.0 373.6 820.8 848.1 883.5 901.8 937.1 907.4 878.0 924.3 951.21 020.21 01961 016.4 1 114.5
Milk, condensed and evaporated 310.2 317.6 330.3 311.2 307.9 308.8 307.4 299.8 306.2 328.1 336.3 333.7 314.4 299.5 305.5
Nfllk, powdered 375.4 374.8 429.0 375.6 355.1 401.8 363.5 336.5 298.8 305.2 385.9 378.3 382.2 300.7 339.7
Bidter 949.5 923.5 783.9 639.6 904.8 829.9 714.3 762.5 826.4 896.0 905.7 818.3 798.1 726.0 720.1
Cheese 678.7 736.9 708.5 639.0 739.3 721.8 719.3 701.7 709.6 763.9 841.3 867.0 878.8 876.6 930.3
Potatoes 48.4 58.8 51.8 59.4 57.3 56.1 52.3 72.7 62.6 57.0 68.0 75.2 70.9 58.6 72.6
Oilseed cake a d meal . 72.5 67.7 61.9 55.4 68.7 68.1 63.7 70.4 77.6 76.2 78.8 82.2 81.7 81.7 80.9
Coffee 1 077.1 1 051.0 1 025.2 922.8 749.1 723.4 684.2 655.6 646.9 839.8 811.1 774.4 702.1 725.3 703.6
Cocoa 813.5 580.8 562.9 844.0 738.8 593.4 474.3 454.0 486.1 502.4 378.7 402.0 544.5 608.0 776.5
Tea 1 383.41 215.5 1 191.0 1 170.61 144.5 1 168.01 144.6 1 102.8 1 110.9 1 089.2 1 050.9 1 004.2 990.9 915.8 831.0
VVine 141.7 155.1 170.3 207.2 176.2 177.6 182.2 173.6 202.3 203.7 212.0 211.8 253.6 257.7 278.0
Tobacco (unmanufactured) . .1 267.61 227.6 1 334.5 1 280.8 1 290.2 1 280.1 1 211.7 1 204.0 1 310.1 1 235.5 1 244.7 1 356.7 1 314.5 1 279.5 1325.3
Linseed 133.7 145.4 116.7 125.1 131.6 132.4 127.9 134.6 124.6 121.2 119.7 114.1 120.0 127.0 121.3
Linseed oil 205.3 313.6 245.6 250.7 212.5 246.8 254.1 229.7 200.7 208.2 201.4 139.0 174.2 188.4 215.9
Castor beans 96.9 134.7 182.0 117.4 110.4 134.1 123.9 106.9 111.1 114.3 106.0 106.9 119.9 124.6 123.7
Castor oil 206.2 288.8 279.5 273.0 238.2 282.2 280.1 263.4 249.4 240.9 205.1 238.7 311.7 328.9 251.9
Cotton 797.9 731.9 732.8 673.2 587.0 624.1 641.2 609.6 609.3 603.0 617.1 564.7 558.4 588.0 579.6
Jute) and Icenaf 189.1 183.8 208.5 193.0 174.8 220.2 291.0 194.7 199.5 161.1 215.6 223.9 225.7 202.6 198.0
Sisal 156.3 158.3 141.8 146.9 174.5 214.8 193.4 197.1 293.2 285.8 190.8 172.5 142.2 112.3 118.8
wool (greasy) 1 358.7 1 378.01 598.4 1 132.8 1 083.61 162.41 143.8 1 138.2 1 324.81 445.7 1 175.8 1 223.5 1 120.1 997.0 1 081.9
Rubber (natural) 698.2 627.5 596.5 516.0 659.4 743.0 548.1 524.8 503.5 462.4 445.8 436.6 363.0 342.0 368.6
Fishery products 1Fresh, chilled or frozen fish . 260.2 274.9 284.5 293.1 302.4 287.1 301.2 315.1 296.7 289.2 328.9 352.6 323.3 349.2 388.0
[Med, salted or smoked fish . 272.6 291.2 296.4 296.5 307.9 328.3 331.1 345.0 361.2 390.9 426.9 454.1 459.5 444.2 455.0
Crustacea and molluscs, fresh,frozen, dried, salted, etc. . . 469.8 536.7 647.0 670.3 667.4 634.3 684.2 758.1 845.8 796.0 891.6 989.51 007.21 116.8 1 181.0
Fish products and preparations.vvhether or not in airtight con-tainers 549.7 621.1 606.5 646.3 632.3 624.3 600.8 695.1 648.6 639.3 703.0 682.9 726.6 699.4 733.0
Crustacean and mollusc prod-ucts and preparations, whetheror not in airtight containers . 1 005.81 071.1 1 075.5 1 105.6 1 068.61 099.51 150.55 146.41 210.81 283.1 1 319.21 646.61 432.1 1 452.4 1 564.0
Oils and fats, crude or refined,of aquatic animal origin . . . 213.6 238.3 241.6 207.3 191.9 180.1 172.6 133.3 137.3 182.7 194.0 182.2 128.1 92.5 120.0
Meals, solubles and similar ani-mal feedstuffs of aquatic origin 144.0 145.7 136.9 133.3 134.0 92.6 86.8 103.8 107.9 109.9 125.3 144.6 117.8 107.6 121.0
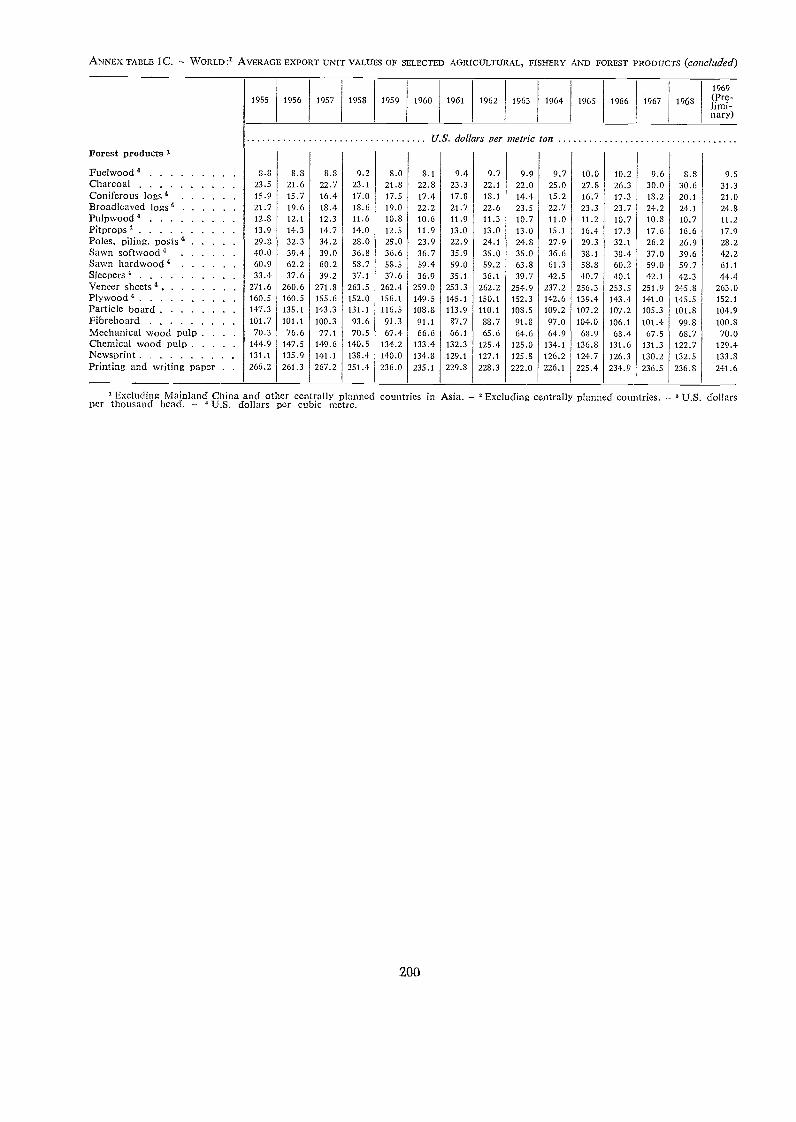
ANNEX TABLE 1C. - WORLD:1 AVERAGE EXPORT UNIT VALUES OF SELECTED AGRICULTURAL, FISHERY AND FOREST PRODUCTS (concluded)
200
' Excluding Mainland China and other centrally planned countries in Asia. - 2 Excluding centrally planned countries. - ' U.S. dollarsper thousand head. - U.S. dollars per cubic metre.
1955 1956 1957 1958 1959 1960 1961 1962 1963 1964 1965 1966 1967 1968
1969(Pre-limi-nary)
U S. dollars per metric tonForest products
Fuelwood 4 8.8 8.8 8.8 9.2 8.0 8.1 9.4 9.7 9.9 9.7 10.0 10.2 9.6 8.8 9.5Charcoal 23.5 21.6 22.7 23.1 21.8 22.8 23.3 22.1 22.0 25.0 27.8 26.3 30.0 30.6 31.3Coniferous logs 4 15.9 15.7 16.4 17.0 17.5 17.4 17.8 14.4 15.2 16.7 17.3 18.2 20.1 21.0Broadleaved logs" 21.7 19.6 18.4 18.6 19.0 22.2 21.7 22.6 23.5 22.7 23.3 23.7 24.2 24.1 24.8Pulpwood' 12.8 12.1 12.3 11.6 10.8 10.6 11.9 11.3 10.7 11.0 11.2 10.7 10.8 10.7 11.2Pitprops 13.9 14.3 14.7 14.0 12.5 11.9 13.0 13.0 13.0 15.1 16.4 17.3 17.6 16.6 17.9Poles. piling. Posts4 29.8 32.3 34.2 28.0 25.0 23.9 22.9 24.1 24.8 27.9 29.3 32.1 26.2 26.9 28.2Sawn softwood' 40.0 39.4 39.0 36.8 36.6 36.7 35.9 35.0 35.0 36.6 38.1 33.4 37.0 39.6 42.2Sawn hardwood 4 60.9 62.2 60.2 58.7 58.5 59.4 59.0 59.2 63.8 61.3 58.8 60.2 59.0 59.7 61.1Sleepers 4 33.4 37.6 39.2 37.1 37.6 36.9 35.1 36.1 39.7 42.5 40.7 40.1 42.1 42.3 44.4Veneer sheets 4 271.6 260.6 271.8 263.5 262.4 259.0 253.3 262.2 254.9 237.2 256.3 253.5 251.9 245.8 263.0PlyWOOd 4 160.5 160.5 155.6 152.0 156.1 149.5 145.1 150.1 152.3 142.6 139.4 143.4 141.0 145.5 152.1Particle board 147.3 135.1 143.3 131.1 116.5 108.8 113.9 110.1 108.5 109.2 107.2 107.2 105.3 101.8 104.9Fibreboard 101.7 101.1 100.3 93.6 91.3 91.1 87.7 88.7 91.8 97.0 104.0 106.1 101.4 99.8 100.8Mechanical wood pulp . 70.3 76.6 77.1 70.5 67.4 66.6 66.1 65.6 64.6 64.9 68.9 68.4 67.5 68.7 70.0Chemical wood pub) 144.9 147.5 149.6 140.5 134.2 133.4 132.3 125.4 125.0 134.1 136.8 131.6 131.3 122.7 129.4Newsprint 131.1 135.9 141.1 138.4 140.0 134.8 129.1 127.1 125.8 126.2 124.7 126.3 130.2 132.5 133.8Printing and writing PaPer 266.2 261.3 267.2 251.4 236.0 235.1 229.8 228.3 222.0 226.1 225.4 234.9 236.5 236.8 241.6
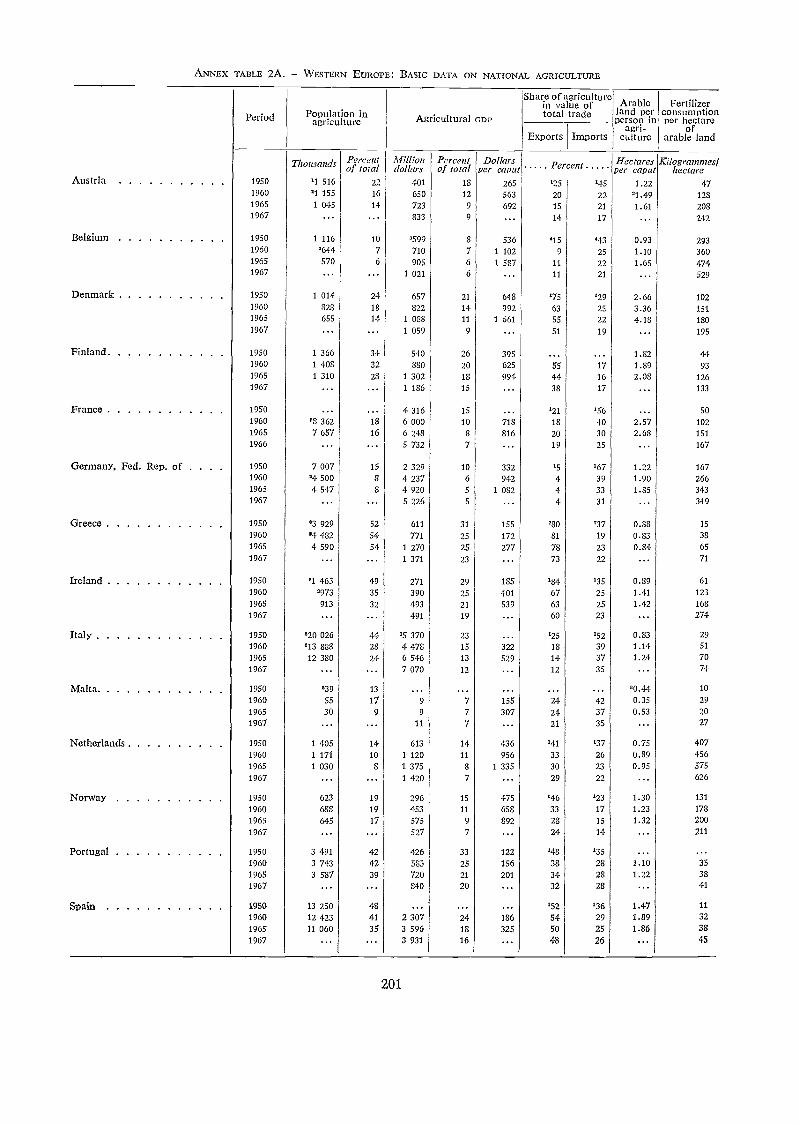
ANNEX TABLE 2A. - WESTERN EUROPE: BASIC DATA ON NATIONAL AGRICULTURE
201
Period Population inagriculture Agricultural GDP
Share of agriculturein va ue ortotal trade
Arableland perperson in
agri-culture
Fertilizerconsumptionper hectare
ofarable landExports Imports
Austria 1950
Lriousands
'I 516
Percentof total
22
Milliondollars
401
I'ercentof total
18
Dollarsper caput
265
P ercent
'25 '45
HectaresPer caput
1.22
Kilogrammes,hectare
471960 '1 155 16 650 12 563 20 22 '1.49 1231965 1 045 14 723 9 692 15 21 1.61 2081967 ... ... 833 9 14 17 ... 242
Belgium 1950 1 116 10 '599 8 536 '15 '43 0.93 2931960 '644 7 710 7 1 102 9 25 1.10 3601965 570 6 905 6 1 587 11 22 1.65 4741967 ... ... 1 021 6 11 21 ... 529
E)enrnark 1950 1 014 24 657 21 648 '75 '29 2.66 1021960 823 13 822 14 992 63 25 3.36 1511965 655 14 1 088 11 1 661 55 22 4.18 1801967 ... ... I 059 9 ... 51 19 ... 195
Finland 19501960
I 3661 408
3432
540380
26
20
395
625
..,55
...17
1.821.89
4493
1965 1 310 28 1 302 18 994 44 16 2.08 1261967 ... 1 186 15 ... 38 17 ... 133
France 1950 ... ... 4 316 15 '21 156 ... 501960 '8 362 18 6 000 10 718 18 40 2.57 1021965 7 657 16 6 248 8 816 20 30 2.68 151
1966 ... ... 5 732 7 ... 19 25 ... 167
Elermany. Fed. Rep. of . . . 1950 7 007 15 2 329 10 332 15 '67 1.22 1671960 '4500 S 4 237 6 942 4 39 1.90 2661965 4 547 8 4 920 5 I 032 4 33 1.35 3431967 ... ... 5 226 5 ... 4 31 ... 349
3reece 1950 °3 929 52 611 31 155 '80 737 0.88 15
1960 '4 482 54 771 25 172 81 19 0.83 38
1965 4 590 54 1 270 25 277 78 23 0.84 651967 ... 1 371 23 ... 73 22 ... 71
reland 1950 °I 463 49 271 29 155 '84 135 0.89 61
1960 '973 35 390 25 401 67 25 1.41 123
1965 913 32 493 21 539 63 25 1.42 1681967 ... ... 491 19 ... 60 23 ... 274
taly 1950 '20 026 44 '5 370 23 ... '25 '52 0.83 291960 .13 888 28 4 478 15 322 18 39 1.14 51
1965 12 380 24 6 546 13 529 14 37 1.24 701967 ... 7 070 12 ... 12 35 ... 74
vlalta 1950 °39 13 ... ... ... "' '" '0.44 10
1960 55 17 9 7 155 24 42 0.35 291965 30 9 9 7 307 24 37 0.53 201967 ... ... 11 7 ... 21 35 ... 27
getherlands 1950 I 405 14 613 14 436 '41 '37 0.75 4071960 1 171 10 I 120 11 956 33 26 0.89 456
1965 1030 g 1375 8 1335 30 23 0.95 575
1967 ... ... 1 420 7 ... 29 22 ... 626
gorway 1950 623 19 296 15 475 '46 '23 1.30 131
1960 688 19 453 11 658 33 17 1.23 178
1965 645 17 575 9 892 28 15 1.32 2001967 ... ... 527 7 ... 24 14 ... 211
'ortugal 1950 3 491 42 426 33 122 148 '35 ... "'1960 3 743 42 585 25 156 38 28 1.10 35
1965 3 587 39 720 21 201 34 28 1.22 38
1967 ... ... 840 20 ... 32 28 ... 41
ain 1950 13 250 48 ... ... ... '52 '36 1.47 11
1960 12 423 41 2 307 24 186 54 29 1.89 32
1965 11 060 35 3 596 18 325 50 25 1.86 38
1967 ... ... 3 931 16 ... 48 26 ... 45
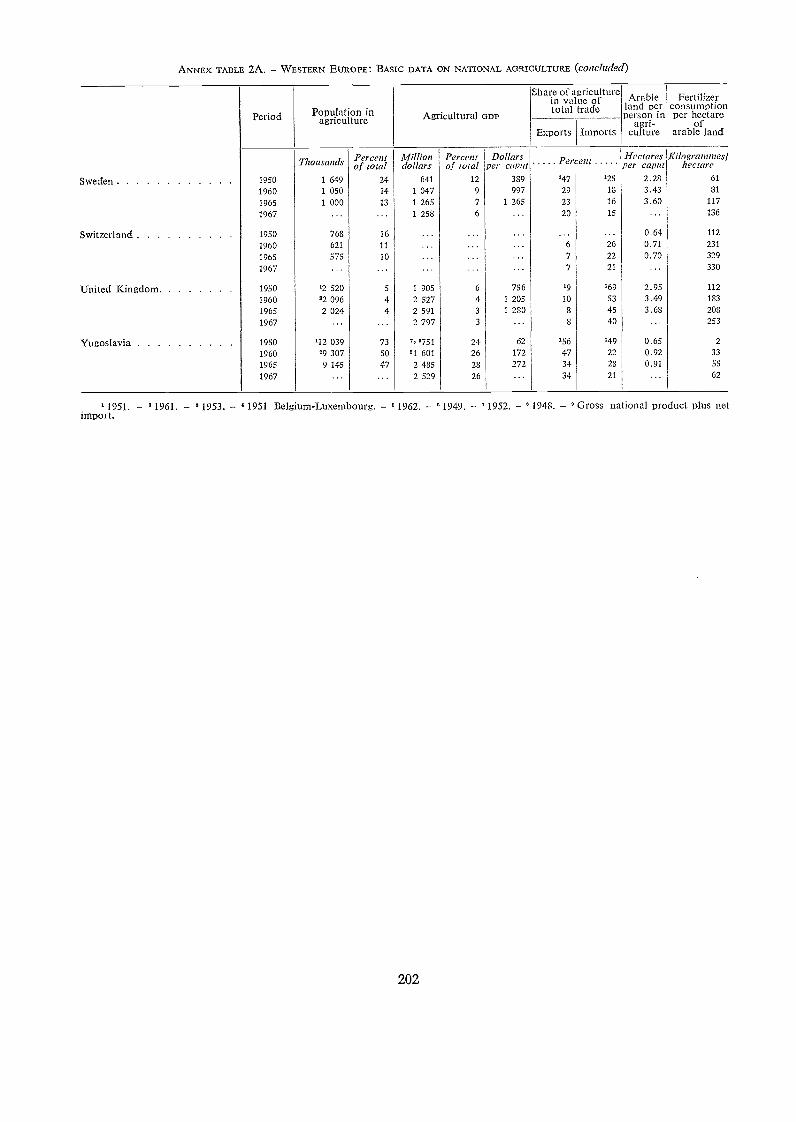
ANNEX TABLE 2A. WESTERN EUROPE: BASIC DATA ON NATIONAL AGRICULTURE (concluded)
71951. ' 1961. ° 1953. 1951 Belgium-Luxembourg. 1962. 1949. 7 1952. 1948. Gross national product plus netimport.
202
Period Population inagriculture Agricultural GDP
Share of agriculturein va ue oftotal trade
Arableland perperson in
agri-culture
Fertilizerconsumptionper hectare
orarable landExports Imports
Thousands Percentof total
Milliondollars
Percentof total
Dollarsper canal Percent Hectares
per capa!K logranunesl
hectare
Sweden 1950 1 649 24 641 12 389 '47 '25 2.28 61
1960 1 050 14 1 047 9 997 29 13 3.43 81
1965 1 000 13 1 265 7 1 265 23 16 3.60 117
1967 ... ... 1 258 6 ... 20 15 ... 136
Switzerland 1950 768 16 ... 0.64 112
1960 621 11 ... 6 26 0.71 231
1965 575 10 ... ... 7 22 0.70 329
1967 ... ... ... ... . 7 21 ... 330
United Kingdom 1950 '2 520 5 1 905 6 756 ,.9 '69 2.95 112
1960 '2 096 4 2 527 4 1 205 10 53 3.49 183
1965 2 024 4 2 591 3 1 280 3 45 3.68 208
1967 ... ... 2 797 3 ... 8 40 253
Yugoslavia 1950 '12 039 73 "'751 24 62 "56 '49 0.65 2
1960 '9 307 50 '1 601 26 172 47 22 0.92 33
1965 9 145 47 2 485 28 272 34 23 0.91 55
1967 ... ... 2 529 26 ... 34 21 ... 62
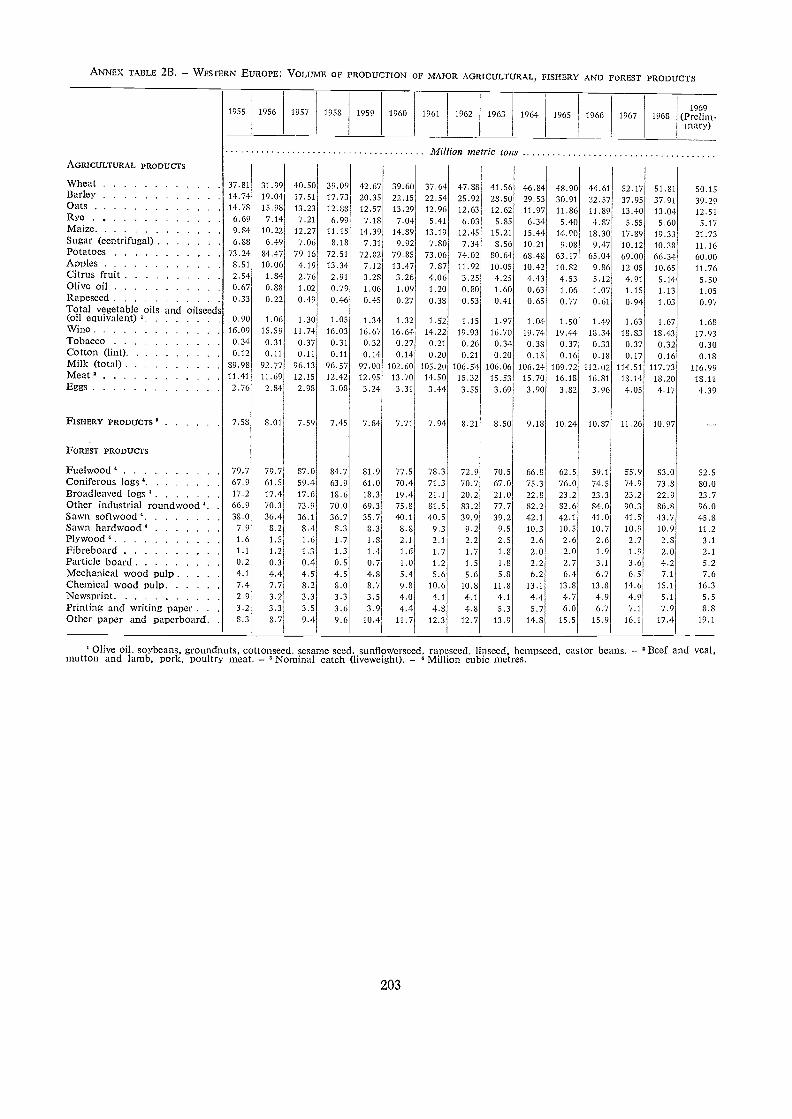
ANNEX TABLE 2B. - WESTERN EUROPE: VOLUME OF PRODUCTION OF MAJOR AGRICULTURAL, FISHERY ANO FOREST PRODUCTS
203
' Olive oil, soybeans, groundnuts, cottonseed, sesame seed, sunflowerseed, rapeseed, l'nseed, hempseed, castor beans. - Beef and veal,mutton and lamb, pork, poultry meat. - Nominal catch (liveweight). - " Million cubic metres.
1955 1956 1957 1958 1959 1960 1961 1962 1963 1964 1965 1966 1967 19681969
(Prelim-inary)
Mil ion metric tor sAGRICULTURAL PRODUCTS
WheatBarleyOatsRyeMaize
37 8114 7414 78
6 699 84
31.9919.0415.987.14
10.22
40.5017.5113.23
7.2112.27
39.0917.7312.886.99
11.15
42.6720.3512.577.18
14.39
39.6022.1513.297.04
14.89
37.6422.5412.965.41
13.19
47.8825.9212.636.03
12.45
41.5628.5012.625.85
15.21
46.8429.5311.976.34
15.44
48.9030.9111.865.40
14.90
44.6132.5711.894.87
18.30
52.1737.9513.405.55
17.89
51.8137.9113.045.60
19.33
50.1539.2912.515.17
21.73Sugar (centrifugal) 6 88 6.49 7.06 8.18 7.31 9.92 7.80 7.34 8.56 10.21 9.08 9.47 10.12 10.38 11.16Potatoes 73 24 84.47 79.16 72.51 72.82 79.85 73.06 74.02 80.64 68.48 63.17 65.04 69.00 66.34 60.00Apples 8 51 10.06 4.19 13.34 7.12 13.47 7.87 11.92 10.05 10.42 10.82 9.86 12.05 10.65 11.76Citrus fruit 2 54 1.84 2.76 2.91 3.28 3.26 4.06 3.25 4.25 4.43 4.53 5.12 4.91 5.14 5.50Olive oil 0 67 0.88 1.02 0.79 1.06 1.09 1.20 0.80 1.60 0.63 1.06 1.07 1.15 1.13 1.05Rapeseed 0 33 0.22 0.49 0.46 0.45 0.27 0.38 0.53 0.41 0.65 0.77 0.61 0.94 1.03 0.97Total vegetable oils and oilseeds(oil equivalent) 090 1.06 1.30 1.05 1.34 1.32 1.52 1.15 1.97 1.04 1.50 1.19 1.63 1.67 1.68Wine 16 09 15.59 11.74 16.03 16.67 16.64 14.22 19.93 16.70 19.74 19.44 18.34 18.83 18.43 17.93Tobacco 0 34 0.31 0.37 0.31 0.32 0.27 0.21 0.26 0.34 0.38 0.37 0.33 0.37 0.32 0.30Cotton (lint) 0.12 0.11 0.11 0.11 0.14 0.14 0.20 0.21 0.20 0.15 0.16 0.18 0.17 0.16 0.18Milk (total) 89 98 92.77 96.13 96.57 97.00 102.60 105.20 106.54 106.06 106.24 109.72 112.02 114.51 117.73 116.99Meat ' 11 41 11.69 12.15 12.42 12.95 13.70 14.50 15.32 15.53 15.70 16.18 16.81 18.14 18.20 18.11Eggs 2 76 2.84 2.98 3.08 3.24 3.31 3.44 3.55 3.69 3.90 3.82 3.96 4.05 4.17 4.39
FISHERY PRODUCTS 7.58 8.01 7.59 7.45 7.84 7.71 7.94 8.21 8.50 9.18 10.24 10.87 11.26 10.97
FOREST PRODUCTS
Fuelwood 79.7 79.7 87.0 84.7 81.9 77.5 78.3 72.9 70.5 66.8 62.5 59.1 55.9 53.0 52.5Coniferous logs 67.9 61.5 59.4 63.9 61.0 70.4 71.3 70.7 67.0 75.3 76.0 74.5 74.9 73.8 80.0Broadleaved logs 17.2 17.4 17.6 18.6 18.3 19.4 21.1 20.2 21.0 22.8 23.2 23.3 23.2 22.9 23.7Other industrial roundwood 66.9 70.3 73.9 70.0 69.3 75.8 31.5 83.2 77.7 82.2 82.6 84.0 90.3 86.8 96.0Sawn softwood 38.0 36.4 36.1 36.7 35.7 40.1 40.5 39.9 39.2 42.1 42.1 41.0 41.5 43.7 45.8Sawn hardwood 7.9 8.2 8.4 8.3 8.3 8.8 9.3 9.2 9.5 10.3 10.5 10.7 10.9 10.9 11.2Plywood ° 1.6 1.5 1.6 1.7 1.8 2.1 2.1 2.2 2.5 2.6 2.6 2.6 2.7 2.8 3.1Fibreboard 1.1 1.2 1.3 1.3 1.4 1.6 1.7 1.7 1.8 2.0 2.0 1.9 1.9 2.0 2.1Particle board 0.2 0.3 0.4 0.5 0.7 1.0 1.2 1.5 1.8 2.2 2.7 3.1 3.6 4.2 5.2Mechanical wood pulp 4.1 4.4 4.5 4.5 4.8 5.4 5.6 5.6 5.8 6.2 6.4 6.7 6.5 7.1 7.6Chemical wood pulp 7.4 7.7 8.2 8.0 8.7 9.8 10.6 10.8 11.8 13.1 13.8 13.8 14.6 15.1 16.3Newsprint. 2.9 3.2 3.3 3.3 3.5 4.0 4.1 4.1 4.1 4.4 4.7 4.9 4.9 5.1 5.5Printing and writing paper . . 3.2 3.3 3.5 3.6 3.9 4.4 4.8 4.8 5.3 5.7 6.0 6.7 7.1 7.9 8.8Other paper and paperboard. 8.3 8.7 9.4 9.6 10.4 11.7 12.3 12.7 13.9 14.8 15.5 15.9 16.1 17.4 19.1
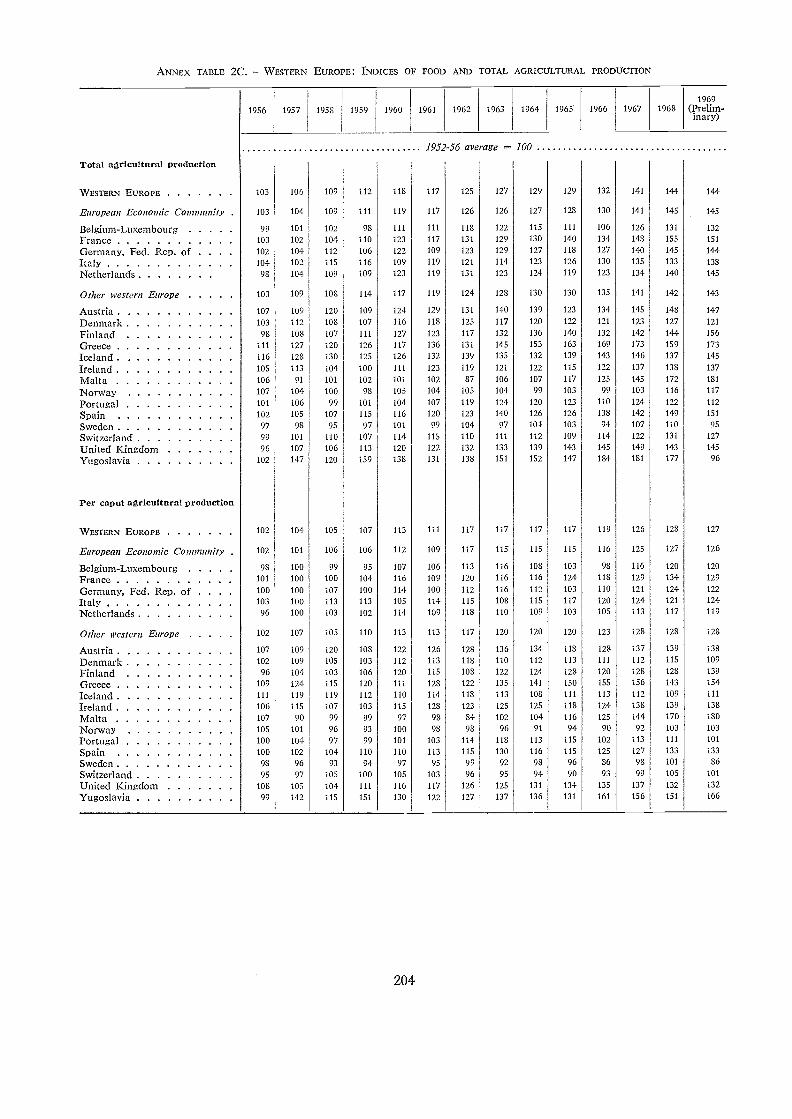
ANNEX TABLE 2C. WESTERN EUROPE: INDICES OF FOOD AND TOTAL AGRICULTURAL PRODUCTION
204
1956 1957 1958 1959 1960 1961 1962 1963 1964 1965 1966 1967 19681969
(Prelim-inary)
1952-56 average 100
Total agricultural production
WESTERN EUROPE 103 106 109 112 118 117 125 127 129 129 132 141 144 144
European Econonzic Comnutnity 103 104 109 111 119 117 126 126 127 123 130 141 145 145
Belgium-Luxembourg 99 101 102 98 111 111 113 122 115 111 106 126 131 132
France 103 102 104 110 123 117 131 129 130 140 134 148 155 151
Germany, Fed. Rep. of 102 104 112 106 122 109 123 129 127 118 127 140 145 144
Italy 104 102 115 116 109 119 121 114 123 126 130 135 133 138
Netherlands 98 104 109 109 123 119 131 123 124 119 123 134 140 145
Other western Europe 103 109 108 114 117 119 124 123 130 130 135 141 142 143
Austria 107 109 120 109 124 129 131 140 139 123 134 145 148 147
Denmark 103 112 108 107 116 118 125 117 120 122 121 123 127 121
Finland 98 108 107 111 127 123 117 132 136 140 132 142 144 156
Greece 111 127 120 126 117 136 131 145 153 163 169 173 159 173
Iceland . 116 123 130 125 126 132 139 135 132 139 143 146 137 145
Ireland 105 113 104 100 111 123 119 121 122 115 122 137 138 137
Malta 106 91 101 102 101 102 87 106 107 117 125 145 172 181
Norway 107 104 100 98 105 104 105 104 99 103 99 103 116 117
Portugal 101 106 99 101 104 107 119 124 120 123 110 124 122 112
Spain 102 105 107 115 116 120 123 140 126 126 138 142 149 151
Sweden 97 98 95 97 101 99 104 97 101 103 94 107 110 95
Switzerland 99 101 110 107 114 115 110 111 112 109 114 122 131 127
United Kingdom 96 107 106 113 120 122 132 133 139 143 145 149 143 145
Yugoslavh 102 147 120 159 138 131 133 151 152 147 184 181 177 96
Per caput agricultural production
WESTERN EUROPE 102 104 105 107 113 111 117 117 117 117 119 126 128 127
European Economic Community 102 101 106 106 112 109 117 115 115 115 116 125 127 126
Belgium-Luxembourg 98 100 99 95 107 106 113 116 108 103 98 116 120 120
France 101 100 100 104 116 109 120 116 116 124 113 129 134 129
Germany, Fed. Rep. of 100 100 107 100 114 100 112 116 112 103 110 121 124 122
Italy 103 100 113 113 105 114 115 108 115 117 120 124 121 124
Netherlands 96 100 103 102 114 109 113 110 109 103 105 113 117 119
Other western Europe 102 107 105 110 113 113 117 120 120 120 123 128 128 128
Austria 107 109 120 108 122 126 123 136 134 113 123 137 139 138
Denmark 102 109 105 103 112 113 118 110 112 113 111 112 115 109
Finland 96 104 103 106 120 115 108 122 124 128 120 128 128 139
Greece 109 124 115 120 111 128 122 135 141 150 155 156 143 154
Iceland 111 119 119 112 110 114 118 113 103 111 113 112 109 111
Ireland 106 115 107 103 115 128 123 125 125 118 124 138 139 138
Malta 107 90 99 99 97 98 84 102 104 116 125 144 170 180
Norway 105 101 96 93 100 98 98 96 91 94 90 92 103 103
Portugal 100 104 97 99 101 103 114 118 113 115 102 113 111 101
Spain 100 102 104 110 110 113 115 130 116 115 125 127 133 133
Sweden 98 96 93 94 97 95 99 92 98 96 86 98 101 86
Switzerland 95 97 105 100 105 103 96 95 94 90 93 99 105 101
United Kingdom 103 105 104 111 116 117 126 125 131 134 135 137 132 132
Yugoslavia 99 142 115 151 130 122 127 137 136 131 161 156 151 166
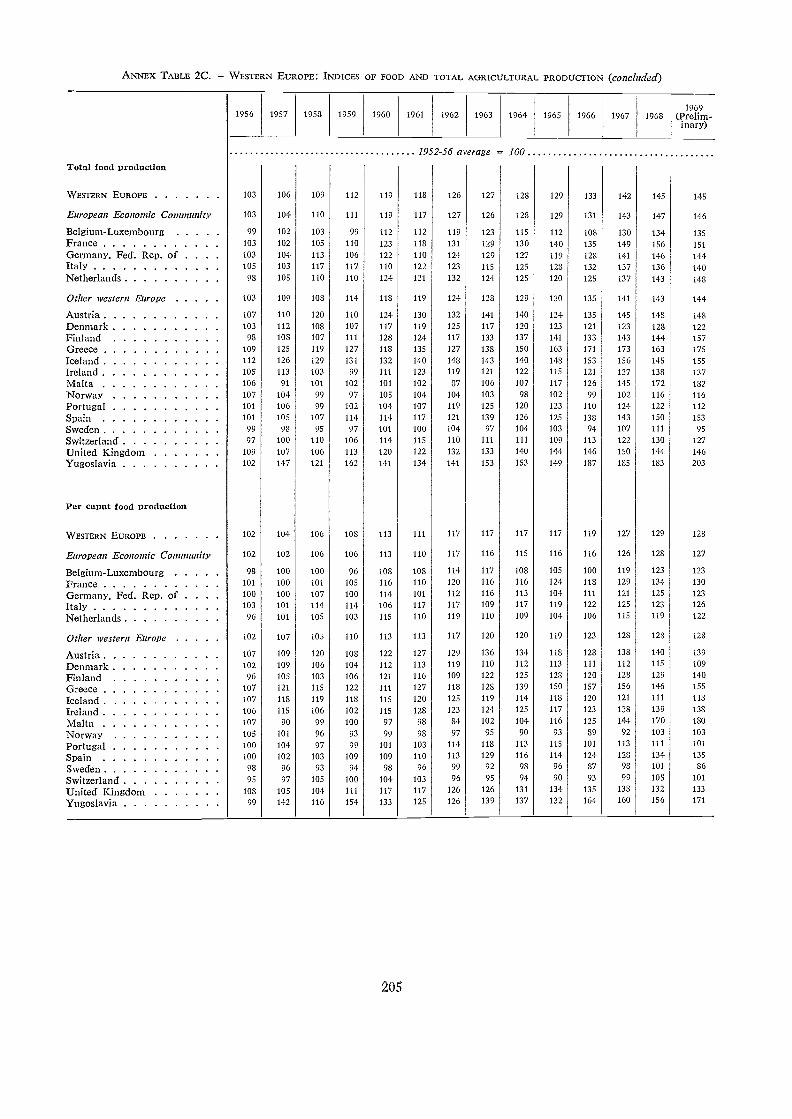
ANNEX TAI3LE 2C. WESTERN EUROPE: INDICES OF FOOD AND TOTAL AGRICULTURAL PRODUCTION (concl tded)
1956 1957 1958 1959 1960 1961 1962 1963 1964 1965 1966 1967 19681969
(Prelim-inary)
1952-56 average 100
Total food production
205
WESTERN EUROPE 103 106 109 112 119 113 126 127 123 129 133 142 145 145
European Economic Community 103 104 110 111 119 117 127 126 123 129 131 143 147 146
Belgium-Luxembourg 99 102 103 99 112 112 119 123 115 112 108 130 134 135
France 103 102 105 110 123 118 131 129 130 140 135 149 156 151
Germany, Fed. Rep. of 103 104 113 106 122 110 124 129 127 119 128 141 146 144Italy 105 103 117 117 110 122 123 115 125 128 132 137 136 140Netherlands 93 105 110 110 124 121 132 124 125 120 125 137 143 148
Other western Europe 103 109 108 114 118 119 124 128 129 130 135 141 143 144
Austria 107 110 120 110 124 130 132 141 140 124 135 145 148 148
Denmark 103 112 103 107 117 119 125 117 120 123 121 123 128 122
Finland 98 108 107 111 128 124 117 133 137 141 133 143 144 157
Greece 109 125 119 127 118 135 127 138 150 163 171 173 163 175
Iceland 112 126 129 131 132 140 148 143 140 148 153 156 145 155
Ireland 105 113 103 99 111 123 119 121 122 115 121 137 138 137
Malta 106 91 101 102 101 102 87 106 107 117 126 145 172 182
Norway 107 104 99 97 105 104 104 103 98 102 99 102 116 116
Portugal 101 106 99 102 104 107 119 125 120 123 110 124 122 112
Spain 101 105 107 114 114. 117 121 139 126 125 138 143 150 153
Sweden 99 98 95 97 101 100 104 97 101 103 94 107 111 95
Switzerland 97 100 110 106 114 115 110 111 111 109 113 122 130 127
United Kingdom 109 107 106 113 120 122 132 133 140 144 146 150 144 146
Yugoslavia 102 147 121 162 141 134 141 153 153 149 187 185 183 203
Per caput food production
WESTERN EUROPE 102 104 106 108 113 111 117 117 117 117 119 127 129 128
European Economic Community 102 102 106 106 113 110 117 116 115 116 116 126 128 127
Belgium-Luxembourg 98 100 100 96 108 108 114 117 108 105 100 119 123 123
France 101 100 101 105 116 110 120 116 116 124 118 129 134 130
Germany. Fcd. Rep. of 100 100 107 100 114 101 112 116 113 104 111 121 125 123
Italy 103 101 114 114 106 117 117 109 117 119 122 125 123 126
Netherlands 96 101 105 103 115 110 119 110 109 104 106 115 119 122
Other western Europe 102 107 105 110 113 113 117 120 120 119 123 128 128 128
Austria 107 109 120 108 122 127 129 136 134 118 128 138 140 139
Denmark 102 109 106 104 112 113 119 110 112 113 111 112 115 109
Finland 96 105 103 106 121 116 109 122 125 120 120 128 129 140
Greece 107 121 115 122 111 127 118 128 139 150 157 156 146 155
Iceland 107 118 119 118 115 120 125 119 114 118 120 121 111 113
Ireland 106 115 106 102 115 128 123 124 125 117 123 138 139 138
Malta 107 90 99 100 97 98 84 102 104 116 125 144 170 180
Norway 105 101 96 93 99 98 97 95 90 93 39 92 103 103
Portugal 100 104 97 99 101 103 114 113 113 115 101 113 111 101
Spain 100 102 103 109 109 110 113 129 116 114 124 128 134 135
Sweden 98 96 93 94 93 96 99 92 93 96 87 98 101 86
Switzerland 95 97 105 100 104 103 96 95 94 90 93 99 105 101
United Kingdom 108 105 104 111 117 117 126 126 131 134 135 138 132 133
Yugoslavia 99 142 116 154 133 125 126 139 137 132 164 160 156 171
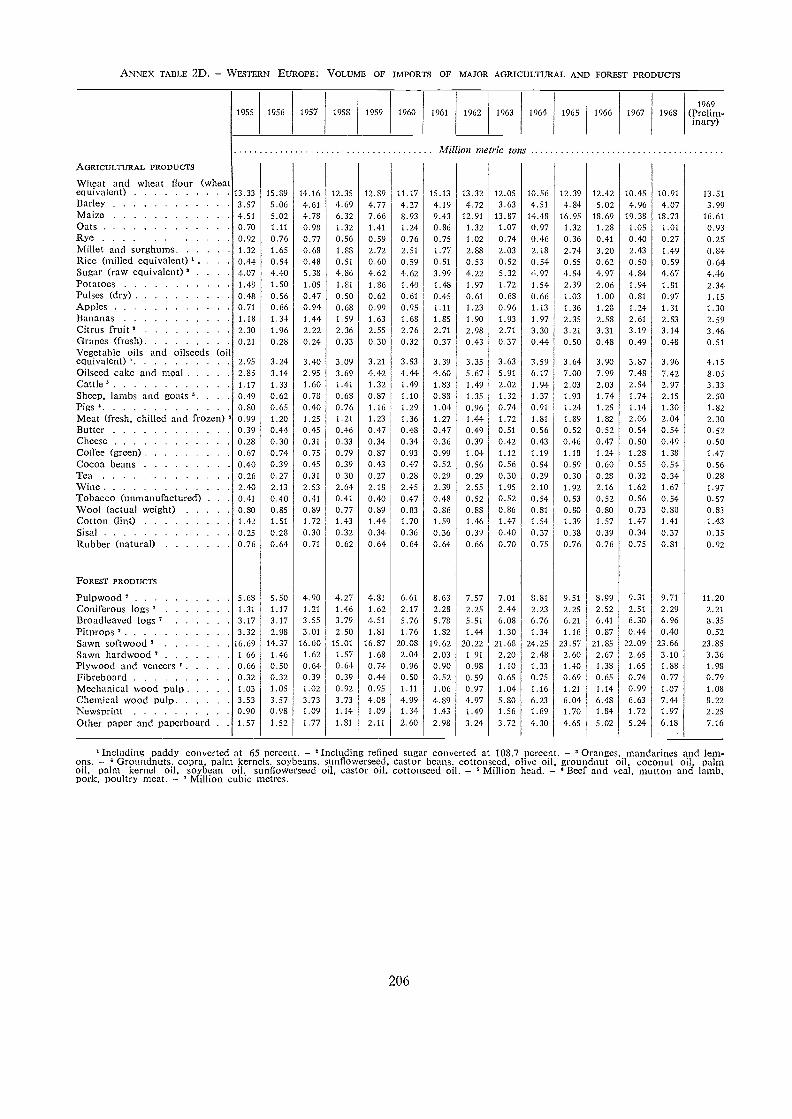
ANNEX TABLE 2D. - WESTERN EUROPE: VOLUME OF IMPORTS OF MAJOR AGRICUI,TUTtAL AND FOREST PRODUCTS
206
'Including paddy converted at 65 percent. - 'Including refined sugar converted at 108.7 percent. - Oranges, mandarines and lem-ons. - s Groundnuts, copra, palm kernels, soybeans, sunflowerseed, castor beans, cottonseed, olive oil, groundnut oil, coconut oil, palmoil, palm kernel oil, soybean oil. sunflowerseed oil, castor oil, cottonseed oil. - s Million head. - ' Beef and veal, mutton and lamb,pork, poultry meat. - ' Million cubic metres.
1955 1956 1957 1958 1959 1960 1961 1962 1963 1964 1965 1966 1967 19681969
(Prelint-Mary)
Million metric tons .
AGRICUURIRAL PRODUCTS
Wheat and wheat flour (wheatequivalent) 13.33 15.89 14.16 12.35 12.89 11.17 15.13 13.32 12.05 10.56 12.39 12.42 10.45 10.91 13.51Barley 3.57 5.06 4.61 4.69 4.77 4.27 4.19 4.72 3.63 4.51 4.84 5.02 4.96 4.07 3.99Maize 4.51 5.02 4.78 6.32 7.66 3.93 9.43 12.91 13.87 14.48 16.95 18.69 19.38 18.73 16.61Oats 0.70 1.11 0.98 1.32 1.41 1.24 0.86 1.32 1.07 0.97 1.32 1.28 1.05 1.01 0.93Rye 0.92 0.76 0.77 0.56 0.59 0.76 0.75 1.02 0.74 0.46 0.36 0.41 0.40 0.27 0.25Millet and sorghums 1.32 1.65 0.68 1.88 2.72 2.51 1.77 2.88 2.03 2.18 2.74 3.20 2.43 1.49 0.84Rice (milled equivalent) . . . 0.44 0.54 0.48 0.51 0.60 0.59 0.51 0.53 0.52 0.54 0.55 0.62 0.50 0.59 0.64Sugar (raw equivalent) 4.07 4.40 5.38 4.86 4.62 4.62 3.99 4.22 5.32 4.97 4.54 4.97 4.84 4.67 4.46Potatoes 1.49 1.50 1.05 1.81 1.86 1.40 1.48 1.97 1.72 1.54 2.39 2.06 1.94 1.81 2.34Pulses (dry) 0 48 0.56 0.47 0.50 0.62 0.61 0.45 0.61 0.68 0.66 1.03 1.00 0.81 0.97 1.15Apples 0 71 0.66 0.94 0.68 0.99 0.95 1.11 1.23 0.96 1.13 1.36 1.28 1.24 1.31 1.30Bananas 1.18 1.34 1.44 1.59 1.63 1.68 1.85 1.90 1.93 1.97 2.35 2.58 2.61 2.53 2.59Citrus fruit 2.30 1.96 2.22 2.36 2.55 2.76 2.71 2.98 2.71 3.30 3.21 3.31 3.19 3.14 3.46Grapes (fresh) 0.21 0.28 0.24 0.33 0.30 0.32 0.37 0.43 0.37 0.44 0.50 0.48 0.49 0.48 0.51Vegetable oils and oilseeds (oilequivalent) 2.95 3.24 3.40 3.09 3.21 3.53 3.39 3.35 3.63 3.59 3.64 3.90 3.87 3.96 4.15Oilseed cake and meal 2 85 3.14 2.95 3.69 4.42 4.44 4.60 5.67 5.91 6.17 7.00 7.99 7.48 7.42 8.05Cattle s 1.17 1.33 1.60 1.41 1.32 1.49 1.83 1.49 2.02 1.94 2.03 2.03 2.54 2.97 3.33Sheep, lambs and goats s. 0.49 0.62 0.78 0.68 0.87 1.10 0.88 1.35 1.32 1.37 1.93 1.74 1.74 2.15 2.50Pigs 0.80 0.65 0.40 0.76 1.16 1.29 1.04 0.96 0.74 0.91 1.24 1.25 1.14 1.30 1.82Meat (fresh, chilled and frozen) 0.99 1.20 1.25 1.21 1.23 1.36 1.27 1.44 1.72 1.81 1.89 1.82 2.06 2.04 2.30Butter 0.39 0.44 0.45 0.46 0.47 0.48 0.47 0.49 0.51 0.56 0.52 0.52 0.54 0.54 0.52Cheese 0 28 0.30 0.31 0.33 0.34 0.34 0.36 0.39 0.42 0.43 0.46 0.47 0.50 0.49 0.50coffee (green) 0 67 0.74 0.75 0.79 0.87 0.93 0.99 1.04 1.12 1.19 1.18 1.24 1.28 1.38 1.47Cocoa beans 0.40 0.39 0.45 0.39 0.43 0.47 0.52 0.56 0.56 0.54 0.59 0.60 0.55 0.54 0.56Tea 0.26 0.27 0.31 0.30 0.27 0.28 0.29 0.29 0.30 0.29 0.30 0.28 0.32 0.34 0.28Wine 2 40 2.13 2.53 2.64 2.18 2.45 2.39 2.55 1.95 2.10 1.92 2.16 1.62 1.67 1.97Tobacco (unmanufactured) . . 0.41 0.40 0.41 0.41 0.40 0.47 0.48 0.52 0.52 0.54 0.53 0.52 0.56 0.54 0.57Wool (actual weight) 0.80 0.85 0.89 0.77 0.89 0.83 0.86 0.88 0.86 0.81 0.80 0.80 0.73 0.80 0.83Cotton (lint) 1.42 1.51 1.72 1.43 1.44 1.70 1.59 1.46 1.47 1.54 1.39 1.57 1.47 1.41 1.43Sisal 0 25 0.28 0.30 0.32 0.34 0.36 0.36 0.39 0.40 0.37 0.38 0.39 0.34 0.37 0.35Rubber (natural) 0.76 0.64 0.71 0.62 0.64 0.64 0.64 0.66 0.70 0.75 0.76 0.76 0.75 0.81 0.92
FOREST PRODUCTS
Pulpwood 5 68 5.50 4.90 4.27 4.81 6.61 8.63 7.57 7.01 8.81 9.51 8.99 9.31 9.71 11.20Coniferous logs 1.31 1.17 1.21 1.46 1.62 2.17 2.28 2.25 2.44 2.23 2.25 2.52 2.51 2.29 2.21Broadleaved logs 3.17 3.17 3.55 3.79 4..51 5.76 5.78 5.51 6.08 6.76 6.21 6.41 6.30 6.96 8.35Pitprops 3 32 2.98 3.01 2.50 1.81 1.76 1.82 1.44 1.30 1.34 1.16 0.87 0.44 0.40 0.52Sawn softwood 16.69 14.37 16.00 15.01 16.87 20.0S 19.62 20.22 21.68 24.25 23.57 21.85 22.09 23.66 23.85Sawn hardwood 1.66 1.46 1.62 1.57 1.68 2.04 2.03 1.91 2.20 2.48 2.60 2.67 2.65 3.10 3.36Plywood and veneers 0.66 0.50 0.64 0.64 0.74 0.96 0.90 0.98 1.10 1.33 1.40 1.38 1.65 1.88 1.98Fibreboard 0.32 0.32 0.39 0.39 0.44 0.50 0.52 0.59 0.65 0.75 0.69 0.65 0.74 0.77 0.79Mechanical wood pulp 1 03 1.05 1.02 0.92 0.95 1.11 1.06 0.97 1.04 1.16 1.21 1.14 0.99 1.07 1.08Chemical wood pulp 3.53 3.57 3.73 3.73 4.08 4.99 4.89 4.97 5.80 6.23 6.04 6.48 6.63 7.44 8.22Newsprint 0.90 0.98 1.09 1.14 1.09 1.34 1.43 1.49 1.56 1.69 1.70 1.84 1.72 1.97 2.25Other paper and paperboard 1.57 1.52 1.77 1.81 2.11 2.60 2.98 3.24 3.72 4.30 4.65 5.02 5.24 6.18 7.16

ANNEX TABLE 2E. - WESTERN EUROPE: VOLUME OF EXPORTS OF MAJOR AGRICULTRAL, FISHERY AND FOREST PRODUCTS
207
Including refined sugar converted at 108.7 Tierce it. - Oranges, mandarines a id lemons. - 3 Linseed, sunflowerseed, olive oil, ground-nut oil, coconut oil, palm oil, palm kernel oil, soybean oil, sunflowerseed oil, castor oil, cottonseed oil, linseed oil. - Million head. -
Beef and veal, mutton and lamb, pork, and poultry meat. - ' Million cubic metres.
1955 1956 1957 1958 1959 1960 1961 1962 1963 1964 1965 1966 1967 19681969
(Prelim-inary)
Million metric tons
AGRICULTURAL PRODUCTS
Wheat and wheat flour (wheat equivalent) 3.40 2.30 3.09 3.88 3.78 3.37 3.19 3.69 5.07 5.27 6.99 6.43 5.73 8.47 10.88Barley 0.40 0.99 1.96 0.76 0.64 1.05 2.51 1.69 2.29 3.16 2.63 3.37 4.08 4.20 4.09Maize 0.12 0.13 0.11 0.61 0.37 0.81 1.09 0.34 0.94 1.27 1.89 2.15 2.77 2.52 3.23Rye 0.24 0.32 0.14 0.09 0.21 0.20 0.31 0.18 0.16 0.05 0.05 0.06 0.05 0.09 0.14Sugar (raw equivalent) 3 1.81 1.56 1.72 1.37 1.34 1.57 1.47 1.26 1.59 1.45 1.54 1.27 1.11 1.60 1.39Potatoes 1.78 1.64 1.35 2.01 1.30 1.58 1.75 1.83 1.64 1.70 2.26 1.98 1.88 1.85 2.37Pulses (dry) 016 0.18 0.17 0.21 0.19 0.17 0.19 0.22 0.17 0.15 0.17 0.19 0.24 0.28 0.27Apples 0.66 0.53 0.73 0.38 0.79 0.71 0.84 0.83 0.53 0.73 0.88 0.76 0.78 0.86 0.94Citrus fruit ' 1.40 0.85 0.96 1.20 1.35 1.47 1.49 1.73 1.22 2.01 1.91 1.97 1.94 1.79 1.90Grapes (fresh) 0.19 0.24 0.19 0.26 0.24 0.28 0.31 0.34 0.29 0.38 0.41 0.41 0.42 0.40 0.40Vegetable oils and oilseeds (oil equiv-alent) ' o 31 0.34 0.31 0.28 0.31 0.44 0.38 0.40 0.37 0.40 0.31 0.38 0.46 0.52 0.71Oilseed cake and meal 0 61 0.68 0.65 0.61 0.77 0.76 0.91 0.92 0.89 1.03 1.07 1.13 1.26 1.20 1.31Cattle 3 1 18 1.24 1.51 1.34 1.26 1.38 1.80 1.37 1.85 1.88 1.74 1.46 2.02 2.34 2.46Sheep, Iambs and goats 3 0.39 0.38 0.67 0.47 0.57 0.86 1.17 0.87 1.35 0.87 0.85 0.58 0.72 0.93 0.98Pigs ' 0.53 0.37 0.25 0.32 0.58 0.80 0.58 0.49 0.39 0.66 0.82 0.49 0.83 1.14 1.51Meat (fresh, chilled and frozen) ' . . . 0.30 0.23 0.30 0.32 0.40 0.51 0.58 0.74 0.81 0.79 0.92 0.91 1.10 1.20 1.25Bacon, ham and salted pork 0.29 0.28 0.30 0.30 0.31 0.37 0.36 0.37 0.35 0.35 0.36 0.36 0.35 0.35 0.34Milk (condensed, evaporated and pow-dered) 0.39 0.43 0.45 0.46 0.51 0.58 0.64 0.69 0.72 0.75 0.90 1.03 1.16 1.38 1.34Butter 0.19 0.19 0.25 0.25 0.21 0.25 0.26 0.23 0.24 0.23 0.27 0.27 0.31 0.34 0.33Cheese 0.23 0.25 0.26 0.29 0.32 0.33 0.34 0.36 0.38 0.40 0.42 0.47 0.48 0.51 0.53Eggs (in the shell) 0.27 0.28 0.30 0.31 0.34 0.31 0.29 0.28 0.23 0.19 0.15 0.14 0.13 0.16 0.20Wine 0.64 0.91 0.88 1.17 0.75 0.91 1.01 1.01 1.26 1.21 1.19 1.30 1.31 1.38 1.42Wool (actual weight) 0.07 0.08 0.09 0.08 0.11 0.11 0.11 0.12 0.13 0.10 0.11 0.11 0.10 0.11 0.11
Thousand metric tons
FISHERY PRODUCTS
Fresh, chilled or frozen fish 511.0 509.6 531.6 593.2 639.2 694.0 684.5 771.7 849.9 877.0 907.7 876.5 860.8 906.5Dried, salted or smoked fish 431 0 466.0 417.0 391.0 346.2 331.0 333.3 353.8 334.3 314.7 323.2 317.4 312.4 312.8Crustacca and molluscs, fresh, frozen,dried, salted, etc . 85 0 87.2 74.8 84.9 108.5 109.2 112.5 123.4 114.0 118.9 108.8 113.7 116.7 131.4
Fish products and preparations, whetheror not in airtight containers 164 4 166.8 166.8 177.6 197.0 191.0 183.7 211.7 196.7 209.1 221.4 211.3 193.8 195.1
Crustacean and mollusc products andpreparations, whether or not in airtightcontainers 4 0 5.0 5.0 6.0 7.0 6.0 8.0 9.0 9.0 13.0 13.0 13.0 13.0 14.0
Oils and fats, crude or refined, of aquaticanimal origin 109.8 104.8 216.8 213.7 228.4 213.7 218.8 243.9 199.8 190.0 266.2 340.1 390.8 203.8
Meals, solubles and similar animal feed-stuffs of aquatic animal origin . . . . 231.0 284.0 253.0 266.0 252.8 234.6 286.2 240.2 306.9 434.8 555.0 576.8 810.4 787.4
Million metric tons
FOREST PRODUCTS
Pulpwood ° 5.08 4.60 4.55 3.76 3.93 4.88 6.10 4.42 3.46 3.62 3.61 3.01 3.82 4.17 5.03
Coniferous logs ° 0 93 0.72 0.70 0.97 1.03 1.34 1.30 1.14 1.05 1.06 1.03 1.35 1.55 1.36 1.25
Broadleavcd logs 3 077 0.68 0.68 0.59 0.79 1.04 0.98 0.93 0.91 0.97 1.02 1.10 1.17 1.20 1.25
Pitprops ° 2 74 2.86 2.90 2.32 1.90 1.62 1.81 1.37 1.07 0.83 0.56 0.54 0.36 0.37 0.46
Sawn softwood ° 13.39 12.54 13.02 11.86 13.51 15.35 14.24 13.86 13.86 14.62 13.57 12.72 12.85 15.05 16.20
Sawa hardwood ° 0.97 0.72 0.82 0.79 0.87 1.06 0.93 0.96 0.98 1.14 1.21 1.26 1.24 1.34 1.44
Plywood and veneers ° 0.55 0.45 0.50 0.48 0.61 0.70 0.65 0.66 0.73 0.83 0.86 0.88 0.97 1.05 1.16
Fibreboard 0.44 0.47 0.53 0.56 0.66 0.74 0.75 0.78 0.83 0.88 0.82 0.76 0.82 0.86 0.90
Particle board 0.02 0.03 0.04 0.06 0.11 0.15 0.18 0.21 0.24 0.29 0.46 0.51 0.59 0.66 0.86
Mechanical wood pulp 0.99 1.06 1.02 0.88 0.93 1.10 1.06 0.97 1.05 1.15 1.12 1.13 1.00 1.06 1.10
Chemical wood pulp 3.66 3.86 3.34 3.90 4.36 4.73 4.50 4.80 5.36 5.86 5.79 6.24 6.16 6.55 6.80
Newsprint 1.08 1.26 1.24 1.30 1.32 1.51 1.62 1.63 1.71 1.88 1.97 2.07 2.11 2.32 2.47
Other paper and paperboard 2.31 2.34 2.57 2.49 2.84 3.25 3.57 3.77 4.23 4.77 5.06 5.54 5.67 6.55 7.74
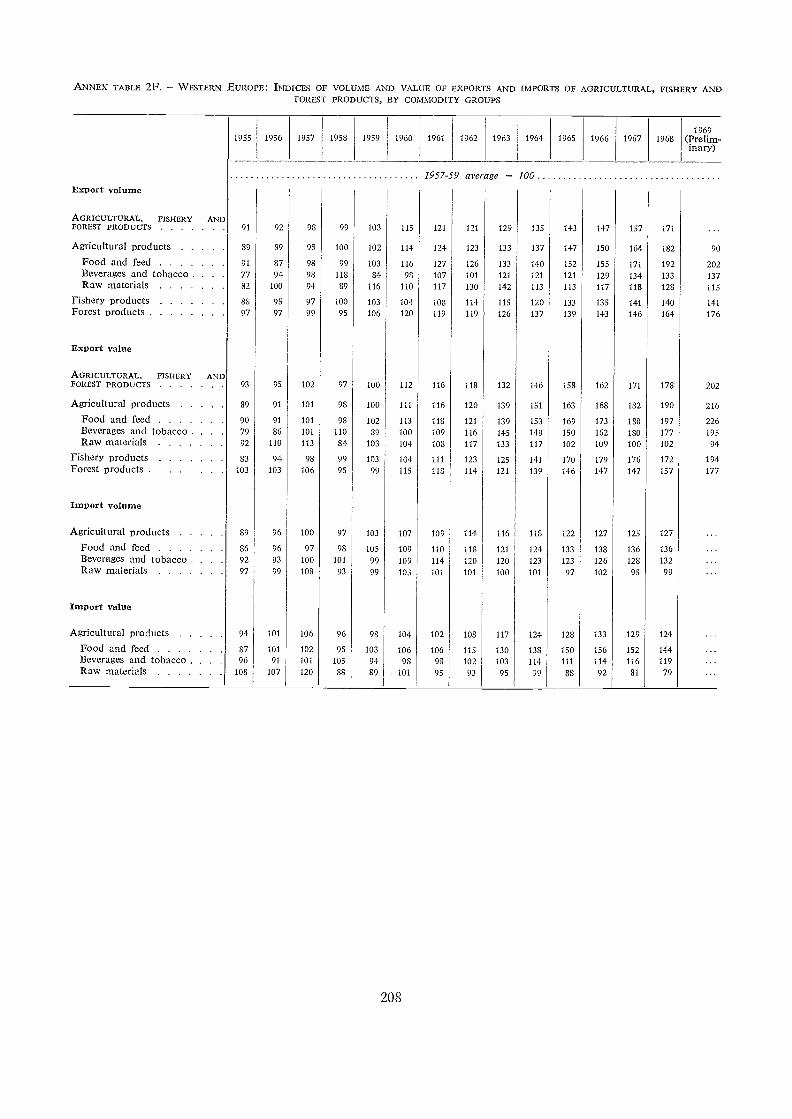
ANNEX TABLE 2F. WESTERN EUROPE: INDICES OF VOLUME AND VALUE OF EXPORTS AND IMPORTS OF AGRICULTURAL, FISHERY ANDFOREST PRODUCTS, BY COMMODITY GROUPS
208
1955 1956 1957 1958 1959 1960 1961 1962 1963 1964 1965 1966 1967 19681969
(Prelim-inary)
1957-59 average 100
Export volume
AGRICULTURAL, FISHERY ANDFOREST PRODUCTS 91 92 98 99 103 115 121 121 129 135 143 147 157 171
Agricultural products 89 89 98 100 102 114 124 123 133 137 147 150 164 132 90
Food and feed 91 87 98 99 103 116 127 126 133 140 152 155 171 192 202Beverages and tobacco . 77 94 98 118 84 98 107 101 121 121 121 129 134 133 137Raw materials 82 100 94 89 116 110 117 130 142 113 113 117 118 128 115
Fishery products 88 95 97 100 103 104 108 114 115 120 133 135 141 140 141Forest products 97 97 99 95 106 120 119 119 126 137 139 143 146 164 176
Export value
AGRICULTURAL, FISHERY ANDFOREST PRODUCTS 93 95 102 97 100 112 116 118 132 146 158 162 171 178 202
Agricultural products 89 91 101 98 100 111 116 120 139 151 163 168 182 190 216
Food and feed 90 91 101 98 102 113 118 121 139 153 169 173 188 197 226Beverages and tobacco . 79 86 101 110 89 100 109 116 145 149 150 162 180 177 195Raw materials 92 110 113 34 103 104 108 117 133 117 102 109 100 102 94
Fishery products 83 94 98 99 103 104 111 123 125 141 170 179 176 172 194Forest products 103 103 106 95 99 115 118 114 121 139 146 147 147 157 177
Import volume
Agricultural products 89 96 100 97 103 107 109 114 116 118 122 127 125 127
Food and feed 86 96 97 98 105 109 110 113 121 124 133 138 136 136Beverages and tobacco . . 92 93 100 101 99 109 114 120 120 123 123 126 128 132Raw materials 97 99 108 93 99 103 101 101 100 101 97 102 95 99
Import value
Agricultural products 94 101 106 96 98 104 102 108 117 124 128 133 129 124
Food and feed 87 101 102 95 103 106 106 115 130 133 150 156 152 144Beverages and tobacco . . . 96 91 101 105 94 98 93 102 103 114 111 114 116 119Raw materials 108 107 120 8S 89 101 95 93 95 99 88 92 81 79
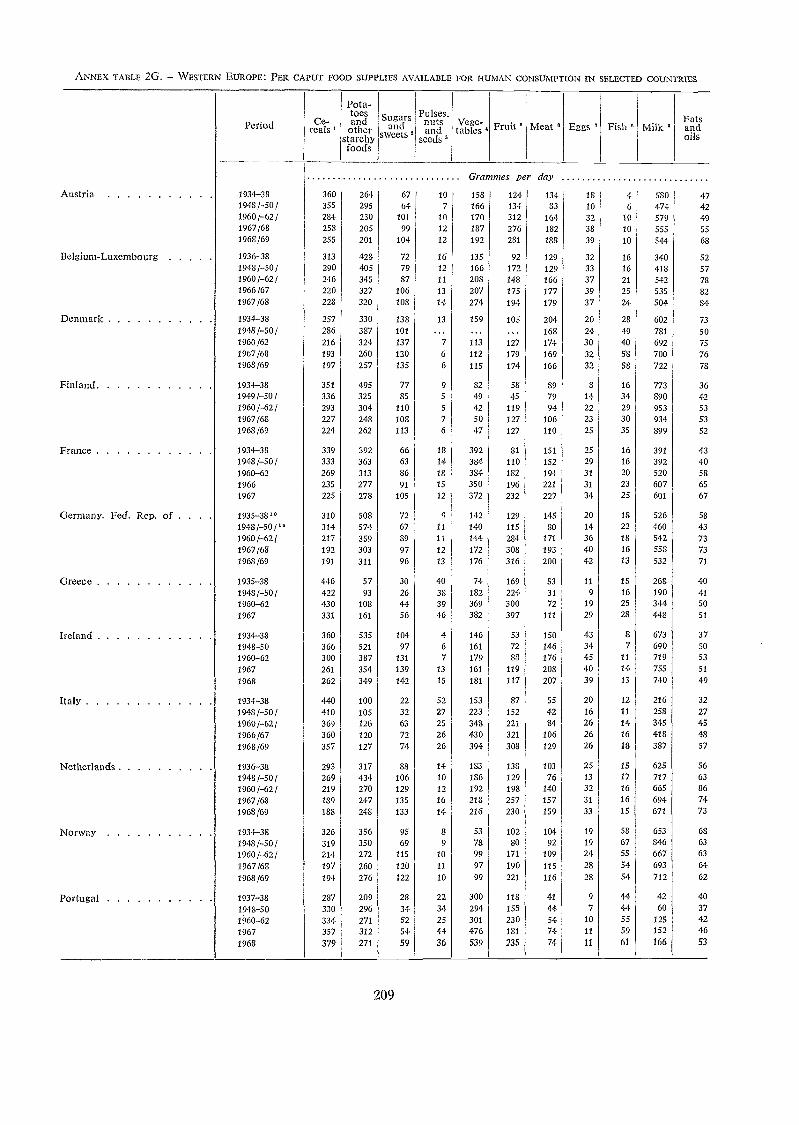
ANNEX TABLE 2G. - WESTERN EUROPE: PER CAPUT FOOD SUPPLIES AVAILABLE FoR HUMAN CONsUmpTION IN sELEcTED COUNTRIES
Period Ce-reals
Pota-toesandother
starchyfoods
Sugarsand
sweets
Pulses,nutsand
seeds'
Vege-tables Fruit Meat Eggs Fish Milk
Fatsandoils
Grammes per day
1934-38 360 264 67 10 158 124 134 18 4 580 4719481-50/ 355 295 54 7 166 134 83 10 6 474 4219601-62/ 284 230 101 10 170 312 164 32 10 579 491967/68 258 205 99 12 187 276 182 38 10 555 551968/69 255 201 104 12 192 281 188 39 10 544 68
1936-38 313 428 72 16 135 92 129 32 16 340 521943/-50/ 290 405 79 12 166 172 129 33 16 418 571960/-621 246 345 87 11 208 143 166 37 21 542 781966/67 220 327 106 13 207 175 177 39 25 535 821967/68 228 320 108 14 274 194 179 37 24 504 84
1934-38 257 330 138 13 159 105 204 20 28 602 731948/-50/ 286 387 101 ... ... 168 24 49 781 501960/62 216 324 137 7 113 127 174 30 40 692 751957/68 193 260 130 6 112 179 169 32 58 700 761968/69 197 257 135 6 115 174 166 32 58 722 78
1934-38 351 495 77 9 82 58 S9 3 16 773 361949/-50/ 336 325 85 5 49 45 79 14 34 890 42
1960/-621 293 304 110 5 42 119 94 22 29 953 531967/68 227 248 108 7 50 127 106 23 30 934 531968/69 224 262 113 6 47 127 110 25 35 899 52
1934-38 339 392 66 18 392 81 151 25 16 391 43
1948/-50/ 333 363 63 14 384 110 152 29 16 392 401960-62 269 313 86 18 384 182 191 31 20 520 53
1966 235 277 91 15 350 196 221 31 23 607 65
1967 225 278 105 12 372 232 227 34 25 601 67
1935-381° 310 508 72 9 142 129 145 20 18 526 58
1948/-50/1° 314 574 67 11 140 115 80 14 22 460 431960f-62f 217 359 89 11 144 284 171 36 18 542 731967/68 192 303 97 12 172 308 193 40 16 558 731968/69 191 311 96 13 176 316 200 42 13 532 71
1935-38 446 57 30 40 74 169 53 11 15 268 401948/-50/ 422 93 26 38 182 224 31 9 16 190 41
1960-62 430 108 44 39 369 300 72 19 25 344 501967 331 161 56 46 382 397 111 29 28 448 51
1934-33 360 535 104 4 146 53 150 43 8 673 37
1948-50 366 521 97 6 161 72 146 34 7 690 50
1960-62 300 387 131 7 179 88 176 45 11 719 53
1967 261 354 139 13 161 119 208 40 14 755 51
1968 262 349 142 15 181 117 207 39 13 740 49
1934-38 440 100 22 52 153 87 55 20 12 216 32
1948/-50/ 410 105 32 27 223 152 42 16 11 258 27
1960/-62f 369 126 63 25 348 221 84 26 14 345 45
1966/67 360 120 72 26 430 321 106 26 16 418 48
1968/69 357 127 74 26 394 308 129 26 18 387 57
1936-38 293 317 88 14 183 138 103 25 15 625 56
1948/-50/ 269 434 106 10 186 129 76 13 17 717 63
1960/-62/ 219 270 129 12 192 198 140 32 16 665 86
1967/68 189 247 135 16 218 257 157 31 16 694 741968/69 188 248 133 14 216 230 159 33 15 671 73
1934-38 326 356 95 8 53 102 104 19 58 653 68
1948/-50/ 319 350 69 9 78 80 92 19 67 846 63
1960/-62/ 214 272 115 10 99 171 109 24 55 667 63
1967/68 197 260 120 11 97 190 115 28 54 693 64
1968/69 194 276 122 10 99 221 116 28 54 712 62
1937-38 287 209 28 22 300 118 41 9 44 42 40
1948-50 330 296 34 34 294 155 44 7 44 60 37
1960-62 334 271 52 25 301 230 54 10 55 125 42
1967 357 312 54 44 476 181 74 11 59 152 46
1968 379 271 59 36 539 235 74 11 61 166 53
209
Austria
Belgium-Luxembourg
Denmark
Finland
France
Germany. Fed. Rep. of . .
Greece
Ireland
Italy
Netherlands
Norway
Portugal
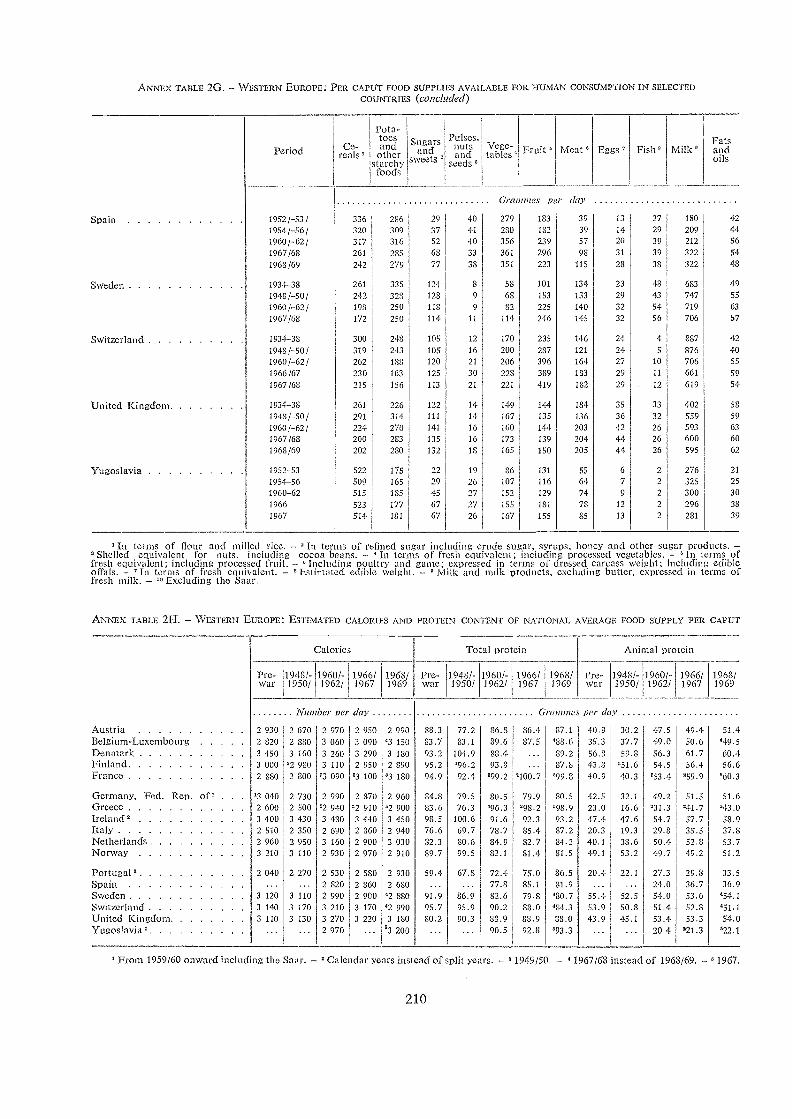
Spain
Sweden
Switzerland
United Kingdom
Yugoslavia
ANNEX TABLE 2G. - WESTERN EUROPE: PER CAPUT FOOD SUPPLIES AVAILABLE FOR HUMAN CONSUMPTION IN SELECTEDCOUNTRIES (CM/Chided)
In terms of flour and milled rice. - In terns of refined sugztr including crude sugar, syrups, honey and other st gar products. -'Shelled equivalent for nuts, including cocoa beans. - ' in terms of fresh equivalent; including processed vegetables. - in terms offresh equivalent; including processed fruit. - °Including poultry and game; expressed in terms of dressed carcass weight; including edibleoffals. - 'In terms of fresh equivalent. - °Estimated edible weight. - °Milk and milk products, excluding butter, expressed in terms offresh. milk. - ',Excluding the Saar.
ANNEX TABLE 21-1. - WESTERN EUROPE: ESTIMATED CALORIES AND PROTEIN CONTENT OF NATIONAL AVERAGE FOOD SUPPLY PER CAPUT
210
day
'From 1959/60 onward including the Saar. - ' Calendar years instead of split years. - U 1949/50. - ' 1967168 instead of 1968/69. - U 1967.
Calories Total protein Animal protein
Pre-Wa r
1948!-1950/
19 60/-1962/
1966/1967
1968/1969
Pre-War
1948!-1950/
1960/-1962/
1966/1967
1968/1969
Pre-war
1948/-1950/
1960/-1962/
1966/1967
1968/1969
Nun ber per day Grammes per day
Austria 2 930 2 670 2 970 2 950 2 990 88.3 77.2 86.8 86.4 87.1 40.9 30.2 47.5 49.4 51.4Belgium-Luxembourg 2 820 2 380 3 060 3 090 43 150 83.7 83.1 89.6 87.5 488.6 35.3 37.7 49.0 50.6 '49.5Den mark 3 450 3 160 3 260 3 290 3 180 93.2 104.9 88.4. 59.2 56.8 59.8 56.3 61.7 60.-9Finland 3 000 '2 980 3 110 2 950 2 890 95.2 '96.2 93.8 87.8 43.8 '51.6 54.5 56.4 56.6France 2 8S0 2 800 23 090 '3 100 '3 150 94.9 92.4 '99.2 '100.7 '99.8 40.9 40.3 :53.4 '59.9 '60.3
Germany, Fed. Rep. of' I3 040 2 730 2 990 2 370 2 960 84.8 79.5 80.5 79.9 80.5 42.5 32.1 49.2 51.5 51.6Greece 2 600 2 500 '2 940 '2 910 '2 900 83.6 76.3 96.3 '98.2 '98.9 23.0 16.6 '31.3 "41.7 '43.0Ireland' 3 400 3 430 3 430 3 440 3 450 98.5 100.6 91.6 92.3 93.2 47.4 47.6 54.7 57.7 58.9Italy 2 510 2 350 2 690 2 860 2 940 76.6 69.7 78.7 85.4 87.2 20.3 19.3 29.8 35.5 37.3Netherlands 2 960 2 950 3 160 2 900 3 030 82.3 80.6 84.9 82.7 84.2 40.1 38.6 50.4 52.8 53.7Norway 3 210 3 110 2 930 2 970 2 910 89.7 99.5 82.1 81.4 81.5 49.1 53.2 49.7 49.2 51.2
Portugal' 2 040 2 270 2 530 2 580 2 930 59.4 67.8 72.4 75.0 86.5 20.4 22.1 27.3 29.8 33.5Spain 2 820 2 860 2 680 77.8 85.1 81.9 24.0 36.7 36.9Sweden 3 120 3 110 2 990 2 900 42 880 91.9 86.9 32.6 79.8 80.7 55.4 52.5 54.0 53.6 454.1
Switzerland 3 140 3 170 3 210 3 170 42 990 95.7 95.9 90.2 88.0 84.3 53.9 50.8 51.4 52.8 51.1United Kingdom 3 110 3 130 3 270 3 220 3 130 80.2 90.3 88.9 88.9 33.0 43.9 45.1 53.4 53.3 54.0Yugoslavia: 2 970 '3 200 90.5 92.8 '93.3 20.4 21.3 '22.1
1952/-53/ 336 286 29 40 279 183 39 13 27 180 42
1954/-56/ 320 309 37 41 280 182 39 14 29 209 441960/-62/ 317 316 52 40 356 239 57 20 39 212 56
1967/63 261 285 68 33 361 296 98 31 39 322 54
1963/69 242 279 77 351 223 115 28 38 322 48
1934-38 261 335 124 8 53 101 134 23 43 653 49
1943/-50/ 242 328 128 9 GS 153 133 29 43 747 55
1960/-62/ 193 250 118 9 82 225 140 32 54 719 63
1967 /68 172 250 114 11 114 246 145 32 56 706 57
1934-38 300 248 105 12 170 235 146 24 4 887 421948 /-50 / 319 243 105 16 200 287 121 24 5 876 40
1960/-62/ 262 188 120 21 206 396 164 27 10 706 55
1966/67 230 163 125 30 228 389 183 29 11 661 59
1967/68 215 156 113 21 221 419 182 29 12 619 54
1934-38 261 226 122 14 149 144 184 35 33 402 58
1948/-50/ 291 314 111 14 167 135 136 36 32 559 591960/-62/ 224 270 141 16 160 144 203 42 26 593 63
1967/68 200 283 135 16 173 139 204 44 26 600 60
1968/69 202 280 132 18 165 150 205 44 26 595 62
1952-53 522 175 22 19 86 131 55 6 2 276 21
1954-56 509 165 29 26 107 116 64 7 2 325 25
1960-62 515 185 45 27 152 129 74 9 2 300 301966 523 177 67 27 155 181 78 12 2 296 38
1967 514 181 67 26 167 155 85 13 2 281 39
Period Ce-reals'
Pota-toesandother
starchyfoods
Sugarsand
SWCOS
Pulses,nutsti nd
seeds'
Vege-tables Fruit Meat Eggs v Fish Milk
Fatsandoils
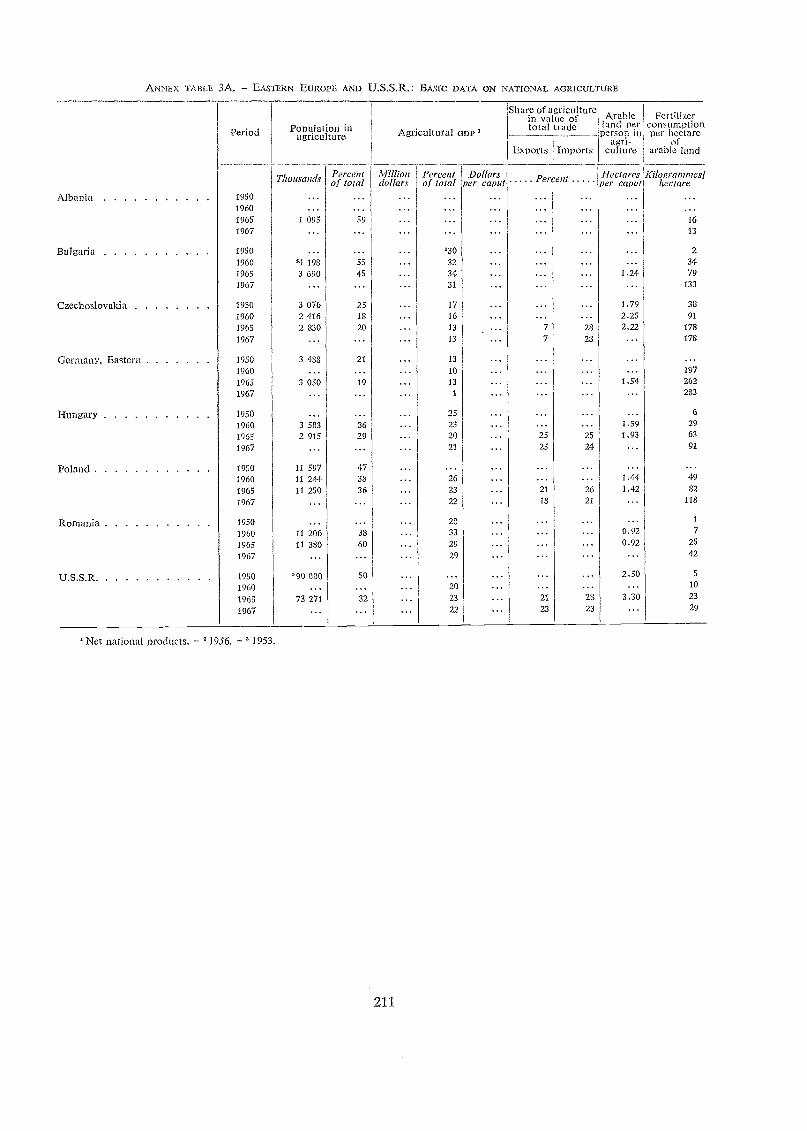
ANNEX TAI3LE 3A. EASTERN EUROPE AND U.S.S.R.: BASIC DATA ON NATIONAL AGRICULTURE
'Nct national products. 21956. 2 1953.
211
Period Population inagriculture gricutura GDP 'A l l
Shareofagrictdturein va uc oftotal trade Eland
Arableper
p-rson inagri-
culture
Fertilizerconsumptionper hectare
ofarable landExports Imports
Thousands oPAtalcoent i°"YolillaP rcz tof. 1
Dollarsper caput P ercent Hectares
per cupid1Cdogranunes1
hectareAlbania 1950 ... ... ... ... ... ... ... ... ...
1960 ... ... ... ... ... ... ... ... ...1965 1 095 59 ''. ... ... ... ... ... 16
1967 ... ... ... ... ... ... ... ... 13
Bulgaria 1950 ." ... ... 230 ... ... ... ... 2
1960 .4 198 53 ... 32 ... ... ". ... 34
1965 3 690 45 ... 34 ... ... ". 1.24 79
1967 ... ... ... 31 ... ... ". ... 133
Czechoslovakia 1950 3 076 25 ... 17 ... ... ... 1.79 38
1960 2 416 18 ... 16 ... ... ... 2.25 91
1965 2 830 20 ... 13 ... 7 23 2.22 178
1967 ... ... ... 13 ... 7 28 ... 178
Germany, Eastern 1950 3 488 21 ... 13 ... ." ... ... ...1960 ... ... ... 10 ... ." ... ... 197
1965 3 050 19 ... 13 ... ... ... 1.54 262
1967 ... ... ... 1 ... ... ... ... 283
Hungary 1950 ... ... ... 25 ... ... ... ... 6
1960 3 583 36 ... 23 ... ... ... 1.59 29
1965 2 915 29 ... 20 ... 25 25 1.93 63
1967 ... ... ... 21 ... 25 24 ... 91
Poland 1950 11 597 47 ... ... ... ... ... ... ...1960 11 244 38 ... 26 ... ... ... 1.44 49
1965 11 250 36 ... 23 ... 21 26 1.42 82
1967 ... ... ... 22 ... 18 21 ... 118
Romania 1950 ... ... ... 28 ... ". ... '" 1
1960 11 206 38 33 ... ... ... 0.92 7
1965 11 380 60 ... 29 ... ... ... 0.92 25
1967 ... ... ... 29 ... ... ... ... 42
U.S.S . R 1950 .90 000 50 ... ... ... ... ... 2.50 5
1960 ... ... ... 20 ... ... ... ... 10
1965 73 271 32 ... 23 ... 21 28 3.30 23
1967 ... ... ... 22 ... 23 23 ... 29
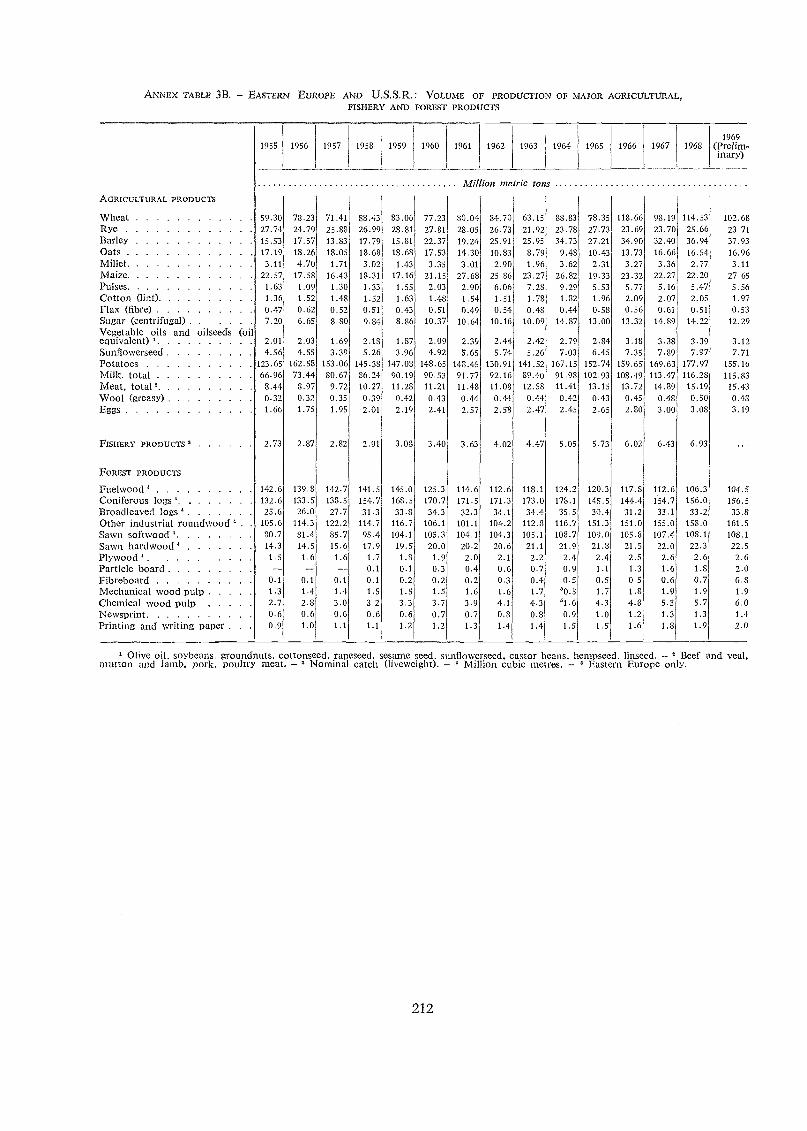
ANNEX TABLE 3B. - EASTERN EUROPE AND U.S.S.R.: VOLUME OF PRODUCTION OF MAJOR AGRICULTURAL,FISHERY AND FOREST PRODUCTS
Olive oil, soybeans, groundnuts, cottonseed. rapeseed, sesame seed, sunflowerseed, castor beans, hempseed, linseed. - Beef and veal,mutton and lamb, pork, poultry meat. - 3 Nominal catch (liveweight). - ° Million cubic metres. - Eastern Europe only.
212
AGRICULTURAL PRODUCTS
1955 1956 1957 1958 1959 1960 1961 1962 1963 1964 1965 1966 1967 19681969
(Prelim-inary)
Million metric tons
Wheat 59 30 78.23 71.41 88.43 83.06 77.23 80.04 84.70 63.15 88.83 78.35 118.66 98.19 114.53 102.68Rye 27 74 24.79 25.88 26.99 28.81 27.81 28.05 26.73 21.92 23.78 27.73 23.69 23.70 25.66 23.71Barley 15 53 17.57 13.83 17.79 15.81 22.37 19.24 25.91 25.95 34.73 27.21 34.90 32.40 36.94 37.93Oats 17.19 18.26 18.05 18.68 18.68 17.53 14.30 10.83 3.79 9.48 10.43 13.73 16.66 16.54 16.96Millet 3 11 4.70 1.71 3.02 1.43 3.35 3.01 2.90 1.96 3.62 2.31 3.27 3.36 2.77 3.11Maize 22 57 17.58 16.43 18.31 17.16 21.15 27.68 25.86 23.27 26.82 19.33 23.32 22.27 22.20 27.65Pulses 1 63 1.09 1.30 1.33 1.55 2.03 2.90 6.06 7.28 9.29 5.53 5.77 5.16 5.47 5.56Cotton (lint) 1 36 1.52 1.48 1.52 1.63 1.48 1.54 1.51 1.78 1.82 1.96 2.09 2.07 2.05 1.97Flax (fibre) 0 47 0.62 0.52 0.51 0.43 0.51 0.49 0.54 0.48 0.44 0.58 0.56 0.61 0.51 0.53Sugar (centrifugal) 7 20 6.65 8.80 9.84 8.86 10.37 10.64 10.16 10.09 14.87 13.00 13.32 14.89 14.22 12.29Vegetable oils and oilseeds (oilectuivalent) 2 01 2.03 1.69 2.18 1.87 2.09 2.39 2.44 2.42 2.79 2.84 3.18 3.38 3.39 3.12Sunflowerseed 4 56 4.55 3.39 5.26 3.96 4.92 5.65 5.74 5.26 7.03 6.45 7.35 7.89 7.97 7.71Potatoes 123 65 162.58 153.06 145.38 147.08 148.65 148.45 130.91 141.52 167.15 152.74 159.65 169.63 177.97 155.16Milk, total 66 96 73.44 80.67 86.24 90.19 90.53 91.77 92.16 89.40 91.98 102.93 108.49 113.47 116.28 115.83Meat, total' 8.44 8.97 9.72 10.27 11.28 11.21 11.48 11.08 12.58 11.41 13.15 13.72 14.89 15.19 15.43
Wool (greasY) 0 32 0.32 0.35 0.39 0.42 0.43 0.44 0.44 0.44 0.42 0.43 0.45 0.48 0.50 0.48
Eggs 1 66 1.75 1.95 2.01 2.19 2.41 2.57 2.58 2.47 2.45 2.65 2.80 3.00 3.08 3.19
FISHERY PRODUCTS 2 73 2.87 2.82 2.91 3.08 3.40 3.63 4.02 4.47 5.05 5.73 6.02 6.43 6.93
FOREST PRODUCTS
Fuelwood 142.6 139.8 142.7 141.5 145.0 125.3 114.6 112.6 118.1 124.2 120.3 117.8 112.6 106.3 104.5
Coniferous logs 132.6 133.5 138.5 154.7 168.5 170.7 171.5 171.3 173.0 178.1 145.5 144.4 154.7 156.0 156.5
Broadleaved logs ° 25.6 26.0 27.7 31.3 33.8 34.3 32.3 34.1 34.4 35.5 30.4 31.2 33.1 33.2 33.8Other industrial roundwood 105.6 114.3 122.2 114.7 116.7 106.1 101.1 104.2 112.8 116.7 151.3 151.0 155.0 158.0 161.5
Sawn softwood' 80.7 81.4 35.7 95.4 104.1 105.3 104.1 104.3 105.1 108.7 109.0 105.8 107.4 103.1 108.1
Sawn hardwood 14 3 14.5 15.6 17.9 19.5 20.0 20.2 20.6 21.1 21.9 21.8 21.5 22.0 22.3 22.5
Plywood 1.5 1.6 1.6 1.7 1.8 1.9 2.0 2.1 2.2 2.4 2.4 2.5 2.6 2.6 2.6Particle board -- -- 0.1 0.1 0.3 0.4 0.6 0.7 0.9 1.1 1.3 1.6 1.8 2.0Fibreboard 0.1 0.1 0.1 0.1 0.2 0.2 0.2 0.3 0.4 0.5 0.5 0.5 0.6 0.7 0.8Mechanical wood pulp 1.3 1.4 1.4 1.5 1.5 1.5 1.6 1.6 1.7 '0.5 1.7 1.8 1.9 1.9 1.9Chemical wood PulP 2.7 2.8 3.0 3.2 3.3 3.7 3.9 4.1 4.3 51.6 4.3 4.8 5.3 5.7 6.0Newsprint . 0.6 0.6 0.6 0.6 0.6 0.7 0.7 0.8 0.8 0.9 1.0 1.2 1.3 1.3 1.4Printing and writing paper . . . 0.9 1.0 1.1 1.1 1.2 1.2 1.3 1.4 1.4 1.5 1.5 1.6 1.8 1.9 2.0
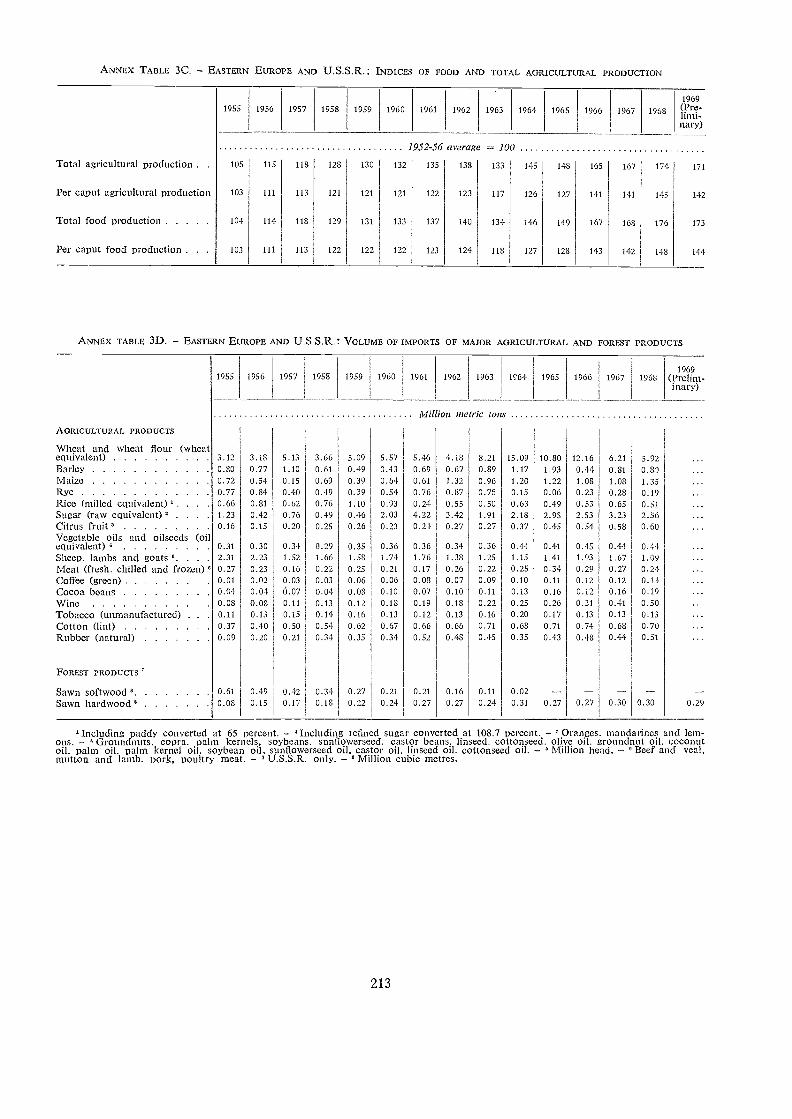
ANNEX TABLE 3C. - EASTERN EUROPE AND U.S.S.R.: INDICES OF FOOD AND TOTAL AGRICULTURAL pRODUCTION
Total agricultural production .
Per caput agricultural production
Total food production
Per caput food production . .
ANNEX TABLE 3D. - EASTERN EUROPE AND U.S.S.R.: VOLUME OF IMPORTS OF MAJOR AGRICULTURAL AND FOREST pRoDuCTs
1952-56 average 100
105 115 118 128 130 132 135 138 133 145 148 165 167 174 171
103 Ill 113 121 121 121 122 123 117 126 127 141 114 145 112
104 114 113 129 131 133 137 140 134 146 149 167 168 176 173
103 111 113 122 122 122 123 124 118 127 128 143 142 148 144
213
1969(Pre-limi-nary)
'Including paddy converted at 65 percent. - 'Including refined sugar converted at 108.7 percent. - 'Oranges, mandarines tnd lem-ons. - Groundnuts, copra, Pala) kernels, soybeans, sunflowerseed, castor bems, linseed, cottonseed, olive oil, groundnut oil, coconutoil, palm oil, palin kernel oil, soybean oil, sunflowerseed oil, castor oil, linseed oil, cottonseed oil. - ° Million head, - 'Beef and veal,mutton and lamb, pork, poultry meat. - U.S.S.R. only. - ° Million cubic metres.
AGRICULTURAL PRODUCTS
Wheat and wheat flour (wheaequivalent)BarleyMaizeFtycRico (milled eqinvalent)' .Sugar (raw cquiva1en02Citrus fruit ,Vegetable oils and oilseeds (oileciuivalent)Sheen, lambs and goats . . .
Meat (fresh, chilled and frozen) 'Coffee (green)Cocoa beansVine
Tobacco (unmanufactured) . . .
Cotton (lint)Rubber (natural)
FOREST PRODuCTS
Sawn softwoodSawn hardwood
0.31
0.08
3.120.800.720.770.661.230.16
2.310.270 010.04
0.110.370.09
0.610.08
3.180.770.540.840.810.420.15
0.302.230.230.020.010.080.130.400.20
0.490.15
5.131.100.150.400.620.760.20
0.341.520.160.030.070.110.150.500.21
0.420.17
3.660.610.690.490.760.490.25
0.291.660.220.030.040.130.140.540.34
0.340.18
5.090.490.390.391.100.460.26
0.351.580.250.060.030.120.160.620.35
0.270.22
5.570.430.640.540.932.030.23
0.361.740.210.060.100.180.130.670.34
0.210.24
Million
5.460.690.610.760.244.220.21
0.361.760.170.080.070.190.120.660.52
0.210.27
4.180.671.320.870.553.420.27
0.341.330.260.070.100.180.130.660.48
0.160.27
metric
8.210.890.960.780.501.910.27
0.361.250.220.090.110.220.160.710.45
0.110.24
tons
15.091.171.200.150.632.180.37
0.441.150.250.100.130.250.200.680.35
0.020.31
10.801.931.220.060.492.950.45
0.411.410.340.110.160.260.170.710.43
0.27
12.160.441.080.230.532.530.54
0.451.930.290.120.120.310.130.740.48
0.27
6.210.811.080.280.653.230.58
0.441.670.270.120.160.410.130.630.44
--0.30
5.920.831.350.190.512.560.60
0.441.090.240.140.190.500.130.700.51
--0.30 0.29
19691955 1956 1957 1958 1959 1960 1961 1962 1963 1064 1965 1966 1967 1968 (Prelim-
inary)
1955 1956 1957 1958 1959 1960 1961 1962 1963 1964 1965 1966 1967 1968
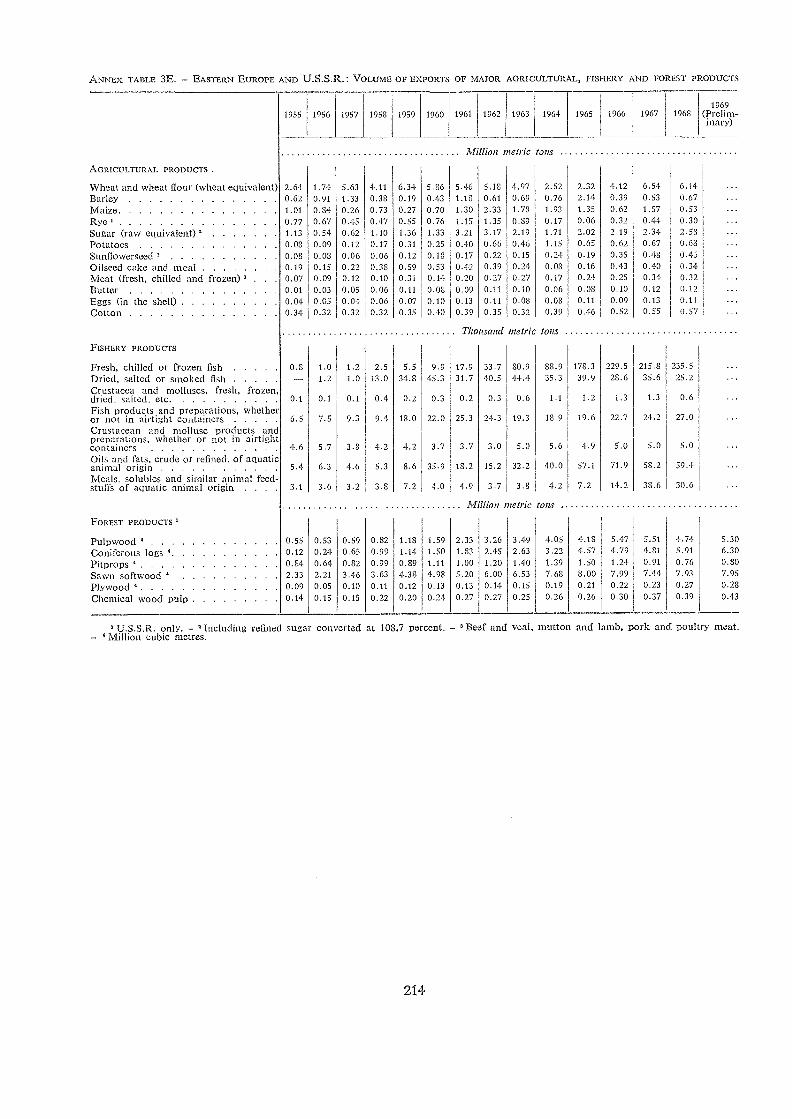
ANNEX TABLE 3E. - EASTERN EUROPE AND U.S.S.R.: VOLUME OF EXPORTS OF MAJOR ACiRICULTURAL, FISHERY AND FOREST PRODUCTS
U.S.S.R. only. - ' Including refined sugar converted at 108.7 percent. - °Beef and veal, mutton and lamb, pork and poultry meat.- ' Million cubic metres.
214
1955 1956 1957 1958 1959 1960 1961 1962 1963 1964 1965 1966 1967 19681969
(Prelim-inary)
Million I lob* tons
AGRICULTURAL PRODUCTS .
Wheat and wheat flour (wheat equivalen t) 2.64 1.74 5.63 4.11 6.34 5.86 5.46 5.18 4.97 2.52 2.32 4.12 6.54 6.14Barley 0.62 0.91 1.33 0.38 0.19 0.43 1.18 0.61 0.69 0.76 2.14 0.39 0.53 0.67Maize 1.01 0.84 0.26 0.73 0.27 0.70 1.30 2.33 1.78 1.93 1.35 0.62 1.57 0.53Rye 0 77 0.67 0.45 0.47 0.55 0.76 1.15 1.35 0.89 0.17 0.06 0.32 0.44 0.30Sugar (raw equivalent) 1.13 0.54 0.62 1.10 1.36 1.33 3.21 3.17 2.19 1.71 2.02 2.19 2.34 2.58
Potatoes 0.08 0.09 0.12 0.17 0.31 0.25 0.40 0.66 0.46 1.15 0.65 0.62 0.67 0.68
Sunflowerseed 0.08 0.08 0.06 0.06 0.12 0.18 0.17 0.22 0.15 0.24 0.19 0.35 0.48 0.45Oilseed cake and meal 0.19 0.15 0.22 0.38 0.59 0.53 0.42 0.39 0.24 0.08 0.16 0.43 0.40 0.34Meat (fresh, chilled and frozen) 0.07 0.09 0.12 0.10 0.31 0.14 0.20 0.27 0.27 0.17 0.24 0.25 0.34 0.32
Butter 0.01 0.03 0.05 0.06 0.11 0.08 0.09 0.11 0.10 0.06 0.08 0.10 0.12 0.12
Eggs (in the shell) 0.04 0.05 0.04 0.06 0.07 0.10 0.13 0.11 0.08 0.08 0.11 0.09 0.13 0.11
Cotton 0.34 0.32 0.32 0.32 0.35 0.40 0.39 0.35 0.32 0.39 0.46 0.52 0.55 0.57
Thousand metric tons
FISHERY PRODUCTS
Fresh, chilled or frozen fish 0 8 1.0 1.2 2.5 5.5 9.9 17.9 33.7 80.9 88.9 178.3 229.5 215.8 235.5
Dried, salted or smoked fish 1.2 1.0 13.0 34.8 45.3 31.7 40.5 44.4 35.3 39.9 28.6 35.6 25.2Crustacea and molluscs, fresh, frozen,dried, stilted, etc. 0 1 0.1 0.1 0.4 0.2 0.3 0.2 0.3 0.6 1.1 1.2 1.3 1.3 0.6
Fish products and preparations, whetheror not in airtight containers 6 5 7.5 9.3 9.4 18.0 22.0 25.3 24.3 19.3 18.9 19.6 22.7 24.2 27.0
Crustacean and mollusc products andpreparations, whether or not in airtightcontainers 4 6 5.7 3.8 4.2 4.2 3.7 3.7 3.0 5.0 5.6 4.9 5.0 5.0 5.0
Oils and fats, crude or refined, of aquaticanimal origin 5.4 6.3 4.6 5.3 8.6 35.9 13.2 15.2 32.2 40.0 57.1 71.9 58.2 59.4
Meals, solubles and similar animal feed-stutrs of aquatic animal origin . . . 3.6 3.2 3.8 7.2 4.0 4.9 3.7 3.8 4.2 7.2 14.2 38.6 30.6
Afillion meolc tons
FOREST PRODUCTS
Pulpwood 0.55 0.53 0.59 0.82 1.18 1.59 2.33 3.26 3.49 4,05 4.18 5.47 5.51 4.74 5.30
Coniferous logs 0.12 0.24 0.65 0.99 1.14 1.50 1.83 2.45 2.63 3.22 4.57 4.79 4.31 5.91 6.30
Pitprops 0.84 0.64 0.82 0.99 0.89 1.11 1.00 1.20 1.40 1.39 1.50 1.24 0.91 0.76 0.80
Sawn softwood 2.33 2.21 3.46 3.63 4.38 4.93 5.20 6.00 6.53 7.68 8.00 7.99 7.44 7.93 7.95
Plywood 0.09 0.05 0.10 0.11 0.12 0.13 0.13 0.14 0.15 0.19 0.21 0.22 0.23 0.27 0.28
Chemical wood pulp 0.14 0.15 0.15 0.22 0.20 0.24 0.27 0.27 0.25 0.26 0.26 0.30 0.37 0.39 0.43
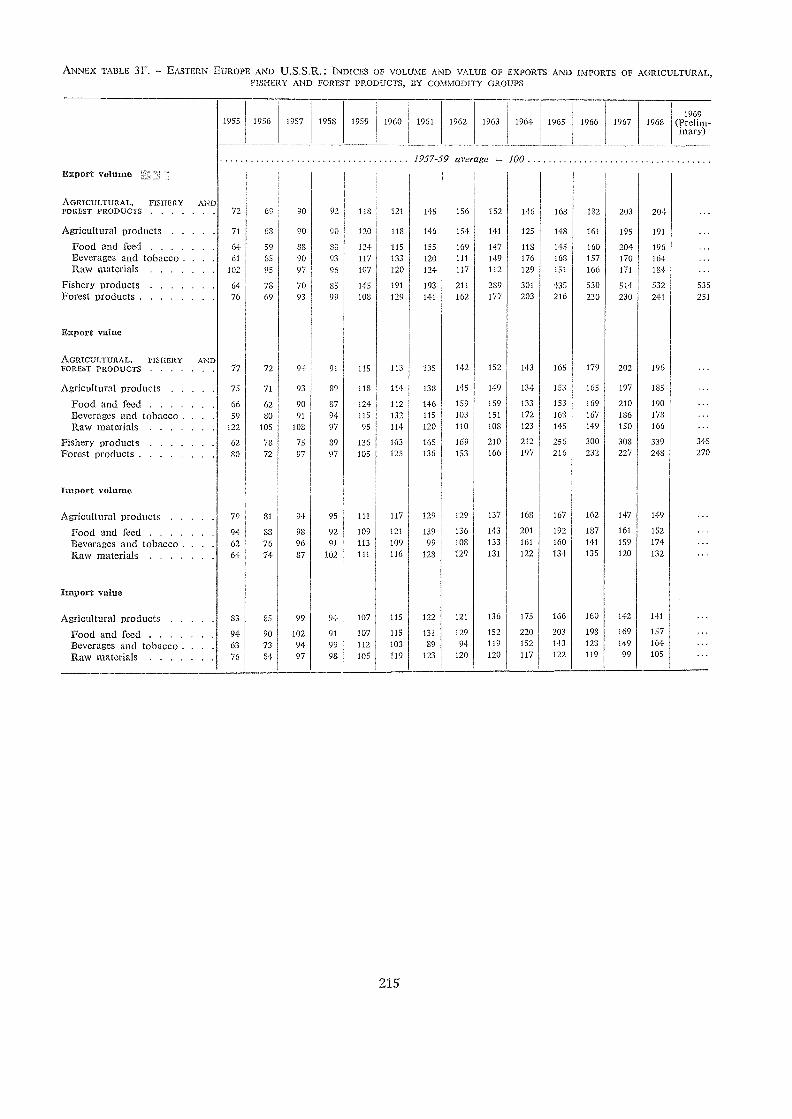
ANNEX TABLE 3F. EASTERN EUROPE AND U.S.S.R.: INDICES OF VOLUME AND VALUE OF EXPORTS AND IMPORTS OF AGRICULTURAL,FISHERY AND FOREST PRODUCTS, BY COMMODITY GROUPS
19691955 1956 1957 1953 1959 1960 1961 1962 1963 1964 1965 1966 1967 1968 (Prelim-
inary)
1957-59 average 100Export volume
AGRICULTURAL, FISHERY ANDFOREST PRODUCTS 72 69 90 92 118 121 115 156 152 146 168 182 203 204
Agricultural products 71 68 90 90 120 113 146 154 141 125 148 161 195 191
Food and feed 64 59 88 SS 124 115 155 169 147 118 145 160 204 196
Beverages and tobacco . 61 85 90 93 117 133 120 Ill 149 176 163 157 170 164Raw material 102 95 97 96 107 120 124 117 112 129 151 166 171 184
Fishery products 64 73 70 55 145 191 193 211 289 301 435 530 514 532 535
Forest products 76 69 93 99 108 129 141 162 177 203 216 230 230 241 251
Export value
AGRICULTURAL, FISHERY ANDFOREST PRODUCTS 77 72 94 91 115 113 135 142 152 143 165 179 202 196
Agricultural products 75 71 93 89 115 114 138 145 149 134 153 165 197 135
Food and feed 66 62 90 87 124- 112 146 159 159 133 153 169 210 190
Beverages and tobacco . 59 80 91 94 115 132 115 103 151 172 163 167 186 173
Raw materials 122 105 108 97 95 114 120 110 108 123 145 149 150 166
Fishery products 62 78 75 89 136 163 165 169 210 212 256 300 303 339 345
Forest products 80 72 97 97 105 125 136 153 166 197 216 232 227 248 270
Import volume
Agricultural products 79 81 94 95 111 117 129 129 137 168 167 162 147 149
Food and feed 94 88 98 92 109 121 139 136 143 201 192 187 161 152
Beverages and tobacco . . 62 76 96 91 113 109 99 103 133 161 160 141 159 174
Raw materials 64 74 87 102 111 116 128 129 131 122 134 135 120 132
Irnport value
Agricultural products 83 85 99 94 107 115 122 121 136 175 166 160 142 141
Food and feed 94 90 102 91 107 115 131 129 152 220 203 198 169 157
Beverages and tobacco . . 63 73 94 99 112 103 89 94 119 152 143 123 149 164
Raw materials 76 34 97 98 105 119 123 120 120 117 122 119 99 105
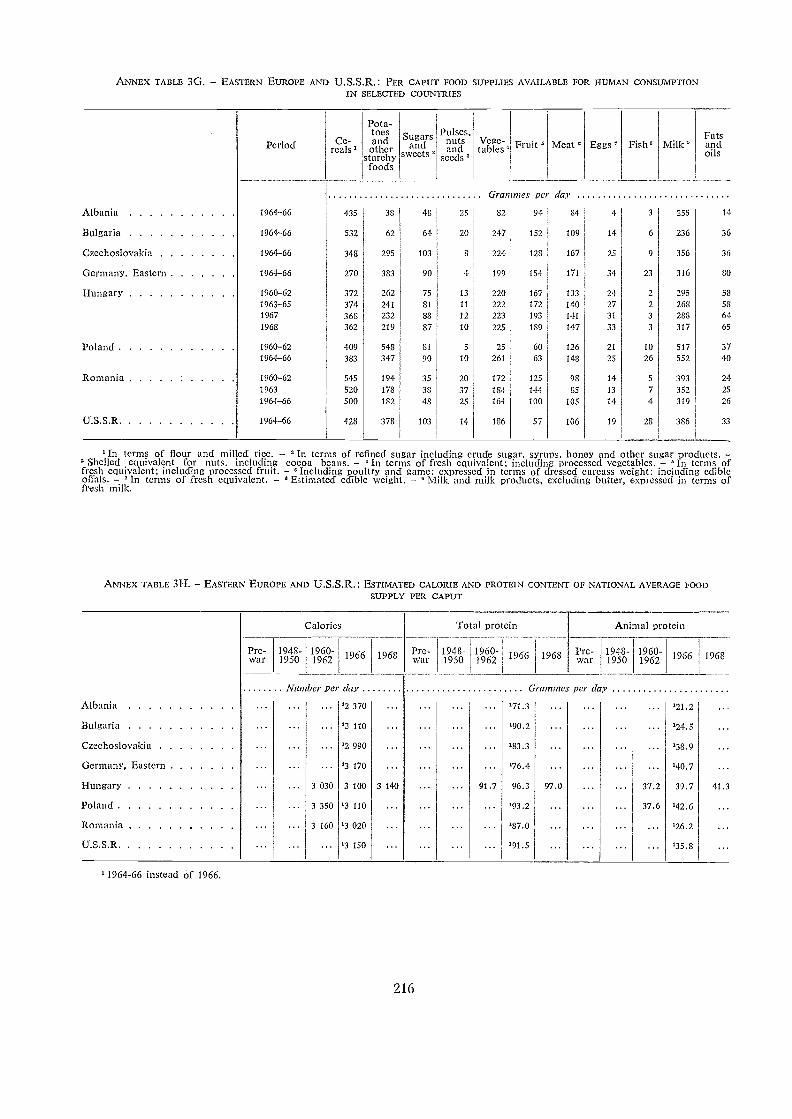
ANNEX TABLE 3G. EASTERN EUROPE AND U.S.S.R.: PER CAPUT FOOD SUPPLIES AVAILABLE FOR IIUMAN CONSUMPTION
1964-66 instead of 1966.
216
'In terms of flour and milled rice. - 'In terms of refilled sugar including crude sugar, syrups, honey and other sugar products. -3 Shelled equivalent for nuts, ncluding cocoa beans. - ° In terms of fresh equivalent; including processed vegetables. - In terms offresh equivalent; including processed fruit. - Including poultry and game; expressed in terms of dressed carcass weight; including edibleoffals. - In terms of fresh equwalent. - Estimated edible weight. - ° Milk and milk products, excluding butter, expressed in terms offresh milk-.
ANNEX TABLE 3H. EASTERN ELTROPE AND U.S.S.R.: ESTIMATED CALORIE AND PROTEIN CONTENT OE NATIONAL AVERAGE FOODSUPPLY PER CAPUT
Gran mes per day
Albania 1964-66 435 38 48 25 82 94 84 4 3 255
Bulgaria 1961-66 532 62 64 20 247 152 109 14 6 236 36
Czechoslovaki 1964-66 348 295 103 8 224 128 167 25 9 356 36
Germany, Eastern 1964-66 270 383 90 4 199 154 171 34 23 316 80
Hungary 1960-62 372 262 75 13 220 167 133 24 2 295 58
1963-65 374 241 81 11 222 172 140 27 2 268 58
1967 368 232 88 12 223 193 141 31 3 288 641968 362 219 87 10 225 189 147 33 3 317 65
Poland 1960-62 409 548 81 5 25 60 126 21 10 517 37
1964-66 383 347 90 10 261 63 148 25 26 552 40
Romania 1960-62 545 194 35 20 172 125 98 14 5 393 241963 520 178 38 37 184 144 85 13 7 352 25
1964-66 500 182 48 25 164 100 105 14 4 319 26
U.S.S . R 1964-66 428 378 103 14 186 57 106 19 28 386 33
Calories Total protein Animal protein
Pre-War
1948-1950
1960-1962 1966 1968 Pre-
war1948-1950
1960-1962 1966 1968 Pre-
war1948-1950
19 60-1962 1966 1968
Nun ber per daY Grain nies per day
Albania "2 370 '71.3 '21.2
Bulgaria '3 110 '90.2 '24.5
Czechoslovakia 12 990 '83.3 138.9
Germany. Eastern 13170 '76.4 '40.7
Hungary 3 030 3 100 3 140 91.7 96.3 97.0 37.2 39.7 41.3
Poland 3 350 13110 '93.2 37.6 '42.6
Romania 3 160 '3 020 '87.0 '26.2
U.S.S . R '3 150 '91.5 135.8
IN SELECTED COUNTRIES
Period Ce-mats'
Pota-toesandother
starchyfoods
Sugarsand
sweets 2
Pulses,nutsand
seeds '
Vege-tables' Fruit ' Meat ° Eggs ' Fish' Milk °
Fatsandoils
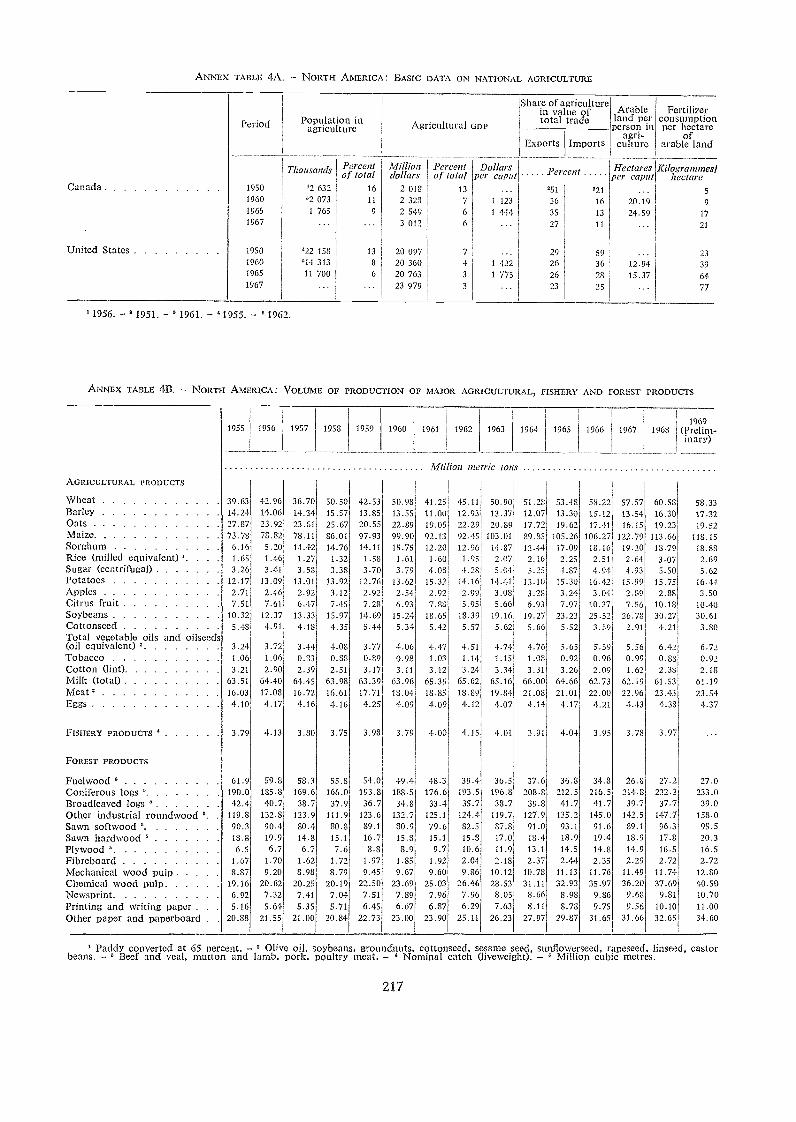
'1956. - 1951. - '1961. - '1955. - 51962.
ANNEX TABLE 411. - NORTH AMERICA : VOLUME OE PRODUCTION OE MAJOR AGRICULT URAL, FISIIERY ANO FORESE PRODUCTS
ANNEX TABLE 4A. - NORTH AMERICA: BASIC DATA ON NATIONAL AGRICULTURE
217
Paddy converted at 65 percent. - Olive oil, soybeans, groundnuts, cottonseed. sesame seed, surdlowersecd, ripcseed, linseed, castorbeans. - Beef and veal, mutton and lamb, pork, poultry meat. - " Nominal catch (livcweight). - 5 Million cub c metres.
Period Population inagriculture Agricultural GDP
are of agriculturein va ue oftotal trade
Arableland perperson in
agri-culture
Fertilizerconsumptionper hectare
ofarable landExports Imports
Thousands Percentof total
Millh7nth)llars
l'ereentof total
Dollarsper amid per ent ¡lectores
per caputKilogrames'
hectareCanada 1950 '2 632 16 2 018 13 ... '51 .21 ... 5
1960 '2 073 11 2 328 7 1 123 36 16 20.19 91965 1 765 9 2 549 6 1 444 35 13 24.59 171967 ... ... 3 012 6 ... 27 11 ... 21
United States 1950 '22 158 13 20 097 7 29 59 ... 231960 '14313 8 20 360 4 1 422 26 36 12.94 391965 11 700 6 20 763 3 1 775 26 28 15.37 641967 ... ... 23 979 3 ... 23 25 77
1955 1956 1957 1953 1959 1960 1961
fvujllion
1962
inctric
1963
tot
1964
s
1965 1966 1967 19681969
(Prelim-inarY)
AGRICULTURAL PRODuCTS
Wheat 39 63 42.96 36.70 50.50 42.53 50.98 41.25 45.11 50.90 51.28 53.48 58.22 57.57 60.58 58.33Barley 14 24 14.06 14.34 15.57 13.85 13.55 11.00 12.93 13.37 12.07 13.30 15.12 13.54 16.30 17.32Oats 27 87 23.92 23.61 25.67 20.55 22.89 19.05 22.29 20.89 17.72 19.62 17.41 16.15 19.23 19.52Maize 73 78 78.82 78.11 86.01 97.93 99.90 92.13 92.45 103.01 89.85 105.26 106.27 122.79 113.66 118.15Sorghum 6.16 5.20 14.42 14.76 14.11 15.75 12.20 12.96 14.87 12.44 17.09 18.16 19.20 18.79 18.38Rice (milled equivalent) '. 1.65 1.46 1.27 1.32 1.53 1.61 1.60 1.95 2.07 2.16 2.25 2.51 2.64 3.07 2.69Sugar (centrifugal) 3 26 3.41 3.58 3.38 3.70 3.79 4.08 4.28 5.04 5.25 4.87 4.94 4.93 5.50 5.62Potatoes 12,17 13.09 13.01 13.92 12.76 13.62 15.32 14.16 14.41 13.10 15.30 16.42 15.99 15.75 16,44Apples 2 71 2.46 2.92 3.12 2.92 2.54 2.92 2.99 3.08 3.28 3.24 3.04 2.89 2.88 3.50Citrus fruit 7 51 7.61 6.47 7.45 7.28 6.93 7.88 5.95 5.66 6.93 7.97 10.37 7.56 10.18 10.40Soybeans 10 32 12.37 13.33 15.97 14..69 15.24 18.65 18.39 19.16 19.27 23.23 25.52 26.78 30.27 30.61Cottonseed 5 48 4.91 4.18 4.35 5.44 5.34 5.42 5.57 5.62 5.66 5.52 3.59 2.91 4.21 3.80Total vegetable oils and oilseeds(oil equivalent) 3 24 3.72 3.44 4.08 3.77 4.06 4.47 4.51 4.74 4.76 5.65 5.59 5.56 6.42 6.72Tobacco 1 06 1.06 0.83 0.88 0.89 0.98 1.03 1.14 1.15 1.08 0.92 0.96 0.99 0.88 0.92Cotton (lint) 3 21 2.90 2.39 2.31 3.17 3.11 3.12 3.24 3.34 3.31 3.26 2.09 1.62 2.38 2.18Milk (total) 63 51 64.40 64.45 63.98 63.39 63.96 65.35 65.62 65.16 66.00 64.66 62.73 62.19 61.53 61.19Meat 16 03 17.08 16.72 16.61 17.71 18.04 18.85 18.89 19.84 21.08 21.01 22.00 22.96 23.43 23.54Eggs 4 10 4.17 4.16 4.16 4.25 4.09 4.09 4.12 4.07 4.14 4.17 4..21 4.43 4.38 4.37
FISHERY PRODUCTS 379 4.13 3.80 3.75 3.98 3.79 4.00 4.15 4.01 3.91 4.04. 3.95 3.78 3.97
FOREST PRODUCTS
Fuelwood 61.9 59.8 58.3 55.8 54.0 49.4 48.3 39.4 36.5 37.6 36.8 34.8 26.8 27.2 27.0Coniferous logs 190.0 185.8 169.6 166.0 193.8 188.5 176.6 193.5 196.8 208.8 212.5 216.5 214.8 232.2 233.0Broadleaved logs 42.4 40.7 38.7 37.9 36.7 34.8 33.4 35.7 38.7 39.8 41.7 41.7 39.7 37.7 39.0Other industrial roundwood 119.8 132.8 123.9 111.9 123.6 132.7 125.1 124.4 119.7 127.9 135.2 145.0 142.5 147.7 158.0Sawn softwood 90.3 90.4 30.4 80.8 89.1 80.9 79.6 82.5 87.8 91.0 93.1 91.6 89.1 96.3 95.5Sawn hardwood 18.8 19.9 14.8 15.1 16.7 15.8 15.1 15.8 17.0 18.4 18.9 19.4 18.9 17.8 20.3PlyWood 6.5 6.7 6.7 7.6 8.8 8.9 9.7 10.6 11.9 13.1 14.5 14.8 14.9 16.5 16.5Fibreboard 1 67 1.70 1.62 1.72 1.97 1.85 1.92 2.04 2.18 2.37 2.44 2.35 2.29 2.72 2.72Mechanical wood pulp 8 87 9.20 8.98 8.79 9.45 9.67 9.60 9.86 10.12 10.78 11.13 11.76 11.49 11.74 12.80Chemical wood pulp ..... 19.16 20.62 20.25 20.19 22.50 23.69 25.03 26.46 28.53 31.11 32.93 35.97 36.20 37.69 40.50Newsprint . 6 92 7.32 7.41 7.04 7.51 7.89 7.96 7.96 8.05 8.66 8.98 9.86 9.68 9.81 10.70Printing and writing paper 5.16 5.64 5.35 5.71 6.45 6.67 6.87 6.29 7.63 8.11 8.73 9.75 9.56 10.10 11.00Other paper and paperboard . 20.88 21.55 21.00 20.84 22.73 23.00 23.90 25.11 26.23 27.97 29.87 31.65 31.66 32.65 34.60
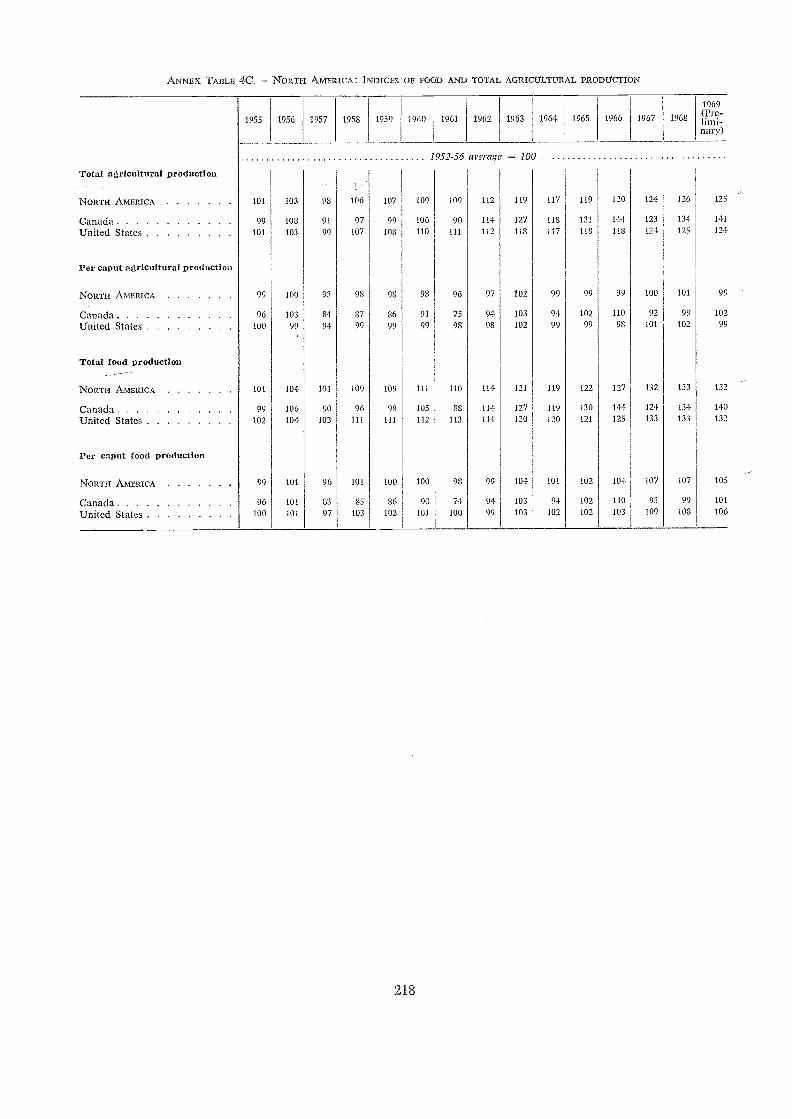
ANNEX TABLE 4C. NORTII AMERICA: INDICES OF FOOD ANO TOTAL AGRICULTURAL PRODUCTION
1955 1956 1957 1958 1959
218
1960 1961
1952-56 average 10()
Total agricultural production
1962 1963 1964 1965 1966 1967 1968
1969(Pre-limi-nary)
-
NORTH AMERICA 101 103 98 106 107 109 109 112 119 117 119 120 124 126 125
Canadi 99 108 91 97 99 106 90 114 127 118 131 144 123 134 141
United States 101 103 99 107 108 110 111 112 118 117 118 118 124 125 124
Per caput agricultural production
NORTH AMERICA 99 100 93 98 98 98 96 97 102 99 99 99 100 101 99
Canadi 96 103 84 87 86 91 75 94 103 94 102 110 92 99 102
United States 100 99 94 99 99 99 98 98 102 99 99 98 101 102 99
Total food production
NORTH AMERICA 101 104 101 109 109 111 110 114 121 119 122 127 132 133 132
Callada 99 106 90 96 98 105 SS 114 127 119 130 144 124 134 140
United States 102 104 103 111 111 112 113 114 120 120 121 125 133 133 132
Per caput food production
NORTH AMERICA 99 101 96 101 100 100 98 99 104 101 102 104 107 107 105
Canad 96 101 63 85 86 90 74 94 103 94 102 110 93 99 101
United States 100 101 97 103 102 101 100 99 103 102 102 103 109 108 106
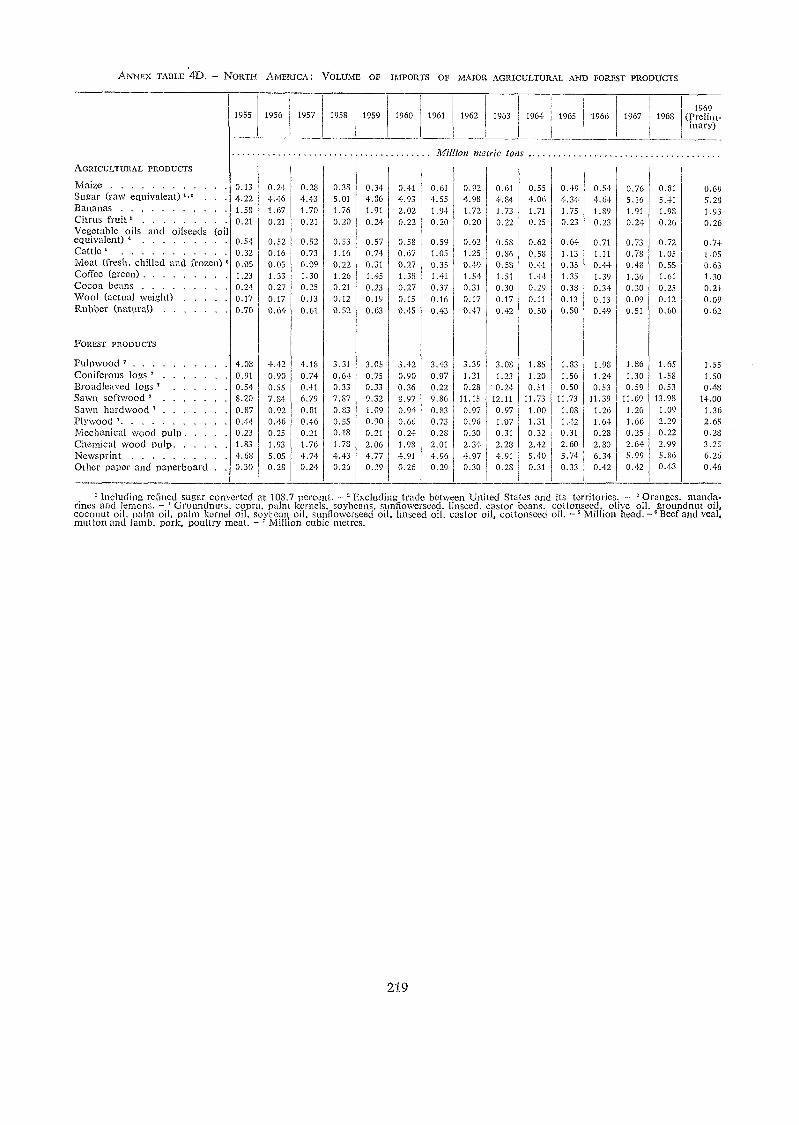
219
'1r-winding refilled sugar corn ertcd at 108.7 puce it. - 'Excluding trade between United States and its territories. - ' Oranges manda-rines and lemons. - ' Groundnuts copra, palm kernels, soybeans, sunflowerseed, linseed, castor beans, cottonseed, olive oil, groundnut oil,coconut oil, palm oil, palm kerne oil, soyfean oil, sunflowerseed oil, linseed oil, castor oil, cottonseed oil. -' Million heacf.--°Beef and veal,mutton and lamb, pork, poultry rneat. - ' Million cuble metres.
ANNEX TABLE '4D. - NORTII AMERICA: VOLUME OF IMPORTS OF MAJOR AGRICULTURAL AND FOREST PRODUCTS
955 1956 1957 1958 1959 1960 1961 1962 1963 1964 1965 1966 1967 19681969
(Prelhn-hlary)
Million metric tonsAGRICULTURAL PRODUCTS
Maize 0.13 0.24 0.28 0.38 0.34 0.41 0.61 0.92 0.61 0.55 0.49 0.54 0.76 0.81 0.69Sugar (raw equivalent) '," 4.22 4.46 4.43 5.01 4.86 4,93 4.55 4.98 4.84 4.06 4.34 4.64 5.16 5.41 5.28Bananas 1.5S 1.67 1.70 1.76 1.91 2.02 1.94 1.72 1.73 1.71 1.75 1.89 1.91 1.98 1.93Citrus fruit 0.21 0.21 0.21 0.20 0.24 0.22 0.20 0.20 0.22 0.25 0.23 0.23 0.24 0.26 0.26Vegetable oils and oilseeds (oilequivalent) 0.54 0.52 0.52 0.53 0.57 0.58 0.59 0.62 0.58 0.62 0.64 0.71 0.73 0.72 0.74Cattle 6 0.32 0.16 0.73 1.16 0.74 0.67 1.05 1.25 0.36 0.58 1.13 1.11 0.78 1.05 1.05Meat (fresh, chilled and frozen) 0.05 0.05 0.09 0.22 0.31 0.27 0.35 0.49 0.53 0.41 0.35 0.44 0.43 0.55 0.63Coffee (green) 2 1.33 1.30 1.26 1.45 1.38 1.41 1.54 1.51 1.44 1.35 1.39 1.36 1.61 1.30Cocoa beans 0.24 0.27 0.25 0.21 0.23 0.27 0.37 0.31 0.30 0.29 0.38 0.34 0.30 0.25 0.24Wool (actual weight) 0.17 0.17 0.13 0.12 0.19 0.15 0.16 0.17 0.17 0.11 0.13 0.13 0.09 0.12 0.09Rubber (natural) 0.70 0.64 0.61 0.52 0.63 0.45 0.43 0.47 0.42 0.50 0.50 0.49 0.51 0.60 0.62
FOREST PRODUCTS
Pulpwood 4 08 4.42 4.18 3.31 3.05 3.42 3.43 3.39 3.08 1.85 1.83 1.98 1.86 1.65 1.55Coniferous logs ' 0.91 0.90 0.74 0.64 0.75 0.90 0.97 1.21 1.23 1.20 1.56 1.24 1.30 1.58 1.50Broadleaved logs ' 0.54 0.55 0.41 0.33 0.33 0.36 0.22 0.28 '0.24 0.51 0.50 0.53 0.59 0.53 0.48Sawn softwood 3.20 7.84 6.79 7.87 9.32 8.97 9.86 11.15 12.11 11.73 11.73 11.39 11.69 13.98 14.00Sawn hardwood 0.87 0.92 0.81 0.83 1.09 0.94 0.83 0.97 0.97 1.00 1.03 1.26 1.20 1.09 1.36Plywood 0.44 0.46 0.46 0.55 0.90 0.66 0.73 0.96 1.07 1.31 1.42 1.64 1.66 2.29 2.65Mechanical wood pulp o 23 0.25 0.21 0.18 0.21 0.24 0.28 0.30 0.31 0.32 0.31 0.28 0.25 0.22 0.28Chemical wood pulp 1.83 1.93 1.76 1.78 2.06 1.98 2.01 2.34 2.28 2.42 2.60 2.30 2.64 2.99 3.25Newsprint 4.68 5.05 4.74 4.43 4.77 4.91 4.96 4.97 4.91 5.40 5.74 6.34 5.99 5.86 6.26Other paper and paperboard 0.30 0.28 0.24 0.26 0.29 0.26 0.29 0.30 0.28 0.31 0.33 0.42 0.42 0.43 0.46
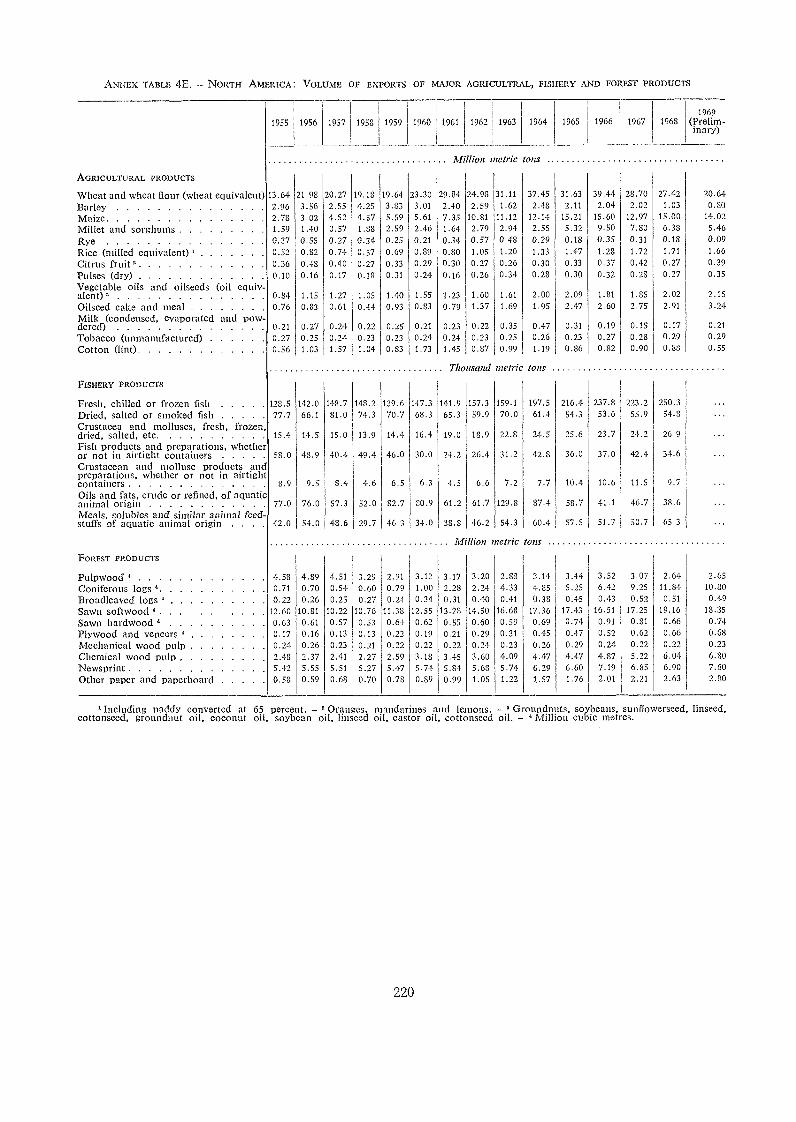
ANNEX TABLE 4E. - NORTH AMERICA . VOLUME OF EXPORTS OF MAJOR AGRICULTRAL, FISHERY ANO FOREST PRODUCTS
220
' Including paddy converted at 65 perce it. - ' Oranges, mandarnes and lemons. - 3 Groundnuts, soybeans, sunflowerseed, linseed,cottonseed, groundnut oil, coconut oil, soybean oil, linseed oil, castor oil, cottonseed oil. - Million cubic metres.
19691955 1956 1957 1953 1959 1960 1961 1962 1963 1964 1965 1966 1967 196$ (Prelim-
inary)
Million t letric tons
AGRICULTURAL PRODUCTS
Wheat and wheat flour (wheat equivalent) 13.64 21.98 20.27 19.18 19.61 23.30 29.84 24.98 31.11 37.45 31.63 39.44 28.70 27.42 20.64
Barley 2.96 3.56 2.55 4.25 3.83 3.01 2.40 2.59 1.62 2.48 2.11 2.04 2.02 1.03 0.80
Maize 2.73 3.02 4.52 4.57 5.59 5.61 7.35 10.81 11.12 12.14 15.21 15.60 12.97 15.00 14.02
Millet and sorghums 1.59 1.40 0.57 1.88 2.59 2.46 1.64 2.79 2.94 2.55 5.32 9.50 7.80 6.38 5.46
Rye 0.37 0.55 0.27 0.34 0.25 0.21 0.34 0.57 0.48 0.29 0.18 0.35 0.31 0.13 0.09Rice (milled equivalent) 0 52 0.82 0.74 0.57 0.69 0.89 0.80 1.05 1.20 1.33 1.47 1.28 1.72 1.71 1.66Citrus fruit 0 36 0.48 0.40 0.27 0.33 0.29 0.30 0.27 0.26 0.30 0.33 0.37 0.42 0.27 0.39Pulses (dry) 0 10 0.16 0.17 0.18 0.31 0.24 0.16 0.26 0.34 0.28 0.30 0.32 0.28 0.27 0.35
Vegetable oils and oilseeds (oil equiv-alent), 0.84 1.15 1.27 1.05 1.40 1.55 1.23 1.60 1.61 2.00 2.09 1.81 1.85 2.02 2.15Oilseed cake and meal 0 76 0.83 0.61 0.44 0.93 0.83 0.79 1.37 1.69 1.95 2.47 2.60 2.75 2.91 3.24Milk (condensed, evaporated and pow-dered) 0.21 0.27 0.24 0.22 0.25 0.21 0.23 0.22 0.35 0.47 0.31 0.19 0.15 0.17 0.21
Tobacco (uninanufactured) 0.27 0.25 0.24 0.23 0.23 0.24 0.24 0.23 0.25 0.26 0.23 0.27 0.28 0.29 0.29
Cotton (lint) 0.56 1.03 1.57 1.04 0.33 1.73 1.45 0.87 0.99 1.19 0.86 0.82 0.90 0.88 0.55
Tho tsand metric tons
FISHERY PRODUCTS
Fresh, chilled or frozen fish 128 5 142.0 148.7 148.2 139.6 147.3 141.9 157.3 159.1 197.5 216.4 237.8 223.2 250.3
Dried, salted or smoked fish 77 7 66.1 81.0 74.3 70.7 68.3 65.3 59.9 70.0 61.4 54.3 53.6 55.9 54.8
Crustacea and molluscs, fresh, frozen,dried, salted, etc 15 4 14.5 15.0 13.9 14.4 16.4 19.0 18.9 22.8 24.5 25.6 23.7 21.2 26.9Fish products and preparations, whetheror not in airtight containers 58 0 48.9 40.4 49.4 46.0 30.0 24.2 26.4 31.2 42.8 36.0 37.0 42.4 34.6
Crustacean and mollusc products andpreparations, whether or not in airtightcontainers $9 9.5 8.4 4.6 6.5 6.3 4.5 6.6 7.2 7.7 10.4 10.6 11.5 9.7
Oils and fats, crude or refined, of aquaticanimal origin 77 0 76.0 57.3 52.0 82.7 80.9 61.2 61.7 129.8 87.4 58.7 41.1 46.7 38.6Meals, solubles and similar animal feed-stuffs of aquatic animal origin . . . . 42.0 54.0 45.6 29.7 46.3 34.0 38.8 46.2 54.3 60.4 57.5 51.7 50.7 65.3
Million metric tons
FOREST PRODUCTS
Pulpwood 4.58 4.89 4.51 3.29 2.91 3.12 3.17 3.20 2.88 3.14 3.44 3.52 3.07 2.64 2.65
Coniferous logs 0.71 0.70 0.54 0.60 0.79 1.00 2.28 2.24 4.33 4.85 5.25 6.42 9.25 11.84 10.80
Broadleaved logs 0.22 0.26 0.25 0.27 0.24 0.34 0.31 0.40 0.41 0.38 0.45 0.43 0.52 0.51 0.49
Sawn softwood 12.60 10.81 10.22 10.76 11.38 12.55 13.28 14.50 16.68 17.36 17.43 16.51 17.25 19.16 18.35
Sawn hardwood 0.63 0.61 0.57 0.53 0.64 0.62 0.55 0.60 0.59 0.69 0.74 0.91 0.81 0.66 0.74.
Plywood and veneers 4 0.17 0.16 0.13 0.13 0.22 0.19 0.21 0.29 0.31 0.45 0.47 0.52 0.62 0.66 0.68Mechanical wood pulp 0.24 0.26 0.23 0.21 0.22 0.22 0.22 0.24 0.23 0.26 0.29 0.24 0.22 0.22 0.23Chemical wood pulp 2.48 2.37 2.41 2.27 2.59 3.1$ 3.45 3.60 4.09 4.47 4.47 4.87 5.22 6.04, 6.80Newsprint 5 42 5.55 5.51 5.27 5.47 5.74 5.84 5.68 5.74 6.29 6.60 7.19 6.85 6.90 7.60
Other paper and paperboard 0.58 0.59 0.68 0.70 0.78 0.89 0.99 1.05 1.22 1.57 1.76 2.01 2.21 2.63 2.80
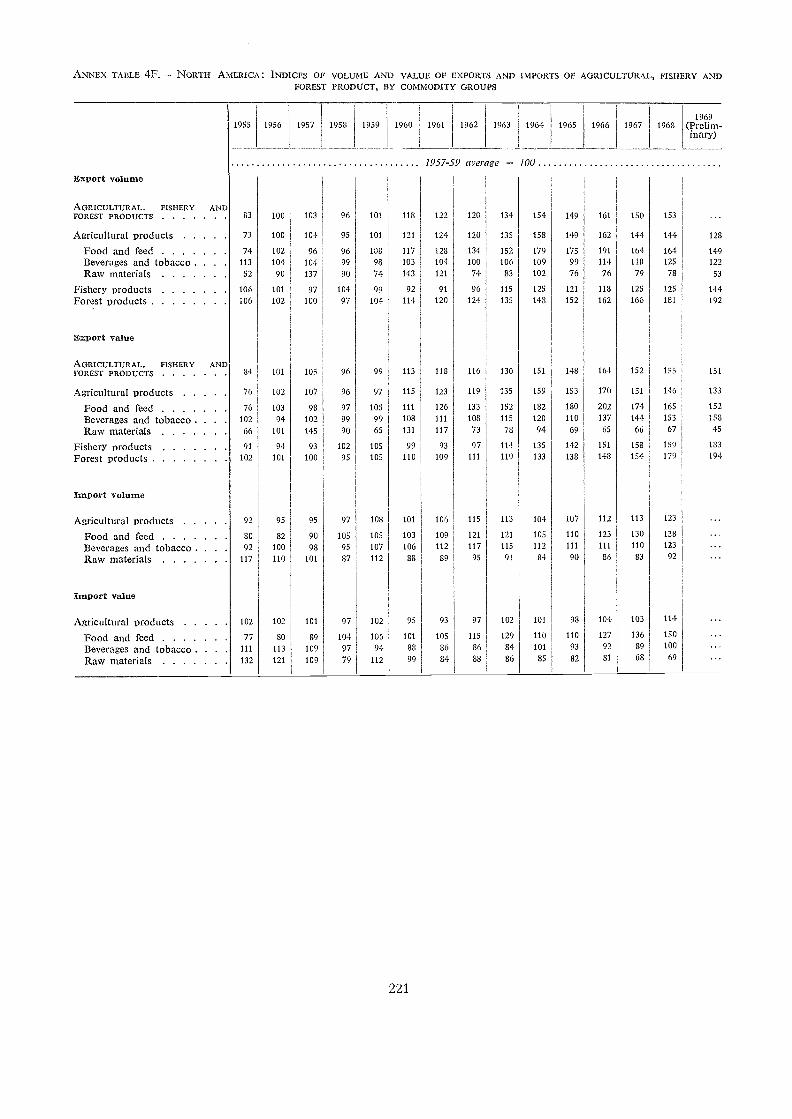
ANNEX TABLE 4F. NORTH AMERICA: INDICES OF VOLUME AND VALUE OF EXPORTS ANO IMPORTS OF AGRICULTURAL, FISHERY ANDFOREST PRODUCT, BY COMMODITY GROUPS
1956
221
1957-59 average 100
118 122 120 134 154 149 161 130 153
121 124 120 135 158 149 162 144 144 128
117 128 134 152 179 175 191 164 164 149103 104 100 106 109 99 114 118 125 122
143 121 74 83 102 76 76 79 78 53
92 91 96 115 125 121 113 125 125 144114 120 124 135 148 152 162 166 181 192
113 113 116 130 151 148 164 152 155 151
115 123 119 135 159 153 170 151 146 133
111 126 133 152 182 180 202 174 165 152
108 111 108 115 120 110 137 144 153 158
131 117 73 78 94 69 65 66 67 45
99 93 97 11-1 135 142 151 158 159 183
110 109 111 119 133 138 148 154 179 194
101 106 115 113 104 107 112 113 123
103 109 121 121 105 110 123 130 138
106 112 117 115 112 111 111 110 123
89 95 91 84 90 86 83 92
95 93 97 102 101 98 104 103 114
101 105 115 129 110 110 127 136 150
88 86 86 84 101 93 92 89 100
99 84 18 86 85 82 81 68 69
Export volume
AGRICULTURAL, FISHERY ANDFOREST PRODUCTS 83 100 103 96 101
Agricultural products 73 100 104 95 101
Food and feed 74 102 96 96 108
Beverages and tobacco . 13 104 104 99 98
Raw materials 52 90 137 90 74
Fishery products 106 101 97 104 99
Forest products 106 102 100 97 104
Export value
AGRICULTURAL, FISHERY ANDFOREST PRODUCTS 84 101 105 96 99
Agricultural products 76 102 107 96 97
Food and feed 76 103 98 97 105
Beverages and tobacco . 102 94 102 99 99
Raw materials 66 101 145 90 65
Fishery products 91 94 93 102 105
Forest products 102 101 100 95 105
Iinport volume
Agricultural products 92 95 95 97 108
Food and feed 80 82 90 105 105
Beverages and tobacco . . . 92 100 98 95 107
Raw materials 117 110 101 87 112
Import value
Agricultural products 102 102 101 97 102
Food and feed 77 80 89 104 106
Beverages and tobacco . . 111 113 109 97 94
Raw materials 132 121 109 79 112
19691960 1961 1962 1963 1964 1965 1966 1967 1968 (Prelim-
inary)1957 1958 1959
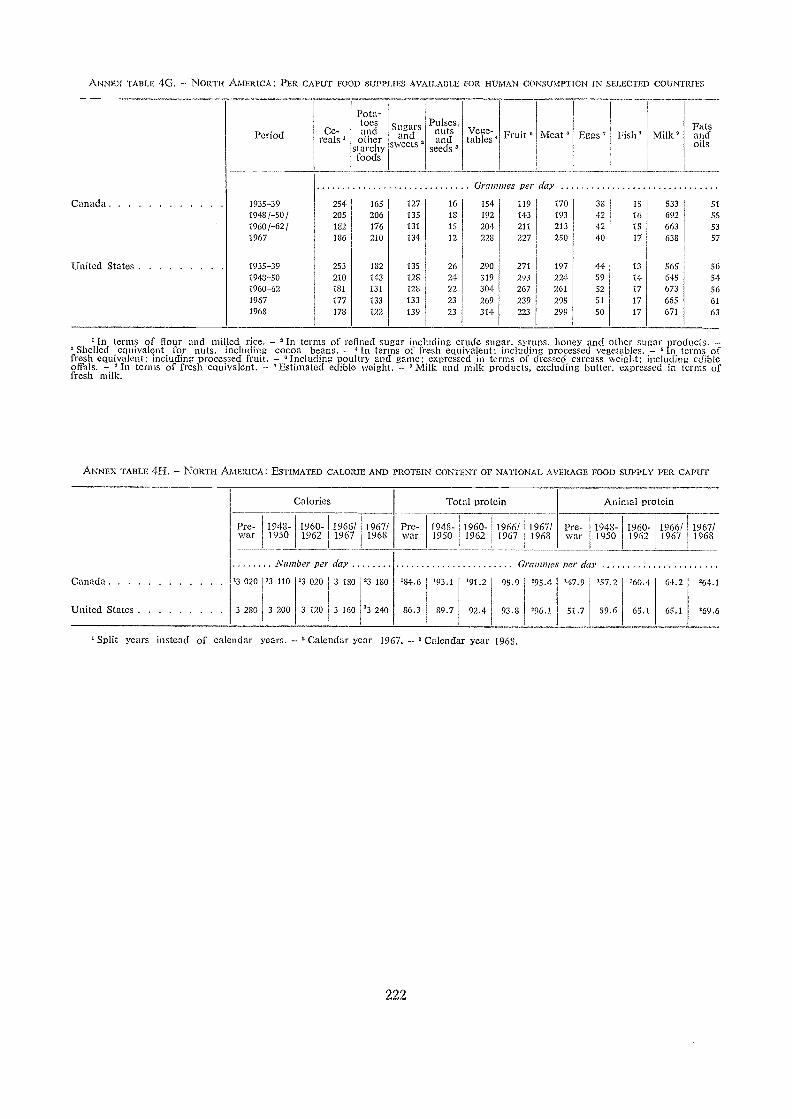
ANNEX TABLE 4G. - NORTH AMERICA: PER CAPUT FOOD SUPPLIES AVAILABLE FOR HUMAN CONSUMPTION IN SELECTED COUNTRIES
Canada
United States
Period Ce-reals
1948- 1960- 1966/1950 1962 1967
NW, ber per day
'3 110 '3 020 3 180
Pota-toesand
otherstarchyfoods
Sugarsand
sweets 2
Grammes per day
254 165 127 16
205 206 135 18
182 176 131 15
186 210 134 12
253 182 135 26210 143 128 24181 131 128 22177 133 133 23
178 122 139 23
'In terms of flour and milled rice. - O In ternas of refined st gar inc uding crude sugar, syrups, honey and other st gar products. -3 Shelled equivalent for nuts, including cocoa beans. - 41n terms of fresh equivalent; including processed vegetables. - In terms offresh equivalent: including processed fruit. - °Including poultry and game: expressed in terms of dressed carcass weight: including edibleoffals. - 'In ternas of fresh equivalent. - 'Estimated edible weight. - ° Milk and milk products, excluding butter, expressed in terms offresh milk.
ANNEX TABLE 41-I. NORTH AMERICA: ESTIMATED CALORIE AND PROTEIN CONTENT OF NATIONAL AVERAGE FOOD SUPI'LY PER CAPUT
222
Pulses,nutsand
seeds2
Vege-tables'
' Split years instead of calendar years. - 'Calendar year 1967. - 'Calendar year 1968.
Fruit 2 Meat
154 119 170192 143 193
204 211 213223 227 250
290 271 197319 293 224304 267 261
269 239 295314 223 299
Eggs ' Fish' Milk°Fatsandoils
38 15 533 51
42 16 692 5542 15 663 53
40 17 638 57
44 13 565 56
59 14 645 5452 17 673 56
51 17 665 61
50 17 671 63
1967/ Pre- 1948- 1960- 1966/ 1967/ Pre- 1948- 1960- 1966/ 1967/1968 war 1950 1962 1967 1968 war 1950 1962 1967 1968
Grwiimes per day
'3 180 '84.6 '93.1 '91.2 95.9 '95.4 '47.9 '57.2 '60.4 64.2 "64 1
'3 240 86.3 89.7 92.4 93.8 396.1 51.7 59.6 65.1 65.1 369 63 200 3 120 3 160
1935-391948/-50/1960/-62/1967
1935-391948-501960-6219671968
Canada
United States
Calorie Total protein Animal protein
Pre-war
'3 020
3 230
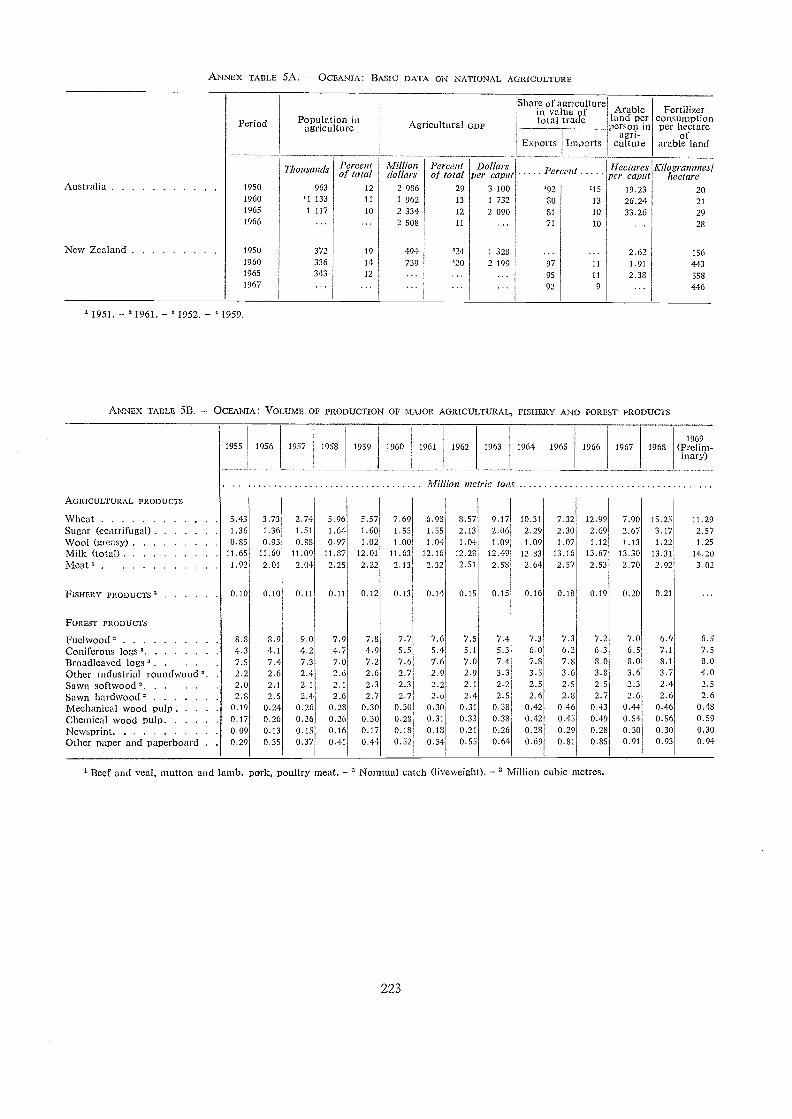
1951. - 1961. - 1952. - 1959.
ANNEX TABLE 5B. - OcEANIA: VOLUME OF PRODUCTION OF MAJOR AGRICULTURAL, FISHERY AND FOREST PRODUCT'S
ANNEX TABLE 5A. - OCEANIA: BASIC DATA ON NATIONAL AGRICULTURE
223
1- Beef and veal, mutton and lamb, pork, poultry meat. - 2 Nominal catch (liveweight). - 3 Million cubic metres.
Period Population inagriculture Agricultural GDP
are of agriculturein value oftotal trade
Arableland perperson in
agri-culture
Fertilizereons'. mptionper 1;ectare
ofarable land
1
Fxports Imports
Thousands Percentof total
Milliondollars
Percentof total
Dollarsper caplet Percent Hectares
per caputKilogrammes"
hectareAustralia 1950 963 12 2 9S6 29 3 100 .92 .15 19.23 20
1960 '1 133 11 1 962 13 1 732 80 13 26.24 211965 1 117 10 2 334 12 2 090 81 10 33.26 291966 ... ... 2 508 11 ... 71 10 28
New Zealand 1950 372 19 494 '24 1 328 ... 2.62 1561960 336 14 739 "20 2 199 97 11 1.91 4431965 343 12 ... ... ... 95 11 2.38 5581967 ... ... ... ... 92 9 4-46
1955 1956 1957 1958 1959 1960 1961
Mill
1962
ion metric
1963
tons
1964 1965 1966 1967 19681969
(Prelim-inary)
AOR1CuLTuRAL PRODUCTS
Wheat 5 43 3.73 2.74 5.96 5.57 7.69 6.98 3.57 9.17 10.31 7.32 12.99 7.90 15.25 11.29Sugar (centrifugal) 1 36 1.36 1.51 1.64 1.60 1.55 1.55 2.13 2.06 2.29 2.30 2.69 2.67 3.17 2.57Wool (grcasY) 0 85 0.93 0.88 0.97 1.02 1.00 1.04 1.04 1.09 1.09 1.07 1.12 1.13 1-22 1.25Milk (total) 11 65 11.60 11.09 11.87 12.01 11.63 12.16 12.28 12.49 12.83 13.16 13.67 13.30 13.31 14.20Meat 1.92 2.01 2.04 2.25 2.22 2.13 2.32 2.51 2.58 2.64 2.57 2.53 2.70 2.92 3.02
FISHERY PRODuCTS 0 10 0.10 0.11 0.11 0.12 0.13 0.14 0.15 0.15 0.16 0.18 0.19 0.20 0.21
FOREST PRODUCTS
Fuclwood 8.8 8.9 9.0 7.9 7.8 7.7 7.6 7.5 7.4 7.3 7.3 7.2 7.0 6.9 6.5Coniferous logs ° . 4.3 4.1 4.2 4.7 4.9 5.5 5.4 5.1 5.3 6.0 6.2 6.3 6.5 7.1 7.5
Broadleaved logs ' 7.5 7.4 7.3 7.0 7.2 7.6 7.6 7.0 7.4 7.8 7.8 8.0 8.0 8.1 8.0Other industrial roundwood 3. 2.2 2.6 2.4 2.6 2.6 2.7 2.9 2.9 3.3 3.5 3.6 3.8 3.6 3.7 4.0Sawn softwood 2.0 2.1 2.1 2.1 2.3 2.3 2.2 2.1 2.2 2.5 2.5 2.5 2.3 2.4 2.5Sawn hardwood 2.8 2.5 2.4 2.6 2.7 2.7 2.6 2.4 2.5 2.6 2.8 2.7 2.6 2.6 2.6Mechanical wood pulp 0 19 0.24 0.26 0.28 0.30 0.30 0.30 0.31 0.38 0.42 0.46 0.43 0.44 0.46 0.48Chemical wood pulp 0.17 0.26 0.26 0.26 0.30 0.28 0.31 0.33 0.38 0.42 0.45 0.49 0.54 0.56 0.59Newsprint . 0 09 0.13 0.15 0.16 0.17 0.18 0.18 0.21 0.26 0.28 0.29 0.28 0.30 0.30 0.30Other paper and paperboard . 0.29 0.35 0.37 0.44 0.44 0.52 0.54 0.55 0.64 0.69 0.81 0.85 0.91 0.93 0.94
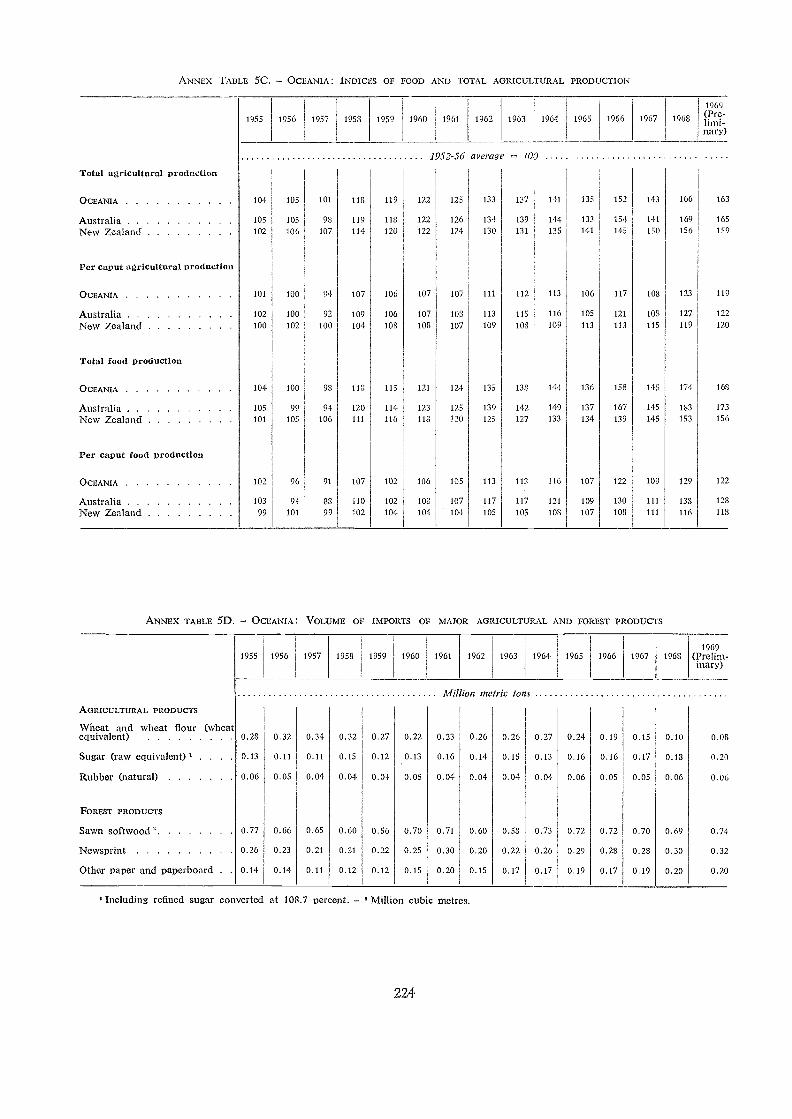
224
' Including refilled sugar converted at 108.7 percent. - Million cubic metres.
ANNEX TABLE 5C. - OCEANIA : INDICES OF FOOD AND TOTAL AGRICULTURAL PRODUCTION
1955 1956 1957 1958 1959 1960 1961 1962 1963 1964 1965 1966 1967 1968
1969(Pre-limi-nary)
1952-56 average 100
Total agricultural production
OCEANIA 104 105 101 118 119 122 125 133 137 141 135 152 143 166 163
Australia 105 105 98 119 113 122 126 134 139 144 133 154 141 169 165
New Zealand. 102 106 107 114 120 122 124 130 131 135 141 145 150 156 159
Per caput agricultural production
OCEANIA 101 100 107 106 107 107 111 112 113 106 117 103 123 119
Australia 102 100 92 109 106 107 103 113 115 116 105 121 108 127 122
NeW Zealand 100 102 100 104 108 108 107 109 103 109 113 113 115 119 120
Total food production
OCEANIA 104 100 98 118 113 121 124 135 138 144 136 158 145 174 163
Australi 105 99 94 120 114 123 125 139 142 149 137 167 145 183 173
New Zealand 101 105 106 116 118 120 125 127 133 134 139 145 153 156
Per caput food production
OCEANIA 102 96 91 107 102 106 105 113 113 116 107 122 109 129 122
Australia 103 94 88 110 102 108 107 117 117 121 109 130 111 138 128
New Zealand 99 101 99 102 104 104 104 105 105 103 107 103 111 116 118
ANNEX TABLE 5D. - OCEANIA: VOLUME OF IMPORTS OF MAJOR AGRICULTURAL AND FOREST PRODUCTS
1955 1956 1957 1958 1959 1960 1961 1962 1963 1964 1965 1966 1967 19681969
(Prelim-inary)
Million metric tors
AGRICULTURAL PRODUCTS
Wheat and wheat flour (wheatequivalent) 0.28 0.32 0.34 0.32 0.27 0.22 0.23 0.26 0.26 0.27 0.24 0.19 0.15 0.10 0.08
Sugar (raw equivalent) . . . . 0.13 0.11 0.11 0.15 0.12 0.13 0.16 0.14 0.15 0.13 0.16 0.16 0.17 0.18 0.20
Rubber (natural) 0.06 0.05 0.04 0.04 0.04 0.05 0.04 0.04 0.04 0.04 0.06 0.05 0.05 0.06 0.06
FOREST PRODUCTS
Sawn softwood ' 0.77 0.66 0.65 0.60 0.56 0.70 0.71 0.60 0.58 0.73 0.72 0.72 0.70 0.69 0.74
Newsprint 0.26 0.23 0.21 0.31 0.22 0.25 0.30 0.20 0.22 0.26 0.29 0.28 0.23 0.30 0.32
Other paper and paperboard . . 0.14 0.14 0.11 0.12 0.12 0.15 0.20 0.15 0.17 0.17 0.19 0.17 0.19 0.20 0.20
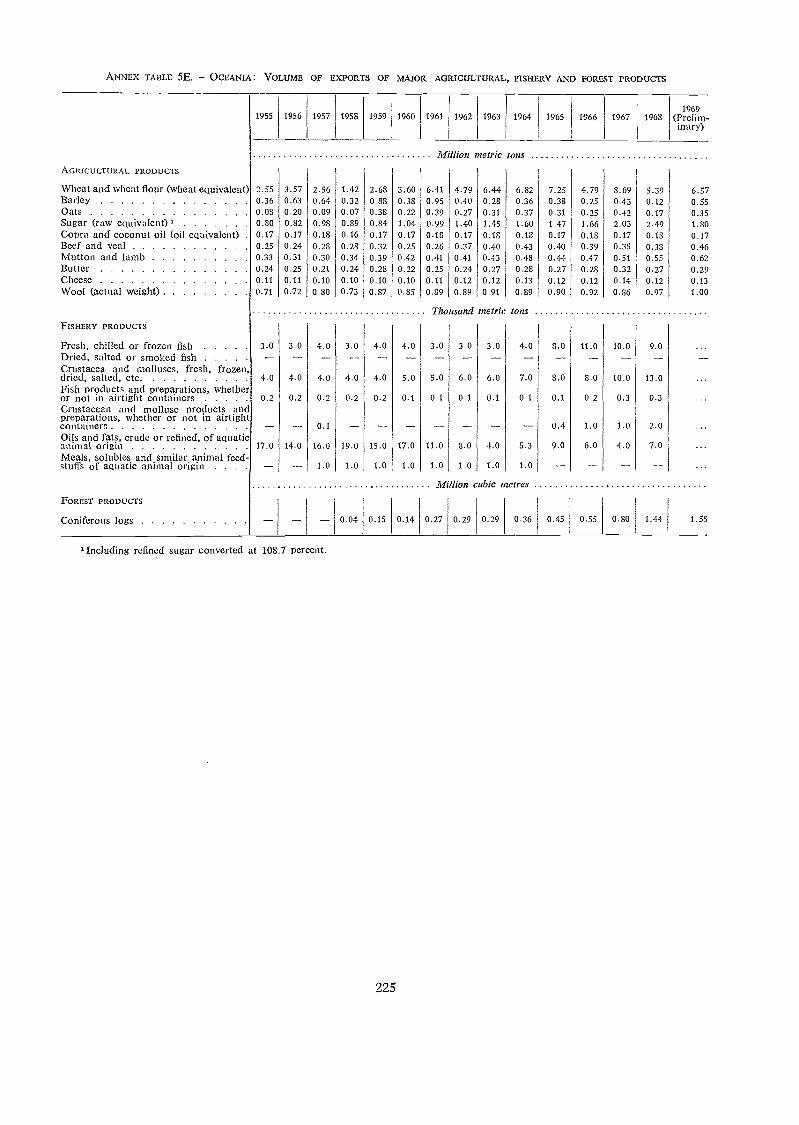
ANNEX TABLE 5E. - OCEANIA: VOLUME OF EXPORTS OF MAJOR AGRICULTURAL, FISHERY AND FOREST PRODUCTS
Including refined sugar converted at 108.7 percent.
225
1955 1956 1957 1958 1959 1960 1961 1962 1963 1964 1965 1966 1967 19681969
(Prelim-inary)
Million tnetric tons .
AGRICULTURAL PRODUCTS
Wheat and wheat flour (wheat equivalent) 2.55 3.57 2.56 1.42 2.68 3.60 6.41 4.79 6.44 6.82 7.25 4.79 8.69 5.39 6.57Barley 0.36 0.63 0.64 0.32 0.88 0.38 0.95 0.40 0.28 0.36 0.38 0.25 0.43 0.12 0.55Oats 0.08 0.20 0.09 0.07 0.38 0.22 0.39 0.27 0.31 0.37 0.31 0.25 0.42 0.17 0.35Sugar (raw equivalent) 0.80 0.82 0.98 0.89 0.84 1.04 0.99 1.40 1.45 1.60 1.47 1.66 2.03 2.49 1.80Copra and coconut oil (oil equivalent) . 0.17 0.17 0.18 0.16 0.17 0.17 0.18 0.17 0.18 0.18 0.17 0.18 0.17 0.18 0.17Beef and veal 0 25 0.24 0.28 0.28 0.32 0.25 0.26 0.37 0.40 0.43 0.40 0.39 0.35 0.38 0.46Mutton and lamb 0.33 0.31 0.30 0.34 0.39 0.42 0.41 0.41 0.43 0.48 0.44 0.47 0.51 0.55 0.62Butter 0.24 0.25 0.21 0.24 0.28 0.22 0.25 0.24 0.27 0.28 0.27 0.28 0.32 0.27 0.29Cheese 0.11 0.11 0.10 0.10 0.10 0.10 0.11 0.12 0.12 0.13 0.12 0.12 0.14 0.12 0.13Wool (actual weight) 0 71 0.72 0.80 0.73 0.87 0.85 0.89 0.89 0.91 0.89 0.90 0.92 0.86 0.97 1.00
Thousand metric tonsFISHERY PRODUCTS
Fresh, chilled or frozen fish 3 0 3.0 4.0 3.0 4.0 4.0 3.0 3.0 3.0 4.0 8.0 11.0 10.0 9.0Dried, salted or smoked fishCrustacea and molluscs, fresh, frozen,dried, salted, etc . 4 0 4.0 4.0 4.0 4.0 5.0 5.0 6.0 6.0 7.0 8.0 8.0 10.0 13.0Fish products and preparations, whetheror not in airtight containers 02 0.2 0.2 0.2 0.2 0.1 0.1 0.1 0.1 0.1 0.1 0.2 0.3 0.3Crustacean and mollusc products andpreparations, whether or not in airtightcontainers __ -- 0.1 __ __ __ 0.4 1.0 1.0 2.0Oils and fats, crude or refined, of aquaticanimal origin 17 0 14.0 16.0 19.0 15.0 17.0 11.0 8.0 4.0 5.3 9.0 6.0 4,0 7.0Meals, solubles and similar animal feed-stuffs of aquatic animal origin . . . -- 1.0 1.0 1.0 1.0 1.0 1.0 1.0 1.0
Million cubic metres
FOREST PRODUCTS
Coniferous logs -- 0.04 0.15 0.14 0.27 0.29 0.29 0.36 0.45 0.55 0.80 1.44 1.55
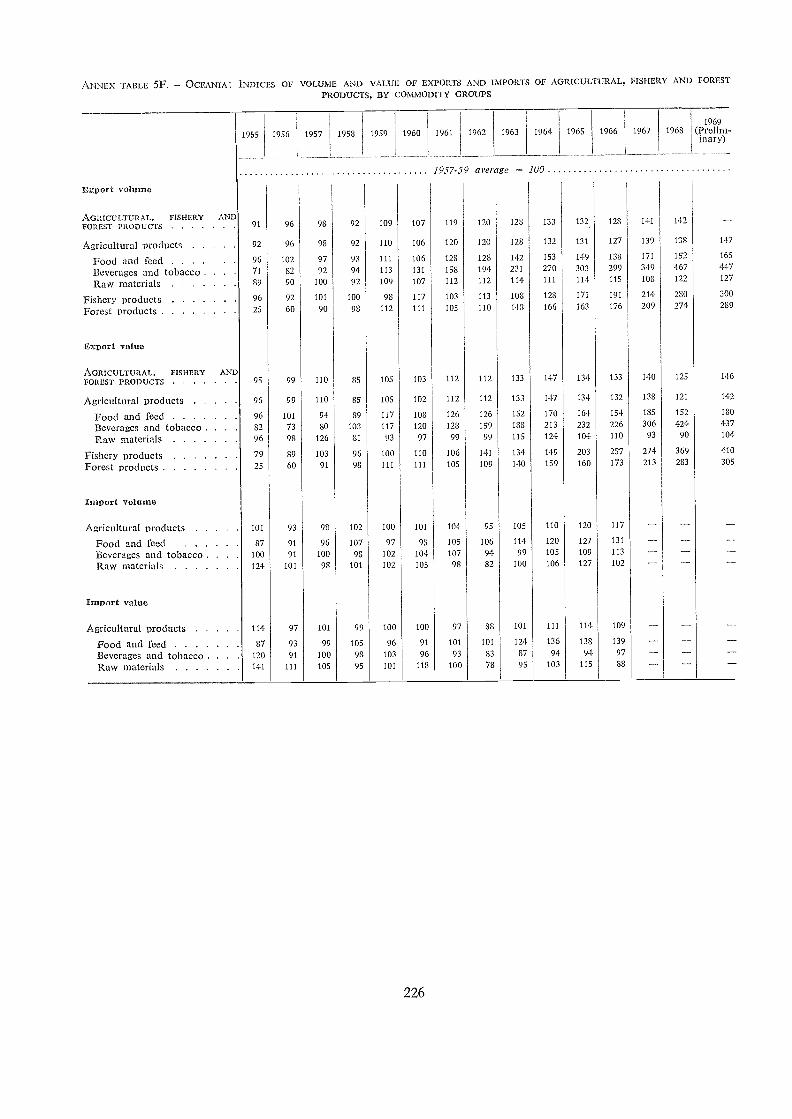
ANNEX TABLE 5F. OCEANIA: INDICES OF VOLUME AND VALUE OF EXPORTS AND IMPORTS OF AGRICULTURAL, FISHERY AND FOREST
PRODUCTS, BY COMMODITY GROUPS
1955 1956 1957 1958 1959 1960
226
1961 1962 1963 1964 1965 1966 1967 19681969
(Prelim-inary)
Export volume
1957-59 average = 100
AGRICULTURAL, FISHERY ANDFOREST PRODUCTS 91 96 98 92 109 107 119 120 128 133 132 128 141 142
Agricultural products 92 96 98 92 110 106 120 120 123 132 131 127 139 138 147
Food and feed 96 102 97 93 111 106 128 128 142 153 149 138 171 152 165
Beverages and tobacco . . 71 82 92 94 113 131 158 194 231 270 303 299 349 467 447
Raw materials 89 90 100 92 109 107 112 112 114 111 114 115 108 122 127
Fishery products 96 92 101 100 98 117 103 113 108 128 171 191 214 280 300
Forest products 25 60 90 98 112 111 105 110 143 166 163 176 209 274 289
Export value
AGRICULTURAL, FISHERY ANDFOREST PRODUCTS 95 99 110 85 105 103 112 112 133 147 134 133 140 125 146
Agricultural products 96 99 110 85 105 102 112 112 133 147 134 132 138 121 142
Food and feed 96 101 94 89 117 108 126 126 152 170 164 154 185 152 180
Beverages and tobacco . 82 73 80 103 117 120 128 159 188 213 232 226 306 424 437
Raw materials 96 98 126 SI 93 97 99 99 115 124 104 110 93 90 104
Fishery products 79 89 103 96 100 110 106 141 134 149 203 257 274 369 410
Forest products 25 60 91 98 111 111 105 109 140 159 160 173 213 283 305
Import volume
Agricultural products 101 93 98 102 100 101 104 95 105 110 120 117
Food and feed 87 91 96 107 97 95 105 106 114 120 127 131
Beverages and tobacco . . 00 91 100 98 102 104 107 94 99 105 109 113
Raw materials 24 101 93 101 102 105 98 82 100 106 127 102
Import value
Agricultural products 114 97 101 99 100 100 97 SS 101 111 114. 109
Food and feed 87 93 99 105 96 91 101 101 124 136 138 139
Beverages and tobacco . . 20 91 100 98 103 96 93 83 87 94 94 97
Raw materials 41 111 105 95 101 118 100 78 95 103 115 83
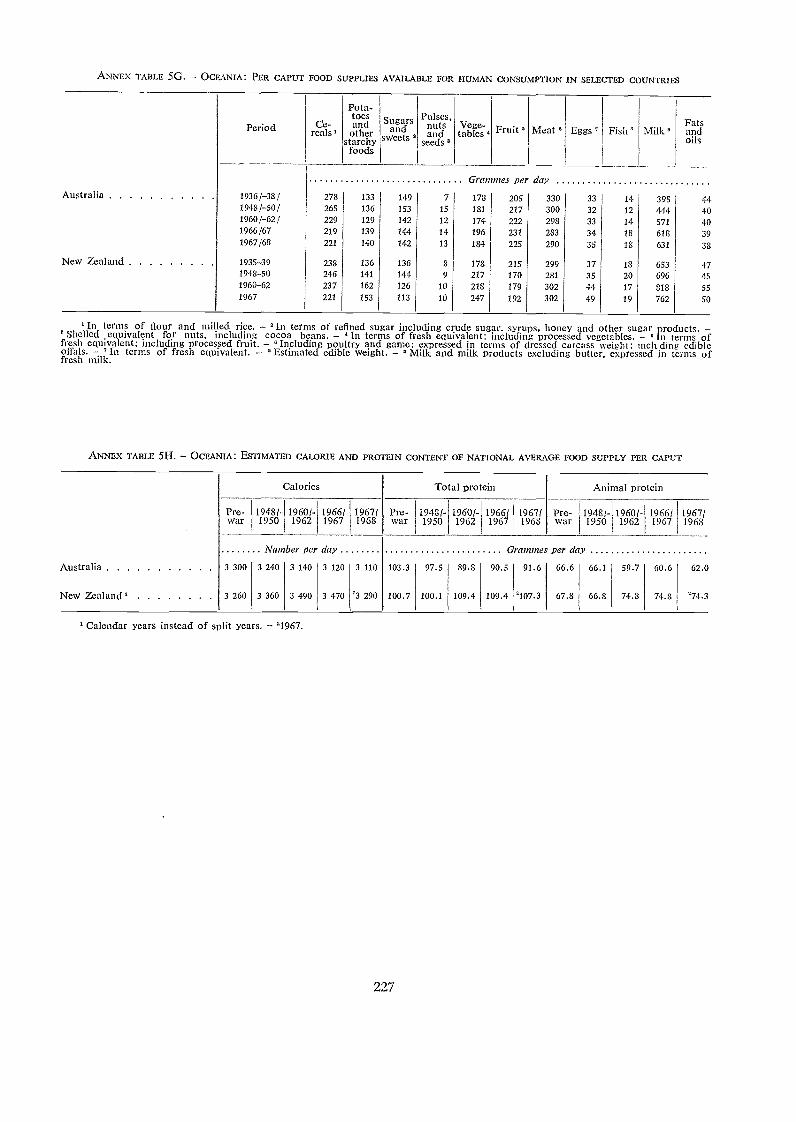
ANNEX TAI3LE 5G. OCEANIA: POR CAPUT FOOD SUPPLIES AVAILAI3LE FOR HUMAN CONSUMPTION IN SELECTED COUNTRIES
Australia
New Zealand'
Pre-war
3 260
Period
1948t1950
3 360
Calories
1960/-1962
3 490
Ce-reals'
Grammes per day
278 133 149 7 173 205 330 33 14 395 44265 136 153 15 181 217 300 32 12 414 40229 129 142 12 174 222 298 33 14 571 40219 139 144 14 196 231 283 34 18 618 39221 140 142 13 184 225 290 35 18 631 38
238 136 136 S 178 215 299 37 18 653 47246 141 144 9 217 170 281 35 20 696 45237 162 126 10 218 179 302 44 17 813 55221 153 113 10 247 192 302 49 19 762 50
1966/1967
Nun ber per day
3 470
Pota-toesandother
starchyfoods
1967/1968
'3 290
Sugarsand
sweets
Pre-war
100.7
Pulses,nutsand
seeds
1950
100.1
Vege-tables '
Total protein
1962
109.4
Fruit
1966f1967
109.4
1967/1968
2107.3
Meat
Pre-war
67.8
Eggs,
Ani nal protein
1948f-1950
66.8
Fish'
1960/-1962
74.8
Milk
1966/1967
74.8
Fatsandoils
1967/1968
174.3
fresh equivalent; including processed fruit. - 'Including poultry and game: expressed in terms of dressed carcass weight: including ediblefresh milk.offals. - In terms of fresh equivalent. - Estimatcd edible Weight. - °Milk and milk products excluding butter, expressed in terms of
Shelled equivalent for nuts, ncluding cocoa beans. - 'In terms of fresh equivalent; including processed vegetables. - In terms ofIn terms of flour and mi led rice. - 'In terms of refilled sugar including crude sugar, syrups, honey and other sugar products. -
ANNEX TABLE 51-1. - OCEANIA: ESTIMATED CALORIE AND PROTEIN CONTENT OF NATIONAL AVERAGE FOOD SUPPLY PER CAPUT
' Calendar years instead of split years. - 1967.
227
Grammes per day
103.3 97.5 89.8 90.5 91.6 66.6 66.1 59.7 60.6 62.0
Australia
New Zealand
1936/-38/1948/-50/1960/-62/1966/671967/68
1935-391943-501960-621967
1948f- 1960f-
3 300 3 240 3 140 3 120 3 110
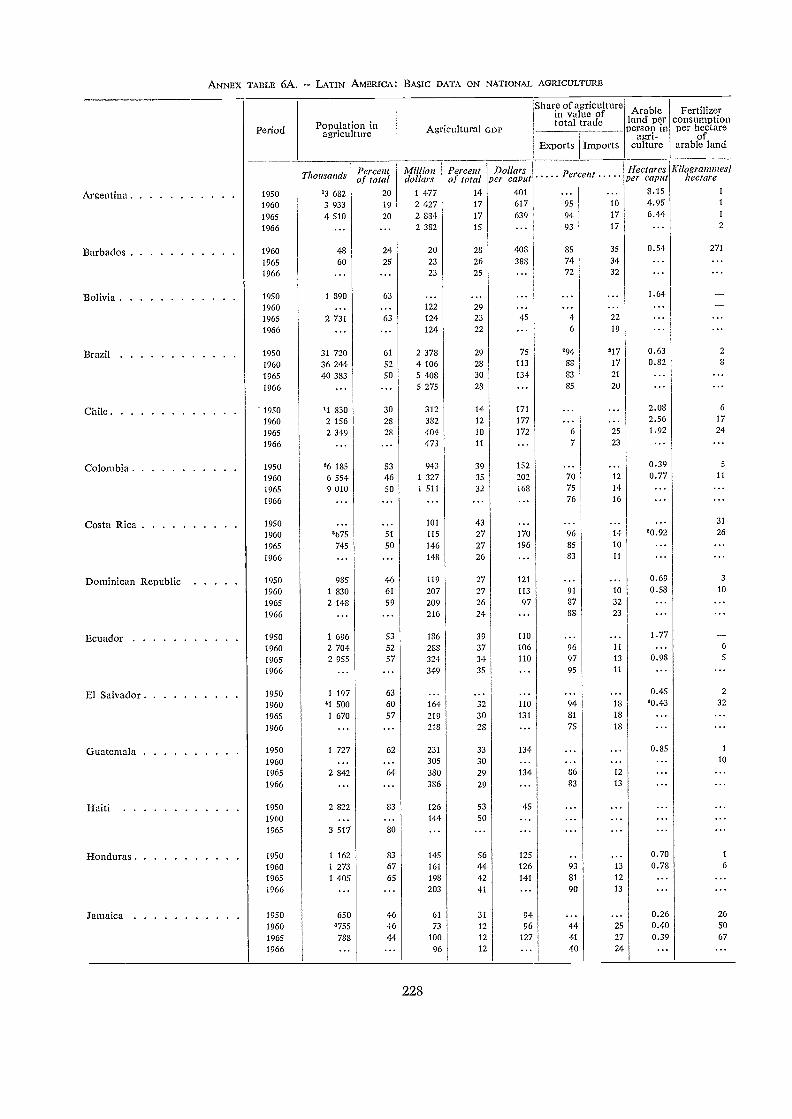
ANNEX TABLE 6A. LATIN AMERICA. BASIC DATA ON NATIONAL AGRICULTURE
228
Period Populationrein
agrictdtu Agricultural GDP
Share ofagriculturein value oftotal trade
Arableland perperson in
agri-culture
Fertilizerconsurnptionper hectare
ofarable landExports Imports
Thousands Percentof total
Milliondollars
Percentoftotal
Dollarsper caput Percent Hectares
per caputlidogrannnest
hectare
Argentina 1950 '3 682 20 1 477 14 401 ... 8.15 I
1960 3 933 19 2 427 17 617 95 10 4.95 1
1965 4 510 20 2 884 17 639 94 17 6.44 1
1966 ... ... 2 382 15 ... 93 17 ... 2
Barbados 1960 48 24 20 28 408 85 35 0.54 271
1965 60 25 23 26 388 74 34 ...1966 ... ... 23 25 ... 72 32 ...
Bolivia 1950 1 890 63 ... ... ... 1.64
1960 ... ... 122 29 ... ...1965 2 731 63 124 23 45 4 22 ...1966 ... ... 124 22 ... 6 19
Brazil 1950 31 720 61 2 378 29 75 194 '17 0.63 2
1960 36 244 52 4 106 28 113 88 17 0.82 8
1965 40 383 50 5 408 30 134 33 21 ... ...1966 ... ... 5 275 28 ... 85 20
Chile 1950 'I 830 30 312 14 171 2.08 6
1960 2 156 28 382 12 177 ... ... 2.56 17
1965 2 349 28 404 10 172 6 25 1.92 24
1966 ... 473 11 ... 7 23 ... ...
Colombia 1950 '6 185 53 943 39 152 ... ... 0.39 5
1960 6 554 46 1 327 35 202 70 12 0.77 11
1965 9 010 50 1 511 32 168 75 14 ... ...1966 ... ... ... ... ... 76 16 ... ...
Costa Rica 1950 ... 101 43 ... ... ... ... 31
1960 '575 51 115 27 170 96 14 '0.92 26
1965 745 50 146 27 196 85 10 ... ...1966 ... ... 148 26 ... 83 11
Dominican Republic 1950 985 46 119 27 121 ... ... 0.69 3
1960 1 830 61 207 27 113 91 10 0.58 10
1965 2 148 59 209 26 97 87 32 ...1966 216 24 ... 38 23 ...
Ecuador 1950 1 696 53 186 39 110 ... ... 1.77 --1960 2 704 52 288 37 106 96 11 ... 6
1965 2 955 57 324 34 110 97 13 0.98 5
1966 ... ... 349 35 ... 95 11 ...
El Salvador 1950 1 197 63 ... ... ... ... ... 0.45 2
1960 '1 500 60 164 32 110 94 18 '0.43 32
1965 1 670 57 219 30 131 81 18 ... ...1966 ... 218 28 75 18 ... ...
Guatemala 1950 1 727 62 231 33 134 0.85 1
1960 ... ... 305 30 ... ... ... ... 10
1965 2 842 64 380 29 134 86 12 ... ...1966 ... ... 386 29 ... 83 13
Haiti 1950 2 822 83 126 53 45
1960 ... ... 144 50 ... ... ...1965 3 517 80 ... ... ...
Honduras 1950 1 162 83 145 56 125 .. ... 0.70 1
1960 1 273 67 161 44 126 93 13 0.78 6
1965 1 405 65 198 42 141 SI 12 ...1966 ... ... 203 41 ... 90 13 ...
Jamaica 1950 650 46 61 31 94 ... ... 0.26 261960 '755 46 73 12 96 44 25 0.40 50
1965 783 44 100 12 127 41 27 0.39 67
1966 ... ... 96 12 ... 40 24 ... ...
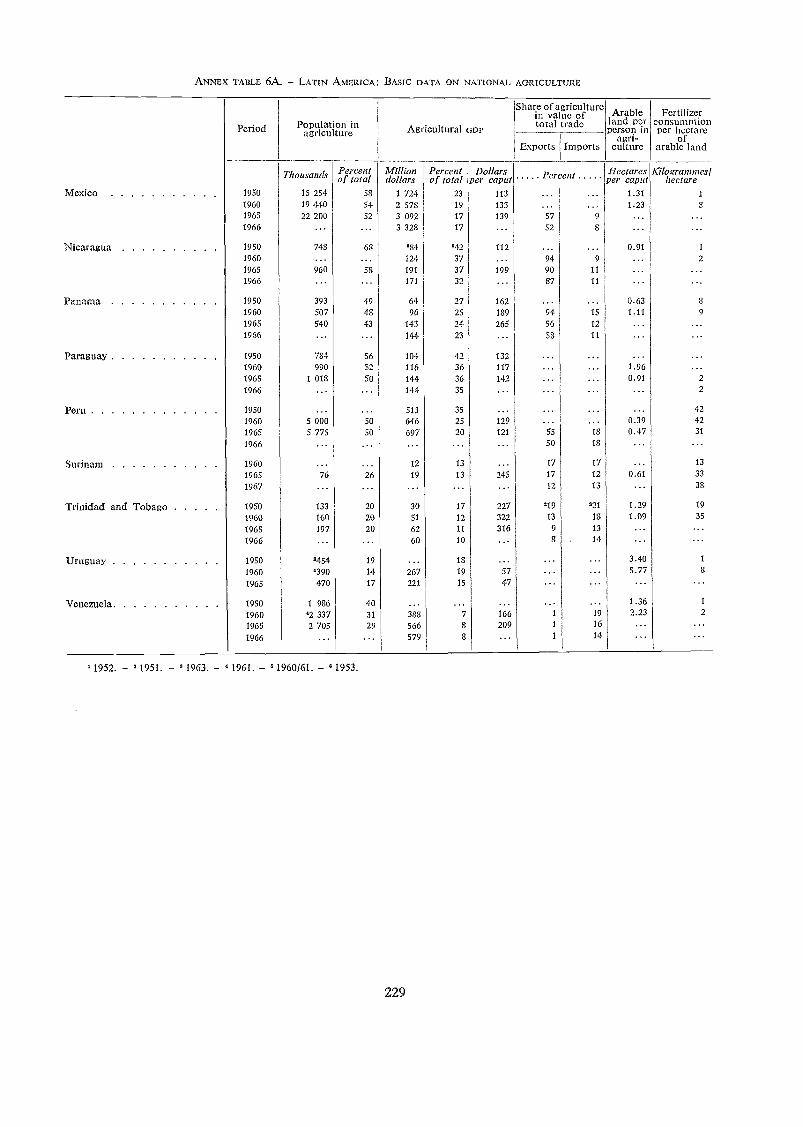
ANNEX TABLE 6A. LATIN AMERICA. BASIC DATA ON NATIONAL AGRICULTURE
' 1952. 2 1951. '1963. 1961. 1960/61. ' 1953.
229
Period Population inagriculture Agdcultural GDP
Shamofagriculturein va uc oftotal trade
Arableland perperson in
agri-ctdture
Fertilizerconsumptionper hectare
ofarable landExports Imports
Thousands Percentof total
Milliondollars
Percentof total
Dollarsper capta Percent Hectares
per caputKilogrammes'
hectareMexico 1950 15 254 58 1 724 23 113 ... 1.31 1
1960 19 440 54 2 578 19 133 1.23 8
1965 22 200 52 3 092 17 139 57 9 ... ...1966 ... ... 3 328 17 ... 52 S ...
Nicaragua 1950 74S 68 '84 "42 112 ... ... 0.91 1
1960 ... ... 124 37 ... 94 9 2
1965 960 58 191 37 199 90 11 ...1966 ... ... 171 32 ... 87 11 ... ...
Panama 1950 393 49 64 27 162 0.63 8
1960 507 48 96 25 189 94 15 1.11 9
1965 540 43 143 24 265 56 12 ...1966 ... ... 144 23 ... 53 11
Paraguay 1950 784 56 104 42 132 --1960 990 52 116 36 117 1.96 ...1965 1 018 50 144 36 142 ... 0.91 2
1966 ... ... 144. 35 ... ... 2
Peru 1950 ... ... 513 35 ... ... ... 421960 5 000 50 646 25 129 ... ... 0.39 421965 5 775 50 697 20 121 55 18 0.47 31
1966 ... ... ... ... 50 18 ... ...
Surinam 1960 12 13 ... 17 17 ... 13
1965 76 26 19 13 245 17 12 0.61 33
1967 ... ... ... ... 12 13 ... 38
Trinidad and Tobago 1950 133 20 30 17 227 219 '21 1.29 19
1960 160 20 51 12 322 13 18 1.09 35
1965 197 20 62 11 316 9 13 ... ...1966 ... ... 60 10 ... 8 14 ... ...
Uruguay 1950 '454 19 ... 18 ... 3.40 1
1960 '390 14 267 19 57 ... 5.77 8
1965 470 17 221 15 47 ... ...
Venezuela 1950 1 986 40 ... ... ... ... 1.36 1
1960 '2 337 31 388 7 166 1 19 2.23 2
1965 2 705 29 566 8 209 1 16 ...1966 ... ... 579 8 ... 1 14
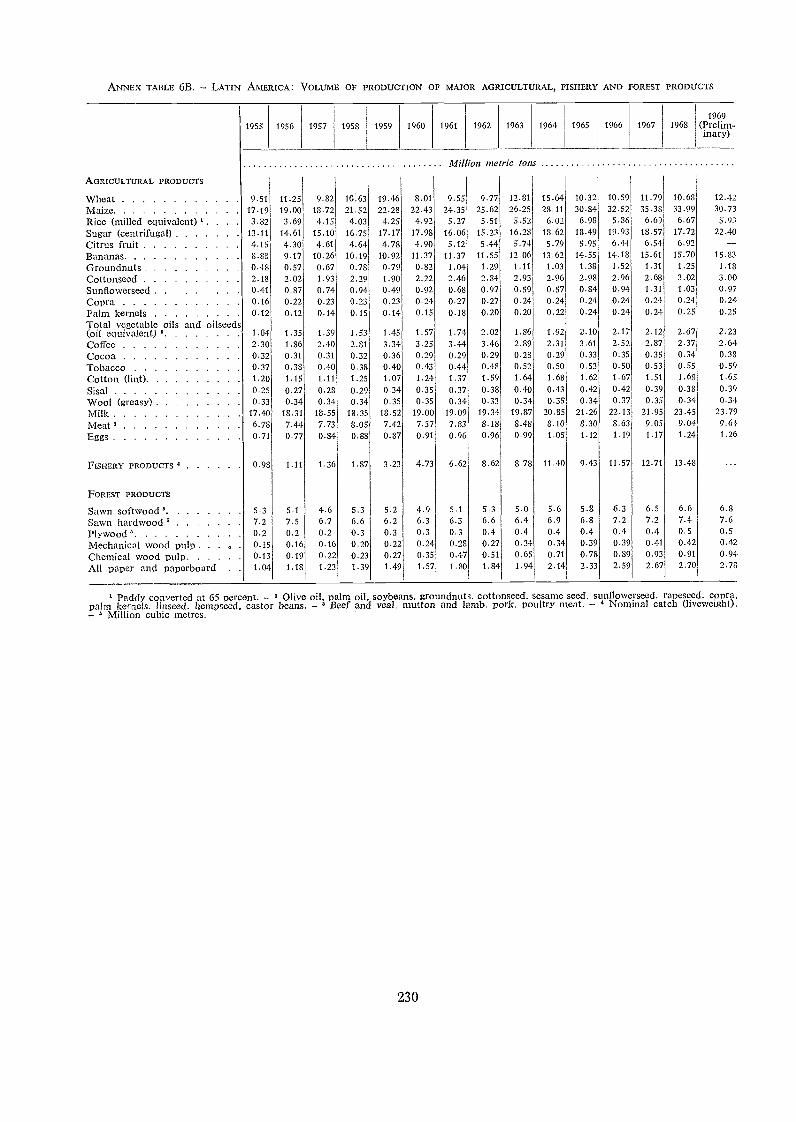
ANNEX TABLE 6B. - LATIN AMERICA: VOLUME OF PRODUCTION OF MAJOR AGRICULTURAL, FISHERY AND FOREST PRODUCTS
230
' Paddy converted at 65 percent. - Olive oil, palm oil, soybeans, groundnuts, cottonseed. sesame seed, sunflowerseed, rapeseed, copra,pa/m Icernels. linseed, her-linseed, castor beans. - 3 Beef and veal, mutton and lamb. pork, poultry meat. - 4 Nominal catch (liveweight).- Million cubic metres.
1955 1956 1957 1958 1959 1960 1961 1962 1963 1964 1965 1966 1967 19681969
(Prelim-inary)
Million me ric tons .
AGRICULTURAL PRODUCTS
Wheat 9 51 11.25 9.82 1063 19.46 8.01 9.55 9.77 12.81 15.64 10.32 10.59 11.79 10.68 12.42
Maize 17 19 19.00 18.72 21.52 22.28 22.43 24.35 25.62 26.25 28.11 30.84 32.52 35.38 33.99 30.73
Rice (milled equivalent) . 3.82 3.69 4.15 4.03 4.25 4.92 5.27 5.51 5.52 6.02 6.98 5.86 6.69 6.67 5.93
Sugar (centrifugal) 13 11 14.61 15.10 16.75 17.17 17.98 16.06 15.23 16.28 18.62 18.49 19.93 18.57 17.72 22.40
Citrus fruit 4 15 4.30 4.61 4.64 4.78 4.90 5.12 5.44 5.74 5.79 5.95 6.44 6.54 6.92 --Bananas S 88 9.17 10.26 10.19 10.92 11.37 11.37 11.55 12.06 13.62 14.55 14.18 15.61 15.70 15.83
Groundnuts 0 48 0.57 0.67 0.78 0.79 0.82 1.04 1.29 1.11 1.03 1.38 1.52 1.31 1.25 1.18
Cottonseed 2 18 2.02 1.93 2.29 1.90 2.22 2.46 2.84 2.93 2.96 2.98 2.96 2.68 3.02 3.00Sunflowerseed 0 41 0.87 0.74 0.94 0.49 0.92 0.68 0.97 0.59 0.57 0.84 0.94 1.31 1.03 0.97
Copra 0 16 0.22 0.23 0.23 0.23 0.24 0.27 0.27 0.24 0.24 0.24 0.24 0.24 0.24 0.24
Palm kernels 012 0.12 0.14 0.15 0.14 0.15 0.18 0.20 0.20 0.22 0.24 0.24 0.24 0.25 0.25
Total vegetable oils and oilseeds(oil equivalent) 1.04 1.35 1.39 1.53 1.45 1.57 1.74 2.02 1.86 1.92 2.10 2.17 2.12 2.67 2.23Coffee 2.30 1.86 2.40 2.81 3.34 3.25 3.44 3.46 2.89 2.31 3.61 2.52 2.87 2,37 2.64Cocoa 0.32 0.31 0.31 0.32 0.36 0.29 0.29 0.29 0.28 0.29 0.33 0.35 0.35 0.34 0.38
Tobacco 0.37 0.38 0.40 0.38 0.40 0.43 0.44 0.48 0.52 0.50 0.53 0.50 0.53 0.55 0.59Cotton (lint) 1 20 1.15 1.11 1.25 1.07 1.24 1.37 1.59 1.64 1.68 1.62 1.67 1.51 1.68 1.65
Sisal 0.25 0.27 0.28 0.29 0.34 0.35 0.37 0.38 0.40 0.43 0.42 0.42 0.39 0.38 0.39wool (greasy) 0.33 0.34 0.34 0.34 0.35 0.35 0.34 0.33 0.34 0.35 0.34 0.37 0.35 0.34 0.34Milk 17.40 18.31 18.55 18.35 18.52 19.00 19.09 19.34 19.87 20.85 21.26 22.13 21.95 23.45 23.79
Meat 6.78 7.44 7.73 8.05 7.42 7.37 7.83 8.18 8.48 8.10 8.30 8.63 9.05 9.04 9.(i4
Eggs 0.71 0.77 0.84 0.83 0.87 0.91 0.96 0.96 0.99 1.05 1.12 1.19 1.17 1.24 1.26
FISI-IERY PRODUCTS 0.98 1.11 1.36 1.87 3.23 4.73 6.62 8.62 8.78 11.40 9.43 11.57 12.71 13.48
FOREST PRODUCTS
Sawn softwood 53 5.1 4.6 5.3 5.2 4.9 5.1 5.3 5.0 5.6 5.8 6.3 6.5 6.6 6.8
Sawn hardwood 3 7.2 7.5 6.7 6.6 6.2 6.3 6.3 6.6 6.4 6.9 6.8 7.2 7.2 7.4 7.6
Plywood 0.9 0.2 0.2 0.3 0.3 0.3 0.3 0.4 0.4 0.4 0.4 0.4 0.4 0.5 0.5
Mechanical wood pulp . . . . 0.15 0.16 0.16 0.20 0.22 0.24 0.28 0.27 0.34 0.34 0.39 0.39 0.44 0.42 0.42
Chemical wood pulP 0 13 0.19 0.22 0.23 0.27 0.35 0.4 0.51 0.65 0.71 0.78 0.89 0.93 0.91 0.94
All paper and paperboard 1.04 1.18 1.23 1.39 1.49 1.57 1.80 1.84 1.94 2.14 2.33 2.59 2.67 2.70 2.78
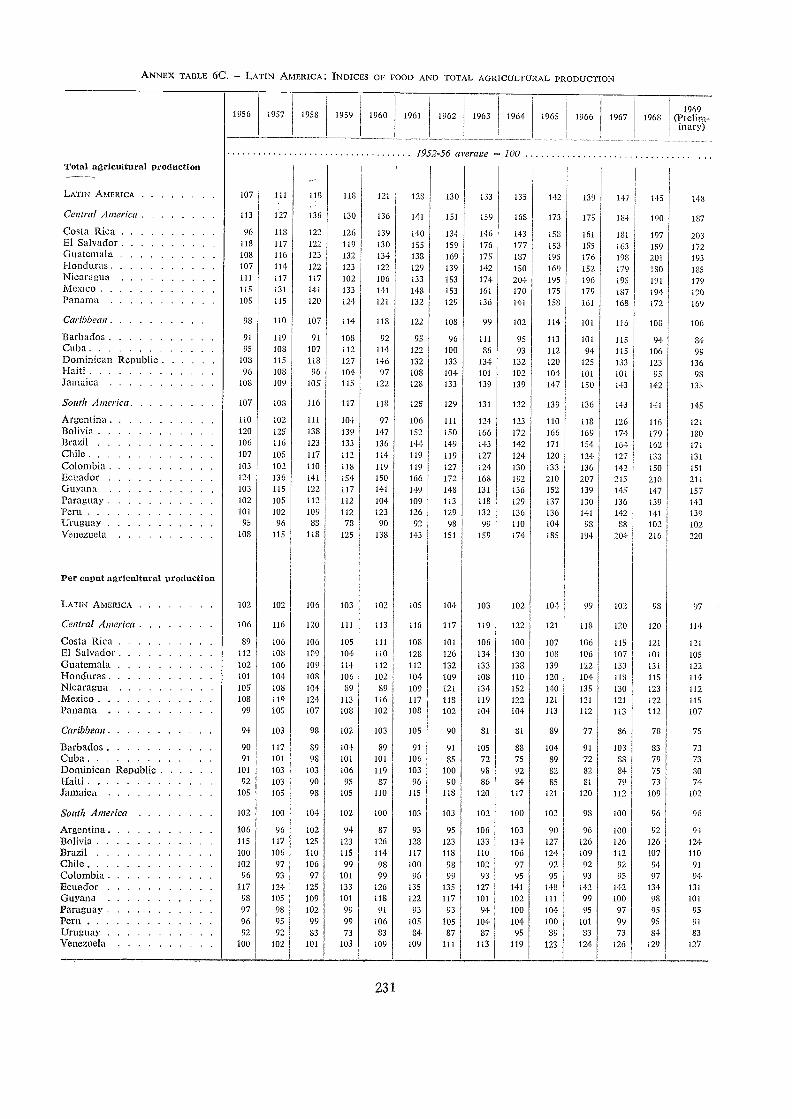
ANNEX TABLE 6C. LATIN AMERICA: INDICES OF FOOD AND TOTAL AGRICULTURAL PRODUCTION
231
1956 1957 1958 1959 1960 1961 1962 1963 1964 1965 1966 1967 19681969
(Prelim-hiarY)
1952-56 aterage 100
Total agricultural production...
LATIN AMERICA 107 111
._,
118 118 121 128 130 133 135 142 139 147 145 148
Central America 113 127 136 130 136 141 151 159 168 173 175 184 190 197
Costa Biel 96 118 122 126 139 140 134 146 143 158 161 181 197 203El Salvador 118 117 122 119 130 155 159 176 177 153 155 163 159 172Guatemala 108 116 123 132 134 139 169 175 137 195 176 198 201 193Honduras 107 114 122 123 122 129 139 142 150 169 152 179 190 135Nicaragua 111 117 117 102 106 133 153 174 204 195 196 195 191 179Mexico 115 131 141 133 141 148 153 161 170 175 179 187 194 190Panama 105 115 120 124 121 132 129 136 141 159 161 168 172 169
Caribbean 98 110 107 114 118 122 108 99 102 114 101 116 103 106
Barbados 91 119 91 108 92 95 96 111 95 113 101 115 94 84Cul-i 95 108 107 112 114 122 100 36 93 112 94 115 106 99Dominican Republic 108 115 118 127 146 132 133 134 132 120 125 133 123 136Haiti 96 108 96 104 97 108 104 101 102 104 101 101 95 98Jamaica 108 109 105 115 122 128 133 139 139 147 150 143 142 135
South America 107 108 116 117 118 125 129 131 132 139 136 143 141 145
Argentina 110 102 111 104 97 106 111 124 123 110 118 126 116 121Bolivia 120 125 138 139 147 152 150 166 172 166 169 174 179 18013razil 106 116 123 133 136 144 149 143 142 171 154 164 162 171Chile 107 105 117 112 114 119 119 127 124 120 124 127 133 131Colombia 103 102 110 118 119 119 127 124 130 133 136 142 150 151Ecuador 124 136 141 154 150 166 172 168 192 210 207 215 210 211Guyana 103 115 122 117 141 149 148 131 136 152 139 145 147 157Paraguay 102 105 112 112 104 109 113 118 129 137 130 136 139 143Peru 101 102 109 112 123 126 129 132 136 136 141 142 141 139Uruguay 95 96 88 78 90 92 98 99 110 104 93 83 102 102Venezuela 108 115 118 125 138 143 151 159 174 185 194 204 216 220
Per caput agricultural production
LATIN AMERICA 102 102 106 103 102 105 104 103 102 104 99 102 93 97
Central America 106 116 120 111 113 116 117 119 122 121 118 120 120 114
Costa Ric9. 89 106 106 105 Ill 109 101 106 100 107 106 115 121 121
El Salvador 112 108 109 104 110 128 126 134 130 108 106 107 101 105Guatemala 102 106 109 114 112 112 132 133 138 139 122 133 131 122Honduras 101 104 108 106 102 104 109 108 110 120 104 118 115 114Nicaragua 105 108 104 89 89 109 121 134 152 140 135 130 123 112Mexico 108 119 124 113 116 117 118 119 122 121 121 121 122 115Panama 99 105 107 108 102 108 102 104 104 113 112 113 112 107
Caribbean 94 103 98 102 103 105 90 81 81 89 77 86 78 75
Barbados 90 117 89 104 89 91 91 105 88 104 91 103 33 73Cuba 91 101 98 101 101 106 85 72 75 89 72 88 79 73Dominican Republic 101 103 103 106 119 103 100 98 92 82 82 84 75 80Haiti 92 103 90 95 87 96 90 86 84 85 81 79 73 74Jamaica 105 105 98 105 110 115 118 120 117 121 120 112 109 102
South America 102 100 104 102 100 103 103 102 100 103 98 100 96 96
Argentina 106 96 102 94 87 93 95 106 103 90 96 100 92 94Bolivia 115 117 125 123 126 128 123 133 134 127 126 126 126 124Brazil 100 106 110 115 114 117 118 110 106 124 109 112 107 110Chile 102 97 106 99 98 100 98 102 97 92 92 92 94 91
Colombia 96 93 97 101 99 96 99 93 95 95 93 95 97 94
Ecuador 117 124 125 133 126 135 135 127 141 148 142 142 134 131
Guyana 98 105 109 101 118 122 117 101 102 111 99 100 98 101
Paraguay 97 98 102 99 91 93 93 94 100 104 95 97 95 95
Peru 96 95 99 99 106 105 105 104 104 100 101 99 95 91
Uruguay 92 92 83 73 83 84 87 87 95 89 83 73 84 83
Venezuela 100 102 101 103 109 109 111 113 119 123 124 126 129 127
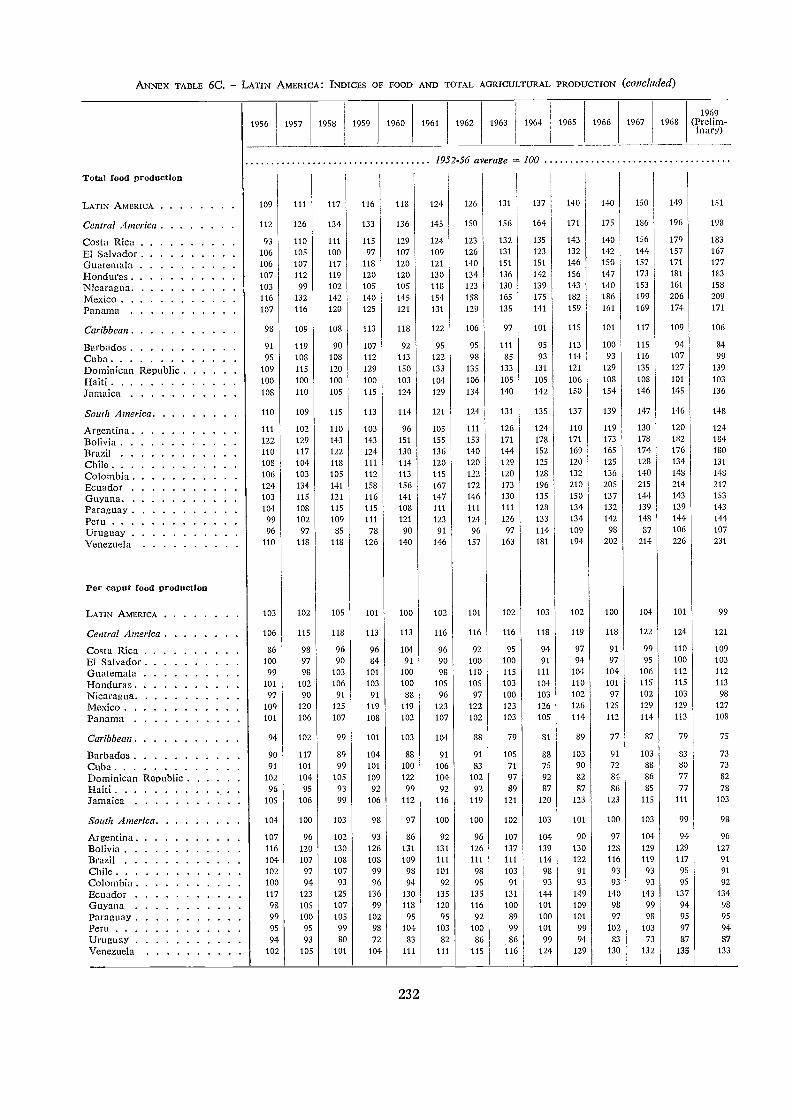
ANNEX TABLE 6C. LATIN AMERICA: INDICES OF FOOD AND TOTAL AGRICULTURAL PRODUCTION (concluded)
232
1956 1957 1958 1959 1960 1961 1962 1963 1964 1965 1966 1967 19681969
(Prelim-inary)
1952-56 average 100
Total food production
LATIN AMERICA 109 Ill 117 116 118 124 126 131 137 140 140 150 149 151
Central America 112 126 134 133 136 145 150 156 164 171 175 186 196 198
Costa Riel 93 110 111 115 129 124 123 132 135 143 140 156 179 183
El Salvador 106 105 100 97 107 109 126 131 123 132 142 144 157 167
Guatemala 106 107 117 118 120 121 140 151 151 146 150 157 171 177
Honduras 107 112 119 120 120 130 134 136 142 156 147 173 181 183
Nicaragua 103 99 102 105 105 118 123 130 139 143 140 153 161 158
Mexico 116 132 142 140 145 154 158 165 175 182 186 199 206 209
Panama 107 116 120 125 121 131 129 135 141 159 161 169 174 171
Caribbean 98 109 108 113 118 122 106 97 101 115 101 117 109 106
Barbados 91 119 90 107 92 95 95 111 95 113 100 115 94 84
Cuba 95 108 108 112 113 122 98 85 93 114 93 116 107 99
Dominican Republic 109 115 120 129 150 133 135 133 131 121 129 135 127 139
Haiti 100 100 100 100 103 104 106 105 105 106 108 108 101 103
Jamaica 108 110 105 115 124 129 134 140 142 150 154 146 145 136
South America 110 109 115 113 114 121 124 131 135 137 139 147 146 148
Argentina 111 102 110 103 96 105 111 126 124 110 119 130 120 124
Bolivia 122 129 143 143 151 155 153 171 178 171 173 178 182 184
Brazil 110 117 122 124 130 136 140 144 152 169 165 174 176 180
Chile 105 104 118 111 114 120 120 129 125 120 125 128 134 131
Colombia 106 103 105 112 113 115 122 120 128 132 136 140 148 148
Ecuador 124 134 141 158 156 167 172 173 196 210 205 215 214 217
Guyana 103 115 121 116 141 147 146 130 135 150 137 144 143 153
Paraguay 104 108 115 115 108 111 111 111 128 134 132 139 139 143
Peru 99 102 109 111 121 123 124 126 133 134 142 148 144 144
Uruguay 96 97 85 78 90 91 96 97 114 109 98 87 106 107
Venezuela 110 118 118 126 140 146 157 163 181 194 202 214 226 231
Per caput food production
LATIN AMERICA 103 102 105 101 100 102 101 102 103 102 100 104 101 99
Central America 106 115 118 113 113 116 116 116 118 119 118 122 124 121
Cc:Ma Rica 86 98 96 96 104 96 92 95 94 97 91 99 110 109
El Salvador 100 97 90 84 91 90 100 100 91 94 97 95 100 103
Guatemali 99 98 103 101 100 98 110 115 111 104 104 106 112 112
Honduras 101 102 106 103 100 105 105 103 104 110 101 115 115 113
Nicaragua 97 90 91 91 88 96 97 100 103 102 97 102 103 98
Mexico 109 120 125 119 119 123 122 123 126 126 125 129 129 127
Panama 101 106 107 108 102 107 102 103 105 114 112 114 113 108
Caribbean 94 102 99 101 103 104 88 79 81 89 77 87 79 75
Barbados 90 117 89 104 88 91 91 105 88 103 91 103 83 73
Cuba 91 101 99 101 100 106 83 71 75 90 72 88 80 73
Dominican Republic 102 104 105 109 122 104 102 97 92 82 84 86 77 82
Haiti 96 95 93 92 99 92 92 89 87 87 86 85 77 78
Jamaica 105 106 99 106 112 116 119 121 120 123 123 115 111 103
South America 104 100 103 98 97 100 100 102 103 101 100 103 99 98
Argentina 107 96 102 93 86 92 96 107 104 90 97 104 94 96
Bolivia 116 120 130 126 131 131 126 137 139 130 128 129 129 127
Brazil 104 107 108 108 109 111 111 111 114 122 116 119 117 91
Chile 102 97 107 99 98 101 98 103 98 91 93 93 95 91
Colombii 100 94 93 96 94 92 95 91 93 93 93 93 95 92
Ecuador 117 123 125 136 130 135 135 131 144 149 140 143 137 134
Guyana 98 105 107 99 118 120 116 100 101 109 98 99 94 98
Paraguay 99 100 105 102 95 95 92 89 100 101 97 98 95 95
Peru 95 95 99 98 104 103 100 99 101 99 102 103 97 94
Uruguay 94 93 80 72 83 82 86 86 99 94 83 73 87 87
Venezuela 102 105 101 104 111 111 115 116 124 129 130 132 135 133
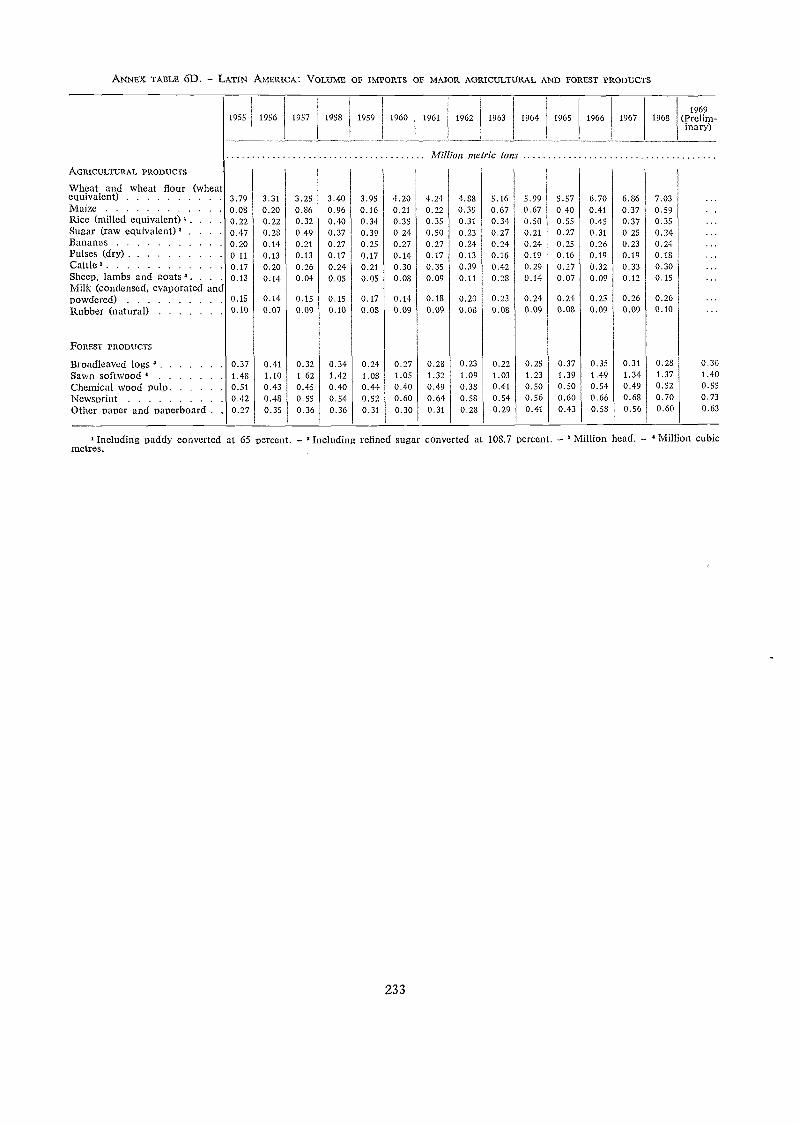
ANNEX TABLE 6D. - LATIN AMERICA: VOLUME OF IMPORTS OF MAJOR AGRICULTURAL AND FOREST PRODUCTS
233
' Including paddy converted at 65 percent. - 'Including refined sugar converted at 108.7 percent. - °Million head. - 'Million cubicmetres.
1955 1956 1957 1958 1959 1960 1961 1962 1963 1964 1965 1966 1967 19681969
(Pram-haary)
Mil I071metric to/ s
AGRIcULTuRAL PRODUCTS
Wheat and wheat flour (wheatequivalent) 3.79 3.31 3.25 3.40 3.95 4.20 4.24 4.38 5.16 5.99 5.57 6.70 6.86 7.03Maize 0.08 0.20 0.86 0.96 0.16 0.21 0.22 0.39 0.67 0.67 0.40 0.41 0.37 0.59Rice (milled equivalent)3. . . 0.22 0.22 0.32 0.40 0.34 0.35 0.35 0.31 0.34 0.50 0.55 0.45 0.37 0.35Sugar (raw equivalent)' . . . . 0.47 0.28 0.49 0.37 0.39 0.24 0.50 0.23 0.27 0.21 0.27 0.31 0.25 0.24Bananas 0.20 0.14 0.21 0.27 0.25 0.27 0.27 0.24 0.24 0.24 0.25 0.26 0.23 0.24Pulses (drY) 0.11 0.13 0.13 0.17 0.17 0.14 0.17 0.13 0.16 0.19 0.16 0.19 0.19 0.18Cattle ,Sheep, lambs and goats ,. . .
0.170.13
0.200.14
0.260.04
0.240.05
0.210.05
0.300.08
0.350.09
0.390.11
0.420.28
0.290.14
0.270.07
0.320.09
0.330.12
0.300.15
Milk (condensed, evaporated andPowdered) 0.15 0.14 0.15 0.15 0.17 0.14 0.18 0.20 0.23 0.24 0.24 0.23 0.26 0.26
Rubber (natural) 0.10 0.07 0.09 0.10 0.08 0.09 0.09 0.08 0.08 0.09 0.08 0.09 0.09 0.10
FOREST PRODucTS
Broadleaved logs 037 0.41 0.32 0.34 0.24 0.27 0.28 0.23 0.22 0.25 0.37 0.35 0.31 0.28 030Sawn softwood 4 1.43 1.10 1.62 1.42 1.08 1.05 1.32 1.09 1.03 1.23 1.39 1.49 1.34 1.37 1.40
Chemical wood pulp 0.51 0.43 0.45 0.40 0.44 0.40 0.49 0.38 0.41 0.50 0.50 0.54 0.49 0.52 0.55
Newsprint 0.42 0.48 0.55 0.54 0.52 0.60 0.64 0.58 0.54 0.56 0.60 0.66 0.68 0.70 0.73
Other paper and paperboard . . 0.27 0.35 0.36 0.36 0.31 0.30 0.31 0.28 0.29 0.41 0.43 0.58 0.56 0.60 0.63
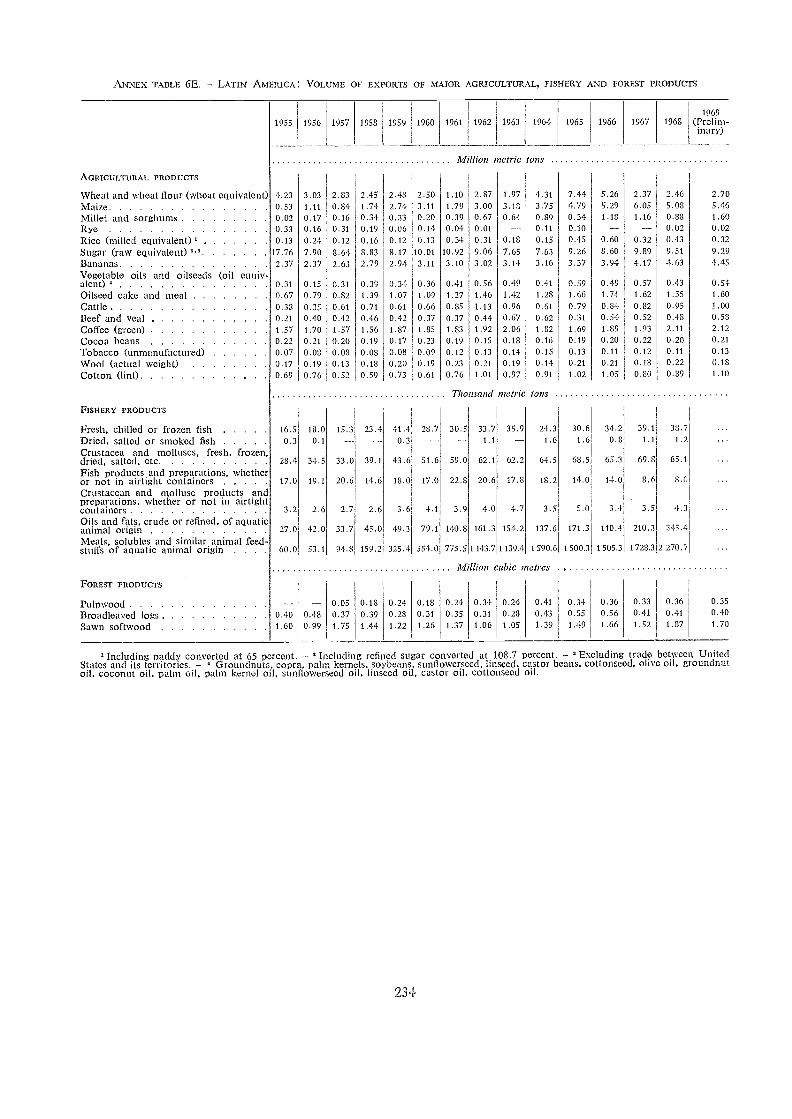
ANNEX TAI3LE 6E. - LATIN AMERICA : VOLUME OF E XPORTS OF MAJOR AGRICULTURAL, FISHERY ANO FOREST PRODUCTS
234
Including paddy converted at 65 percent. - ' Including refilled sugar converted at 108.7 percent. - Excluding trade betwee I UnitedStates and its territories. - Groundnuts. copra, palm kernels, soybeans. sunflowerseed. linseed, castor beans, cottonseed. olive oil, roundnutoil, coconut oil. palm oil, palm kernel oil, sunflowerseed oil, linseed oil, castor oil, cottonseed oil.
1955 1956 1957 1958 1959 1960 1961 1962 1963 1964 1965 1966 1967 19681969
(Prelim-inary)
Million metric tons
AGRICULTURAL PRODUCTS
Wheat and wheat flour (wheat equivalent) 4.23 3.03 2.83 2.45 2.48 2.50 1.10 2.87 1.97 4.31 7.44 5.26 2.37 2.46 2.70Maize 0.53 1.11 0.84 1.74 2.74 3.11 1.79 3.00 3.18 3.75 4.79 5.29 6.05 5.08 5.46Millet and sorghums 0.02 0.17 0.16 0.34 0.33 0.20 0.39 0.67 0.64 0.89 0.34 1.18 1.16 0.88 1.60Rye 0.33 0.16 0.31 0.19 0.06 0.14 0.04 0.01 -- 0.11 0.10 -- 0.02 0.02Rice (milled equivalent) 0 13 0.24 0.12 0.16 0.12 0.13 0.34 0.31 0.18 0.15 0.45 0.60 0.32 0.43 0.32
Sugar (raw equivalent) 17.76 7.90 8.64 8.83 8.17 10.01 10.92 9.06 7.65 7.63 9.26 8.60 9.89 9.51 9.29Bananas 2.37 2.37 2.63 2.79 2.94 3.11 3.10 3.02 3.14 3.16 3.37 3.94 4.17 4.63 4.45Vegetable oils and oilseeds (oil equiv-alent) 0.31 0.15 0.31 0.39 0.34 0.36 0.41 0.56 0.49 0.41 0.59 0.49 0.57 0.43 0.54Oilseed cake and meal 0 67 0.79 0.82 1.39 1.07 1.09 1.27 1.46 1.42 1.28 1.66 1.74 1.62 1.55 1.60
Cattle 0 38 0.35 0.61 0.71 0.61 0.66 0.85 1.13 0.96 0.61 0.79 0.84 0.82 0.95 1.00
Beef and veal 0 21 0.40 0.42 0.46 0.42 0.37 0.37 0.44 0.67 0.62 0.31 0.54 0.52 0.48 0.58
Coffee (green) 1.57 1.70 1.57 1.56 1.87 1.85 1.83 1.92 2.06 1.82 1.69 1.89 1.93 2.11 2.12
Cocoa beans 0.22 0.21 0.20 0.19 0.17 0.23 0.19 0.15 0.18 0.16 0.19 0.20 0.22 0.20 0.21
Tobacco (unmanufactured) 0.07 0.08 0.08 0.08 0.08 0.09 0.12 0.13 0.14 0.15 0.13 0.11 0.12 0.11 0.13
Wool (actual weight) 0.17 0.19 0.13 0.18 0.20 0.19 0.23 0.21 0.19 0.14 0.21 0.21 0.18 0.22 0.18
Cotton (lint) 0.69 0.76 0.52 0.59 0.73 0.61 0.76 1.01 0.97 0.91 1.02 1.05 0.80 0.89 1.10
Tho isand metric tons
FISHERY PRODUCTS
Fresh, chilled or frozen fish 16.5 18.0 15.3 23.4 41.4 28.7 30.5 33.7 35.9 24.3 30.6 34.2 39.1 38.7
Dried, salted or smoked fish 0.3 0.1 0.3 1.1 1.6 1.6 0,8 1.1 1.2
Crustacea and molluscs, fres , frozen,dried, salted, etc . 28.4 34.5 33.0 39.1 43.6 51.6 59.0 62.1 62.2 64.5 68.5 65.3 69.8 65.1
Fish products and preparations, whetheror not in airtight containers 17.0 19.1 20.6 14.6 18.0 17.0 22.8 20.6 17.8 18.2 14.0 14.0 8.6 8.0
Crustacean and mollusc products andpreparations, whether or not in airtightcontainers 3.2 2.6 2.7 2.6 3.6 4.1 3.9 4.0 4.7 3.5 5.0 3.4 3.5 4.3
Oils and fats, crude or refined, of aquaticanimal origin 27.0 42.0 33.7 45.0 >9.3 79.1 140.8 161.3 154.2 137.6 171.3 110.4 210.3 345.4
Meals, solubles and similar animal feed-stuffs of aquatic animal origin . . . . 60.0 53.1 94.8 159.2 325.4 554.0 775.5 1143.7 1139.4 1590.6 1500.3 1505.3 1728.3 2 270.7
Million cubic metres
FOREST PRODUCTS
Pulpwood 0.05 0.18 0.24 0.18 0.24 0.34 0.24 0.41 0.34 0.36 0.33 0.36 0.35
13roadleaved logs 0 40 0.48 0.37 0.39 0.28 0.31 0.35 0.31 0.28 0.43 0.55 0.56 0.41 0.41 0.40
Sawn softwood 1.60 0.99 1.75 1.44 1.22 1.26 1.37 1.06 1.05 1.39 1.49 1.66 1.52 1.87 1.70
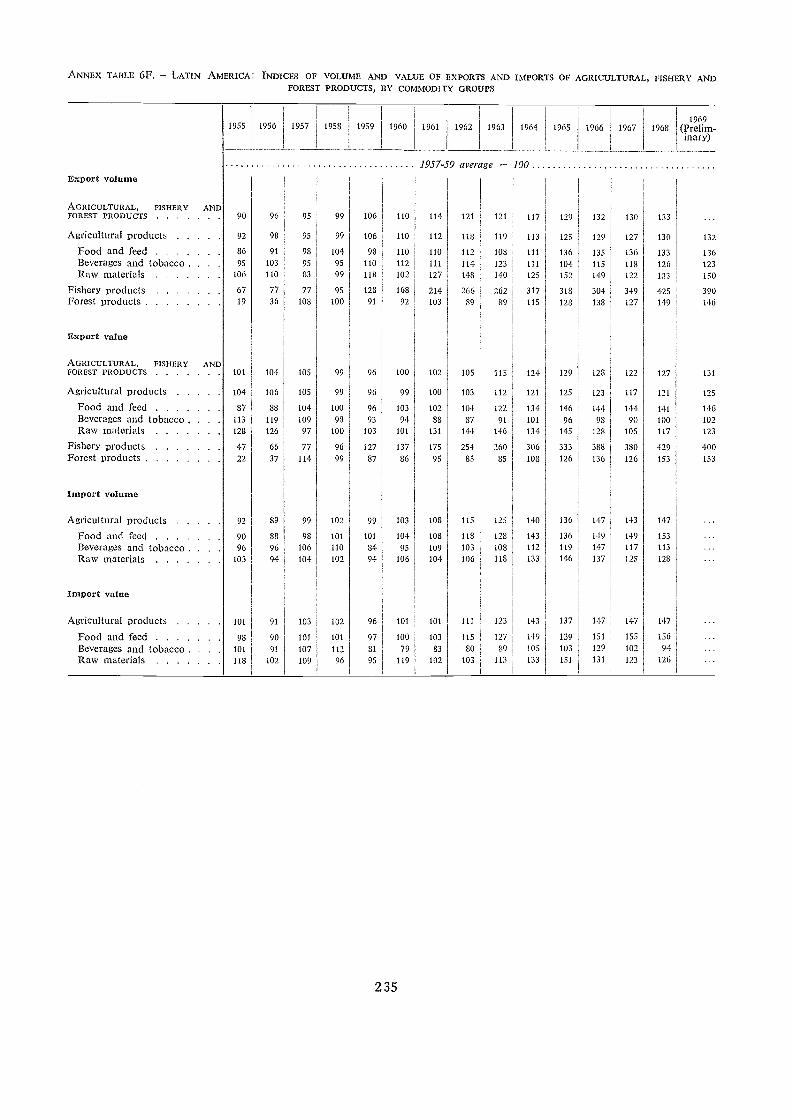
ANNEX TABLE 6F. LATIN AMERICA : INDICES OF VOLUME AND VALUE OF EXPORTS AND IMPORTS OF AGRICULTURAL, FISHERY ANDFOREST PRODUCTS, BY COMMODITY GROUPS
235
1955 1956 1957 1958 1939 1960 1961 1962 1963 1964 1965 1966 1967 9681969
(Prelim-inary)
1957.-59 average 100Export volume
AGRICULTURAL, FISHERY ANDFOREST PRODUCTS 90 96 95 99 106 110 114 121 121 117 129 132 130 133
Agricultural products 92 98 95 99 106 110 112 118 119 113 125 129 127 130 132
Food and feed 86 91 98 104 98 110 110 112 108 111 136 135 136 133 136Beverages and tobacco . 95 103 95 95 110 112 111 114 123 111 104 115 118 126 123Raw materials 106 110 83 99 118 102 127 148 140 125 152 149 122 133 150
Fishery products 67 77 77 95 128 168 214 266 262 317 318 304 349 425 390Forest products 19 36 108 100 91 92 103 89 89 115 128 138 127 149 146
Export value
AGRICULTURAL, FISHERY ANDFOREST PRODUCFS 101 104 105 99 96 100 102 105 115 124 129 128 122 127 131
Agricultural products 104 106 105 99 96 99 100 103 112 121 125 123 117 121 125
Food and feed 87 88 104 100 96 103 102 104 122 134 146 144 144 141 146Beverages and tobacco . 113 119 109 98 93 94 88 87 91 101 96 98 90 100 102Raw materials 128 126 97 100 103 101 131 144 146 134 145 128 105 117 123
Fishery products 47 66 77 96 127 137 175 254 260 306 333 388 380 429 400Forest products 22 37 114 99 87 86 95 85 85 108 126 136 126 153 153
Iinport volume
Agricultural products 92 89 99 102 99 103 108 115 125 140 136 147 143 147
Food and feed 90 88 98 101 101 104 108 118 128 143 136 119 149 153
Beverages and tobacco . . . 96 96 106 110 84 95 109 103 108 112 119 147 117 113
Raw materials 103 94 104 102 94 106 104 106 118 133 146 137 125 128
Import value
Agricultural products 101 91 103 102 96 101 101 ill 123 143 137 147 147 147
Food and feed 98 90 101 101 97 100 103 115 127 149 139 151 155 156
Beverages and tobacco . 101 91 107 112 81 79 83 80 89 105 103 129 102 94
Raw materials 118 102 109 96 95 119 102 103 113 133 151 131 123 126
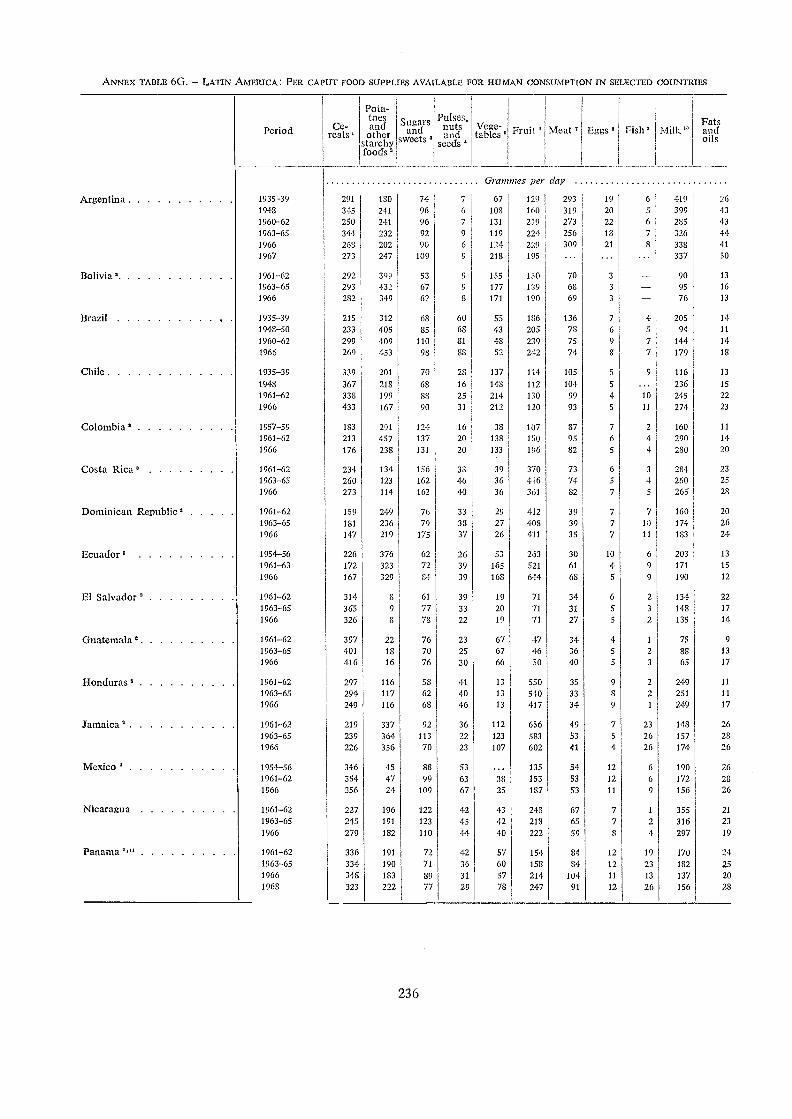
ANNEX TABLE 6G. - LATIN AMERICA: PER CAPUT FOOD SUPPLIES AVAILABLE FOR DUMAN CONSUMPTION IN SELECTED COUNTRIES
Argentina
Bolivia"
Brazil
Chile
Colombia'
Costa Rica'
Dominican Republic'
Ecuador'
El Salvador
Guatemala'
Honduras 2
Jamaica'
Mexico '
Nicaragua
Panama',"
Period Ce-reals'
Pota-toesand
otherstarchyfoods'
Sugarsand
sweets
Pulses,nutsand
seeds
Vege-tables Fruit Meat Eggs Fish' Milk"
Fatsandoils
Grammes pel day
1935-39 291 180 74 7 67 129 293 19 6 419 26
1948 345 241 96 6 108 160 319 20 5 399 431960-62 250 241 96 7 131 219 273 22 6 285 431963-65 344 232 92 9 119 224 256 18 7 326 441966 268 202 90 6 124 229 309 21 8 338 41
1967 273 247 109 9 218 195 ... ... 337 50
1961-62 292 39.) 53 9 155 150 70 3 90 13
1963-65 293 432 67 9 177 139 GS 3 95 16
1966 282 349 62 8 171 190 69 3 76 13
1935-39 215 312 68 60 55 186 136 7 4 205 14-
1948-50 233 405 85 68 43 205 78 6 5 94 11
1960-62 299 409 110 81 48 239 75 9 7 144 14
1966 269 453 98 88 52 242 74 8 7 179 18
1935-39 339 201 70 28 137 114 105 5 9 116 13
1948 367 218 68 16 148 112 104. 5 236 15
1961-62 338 199 88 25 214 130 99 4 10 245 22
1966 433 167 90 31 212 120 93 5 11 274 23
1957-59 183 291 124 16 38 107 87 7 2 160 11
1961-62 213 457 137 20 138 150 95 6 4 290 14
1966 176 238 131 20 133 196 82 5 4 280 20
1961-62 234 134 156 38 39 370 73 6 3 284 23
1963-65 260 123 162 46 36 416 74 5 4 260 25
1966 273 114 162 40 36 361 82 7 5 265 28
1961-62 159 249 76 33 29 412 39 7 7 160 20
1963-65 181 236 79 38 27 408 39 7 10 174 26
1966 147 219 175 37 26 411 35 7 11 183 24
1954-56 226 376 62 26 53 263 30 10 6 203 13
1961-63 172 323 72 39 165 521 61 4 9 171 15
1966 167 329 84 39 168 644 68 5 9 190 12
1961-62 314 8 61 39 19 71 34 6 2 134 22
1963-65 365 9 77 33 20 71 31 5 3 148 17
1966 326 8 78 22 19 71 27 5 2 135 14
1961-62 397 22 76 23 67 47 34 4 1 75 9
1963-65 401 13 70 25 67 46 36 5 2 88 13
1966 416 16 76 30 66 50 40 5 3 65 17
1961-62 297 116 58 41 13 550 35 9 2 249 11
1963-65 294 117 62 40 13 540 33 8 2 251 11
1966 249 116 68 46 13 417 34 9 1 249 17
1961-62 219 337 92 36 112 656 49 7 23 148 261963-65 239 364 113 22 123 583 53 5 26 157 281966 226 356 70 23 107 602 41 4 26 174 26
1954-56 346 45 88 53 135 54 12 6 190 26
1961-62 354 47 99 63 38 153 53 12 6 172 281966 356 24 109 67 25 187 53 11 9 156 26
1961-62 227 196 122 42 43 248 67 7 1 355 21
1963-65 245 191 123 45 42 218 65 7 2 316 23
1966 279 182 110 44 40 222 59 8 4 297 19
1961-62 336 191 72 42 57 154 84 12 19 170 241963-65 334 190 71 36 60 158 84 12 23 182 251966 348 183 89 31 57 214 104 11 13 137 201968 323 222 77 29 78 247 91 12 26 156 28
236
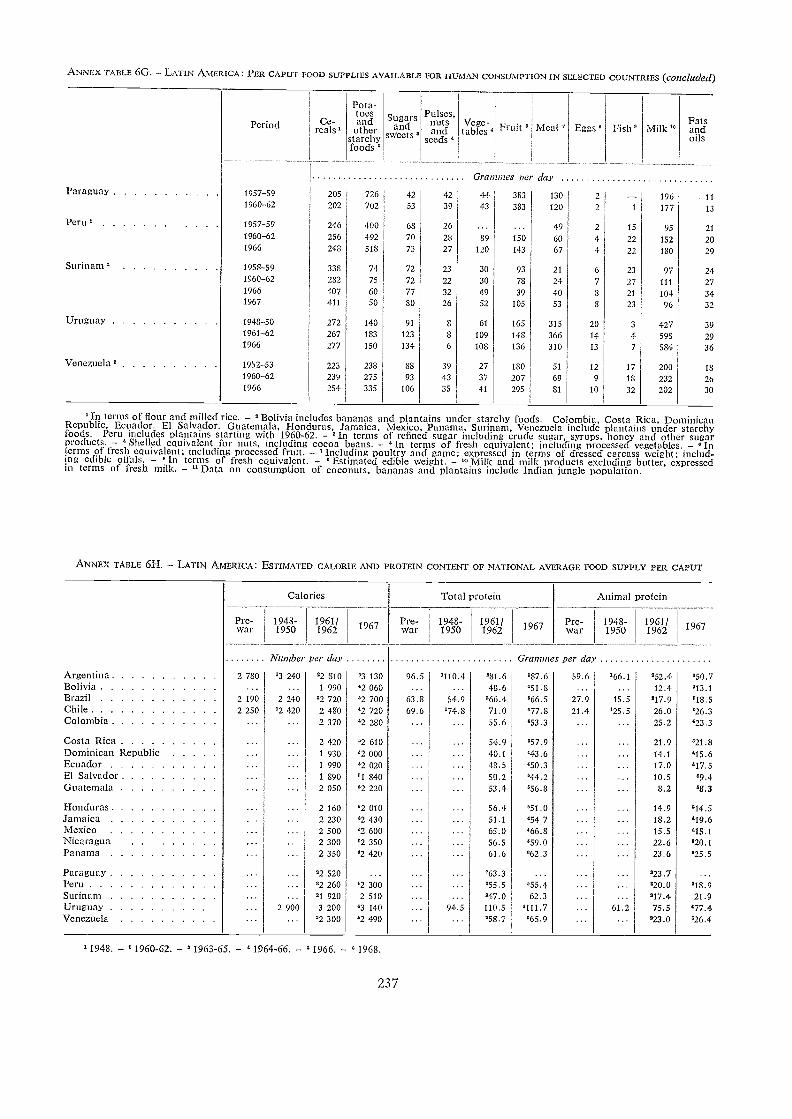
ANNEX TABLE 6G. - LATIN AMERICA: PER CAPUT FOOD SUPPLIES AVAILABLE FOR 1-JUMAN CONSUMPTION IN SELECTED COUNTRIES (concluded)
Period Ce-reals'
Pota-toesandother
starchyfoods '
1948. - 21960-62. - 3 1963-65. - 1964-66. - ° 1966. - 3 1968.
Sugarsand
sweets'
237
Pulses,nutsand
seeds
Vege-tables Fruit Meat' Eggs Fish'
GralltIlieS per daY
42 44 383 130 239 43 383 120 2 1
26 ... ... 49 2 1523 89 150 60 4 2227 120 143 67 4 22
23 30 93 21 6 2322 30 78 24 7 2732 49 39 40 8 2126 52 105 53 8 23
8 61 165 315 20 3
S 109 148 366 14 46 108 136 310 13 7
39 27 180 51 12 17
43 37 207 69 9 1835 41 295 81 10 32
Milk"
' In terms of flour and milled rice. - ' Bolivia includes bananas and plantains under starchy foods. Co ornbia, Costa Rica, DominicanRepublic, Ecuador, El Salvador, Guatemala, Honduras. Jamaica, Mexico, Panarna, Surinam, Venezuela include plantains under starchyfoods. Peru includes plantains starting with 1960-62. - In terms of refined sugar including crude sugar, syrups, honey and other sugarproducts. - ' Shelled equivalent for nuts, including cocoa beans. - ' In terms of fresh equivalent; including processed vegetables. - 'Interms of fresh equivalent; including processed fruit. - *Including poultry and game; expressed in terms of dressed carcass weight; includ-ing edible offals. - 31n terms of fresh equivalent. - Estimated edible weight. - '0 Milk and milk products excluding butter, expressedin terms of fresh milk. - " Data on consumption of coconuts, bananas and plantains include Indian jungle population.
ANNEX TABLE 6H. - LATIN AMERICA: ESTIMATED CALORIE AND PROTEIN CONTENT OF NATIONAL AVERAGE FOOD SUPPLY PER CAPUT
Fatsandoils
Calories Total protein Animal protein
Pre-war
1948-1950
1961/1962 1967 Pre-
War1948-1950
1961/1962 1967 Pre-
war1948-1950
1961/1962 1967
Number per day Grammes per day
Argentina 2 780 °3 240 °2 810 '3 130 96.5 '110.4 '81.6 '87.6 59.6 '66.1 "52.4 '50.7Bolivia 1 990 42 060 48.6 .51.8 12.4 '13.1Brazil 2 190 2 240 .2 720 '2 700 63.8 54.9 '66.4 '66.5 27.9 15.5 '17.9 *18.5Chile 2 250 °2 420 2 480 '2 720 69.6 '74.8 71.0 '77.8 21.4 '25.5 26.0 '26.3Colombia 2 370 '2 280 55.6 '53.3 25.2 '23.3
Costa Rica 2 420 '2 610 54.9 '57.9 21.9 '21.8Dominican Republic 1 930 '2 000 40.1 '43.6 14.1 '15.6Ecuador 1 990 12 020 48.5 '50.3 17.0 '17.5El Salvador 1 890 31 840 50.2 '44.2 10.5Guatemala 2 050 '2 220 53.4 '56.8 8.2 '8.3
Honduras 2 160 02 010 56.4 '51.0 14.9 '14.5Jamaica 2 230 '2 430 51.1 '54.7 18.2 '19.6Mexico 2 500 "2 600 65.0 '66.8 15.5 115.1Nicaragua 2 300 '2 350 56.5 "59.0 22.6 '20.1Panama 2 350 '2 420 61.6 "62.3 23.6 '25.5
Paraguay '2 520 '63.3 "23.7Peru '2 260 '2 300 '55.5 '55.4 320.0 '18.9Surinam '1920 2 510 '47.0 62.3 217.4 21.9Uruguay 2 900 3 200 '3 140 110.5 '111.7 61.2 75.5 '77.4Venezuela '2300 "2 490 258.7 '65.9 "23.0 '26.4
205 726 42.
202 702 53
246 400 63256 492 70248 518 73
338 74 72282 75 72407 60 77411 50 80
272 140 91
267 183 123277 150 134
223 238 88239 275 93254 335 106
196
177 13
95
152
180
21
2029
97
10496
24273432
427595584
392936
200232202
18
2630
1957-591960-62
1957-591960-621966
1958-591960-6219661967
1948-501961-621966
1952-531960-621966
Paraguay
Peru
Surinam 3
Uruguay
Venezuela'
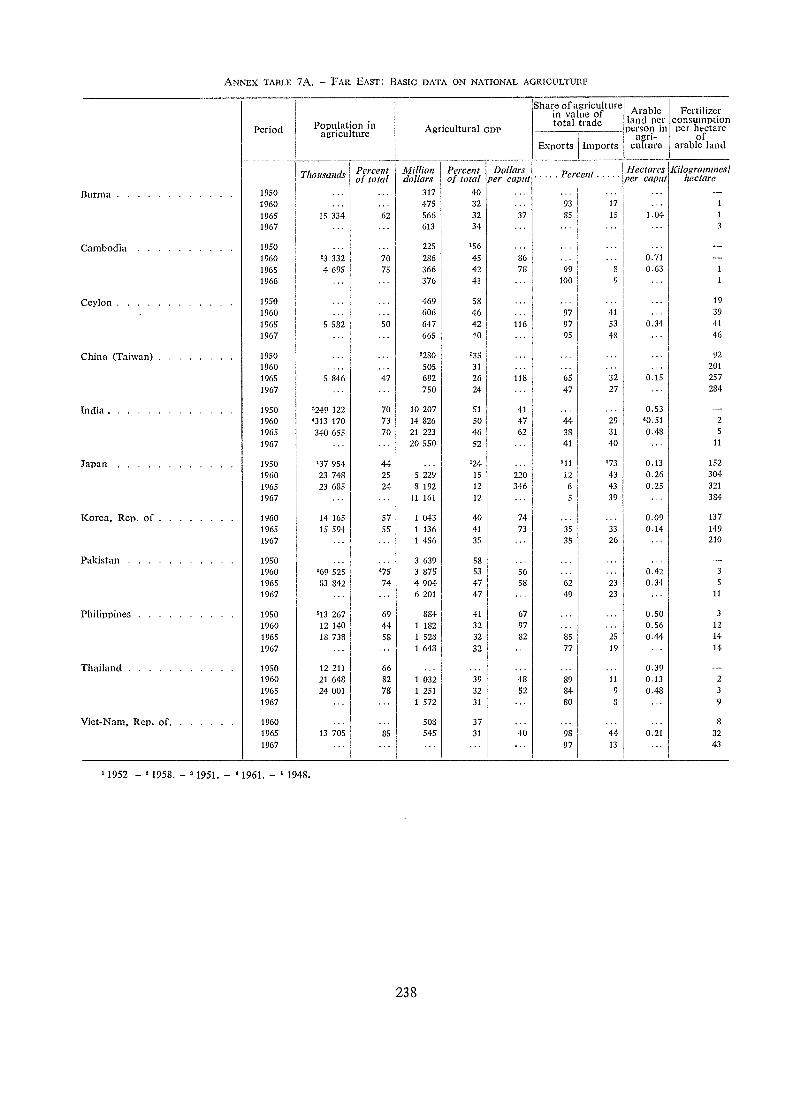
ANNEX TABLE 7A. FAR EAST: BASIC DATA ON NATIONAL AGRICULTURE
'1952 1958. '1951. '1961. 1948.
238
Period Population inagriculture Agricultural GDP
Share of agriculturein value oftotal trade
Arableland perperson in
agri-culture
Fertilizerconsumptionper hectare
ofarable landExports imports
Tliousands Percentof total
Milliondollars
Percentof total
Dollarsper caput Percent Hectares
per caputKilogrammes)
hectare
Burma 1950 ... ... 317 40 .. ... ... ...1960 ... ... 475 32 ... 93 17 ... 1
1965 15 334 62 566 32 37 85 15 1.04 1
1967 .. ... 613 34 ... ... ... ... 3
:ambodia 1950 ... ... 225 156 ... . .. ... ... --1960 '3 332 70 286 45 86 ... ... 0.711965 4 695 75 366 42 78 99 8 0.63 1
1966 ... ... 376 41 ... 100 9 ... 1
eylon 1950 ... ... 469 58 ... ... 19
, 1960
1965...
5 582...50
606647
4642
...116
9797
41
53
...0.34
39
41
1967 ... ... 665 40 ... 95 48 ... 46
Thina (Taiwan) 1950 ... ... '280 335 ... ... ... ... 92
1960 ... ... 505 31 ... ... ... ... 201
1965 5 846 47 692 26 118 65 32 0.15 257
1967 ... ... 750 24 ... 47 27 ... 284
India 1950 3249 122 70 10 207 51 41 ... ... 0.531960 '313 170 73 14 826 50 47 44 29 '0.51 2
1965 340 655 70 21 223 46 62 38 31 0.48 5
1967 ... ... 20 550 52 ... 41 40 ... 11
rapan 1950 137 954 44 ... 124 ... 311 173 0.13 152
1960 23 748 25 5 229 15 220 12 43 0.26 304
1965 23 685 24 8 192 12 346 6 43 0.25 321
1967 ... ... 11 161 12 ... 5 39 ... 384
Korea, Rep. of 1960 14 165 57 1 043 40 74 ... ... 0.09 137
1965 15 594 55 1 136 41 73 35 33 0.14 149
1967 ... ... 1 456 35 ... 35 26 ... 210
Pakistan 19501960
. ..'69 525
...'75
3 6393 875
58
53
...56
...
.........
...0.42 3
1965 83 842 74 4 904 47 58 62 23 0.34 5
1967 ... ... 6 201 47 ... 49 23 ... 11
Philippines 1950 '13 267 69 884 41 67 ... ... 0.50 3
1960 12 140 44 1 182 32 97 ... 0.56 12
1965 18 738 58 1 528 32 82 85 25 0.44 14
1967 ... ... 1 648 32 ... 77 19 ... 14
Thailand 1950 12 211 66 ... ... ... ... ... 0.391960 21 648 82 1 032 39 48 89 11 0.13 2
1965 24 001 78 1 251 32 52 84 9 0.48 3
1967 ... ... 1 572 31 ... 80 8 ... 9
Viet-Nam, Rep. of 1960 ... ... 508 37 ... ... ... ... S
1965 13 705 85 545 31 40 98 44 0.21 32
1967 ... ... ... " 97 13 ... 43
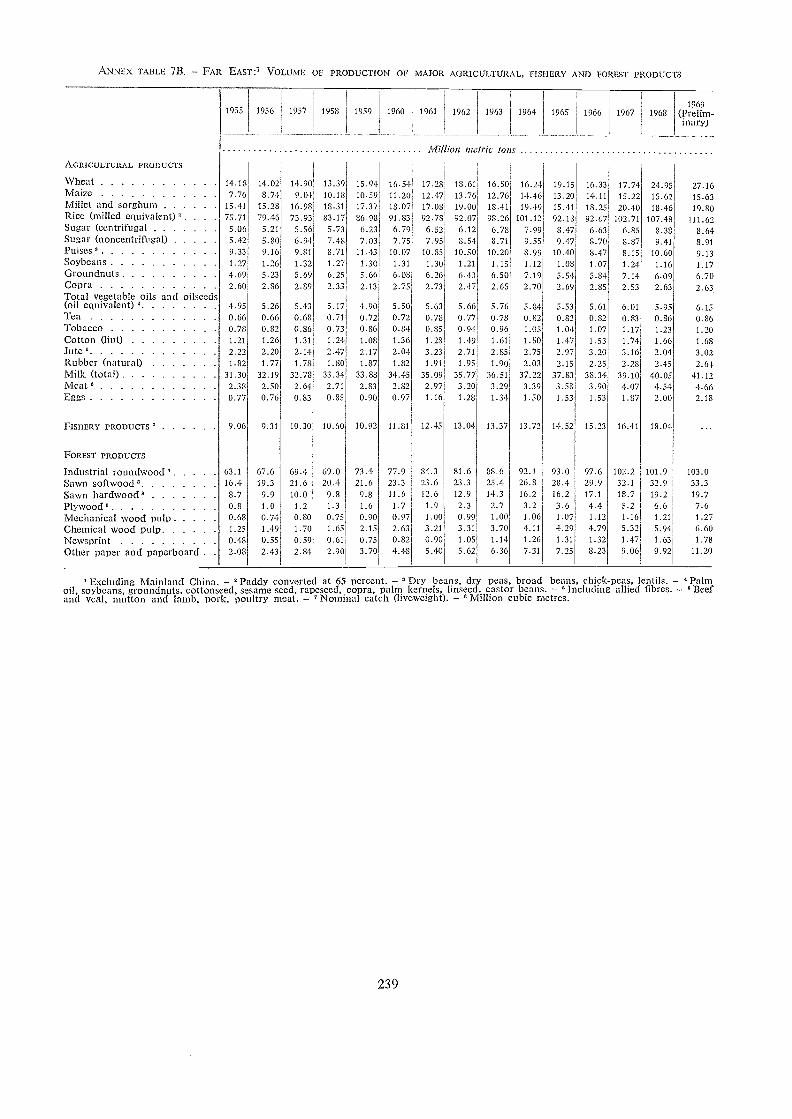
ANNEX TABLE 713. - FAR EAsT:1 VOLUME OF PRODUCTION OF MAJOR AGRICULTURAL, FISHERY AND FOREST PRODUCTS
239
1969(Prelim-inary)
103.033.319.77.61.276.601.78
11.20
Excluding Mainland China. - 2 Paddy converted at 65 percent. - " Dry beans, dry peas, broad beans, chick-peas, entils. - Palmoil, soybeans, groundnuts, cottonseed, sesame seed, rapeseed, copra, palm kernels, linseed. castor beans. - Including allied fibres. - Beefand veal, mutton and lamb, pork, poultry meat. - 7 Nominal catch (liveweight). - " Million cubic metres.
1955 1956 1957 1958 959 1960 1961 1962 1963 1964
tons
1965 1966 1967 1968
¡FI illion mclric
AGRICULTURAL PRODUCTS
Wheat 14 18 14.02 14.90 13.39 15.94 16.54 17.28 13.61 16.50 16.24 19.15 16.33 17.74. 24.95Maize 7 76 8.74 9.04 10.18 10.39 11.20 12.47 13.76 12.76 14.46 13.20 14.11 15.22 15.62Millet and sorghum 15 41 15.28 16.98 18.31 17.37 18.07 17.08 19.00 18.41 19.49 15.41 18.25 20.40 18.46Rice (milled equivalent) 2 . 75.71 79.46 73.93 83.17 86.98 91.83 92.78 92.07 98.26 101.12 92.18 92.67 102.71 107.48Sugar (centrifugal 5 06 5.21 5.56 5.73 6.23 6.79 6.52 6.12 6.78 7.99 8.47 6.63 6.85 8.38Sugar (noncentrifugal) 5 42 5.80 6.94 7.48 7.03 7.75 7.95 8.54 8.71 9.55 9.47 8.70 8.87 9.41Pulses 3 9 33 9.16 9.81 8.71 11.43 10.07 10.85 10.50 10.20 8.99 10.40 8.47 8.13 10.60Soybeans 1 27 1.26 1.32 1.27 1.30 1.31 1.30 1.21 1.15 1.12 1.08 1.07 1.24 1.16Groundnuts 4 69 5.23 5.69 6.25 5.66 6.08 6.26 6.43 6.50 7.19 5.54 5.84 7.14 6.09Copra 2 60 2.86 2.89 2.33 2.13 2.75 2.73 2.47 2.65 2.70 2.69 2.85 2.53 2.63Total vegetable oils and oilseeds(oil equivalent) 3 495 5.26 5.43 5.17 4.90 5.50 5.63 5.66 5.76 5.84 5.53 5.61 6.01 5.95Tea 066 0.66 0.68 0.71 0.72 0.72 0.78 0.77 0.78 0.82 0.82 0.82 0.83 0.86Tobacco 0 78 0.82 0.86 0.73 0.86 0.84 0.85 0.94 0.96 1.05 1.04 1.07 1.17 1.23Cotton (lint) 1 21 1.26 1.31 1.24 1.08 1.36 1.28 1.49 1.61 1.50 1.47 1.53 1.74 1.66Jute 3 2 22 2.20 2.14 2.47 2.17 2.04 3.23 2.71 2.85 2.75 2.97 3.20 3.16 2.04Rubber (natural) 1 82 1.77 1.78 1.80 1.87 1.82 1.91 1.95 1.90 2.03 2.15 2.25 2.28 2.45Milk (total) 31.30 32.19 32.78 33.34 33.88 34.45 35.09 35.77 36.51 37.22 37.83 38.34 39.10 40.05Meat 2 38 2.50 2.64 2.71 2.83 2.82 2.97 3.20 3.29 3.39 3.58 3.90 4.07 4.54Eggs 0 77 0.76 0.83 0.85 0.90 0.97 1.16 1.28 1.34 1.50 1.53 1.53 1.87 2.00
FISHERY PRODUCTS 7 906 9.31 10.30 10.60 10.92 11.81 12.45 13.04 13.37 13.72 14.52 15.23 16.41 18.04
FOREST PRODUCTS
Industrial rouncIwood 63 1 67.6 69.4 69.0 73.4 77.9 81.3 31.6 88.6 92.1 93.0 97.6 102.2 101.9Sawn softwood 3 16 4 19.3 21.6 20.4 21.6 23.3 23.6 23.3 25.4 26.8 28.4 29.9 32.1 32.9Sawn hardwood" 87 9.9 10.0 9.8 9.8 11.6 12.6 12.9 14.3 16.2 16.2 17.1 18.7 19.2Plywood 08 1.0 1.2 1.3 1.6 1.7 1.9 2.3 2.7 3.2 3.6 4.4 5.2 6.6Mechanical wood Pull) 0 68 0.74 0.80 0.75 0.90 0.97 1.00 0.99 1.00 1.06 1.07 1.12 1.16 1.21
Chemical wood pulp 1 25 1.49 1.70 1.65 2.15 2.63 3.21 3.31 3.70 4.11 4.29 4.79 5.32 5.94Newsprint 0 48 0.55 0.59 0.61 0.75 0.82 0.90 1.05 1.14 1.26 1.31 1.32 1.47 1.63Other paper and paperboard . . 2.08 2.43 2.84 2.90 3.70 4.48 5.40 5.62 6.36 7.31 7.25 8.23 9.06 9.92
27.1615.6319.80
111.628.648.919.131.176.702.63
6.150.861.201.683.022.61
41.124.662.18
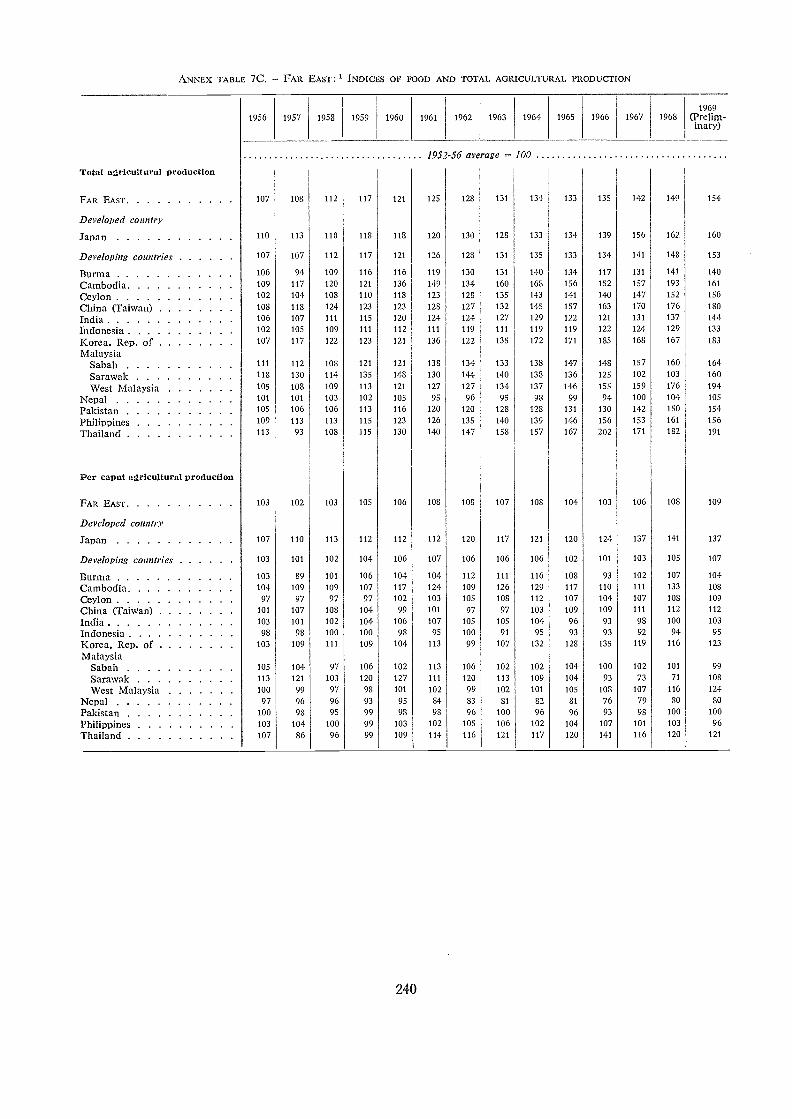
ANNEX TABLE 7C. FAR EAST:1 INDICES OF FOOD AND TOTAL AGRICULTURAL PRODUCTION
240
1956 1957 1958 1959 1960 1961 1962 1963 1964 1965 1966 1967 19681969
(Prelim-inary)
1952-56 average 100
Total agricultural production
FAR EAST 107 108 112 117 121 125 128 131 134 133 135 142 149 154
Developed country
Japan 110 113 118 118 118 120 130 128 133 131 139 156 162 160
Developing countries 107 107 112 117 121 126 128 131 135 133 134 141 148 153
Burma 106 94 109 116 116 119 130 131 140 134 117 131 141 140
Cambodia 109 117 120 121 136 149 134 160 168 156 152 157 193 161
Ceylon 102 104 108 110 118 123 128 135 143 141 140 147 152 156
China (Taiwan) 108 118 124 123 123 128 127 132 145 157 163 170 176 180
India 106 107 111 115 120 124 124 127 129 122 121 131 137 144
Indonesia 102 105 109 111 112 111 119 111 119 119 122 124 129 133
Korea. Rep. of 107 117 122 123 121 136 122 135 172 171 185 168 167 183
MalaysiaSabah 111 112 108 121 121 138 134 133 138 147 148 157 160 164
Sarawak 118 130 114 135 148 130 144 140 138 136 125 102 103 160
West Malaysia 105 108 109 113 121 127 127 131 137 146 155 159 176 194
Nepal 101 101 103 102 105 95 96 95 93 99 94 100 104 105
Pakistan 105 106 106 113 116 120 120 128 128 131 130 142 150 154
Philippines 109 113 113 115 123 126 135 140 139 146 156 153 161 156
Thailand 113 93 108 115 130 140 147 158 157 167 202 171 182 191
Per caput agricultural production
FAR EAST 103 102 103 105 106 108 108 107 108 104 103 106 108 109
Developed country
Japan 107 110 113 112 112 112 120 117 121 120 124 137 141 137
Developing countries 103 101 102 104 106 107 106 106 106 102 101 103 105 107
Burma 103 89 101 106 104 104 112 111 116 108 93 102 107 104
Cambodia 104 109 109 107 117 124 109 126 129 117 110 111 133 108
Ceylon 97 97 97 97 102 103 105 108 112 107 104 107 108 109
China (Taiwan) 101 107 108 104 99 101 97 97 103 109 109 111 112 112
India 103 101 102 104 106 107 105 105 104 96 93 98 100 103
Indonesia 98 98 100 100 98 95 100 91 95 93 93 92 94 95
Korea, Rep. of 103 109 111 109 104 113 99 107 132 128 135 119 116 123
MalaysiaSabah 105 104 97 106 102 113 106 102 102 104 100 102 101 99
Sarawak 113 121 103 120 127 111 120 113 109 104 93 73 71 108
West Malaysia 100 99 97 98 101 102 99 102 101 105 108 107 116 124
Nepal 97 96 96 93 95 84 83 81 82 81 76 79 80 80
Pakistan 100 98 95 99 98 98 96 100 96 96 93 98 100 100
Philippines 103 104 100 99 103 102 105 106 102 104 107 101 103 96
Thailand 107 86 96 99 109 114 116 121 117 120 141 116 120 121
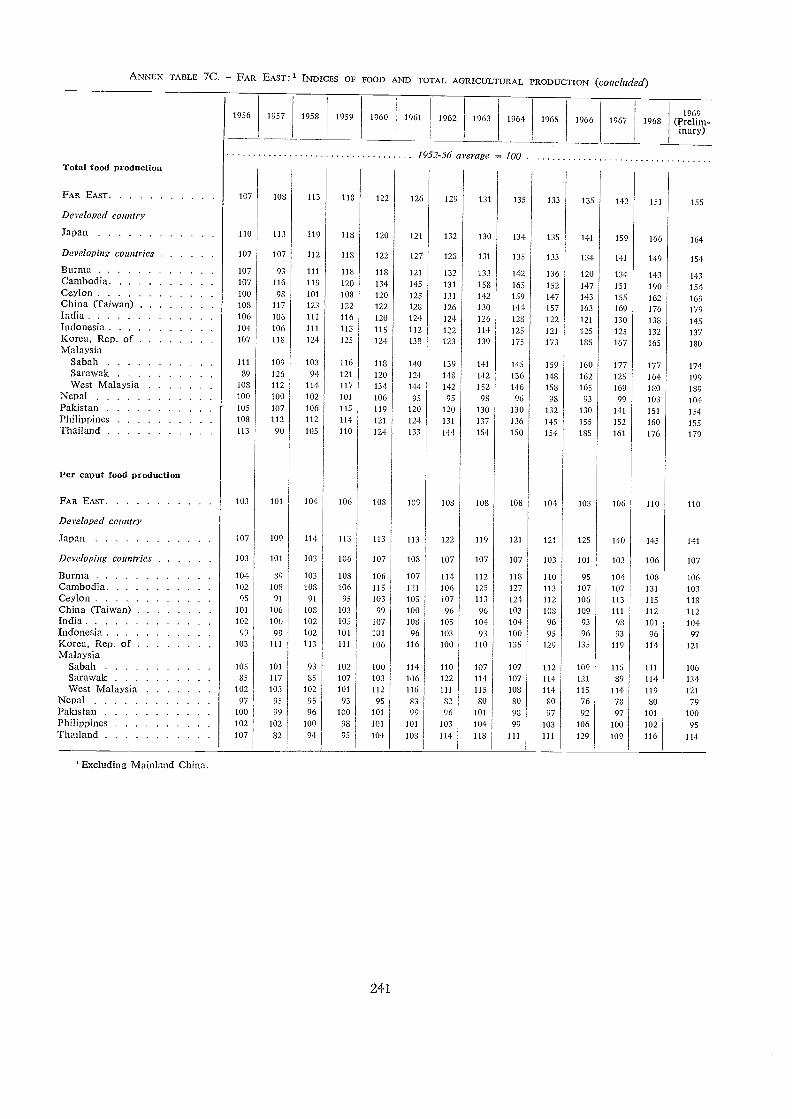
ANNEX TABLE 7C. FAR EAST:1 INDICES OF FOOD AND TOTAL AGRICULTURAL PRODUCTION (COnChided)
'Excluding Mainland China.
1956 1957 1958 1959 1960
241
1961 1962 1963 1964 1965 1966 1967 19681969
(Prelim-inary)
Total food production1952-56 average 100
FAR EAsT 107 108 113 118 122 126 129 131 135 133 135 142 151 155
Developed country
Japan 110 113 119 118 120 121 132 130 134 135 141 159 166 164
Developing countries 107 107 112 118 122 127 128 131 135 133 134 141 149 154BurmaCambodiaCeylonChina (Taiwan)IndiaIndonesia
107107
100108
106
104
93
116
98
117106
106
111
119
101
123
111
111
118
120
108122116
113
118
134
120122
120
115
121
145
125128
124
112
132
131
131
126
124
122
133
158142130
126
114
142
163
159
144
128
125
136152147157
122
121
120
147
143163
121
125
134
151
155169
130
125
143
190
162176
138
132
143
154169
179
145
137Korea, Rep. of 107 118 124 125 124 138 123 139 175 173 185 167 165 180Malaysia
Sabah 111 109 103 116 118 1,10 139 141 145 159 160 177 177 174Sarawak 89 126 94 121 120 124 148 142 136 148 162 125 164 199West Malaysia 108 112 114 117 134 114 142 152 146 158 165 169 180 189
Nepal 100 100 102 101 106 95 95 95 96 98 93 99 103 104Pakistan 105 107 106 115 119 120 120 130 130 132 130 141 151 154Philippines 108 112 112 114 121 124 131 137 136 145 155 152 160 155Thailand 113 90 105 110 124 133 144 154 150 154 185 161 176 179
Per caput food production
FAR EAST 103 101 104 106 108 109 108 108 108 104 103 106 110 110
Developed country
Japan 107 109 114 113 113 113 122 119 121 121 125 140 145 141
Developing countries 103 101 103 106 107 108 107 107 107 103 101 103 106 107
Burma 104 89 103 108 106 107 114 112 118 110 95 104 103 106Cambodia 102 108 108 106 115 121 106 125 127 113 107 107 131 103Ceylon 91 91 95 103 105 107 113 124 112 106 113 115 118
China (Taiwan) 101 106 108 103 99 100 96 96 103 108 109 Ill 112 112India 102 100 102 105 107 108 105 104 104 96 93 98 101 104Indonesia 99 99 102 101 101 96 103 93 100 95 96 93 96 97Korea, Rep. of 103 111 113 111 106 116 100 110 135 129 135 119 114 121
MalaysiaSabah 105 101 93 102 100 114 110 107 107 112 109 115 111 106Sarawak 85 117 85 107 103 106 122 114 107 114 121 89 114 134West Malaysia 102 103 102 101 112 116 111 115 108 114 115 114 119 121
Nepal 97 95 95 93 95 83 32 80 SO SO 76 78 80 79Pakistan 100 99 96 100 101 99 96 101 98 97 92 97 101 100Philippines 102 102 100 98 101 101 103 104 99 103 106 100 102 95Thailand 107 82 94 95 104 103 114 118 Ill III 129 109 116 114
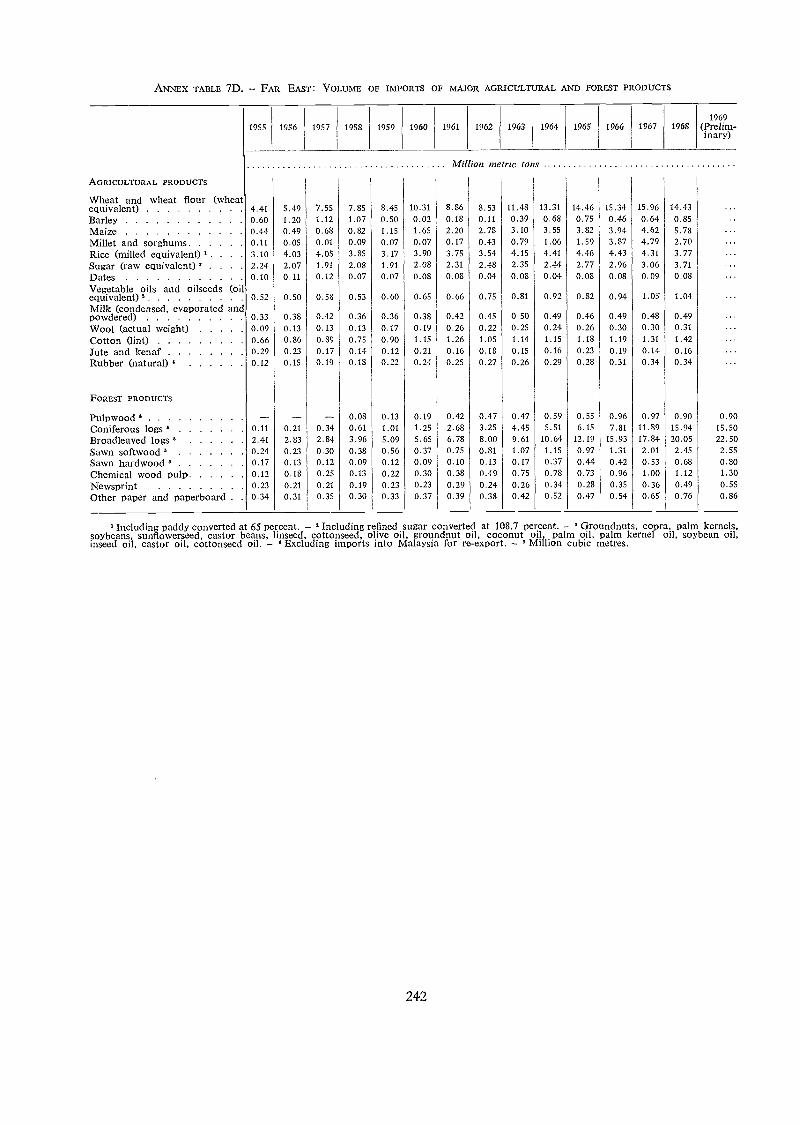
ANNEX TABLE 7D. - FAR EAST: VOLUME OF IMPORTS OF MAJOR AGRICULTURAL AND FOREST PRODUCTS
242
Including paddy converted at 65 percent. - ' Including refined sugar converted at 108.7 percent. - ' Groundnuts, copra, palm kernels,soybeans, sunflowerseed, castor beans, linseed, cottonseed, olive oil, groundnut oil, coconut oil. palm oil, palm kernel oil, soybean oil,inseed oil, castor oil, cottonseed oil. - Excluding imports into Malaysia for re-export. - Million cubic metres.
1955 1956 1957 1958 1959 1960 1961 1962 1963 1964 1965 1966 1967 19681969
(Prehm-inary)
Million metric tons .
AGRICULTURAL PRODUCTS
Wheat and wheat flour (wheatequivalent) 4.41 5.49 7.55 7.85 8.45 10.31 8.86 8.53 11.48 13.31 14.46 15.34 15.96 14.43
Barley 0.60 1.20 1.12 1.07 0.50 0.02 0.18 0.11 0.39 0.68 0.75 0.46 0.64 0.85Maize 0.44 0.49 0.68 0.82 1.15 1.65 2.20 2.78 3.10 3.55 3.82 3.94 4.62 5.78Millet and sorghums 0.11 0.05 0.01 0.09 0.07 0.07 0.17 0.43 0.79 1.06 1.59 3.87 4.79 2.70Rice (milled equivalent) ' . . . . 3.10 4.03 4.05 3.85 3.17 3.90 3.75 3.54 4.15 4.41 4.46 4.43 4.31 3.77
Sugar (raw equivalent) . . . . 2.24 2.07 1.91 2.08 1.91 2.08 2.31 2.48 2.35 2.44 2.77 2.96 3.06 3.71
Dates 0.10 0.11 0.12 0.07 0.07 0.08 0.03 0.04 0.08 0.04 0.08 0.08 0.09 0.08
Vegetable oils and oilseeds (oilequivalent) 0 52 0.50 0.58 0.53 0.60 0.65 0.66 0.75 0.81 0.92 0.82 0.94 1.05 1.04Milk (condensed, evaporated andpowdered) 0.33 0.38 0.42 0.36 0.36 0.38 0.42 0.45 0.50 0.49 0.46 0.49 0.48 0.49Wool (actual weight) 0.09 0.13 0.13 0.13 0.17 0.19 0.26 0.22 0.25 0.24 0.26 0.30 0.30 0.31
Cotton (lint) 0.66 0.86 0.89 0.75 0.90 1.15 1.26 1.05 1.14 1.15 1.18 1.19 1.31 1.42
Jute and kenaf 0.29 0.23 0.17 0.14 0.12 0.21 0.16 0.18 0.15 0.16 0.23 0.19 0.14 0.16
Rubber (natural) 0.12 0.15 0.19 0.18 0.22 0.24 0.25 0.27 0.26 0.29 0.28 0.31 0.34 0.34
FOREST PRODUCTS
Pulpwood 0.08 0.13 0.19 0.42 0.47 0.47 0.59 0.55 0.96 0.97 0.90 0.90Coniferous logs 0.11 0.21 0.34 0.61 1.01 1.25 2.68 3.25 4.45 5.51 6.15 7.81 11.89 15.94 15.50Broadleaved logs 2.41 2.83 2.84 3.96 5.09 5.65 6.78 8.00 9.61 10.64 12.19 15.93 17.84 20.05 22.50
Sawn softwood 0.24 0.23 0.30 0.38 0.56 0.37 0.75 0.81 1.07 1.15 0.97 1.31 2.01 2.45 2.55Sawn hardwood 0.17 0.13 0.12 0.09 0.12 0.09 0.10 0.13 0.17 0.37 0.44 0.42 0.53 0.68 0.80Chemical wood PuIP 0.12 0.18 0.25 0.13 0.22 0.30 0.38 0.49 0.75 0.78 0.73 0.96 1.00 1.12 1.30
Newsprint 0.23 0.21 0.21 0.19 0.23 0.23 0.29 0.24 0.26 0.34 0.28 0.35 0.36 0.49 0.55Other paper and paperboard . . 0.34 0.31 0.35 0.30 0.33 0.37 0.39 0.38 0.42 0.52 0.47 0.54 0.65 0.76 0.86
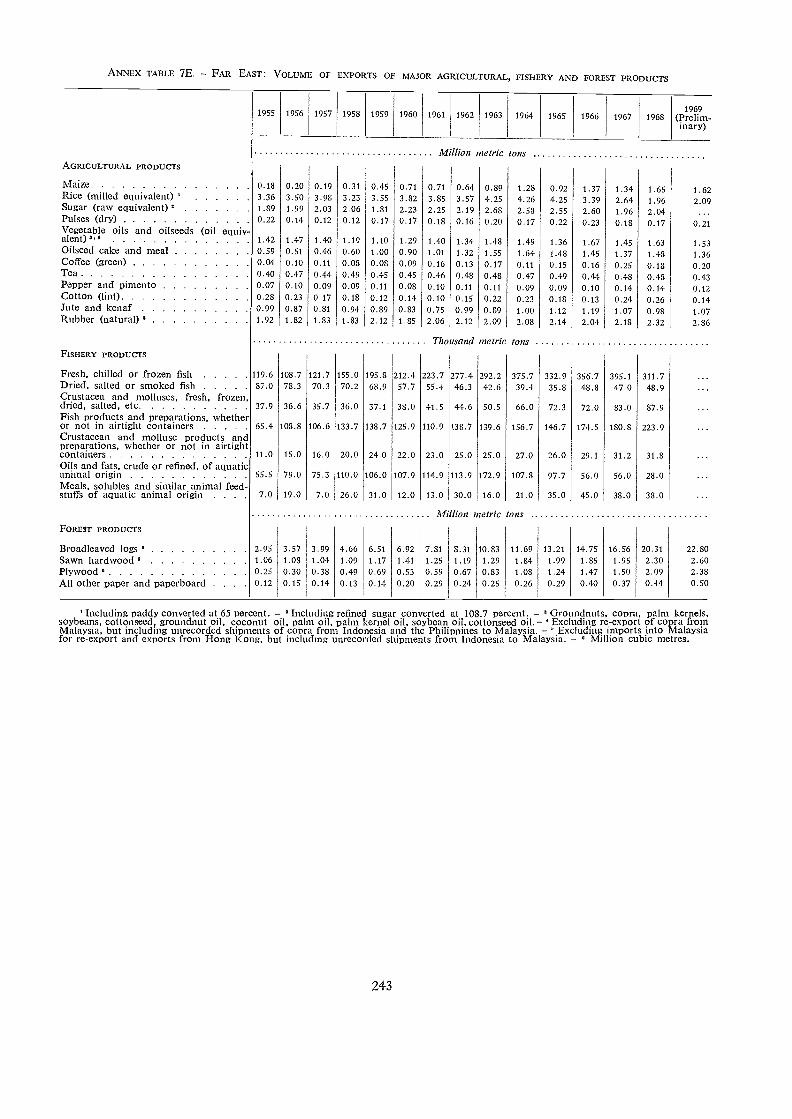
ANNEX TABLE 7E. - Fmt EAST: VOLUME OF EXPORTS OF MAJOR AGRICULTURAL, FISHERY AND FOREST PRODUCTS
243
' Including paddy converted at 65 percent. - ' Inc uding refined sugar converted at 103.7 percent. - Groundnuts, copra, palm kernels,soybeans, cottonseed, groundnut oil, coconut oil, palm oil, palm kernel oil, soybean oil, cottonseed oil.- Excluding re-export of copra fromMalaysia. but including unrecorded shipments of copra from Indonesia and the Philippines to Malaysia. - Excluding imports into Malaysiafor re-export and exports from Hong Kong, but including unrecorded shipments from Indonesia to Malaysia. - ' Million cubic metres.
1955 1956 1957 1958 1959 1960 1961 1962 1963 1964 1965 1966 1967 19681969
(Prelim-inary)
Million metric tonsAGRICULTURAL PRODUCTS
Maize 0.18 0.20 0.19 0.31 0.45 0.71 0.71 0.64 0.89 1.28 0.92 1.37 1.34 1.65 1.62Rice (milled equivalent) 3.36 3.50 3.98 3.23 3.55 3.82 3.85 3.57 4.25 4.26 4.25 3.39 2.64 1.96 2.09Sugar (raw equivalent) 1.89 1.99 2.03 2.06 1.81 2.23 2.25 2.19 2.68 2.58 2.55 2.60 1.96 2.04Pulses (dry) 0 22 0.14 0.12 0.12 0.17 0.17 0.13 0.16 0.20 0.17 0.22 0.23 0.18 0.17 0.21Vegetable oils and oilseeds (oil equiv-alent)',' 1.42 1.47 1.40 1.19 1.10 1.29 1.40 1.34 1.48 1.49 1.36 1.67 1.45 1.63 1.53Oilseed cake and meal 0 59 0.51 0.46 0.60 1.00 0.90 1.01 1.32 1.55 1.64 1.48 1.45 1.37 1.48 1.36Coffee (green) 0 04 0.10 0.11 0.08 0.08 0.09 0.16 0.13 0.17 0.11 0.15 0.16 0.25 0.18 0.20Tea 0 40 0.47 0.44 0.49 0.45 0.45 0.46 0.48 0.48 0.47 0.49 0.44 0.48 0.48 0.43Pepper and pimento 0.07 0.10 0.09 0.09 0.11 0.08 0.10 0.11 0.11 0.09 0.09 0.10 0.14 0.14 0.12Cotton (lint) 0.23 0.23 0.17 0.18 0.12 0.14 0.10 0.15 0.22 0.23 0.18 0.13 0.24 0.26 0.14Jute and kenaf 0.99 0.87 0.81 0.94 0.89 0.83 0.75 0.99 0.89 1.00 1.12 1.19 1.07 0.98 1.07Rubber (natural) 1.92 1.82 1.83 1.83 2.12 1.85 2.06 2.12 2.09 2.08 2.14 2.04 2.18 2.32 2.86
Thousand metric tonsFISHERY PRODUCTS
Fresh, chilled or frozen fish 119 6 108.7 121.7 155.0 195.8 212.4 223.7 277.4 292.2 375.7 332.9 356.7 395.1 311.7Dried, salted or smoked fish 87 0 78.3 70.3 70.2 68.9 57.7 55.4 46.3 42.6 39.4 35.8 48.8 47.0 48.9Crustacea and molluscs, fresh, frozen,dried, salted, etc . 37 9 36.6 35.7 36.0 37.1 38.0 41.5 44.6 50.5 66.0 72.3 72.0 83.0 87.9Fish products and preparations, whetheror not in airtight containers 654 108.8 106.6 133.7 138.7 125.9 110.9 138.7 139.6 156.7 146.7 174.5 180.8 223.9Crustacean and mollusc products andpreparations, whether or not in airtightcontainers 11 0 15.0 16.0 20.0 24.0 22.0 23.0 25.0 25.0 27.0 26.0 29.1 31.2 31.8Oils and fats, crude or refined, of aquaticanimal origin 55.5 79.0 75.3 110.0 106.0 107.9 114.9 113.9 172.9 107.8 97.7 56.0 56.0 28.0Meals, solubles and similar animal feed-stuffs of aquatic animal origin . . . . 7.0 19.0 7.0 26.0 31.0 12.0 13.0 30.0 16.0 21.0 35.0 45.0 38.0 38.0
Million metric tonsFOREST PRODUCTS
Broadleaved logs 2.95 3.57 3.99 4.66 6.51 6.92 7.81 8.31 10.83 11.69 13.21 14.75 16.56 20.31 22.80Sawn hardwood 1.06 1.08 1.04 1.09 1.17 1.41 1.25 1.19 1.29 1.84 1.99 1.85 1.95 2.30 2.60Plywood 0.25 0.30 0.38 0.49 0.69 0.53 0.59 0.67 0.83 1.08 1.24 1.47 1.50 2.09 2.38All other paper and paperboard . . . . 0.12 0.15 0.14 0.13 0.14 0.20 0.29 0.24 0.25 0.26 0.29 0.40 0.37 0.44 0.50
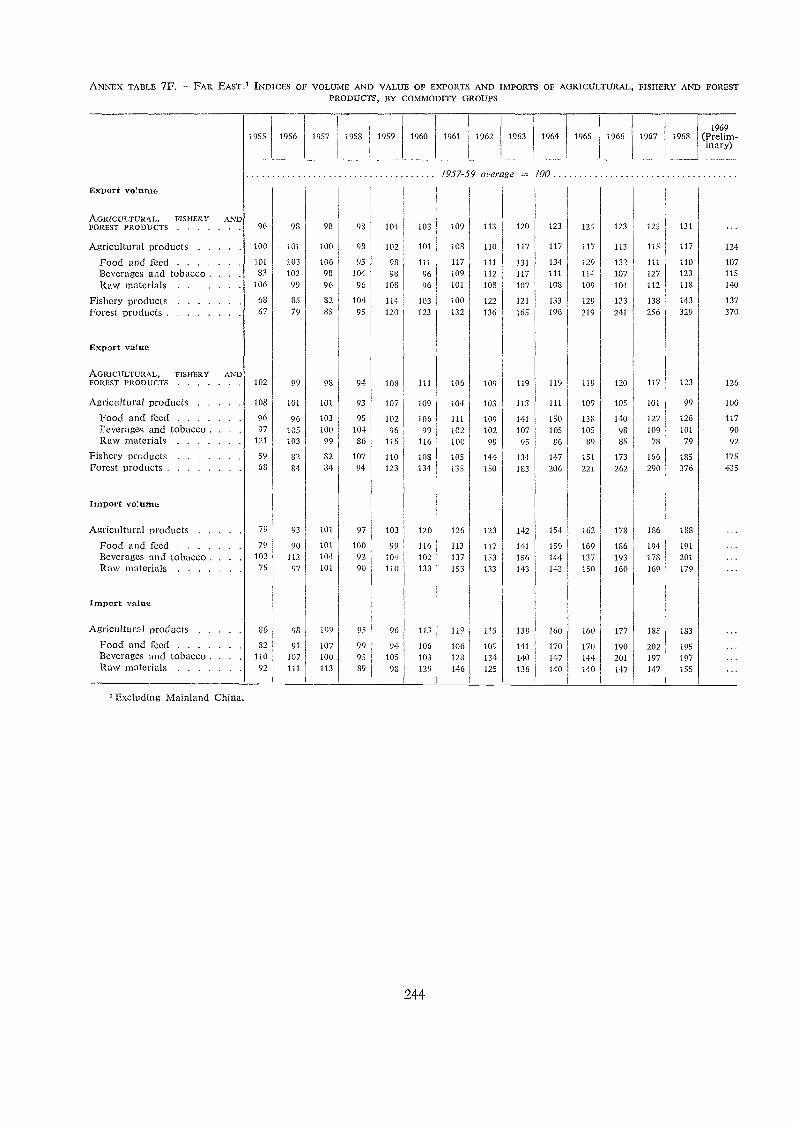
ANNEX TABLE 7F. FAR EAST:I- INDICES OF. VOLUME AND VALUE OF EXPORTS AND IMPORTS OF AGRICULTURAL, FISHERY AND FORESTPRODUCTS, BY COMMODITY GROUPS
244
1955 1956 1957 1958 1959 1960 1961 1962 1963 1964 1965 1966 1967 19681969
(Prelim-inary)
1957-59 average 100
Expor o1utne
AGRICULTURAL, FISHERY ANOFOREST PRODUCTS 96 98 98 98 104 103 109 113 120 123 124 123 125 131
Agricultural products 100 101 100 98 102 101 108 110 117 117 117 113 115 117 124
Food ancl feed 101 103 106 95 98 111 117 111 131 134 129 132 111 110 107
'Beverages and tobacco . 83 102 98 104 98 96 109 112 117 111 114 107 127 123 115
Raw materials 106 99 96 96 108 96 101 108 107 108 109 104 112 118 140
Fishery products 68 85 82 104 114 103 100 122 121 133 129 133 138 143 137
Forest products 67 79 SS 95 120 123 132 136 165 196 219 241 256 329 370
Export value
AGRICULTURAL, FISHERY ANL)FOREST PRODUCTS 102 99 98 94 108 111 106 109 119 119 119 120 117 123 126
Agricultural products 108 101 101 93 107 109 104 103 113 111 109 105 101 99 100
Food and feed 96 96 103 95 102 106 111 109 141 150 138 140 127 126 117
leverages and tobacco . 97 105 100 104 96 99 102 102 107 105 105 98 109 101 90Raw materials 121 103 99 86 115 116 100 99 95 86 89 85 78 79 92
Fishery products 59 82 82 107 110 108 105 144 134 147 151 173 166 185 175
Forest products 68 84 84 94 123 134 135 150 183 206 221 262 290 376 435
Import vo1ume
Agricultural products 79 93 101 97 103 120 126 123 142 154 162 178 186 188
Food and feed 79 90 101 100 99 116 113 117 141 159 169 186 194 191
Beverages and tobacco . 102 113 104 92 104 102 137 153 156 144 137 193 178 201
Raw materials 75 97 101 90 110 133 153 133 143 143 150 160 169 179
Import value
Agricultural products 86 98 109 95 96 113 119 115 139 160 160 177 185 183
Food and feed 82 91 107 99 94 106 106 109 141 170 170 190 202 19513everages and tobacco . . . 110 107 100 95 103 103 128 134 140 147 144 201 197 197Raw materials 92 Ill 113 89 98 129 146 125 136 140 140 147 147 155
' Excluding Mainland China.
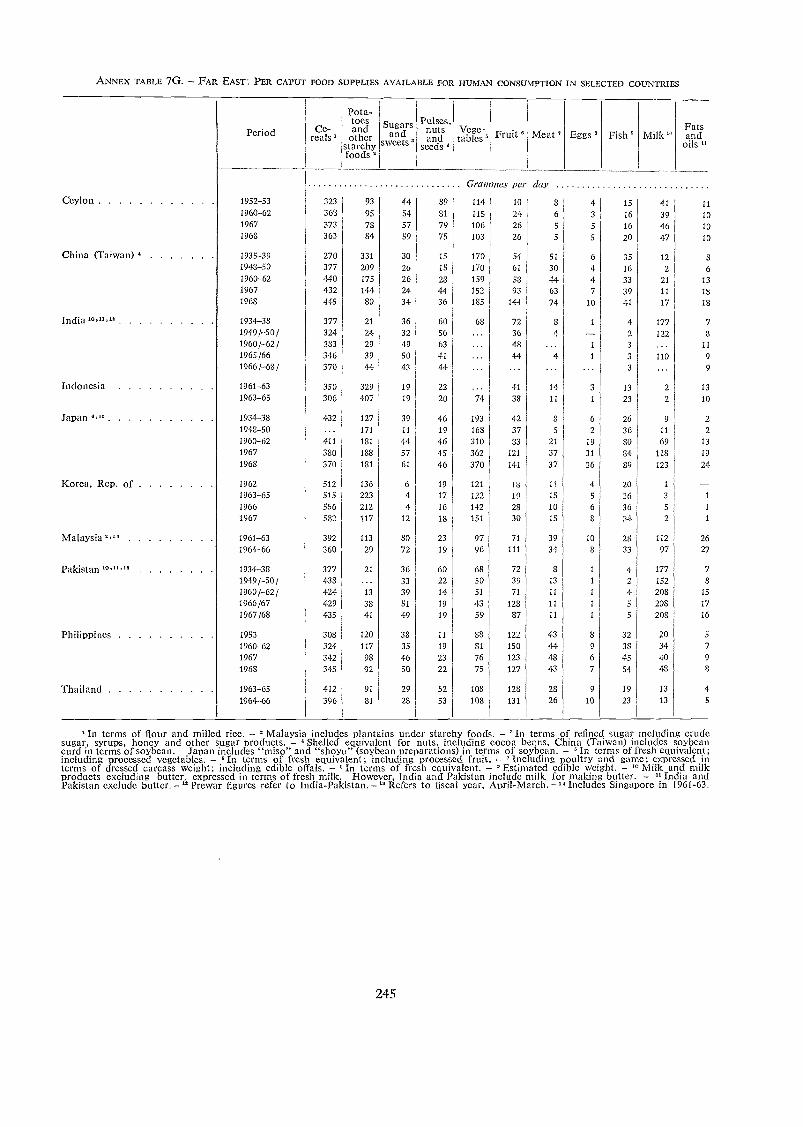
ANNEX TABLE 7G. - FAR EAST: PER CAPUT FOOD SUPPLIES AVAILABLE FOR HUMAN CONSUMPTION IN SELECTED COUNTRIES
Ceylon
China (Taiwan) 4
India 7°,","
Indonesia
Japan 4,"
Korea, Rep. of
Malaysia 4'"
Pakistan 70,17,7'
Philippines
Thailand
Period Ce-reals
Pota-toesand
otherstarchyfoods
Sugarsand
sweets
Pulses,nutsand
seeds
Vege-tables Fruit Meat 7 Eggs Fish Milk"
Fatsand
oils 7"
Gran nies per day
1952-53 323 93 44 89 114 10 8 4 15 41 111960-62 368 95 54 81 115 24 6 3 16 39 101967 373 78 57 79 106 26 5 5 16 46 101968 363 84 59 75 103 26 5 5 20 47 10
1935-39 270 331 30 15 170 54 51 6 35 12 81948-50 377 209 26 15 170 61 30 4 16 2 61960-62 440 175 26 28 159 58 44 4 33 21 131967 432 114 24 44 152 93 63 7 39 11 181968 145 80 34 36 185 144 74 10 41 17 18
1934-38 377 21 36 60 68 72 8 1 4 177 71919 ¡-50/ 324 24 32 56 36 4 2 122 8
1960 /-62 / 333 29 49 63 18 ... I 3 ... 11
1965/66 346 39 50 41 41 4 1 3 110 91966/-68/ 370 44 43 44 ... ... 3 ... 9
1961-63 350 329 19 22 41 14 3 13 2 13
1963-65 306 407 19 20 74 38 11 1 23 2 10
1931-38 432 127 39 46 193 42 8 6 26 9 21948-50 171 11 19 168 37 5 2 36 11 2
1960-62 411 181 44 46 310 33 21 19 SO 69 13
1967 380 188 57 45 362 121 37 31 94 118 19
1963 370 181 61 46 370 141 37 36 89 123 24
1962 512 136 6 19 121 i 5 11 4 20 1
1963-65 515 223 4 17 122 19 15 5 26 3 1
1966 556 212 4 16 142 28 10 6 36 5 1
1967 582 117 12 18 151 30 15 8 34 2 1
1961-63 392 113 80 23 97 71 39 10 28 112 261964-66 360 29 72 19 96 111 34 8 33 97 27
1934-38 377 21 36 60 68 72 8 1 4 177 7
1949/-50/ 433 ... 33 22 50 39 13 1 2 152 8
1960/-62/ 424 13 39 14 51 71 11 1 4 208 15
1966/67 429 38 51 19 43 128 11 1 5 208 17
1967/68 435 41 49 19 59 37 11 1 5 208 16
1953 308 120 38 11 33 122 43 8 32 20 5
1960-62 324 117 35 19 81 150 44 9 38 34 7
1967 342 98 46 23 76 123 48 6 45 40 9
1968 345 92 50 22 75 127 43 7 51 43 3
1963-65 412 91 29 52 108 128 28 9 19 13 41964-66 396 31 23 53 108 131 26 10 23 13 5
'In terms of flour and milled rice. - Malaysia includes plantains under starchy foods. - 'In terms of refined sugar including crudesugar, syrups, honey and other sugar products. - 'Shelled equivalent for nuts, including cocoa beans, China (Taiwan) includes soybeancurd in terms of soybean. Japan includes "miso" and "shoyu" (soybean preparations) in terms of soybean. - terms of fresh equivalent;including processed vegetables. - In terms of fresh equivalent; including processed fruit. - Including poultry and game; expressed interms of dressed carcass weight; including edible offals. - 81n terms of fresh equivalent. - ° Estimated edible weight. - '" Milk and milkproducts excluding butter, expressed in terms of fresh milk. However. India and Pakistan include milk for making butter. - "India andPakistan exclude butter. -"Prewar figures refer to India-Pakistan. - " Refers to fiscal year, April-March. -"Includes Singapore in 1961-63.
245
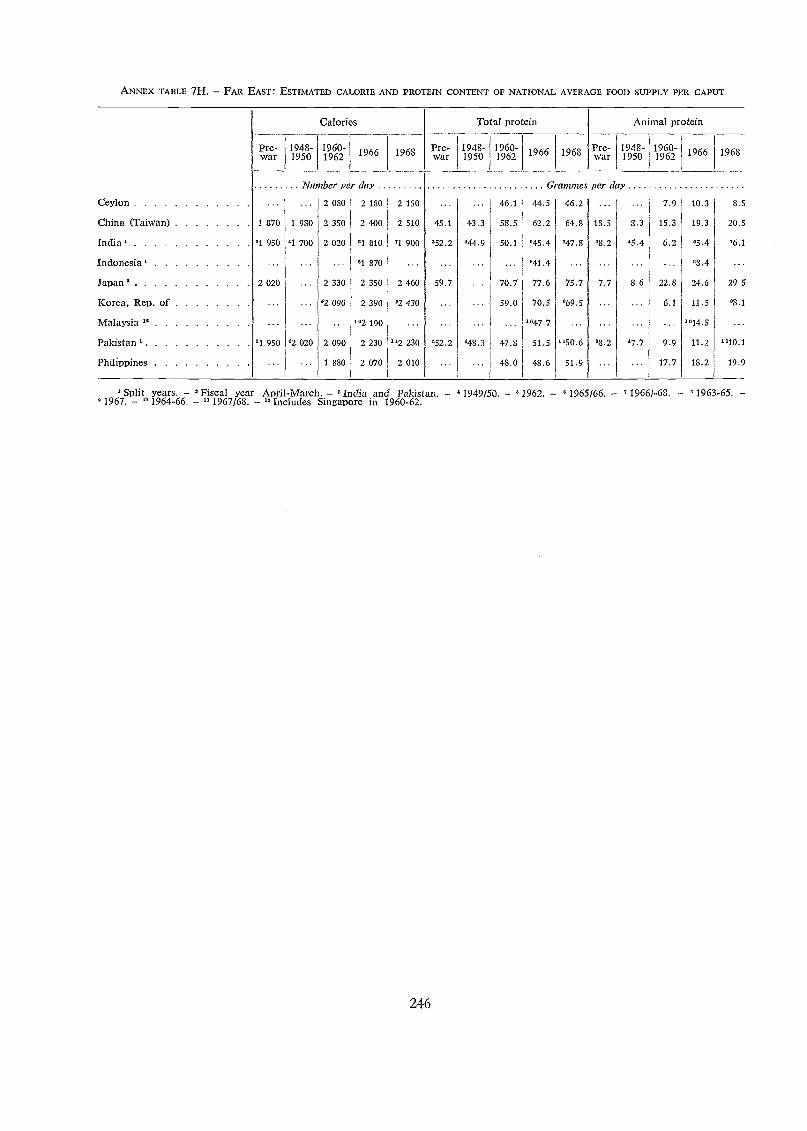
ANNEX TABLE 7H. - FAR EAsT: ESTIMATED CALORIE AND PROTEIN CONTENT OF NATIONAL AVERAGE FOOD SUPPLY PER CAPUT
Ceylon
China (Taiwan)
India
Indonesia
Japan
Korea, Rep. of
Malaysia "
Pakistan
Philippines
Pre-war
1948-1950
Calories
1960-1962
Number per day
2 080 2 180 2 130
1 870 1 980 2 350 2 400 2 510
01 950 M 700 2 020 01 810 01 900
01 870
2 020 2 330 2 350 2 460
02 090 2 390 92 430
102 190
01 950 "2 020 2 090 2 230 230
1 880 2 070 2 010
246
Pre-War
45.1
352.2
59.7
'52.2
1948-1950
43.3
'44.9
'48.3
Total protein
1960-1962
46.1
58.5
50.1
70.7
59.0
47.8
48.0
44.5
62.2
'45.4
'41.4
77.6
70.5
1047.7
51.5
48.6
G.ammes per day
46.2
64.8
747.8
75.7
969.5
1150.6
51.9
Pre-War
15.5
7.7
'8.2
1948-1950
Ammal protein
8.3
8.6
"7.7
1960-1962
7.9
15.3
6.2
22.8
6.1
9.9
17.7
10.3
19.3
98.4
24.6
11.5
0914.5
11.2
18.2
8.5
20.5
06.1
29.5
°8.1
"110.1
19.9
' Split years. - 'Fiscal year April-March - 'India and Pakistan. - 1949/50. - '1962. - 1965/66. - 71966/-68. - "1963-65. -91967. - "1964-66. - " 1967/68. - " Includes Singapore in 1960-62.
1966 1968 1966 1968 1966 1968
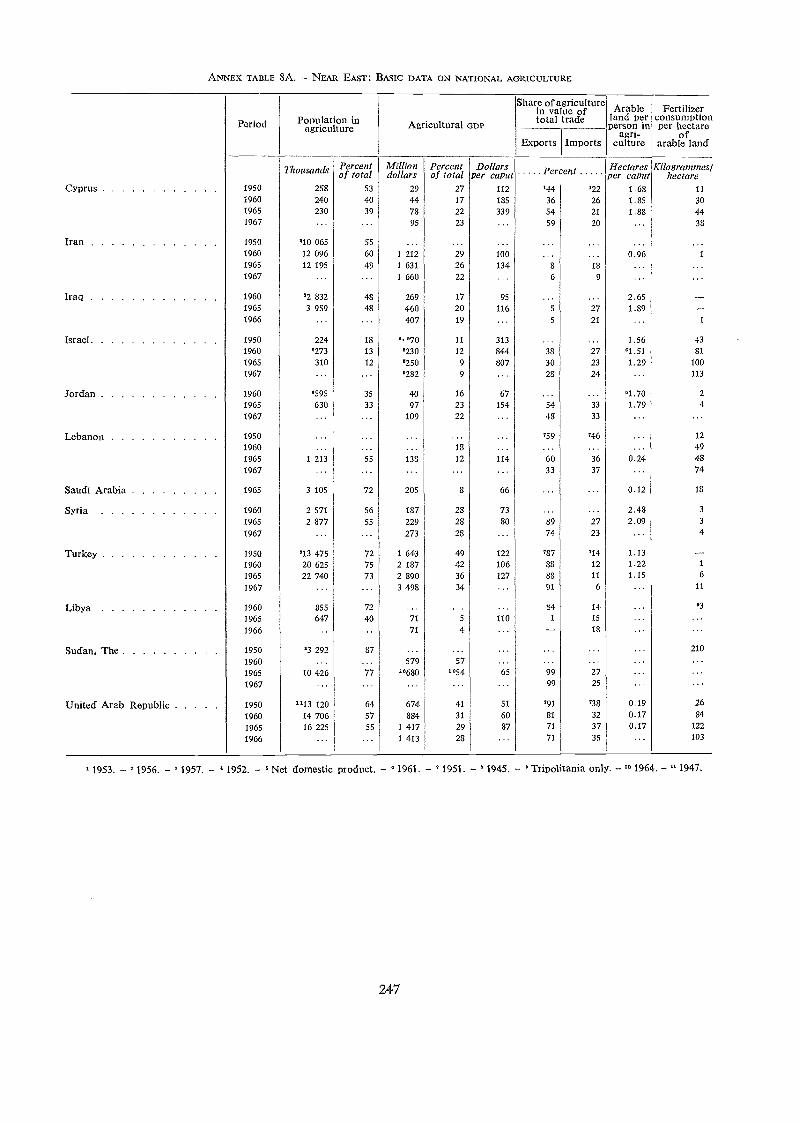
ANNEX TABLE 8A. - NEAR EAST: BASIC DATA ON NATIONAL AGRICULTURE
' 1953. - 1956. - 1957. - 4 1952. - Net domestic product. - 1961. - 1951. - 1945. - °Tripolitania only. - m 1964. - "1947.
247
Period Population inagriculture Agricultural GDP
Share of agriculturein va ue oftotal trade
Arableland perPerson in
agri-culture
Fertilizerconsumptionper hectare
ofarable landExports Imports
Thousands Percentof total
Milliondollars
Percentof total
Dollarsper caput Percent Hectares
per caputKilogrammes'
hectare-2yprus 1950 258 53 29 27 112 '44 '22 1.68 11
1960 240 40 44 17 185 36 26 1.85 301965 230 39 78 22 339 54 21 1.88 441967 ... ... 95 23 ... 59 20 ... 38
ran 1950 '10 065 55 ... ... ... ... ... ... ".1960 12 096 60 1 212 29 100 ... ... 0.961965 12 195 49 1 631 26 134 8 18 ... .,.1967 ... ... 1 660 22 ... 6 9 - .
raq 1960 '2 832 48 269 17 95 ... ... 2.65 -1965 3 959 48 460 20 116 5 27 1.89 -1966 ... ... 407 19 ... 5 21 ... 1
srael 1950 224 13 '''70 11 313 ... ... 1.56 431960 °273 13 '230 12 844 38 27 '1.51 81
1965 310 12 '250 9 807 30 23 1.29 1001967 - ... .282 9 ... 28 24 ... 113
ordan 1960 .595 35 40 16 67 ... °1.70 21965 630 33 97 23 154 54 33 1.79 4
1967 ... ... 109 22 ... 48 33 -.ebanon 1950
1960......
......
-- 18..
"59 '46 -
...12
491965 1 213 55 138 12 114 60 36 0.24 481967 ... ... - 33 37 ... 74
iaudi Arabia 1965 3 105 72 205 3 66 ... - 0.12 13
iyria 1960 2 571 56 187 28 73 ... .. 2.48 3
1965 2 877 55 229 28 80 89 27 2.09 3
1967 . ... 273 28 ... 74 23 ... 4
rurkey 1950 '13 475 72 1 643 49 122 '87 '14 1.13 -1960 20 625 75 2 187 42 106 88 12 1.22 1
1965 22 740 73 2 890 36 127 88 11 1.15 6
1967 ... ... 3 498 34 ... 91 6 ... 11
_.ibya 1960 855 72 ... ... ... 84 14 .3
1965 647 40 71 5 110 1 15 - ...1966 . ... 71 4 ... - 18 ' -
3udan, The 19501960
'3 292 87. 579 57 -
-... 210
1965 10 426 77 "680 '°54 65 99 27 ... ..1967 - - ... 99 25 ... ...
Jnited Arab Republic 1950 "13 120 64 674 41 51 '91 '38 0.19 26
1960 14 706 57 884 31 60 81 32 0.17 84
1965 16 225 55 1 417 29 87 71 37 0.17 122
1966 ... ... 1 413 28 ... 71 35 ... 103
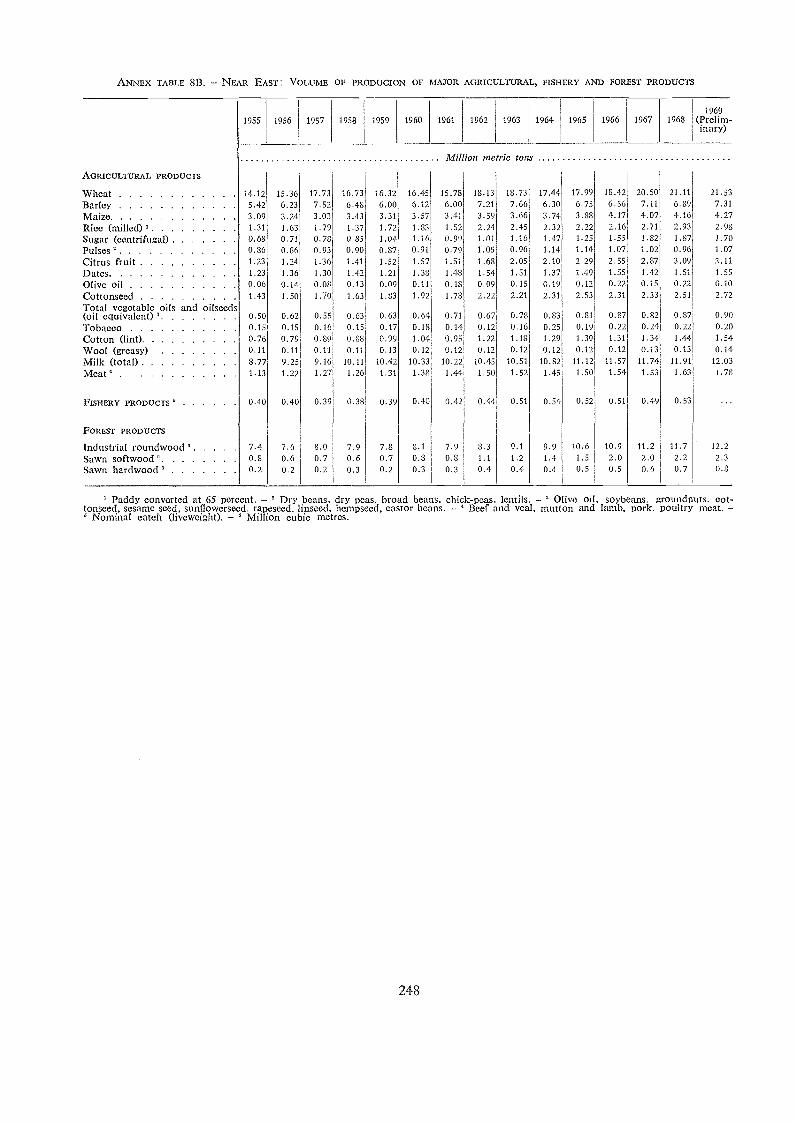
ANNEX TABLE 8B. - NEAR EAST: VOLU E OF PRODUCION OF MAJOR AGRICULTURAL, FISHERY AND FOREST PRODUCTS
248
Paddy converted at 65 percent. - Dry beans, dry peas, broad beans, chick-peas, lentils. -O ive oil, soybeans, groundnuts, cot-tonseed, sesame seed, sunflowerseed, rapeseed, linseed, hempseed, castor beans. - Beef and veal, mutton and lamb, pork, poultry meat. -° Nominal catch (liveweight). - ° Million cubic metres.
955 1956 1957 1958 1959 1960 1961 1962 1963 1964 1965 1966 1967 19651969
(Prelim-inary)
Million metric tots
AGRICULTURAL PRoDucTs
Wheat 14 12 15.36 17.73 16.73 16.32 16.45 15.78 18.13 18.73 17.44 17.99 18.42 20.50 21.11 21.53
Barley 5 42 6.23 7.52 6.48 6.00 6.12 6.00 7.21 7.66 6.30 6.75 6.56 7.11 6.89 7.31
Maize 3 09 3.24 3.03 3.43 3.31 3.57 3.41 3.59 3.66 3.74 3.88 4.17 4.07 4.16 4.27Rice (milled) ' 1.31 1.63 1.79 1.37 1.72 1.83 1.52 2.24 2.45 2.32 2.22 2.16 2.71 2.93 2.98
Sugar (centrifugal) 0.68 0.71 0.78 0.85 1.04 1.16 0.99 1.01 1.16 1.47 1.25 1.55 1.82 1.87 1.70
Pulses 0.86 0.86 0.93 0.90 0.87 0.91 0.79 1.05 0.96 1.14 1.14 1.07 1.02 0.96 1.07Citrus fruit 1 23 1.24 1.36 1.41 1.52 1.57 1.51 1.68 2.05 2.10 2.29 2.55 2.87 3.09 3.11
Dates. 1.23 1.36 1.30 1.12 1.21 1.38 1.48 1.54 1.51 1.37 1.49 1.55 1.42 1.51 1.55
Olive oil 0.06 0.14 0.08 0.13 0.09 0.11 0.18 0.09 0.15 0.19 0.12 0.22 0.15 0.22 0.10
Cottonseed 1 43 1.50 1.70 1.63 1.83 1.92 1.78 2.22 2.21 2.31 2.53 2.31 2.33 2.51 2.72
Total vegetable oils and oilseeds(oil equivalent) ' 0.50 0.62 0.55 0.63 0.63 0.64 0.71 0.67 0.78 0.83 0.81 0.87 0.82 0.87 0.90
Tobacco 0.15 0.15 0.16 0.15 0.17 0.18 0.14 0.12 0.16 0.25 0.19 0.22 0.24 0.22 0.20
Cotton (lint) 0.76 0.79 0.89 0.88 0.99 1.04 0.95 1.22 1.18 1.29 1.39 1.31 1.34 1.14 1.54
Wool (greasy) 0.11 0.11 0.11 0.11 0.13 0.12 0.12 0.12 0.12 0.12 0.12 0.12 0.13 0.13 0.14Milk (total) 8 77 9.25 9.16 10.11 10.42 10.33 10.22 10.45 10.51 10.82 11.12 11.57 11.74 11.91 12.03
Meat" 1.13 1.22 1.27 1.26 1.31 1.38 1.44 1.50 1.52 1.45 1.50 1.54 1.53 1.63 1.78
FisliERY PRODUcTs 0.40 0.40 0.39 0.38 0.39 0.40 0.42 0.44 0.51 0.54 0.52 0.51 0.49 0.53
FOREST PRODUCTS
Industrial roundwood ° 7 4 7.6 8.0 7.9 7.8 8.1 7.9 3.3 9.1 9.9 10.6 10.9 11.2 11.7 12.2
Sawn softwood ° 0 8 0.6 0.7 0.6 0.7 0.8 0.8 1.1 1.2 1.5 2.0 2.0 2.2 2.3
Sawn hardwood ° 0.2 0.2 0.2 0.3 0.2 0.3 0.3 0.4 0.4 0.4 0.5 0.5 0.6 0.7 0.8
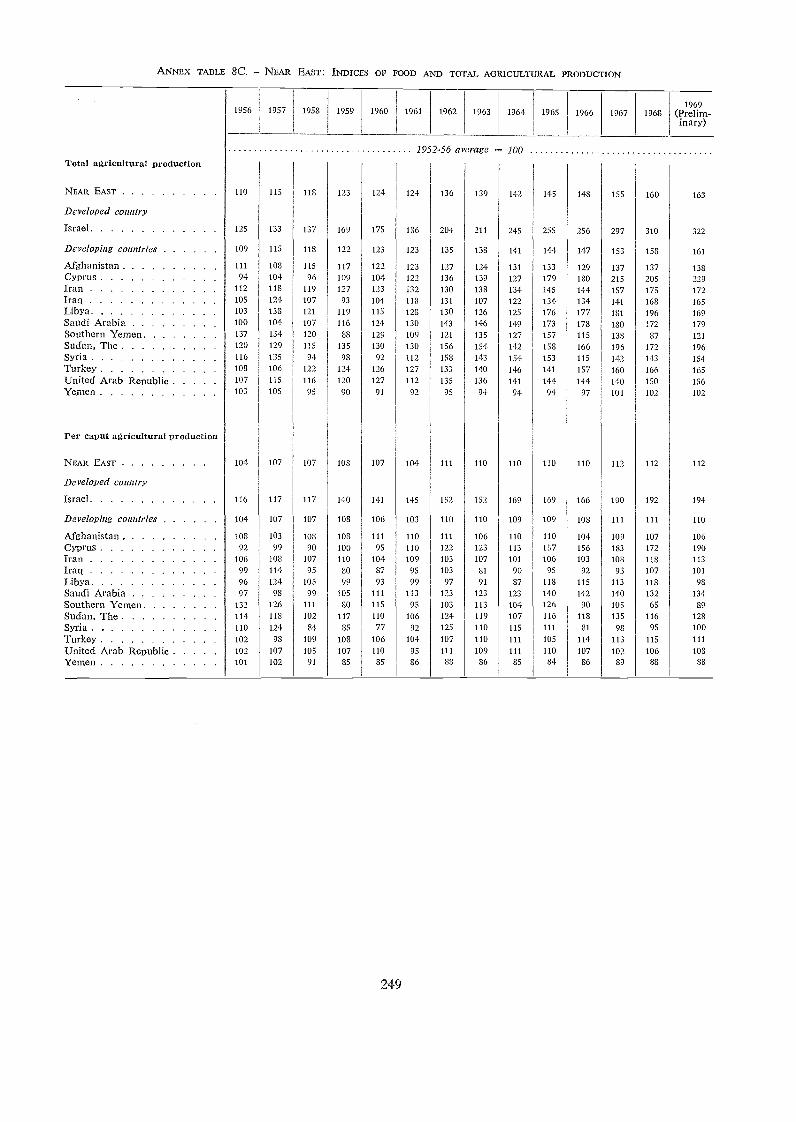
ANNEX TABLE 8C. NEAR EAST: INDICES OF FOOD AND TOTAL AGRICULTURAL PRODUCTION
1956 1957 1958 1959 1960 1961 1962 1963 1964 1965 1966 1967 19681969
(Prelim-inary)
1952-56 average 100Total agricultural production
249
NEAR EAST 110 115 118 123 124 124 136 139 142 145 148 155 160 163
Developed country
Israel 125 133 137 169 175 136 204 211 245 255 256 297 310 322
Developing countries 109 115 118 122 123 123 135 138 141 144 147 153 158 161
Afghanistan 111 108 115 117 122 123 127 124 131 133 129 137 137 138Cyprus 94 104 96 109 104 122 136 139 127 179 180 215 205 229Iran 112 118 119 127 123 132 130 138 134 145 144 157 175 172Iraq 105 124 107 93 104 118 131 107 122 134 134 141 168 165Libya 103 138 121 119 115 123 130 126 125 176 177 181 196 169Saudi Arabia 100 104 107 116 124 130 143 146 149 173 178 180 172 179Southern Yemen 137 134 120 88 129 109 121 135 127 157 115 138 87 121
Sudan, The 120 129 115 135 130 130 156 154 142 158 166 196 172 196Syria 116 135 94 98 92 112 158 143 154 153 115 142 143 154
Turkey 108 106 122 124 126 127 133 140 146 141 157 160 166 165
United Arab Republic 107 115 116 120 127 112 135 136 141 144 144 140 150 156
Yemen 103 105 95 90 91 92 95 94 94 94 97 101 102 102
Per caput agriculturat production
NEAR EAST 104 107 107 108 107 104 Ill 110 110 110 110 112 112 112
Developed country
Israel 116 117 117 140 141 145 152 152 169 169 166 190 192 194
Developing countries 104 107 107 108 106 103 110 110 109 109 108 111 111 110
Afghanistan 108 103 108 108 Ill 110 111 106 110 110 104 109 107 106
Cyprus 92 99 90 100 95 110 122 123 113 157 156 183 172 190
Iran 106 108 107 110 104 109 103 107 101 106 103 108 118 113
Iraq 99 114 95 80 87 95 103 81 90 95 92 93 107 101
Libya 96 124 105 99 93 99 97 91 87 118 115 113 118 98
Saudi Arabia 97 98 99 105 111 113 123 123 123 140 142 140 132 134
Southern Yemen 132 126 111 80 115 95 103 113 104 126 90 105 65 89
Sudan, The 114 118 102 117 110 106 124 119 107 116 118 135 116 128
Syria 110 124 84 85 77 92 125 110 115 111 81 98 95 100
Turkey 102 98 109 108 106 104 107 110 111 105 114 113 115 111
United Arab Republic 102 107 105 107 110 95 111 109 111 110 107 102 106 108
Yemen 101 102 91 85 85 86 88 86 85 84 86 89 88 88
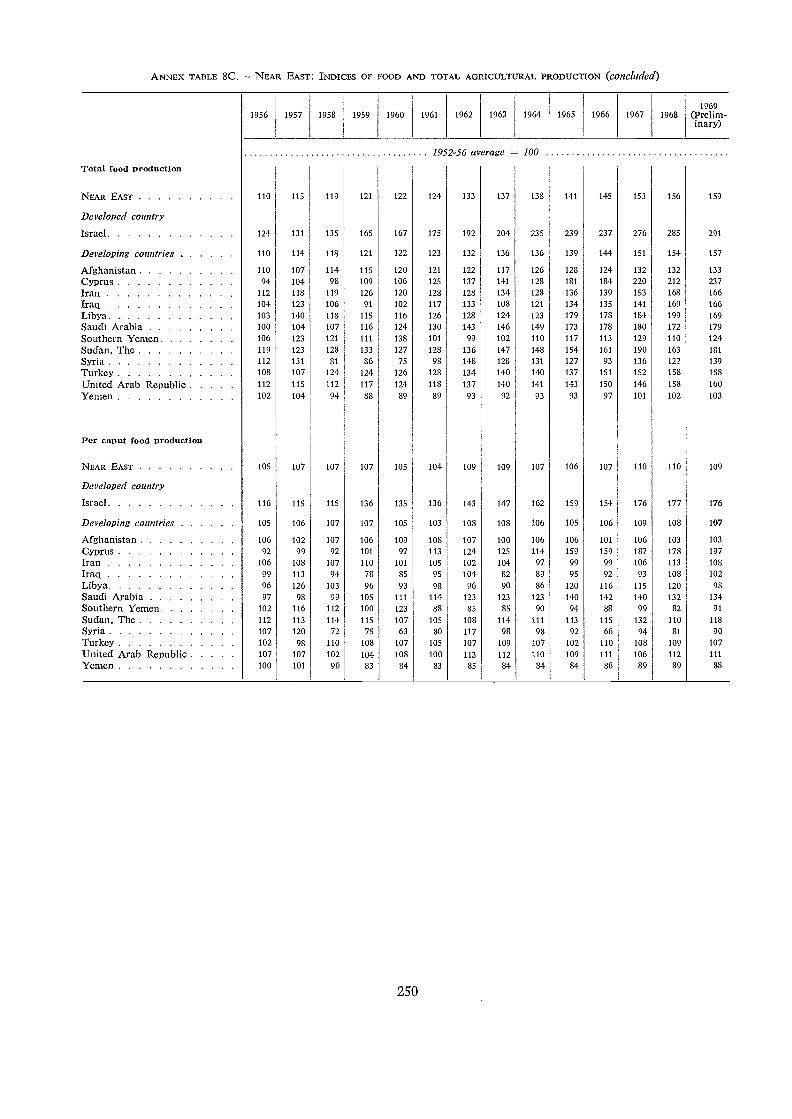
ANNEX TABLE 8C. NEAR EAST: INDICES OF FOOD AND TOTAL AGRICULTURAL PRODUCTION (conchtdear)
250
1956 1957 1958 1959 1960 1961 1962 1963 1964 1965 1966 1967 19681969
(Prelim-inary)
1952-56 average 100
Total food production
NEAR EAST 110 115 119 121 122 124 133 137 138 141 145 153 156 159
Developed country
Israel 124 131 135 165 167 175 192 204 235 239 237 276 285 291
Developing countries 110 114 118 121 122 123 132 136 136 139 144 151 154 157
Afghanistan 110 107 114 115 120 121 122 117 126 128 124 132 132 133
Cyprus 94 104 98 109 106 125 137 141 128 181 184 220 212 237
Iran 112 118 119 126 120 128 128 134 128 136 139 153 168 166
Iraq 104 123 106 91 102 117 133 108 121 134 135 141 169 166
Libya 103 140 118 115 116 126 128 124 123 179 178 184 199 169
Saudi Arabia 100 104 107 116 124 130 143 146 149 173 178 180 172 179
Southern Yemen 106 123 121 111 138 101 99 102 110 117 113 129 110 124
Sudan, The 119 123 128 133 127 128 136 147 148 154 161 190 163 181
Syria 112 131 81 86 75 98 148 128 131 127 93 136 122 139
Turkey 108 107 124 124 126 128 134 140 140 137 151 152 158 158
United Arab Republic 112 115 112 117 124 118 137 140 141 143 150 146 158 160
Yemen 102 104 94 88 89 89 93 92 93 93 97 101 102 103
Per caput food production
NEAR EAST 105 107 107 107 105 104 109 109 107 106 107 110 110 109
Developed country
Israel 116 115 115 136 135 136 143 147 162 159 154 176 177 176
Developing countries 105 106 107 107 105 103 108 108 106 105 106 109 108 107
Afghanistan 106 102 107 106 109 108 107 100 106 106 101 106 103 103
Cyprus 92 99 92 101 97 113 124 125 114 159 159 187 178 197
Iran 106 108 107 110 101 105 102 104 97 99 99 106 113 108
Iraq 99 113 94 78 85 95 104 82 89 95 92 93 108 102
Libya 96 126 103 96 93 98 96 90 86 120 116 115 120 98
Saudi Arabia 97 98 99 105 111 114 123 123 123 140 142 140 132 134
Southern Yemen 102 116 112 100 123 88 85 85 90 94 88 99 82 91
Sudan, The 112 113 114 115 107 105 108 114 111 113 115 132 110 118
Syria 107 120 72 75 63 80 117 98 98 92 66 94 81 90Turkey 102 98 110 108 107 105 107 109 107 102 110 108 109 107
United Arab Republic 107 107 102 104 108 100 113 112 110 109 111 106 112 111
Yemen 100 101 90 83 84 83 85 84 84 84 86 89 89 88
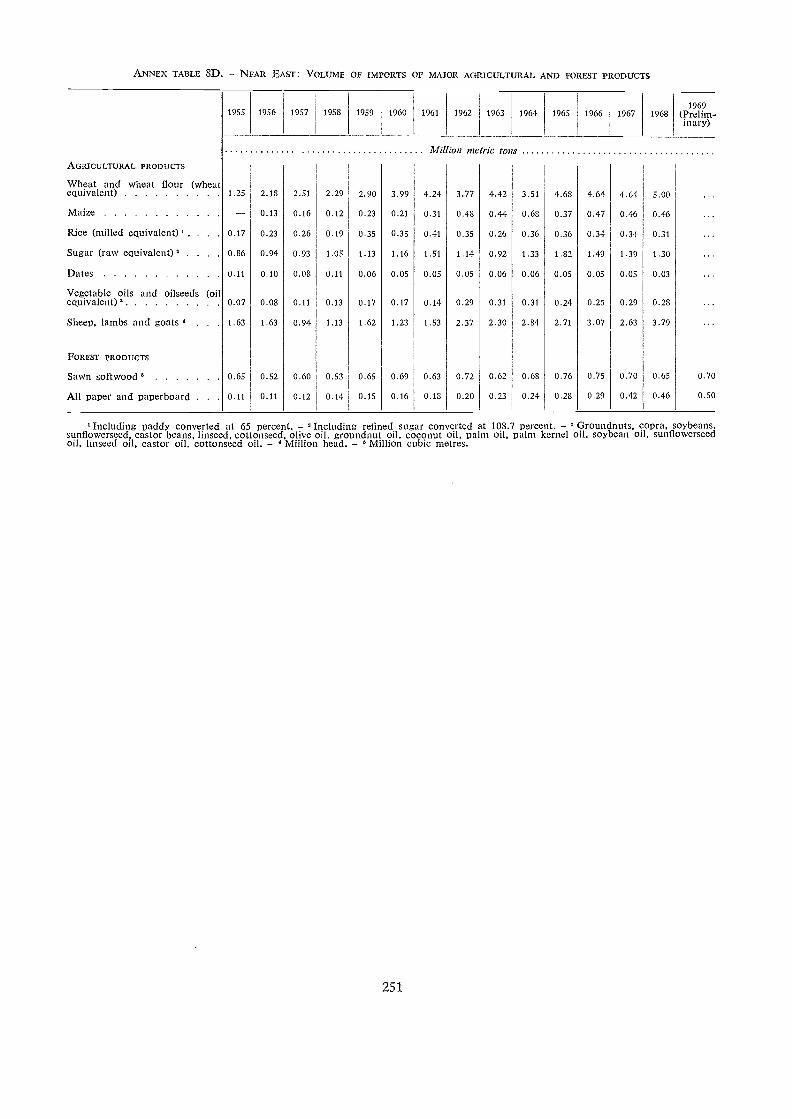
ANNEX TABLE 8D. - NEAR EAST: VOLUME OF IMPORTS OF MAJOR AGRICULTURAL AND FOREST PRODUCTS
251
' Including paddy converted at 65 percent. - 6 Including refined sugar converted at 108.7 perce - Groundnuts, copra, soybeans,sunflowerseed, castor beans, linseed, cottonseed, olive oil, groundnut oil, coconut oil, palm oil, palm kernel oil, soybean oil, sunflowerseedoil, linseed oil, castor oil, cottonseed oil. - Million head. - 6 Million cubic metres.
1955 1956 1957 1958 1959 1960 1961 1962 1963 1964 1965 1966 1967 19681969
(Prelim-inary)
Million metric tonsAGRICULTURAL PRODUCTS
Wheat and wheat flour (wheatequivalent) 1.25 2.18 2.51 2.29 2.90 3.99 4.24 3.77 4.42 3.51 4.68 4.64 4.64 5.00
Maize -- 0.13 0.16 0.12 0.23 0.21 0.31 0.48 0.44 0.68 0.37 0.47 0.46 0.46
Rice (milled equivalent) . . 0.17 0.23 0.26 0.19 0.35 0.35 0.41 0.35 0.26 0.36 0.36 0.34 0.34 0.31
Sugar (raw equivalent) 0.86 0.94 0.93 1.05 1.13 1.16 1.51 1.14 0.92 1.33 1.82 1.49 1.39 1.30
Dates 0.11 0.10 0.08 0.11 0.06 0.05 0.05 0.05 0.06 0.06 0.05 0.05 0.05 0.03
Vegetable oils and oilseeds (oilequivalent) 0 07 0.08 0.11 0.13 0.17 0.17 0.14 0.29 0.31 0.31 0.24 0.25 0.29 0.28
Sheep, lambs and goats 1.63 1.63 0.94 1.13 1.62 1.23 1.53 2.37 2.30 2.84 2.71 3.07 2.63 3.79
FOREST PRODUCTS
Sawn softwood 6 0.65 0.52 0.60 0.53 0.65 0.69 0.63 0.72 0.62 0.68 0.76 0.75 0.70 0.65 0.70
All paper and paperboard . . 0.11 0.11 0.12 0.14 0.15 0.16 0.18 0.20 0.23 0.24 0.28 0.29 0.42 0.46 0.50
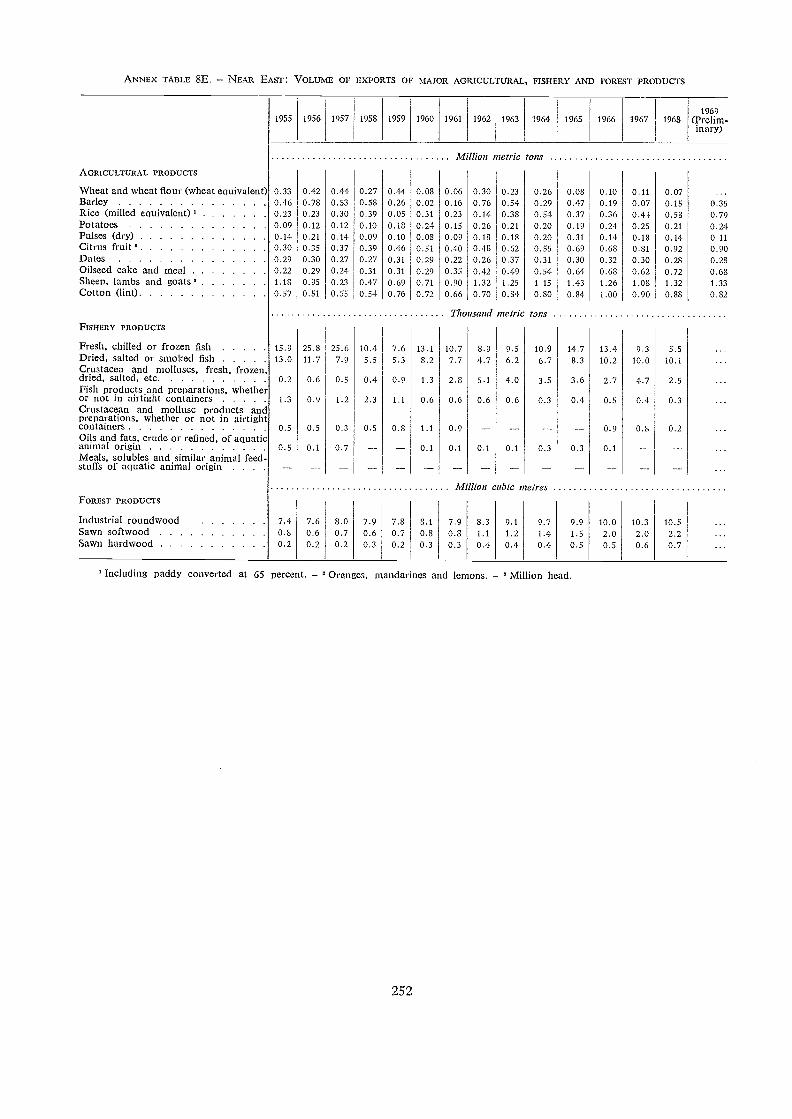
ANNEX TABLE 8E. - NEAR EAST: VOLUME OF EXPORTS OF MAJOR AGRICULTURAL, FISHERY AND FOREST PRODTJCTS
' Including paddy converted at 65 percent. - ' Oranges, mandarines and lemons. - Million head.
252
1955 1956 1957 1958 1959 1960 1961 1962 1963 1964 1965 1966 1967 19681969
(Prelim-inary)
M Ilion metric tonsAGRICULTURAL PRODUCTs
Wheat and wheat flour (wheat equivalent) 0.33 0.42 0.44 0.27 0.44 0.08 0.06 0.30 0.23 0.26 0.08 0.10 0.11 0.07Barley 0.46 0.78 0.53 0.58 0.26 0.02 0.16 0.76 0.54 0.29 0.47 0.19 0.07 0.15 0.35Rice (milled equivalent) 0 23 0.23 0.30 0.39 0.05 0.31 0.23 0.14 0.38 0.54 0.37 0.36 0.41 0.58 0.79Potatoes 0.09 0.12 0.12 0.10 0.18 0.24 0.15 0.26 0.21 0.20 0.19 0.24 0.25 0.21 0.24Pulses (dry) 0 14 0.21 0.14 0.09 0.10 0.08 0.09 0.18 0.18 0.20 0.31 0.14 0.18 0.14 0.11Citrus fruit 0 30 0.35 0.37 0.39 0.46 0.51 0.40 0.48 0.62 0.55 0.69 0.68 0.81 0.92 0.90Dates 0.29 0.30 0.27 0.27 0.31 0.29 0.22 0.26 0.37 0.31 0.30 0.32 0.30 0.28 0.28Oilseed cake and meal 0 22 0.29 0.24 0.31 0.31 0.29 0.35 0.42 0.49 0.54 0.64 0.68 0.62 0.72 0.68Sheep, lambs and goats 1.18 0.95 0.23 0.47 0.69 0.71 0.90 1.32 1.25 1.15 1.43 1.26 1.08 1.32 1.33Cotton (lint) 0.57 0.51 0.55 0.54 0.76 0.72 0.66 0.70 0.84 0.80 0.84 1.00 0.90 0.88 0.82
Tito tsand metric tonsFISHERY PRODUCTS
Fresh, chilled or frozen fish 159 25.8 25.6 10.4 7.6 13.1 10.7 8.9 9.5 10.9 14.7 13.4 9.3 5.5Dried, salted or smoked fish 13 0 11.7 7.9 5.5 5.3 8.2 7.7 4.7 6.2 6.7 8.3 10.2 10.0 10.1Crustacea and molluscs, fresh, frozen,dried, salted, etc . 0 2 0.6 0.5 0.4 0.9 1.3 2.8 5.1 4.0 3.5 3.6 2.7 4.7 2.5Fish products and preparations, whetheror not in airtight containers 13 0.9 1.2 2.3 1.1 0.6 0.6 0.6 0.6 0.3 0.4 0.5 0.4 0.3Crustacean and mollusc products andpreparations, whether or not in airtightcontainers 05 0.5 0.3 0.5 0.8 1.1 0.9 -- 0.9 0.3 0.2Oils and fats, crude or refined, of aquaticanimal origin 05 0.1 0.7 -- -- 0.1 0.1 0.1 0.1 0.3 0.3 0.1Meals, solubles and similar animal feed-stuffs of aquatic animal origin . . . . --
Million cubic ¡nutresFOREST PRoDUCTS
Industrial roundwood 7 4 7.6 8.0 7.9 7.8 8.1 7.9 8.3 9.1 9.7 9.9 10.0 10.3 10.5Sawn softwood 08 0.6 0.7 0.6 0.7 0.8 0.8 1.1 1.2 1.4 1.5 2.0 2.0 2.2Sawn hardwood 02 0.2 0.2 0.3 0.2 0.3 0.3 0.4 0.4 0.4 0.5 0.5 0.6 0.7
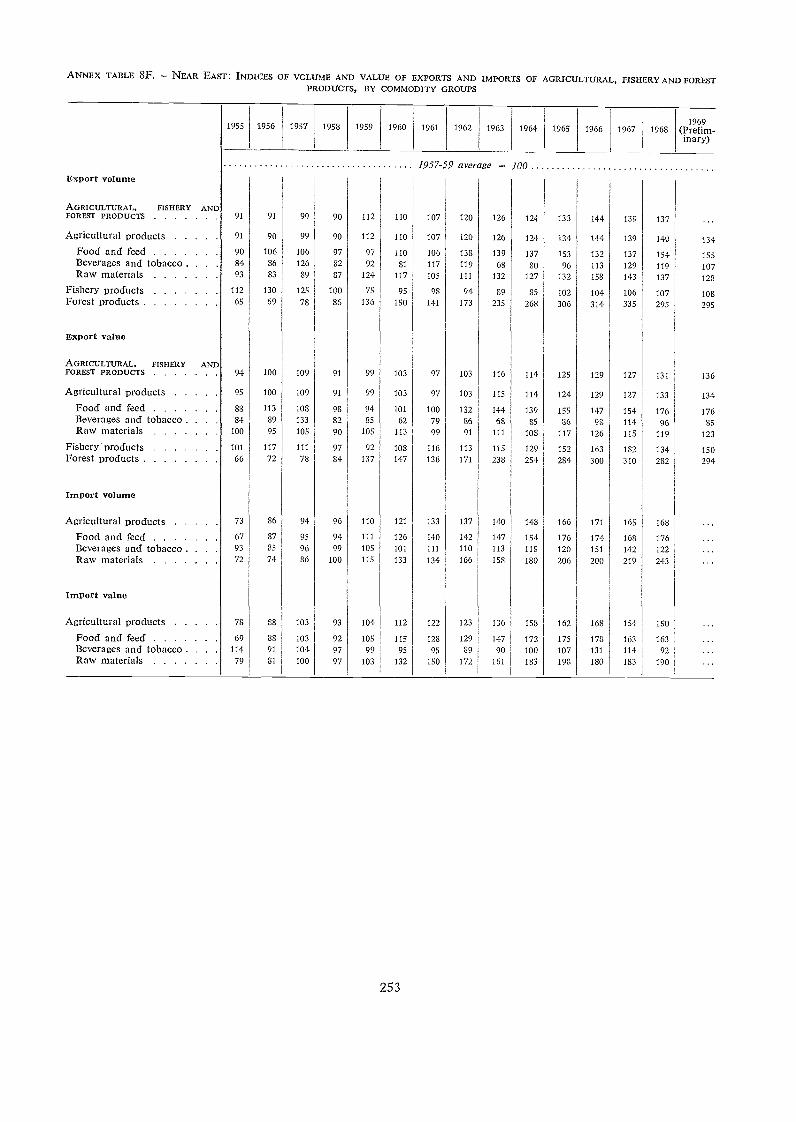
ANNEX TABLE 8F. - NEAR EAST: INDICES OF VCLUME AND VALUE OF EXPORTS AND IMPORTS OF AGRICULTURAL, FISHERY AND FORESTPRODUCTS, BY COMMODITY GROUPS
253
1955 1956 1957 1958 1959 1960 1961 1962 1963 1964 1965 1966 1967 19681969
(Prelim-inary)
1957-59 average - 100E:N:port volume
AGRICULTURAL, FISHERY ANDFOREST PRODUCTS 91 91 99 90 112 110 107 120 126 124 133 144 139 137
Agricultural products 91 90 99 90 112 110 107 120 126 124 134 144 139 140 134
Food and feed 90 106 106 97 97 110 106 138 139 137 153 132 137 154 155Beverages and tobacco . . 84 86 126 82 92 81 117 119 68 80 96 113 129 119 107Raw materials 93 83 89 87 124 117 105 111 132 127 132 158 143 137 128
Fishery products 112 130 125 100 75 95 98 94 89 85 102 104 106 107 108Forest products 65 69 78 86 136 150 141 173 235 268 306 314 335 295 295
Export value
AGRICULTURAL, FISHERY ANDFOREST PRODUCTS 94 100 109 91 99 103 97 103 116 114 125 129 127 131 136
Agricultural products 95 100 109 91 99 103 97 103 115 114 124 129 127 133 134
Food and feed 88 113 108 98 94 101 100 132 144 139 155 147 154 176 176Beverages and tobacco . 84 89 133 82 35 62 79 86 63 85 86 98 114 96 SSRaw materials 100 95 105 90 105 113 99 91 Ill 108 117 126 115 119 123
Fishery-products 101 117 111 97 92 108 116 113 115 129 152 163 182 134 150Forest products 66 72 78 84 137 147 136 171 238 254 284 300 310 282 294
Import volume
Agricultural products 73 86 94 96 110 121 133 137 140 148 166 171 165 168
Food and feed 67 87 95 94 111 126 140 142 147 151 176 174 168 176
Beverages and tobacco . . . 93 35 96 99 105 101 111 110 113 118 120 151 142 122
Raw inaterials 72 74 86 100 115 133 134 166 158 180 206 200 219 243
Import value
Agricultural products 73 38 103 93 104 112 122 123 136 158 162 168 154 150
Food and feed 69 88 103 92 105 115 128 129 147 172 175 178 163 163Beverages and tobacco . . . 114 91 104 97 99 95 95 89 90 100 107 131 114 92Raw materials 79 81 100 97 103 132 150 172 161 183 198 180 183 190
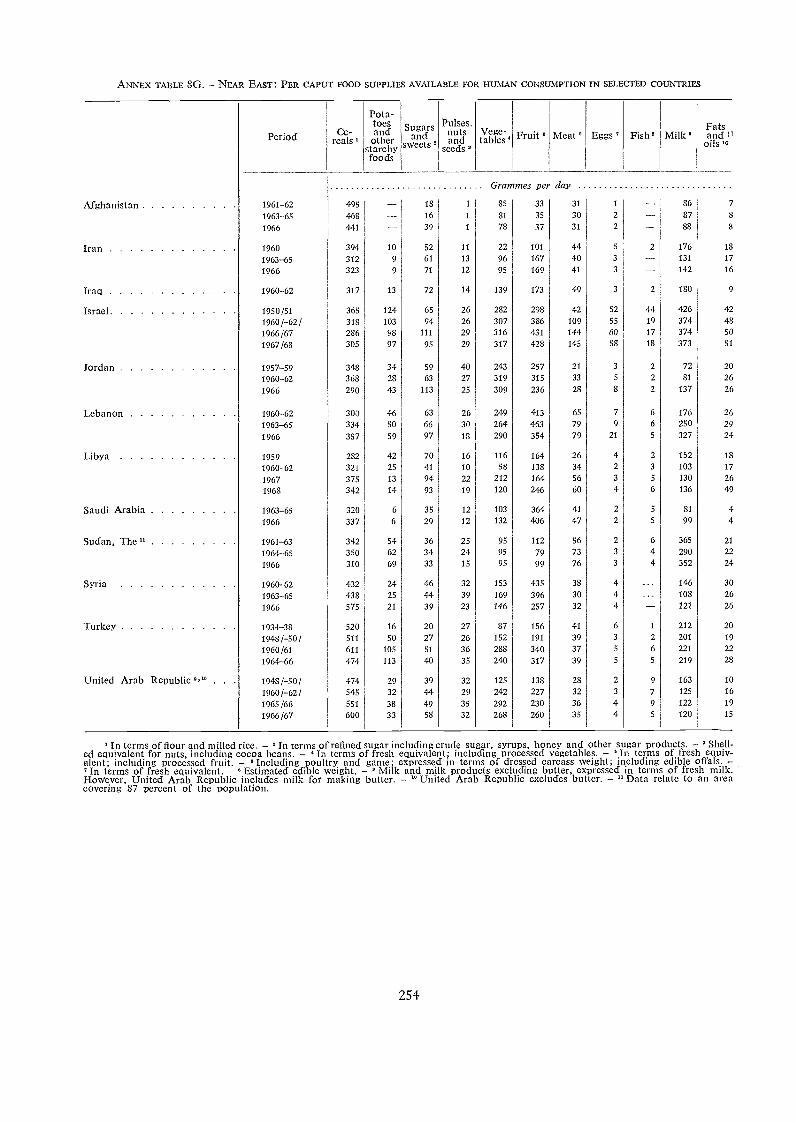
ANNEX TABLE 8G. - NEAR EAST: PER CAPUT FOOD SLTPPLIES AVAILABLE FOR HUMAN CONSUMPTION IN SELECTED COUNTRIES
Pulses,nutsand
seeds 3
Vege-tables Fruit Meat Eggs ' Fish' Milk °
Fatsand 11
oils 30
254
Gran Ines per day
Afghanistan 1961-62 495 18 1 I 85 33 31 1 86 7
1963-65 488 16 1 81 35 30 2 87 8
1966 441 39 1 78 37 31 2 88 8
Iran 1960 394 10 52 11 22 101 44 5 2 176 18
1963-65 312 9 61 13 96 167 40 3 131 17
1966 323 9 71 12 95 169 41 3 142 16
Iraq 1960-62 317 13 72 14 139 173 49 3 2 180 9
Israel 1950/51 365 124 65 26 282 298 42 52 44 426 42
1960/-62/ 318 103 94 26 307 386 109 55 19 374 48
1966/67 286 98 111 29 316 431 144 60 17 374 50
1967/68 305 97 95 29 317 428 145 58 18 373 51
Jordan 1957-59 348 34 59 40 243 257 21 3 2 72 20
1960-62 368 28 63 27 319 315 33 5 2 81 26
1966 290 43 113 25 309 236 28 8 2 137 26
Lebanon 1960-62 300 46 63 26 249 413 65 7 6 176 26
1963-65 334 50 66 30 264 463 79 9 6 250 29
1966 357 59 97 18 290 354 79 21 5 327 24
Libya 1959 282 42 70 16 116 164 26 4 2 152 18
1960-62 321 25 41 10 58 138 34 2 3 103 17
1967 375 13 94 22 212 164 56 3 5 130 26
1968 342 14 93 19 120 246 60 4 6 136 49
Saudi Arabia 1963-65 320 6 35 12 103 364 41 2 5 81 41966 337 6 29 12 132 406 47 2 5 99 4
Sudan, The " 1961-63 342 54 36 25 95 112 56 2 6 365 21
1964-65 350 62 34 24 95 79 73 3 4 290 22
1966 310 69 33 15 95 99 76 3 4 352 24
Syria 1960-62 432 24 46 32 153 435 33 4 146 30
1963-65 438 25 44 39 169 396 30 4 108 26
1966 575 21 39 23 146 257 32 4 121 26
Turkey 1934-38 520 16 20 27 87 156 41 6 1 212 20
1948/-50/ 511 50 27 26 152 191 39 3 2 201 19
1960/61 611 105 51 36 288 340 37 5 6 221 22
1964-66 474 113 40 35 240 317 39 5 5 219 28
United Arab Republic °,1° . . 1948/-50/ 474 29 39 32 125 138 28 2 9 163 10
1960/-62/ 545 32 44 29 242 227 32 3 7 125 16
1965/66 551 38 49 35 292 230 36 4 9 122 19
1966/67 600 33 58 32 268 260 35 4 5 120 15
'In terms of flour and milled rice. - 'In terms of refined sugar including crude sugar, syrups, honey and other sugar products. - Shell-ed equivalent for nuts, including cocoa beans. - In terms of fresh equivalent; including processed vegetables. - In terms of fresh equiv-alent; including processed fruit. - 'Including poultry and game; expressed in terms of dressed carcass weight; including edible (ATMs. -
In terms of fresh equivalent. - Estimated edible weight. - ° Milk and milk products excluding butter, expressed in terms of fresh milk.However, United Arab Republic includes milk for making butter. - United Arab Republic excludes butter. - ' Data relate to an areacovering 87 percent of the population.
Period Ce-reals 3
Pota-toesandother
starchyfoods
Sugarsand
sweets 3
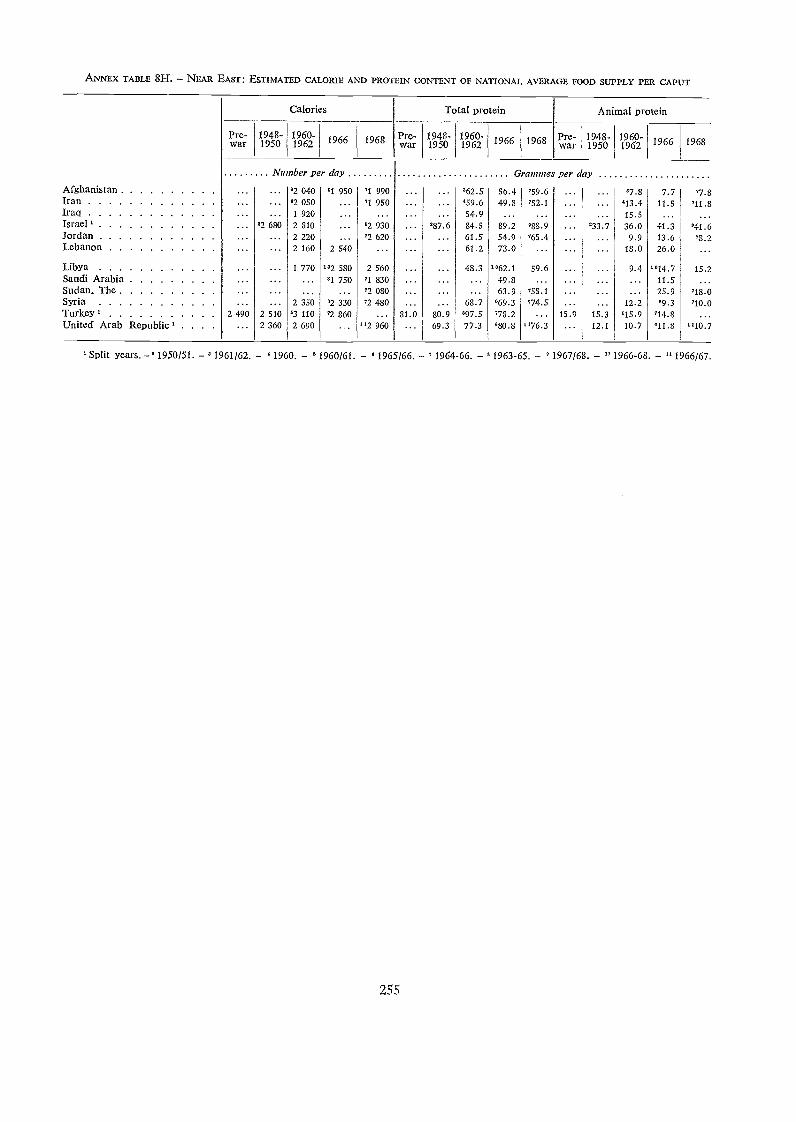
ANNEX TABLE 8H. - NEAR EAST: ESTIMATED CALORIE AND PROTEIN CONTENT OF NATIONAL AVERAGE FOOD SUPPLY PER CAPUT
AfghanistanIranIraqIsraelJordanLebanon
LibyaSaudi ArabiaSudan, TheSyriaTurkeyUnited Arab Republic'
Pre-war
Number per day
2 490
1948-1950
'2 680
2 5102 360
Calories
1960-1962
'2 040'2 0501 9202 8102 2202 160
1 770
2 350'3 1102 690
'1 950
2 540
"2 580'1 750
"2 33072 860
71 99071 950
°2 93072 620
2 56071 83072 08072 480
"2 960
255
Pre-war
81.0
1948-1950
'87.6
80.969.3
Total protein
1960-1962
'62.5'59.654.984.561.561.2
48.3
*68.7
"97.577.3
56.449.8
89.254.973.0
7062.149.863.9
°69.3778.2'80.8
Pre-war
Grammes per day
759.6752.1
'88.9765.4
59.6
758.1
774.5
"76.3
Animal protein
1948-1950
1960-1962
'7.8'13.415.536.09.9
18.0
9.4
12.2'15.910.7
7.711.5
41.313.626.0
"14.711.525.989.3
714.8"11.8
15.2
718.0710.0
..7710.7
Split years. - 1950/51. - ' 1961/62. - 1960. - "1960/61. - 1965/66. - 71964-66. - 1963-65. - '1967/68. - " 1966-68. - "1966/67.
'33.7"
15.9 15.312.1
1966 1968 1966 1968 1966 1968
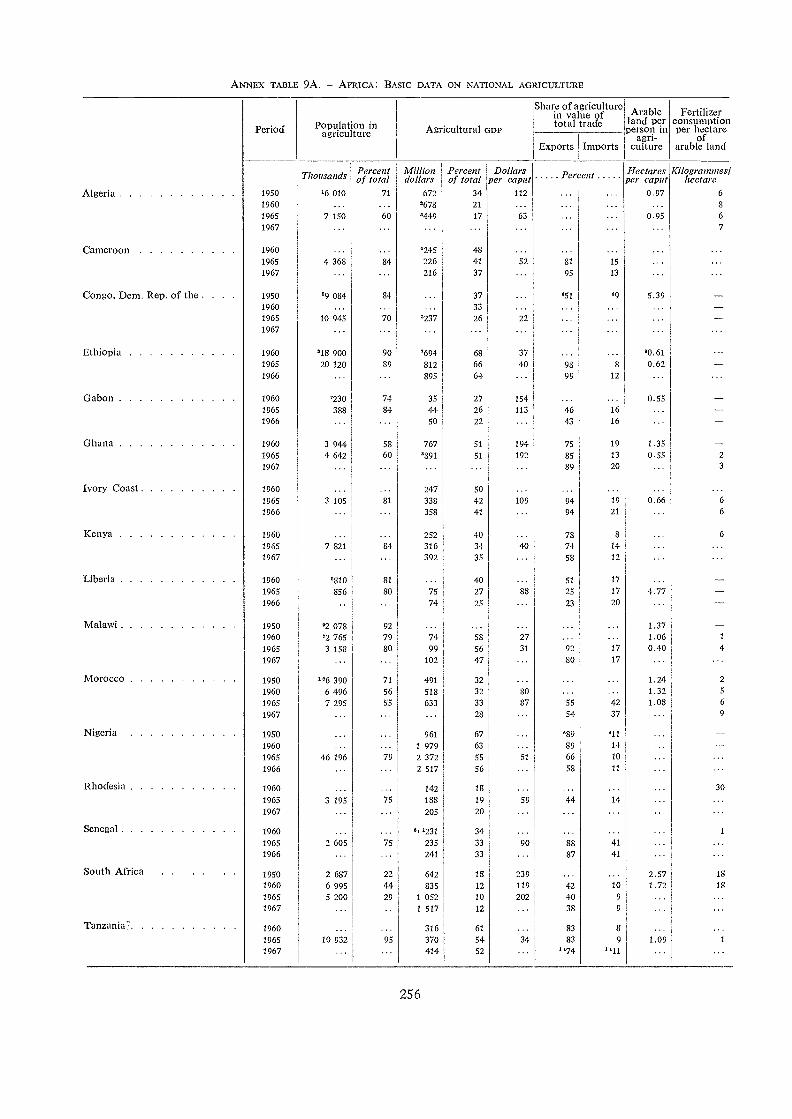
Algeria
Cameroon
Congo, Dem. Rep, of the . . . .
Ethiopia
Gabon
Ghana
Ivory Coast
Kenya
Liberia
Malawi
Morocco
Nigeria
Rhodesia
Senegal
South Africa
Tanzania-
ANNEX TABLE 9A. AFRICA: BASIC DATA ON NATIONAL AGRICULTURE
Period
195019601965
1967
196019651967
1950196019651967
19601965
1966
1960
19651966
19601965
1967
19601965
1966
196019651967
196019651966
1950196019651967
1950196019651967
1950196019651966
196019651967
196019651966
1950
19601965
1967
196019651967
Population inagriculture
Thousands
'6 010
7 150
4 368
'9 084
10 945
'18 90020 120
'230388
3 9444 642
3 105
7 821
'810856
"2 078'2 7653 158
"6 3906 4967 295
46 196
3 195
.
2 605
2 6876 9955 200
10 932
Percentof total
71
60
84
84
70
9089
7484
5860
84
81
80
92
79SO
715655
79
75
75
224429
95
Milliondollars
672'678'449
256
Agricultural GDP
'245226216
'237
'694812895
35
4450
767'891
247338358
252316392
7574
7499
102
491
518633
961
1 9792 3722 517
142188
205
'231235241
642835
1 0521 517
316370414
Percentof total
3421
17
4841
37
3733
26
686664
272622
51
51
SO
4241
403435
402725
58
5647
32
32
33
28
6763
55
56
18
19
20
34
33
33
18
12
10
12
61
5452
Dollarsper caput
112
63
52
22
154113
194192
109
40
83
2731
8087
51
59
90
239119
202
34
Share of agriculturein va ue oftotal trade
Exports
Percent
81
95
'51
3740 98
99
4643
7585
89
9494
787458
51
25
23
92
80
55
54
'8989
6658
8887
424038
8383
',74
Imports
15
13
69
8
12
16
16
19
13
20
19
21
8
14
12
17
17
20
17
17
4237
14
41
41
109
9
8
9
Arable Fertilizerland per consumptionperson in per hectare
agri- ofculture arable land
Hectares Kilogrammes'per caput hectare
0.97 6
8
0.95 6
7
5.39
'0.610.62
0.55
1.350.55
0.66
4.77
1.371.060.40
1.241.321.08
2.571.72
1.09
2
3
66
6
4
2
5
6
9
30
18
18
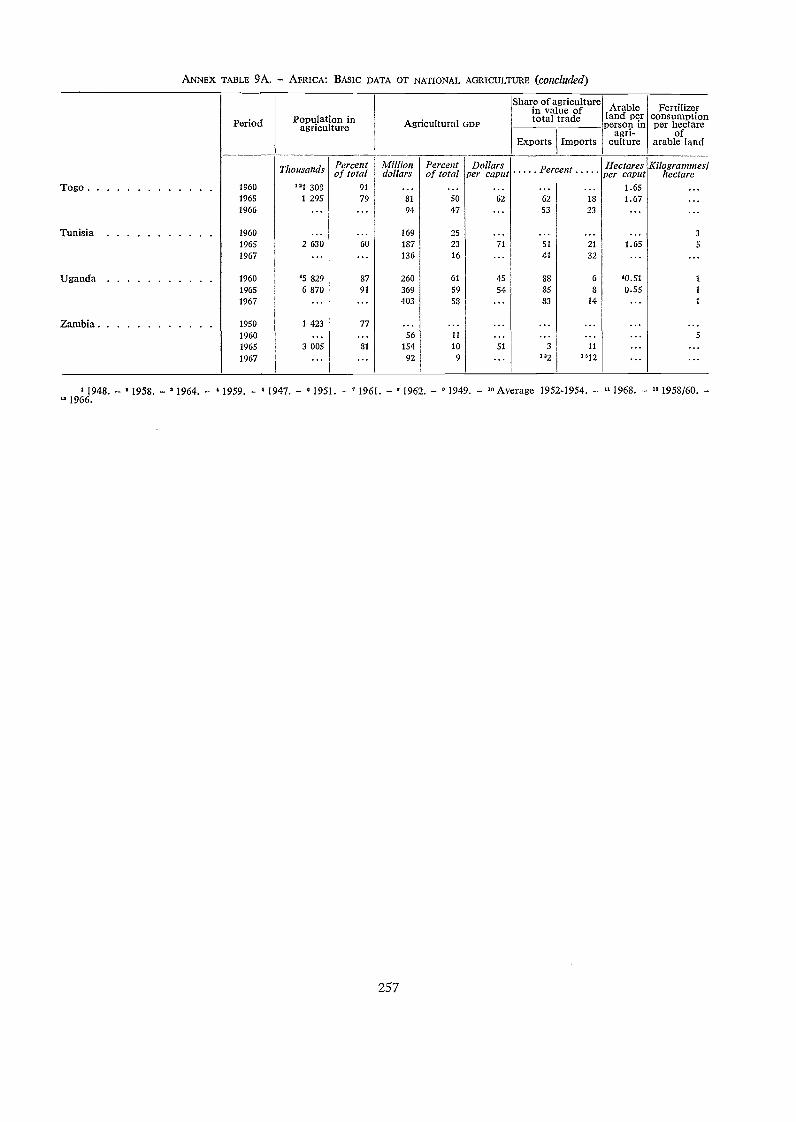
ANNEX TABLE 9A. AFRICA: BASIC DATA OT NATIONAL AGRICULTURE (concluded)
' 1948. ' 1958. '19154. ' 1959. ° 1947. ' 1951. '1961. ° 1962. '1949. 7° Average 1952-1954.-- "1968. "1958/60." 1966.
257
Period Population inagriculture Agricultural GDP
Share of agriculturein va ue oftotal trade
Arableland perperson in
agri-culture
Fertilizerconsumptionper hectare
ofarable landExports Imports
Togo 1960
Thousands
"1 303
Percentof total
91
Milliondollars
...
Percentof total. Dollars
per caput Per. et n
...
HectaresPer caput
1.65
Kilogrammes,hectare
...1965 1 295 79 81 50 62 62 18 1.67 ...1966 ... ... 94 47 .. 53 23 ... ...
Tunisia 1960 ... ... 169 25 ... ... ... ... 3
1965 2 630 60 187 23 71 51 21 1.65 5
1967 ... ... 136 16 ... 41 32 ... ...
Uganda 1960 '5 829 87 260 61 45 83 6 '0.51 1
1965 6 870 91 369 59 54 85 8 0.55 1
1967 ... 403 53 83 14 1
Zambia 1950 1 423 771960 ... ... 56 11 ... ... ... 5
1965 3 005 81 154 10 51 3 11 ... ...1967 ... 92 9 ... "2 ,*12 ...
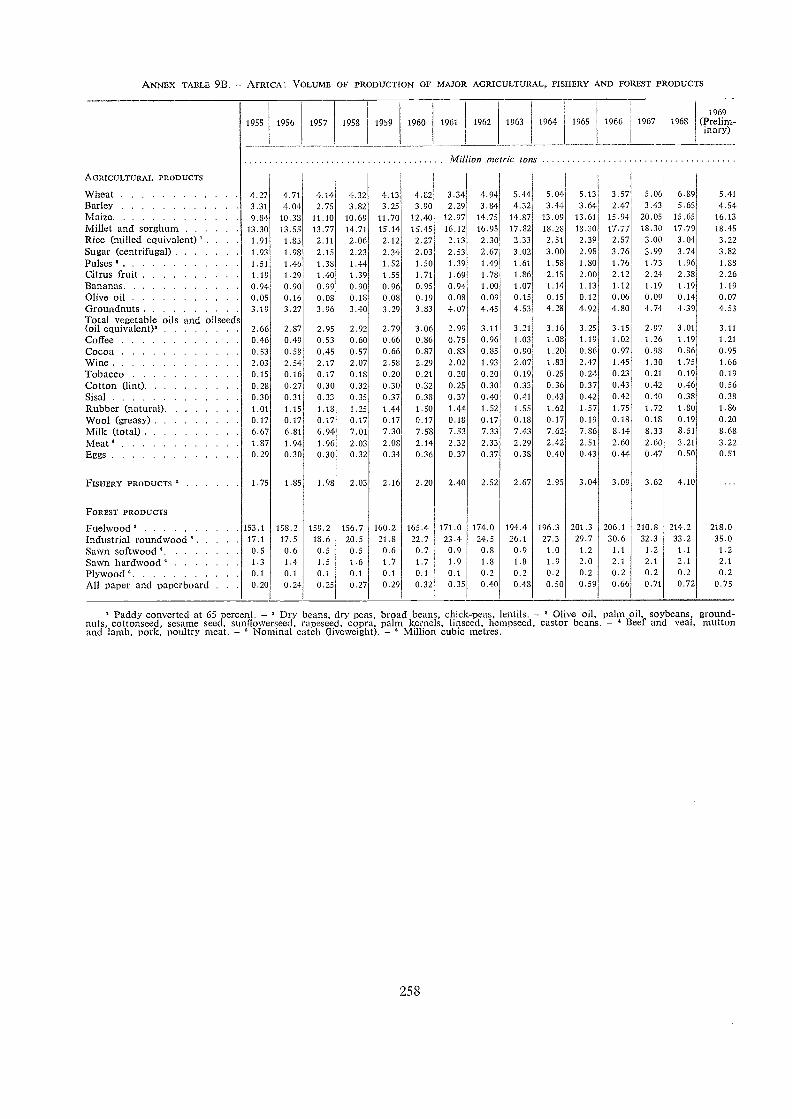
ANNEX TABLE 9B. - AFRICA: VOLUME OF PRODUCTION OF MAJOR AGRICULTURAL, FISHERY AND FOREST PRODUCTS
Paddy converted at 65 percent. - Dry beans, dry peas, broad beans, chick-peas, entils. - 0I've oil, palm oil, soybeans, ground-nuts, cottonseed, sesame seed, sunflowerseed, rapeseed, copra, palm kernels, linseed, hempseed, castor beans. - ' Beef and veal, muttonand lamb, pork, poultry meat. - Nominal catch (liveweight). - Million cubic metres
258
1955 1956 1957 1958 1959 1960 1961 1962 1963 1964 1965 1966 1967 19681969
(Prelim-inary)
Mil ion metric tons
AGRICuLTuRAL PRoDucTs
Wheat 427 4.71 4.14 4.32 4.13 4.82 3.34 4.94 5.44 5.04 5.13 3.57 5.06 6.89 5.41Barley 3 31 4.04 2.75 3.82 3.25 3.90 2.29 3.84 4.32 3.44 3.64 2.47 3.43 5.65 4.54Maize 9 84 10.38 11.10 10.69 11.70 12.40 12.97 14.75 14.87 13.09 13.61 15.94 20.05 15.65 16.13
Millet and sorghLun 13 30 13.55 13.77 14.71 15.14 15.45 16.12 16.95 17.82 18.28 18.30 17.77 18.30 17.79 18.45Rice (milled equivalent) . 1.91 1.83 2.11 2.06 2.12 2.27 2.13 2.30 2.33 2.51 2.39 2.57 3.00 3.04 3.22Sugar (centrifugal) 1 93 1.98 2.15 2.23 2.34 2.03 2.53 2.67 3.02 3.00 2.98 3.76 3.99 3.74 3.82Pulses 1 51 1.46 1.38 1.44 1.52 1.50 1.39 1.49 1.61 1.58 1.80 1.76 1.73 1.96 1.88Citrus fruit 1 19 1.29 1.40 1.39 1.55 1.71 1.69 1.78 1.86 2.15 2.00 2.12 2.24 2.38 2.26Bananqs 0 94 0.90 0.99 0.90 0.96 0.95 0.94 1.00 1.07 1.14 1.13 1.12 1.19 1.19 1.19Olive oil 0 05 0.16 0.08 0.18 0.08 0.19 0.08 0.09 0.15 0.15 0.12 0.06 0.09 0.14 0.07Groundnuts 3 19 3.27 3.96 3.40 3.29 3.53 4.07 4.45 4.53 4.28 4.92 4.80 4.74 4.39 4.53Total vegetable oils and oilseeds(oil equivalent). 2 66 2.87 2.95 2.92 2.79 3.06 2.99 3.11 3.21 3.16 3.25 3.15 2.97 3.01 3.11Coffee 0 46 0.49 0.53 0.60 0.66 0.86 0.75 0.96 1.03 1.08 1.19 1.02 1.26 1.19 1.21Cocoa 0 53 0.58 0.45 0.57 0.66 0.87 0.83 0.85 0.90 1.20 0.86 0.97 0.98 0.86 0.95\Vine 2 03 2.54 2.17 2.07 2.58 2.29 2.02 1.93 2.07 1.83 2.47 1.45 1.30 1.75 1.66Tobacco 0 15 0.16 0.17 0.18 0.20 0.21 0.20 0.20 0.19 0.25 0.24 0.23 0.21 0.19 0.19Cotton (lint) 0 28 0.27 0.30 0.32 0.30 0.32 0.25 0.30 0.33 0.36 0.37 0.43 0.42 0.46 0.56Sisal 0 30 0.31 0.33 0.35 0.37 0.38 0.37 0.40 0.41 0.43 0.42 0.42 0.40 0.38 0.38Rubber (natural) . 1 01 1.15 1.18 1.25 1.44 1.50 1.44 1.52 1.55 1.62 1.57 1.75 1.72 1.80 1.86Wool (greasY) 0 17 0.17 0.17 0.17 0.17 0.17 0.18 0.17 0.18 0.17 0.19 0.18 0.18 0.19 0.20Milk (total) 6 67 6.81 6.94 7.01 7.30 7.58 7.53 7.33 7.43 7.62 7.96 8.14 8.33 8.51 8.68Meat' 1 87 1.94 1.96 2.03 2.08 2.14 2.32 2.33 2.29 2.42 2.51 2.60 2.60 3.21 3.22/Eggs 0 29 0.30 0.30 0.32 0.34 0.36 0.37 0.37 0.38 0.40 0.43 0.44 0.47 0.50 0.51
FISHERY PRODUCTS 1 75 1.85 1.98 2.03 2.16 2.20 2.40 2.52 2.67 2.95 3.04 3.09 3.62 4.10
FOREST PRODUCTS
Fuelviood' 153 1 158.2 159.2 156.7 160.2 165.4 171.0 174.0 194.4 196.3 201.3 206.1 210.8 214.2 218.0
Industrial roundwood 17 1 17.5 18.6 20.5 21.8 22.7 23.4 24.5 26.1 27.3 29.7 30.6 32.3 33.2 35.0Sawn softwood' 0 5 0.6 0.5 0.5 0.6 0.7 0.9 0.8 0.9 1.0 1.2 1.1 1.2 1.1 1.2Sawn hardwood ' 1 3 1.4 1.5 1.6 1.7 1.7 1.9 1.8 1.8 1.9 2.0 2.1 2.1 2.1 2.1
Plywood° 0 1 0.1 0.1 0.1 0.1 0.1 0.1 0.2 0.2 0.2 0.2 0.2 0.2 0.2 0.2Adl paper and paperboard . . 0.20 0.24 0.25 0.27 0.29 0.32 0.35 0.40 0.48 0.50 0.59 0.66 0.71 0.72 0.75
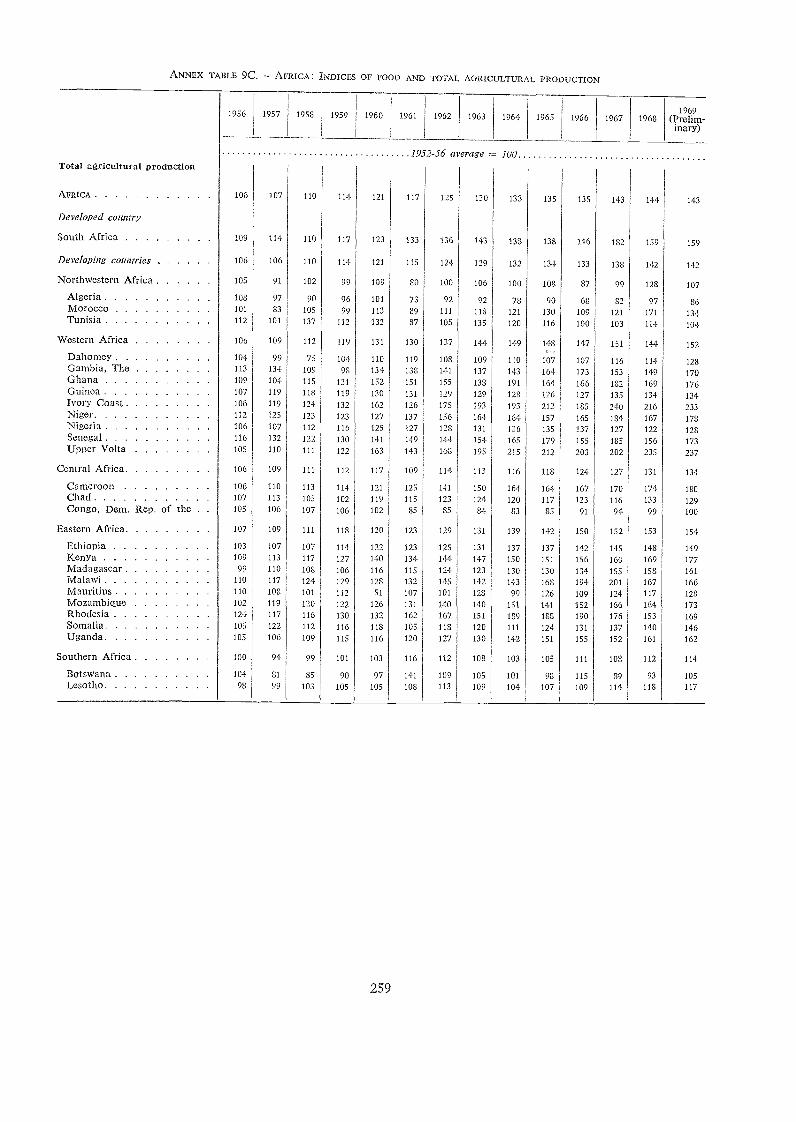
ANNEX TABLE 9C. AFRICA: INDICES OF FOOD AND TOTAL AGRICULTURAL, PRODUCTION
956 1957 1958 1959 1960
259
1961 1962 1963 1964 1965 1966 1967 19681969
(Prelim-inary)
Total agricultural production1952-56 average 100
AFRICA 106 107 110 114 111 117 125 130 133 135 135 143 144 143
Developed country
South Africa 109 114 110 117 123 133 136 143 138 138 146 182 159 159
Developing countries 106 106 110 114 121 115 124 129 132 134 133 138 142 142
Northwestern Africa 105 91 102 99 109 SO 100 106 100 108 87 99 128 107
Ajgeria 108 97 90 96 101 73 92 92 78 90 68 82 97 86Morocco 101 83 105 99 113 89 111 113 121 130 109 121 171 134Tunisia 112 101 137 112 132 87 105 135 120 116 100 103 114 104
Western Africa 106 109 112 119 131 130 137 114 149 148 147 151 144 152
pahorneY 104 99 73 104 110 119 108 109 110 107 107 116 114 128Gambia. The 113 134 109 98 134 138 141 137 143 164 173 153 149 170Ghana 109 104 115 131 152 151 155 138 191 164 166 132 169 176Guinea 107 119 118 119 130 131 129 129 128 126 127 135 134 134Ivory Gaast 106 119 124 132 162 126 175 193 193 212 185 240 216 233Niger. . 112 125 123 123 127 137 156 164 164 157 165 184 167 178Tiigeril 106 107 112 116 125 127 128 131 136 135 137 127 122 128Senegal 116 132 122 130 141 149 114 151 165 179 155 185 156 173Upper Volta 105 110 111 122 163 143 168 195 215 212 203 202 235 237
Central Africa 106 109 111 112 117 109 114 113 116 118 124 127 131 134
Cameroon 106 110 113 114 121 125 141 150 164 164 167 170 174 180Chad 107 113 105 102 119 115 123 124 120 117 123 116 133 129Congo, Dem. Rep, of the 105 106 107 106 102 85 85 84 83 85 91 94 99 100
Eastern Africa 107 109 111 118 120 123 129 131 139 142 150 152 153 154
Ethiopia 103 107 107 114 122 123 125 131 137 137 142 145 148 149Kenya 109 113 117 127 140 134 144 147 150 151 156 160 169 177Madagascar 99 110 108 106 116 115 124 123 130 130 134 155 158 161Malawi 110 117 124 129 12S 132 145 142 143 168 194 201 167 166Mauritius 110 108 101 112 51 107 101 128 99 126 109 124 117 128Mozambique 102 119 120 122 126 131 140 140 151 141 152 166 164 173Rhodesia 124 117 116 130 132 162 167 151 189 188 190 176 153 169Somalia 105 122 112 116 118 105 118 120 111 124 131 137 140 146Uganda. 105 106 109 115 116 120 127 130 142 151 155 152 161 162
Southern Africa j 100 94 99 101 103 116 112 108 103 105 111 108 112 114
Botswana 104 $I 85 90 97 141 109 105 101 98 115 89 93 105Lesotho 98 99 103 105 105 108 113 109 104 107 109 114 118 117
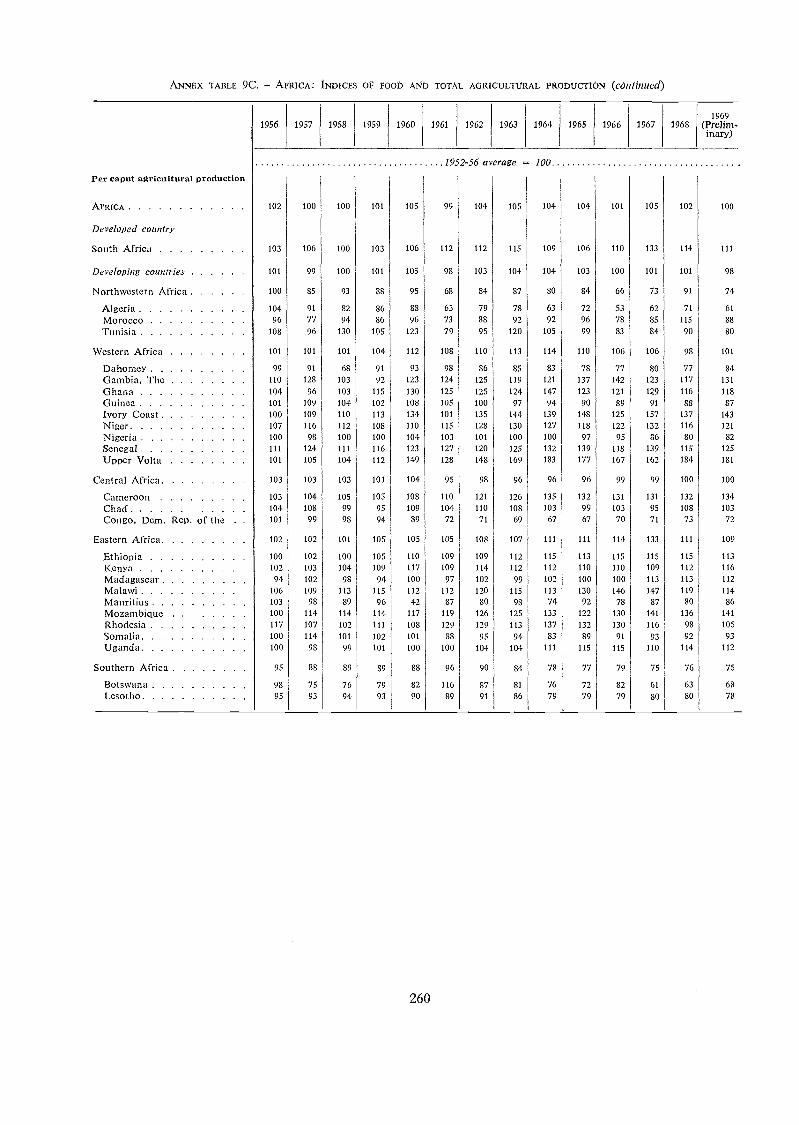
ANNEX -EMILE 9C. AFRicA: INDICES OP FOOD AND TOTAL AGRICULTURAL PkODUCTION (continued)
260
1956 1957 1958 1959 1960 1961 1962 1963 1964 1965 1966 1967 19681969
(Prelim-inary)
1952-56 average = 100
Per caput agricultural production
AFRICA 102 100 100 101 105 99 104 105 104 104 101 105 102 100
Developed country
South Africa 103 106 100 103 106 112 112 115 109 106 110 133 114
Developing countries 101 99 100 101 105 98 103 104 104 103 100 101 101 98
Northwestern Africa 100 85 93 88 95 68 84 87 80 84 66 73 91 74
Algeria 104 91 82 86 88 63 79 78 63 72 53 62 71 61
Morocco 96 77 94 86 96 73 88 92 92 96 78 85 115 88
Tunisia 108 96 130 105 123 79 95 120 105 99 83 84 90 80
Western Africa 101 101 101 104 112 108 110 113 114 110 106 106 98 101
DahOmCy 99 91 68 91 93 98 86 85 83 78 77 80 77 84
Gambia, The 110 128 103 92 123 124 125 119 121 137 142 123 117 131
Ghana 104 96 103 115 130 125 125 124 147 123 121 129 116 118
Guinea 101 109 104 102 108 105 100 97 94 90 89 91 88 87
Ivory Coast 100 109 110 113 134 101 135 144 139 148 125 157 137 143
Niger 107 116 112 108 110 115 128 130 127 118 122 132 116 121
Nigeria 100 98 100 100 104 103 101 100 100 97 95 86 80 82
Senegal 111 124 111 116 123 127 120 125 132 139 118 139 115 125
Upper Volta 101 105 104 112 149 128 148 169 183 177 167 162 184 181
Central Africa 103 103 103 101 104 95 98 96 96 96 99 99 100 100
Cameroon 103 104 105 105 108 110 121 126 135 132 131 131 132 134
Chad 104 108 99 95 109 104 110 108 103 99 103 95 108 103
Congo, Dem. ReP, of the 101 99 98 94 89 72 71 69 67 67 70 71 73 72
Eastern Africa 102 102 101 105 105 105 108 107 111 111 114 133 111 109
Ethiopia 100 102 100 105 110 109 109 112 115 113 115 115 115 113
Kenya 102 103 104 109 117 109 114 112 112 110 110 109 112 116
Madagascar 94 102 98 94 100 97 102 99 102 100 100 113 113 112
Malawi 106 109 113 115 112 112 120 115 113 130 146 147 119 114
Mauritius 103 98 89 96 42 87 80 98 74 92 78 87 80 86
Mozambique 100 114 114 114 117 119 126 125 133 122 130 141 136 141
Rhodesia 117 107 102 111 108 129 129 113 137 132 130 116 98 105
Somalia 100 114 101 102 101 88 95 94 83 89 91 93 92 93
Uganda 100 98 99 101 100 100 104 104 111 115 115 110 114 112
Southern Africa 95 88 89 89 88 96 90 84 78 77 79 75 76 75
BotsWana 98 75 76 79 82 116 87 81 76 72 82 61 63
Lesotho 95 93 94 93 90 89 91 86 79 79 79 80 80 78
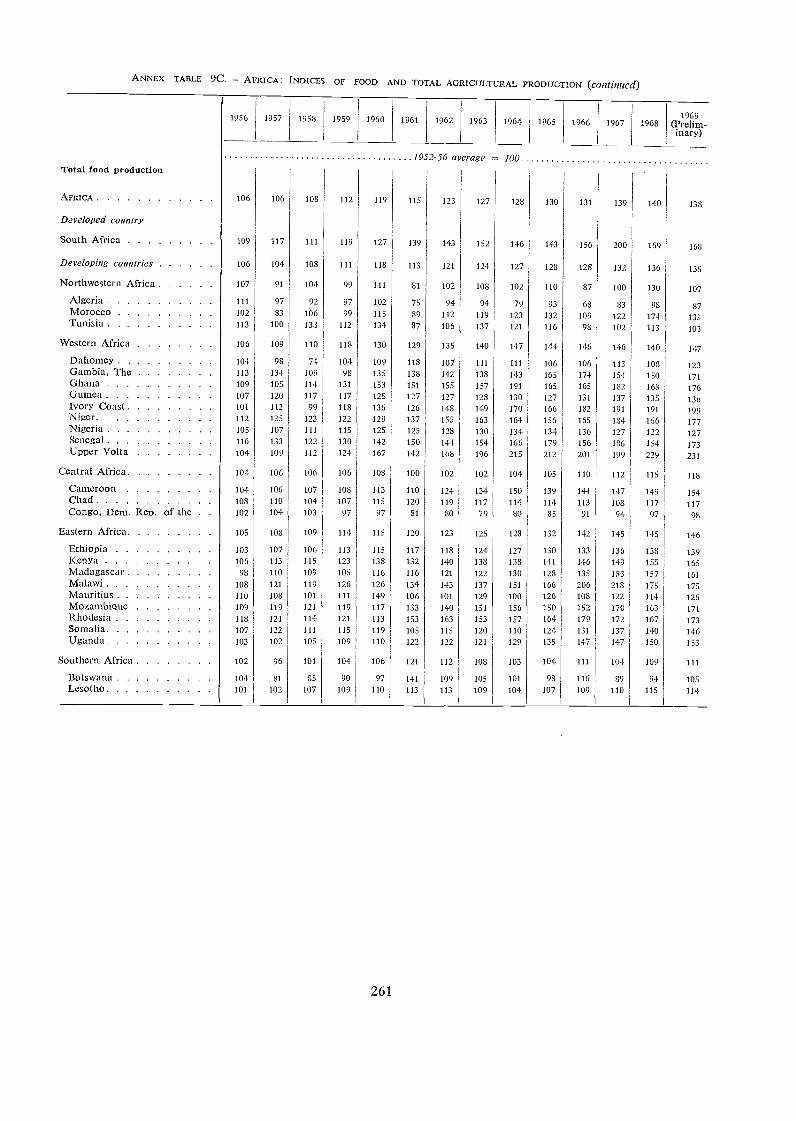
ANNEX TABLE 9C. AFRICA: INDICES OF FOOD AND TOTAL AGRICULTURAL PRODUCTION (COMM/fed)
1956 1957 1958 1959 1960
261
1961 1962 1963 1964 1965 1966 1967 19681969
(Prelim-inary)
Total food production1952-56 average 100
AFRICA 106 106 108 112 119 115 123 127 128 130 131 139 140 138
Developed country
South Africa 109 117 111 119 127 139 143 152 146 143 156 200 169 168
Developing countries 106 104 108 111 118 113 121 124 127 128 128 132 136 135
Northwestern Africa 107 91 104- 99 Ill 81 102 10S 102 110 87 100 130 107
AlgeriaMoroccoTunisia
111
102113
97
83
100
92106
138
97
99112
102
115
134
75
89
87
94112
106
94119
137
79
123
121
93
132
116
68
10998
83122
102
98
174113
87
135
103
Western Africa 106 109 110 118 130 129 135 140 147 144 146 146 140 147
Dahomey 104 98 74 104 109 118 107 111 111 106 106 113 108 123Gambia, The 113 134 109 98 135 138 142 138 143 165 174 154 150 171Ghana 109 105 114 131 153 151 155 157 191 165 165 182 168 176Guinea 107 120 117 117 128 127 127 128 130 127 131 137 135 136Ivory Coast 101 112 99 118 136 126 148 149 170 166 182 191 191 199Niger 112 125 123 122 129 137 155 163 164 156 165 184 166 177Nigeria 105 107 111 115 125 125 128 130 134 134 136 127 122 127Senegal 116 133 122 130 142 150 144 154- 166 179 156 186 154 173Upper Volta 104 109 112 124 167 142 168 196 215 212 201 199 229 231
Central Africa . 104 106 106 106 108 100 102 102 104 105 110 112 115 118
Cameroon 104 106 107 108 113 110 124 134 150 139 144- 147 149 154Chad 108 110 104 107 115 120 119 117 114 114 113 108 117 117Congo, Dem. Rep, of the 102 104 103 97 97 SI 80 79 80 85 91 94 97 98
Eastern Africa 105 108 109 114 115 120 123 125 128 132 142 14-5 145 146
Ethiopia 103 107 106 113 115 117 118 124 127 130 133 136 138 139Kenya 106 113 115 123 138 132 140 138 138 141 146 149 155 165Madagascar 98 110 109 105 116 116 121 122 130 128 135 153 157 161Malawi 108 121 119 126 126 134 143 137 151 166 206 213 175 175Mauritius 110 108 101 III 149 106 101 129 100 126 108 122 114 126Mozambique 109 119 121 119 117 133 140 151 156 150 152 170 163 171Rhodesia 118 121 114 121 113 153 163 153 157 164 179 172 167 173Somalia 107 122 111 115 119 105 115 120 110 124 131 137 140 146Uganda. 103 102 105 109 110 122 122 121 129 135 147 147 150 153
Southern Africa 102 96 101 104 106 121 112 108 103 104 111 104 109 111
Botswana 104 81 Si 90 97 141 109 105 101 98 116 89 94 105Lesotho 101 102 107 109 110 113 113 109 104 107 109 110 115 114
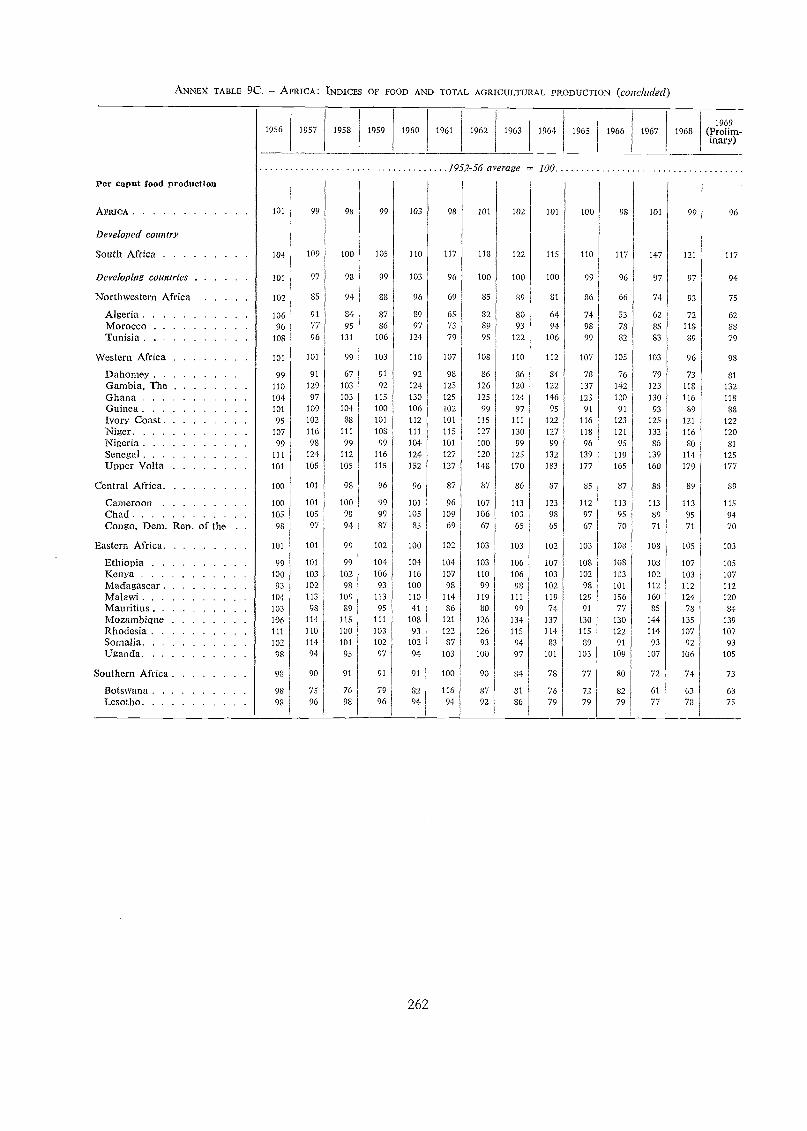
ANNEX TABLE 9C. AFRICA : INDICES OF FOOD AND TOTAL AGRICULTURAL PRODUCTION (concluded)
262
Per caput food production1952-56 average 100
AFRICA 101 99 98 99 103 98 101 102 101 100 98 101 99 96
Developed country
South Africa 104 109 100 105 110 117 118 122 115 110 117 147 121 117
Developirtg countries 101 97 98 99 103 96 100 100 100 99 96 97 97 94
Northwestern Africa 102 85 94 83 96 69 85 89 81 86 66 74 93 75
Algeritt 106 91 84 87 89 65 82 80 64 74 53 62 72 62Morocco 96 77 95 86 97 73 89 93 94 98 78 85 118 88
Tunisia 108 96 131 106 124 79 95 122 106 99 82 83 89 79
Western Africa 101 101 99 103 110 107 108 110 112I
107 105 103 96 98
Dahomey 99 91 67 91 92 98 86 86 84 78 76 79 73 81
Gambia, The 110 129 103 92 124 125 126 120 122 137 142 123 118 132
Ghana 104 97 103 115 130 125 125 124 146 123 120 130 116 118
Guinea 101 109 104 100 106 102 99 97 95 91 91 93 99 88
Ivory Coast 95 102 88 101 112 101 115 111 122 116 123 125 121 122Niger. . 107 116 111 108 111 115 127 130 127 118 121 132 116 120
Nigeria 99 95 99 99 104 101 100 99 99 96 95 86 SO 81
Senegal 111 124 112 116 124 127 120 125 132 139 119 139 114 125
Upper Volta 101 105 105 115 152 127 148 170 183 177 165 160 179 177
Central Africa . 100 101 95 96 96 37 87 86 87 35 87 88 89
Cameroon 100 101 100 99 101 96 107 113 123 112 113 113 113 115
Chad 105 105 98 99 105 109 106 103 98 97 95 89 95 94
Congo, Dem. Rep, of the 98 97 94 87 85 69 67 65 65 67 70 71 71 70
Eastern Africa 101 101 99 102 100 102 103 103 102 103 108 108 105 103
Ethiopia 99 101 99 104 104 104 103 106 107 108 108 103 107 105
Kenya 100 103 102 106 116 107 110 106 103 102 103 102 103 107
Madagascar 93 102 98 93 100 98 99 98 102 98 101 112 112 112
Malawi 104 113 109 113 110 114 119 111 119 129 156 160 124 120
Mauritius 103 98 89 95 41 86 80 99 74 91 77 85 78 84Mozambique 106 114 115 111 101 121 126 134 137 130 130 144 135 139
Rhodesia 111 110 100 103 93 122 126 115 114 115 122 114 107 107Somalia 102 114 101 102 102 87 93 94 83 89 91 93 92 93
Uganda. 98 94 95 97 94 103 100 97 101 103 109 107 106 105
Southern Africa 98 90 91 91 91 100 90 84 78 77 80 72 74 73
Botswini 98 75 76 79 82 116 87 SI 76 72 82 61 63 68Lesotho 98 96 98 96 94 94 92 86 79 79 79 77 78 75
19691956 1957 1958 1959 1960 1961 1962 1963 1964 1965 1966 1967 1968 (Prelim-
inary)
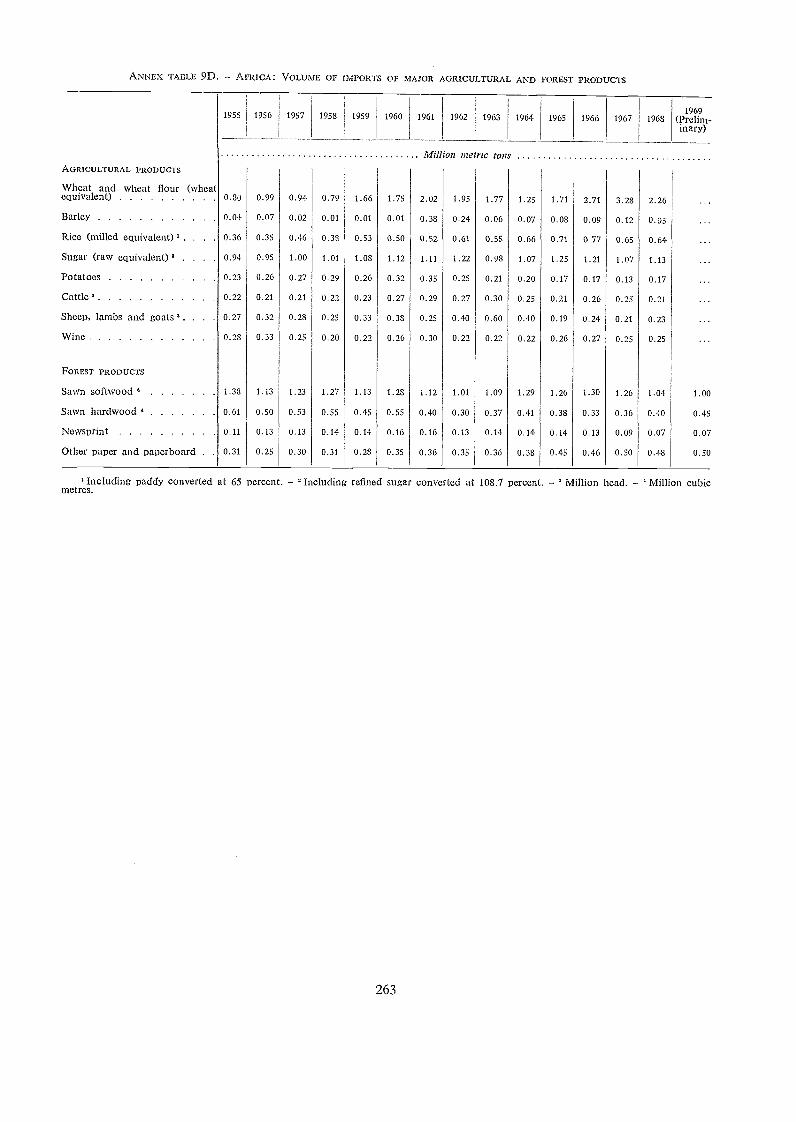
ANNEX TABLE 9D. - AFRICA: VOLUME OF IMPORTS OF MAJOR AGRICULTURAL AND FOREST PRODUCTS
'Including paddy converted at 65 percent. - 'Including refined sugar converted at 108.7 percent. - Million lead. - Million cubicmetres.
263
1955 1956 1957 1958 1959 1960 1961 1962 1963 1964 1965 1966 1967 19681969
(Prelim-inary)
Mi/lino metric tonsAGRICULTURAL PRODUCTS
Wheat and wheat flour (wheatequivalent) 0.80 0.99 0.94 0.79 1.66 1.75 2.02 1.95 1.77 1.25 1.71 2.71 3.28 2.26
Barley 0.04 0.07 0.02 0.01 0.01 0.01 0.38 0.24 0.06 0.07 0.08 0.09 0.12 0.05
Rice (milled equivalent), . . 0.36 0.35 0.46 0.38 0.53 0.50 0.52 0.61 0.55 0.66 0.71 0.77 0.65 0.64
Sugar (raw ectuivalent)4 . . . 0.94 0.95 1.00 1.01 1.03 1.12 1.11 1.22 0.98 1.07 1.25 1.21 1.07 1.13
Potatoes 0.23 0.26 0.27 0.29 0.26 0.32 0.35 0.25 0.21 0.20 0.17 0.17 0.13 0.17
Cattle. 0.22 0.21 0.21 0.22 0.23 0.27 0.29 0.27 0.30 0.25 0.21 0.26 0.25 0.21
Sheep, lambs and goats . . 0.27 0.32 0.28 0.25 0.33 0.38 0.25 0.40 0.60 0.40 0.19 0.24 0.21 0.23
Wine 028 0.33 0.25 0.20 0.22 0.26 0.30 0.22 0.22 0.22 0.26 0.27 0.25 0.25
FOREST PRODUCTS
Sawn softwood 4 1.38 1.13 1.23 1.27 1.13 1.28 1.12 1.01 1.09 1.29 1.26 1.30 1.26 1.04 1.00
Sasvn hardwood 4 0.61 0.50 0.53 0.55 0.45 0.55 0.40 0.30 0.37 0.41 0.38 0.33 0.36 0.40 0.45
Newsprint 0.11 0.13 0.13 0.14 0.14 0.16 0.16 0.13 0.14 0.14 0.14 0.13 0.09 0.07 0.07
Other paper and paperboard . . 0.31 0.25 0.30 0.31 0.28 0.35 0.36 0.35 0.36 0.38 0.45 0.46 0.50 0.48 0.50
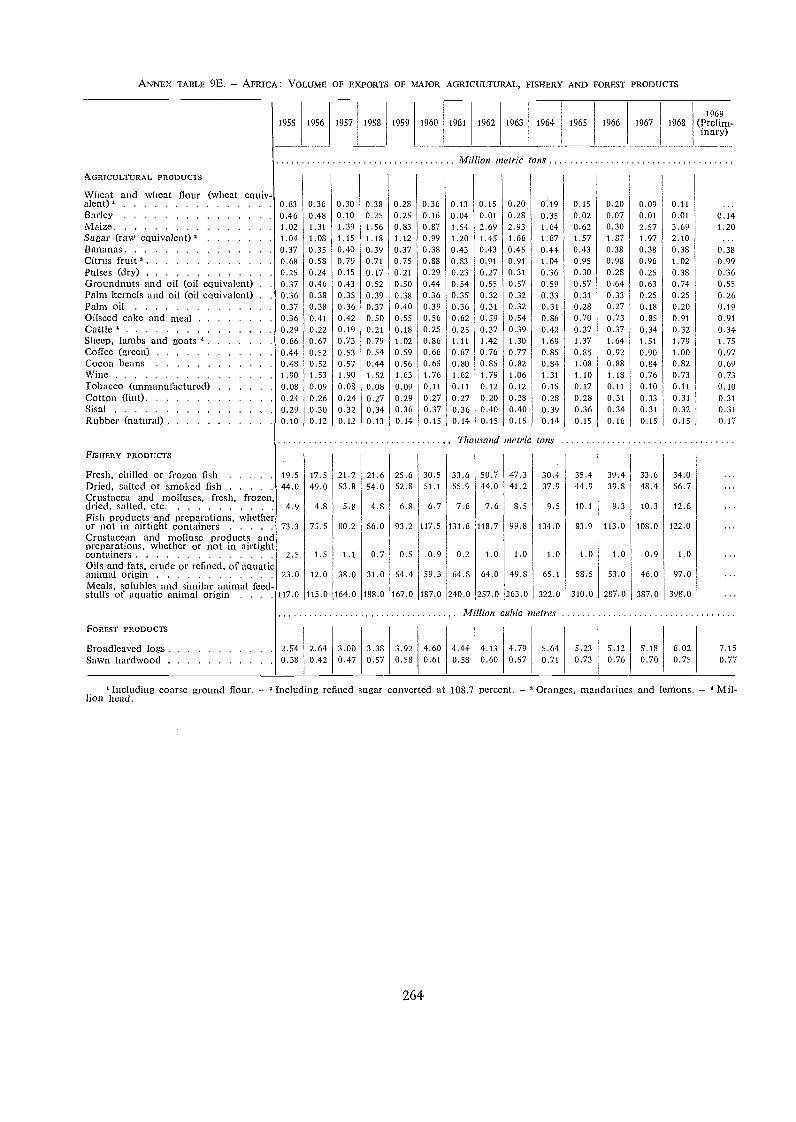
ANNEX TABLE 9E. - AFRICA : VOLUME OF EXPORTS OF MAJOR AGRICULTURAL, FISHERY AND FOREST PRODUCTS
' Including coarse ground flour. - 2 Including refined sugar converted at 108.7 percent. - Oranges, mandarines and lemons. - ' Mil-lion head.
264
1955 1956 1957 1958 1959 1960 1961 1962 1963 1964 1965 1966 1967 19681969
(Prelim-inary)
Million i zetric lotis
AGRICULTURAL PRODUCTS
VVheat and wheat flour (wheat equiv-alent) 0.63 0.36 0.30 0.38 0.28 0.36 0.13 0.15 0.20 0.19 0.15 0.20 0.09 0.11Barley 0.46 0.48 0.10 0.25 0.25 0.16 0.04 0.01 0.28 0.35 0.02 0.07 0.01 0.01 0.14Maize 1.02 1.31 1.39 1.56 0.83 0.87 1.54 2.69 2.93 1.64 0.62 0.30 2.57 3.69 1.20Sugar (raw equivalent)" 1.04 1.08 1.15 1.18 1.12 0.99 1.20 1.45 1.66 1.67 1.57 1.87 1.97 2.10Bananas 0.37 0.35 0.40 0.39 0.37 0.38 0.43 0.43 0.45 0.44 0.43 0.38 0.38 0.38 0.38Citrus fruit' 0 68 0.58 0.79 0.71 0.75 0.88 0.83 0.91 0.91 1.04 0.95 0.98 0.96 1.02 0.99Pulses (drY) 0 25 0.24 0.15 0.17 0.21 0.29 0.23 0.27 0.31 0.36 0.30 0.28 0.25 0.38 0.36Groundnuts and oil (oil equivalent) . 0.37 0.46 0.43 0.52 0.50 0.44 0.54 0.55 0.57 0.59 0.57 0.64 0.63 0.74 0.55Palm kernels and oil (oil equivalent) . 0.36 0.38 0.35 0.39 0.38 0.36 0.35 0.32 0.32 0.33 0.31 0.33 0.25 0.25 0.26Palm oil 0.37 0.38 0.36 0.37 0.40 0.39 0.36 0.31 0.32 0.31 0.28 0.27 0.18 0.20 0.19Oilseed cake and meal 0 36 0.41 0.42 0.50 0.55 0.56 0.62 0.59 0.54 0.86 0.70 0.73 0.85 0.91 0.91Cattle 4 0 29 0.22 0.19 0.21 0.18 0.25 0.25 0.37 0.39 0.42 0.37 0.37 0.34 0.32 0.34Sheep, lambs and goats 4 0.66 0.67 0.73 0.79 1.02 0.86 1.11 1.42 1.30 1.69 1.37 1.64 1.51 1.79 1.75coffee (green) 0 44 0.52 0.53 0.54 0.59 0.66 0.67 0.76 0.77 0.85 0.85 0.92 0.90 1.00 0.97Cocoa beans 0.48 0.52 0.57 0.44 0.56 0.65 0.80 0.85 0.82 0.84 1.08 0.88 0.84 0.82 0.69'Nine 1 90 1.53 1.90 1.52 1.63 1.76 1.62 1.79 1.06 1.31 1.10 1.18 0.76 0.73 0.73Tobacco (unmanufactured) 0.08 0.09 0.08 0.08 0.09 0.11 0.11 0.12 0.12 0.15 0.17 0.11 0.10 0.11 0.10Cotton (lint) 0.24 0.26 0.24 0.27 0.29 0.27 0.27 0.20 0.28 0.28 0.28 0.31 0.33 0.31 0.31Sisal 0.29 0.30 0.32 0.34 0.36 0.37 0.36 0.40 0.40 0.39 0.36 0.34 0.31 0.32 0.31Rubber (natural) 0 10 0.12 0.12 0.13 0.14 0.15 0.14 0.15 0.15 0.14 0.15 0.16 0.15 0.15 0.17
Thousand nzetric tonsFISHERY PRODUCTS
Fresh, chilled or frozen fish 19 5 17.5 21.7 21.6 25.6 30.5 33.6 50.7 47.3 30.4 35.4 39.4 33.6 34.0Dried, salted or smoked fish 44 0 49.0 53.8 54.0 52.8 51.1 55.9 44.0 41.2 37.9 44.9 39.8 48.4 56.7Crustacea and molluscs, fresh, frozen,dried, salted, etc . 4 9 4.8 5.8 4.8 6.8 6.7 7.6 7.6 8.5 9.5 10.1 9.3 10.3 12.6Fish products and preparations, whetheror not in airtight containers 73 3 75.5 80.2 86.0 93.2 117.5 131.6 118.7 99.8 134.0 83.9 113.0 108.0 122.0Crustacean and mollusc products andpreparations, whether or not in airtightcontainers 2 5 1.5 1.1 0.7 0.5 0.9 0.2 1.0 1.0 1.0 1.0 1.0 0.9 1.0Oils and fats, crudo or refined, of aquaticanimal origin 23 0 12.0 38.0 31.0 54.4 59.3 64.8 64.0 49.8 65.1 58.5 53.0 46.0 97.0Meals, solubles and similar animal feed-stuffs of aquatic animal origin . . . . 117.0 115.0 164.0 188.0 167.0 187.0 240.0 257.0 263.0 322.0 310.0 287.0 387.0 398.0
Million cubic n etresFOREST PRODUCTS
Broadleaved logs 2.54 2.64 3.00 3.38 3.92 4.60 4.44 4.13 4.79 5.64 5.23 5.12 5.18 6.02 7.15Sawn hardwood 0 38 0.42 0.47 0.57 0.58 0.61 0.58 0.60 0.57 0.71 0.73 0.76 0.70 0.75 0.77
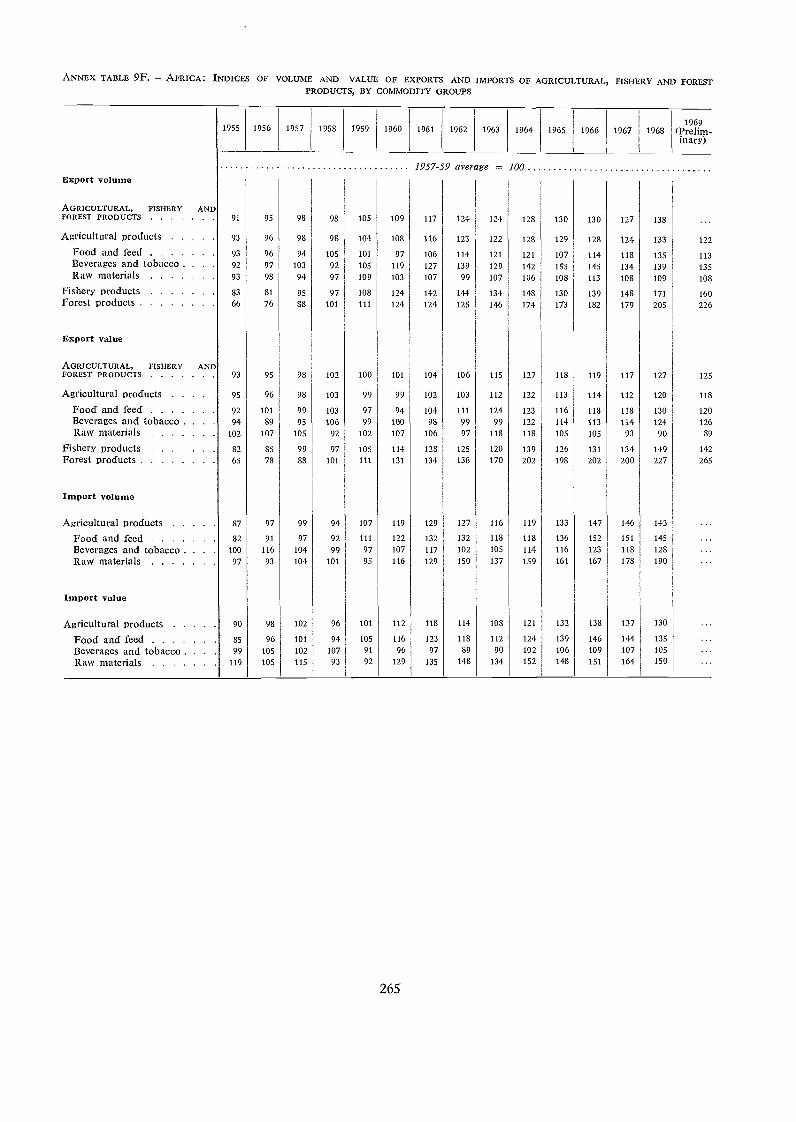
265
ANNEX TABLE 9F. AFRICA: INDICES OF VOLUME AND VALUE OF EXPORTS AND IMPORTS OF AGRICULTURAL, FISHERY AND FORESTPRODUCTS, BY COMMODITY GROUPS
1955 1956 1957 1958 1959 1960 1961 1962 1963 1964 1965 1966 1967 19681969
(Prelim-inary)
1957-59 average 100Export volume
AGRIcULTuRAL, FISHERY ANDFoREST PRODUcTs 91 95 98 98 105 109 117 124 124 128 130 130 127 138
Agricultural products 93 96 98 98 104 108 116 123 122 128 129 128 124 133 122
Food and feed 93 96 94 105 101 97 106 114 121 121 107 114 118 135 113Beverages and tobacco . 92 97 103 92 105 119 127 139 129 142 155 145 134 139 135Raw materials 93 98 94 97 109 103 107 99 107 106 108 113 108 109 108
Fishery products 83 81 95 97 108 124 142 144 134 148 130 139 148 171 160Forest products 66 76 88 101 111 124 124 125 146 174 173 182 179 205 226
Export value
AGRICULTURAL, FISHERY ANDFOREST PRODuCTs 93 95 98 102 100 101 104 106 115 127 118 119 117 127 125
Agricultural products 95 96 98 103 99 99 102 103 112 122 113 114 112 120 118
Food and feed 92 101 99 103 97 94 104 111 124 123 116 118 118 130 120Beverages and tobacco . 94 89 95 106 99 100 98 99 99 122 114 113 114 124 126Raw materials 102 107 105 92 102 107 106 97 118 118 105 105 93 90 89
Fishery products 82 85 99 97 105 114 128 125 120 139 126 131 134 149 142
Forest products 65 78 88 101 111 131 134 136 170 202 198 202 200 227 265
Import volume
Agricultural products 87 97 99 94 107 119 129 127 116 119 133 147 146 143
Food and feed 82 91 97 92 111 122 132 132 118 118 136 152 151 145
Beverages and tobacco . . 100 116 104 99 97 107 117 102 105 114 116 123 118 128
Raw materials 97 93 104 101 93 116 129 150 137 159 161 167 178 190
Import value
Agricultural products 90 98 102 96 101 112 118 114 108 121 132 138 137 130
Food and feed 85 96 101 94 105 116 123 118 112 124 139 146 144 135
Beverages and tobacco . . . 99 105 102 107 91 96 97 89 90 102 106 109 107 105
Raw materials 119 105 115 93 92 129 135 148 134 152 148 151 164 150
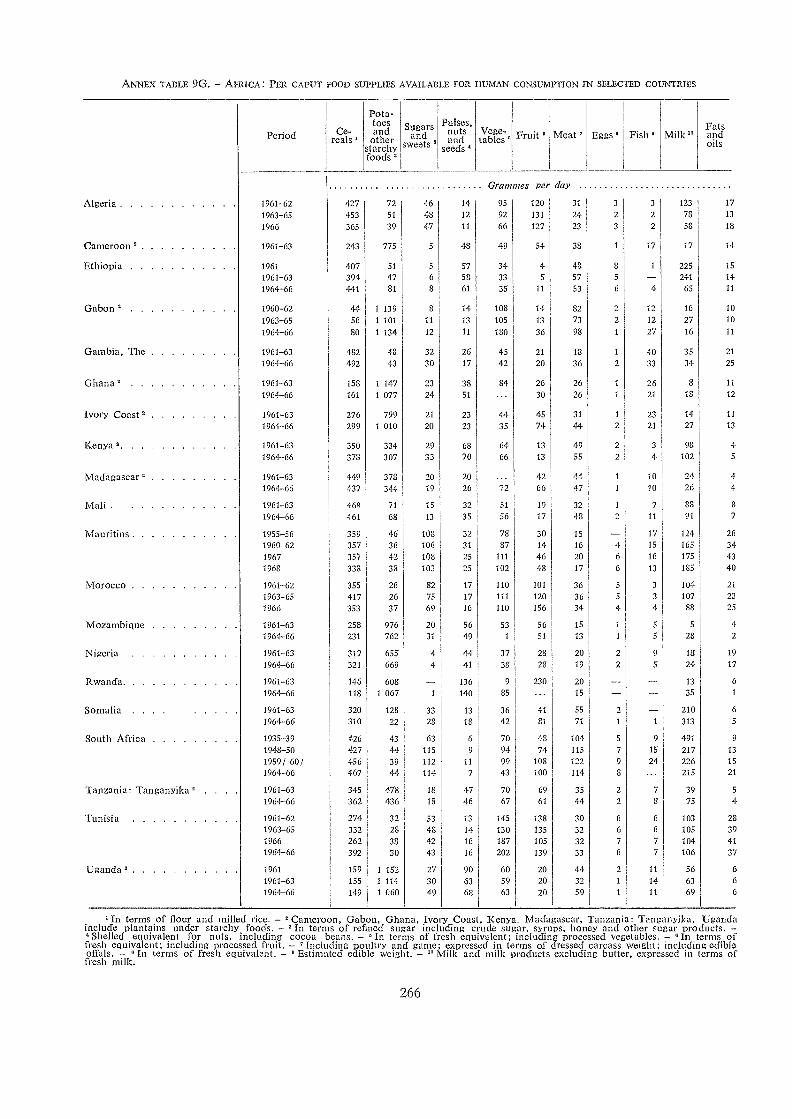
ANNEX TABLE 9G. - AFRICA: PER CAPUT FOOD SUPPLIES AVAILABLE FOR HUMAN CONSUMPTION IN SELECTED COUNTRIES
Period
Algeria 1961-621963-651966
Cameroon 2 1961-63
Ethiopia 19611961-631964-66
Gabon 2 1960-621963-651961-66
Gambia, The 1961-631964-66
Ghana 1961-631964-66
Ivory Coast° 1961-631961-66
Kenya 1961-631964-66
Madagascar 2 1961-631961-66
Mali 1961-631961-66
Mauritius 1955-561960-6219671968
Morocco 1961-621963-651966
Mozambique 1961-631961-66
Nigeria 1961-631961-66
Rwanda 1961-631964-66
Somalia . . . . 1961-631964-66
South Africa 1935-391943-501959/-60/1961-66
Tanzania: Tanganyika' .
Tunisia
1961-631964-66
1961-621963-6519661964-66
Uganda' 19611961-631961-66
Ce-reals'
Grammes per day
427453365
243
407394441
445680
482492
158
161
276299
350
373
449437
468461
359357357338
355417353
258231
317321
146
118
320310
426427456467
345362
274332262392
159155149
Pota-toesandother
starchyfoods'
7251
39
775
51
4781
1 1391 1011 134
4843
I 1471 077
7991 010
334307
378344
71
68
46364238
262637
976762
655669
6081 067
12822
43143944
478436
32
23
33
30
1 1521 1141 060
Sugarsand
sweets
464847
5
5
68
8
11
12
3230
23
24
21
20
29
33
2019
15 3213 35
109106108
103
827569
2031
4
4
33
28
63
115
112
114
18
18
53
4842
43
27
3049
Pulses,nutsand
seeds
1412
11
43
575861
14
13
11
26
17
38
51
2323
6870
2026
32
31
25
25
17
17
16
56
49
4441
136
140
13
18
9
11
7
4746
13
14
16
16
906368
Vege-tables
95
9266
49
3433
35
103
105
180
45
42
84
35
6466
51
56
7887
111
102
53
3738
9
35
3642
70949943
7067
145130187
202
605963
Fruit
120131
127
54
45
11
14
13
36
21
20
2630
4574
13
13
4272 66
19
17
30144648
101
120156
5651
28
28
230
41
81
4874
108100
69
61
138135105
139
202020
Meat 7
31
2423
38
485753
82
73
98
13
36
2626
31
44
4955
4447
32
48
15
16
2017
363634
15
13
20
19
2015
55
71
104115
122114
35
44
303232
33
4432
59
Eggs
3
23
56
221
1
2
1
2
2
2
2
466
5
5
4
22
2
5
7
9
8
2
2
6
6
7
6
2
1
1
Fish°
3
22
17
1
4
12
12
27
4033
2621
23
21
3
4
10
10
711
17
15
16
13
3
3
4
5
5
9
5
9
15
24
7
6
6
77
Milk"
123
7358
17
225241
65
16
2716
35
34
18
14
27
93102
2426
83
91
124165
175
135
104107
88
5
28
18
24
1335
210313
491
217226215
3975
103
105104106
11 5614 6311 69
I
Fatsandoils
17
13
18
14
15
14
11
10
10
11
21
25
11
12
11
13
4
5
4
4
7
2634
4340
21
23
25
4
2
19
17
6
65
913
15
21
5
4
28
3941
37
66
6
include plantains under starchy foods. - In terms of refined sugar including crude sugar, syrups, honey and other sugar products. -In terms of flour and milled rice. - 'Cameroon, Gabon, Ghana, Ivoiy Coast, Kenya, Madagascar, Tanzania: Tanganyika, Uganda
°Shelled equivalent for nuts, including cocoa beans. - In terms of fresh equivalent; including processed vegetables. - 'In terms offresh equivalent: including processed fruit. - 'Including poultry sud game; expressed in terms of dressed carcass weight; including edibleoffals. - "In terms of fresh equivalent. - ° Estimated edible weight. - " Millz and milk products excluding butter. expressed in terms offresh milk.
266
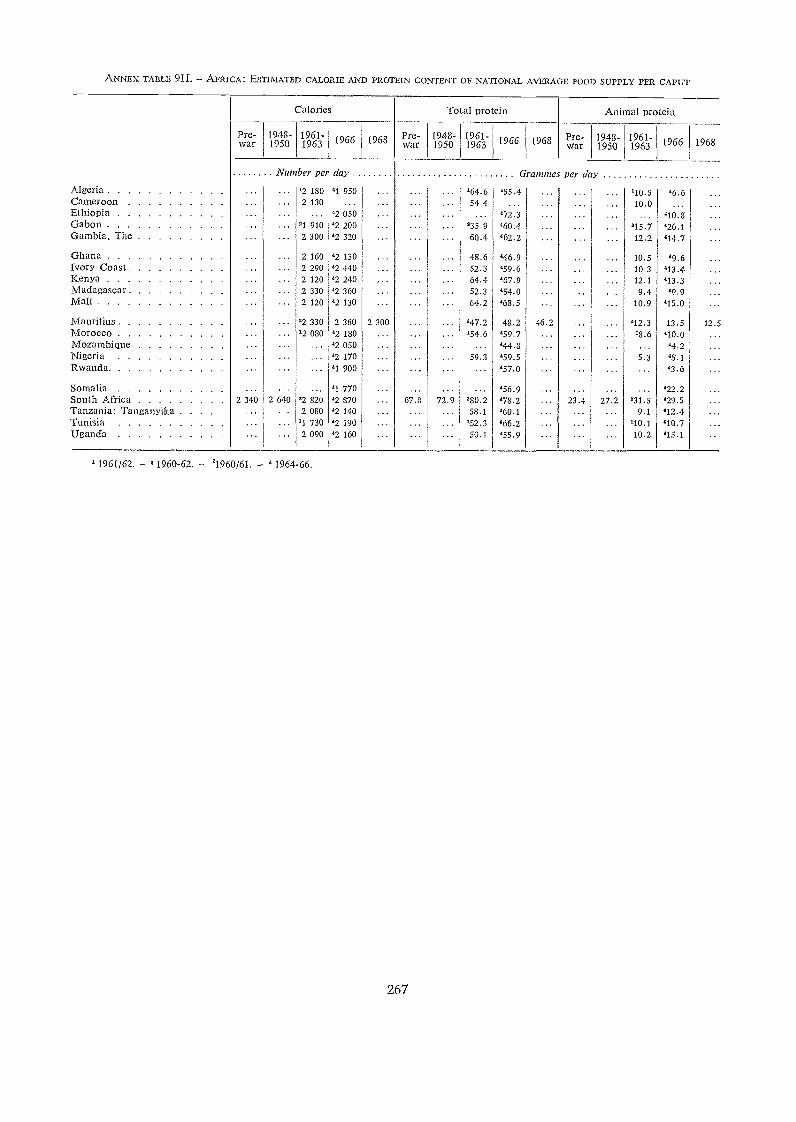
ANNEX TABLE 9H. - AFRICA: ESTIMATED CALORIE AND PROTEIN CONTENT OF NATIONAL AVERAGE FOOD SUPPLY PER CAPUT
AlgeriaCameroonEthiopiaGabonGambia, The
GhanaIvory CoastKenyaMadagascarMali
MauritiusMoroccoMozambiqueNigeriaRwanda
SomaliaSouth AfricaTanzania: TanganyikaTunisiaUganda
Pre-war
1948-1950
1961/62. - 1960-62. - '1960/61. 1964-66.
Calories
1961-1963
Nun ber per day
12 180 "1 9502 130
... '2050"1 910 '2 2002 300 '2 320
2 160 '2 1302 290 '2 4402 120 '2 2402 330 "2 3602 120 "2 130
22 330 2 360'2 030 '2 180
... '2050'2170'1900
'1770'2 820 "2 8702 080 '2 140'1 730 '2 1902 090 '2 160
2 300
267
Pre-War
1948-1950
1961-1963 1966
'64.6 '55.454.4... '72.3
'35.9 "60.460.4 '62.2
48.6 "46.952.3 '59.664.4 '67.952.3 '54.064.2 '68.5
'47.2 48.2"54.6 '59.7
... '44.859.3 '59.5... '57.0
... '56.9'80.2 '78.258.1 '60.1
'52.3 '66.250.1 '55.9
1968 Pre-war
1948-1950
196 1-1963
Grammes per day
2 6402 340
'10.510.0
°15.712.2
'6.6
'10.8'26.1'14.7
10.510.312.19.4
10.9
'9.6'13.4'13.3'9.9
'15.0
46.2 '12.3'8.6
5.3
12.513.5'10.0'4.2'5.1'3.6
.
"22.2'29.5'12.4'10.7'15.1
23.4 27.2 '31.59.1
'10.110.2
Total protein Animal protein
1966 1968 1966 1968
67.8 72.9
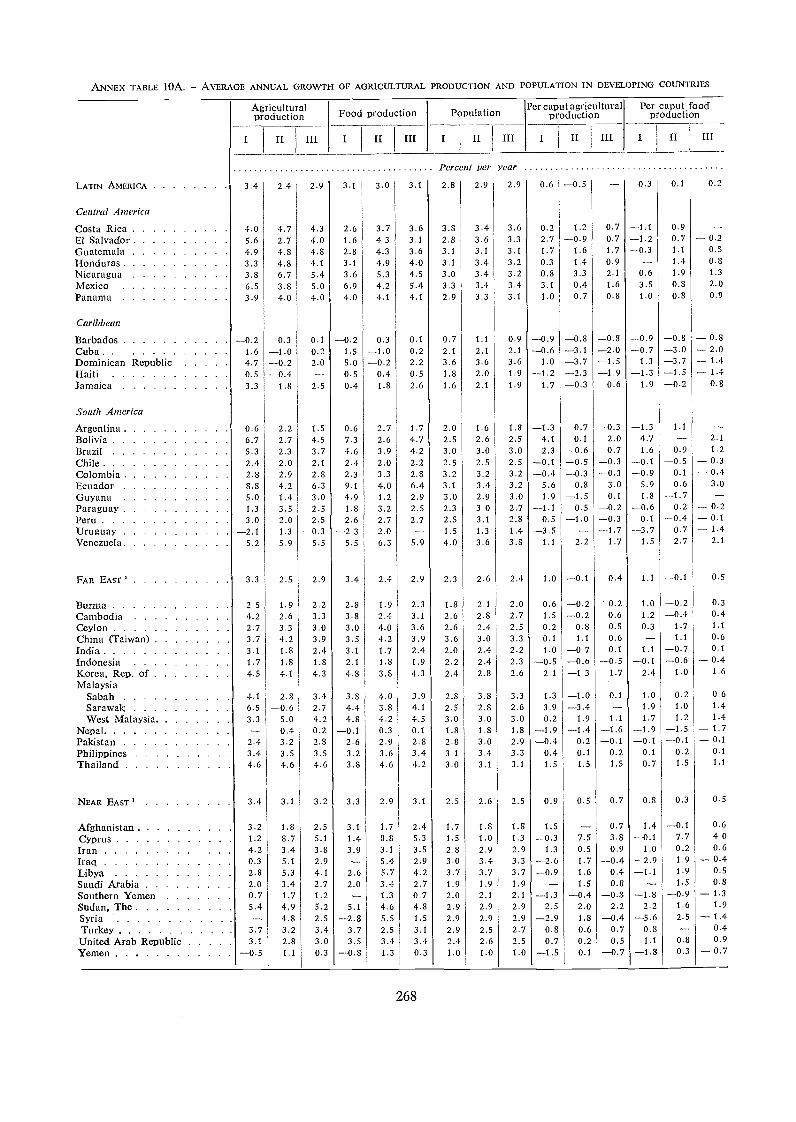
ANNEX TABLE 10A. - AVERAGE ANNUAL GROWTH OF AGRICULTURAL PRODUCTION AND POPULATION IN DEVELOPING COUNTRIES
268
Agriculturalproduction Food production Population
Per caput agriculturalproduction
Per caput foodproduction
I II III I II III I II III I II III I It 'if
Percent per year
LATIN AMERICA 3.4 2.4 2.9 3.1 3.0 3.1 2.8 2.9 2.9 0.6 --0.5 -- 0.3 0.1 0.2
Central America
:osta Rica 4.0 4.7 4.3 2.6 3.7 3.6 3.8 3.4 3.6 0.2 1.2 0.7 --1.1 0.9 --FA Salvador 5.6 2.7 4.0 1.6 4.3 3.1 2.8 3.6 3.3 2.7 --0.9 0.7 --1.2 0.7 -- 0.23uaternala 4.9 4.8 4.8 2.8 4.3 3.6 3.1 3.1 3.1 1.7 1.6 1.7 --0.3 1.1 0.5
ionduras 3.3 4.8 4.1 3.1 4.9 4.0 3.1 3.4 3.2 0.3 1.4 0.9 -- 1.4 0.8
slicaragua 3.8 6.7 5.4 3.6 5.3 4.5 3.0 3.4 3.2 0.8 3.3 2.1 0.6 1.9 1.3
Vlexico 6.5 3.8 5.0 6.9 4.2 5.4 3.3 3.4 3.4 3.1 0.4 1.6 3.5 0.8 2.0
Panarna 3.9 4.0 4.0 4.0 4.1 4.1 2.9 3.3 3.1 1.0 0.7 0.8 1.0 0.8 0.9
Caribbean
3arbados --0.2 0.3 0.1 --0.2 0.3 0.1 0.7 1.1 0.9 --0.9 --0.8 --0.8 --0.9 --0.8 -- 0.8Cuba 1.6 --1.0 0.2 1.5 --1.0 0.2 2.1 2.1 2.1 --0.6 --3.1 --2.0 --0.7 --3.0 -- 2.0Dominican Republic 4.7 --0.2 2.0 5.0 --0.2 2.2 3.6 3.6 3.6 1.0 --3.7 --1.5 1.3 --3.7 -- 1.4Aaifi 0.5 --0.4 -- 0.5 0.4 0.5 1.8 2.0 1.9 --1.2 --2.3 --1.9 --1.3 --1.5 -1.4lamaica 3.3 1.8 2.5 0.4 1.8 2.6 1.6 2.1 1.9 1.7 --0.3 0.6 1.9 --0.2 0.8
South America
krgentina 0.6 2.2 1.5 0.6 2.7 1.7 2.0 1.6 1.8 --1.3 0.7 --0.3 --1.3 1.1 _...
Bolivia 6.7 2.7 4.5 7.3 2.6 4.7 2.5 2.6 2.5 4.1 0.1 2.0 4.7 -- 2.1
Braza 5.3 2.3 3.7 4.6 3.9 4.2 3.0 3.0 3.0 2.3 --0.6 0.7 1.6 0.9 1.2
Chile 2.4 2.0 2.1 2.4 2.0 2.2 2.5 2.5 2.5 --0.1 --0.5 --0.3 --0.1 --0.5 -- 0.3Colombia 2.8 2.9 2.8 2.3 3.3 2.8 3.2 3.2 3.2 --0.4 --0.3 --0.3 --0.9 0.1 -- 0.4Ecuador 8.8 4.2 6.3 9.1 4.0 6.4 3.1 3.4 3.2 5.6 0.8 3.0 5.9 0.6 3.0
5uyana 5.0 1.4 3.0 4.9 1.2 2.9 3.0 2.9 3.0 1.9 --1.5 0.1 1.8 --1.7 __.
Paraguay 1.3 3.5 2.5 1.8 3.2 2.5 2.3 3.0 2.7 --1.1 0.5 --0.2 --0.6 0.2 -- 0.2Peru 3.0 2.0 2.5 2.6 2.7 2.7 2.5 3.1 2.8 0.5 --1.0 --0.3 0.1 --0.4 -- 0.1Uruguay --2.1 1.3 --0.3 --2.3 2.0 -- 1.5 1.3 1.4 --3.5 -- --1.7 --3.7 0.7 -- 1.4Venezuela 5.2 5.9 5.5 5.5 6.3 5.9 4.0 3.6 3.8 1.1 2.2 1.7 1.5 2.7 2.1
FAR EAST ' 3.3 2.5 2.9 3.4 2.4 2.9 2.3 2.6 2.4 1.0 --0.1 0.4 1.1 --OA 0.5
Burma 2.5 1.9 2.2 2.8 1.9 2.3 1.8 2.1 2.0 0.6 --0.2 0.2 1.0 --0.2 0.3
Cambodia 4.2 2.6 3.3 3.8 2.4 3.1 2.6 2.8 2.7 1.5 --0.2 0.6 1.2 --0.4 0.4Ceylon 2.7 3.3 3.0 3.0 4.0 3.6 2.6 2.4 2.5 0.2 0.8 0.5 0.3 1.7 1.1
China (Taiwan) 3.7 4.2 3.9 3.5 4.2 3.9 3.6 3.0 3.3 0.1 1.1 0.6 -- 1.1 0.6India 3.1 1.8 2.4 3.1 1.7 2.4 2.0 2.4 2.2 1.0 --0.7 0.1 1.1 --0.7 0.1
(nclonesia 1.7 1.8 1.8 2.1 1.8 1.9 2.2 2.4 2.3 --0.5 --0.6 --0.5 --0.1 --0.6 -- 0.4Korea, Rep. of 4.5 4.1 4.3 4.8 3.8 4.3 2.4 2.8 2.6 2.1 --1.3 1.7 2.4 1.0 1.6
MalaysiaSabah 4.1 2.8 3.4 3.8 4.0 3.9 2.8 3.8 3.3 1.3 --1.0 0.1 1.0 0.2 0.6
Sarawak 6.5 --0.6 2.7 4.4 3.8 4.1 2.5 2.8 2.6 3.9 --3.4 -- 1.9 1.0 1.4
West Malaysia 3.3 5.0 4.2 4.8 4.2 4.5 3.0 3.0 3.0 0.2 1.9 1.1 1.7 1.2 1.4
Nepal -- 0.4 0.2 --0.1 0.3 0.1 1.8 1.8 1.8 --1.9 --1.4 --1.6 --1.9 --1.5 -1.7Pakistan 2.4 3.2 2.8 2.6 2.9 2.8 2.8 3.0 2.9 --0.4 0.2 --0.1 --0.1 --0.1 -- 0.1Philippines 3.4 3.5 3.5 3.2 3.6 3.4 3.1 3.4 3.3 0.4 0.1 0.2 0.1 0.2 0.1
Thailand 4.6 4.6 4.6 3.8 4.6 4.2 3.0 3.1 3.1 3.5 1.5 1.5 0.7 1.5 1.1
NEAR EAST 1 3.4 3.1 3.2 3.3 2.9 3.1 2.5 2.6 2.5 0.9 0.5 0.7 0.8 0.3 0.5
Afghanistan 3.2 1.8 2.5 3.1 1.7 2.4 1.7 1.8 1.8 1.5 -- 0.7 1.4 --0.1 0.6
CYprus 1.2 8.7 5.1 1.4 8.8 5.3 1.5 1.0 1.3 --0.3 7.5 3.8 --0.1 7.7 4.0
Iran 4.2 3.4 3.8 3.9 3.1 3.5 2.8 2.9 2.9 1.3 0.5 0.9 1.0 0.2 0.6
Iraq 0.3 5.1 2.9 -- 5.4 2.9 3.0 3.4 3.3 --2.6 1.7 --0.4 --2.9 1.9 -- 0.4Libya 2.8 5.3 4.1 2.6 5.7 4.2 3.7 3.7 3.7 --0.9 1.6 0.4 --1.1 1.9 0.5
Saudi Arabia 2.0 3.4 2.7 2.0 3.4 2.7 1.9 1.9 1.9 -- 1.5 0.8 -- 1.5 0.8Southern Yemen 0.7 1.7 1.2 -- 1.3 0.7 2.0 2.1 2.1 --1.3 --0.4 --0.8 --1.8 --0.9 -- 1.3Sudan, The 5.4 4.9 5.2 5.1 4.6 4.8 2.9 2.9 2.9 2.5 2.0 2.2 2.2 1.6 1.9
Syria -- 4.8 2.5 --2.8 5.5 1.5 2.9 2.9 2.9 --2.9 1.8 --0.4 --5.6 2.5 -- 1.4Turkey 3.7 3.2 3.4 3.7 2.5 3.1 2.9 2.5 2.7 0.8 0.6 0.7 0.8 -- 0.4United Arab Republic 3.1 2.8 3.0 3.5 3.4 3.4 2.4 2.6 2.5 0.7 0.2 0.5 1.1 0.8 0.9
Yemen --0.5 1.1 0.3 --0.8 1.3 0.3 1.0 1.0 1.0 --1.5 0.1 --0.7 --1.8 0.3 -0.7
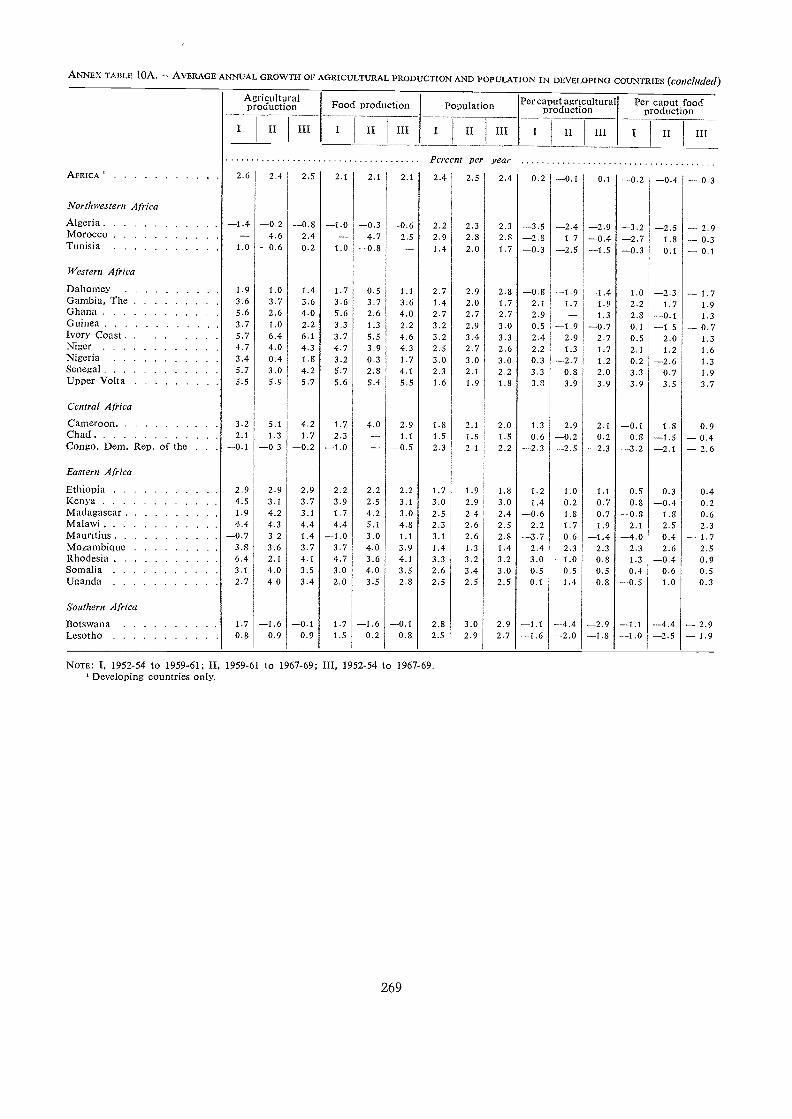
ANNEX TABLE 10A. - AVERAGE ANNUAL GROWTH OF AGRICULTURAL PRODUCTION AND POPULATION IN DEVELONNG COUNTRIES (concluded)
Agricultural Per caput agricultural Per caput foodproduction Food production Population production production
II III I II III I II III I II III I II III
NOTE: I. 1952-54 to 1959-61; II, 1959-61 to 1967-69; III, 1952-54 to 1967-69.' Developing countries only.
269
Percent per yearAFRICA 2.6 2.4 2.5 2.1 2.1 2.1 2.4 2.5 2.4 0.2 -0.1 0.1 -0.2 --0.4 -0.3
North western Africa
Algeria --1.4 --0.2 --0.8 --I.0 --0.3 --0.6 2.2 2.3 2.3 --3.5 --2.4 --2.9 --3.2 --2.5 -- 2.9Morocco __ 4.6 2.4 -- 4.7 2.5 2.9 2.8 2.8 --2.8 1.7 --0.4 --2.7 1.8 -- 0.3Tit nisia 1.0 --0.6 0.2 1.0 --0.8 -- 1.4 2.0 1.7 --0.3 --2.5 --1.5 --0.3 0.1 -- 0.1
Western Africa
Daltontey 1.9 1.0 1.4 1.7 0.5 1.1 2.7 2.9 2.8 --0.8 --1.9 --1.4 1.0 --2.3 -- 1.7Gambia, The 3.6 3.7 3.6 3.6 3.7 3.6 1.4 2.0 1.7 2.1 1.7 1.9 2.2 1.7 1.9Ghana 5.6 2.6 4.0 5.6 2.6 4.0 2.7 2.7 2.7 2.9 -- 1.3 2.8 --0.1 1.3Guinea 3.7 1.0 2.2 3.3 1.3 2.2 3.2 2.9 3.0 0.5 --1.9 -0.7 0.1 --1.5 -- 0.7IvOry Coast 5.7 6.4 6.1 3.7 5.5 4.6 3.2 3.4 3.3 2.4 2.9 2.7 0.5 2.0 1.3Niger 4.7 4.0 4.3 4.7 3.9 4.3 2.5 2.7 2.6 2.2 1.3 1.7 2.1 1.2 1.6Nigeria 3.4 0.4 1.8 3.2 0.3 1.7 3.0 3.0 3.0 0.3 --2.7 1.2 0.2 --2.6 1.3Senegal 5.7 3.0 4.2 5.7 2.8 4.1 2.3 2.1 2.2 3.3 0.8 2.0 3.3 0.7 1.9Upper Volta 5.5 5.9 5.7 5.6 5.4 5.5 1.6 1.9 1.8 3.8 3.9 3.9 3.9 3.5 3.7
Central Africa
Cameroon 3.2 5.1 4.2 1.7 4.0 2.9 1.8 2.1 2.0 1.3 2.9 2.1 --0.1 1.8 0.9Chad 2.1 1.3 1.7 2.3 1.1 1.5 1.5 1.5 0.6 --0.2 0.2 0.8 --1.5 -0.4Congo. I)era. Ftep, of the --0.1 --0.3 --0.2 --1.0 --0.5 2.3 2.1 2.2 --2.3 --2.5 --2.3 --3.2 --2.I -- 2.6
Eastern Africa
Ethiopia 2.9 2.9 2.9 2.2 2.2 2.2 1.7 1.9 1.8 1.2 1.0 1.1 0.5 0.3 0.4Kenya 4.5 3.1 3.7 3.9 2.5 3.1 3.0 2.9 3.0 1.4 0.2 0.7 0.8 --0.4 0.2Madagascar 1.9 4.2 3.1 1.7 4.2 3.0 2.5 2.4 2.4 --0.6 1.8 0.7 --0.8 1.8 0.6Malawi 4.4 4.3 4.4 4.4 5.1 4.8 2.3 2.6 2.5 2.2 1.7 1.9 2.1 2.5 2.3Mauritius --0.7 3.2 1.4 --1.0 3.0 1.1 3.1 2.6 2.8 --3.7 0.6 --1.4 --4.0 0.4 -- 1.7Mozambique 3.8 3.6 3.7 3.7 4.0 3.9 1.4 1.3 1.4 2.4 2.3 2.3 2.3 2.6 2.5Rhodesia 6.4 2.1 4.1 4.7 3.6 4.1 3.3 3.2 3.2 3.0 --1.0 0.8 1.3 -0.4 0.9Somalia 3.1 4.0 3.5 3.0 4.0 3.5 2.6 3.4 3.0 0.5 0.5 0.5 0.4 0.6 0.5Uganda 2.7 4.0 3.4 2.0 3.5 2.8 2.5 2.5 2.5 0.1 1.4 0.8 --0.5 1.0 0.3
Southern Africa
Botswana 1.7 -1.6 -0.1 1.7 --1.6 -0.1 2.8 3.0 2.9 -1.1 -4.4 -2.9 -1.1 -4.4 -2.9Lesotho 0.8 0.9 0.9 1.5 0.2 0.8 2.5 2.9 2.7 --1.6 -2.0 -1.8 -1.0 -2.5 -1.9
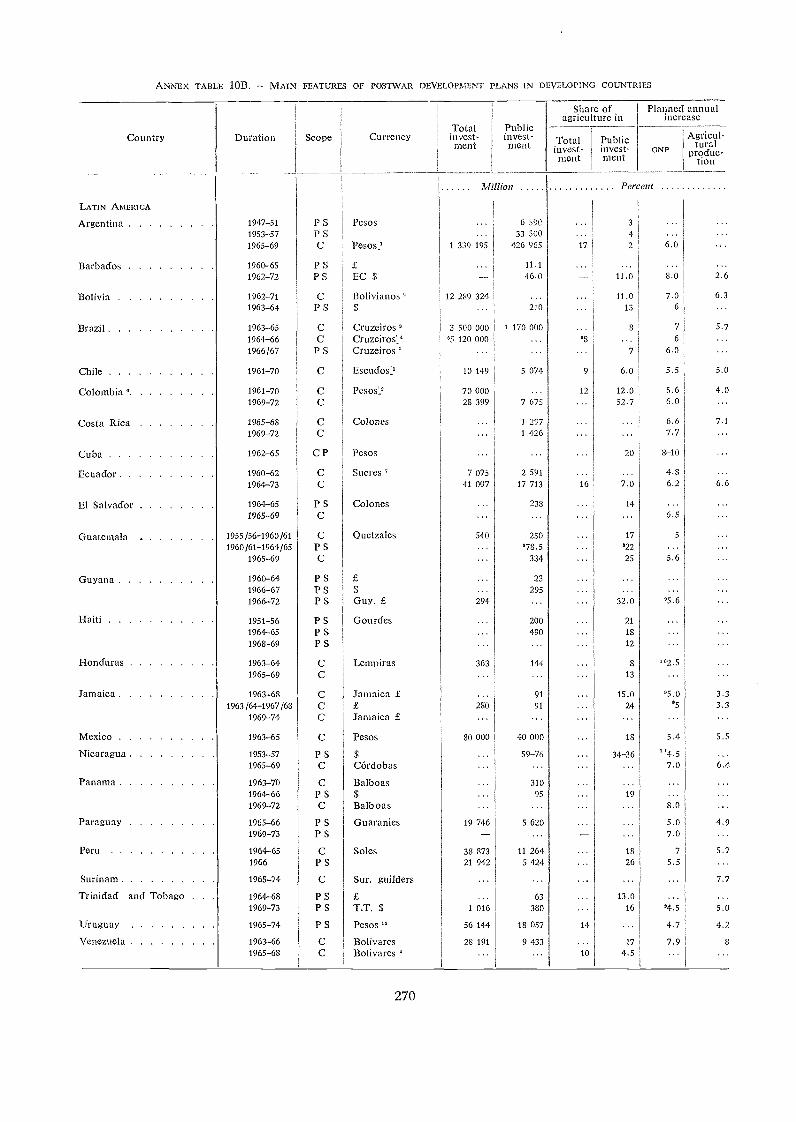
ANNEX TABLE 10B. - MAIN FEATURES OF POSTWAR DEVELOPMENT PLANS IN DEVELOPING COUNTRIES
270
Country Duration Scope CurrencyTotalinvest-
Publicinvest-
Sisare ofagriculture in
Planned annualincrease
Total Public Agricul-ment ment invest- invest- GNP tural
produc-ment merit tion
Million Percent
LATIN AMERICA
Argentina 1947-51 P S Pesos 6 590 3
1953-571965-69
P S ,
C Pesos.'...
1 339 19533 500
426 965 17
4
2 6.0
Barbados 1960-65 P S f 11.1 ... ...1962-72 P S EC S 46.0 -- 11.0 8.0 2.6
Bolivia 1962-71 C Bolivianos 12 289 324 11.0 7.0 6.31963-64 l' S $ ... 210 13 6 ...
Brazil 1963-65 c Cruzeiros ' 3 500 000 1 170 000 7 5.71964-66 C Cruzeiros:' 05 120 000 s8 6 ...1966/67 P S Cruzeiros ' ... 7 6.0
Chile 1961-70 C Escudos; 10 149 5 074 9 6.0 5.5 5.0
Colombia ° 1961-70 C Pesos' 70 000 ... 12 12.0 5.6 4.01969-72 C 28 399 7 675 52.7 6.0 ..
Costa Rica 1965-63 c Colones ... 1 297 6.6 7.11969-72 C 1 426 7.7
Cuba 1962-65 C P Pcsos ... 20 8-10
Ecuador 1960-62 c Sucres 7 7 075 2 591 4.81964-73 C 41 007 17 713 16 7.0 6.2 6.6
El Salvador 1964-65 P S Colones 238 14
1965-69 C 6.5
Guatemala 1955/56-1960/61 C Quetzales 540 250 17 5
1960/61-1964/65 P S ... 878.5 022
1965-69 C ... 334 25 5.6
Guyana 1960-64 P S E . - 23
1966-67 P S $ ... 295 ...1966-72 P S GUY. E 294 ... 32.0 05.6
Haiti 1951-56 P S Gourdes ... 200 ... 21
1964-65 P S ... 490 18
1968-69 P S ... ... 12
Honduras 1963-64 C Lempiras 363 144 ... 8 002.5 '''1965-69 c ... .. 13
Jamaica 1963-68 c Jamaica E ... 91 15.0 '5.0 3.31963 /64-1967 /68 C E 280 91 ... 24 .5 3.3
1969-74 C Jamaica £ ... ... ..
Mexico 1963-65 C Pesos 80 000 40 000 18 5.4 5.5
Nicaragua 1953-57 P S $ 59-76 34-36 ' '4.5 ...1965-69 c Córdobas ... ... 7.0 6.4
Panama 1963-70 C Balboas ... 310 ...1964-66 P S $ ... 95 19 ..1969-72 C Balboas ... ... 8.0 ...
Paraguay 1965-66 P S Guaranies 19 746 5 620 ... 5.0 4.91969-73 P S - .. - 7.0 .
Peru 1964-65 C Soles 38 373 11 264 18 7 5.71966 P S 21 942 5 424 26 5.5 ...
Surinam 1965-74 C Sur. guilders 7.7
Trinidad and Tobago . . . 1964-68 P S E ... 63 13.0 ...1969-73 P S T.T. $ I 016 380 ... 16 04.5 5.0
Uruguay 1965-74 P S Pesos 1' 56 144 18 057 14 4.7 4.2
Venezuela 1963-66 c Bolívares 28 191 9 433 ... 17 7.9 S
1965-68 c Bolivares " ... ... 10 4.5 ...
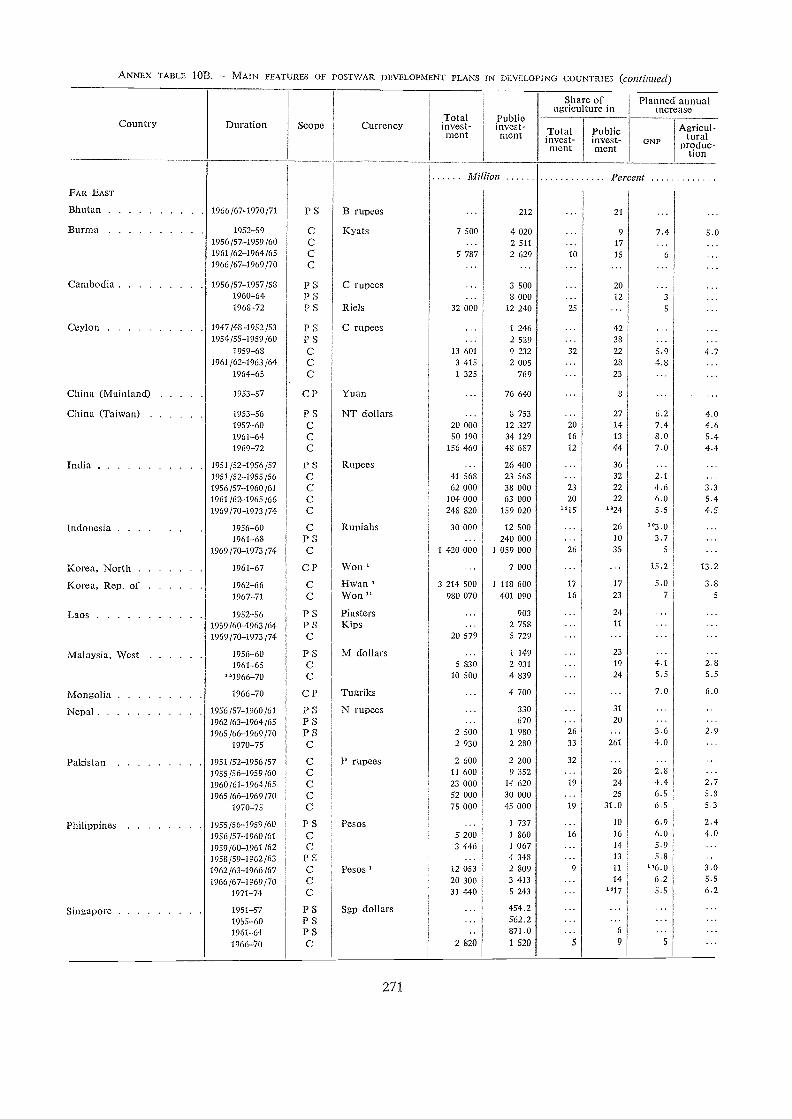
ANNEX TA13LE 10B. - MAIN FEATURES OF POSTWAR DEVELOPMENT PLANS IN DEVELOPING COUNTRIES (continued)
271
Country Duration Scope CurrencyTotalinvest-ment
Publicinvest-ment
Share ofagriculture in
Planned annualincrease
Totalinvest-
Publicinvest-
Agrieul-tural
merit mentGNP produc-
tion
Million Per ent
FAR EAST
Bhutan 1966/67-1970/71 P S B rupees ... 212 ... 21 ...Burma 1952-59 c Kyats 7 500 4 020 9 7.4 5.6
1956/57-1959/60 C ... 2 511 17 ...' '1961/62-1964/65 C 5 787 2 629 10 15 6 ...
1966/67-1969/70 c ... ....
. .
Cambodia 1956/57-1957/58 P S C rupees ... 3 500 20 ...1960-64 P S ... S 000 ... 12 31968-72 P S Riels 32 000 12 240 25 ... 5 ...
Ceylon 1947 /43 -1952 /53 P S C rupees 1 246 ... 421954/55-1959/60 P S ... 2 529 - 38 ... ...
1959-68 C 13 601 9 232 32 22 5.9 4.71961/62-1963/64 C 3 415 2 005 ... 28 4.8 ...
1964-65 C 1 325 769 - 23 ... ...China (Mainland) 1953-57 C P Yuan 76 640 8 ... ...
r.',Ilina (Taiwan) 1953-56 P S NT dollars ... 8 753 ... 27 6.2 4.01957-60 C 20 000 12 327 20 14 7.4 4.61961-64 C 50 190 34 129 16 13 8.0 5.41969-72 C 156 460 48 687 12 44 7.0 4.4
India 1951/52-1956/57 P S Rupees 26 400 36 ... ...1951/52-1955/SO C 41 568 23 568 32 2.1 ...1956/57-1960/61 C 62 000 38 000 23 22 4.6 3.31961/62-1965/66 C 104 000 63 000 20 22 6.0 5.41969/70-1973/74 C 248 820 159 020 ,,15 "24 5.5 4.5
Indonesia 1956-60 C Rupiahs 30 000 12 500 26 "3.0 ...1961-68 P S 240 000 ... 10 3.7 ...
1969 /70-1973 /74 C 1 420 000 1 059 000 26 35 5 ...
Korea, North 1961-67 C P Won ' ... 7 000 - - 15.2 13.2
Korea, Rep. of 1962-66 C Hwan ' 3 214 500 1 118 600 17 17 5.0 3.81967-71 C Won " 980 070 401 090 16 23 7 5
Laos 1952-56 P S Piasters 903 24 ... ...1959/60-1963/64 P S Kips 2 758 11
1969 /70-1973 /74 C 20 579 5 729
Malaysia, West 1956-60 P S M dollars 1 149 23 ... ...1961-65 c 5 830 2 931 ... 19 4.1 2.8
"1966-70 C 10 500 4 839 24 5.5 5.5
Mongolia 1966-70 Cl' Tugriks 4 700 - ... 7.0 6.0
Nepal 1956/57-1960/61 P S N rupees ... 330 31 ... ...1962/63-1964/65 P S 670 20 ... ...1965/66-1969/70 P S 2 500 1 980 26 ... 3.6 2.9
1970-75 C 2 930 2 280 33 261 4.0 ...
Pakistan 1951/52-1956/57 C P rupees 2 600 2 200 32 ... ...1955/56-1959/60 C 11 600 9 352 ... 26 2.8 ...1960/61-1964/65 C 23 000 14 620 19 24 4.4 2.7
1965 /66-1969 /70 C 52 000 30 000 .. 25 6.5 5.8
1970-75 e 75 000 45 000 19 31.0 6.5 5.3
Philippines 1955/56-1959/60 P S Pesos ... 1 737 ... 10 6.9 2.4
1956/57-1960/61 C 5 200 1 860 16 16 6.0 4.01959/60-1961/62 c 3 446 1 067 ... 14 5.9 ...1958/59-1962/63 1' S 4 348 ... 13 5.8 ...1962/63-1966/67 c Pesos ' 12 053 2 809 9 11 "6.0 3.0
1966/67-1969/70 C 20 300 3 413 ... 14 6.2 5.5
1971-74 C 31 440 5 243 1.17 5.5 6.2
Singapore 1951-57 P S Sgp dollars ... 454.2 ...1955-60 P S ... 562.2 ... ...1961-64 P S ... 871.0 ... 6 ... ...1966-70 C 2 820 1 520 5 9 5 .
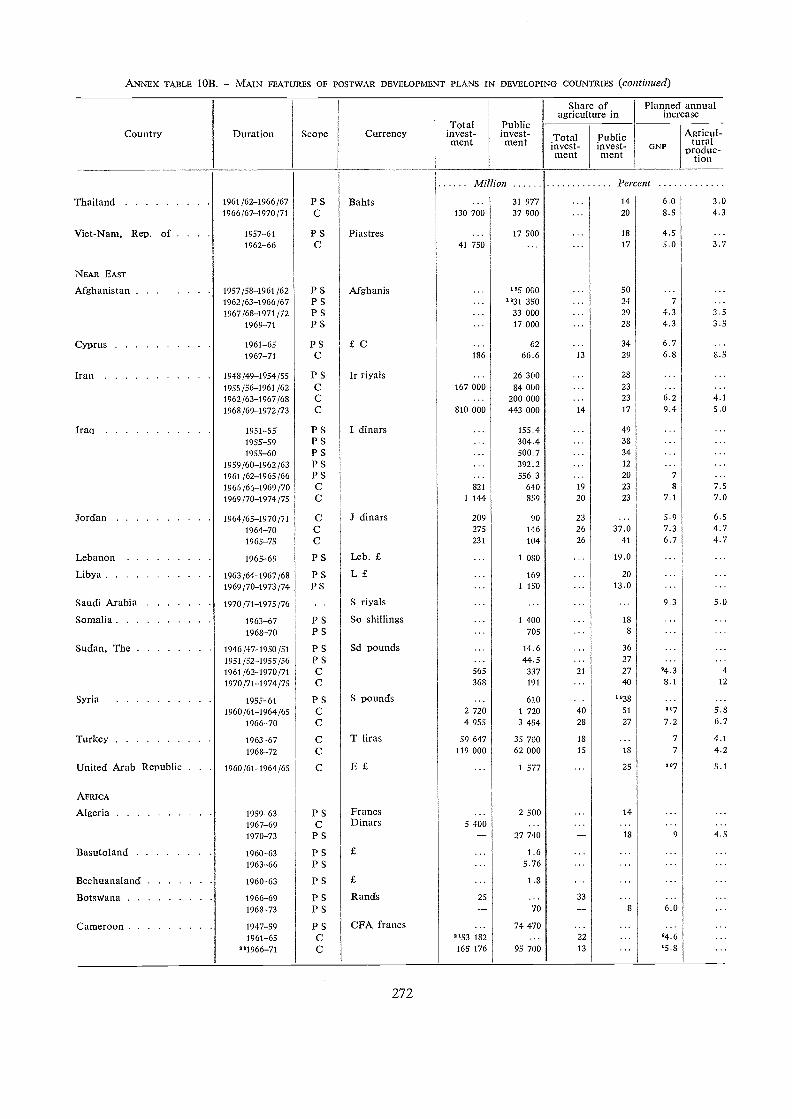
ANNEX TABLE 10B. - MAIN FEATURES OF POSTWAR DEVELOPMENT PLANS IN DEVELOPING COUNTRIES (continued)
272
Share ofagriculture in
Planned annualincrease
Total PublicCountry Duration Scope Currency invest-
mentinvest-ment -
TotalInvest-
Publici nvest- GNP
Agricul-tural
ment ment prqduc-non
Million Percent
Thailand 1961/62-1966/67 P S Bahts 31 977 14 6.0 3.01966/67-1970/71 C 130 700 37 900 20 8.5 4.3
Viet-Nam, Rep. of . . . . 1957-61 P S Piastres ... 17 500 18 4.5 ...1962-66 C 41 750 17 5.0 3.7
NEAR EAST
Afghanistan 1957/58-1961 /62 P S Afghanis '25 000 .. . 50 ...1962/63-1966/67 P S 31 350 24 7 ...1967/68-1971/72 P S ... 33 000 29 4.3 3.5
1969-71 P S 17 000 28 4.3 3.5
Cyprus 1961-65 P S E C ... 62 34 6.7 ...1967-71 C 186 66.6 13 29 6.8 8.5
Iran 1948/49-1954/55 P S Ir riyals 26 300 28 ... ...1955/56-1961/62 C 167 000 84 000 ... 23 ... ...1962/63-1967/68 C ... 200 000 23 6.2 4.1
1968/69-1972/73 c 810 000 443 000 14 17 9.4 5.1
Iraq 1951-55 P S I dinars 155.4 49 ...1955-59 P S 304.4 38
1955-60 P S 500.7 34 ...1959/60-1962/63 P S . 392.2 12
1961 /62-1965 /66 P S ... 556.3 20 7 ...1965/65-1969/70 C 821 640 19 23 8 7.5
1969/70-1974/75 c 1 144 859 20 23 7.1 7.1
Jordan 1964/65-1970/71 C J dinars 209 90 23 ... 5.9 6.5
1964-70 c 275 146 26 37.0 7.3 4.'1
1965-75 c 231 104 26 41 6.7 4.1
Lebanon 1965-69 P S Leb. E 1 080 ... 19.0 ...
Libya 1963/64-1967/68 P S L E 169 20
1969/70-1973/74 P S 1 150 ... 13.0 ... ...
Saudi Arabia 1970/71-1975/76 ... S riyals ... 9.3 5.1
Somalia 1963-67 P S So shillings 1 400 18
1968-70 P S . 705 8 ...Sudan, The 1946/47-1950/51 P S Sd pounds 14.6 36
1951/52-1955/56 P S 44.5 ... 27 ...1961/62-1970/71 C 565 337 21 27 04.3
1970/71-1974/75 c 368 191 40 8.1 1:
Syria 1955-61 P S S pounds ... 610 ... .981960/61-1964/65 C 2 720 1 720 40 51 207 5.
1966-70 c 4 955 3 454 28 27 7.2 6.1
Turkey 1963-67 C T liras 59 647 35 700 18 ... 7 4.1
1968-72 c 119 000 62 000 15 18 7 4.:
United Arab Republic . . . 1960/61-1964/65 C E E ... 1 577 25 007 5.1
AFRICA
Algeria 1959-63 p s Francs ... 2 500 14
1967-69 c Dinars 5 400 ... ...1970-73 P S - 27 740 - 18 9 4.5
Basutoland 1960-63 P s E 1.6 ...1963-66 P S 5.76
Bechuanaland 1960-63 p5 i ... 1.8 ...
Botswana 1966-69 P S Rands 25 ... 33 ... ...1968-73 P S - 70 - 8 6.0
Cameroon 1947-59 P S CFA francs ... 74 470 ... ... ...1961-65 c 2053 182 ... 22 24.6
'21966-71 c 165 176 95 700 13 ... 25.8
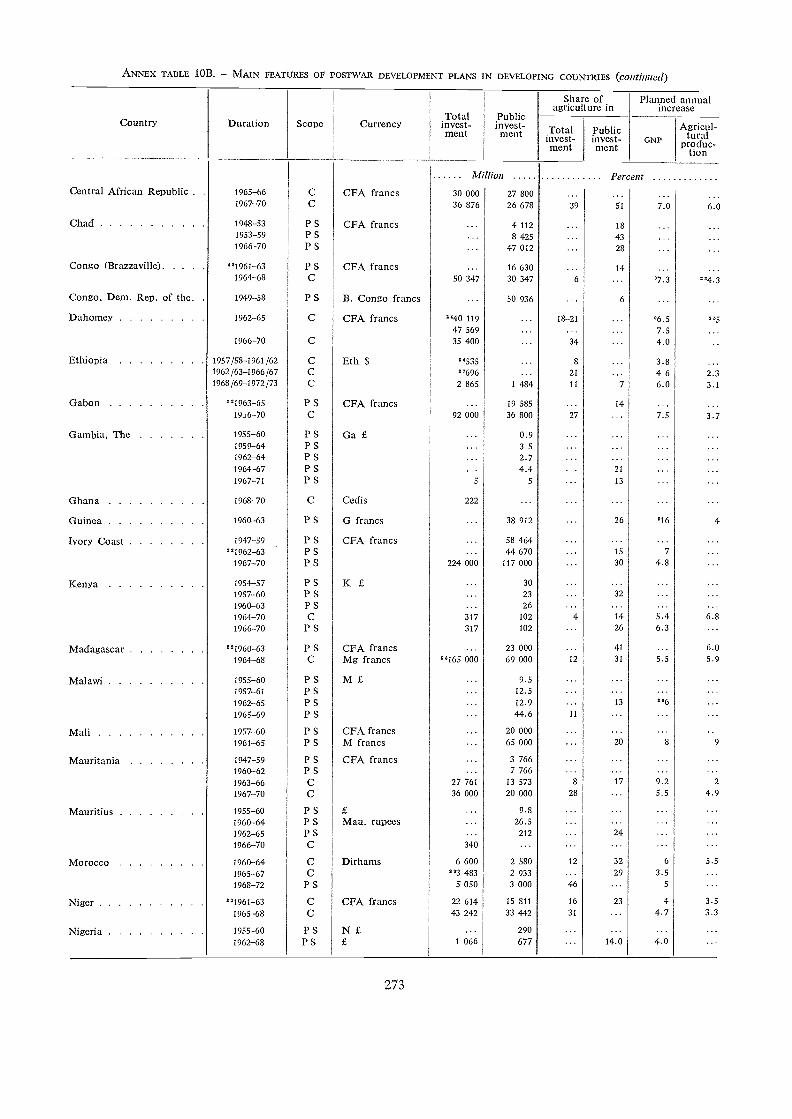
ANNEX TABLE 10B. - MAIN FEATURES OF POSTWAR DEVELOPMENT PLANS IN DEVELOPING COUNTRIES (continued)
273
Country Duration SCOPe CurrencyTotalinvest-ment
Publicinvest-ment
Share ofagriculture in
Planned annualincrease
Totalinvest-ment
Publicinvest-ment
GNP
Agricul-tural
produc-tion
Million PercentCentral African Republic . . 1965-66 C CFA francs 30 000 27 800 ... ... ... ...
1967-70 C 36 876 26 678 39 51 7.0 6.0
Chad 1948-53 P S CFA francs 4 112 18 ... ...1953-59 P S 8 425 431966-70 P S 47 012 ... 28
Congo (Brazzaville) "1961-63 P S CFA francs ... 16 630 ... 14 ... ...1964-68 C 50 347 30 347 6 ... 97.3 "4.3
Congo, Dem. Rep, of the. . 1949-58 P S B. Congo francs ... 50 936 ... 6 ... ...Dahomey 1962-65 C CFA francs "40 119 18-21 '6.5 .45
47 569 ... ... ... 7.5 ...1966-70 C 35 400 ... 34 4.0
Ethiopia 1957/58-1961/62 C Eth $ "535 8 3.81962/63-1966/67 C "696 ... 21 ... 4.6 2.31968/69-1972/73 C 2 865 1 484 11 7 6.0 3.1
Gabon "1963-65 P S CFA francs 19 585 ... 14 ... ...19.,6-70 C 92 000 36 800 27 ... 7.5 3.7
Gambia, The 1955-60 P S Ga £ 0.9 ...1959-64 P S ... 3.51962-64 P S .. 2.7 ...1964-67 P S 4.4 21 ...1967-71 P S 5 5 13
Ghana 1968-70 C Cedis 222 ...
Guinea 1960-63 P S G francs 38 912 ... 26 916 4
Ivory Coast 1947-59 P S CFA francs 58 464"1962-63 P S 44 670 15 7
1967-70 P S 224 000 117 000 30 4.8
Kenya 1954-57 P S K £ 30
1957-60 P S 23 32
1960-63 P S 26 ...1964-70 C 317 102 4 14 5.4 6.81966-70 P S 317 102 . 26 6.3 ...
Madagascar "1960-63 P S CFA francs ... 23 000 . 41 ... 6.01964-68 C Mg francs "165 000 69 000 12 31 5.5 5.9
Malawi 1955-60 P S M E 9.51957-61 P S ... 12.51962-65 P S 12.9 ... 13 "6 ...1965-69 P S 44.6 11 ... ...
Mali 1957-60 P S CFA francs 20 000 - ...1961-65 P S M francs ... 65 000 20 8 9
Mauritania 1947-59 P S CFA francs 3 7661960-62 P S ... 7 7661963-66 C 27 761 13 573 8 17 9.2 2
1967-70 C 36 000 20 000 28 ... 5.5 4.9
Mauritius 1955-60 P S E 9.8 ' " ' '
1960-64 P S Mau. rupees 26.5 ...1962-65 P S 212 ... 24
1966-70 C 340 ...Morocco 1960-64 C Dirhams 6 600 2 580 12 32 6 5.5
1965-67 C "3 483 2 933 29 3.51968-72 P S 5 050 3 000 46 5
Niger "1961-63 C CFA francs 22 614 15 811 16 23 4 3.51965-68 C 43 242 33 442 31 ... 4.7 3.3
Nigeria 1955-60 P S N E ... 290 ...1962-68 P S E 1 066 677 14.0 4.0
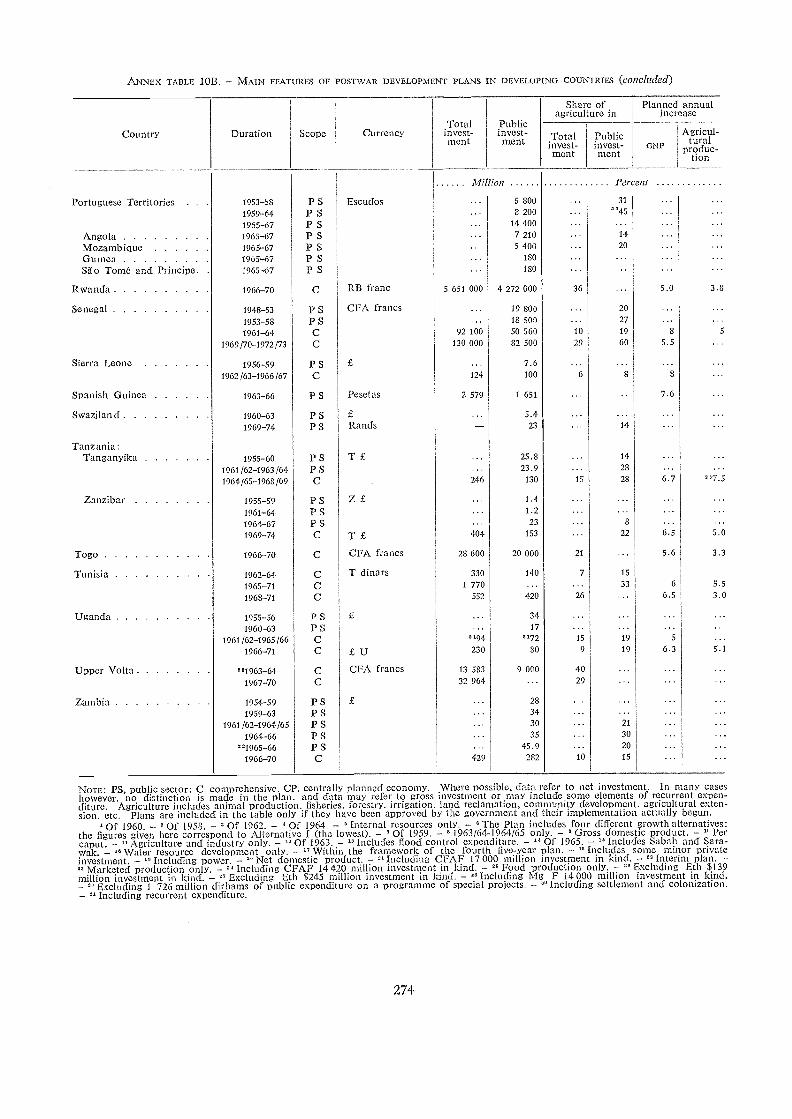
ANNE"( TABLE 10B. - MAIN FEATuREs OF POSTwAR DEvELOPmENT PLANs IN DEVELOPING COUNTRIES (concluded)
NOTE: PS, public sector; C, comprehensive. CP, centrally planned economy. Where possible, data refer to net investment. In many caseshowever, no distinction is made in the plan, and data may refer to gross investment Or may include some elements of recurrent expen-diture. Agriculture includes animal production, fisheries, forestry, irrigation, land reclamation, community development, agricultural exten-sion, etc. Plans are included in the table only if they have been approved by the government and their implementation actually begun.
Of 1960. - 'Of 1958. - Of 1962. - Of 1964, - 'Internal resources only. - 'The Plan includes four different growth alternatives;the figures given here correspond to Alternative I (the lowest). - ' Of 1959. - 1963/64-1964/65 only. - ° Gross domestic product. - 0 Percaput. - " Agriculture and industry only. - Of 1963. - "Includes flood control expenditure. - " Of 1965. - " Includes Sabah and Sara-wak. - " Water resource development only. - " Within the framework of the fourth five-year plan. - Includes some minor privateinvestment. - " Including power. - " Net domestic product. - Including CFAF 17 000 million investment in kind. - Interim plan. -" Marlceted production only. - " Including CFAF 14 420 million investment in kind. - " Food production only. - " Excluding Eth $139million investment in kind. - " Excluding Eth $245 million investment in k-incf. - "Including Mg F 14 000 million investment in kind.
Exefifiling 1 726 million dirharrts of public expenditure on a programme of special projects. - '*Including settlement and colonization."Including recurrent expenditure.
274
Country Duration Scope CurrencYTotalinvest-
Publicinvest-
Share ofagriculture in
Planned annualincrease
Total Public Agricul -ment ment invest-
mentinvest-ment GNP
turalproduc-
don
Million Percent
Portuguese Territories . . . 1953-58 P S Escudos ... 5 800 ... 31 ... ...1959-64 P S ... 8 200 ''45 ... ...1965-67 P S 14 400
Angola 1965-67 P S ... 7 210 ... 14 ... ...Mozambique 1965-67 P S . 5 400 ... 20 ... ...Guinei 1965-67 P S 180 ... ... ... ...Sdo Tome and Principe. . 1965-67 P S ... 180 " ... ... ...
Rwanda 1966-70 C RB franc 5 651 000 4 272 000 36 ... 5.0 3.8
Senegal 1948-53 p s CFA francs ... 19 800 ... 20 ... .. .
1953-58 P S ... 18 500 " ' 27 ... ...1961-64 C 92 100 50 560 10 19 S 5
1969/70-1972/73 C 1 30 000 82 500 29 60 5.5 ...
Sierra Leone 1956-59 p5 . 7.6 ... ... .
1962/63-1966/67 C 124 100 6 8 8
Spanish Guinea 1963-66 p S Pesetas 2 579 1 651 ... ... 7.6 ...
Swazilan d 1960-63 rs E 5.4 ... ... ...1969-74 P S Rands 23 ... 14 ... ...
Tanzania:Tanganyika 1955-60 rs T E . .. 25.8 ... 14 ... ...
1961/62-1963/64 P5 ... 23.9 ... 28 ...1964/65-1968/69 C 246 130 15 28 6.7 .7.5
Zanzibar 1955-59 p s Z £ 1.4 ... ... .. ...1961-64 P5 ... 1.2 ... ... ... ...1964-67 P S ... 23 ... 8 ... ...1969-74 C T £ 404 153 ... 22 6.5 5.0
Togo 1966-70 c CFA francs 28 600 20 000 21 ... 5.6 3.3
Tunisia 1962-64 C T dinars 330 140 7 15
1965-71 C 1 770 ... ... 33 6 5.5
1968-71 C 552 420 26 ... 6.5 3.0
Uganda 1955-56 P s i ... 34 ... ... ... ...1960-63 P S ... 17 ... ...
1961 /62-1965/66 C "94 "72 15 19 5 .
1966-71 C £ U 230 80 9 19 6.3 5.1
Upper Volta "1963-641967-70
CC
CFA francs 13 58332 964
9 000...
4029
...
.........
...
Zambia 1954-591959-63
P SP S
... 2834
...
.........
...
.....,
1961/62-1964/65 P S 30 ... 21 ... ..1964-66 P S ... 35 ... 30 ... ..
"1965-66 P S ... 45.9 ... 20 ...1966-70 C 429 282 10 15 ... ..
SALES AGENTS AND BOOKSELLERS FOR FAO PUBLICATIONS
Societe nationale d'édition et de diffusion (SNED), Algiers.
Libreria de las Naciones Cooperativa Ltda., Alsina 500, Buenos Aires.
Hunter Publications, 23 McKillop Street, Melbourne C.1 ; The Assistant Director, Sales andDistribution, Government Printing Office, P.O. Box 84, Canberra, A.C.T. 2600, and outletsin each state capital city.
Wilhelm Frick Buchhandlung, Graben 27, Vienna I.
Agence et Messageries de la Presse, 1 rue de la Petite-Ile, Brussels 7.
Libreria y Editorial " Juventud," Plaza Murillo 519, La Paz ; Librería Alfonso Tejerina, Comer-cio 1073, La Paz.
Livraria Mestre Jou, Rua Martins Fontes 99, Sfio Paulo ; Rua Senador Dantas, 19-S205/206, Riode Janeiro.
Hemus, 11 place Slaveikov, Sofia.
" Le monde noir," B.P. 736, Yaounde.
Information Canada, Ottawa.
M.D. Gunasena and Co. Ltd., 217 Norris Road, Colombo 11.
Biblioteca, FAO Oficina Regional para América Latina, Av. Providencia 871, Casilla 10095,Santiago ; Librerías Renacimiento, Amunategui 458, Santiago ; Editorial y Distribuidora OrbeLtda., Galería Imperio 256, Santiago ; Sergio Feliú Cía. Ltda., " Chile Libros," Av. SantaMaría 281, Santiago.
" Agricultura Tropical," Avenida Jiménez No 7-25, Ofcs. 811/816, Bogotá ; Librería Central,Calle 14, No 6-88, Bogotá.
Imprenta y Librería Trejos, S.A., Apartado 1313, San José.
Instituto del Libro, Calle 19 y 10 No 1002, Vedado.
MAM, P.O. Box 1722, Nicosia.
Ejnar Munksgaard, Norregade 6, Copenhagen S.
Librerfa Universitaria, García Moreno 739, Quito ; Su Librería, Plaza de Independencia, Quito.
Librería Cultural Salvadoreña S.A., 6. Calle Oriente 118, Edificio San Martin, San Salvador.
International Press Agency, P.O. Box No. 120, Addis Ababa.
Akateeminen Kirjakauppa, 2 Keskuskatu, Helsinki.
Editions A. Pedone, 13 rue Soufflot, Paris 55.
Paul Parey, Lindenstrasse 44-47, Berlin SW 61.
" Eleftheroudakis," 4 Nikis Street, Athens; Institute of Scientific Publications, 9 AmerikisStreet, Athens.
Sociedad Económico Financiera, Edificio " El Cielito," Despacho 222, Zona 1, Guatemala.
Max Bouchereau, Librairie "A la Caravelle," B.P. 111B, Port-au-Prince.
Swindon Book Co., 13-15 Lock Road, Kowloon.
Snaebjörn Jónsson and Co. h.f., Hafnarstraeti 9, P.O. Box 1131, Reykjavik.
Oxford Book and Stationery Co., Scindia House, New Delhi ; 17 Park Street, Calcutta.
Pembangunan Ltd., 84 Gunung Sahari, Jakarta.
Economist Tehran, 99 Sevom Esfand Avenue, Tehran.
Mackenzie's Bookshop, Baghdad.
The Controller, Stationery Office, Dublin.
Emanuel Brown, formerly Blumstein's Bookstores Ltd., P.O. Box 4101, 35 Allenby Road, andNachlat Benyamin Street, Tel Aviv.
Libreria Internazionale Rizzoli, Largo Chigi, Rome : A.E.I.O.U., Via Meravigli 16, Milan ; Li-breria Commissionaria Sansoni, S.p.A., Via Lamarmora 45, Florence ; Libreria Macchiaroli,Via Carducci 55/59, 80121 Naples.
Maruzen Company Ltd., P.O. Box 5050, Tokyo International 100-31.
The E.S.A. Bookshop, P.O. Box 30167, Nairobi ; University Bookshop, University College,P.O. Box 30197, Nairobi.
The Eul-Yoo Publishing Co. Ltd., 5 2-Ka, Chong-ro, Seoul.
Dar Al-Maaref Liban S.A.L., place Riad El-Solh, B.P. 2320, Beirut.
Caxton Stationers Ltd., 13-15 Leboh Pasar Besar, Kuala Lumpur.
Nalanda Company Limited, 30 Bourbon Street, Port Louis.
Manuel Gomez Pezuela e Hijo, Donceles 12, México, D.F. ; Editorial Iztaccihuatl, S.A., MiguelSchultz 21, Mexico 4, D.F. ; Av. Morelos Ote 437, Monterrey, N.L. ; Colón 175, Guadalajara, Jal.
Algeria
Argentina
Australia
Austria
Belgium
Bolivia
Brazil
Bulgaria
Cameroon
Canada
Ceylon
Chile
Colombia
Costa Rica
Cuba
Cyprus
Denmark
Ecuador
El Salvador
Ethiopia
Finland
France
Germany
Greece
GuatemalaHaitiHong KongIceland
India
Indonesia
IranIraq
IrelandIsrael
Italy
Japan
Kenya
KoreaLebanon
Malaysia
MauritiusMexico
Morocco
Netherlands
New Zealand
Nicaragua
Nigeria
Norway
Pakistan, East
Pakistan, West
Panama
Paraguay
Peru
Philippines
Poland
Portugal
Romania
Saudi Arabia
South Africa
Spain
Sweden
Switzerland
Syria
Taiwan
Tanzania
Thailand
Togo
Turkey
Uganda
United Arab Republic
United Kingdom
United Statesof America
Uruguay
Venezuela
Yugoslavia
Other countries
SALES AGENTS AND BOOKSELLERS FOR FAO PUBLICATIONS
Librairie " Aux Belles Images," 281 avenue Mohammed V. Rabat.
N.V. Martinus Nijhoff, Lange Voorhout 9, The Hague.
Government Printing Office : Government Bookshops at Rutland Street, P.O. Box 5344,Auckland ; Mulgrave Street, Private Bag. Wellington ; 130 Oxford Terrace, P.O. Box 1721,Christchurch ; Princes Street, P.O. Box 1104, Dunedin ; Alma Street, P.O. Box 857,Hamilton.
Librería Universal, 15 de Septiembre 301, Managua.
University Bookshop Nigeria Ltd., University College, lbadan.
Johan Grundt Tanum Forlag, Karl Johansgt. 43, Oslo.
Shilpa Niketan, 29 D.I.T. Super Market, Mymensingh Road, Dacca-2.
Mirza Book Agency, 65 The Mall, Lahore 3.
Agencia Internacional de Publicaciones J. Menéndez, Apartado 2052, Panama.
Agencia de Librerías de Salvador Nizza, Calle Pte. Franco N^ 39-43, Asunción.
Librería Internacional del Perú, S.A., Casilla 1417, Lima; Librería La Universidad, Av. Nicolásde Piérola 639, Lima; Librería Studium, Amargura 939, Lima; Distribuidora Inca, EmilioAlthaus 470, Lince, Lima.
The Modern Book Company, 928 Rizal Avenue, Manila.
Ars Polona, Krakowskie Przedmiescie 7, Warsaw; Ruch Export-Import Enterprise, Ul. Wronia 23,\Narsaw.
Livraria Bertrand, S.A.R.L., Apartado 37, Amadora.
Cartimex, P.O. Box 134-135, Bucharest.
Khazindar Establishment, King Faysal Street, Riyadh.
Van Schaik's Book Store Ltd., P.O. Box 724, Pretoria.
Librería Mundi-Prensa, Castello 37, Madrid; Librería Agrícola, Fernando VI, 2, Madrid 4; JoséBosch, Librero, Ronda Universidad 11, Barcelona; " Adlha," Av. General Mitre 100, Barce-lona; Libreria General, S. Miguel 4, Saragossa.
C.E. Fritze, Fredsgatan 2, Stockholm 16; Universitetsbokhandel, Sveavägen 166, StockholmVa.; Gumperts A.B., Goteborg.
Librairie Payot S.A., Lausanne and Geneva; Hans Raunhardt, Kirchgasse 17, Zurich 1.
Librairie Internationale, B.P. 2456, Damascus.
The World Book Company Ltd., 99 Chungking South Road, Section 1, Taipeh.
Dar es Salaam Bookshop, P.O. Box 9030, Dar es Salaam.
FAO Regional Office for Asia and the Far East, Maliwan Mansion, Bangkok; Suksapan Panit,Mansion 9, Rajadamnern Avenue, Bangkok.
Librairie du Bon Pasteur, B.P. 1164, Lomé.
L'ibrairie Hachette, 469 Istiklal Caddesi, Beyoglu, Istanbul.
The E.S.A. Bookshop, P.O. Box 2615, Kampala.
Librairie Hachette, 45 bis rue Champollion, Cairo; Al Ahram, El Galas St., Cairo.
Her Majesty's Stationery Office, 49 High Holborn, London, W.C.1; P.O. Box 569, London,5.E.1. (Trade and London area mail orders); 13a Castle Street, Edinburgh EH2 3AR; 109St. Mary Street, Cardiff CF1 11W; 7 Linenhall Street, Belfast BT2 8AY; Brazennose Street,Manchester M60 8AS; 258 Broad Street, Birmingham 1; 50 Fairfax Street, Bristol .BS1 3DE.
UNIPUB, Inc., 650 First Avenue, P.O. Box 433, New York, N.Y. 10016.
Editorial Losada Uruguaya S.A., Maldonado 1092, Montevideo; Barreiro y Ramos, 25 de Mayoesq. J.C. Gómez, Montevideo; Librería Albe, Soc. Com., Cerrito 566, Montevideo.
Suma S.A., Calle Real de Sabana Grande, Caracas; Librería Politécnica, Apartado 50738 SabanaGrande, Caracas; Librería del Este, Pericás S.A., Av. Fco. de Miranda 52, Edificio Galipán, Cara-cas; Librería Técnica Vega, Plaza Las Tres Gracias, Edificio Odeon, Los Chaguaramos, Caracas.
Jugoslovenska Knjiga, Terazije 27/11, Belgrade; Prosveta Export-Import Agency, Terazije 16,Belgrade; Cankarjeva Zalozba, P.O. Box 201 - IV, Ljubljana.
Requests from countries where sales agents have not yet been appointed may be sent to:Distribution and Sales Section, Food and Agriculture Organization of the United Nations,Via delle Terme di Caracalla, 00100 Rome, Italy.
FAO publications are priced in U.S. dollars and pounds sterling. Payment to FAO sales agents maybe made in /oca/ currencies.
Price: $7.50 or 60s [i 3] PP/A4700/11.70/E/1/7100