Embed Size (px)
Citation preview

THE STATE OF EDUCATION IN ARKANSAS2015 REPORT SUMMARY
W O R K I N G T O G E T H E R T O
A D V A N C E E D U C A T I O N

Dear Arkansan:
ForwARd Arkansas, a strategic partnership of the Winthrop Rockefeller Foundation,
Walton Family Foundation and Arkansas Board of Education, has been established to
develop a strategic plan to dramatically improve public education in Arkansas.
ForwARd has brought us together, a diverse group of Arkansas leaders with a wide
range of experiences, to form its steering committee. We are reaching out to educators,
parents, students, community leaders and policy makers across our state for input on
how to advance education and move Arkansas forward. Following careful review of
input from the community and based upon our understanding of where we stand today
(which we share with you in this report), we plan to complete and release a holistic plan
for P- 16 education.
We start this process from a position of strength. Arkansas has been successful in
improving access to education across all ages from pre- K to college. We have also
established policies and standards that should support improved student outcomes.
However, student outcomes are still far below our aspirations. Too few students are
graduating from our schools prepared for college and the workforce. Additionally, the
achievement gap is still significant despite recent gains.
ForwARd’s work will not stop with the release of a plan. ForwARd is committed to
working with the rest of Arkansas to change these outcomes in the coming years. And
the opportunity is great. Just to give one example: if we are able to bring Arkansas’s 6-
year college graduation rates up from 39% (among the lowest in the nation) just to the
national average of 57%, 11,000 more Arkansas students would graduate from college in
the next five years in 4- year public universities alone.1
Education is important to all of us. Let’s move ForwARd together.
Sincerely,
ForwARd Arkansas Steering Committee
Working Together to Advance Education
1

ForwARd Arkansas is a partnership of education,
business, government and civil society professionals
committed to improving public education in the state.
The group is currently conducting extensive research,
encouraging statewide discussion and developing a
holistic plan to strengthen public education.
ForwARd is organized by the Winthrop Rockefeller
Foundation, Walton Family Foundation and Arkansas
Board of Education, and advised by The Boston
Consulting Group (research and strategic planning), Eric
Rob & Isaac (web and report development), and The
Peacock Group (communications).
VISION: Every Arkansas student will graduate prepared
for success in college and the workplace
MISSION: To help Arkansas create one of the finest
public education systems in the nation
GOAL: To create a holistic strategic plan for P-16
education in Arkansas, with specific recommendations
for academically distressed schools and school districts,
that will provide actionable recommendations to shape
and guide the state’s time and resources to realize this
vision and mission
About ForwARd
Shane Broadway, Director, Arkansas Department of Higher Education
Toby Daughtery, Lead Recruiter and Outreach Coordinator, The STAND Foundation
Kim Davis, Board Member, Arkansas State Board of Education
Bill Dillard III, Vice President, Dillard’s Inc.
Marcy Doderer, President and CEO, Arkansas Children’s Hospital in Little Rock
Matt Dozier, President and CEO, Environmental and Spatial Technology (EAST) Initiative
Bob East, Co-Founder, East-Harding Inc.
Joyce Elliot, Arkansas State Senator
Melanie Fox, Co-Founder, J&M Foods
Diana Gonzales Worthen, Director, Project RISE at University of Arkansas at Fayetteville
Lavina Grandon, Founder and President, Rural Community Alliance
Johnny Key, Associate Vice President of University Relations, University of Arkansas
Tom Kimbrell, Superintendent, Bryant Public Schools
Ginny Kurrus, Former State President, Arkansas PTA
Michele Linch, Executive Director, Arkansas State Teachers Association
Hugh McDonald, President and CEO, Entergy Arkansas Inc.
Justin Minkel, Elementary School Teacher, Jones Elementary School in Springdale
David Rainey, Assistant State Director, JBHM Education Group
John Riggs IV, President, J.A. Riggs Tractor Company
Scott Shirey, Founder and Executive Director, KIPP Delta Public Schools
Ray Simon, Former Deputy Secretary, U.S. Department of Education
Kathy Smith, Senior Program Officer, Walton Family Foundation
LaDonna Spain, School Improvement Specialist, Arkansas Department of Education
Bob Watson, Former Superintendent, El Dorado Public Schools
Sherece West-Scantlebury, President and CEO, Winthrop Rockefeller Foundation
Darrin Williams, CEO, Southern Bancorp Inc.
Kenya Williams, Co-Chair, Strong-Community Leadership Alliance
For more information on the Steering Committee, please visit ForwardArkansas.org.
Steering Committee
2
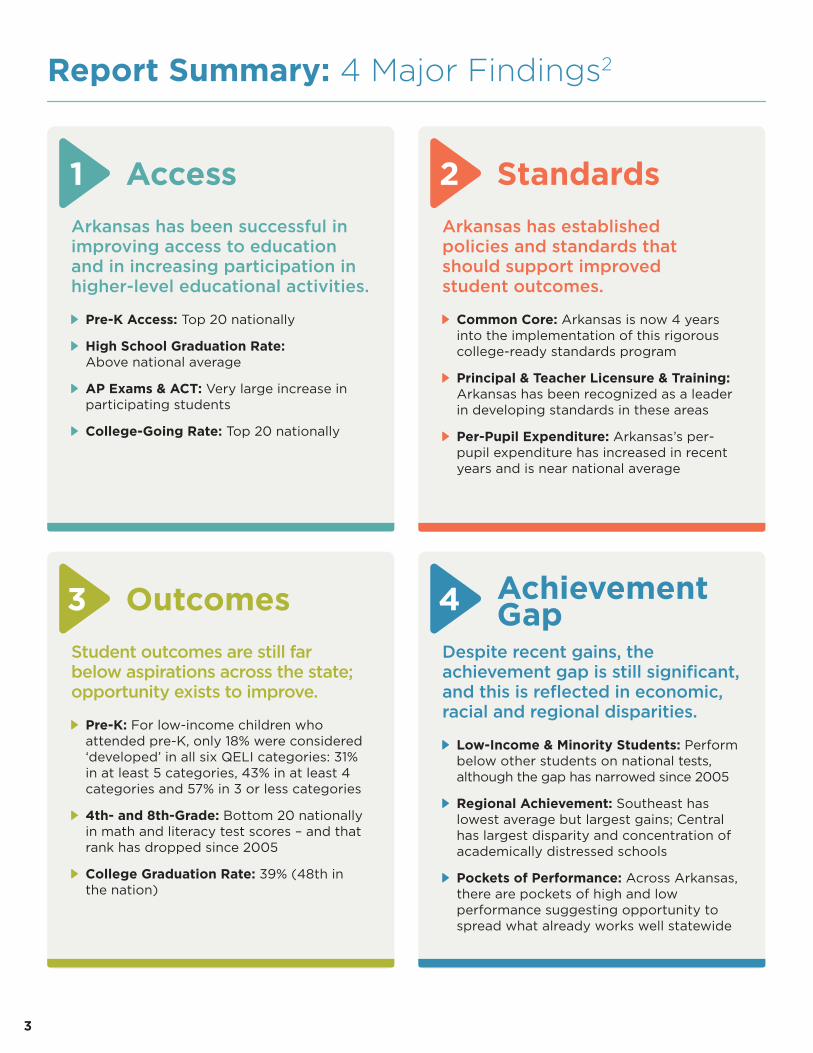
Report Summary: 4 Major Findings2
Access Standards
Outcomes AchievementGap
Arkansas has been successful in
improving access to education
and in increasing participation in
higher-level educational activities.
Pre-K Access: Top 20 nationally
High School Graduation Rate: Above national average
AP Exams & ACT: Very large increase in participating students
College-Going Rate: Top 20 nationally
Arkansas has established
policies and standards that
should support improved
student outcomes.
Common Core: Arkansas is now 4 years into the implementation of this rigorous college-ready standards program
Principal & Teacher Licensure & Training: Arkansas has been recognized as a leader in developing standards in these areas
Per-Pupil Expenditure: Arkansas’s per-pupil expenditure has increased in recent years and is near national average
Student outcomes are still far
below aspirations across the state;
opportunity exists to improve.
Pre-K: For low-income children who attended pre-K, only 18% were considered ‘developed’ in all six QELI categories: 31% in at least 5 categories, 43% in at least 4 categories and 57% in 3 or less categories
4th- and 8th-Grade: Bottom 20 nationally in math and literacy test scores – and that rank has dropped since 2005
College Graduation Rate: 39% (48th in the nation)
Despite recent gains, the
achievement gap is still significant,
and this is reflected in economic,
racial and regional disparities.
Low-Income & Minority Students: Perform below other students on national tests, although the gap has narrowed since 2005
Regional Achievement: Southeast has lowest average but largest gains; Central has largest disparity and concentration of academically distressed schools
Pockets of Performance: Across Arkansas, there are pockets of high and low performance suggesting opportunity to spread what already works well statewide
1 2
3 4
3

Pre-K
K-12
2012–13
2013–14
2013–14
3- & 4-year-olds enrolled$ per pupil
Number of school districtsAvg students/districtNumber of schoolsNumber of teachers4
Number of students% of students minority% of students qualifying for FRL5
$ per pupil6
Number of students in 2- or 4-year% of students in 4-year schools7
% of students minority8
39,000$5,514
2581,8411,08233,000475,00037%61%$9,411
181,00065%32%
Higher
Ed
Increase in number of students in
2- or 4-year colleges
Increase in percentage of students qualifying
for free or reduced lunch
Increase in percentage of
minority students
ARKANSASEDUCATION AT A GLANCE3
Trends in student populations
highlight the changing
landscape of Arkansas
education.
4

Ranked in the top 20 nationally for pre-K access49% of 3- and 4-year-olds (vs. 48% nationally)9
High school graduation rate above national average84% graduation rate (vs. 80% nationally)10
Very large recent increase in the number of students taking AP exams and the ACT Ranked 6th in the nation for students taking
AP exams11
Top 20 nationally for college-going rate65% of high school grads go on to college
(vs. 63% nationally)12
ACCESS Arkansas has been successful in
improving access to education
and in increasing participation
in higher-level educational
activities.
5
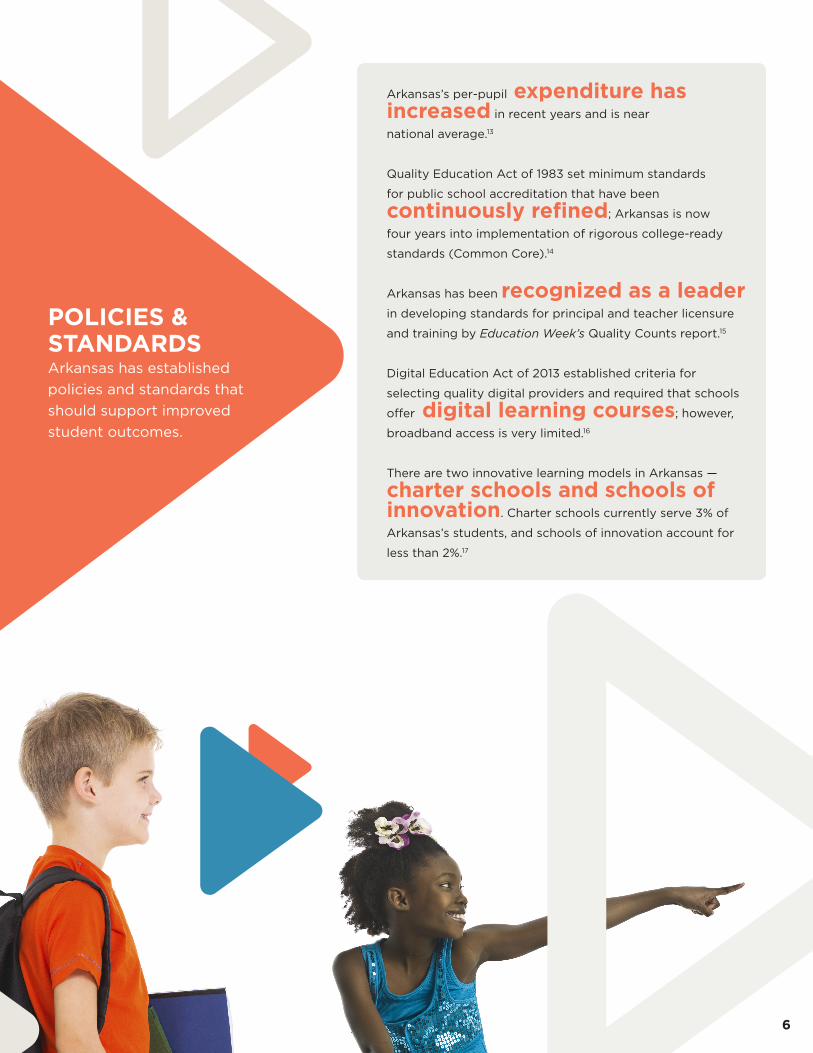
Arkansas’s per-pupil expenditure has increased in recent years and is near
national average.13
Quality Education Act of 1983 set minimum standards
for public school accreditation that have been
continuously refined; Arkansas is now
four years into implementation of rigorous college-ready
standards (Common Core).14
Arkansas has been recognized as a leader
in developing standards for principal and teacher licensure
and training by Education Week’s Quality Counts report.15
Digital Education Act of 2013 established criteria for
selecting quality digital providers and required that schools
offer digital learning courses; however,
broadband access is very limited.16
There are two innovative learning models in Arkansas —
charter schools and schools of innovation. Charter schools currently serve 3% of
Arkansas’s students, and schools of innovation account for
less than 2%.17
POLICIES & STANDARDSArkansas has established
policies and standards that
should support improved
student outcomes.
6

OUTCOMES Student outcomes are still far
below aspirations across the state;
opportunity exists to improve.
Pre-K helps children, especially low
income, build skills for kindergarten and beyond; however
further evaluation and adjustments may be needed.
For low-income children who attended pre-K, only 18%
were considered ‘developed’ in all six QELI categories:
31% in at least 5 categories, 43% in at least 4 categories,
and 57% in 3 or less categories.18
Arkansas ranks in the bottom 20 states
on 4th- and 8th-grade national tests in math and literacy.19
26 schools and two school districts have been placed in
Academic Distress.20
Only 20% of students taking the ACT met college-
ready benchmarks in all four subjects.21
Almost half of all students enrolling in 2- and
4-year public universities in Arkansas
require remedial coursework.22
Arkansas’s college graduation rate and degree
attainment rate are among the lowest in the nation.23
7

ACHIEVEMENT GAPDespite recent gains, the
achievement gap is still significant,
and this is reflected in economic,
racial and regional disparities.
Regional
Challenges
Top and bottom 10%
based on Augmented
Benchmark Exams
proficiency for schools
serving grades 3–8Top 10%
Bottom 10%
NE
SE
C
NW
SW
Students in NW have the highest math
and literacy proficiency; students in SE
have the lowest (Average, grades 3-8)
Most students in NW attend schools
in top 50% of performance; most in
SE attend schools in bottom 50%
Minority and FRL-eligible population has grown statewide; Southeast has the highest
concentration.24
Minority and FRL-eligible students perform below other students on national
tests, although the gap has narrowed since 2005.25
Arkansas has high- and low-performing schools in
every region, but access to high-performing schools
varies significantly by region.26
Source: Office of Education Policy Benchmark Exam database 2013-14
8

There’s no doubt that Arkansas has made progress in improving the education of our students. We have seen many
inspiring examples of great teaching by educators across the state. Yet there is still a long way to go to be sure that
every student is provided the best education to serve them in the future.
This report is designed to help you better understand the state of education in Arkansas and how we compare nationally.
The facts and figures found in this report set the foundation for creating a holistic plan to improve public education in
our state.
This is our home and these are our children. We owe them, the future of our state, the best education possible. We owe
the employers who have committed to building businesses here the most educated workforce. We are committed to
making that happen, and we hope you’ll join us in the journey.
We need all Arkansans to do their part in helping move the state forward. Here are a few steps you can take today!
1. Visit www.ForwardArkansas.org and use our online survey to share your thoughts on public education in Arkansas.
2. Share this report with your friends, families, teachers and community leaders. We make it easy through our social portals on Facebook and Twitter.
3. Encourage conversations in your community and email us at [email protected] to tell us about your progress.
4. Sign up for our e-newsletter (on the home page of the website) to stay informed about ForwARd Arkansas’s progress and how you can help.
Conclusion
Call to Action
9

www.arkansased.org
www.wrfoundation.org
www.waltonfamilyfoundation.org
10

1. Sources: The Chronicle of Higher Education
College Completion webpage (Winter 2015). http://
collegecompletion.chronicle.com/state; Data is based on
IPEDS, which tracks completions of first time, full-time
degree seeking undergrad students. See also National
Center for Education Statistics webpage (Winter 2015).
http://nces.ed.gov/fastfacts/display.asp?id=40. See also
2013 Comprehensive Arkansas Higher Education Annual
Report, Section 4: “Retention and Graduation Rates.”
http://www. highereducation.org/reports/college_
readiness/gap.shtml.
2. Sources: Source citations for the summary page can be
found in the source citations for each report section.
3. Sources: Pre-K spending data from NIEER 2013
Yearbook, pre-K volume from Ed Week Quality Counts and
US Census data. All K-12 data from Arkansas Department
of Education SIS State Profiles, unless otherwise noted.
Higher Ed data from IPEDS and SREB. Teacher data a
special pull by ADE. Per pupil expenditures from US
Census, NCES.
4. Note: Data is for 2014–15 because reporting issue for
2013-14 prohibits comparisons.
5. Note: FRL stands for Free or Reduced Lunch. A student
is eligible for free lunch at school if his or her family
income is below 130 percent of the poverty line; the
student is eligible for a reduced-price lunch if the family
income is below 185 percent of the poverty line.
6. Note: Data is for FY 2012; constant FY 2012 values are
shown (calculated using CPI inflator).
7. Note: This is for 2011–12, data not available for 2012–13.
8. Note: Minority includes all races except white.
9. Source: Ed Week Quality Counts database accessed
10/21/2014.
10. Note: Using adjusted cohort graduation rate, which
is considered the most accurate measure available for
reporting on-time graduation rates (Seastrom et al.
2006b). A 4-year ACGR is defined as the number of
students who graduate in 4 years with a regular high
school diploma divided by the number of students who
form the adjusted cohort for that graduating class. The
term “adjusted cohort” means the students who enter
grade 9 plus any students who transfer into the cohort in
grades 9–12 minus any students who are removed from
the cohort because they transferred out, moved out of the
country, or were deceased (34 C.F.R. § 200.19). The Office
of Education Policy’s graduation rate database also reports
2011-12 adjusted graduation rate as 84%.
Source: NCES Public HS Four-Year On-Time Graduation
Rates and Event Dropout Rates: School years 2010-11 and
2011-12.
11. Note: Number of exams taken by the current year’s 11th
and 12th grade AP students (number of exams not given)
divided by the state’s “11th and 12th Grade Enrollment” x
1000. 11th and 12th grade enrollment represent enrollment
for public schools only, from Applied Educational Research
Inc. of Princeton, NJ.
Sources: College Board National AP Report. See also ACT
Condition of College and Career Readiness Report 2012.
12. Note: College-going rate is defined as the number of
first-time freshmen who graduated from high school in
the past year from state X enrolled anywhere in the U.S./
Public and private high school graduates. 2010 is the last
year for which this was calculated. Note that the Arkansas
Dept of Higher Ed’s 2013 Comprehensive Report calculates
the 2012 college-going rate as 52%; this difference is
potentially due to the fact that only public high school
students are considered.
Source: NCHEMS Information Center, which relies on
information from Tom Mortenson—Postsecondary
Education Opportunity http://www.postsecondary.org.
13. Note A: Statewide data on current expenditures
collected and aggregated from states by Census Bureau,
statewide enrollment from National Center for Education
Statistics (NCES)
Note B: Growth rate calculated on real 2012 dollars i.e.
adjusted for inflation using the CPI inflator
Sources: Census of Governments: Finance - Survey of
School System Finances (FY2007-FY2012): http://www.
census.gov/govs/school/. National Center for Education
Statistics (NCES): http://nces.ed.gov/.
14. Sources: Interviews with ADE; University of Arkansas
Office of Education Policy “Quality Education Act of
2003.”
15. Source: Education Week Quality Counts Database 2012.
(2012 was most recent year data was available for a state
by state comparison in the database.)
Footnotes
11

16. Source: Arkansas Department of Education Digital
Learning webpage (Winter, 2014). http://www.arkansased.
org/divisions/learning-services/digital-learning-k-12.
17. Sources: ADE Charter Schools website: http://www.
arkansased.org/divisions/learning-services/charter-
schools. Enrollment estimates from Office for Ed
Policy demographic database, 2013-14. ADE Schools of
Innovation website: http://www.arkansased.org/divisions/
learning-services/schools-of-innovation and Related Files.
18. Note A: Child development assessed using Qualls Early
Learning Inventory (QELI), an observational tool for use in
the primary grades to identify student development in six
areas related to school learning.
Note B: Low-income defined in study as being free- or
reduced-lunch eligible. For example, according to the
Arkansas Research Center study “ABC Shrinks Gap in
Kindergarten Readiness for Economically Disadvantaged
Students”, for a family of four an income of $43,568 or less
is classified as free- or reduced-lunch eligible.
Sources: Arkansas Research Center, ADE expert interview.
19. Sources: U.S. Department of Education, Institute
of Education Sciences, National Center for Education
Statistics, National Assessment of Educational Progress
(NAEP), 2005, 2007, 2009, 2011 and 2013 Mathematics and
Reading Assessments.
20. Sources: ADE Rules Governing the Arkansas
Comprehensive Testing, Assessment and Accountability
Program (ACTAAP) and the Academic Distress Program,
September 2014: http://www.arkansased.org/divisions/
legal/rules/current. ADE interview.
21. Note: The four subjects tested in the ACT are: English,
Mathematics, Reading and Science.
Source: ACT Profile Report for Arkansas, Graduating Class
of 2013.
22. Note: Using “anytime” remediation rate, which is
defined to be % of first-time degree-seeking students
enrolled in a remedial class.
Source: 2013 Comprehensive Arkansas Higher Education
Annual Report, Section 4: “Remediation Rates”: http://
www.highereducation.org/reports/college_readiness/gap.
shtml.
23. Source: http://collegecompletion.chronicle.com/state/
no.state=AR§or=public_four; data is based on IPEDS,
which tracks completions of first-time, full-time degree-
seeking undergrad students.
24. Source: Office for Education Policy demographic
databases, 2005-06 and 2013-14
25. Sources: National Center for Education Statistics,
National Assessment of Educational Progress (NAEP),
2005, 2007, 2009, 2011 and 2013 Mathematics and Reading
Assessments. Office for Education Policy Benchmark
Exam databases.
26. Source: ADE. Office of Education Policy (University of
Arkansas) benchmark exam database, 2013-14.
12
Academic Distress: This term is used to describe a
school or district that has, for a sustained period of time,
demonstrated a lack of student achievement. Specifically,
this is a classification assigned to (a) any public school or
school district in which 49.5 percent or less of its students
achieve proficient or advanced on a composite of math
and literacy tests for the most recent three-year period;
or (b) a Needs Improvement school (Priority) or a school
district with a Needs Improvement (Priority) school that
has not made the progress required under the school’s
Priority Improvement Plan (PIP). A Needs Improvement
school is a school that has not met its annual targets in
performance growth and high school graduation rates.
See the Arkansas Accountability Addendum to Elementary
Secondary Education Act Flexibility Request for more
information.
http://www.arkansased.org/public/userfiles/ESEA/ESEA_
Flexibility_Accountability_Addendum.pdf, ADE Rules
Governing ACTAAP and the Academic Distress Program,
Sept 2014: http://www.arkansased.org/public/userfiles/
rules/ Current/ACTAAP-FINAL_-_September_2014.pdf
ACT: The ACT is a national college admissions examination
that consists of subject area tests in English, mathematics,
reading and science.
http://www.actstudent.org/faq/what.html
Advanced Placement Exams (AP): AP Exams are rigorous,
multiple-component tests that are administered at high
schools each May. High school students can earn college
credit, placement or both for qualifying AP Exam scores.
Each AP Exam has a corresponding AP course and
provides a standardized measure of what students have
learned in the AP classroom.
http://professionals.collegeboard.com/testing/ap
Augmented Benchmark Exams: The Augmented
Benchmark Exam is an assessment that is given in the
spring to students in grades 3-8. The first part of the test,
commonly called the Benchmark, is based on specific
student learning expectations (SLEs) found in the state
frameworks. The Benchmark test covers SLEs in math
and literacy. Science SLEs are included in grades 5 and
7. Scores from the Benchmark are reported as below
basic, basic, proficient and advanced. An Academic
Improvement Plan will be developed to identify skills
where a student needs extra support to be successful in
school if the student scored basic or below basic. Students
scoring proficient or advanced combine to form our
percentage reported as AYP (Adequate Yearly Progress).
This percentage – or AYP – is reported to the public. The
second part – augmented – of this assessment, called
ITBS, is not based on Arkansas learning objectives, but
instead measures an individual student’s performance
to a nationwide group of students. Scores from this part
of the Augmented Benchmark are not part of the AYP
calculations.
http://www.cabotschools.org/curriculum/assesment-
testing/benchmark-exams-grades-3-8
Charter school: Charter schools are public schools that
operate under a “charter,” or “charter contract,” which
frees them from many regulations created for traditional
public schools while holding them accountable for
academic and financial results. The charter contract is
between the charter school’s sponsoring entity and the
Arkansas State Board of Education or the Commissioner of
Education.
http://www.arkansased.org/faqs/105/what-is-a-charter-
school
GlossaryThis glossary contains common meanings of words and phrases in this document, but does not replace any definitions put forth by the State Board of Education.
13

Common Core State Standards: The Common Core State
Standards is a set of high-quality academic standards in
mathematics and English language arts/literacy. These
learning goals outline what a student should know and be
able to do at the end of each grade. The standards were
created to ensure that all students graduate from high
school with the skills and knowledge necessary to succeed
in college, career and life.
http://www.arkansased.org/divisions/learning-services/
assessment/definitions-of-common-terms
Degree Attainment Rate: Percentage of the state’s
working-age population (25-64) with at least an
associate’s degree.
Education Week Quality Counts: Quality Counts is
Education Week’s annual report on state-level efforts to
improve public education. It is published in January.
http://www.edweek.org/ew/qc/index.html
Free or Reduced Lunch (FRL): The National School Lunch
Program is a federally assisted meal program operating
in public and nonprofit private schools and residential
child care institutions. It provides nutritionally balanced,
low-cost or free lunches to children each school day. A
student is eligible for free lunch at school if his or her
family income is below 130 percent of the poverty line; the
student is eligible for a reduced-price lunch if the family
income is below 185 percent of the poverty line.
http://www.fns.usda.gov/nslp/national-school-lunch-
program-nslp
National Assessment of Educational Progress (NAEP):
NAEP is the largest nationally representative and
continuing assessment of what students in the United
States know and can do in various subject areas.
Assessments are conducted periodically in mathematics,
reading, science, writing, the arts, civics, economics,
geography, U.S. history, and beginning in 2014, in
technology and engineering literacy.
http://nces.ed.gov/nationsreportcard/about/
P-16: Refers to the full spectrum of education from pre-K
through the first four years of post-secondary education.
Remediation Rate: Since 1988, all entering first-year
students seeking an associate degree or higher from an
Arkansas public college or university must meet Arkansas
Higher Education Coordinating Board assessment and
placement standards in the disciplines of English, math
and reading. A cut-off score of 19 on the ACT exam (or the
equivalent on the ASSET, SAT or COMPASS tests) is used
for each of the three subject areas.
Comprehensive Arkansas Higher Education Report, Dec
2013, Remediation Rates.
14

forwardarkansas.org