Embed Size (px)
Citation preview
THE SOCIETY OF NAVAL ARCHITECTS AND MARINE ENGINEERS
One World Trade Center, Suite 1369, New York, N. Y. 10048 Paper to be presented at the Chesapeake Sailing Yacht Symposium, Annapolis, Maryland, January 17, 1981.
Yacht Performance Analysis with Computers David R. Pedrick, Pedrick Yacht Designs, Newport, RI. Richard S. Mccurdy, Consultant, Darien, CT.
ABSTRACT
Advances in computer technology continue to expand the every-day application of electronic calculation and programming. With everything from home computers to automotive diagnostic devices, hand-held Pong games, and calculator wristwatches now being big sellers,
it is no surprise that computer-based marine instruments have increased in capability and popularity. This paper describes some current
developments in electronics to evaluate the performance of sailing yachts, ranging from
basic digital displays to full-blown shoreside computers.
NOMENCLATURE
.f3A (-3 Alff
PT 't
8N es 8-r A <P
wind angle offset
apparent wind speed (corrected)
apparent wind speed (uncorrected for upwash and heel)
speed-made-good to windward or leeward; also, VMG
boat speed true wind speed
apparent wind angle (corrected)
apparent wind angle (uncorrected for upwash and heel)
true wind angle
upwash angle heading on next leg or tack heading of yacht heading of true wind leeway angle heel angle
INTRODUCTION
The most general concern of the racing sailor (or speed-conscious cruiser) is the comparison of the yacht's speed in given wind and sea conditions to her previous performance. Usually a yacht has analog or digital displays of boat speed, wind speed, and wind
direction, and the owner or crew normally take mental notes of normal sailing performance, particularly when on the wind. If speed is down, relative to recent or long-term performance, the sails are eyeballed for trim, or a possible sail change. Clearly, such instruments do not control how the ya~is
13
sailed--that remains in the hands of humans.
~formation available on the instruments merely helps the crew judge whether performance is satisfactory and, if not, signals them to look around and figure out what is wrong.
As the level of complexity in yacht instrumentation increases, one should not be
intimated into thinking that the sailing skill
of yachtsmen is being encroached upon. At this time, the most sophisticated of yacht computer systems is totally incapable of eyeballing sail trim or steering efficiently in a seaway. The purpose of computer-based instrument systems is to provide more thorough
report cards to the crew, with more meaningful measures of performance evaluation. The instruments indicate how the yacht has been
sailing recently, or has sailed at some time in the past in similar conditions. Based upon that information, it remains in the full judgment of the skipper and crew to correct their mistakes or improve upon their present or previous best performance' in sailing the
yacht.
PART I HAND-CALCULATOR PERFORMANCE ANALYSIS
Hardware--The Hard Way
The conscientious racing sailor keeps a log of sail combinations, lead positions, boat speed, wind speed, wind angle, and per
haps a few other pertinent items. This makes it easier to reproduce sail trim settings in given conditions, and judge whether boat speed is satisfactory.
The wind references in this case are the apparent readings straight off the meters. These very likely contain gross errors of calibration, but are worthwhile nevertheless as a basis of comparison for a particular yacht. Simple as this means is, it is the only means
that most of the sailing world has had to evaluate its performance.
To take the next step one should under
stand the concepts of apparent wind versus true wind. The wind that a person feels on a moving vehicle--boat, car, or whatever--is called apparent wind. It is the vector combi-
nation of the ambient wind and the velocity of the vehicle. The ambient wind measured from a stationary reference is called the true wind. The vector solutions are described later, as are more detailed applications. It is evident, however, that the only absolute reference for comparing performance of two different yachts is through the use of true wind as a constant baseline. If the "given" wind conditions were taken from the respective yacht's instruments, one's apparent wind reference would differ from the other's. Also, as will be described shortly, the optimum point of sail to windward and to leeward can only be determined according to the true wind axis.
The accumulation of data and the calculations to establish optimum conditions require thousands of data points, and various corrections for instrument calibration and for geometric and aerodynamic corrections, followed by statistical evaluation, sets of graphs, faired cross-plots, and judicious "fudging". It can all be done with fairly good success using a hand-held programmable calculator and a lot of patience. A program for data reduction using the HP-65 calculator is given in the appendices.
Naturally, improved precision and reliability result from higher resolution of the instrument readings, along with more frequent, simultaneous sampling of the set of instruments. Strip chart recorders that automatically plot time histories of appropriate instrument readings are quite useful, but remain rather timeconsuming to analyze. This is the stage at which electronic data processing becomes a blessing. The hardware becomes more sophisticated, but the tediousness of the data analysis is substantially reduced. Before getting into the equipment, however, we will look into the theory of performance analysis, and its combination with tactics and navigation.
Vector Triangles and Polar Curves
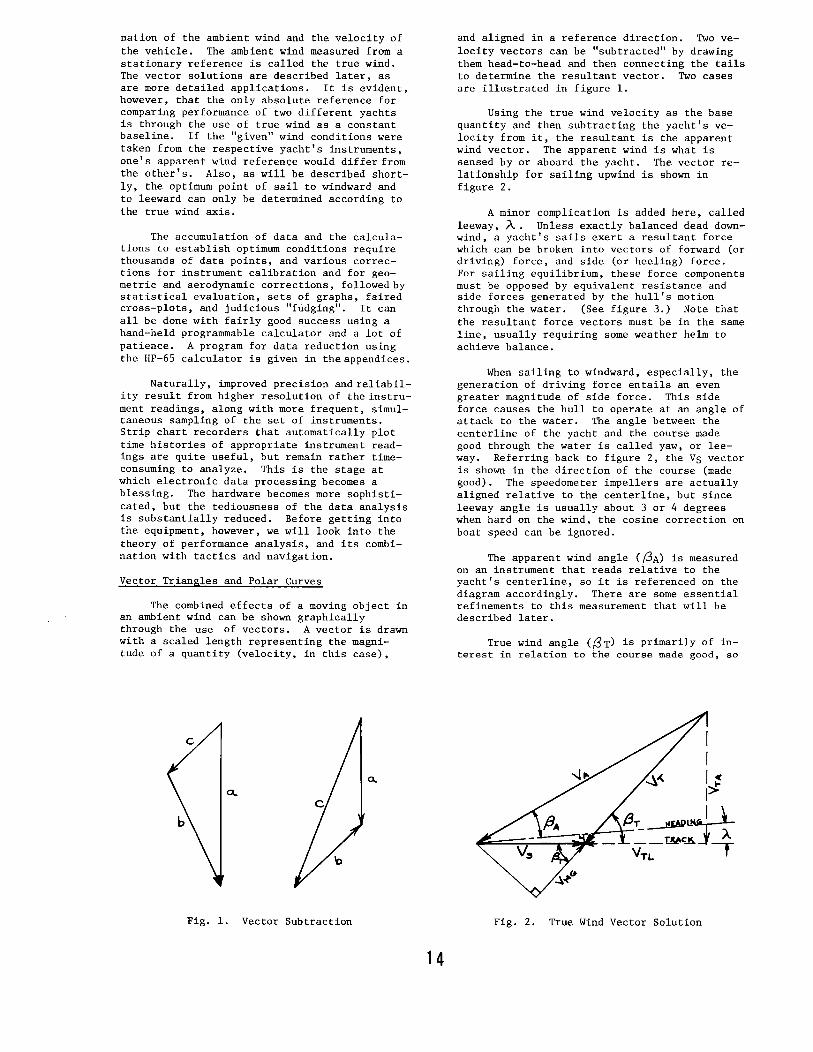
The combined effects of a moving object in an ambient wind can be shown graphically through the use of vectors. A vector is drawn with a scaled length representing the magnitude of a quantity (velocity, in this case),
a..
Fig. 1. Vector Subtraction
14
and aligned in a reference direction. Two velocity vectors can be "subtracted" by drawing them head-to-head and then connecting the tails to determine the resultant vector. Two cases are illustrated in figure 1.
Using the true wind velocity as the base quantity and then subtracting the yacht's velocity from it, the resultant is the apparent wind vector. The apparent wind is what is sensed by or aboard the yacht. The vector relationship for sailing upwind is shown in figure 2.
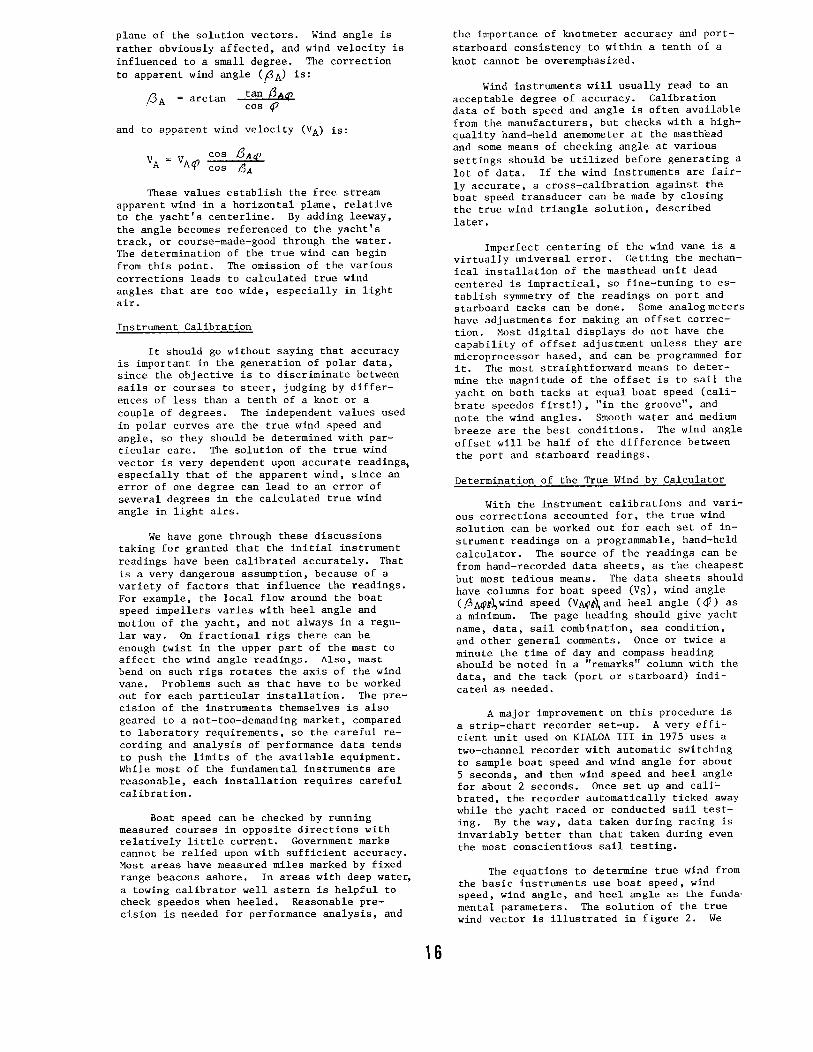
A minor complication is added here, called leeway, .A. Unless exactly balanced dead downwind, a yacht's sails exert a resultant force which can be broken into vectors of forward (or driving) force, and side (or heeling) force. For sailing equilibrium, these force components must be opposed by equivalent resistance and side forces generated by the hull's motion through the water. (See figure 3.) Note that the resultant force vectors must be in the same line, usually requiring some weather helm to achieve balance.
When sailing to windward, especially, the generation of driving force entails an even greater magnitude of side force. This side force causes the hull to operate at an angle of attack to the water. The angle between the centerline of the yacht and the course made good through the water is called yaw, or leeway. Referring back to figure 2, the Vs vector is shown in the direction of the course (made good). The speedometer impellers are actually aligned relative to the centerline, but since leeway angle is usually about 3 or 4 degrees when hard on the wind, the cosine correction on boat speed can be ignored.
The apparent wind angle ((3A) is measured on an instrument that reads reiative to the yacht's centerline, so it is referenced on the diagram accordingly. There are some essential refinements to this measurement that will be described later.
True wind angle ( {3 T) is primarily of interest in relation to the course made good, so
Fig. 2. True Wind Vector Solution
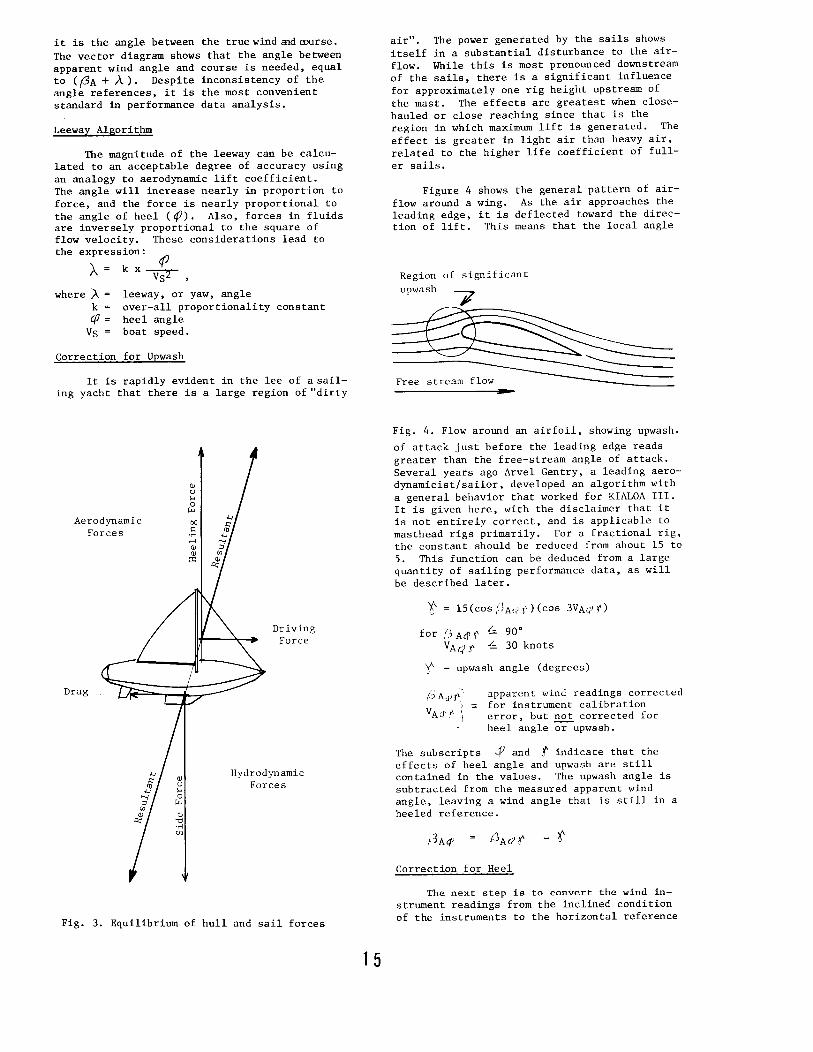
it is the angle between the true wind aid course. The vector diagram shows that the angle between apparent wind angle and course is needed, equal to ( f3A + A ) . Despite inconsistency of the angle references, it is the most convenient standard in performance data analysis.
Leeway Algorithm
The magnitude of the leeway can be calculated to an acceptable degree of accuracy using an analogy to aerodynamic lift coefficient. The angle will increase nearly in proportion to force, and the force is nearly proportional to the angle of heel ( cfJ). Also, forces in fluids are inversely proportional to the square of flow velocity. These considerations lead to the expression:
A.= kx <{J --vsr , where A =
k =
<fl = Vs =
leeway, or yaw, angle over-all proportionality constant heel angle boat speed.
Correction for Upwash
It is rapidly evident in the lee of a sailing yacht that there is a large region of"dirty
Aerodynamic Forces
Drag
QJ ()
'""' 0 ~
QJ "d . .., lfJ
Driving Force
Hydrodynamic Forces
Fig. 3. Equilibrium of hull and sail forces
1 5
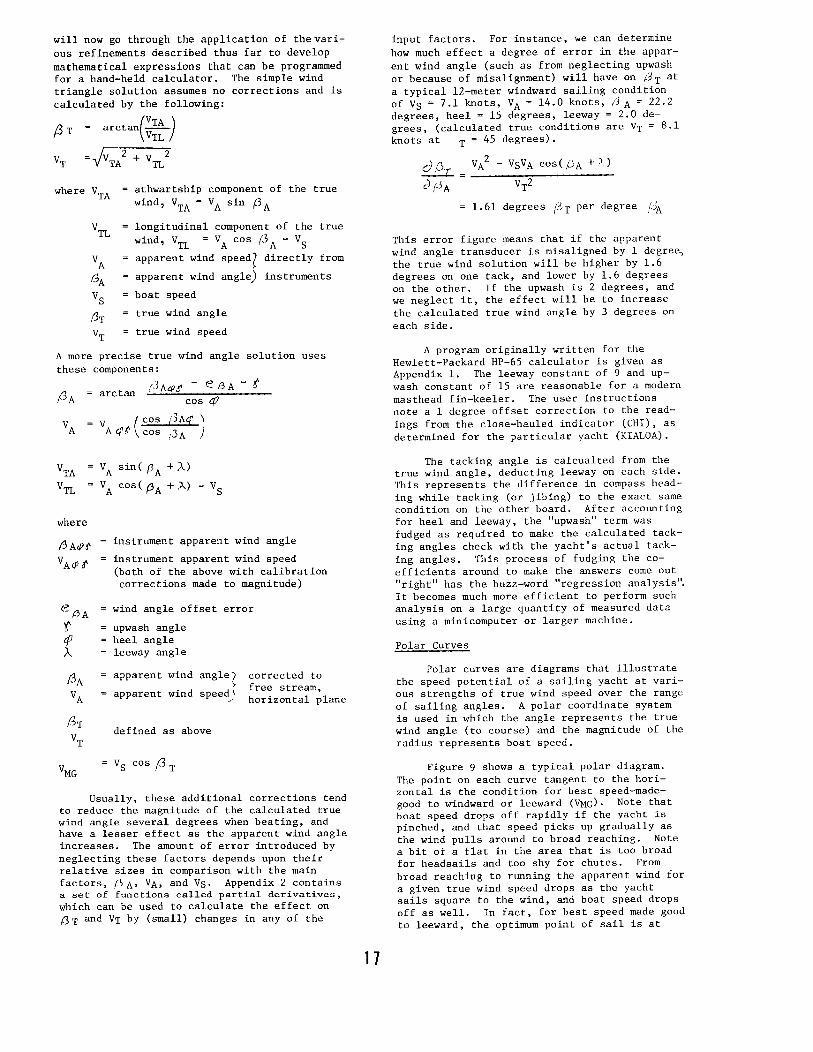
air". The power generated by the sails shows itself in a substantial disturbance to the airflow. While this is most pronounced downstream of the sails, there is a significant influence for approximately one rig height upstream of the mast. The effects are greatest when closehauled or close reaching since that is the region in which maximum lift is generated. The effect is greater in light air than heavy air, related to the higher life coefficient of fuller sails.
Figure 4 shows flow around a wing. leading edge, it is tion of lift. This
the general pattern of airAs the air approaches the
deflected toward the direcmeans that the local angle
Region of significant upwash
Free stream flow
Fig. 4. Flow around an airfoil, showing upwash.
of attack just before the leading edge reads greater than the free-stream angle of attack. Several years ago Arvel Gentry, a leading aerodynamicist/sailor, developed an algorithm with a general behavior that worked for KIALOA III. It is given here, with the disclaimer that it is not entirely correct, and is applicable to masthead rigs primarily. For a fractional rig, the constant should be reduced from about 15 to 5. This function can be deduced from a large quantity of sailing performance data, as will be described later.
't = 15(cos(\Aq>J')(cos 3VAc.P ~)
for ,r.\ M' {' ~ 90° V ArJ( f' ~ 30 knots
'!' = upwash angle (degrees)
(.3 A:iJ.\" ',
VA:J.~ :; ::;;
apparent wind readings corrected for instrument calibration error, but not corrected for heel angle ~upwash.
The subscripts qJ and t indicate that the effects of heel angle and upwash are still contained in the values. The upwash angle is subtracted from the measured apparent wind angle, leaving a wind angle that is still in a heeled reference.
- t
Correction for Heel
The next step is to convert the wind instrument readings from the inclined condition of the instruments to the horizontal reference
plane of the solution vectors. Wind angle is rather obviously affected, and wind velocity is influenced to a small degree. The correction to apparent wind angle ( f?> A) is:
/J A arc tan tan f3Mp cos <P
and to apparent wind velocity (VA) is:
v = v cos DA({' A Al{J cos /)
t-JA
These values establish the free stream apparent wind in a horizontal plane, relative to the yacht's centerline. By adding leeway, the angle becomes referenced to the yacht's track, or course-made-good through the water. The determination of the true wind can begin from this point. The omission of the various corrections leads to calculated true wind angles that are too wide, especially in light air.
Instrument Calibration
It should go without saying that accuracy is important in the generation of polar data since the objective is to discriminate betwe~n sails or courses to steer, judging by differences of less than a tenth of a knot or a couple of degrees. The independent values used in polar curves are the true wind speed and a~gle, so they should be determined with particular care. The solution of the true wind vector is very dependent upon accurate readings especially that of the apparent wind, since an ' error of one degree can lead to an error of several degrees in the calculated true wind angle in light airs.
We have gone through these discussions taking for granted that the initial instrument readings have been calibrated accurately. That is a very dangerous assumption, because of a variety of factors that influence the readings. For example, the local flow around the boat speed impellers varies with heel angle and motion of the yacht, and not always in a regular way. On fractional rigs there can be enough twist in the upper part of the mast to affect the wind angle readings. Also, mast bend on such rigs rotates the axis of the wind vane. Problems such as that have to be worked out for each particular installation. The precision of the instruments themselves is also geared to a not-too-demanding market, compared to laboratory requirements, so the careful recording and analysis of performance data tends to push the limits of the available equipment. While most of the fundamental instruments are reasonable, each installation requires careful calibration.
Boat speed can be checked by running measured courses in opposite directions with relatively little current. Government marks cannot be relied upon with sufficient accuracy. Most areas have measured miles marked by fixed range beacons ashore. In areas with deep water, a towing calibrator well astern is helpful to check speedos when heeled. Reasonable precision is needed for performance analysis, and
16
the importance of knotmeter accuracy and portstarboard consistency to within a tenth of a knot cannot be overemphasized.
Wind instruments will usually read to an acceptable degree of accuracy. Calibration data of both speed and angle is often available from the manufacturers, but checks with a highquality hand-held anemometer at the masthead and some means of checking angle at various settings should be utilized before generating a lot of data. If the wind instruments are fairly accurate, a cross-calibration against the boat speed transducer can be made by closing the true wind triangle solution, described later.
Imperfect centering of the wind vane is a virtually universal error. Getting the mechanical installation of the masthead unit dead centered is impractical, so fine-tuning to establish symmetry of the readings on port and starboard tacks can be done. Some analogmeters have adjustments for making an offset correction. Most digital displays do not have the capability of offset adjustment unless they are microprocessor based, and can be programmed for it. The most straightforward means to determine the magnitude of the offset is to sail the yacht on both tacks at equal boat speed (calibrate speedos first!), "in the groove", and note the wind angles. Smooth water and medium breeze are the best conditions. The wind angle off set will be half of the difference between the port and starboard readings.
Determination of the True Wind by Calculator
With the instrument calibrations and various corrections accounted for, the true wind solution can be worked out for each set of instrument readings on a programmable, hand-held calculator. The source of the readings can be from hand-recorded data sheets, as the cheapest but most tedious means. The data sheets should have columns for boat speed (Vs), wind angle ( f3 A<Pt~ wind speed (V Mt), and heel angle ( ~) as a minimum. The page heading should give yacht name, data, sail combination, sea condition, and other general comments. Once or twice a minute the time of day and compass heading should be noted in a "remarks" column with the data, and the tack (port or starboard) indicated as needed.
A major improvement on this procedure is a strip-chart recorder set-up. A very efficient unit used on KIALOA III in 1975 uses a two-channel recorder with automatic switching to sample boat speed and wind angle for about 5 seconds, and then wind speed and heel angle for about 2 seconds. Once set up and cali~ brated, the recorder automatically ticked away while the yacht raced or conducted sail testing. By the way, data taken during racing is invariably better than that taken during even the most conscientious sail testing.
The equations to determine true wind from the basic instruments use boat speed, wind speed, wind angle, and heel angle as the fundamental parameters. The solution of the true wind vector is illustrated in figure 2. We
will now go through the application of the various refinements described thus far to develop
mathematical expressions that can be programmed for a hand-held calculator. The simple wind triangle solution assumes no corrections and is calculated by the following:
/3 T arctan(VTA _)
VTL I
where VTA athwartship component of the true wind, VTA = VA sin /3 A
VTL longitudinal component of the true
wind, VTL = VA cos (J A - vs
VA apparent wind speed~ directly from
!3A apparent wind angle instruments
vs boat speed
/3T true wind angle
VT true wind speed
A more precise true wind angle solution uses these components:
(3 AcPt' - e 13 A - t '/3A arc tan
cos qJ
v (cos ;.3M) VA A <'ff' cos /'>A )
where
e f3A
f cp ,\
VA sin( (3A +,\)
VA cos ( (3 A + ;.q - VS
instrument apparent wind angle
instrument apparent wind speed (both of the above with calibration corrections made to magnitude)
wind angle off set error
upwash angle heel angle leeway angle
apparent wind angle'?
apparent wind speed)
defined as above
VS cos (3 T
corrected to free stream, horizontal plane
Usually, these additional corrections tend to reduce the magnitude of the calculated true wind angle several degrees when beating, and have a lesser effect as the apparent wind angle increases. The amount of error introduced by neglecting these factors depends upon their relative sizes in comparison with the main factors, (~A• VA, and Vs. Appendix 2 contains a set of functions called partial derivatives,
which can be used to calculate the effect on /3T and VT by (small) changes in any of the
1 7
input factors. For instance, we can determine
how much effect a degree of error in the apparent wind angle (such as from neglecting upwash or because of misalignment) will have on ,3T at a typical 12-meter windward sailing condition of Vs= 7.1 knots, VA= 14.0 knots, ;3 A= 22.2 degrees, heel = 15 degrees, leeway = 2.0 degrees, (calculated true conditions are VT = 8.1 knots at T = 45 degrees).
0Pr = vA2 - VsVA cos( f.h + ,\)
l1 ('>A VT2
1.61 degrees (1'T per degree r~~
This error figure means that if the apparent wind angle transducer is misaligned by 1 degree., the true wind solution will be higher by 1.6 degrees on one tack, and lower by 1.6 degrees on the other. If the upwash is 2 degrees, and we neglect it, the effect will be to increase the calculated true wind angle by 3 degrees on each side.
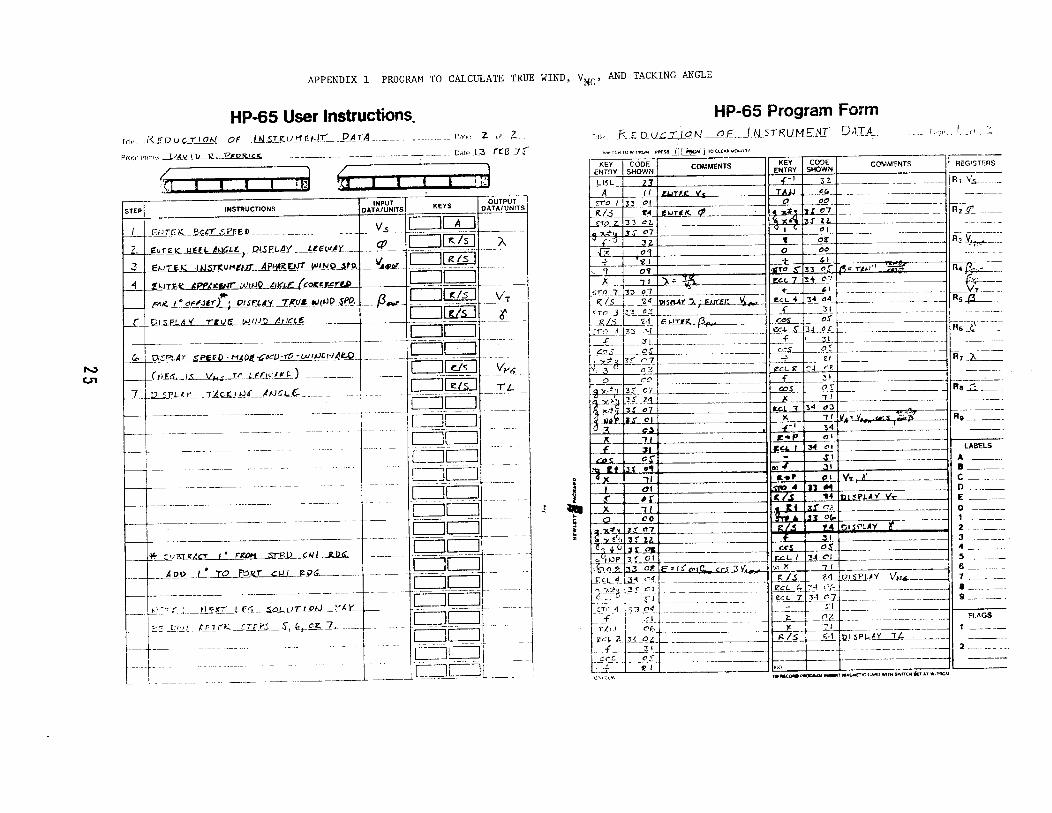
A program originally written for the Hewlett-Packard HP-65 calculator is given as Appendix 1. The leeway constant of 9 and upwash constant of 15 are reasonable for a modern masthead fin-keeler. The user instructions note a 1 degree offset correction to the readings from the close-hauled indicator (CHI), as determined for the particular yacht (KIALOA).
The tacking angle is calcualted from the true wind angle, deducting leeway on each side. This represents the difference in compass heading while tacking (or jibing) to the exact same condition on the other board. After accounting for heel and leeway, the "upwash" term was fudged as required to make the calculated tacking angles check with the yacht's actual tacking angles. This process of fudging the coefficients around to make the answers come out "right" has the buzz-word "regression analysis". It becomes much more efficient to perform such analysis on a large quantity of measured data using a minicomputer or larger machine.
Polar Curves
Polar curves are diagrams that illustrate the speed potential of a sailing yacht at various strengths of true wind speed over the range of sailing angles. A polar coordinate system is used in which the angle represents the true wind angle (to course) and the magnitude of the radius represents boat speed.
Figure 9 shows a typical polar diagram. The point on each curve tangent to the horizontal is the condition for best speed-madegood to windward or leeward (VMG). Note that boat speed drops off rapidly if the yacht is pinched, and that speed picks up gradually as the wind pulls around to broad reaching. Note a bit of a flat in the area that is too broad for headsails and too shy for chutes. From broad reaching to running the apparent wind for a given true wind speed drops as the yacht sails square to the wind, and boat speed drops off as well. In fact, for best speed made good to leeward, the optimum point of sail is at
fairly wide angles to the true wind, in order to build up apparent wind speed over the sails.
The development of these curves from sailing data takes many weeks by hand calculator, but it can be (and has been) done. Computers and automatic recording of data make the process quite quick and relatively simple.
Using either process, it is more convenient to plot the parameters in rectilinear form. One can start by grouping the data by wind angle. In the close-hauled region the intervals should not exceed 2 degrees. Offwind, the intervals can enlarge to as much as 10 degrees.
A plot of boat speed (Vs) versus true wind speed (VT) is generated by spotting the data points for each angle range on a separate sheet of translucent graph paper. A hand-faired curve can be drawn through the better 10% or so of the data, and the curves can be laid over one another to develop a progression, or "family", of related curves.
Having done that, cross-plots of boat speed at constant wind speed are read and plotted against wind angle (,GT). This process helps locate and smooth out anomalies in the data. Then, replotting the Vs - VT curves at constant angle provides a check that the curves are remaining reasonably faithful to the data. After completing the rectilinear cross-plotting to a satisfactory state, points at constant true wind velocity and the range of angles can be transferred to polar coordinates to end up with the same data in polar form.
Once again, computers can help remove a lot of drudgery. Software can be written that is smart enough to do plotting and trial curve fits, and can be interactive to let personal judgment override pure statistics. There is inevitably enough garbage in the data to require some degree of human intervention, but the combination of man and machine can produce some profound insights into sailing yacht performance evaluation.
PART II MICROCOMPUTERS AND BEYOND
The electronics revolution has greatly increased the sailor's understanding of both performance and tactics. The tactical side has not been brought out yet in this paper, because it makes its big gains through some clever interconnecting of several instruments, and automatic processing of data for instant use, and/or recording of data for later reference. Computers can sample and update all of the yacht's instruments and produce complex calculated output continuously at a rate faster than once a second. The ready access to more comprehensive information enables yachtsmen to make more rational and more rapid judgment calls in performance and tactical decisionmaking.
The rapid sampling rate is important statistically to avoid erroneous interpretation of data. All of the instruments, but particu-
18
larly the masthead transducers, are affected by the pitching motion of the yacht. To avoid incorrect averaging of the cyclic behavior (or "aliasing") resulting from pitch motion, it is desirable to sample the readings a minimum of about four times per cycle. With the pitching period of a yacht typically about 2 seconds while encountering waves to windward, this means that the data should be sampled approximately every half-second.
Computers aboard sailboats do some of the same things as the hand calculators mentioned above. Their advantage is that they do it by reading the information directly from the transducers. Accuracy is improved, since the computer can read the information from all the required sources simultaneously with greater speed and precision than can be done by hand. There is a convenience aspect to this automation that is important, since taking readings and converting them to true wind is so slow that most sailors don't have the patience to gather enough data. While racing, no one really has the time to do it. If cruising, not only is the data less meaningful, but relaxing in the cockpit with pleasant company and perhaps a cocktail is a lot more fun. As in most uses of the computer, its job is to do the tedious work with objective results, and leave the fun to its masters.
There are two or three commercially available on-board computers which can calculate true wind. These machines are not the ultimate in accuracy but they can take a lot of the agony out of polar curve generation, since they display true wind angle and speed directly. None of these machines goes beyond a simple true-wind triangle solution--that is, heel, upwash and leeway are not specifically included in the vector solution. These effects can be compensated for in a particular situation by using a "fudge factor" algorithm that approximates the combined effects.
As another advantage, the computer can read instrument data more accurately because it has access to the transducer signals at a more basic level. This eliminates errors introduced by the conversion of those signals into a readout. Error corrections can also be applied which are not cost-effective for the instrument manufacturer to include, like the non-linear error introduced by the fact that mechanical transducers stop before the flow does, or the 1.6 degree cyclical error found in most masthead angle transducers, and similar non-linearities.
To assist in later reanalysis, data can be recorded on as simple a device as a cheap, monaural audio cassette recorder. The same machine can play the data back into a computer ashore for whatever more detailed use of the data may be desired.
Navigational and Tactical Functions
The extraordinary power of even a small on-board computer comes through the combination of true wind determination with navigation and tactics. The questions that the computer can
answer expand from, "how am I doing?" to "where am I in relation to the next mark and how can I get there the fastest way?".
By adding a compass several things become possible. The true wind angle from the yacht's centerline can be turned into a true wind magnetic azimuth (~T), or the compass direction of the true wind. Add a strip-chart recorder and you can log the phasing of wind shifts and changes in strength. Also, the computer can add or subtract the calculated tacking angle from the present course and say what course to steer on the opposite tack.
Add a clock and the computer can do the dead reckoning, knowing speed, course, and time. It can even keep up with a Twelve-meter tacking duel, with forty tacks in a 4.5 mile weather leg. To do this with sufficient accuracy, the navigator must be able to input the estimated speed and direction of the current-the beginning of interactive instrumentation.
Now let the navigator input the coordinates of an origin (such as the starting mark) and the next mark. If the computer knows where the yacht is (dead reckoning) and where the mark is (navigator input), it can tell the difference--where the mark is relative to the yacht. The most direct means of presenting this is as a bearing and range.
Now, the computer already knows the wind direction, and the tacking angle. So, it can construct the lay lines, which are separated by the tacking angle, and are centered on the wind's axis. (The lay lines are automatically updated for wind shifts.) Now the computer can tell where the yacht is in relation to the lay lines from the mark, and provide a running update of distance to the lay line, and then on the lay line, sailing to the mark. By looking back over a short-term average speed, the distances can be converted to sailing time to and on the lay line.
In another area of interest, once polar diagrams have been developed for a yacht, they can be put into the computer's memory. Not only is that helpful in evaluating instantaneous performance, but in making a sail call for the next leg. Knowing the next course (navigator input) and the true wind speed and magnetic direction, the computer can find the predicted boat speed in the polar data and work the wind vectors backwards to predict the apparent wind strength and direction. The computer can even be smart enough to tell if the optimum course downwind is a higher sailing angle than rhumb line.
In the near future Loran-C inputs should be available, keeping a record of average speed over the bottom. If the boat speed and course data is accurate, the computer could deduce the current with reasonably frequent updates--helpful when sailing in areas having strong currents.
Numerous other alternatives are bred from this line of thinking, and it all becomes routine in microcomputer interconnection of normal
1 9
yacht's instruments.
General Commercial Yachting Computers
Several manufacturers have now gotten into interconnected electronics on a commercial basis. The most powerful of these is by Brookes & Gatehouse, called the Hercules 190 system. It uses a microcomputer to compute the true wind solution, dead reckoning, and speed comparison to stored polar data. Rochester Instruments, Signet Scientific, and Atlantic Marine make speed-made-good computers that solve for the true wind and speed-made-good to windward or leeward (VMG), but do not have navigation or polar capability at this time.
These instruments presently use an overall correction for the combined effects of heei upwash, and leeway in the wind vector solution. The owner of one of the commercial true wind computers should be aware of these errors and compensate for them when making his polar curves. The most direct way of finding out the error is to do some carefully controlled sailing, using the compass to determine how much the true wind solution is off, and generating a "deviation card" showing the amount of correction needed. The masthead error e .. l A should be taken out by comparing the true wind solution on opposite tacks and adjusting the masthead transducer or meter output where possible.
Using an on-board computer and deviation card simplifies the generation of polar curves in several ways. First, the true wind indication is provided continuously and allows the helmsman to maintain a constant true wind angle, removing one of the scattering variables. The display also allows deliberate sailing at a true wind angle which would not ordinarily be done to gather information to fill in a gap in the data, or to get information in an area where sail combinations overlap.
Having the true wind solution at hand also allows data points to be added to the Vs - VT curves while the sailing is going on. This increases the efficiency of the operation enormously, since poor performance shows up right away, and the cause can be found and corrected, saving many days of work retaking the information. However, if the curves are generated in this way, the auxiliary information (sail combination and trim, sea state, helmsman, etc.) tends to be forgotten. It is important to be able to quickly reproduce those combinations of sails and trim that show good performance, and to avoid proven slow combinations. Full data on all points should be logged as well as plotted to expedite performance evaluation in both racing and data gathering conditions.
Home Computer Analysis
By recording instrument data on tape or floppy disk, a larger home computer can be used to develop performance data. Once the data is collected, the home computer can speed up the analysis. Some units have good enough graphics capability to allow trial fitting Vs - VT
curves to the data and then cross plotting them onto polar curves under program control. With the data available for recall and examination, the discrepancies in the various curve fits can be resolved much more quickly than with manual plotting methods. The problem here is lack of suitable general-purpose functions which will fit the polar curve shape. In most cases, a polynomial function must be adjusted for a best fit to the data in the constant- i3T plane (Vs - VT) curves), and then those curves serve as input to another polynomial fit in the constant-VT plane (Vs - f3 curves, or polars). This process is worked bac~ and forth between polar and(Vs - VT)until a smooth set of curves is generated which best fits the data.
All the effort to get the home computer set up, and to create the data base and plotting programs sounds like more work than doing the cross-plotting manually, and initially this is so. The advantage comes later, when you want to change the polars because of a new sail combination or new data. If the old polars are available to the computer, and you want to change a small portion of them, the process becomes much faster and easier, making updating more efficient.
At the present time, any connections between microprocessor-based instruments and a microcomputer working in parallel have been on a custom basis, but there is at least one specific project underway now to interface a line of computer-connected instruments with a popular, economical home computer. In addition to assisting in statistical analysis and computer-plotting of sailing data, a full, twoway interface between the instruments and a versatile computer carried aboard a yacht opens up the door to quite complete dead reckoning/ tactical/performance capability at a rather reasonable cost. Future developments in this area should add very exciting capability in high-performance ocean racing. Until now, such games have been exclusively for the extreme intensity of a few Twelve meter yachts, but we should see more universal use of similar machines aboard other serious racing yachts in the not-too-distant future.
PART III STARSHIP NOVA
America's Cup defense syndicates require that the maximum potential of their yachts be achieved in the shortest possible time, and in recent years have been employing computers to help achieve that goal. The computer equipment used in the 1980 CLIPPER effort was designed to help in the generation of polar curves and to display performance, tactical and navigation information for the crew. In many ways, the computers were used in the same way as those mentioned above. The differences were chiefly in greater emphasis on crew training and real-time tactical and navigation display. The equipment also made substantial improvements in the accuracy and speed of analysis. The initial goal was to have sailing data statistically analyzed and plotted by the evening of each day, so that the results could be reviewed while the recollections of the day
20
were still fresh in the crew's minds. That goal was exceeded, actually having plotted results available by the time CLIPPER returned to the dock.
The on-board computer was built especially for the task of real-time, on-board analysis because of the need for the best achievable accuracy and specialized information requirements. This computer was designed to read the transducers of the standard instrumentation and compute and display the following functions:
Current speed and direction (input) Racing mark locations (input) Boat speed Apparent wind speed Apparent wind angle Heel angle Leeway angle Water angle Compass heading
True wind speed True wind angle True wind heading Expected course on opposite tack Speed-made-good to windward (leeward)
Dead reckoning position Range and bearing to next mark Time (or distance) to and on lay lines Speed-made-good to windward lost during
a tack Elapsed time since last tack Stopwatch Time-of-day
Optimum boat speed (or speed-made-good) from polar curve data for present conditions
Boat speed differential between actual and optimum
Rate of acceleration Optimum course to next mark, based upon
best optimum speed-made-good relative to rhumb line
Optimum downwind sailing courses Predicted apparent wind speed and angle
on next leg of race.
The inputs to the computer were taken from standard instrument transducers, consisting of paddlewheels for boat speed, wind cups for wind speed, a synchro potentiometer for wind angle, and a bridge pot for water angle. Among the non-standard inputs were a potentiometer rigged with a pendulum for sensing the heel angle, an electronic compass giving the heading, and an integral crystal oscillator providing the time. Provision was made for reading and recording the rudder and trimtab angles and pitch motion acceleration. The machine was also designed to record all input variables on tape as well as to send them to the shoreside analysis computer by telemetry to speed up the analysis of performance.
The shoreside computer center was named "Starship Nova" because of its Data General Nova-4X computer with disk and tape storage and dual programming capability. Its purpose
was to gather the data from the telemetry re
ceiver or tape reader, create the data files,
update the polar curves, and generate plots which could help in improving tacking ability. Except that computing speed and data storage are greatly reduced, this machine's function can be set up on a home computer.
Needless to say, assembling this system took enormous effort. The original system for CLIPPER was conceived to function primarily as a "real time" machine with moderate shoreside analysis. After her launching in April, 1980,
the Data General Corporation added large-scale
support of equipment and personnel to expand the capabilities for CLIPPER. This included the Nova system, and three systems engineers led by Tom Johnson. The resources of the University of Rhode Island were made available,
most notably through the nearly full-time assistance of Lex Brincko. Richard Mccurdy, after having designed and built the on-board system, directed the shoreside staff, including
custom electronics assemblers and three people operating the system daily. Pedrick Yacht Designs managed the over-all organization of the system components and staff, and coordinated the application of the system between the sailing personnel and computer staff.
Additional major equipment in the system were a Nicolet-Zeta drum plotter, a Science Accessories sonic digitizer, and modems by Avanti Communications.
Telemetry
The means of getting a large quantity of data fed into the computer rapidly presented logistical and cost problems. The audio cassette recorder was reliable, but could only be
unloaded into the Nova at the same rate at
which it recorded (1200 baud). So, five hours of data meant five hours to transfer the data. It was judged that floppy disks would never survive a Twelve-meter environment (wet), so
necessity became the mother of invention. A
5-watt VHF transmitter was built, using a Brincko special lightweight antenna mounted on CLIPPER's jumper strut. Adding modified modems on CLIPPER and ashore to convert computer serial stream to radio wave and back, the onboard data was transmitted to the Starship Nova base twice per second. In five hours of pro
ductive sailing, more than a quarter of a
million separate instrument readings could be read from CLIPPER and loaded into the Nova. After the initial debugging period, the telemetry link was virtually 100 percent reliable
for distances of up to twenty miles. The performance of CLIPPER could be monitored on one of the system's cathode ray tube screens, and notations (such as sails used or other comments) could be typed into the terminal keyboard on CLIPPER for storage in Nova and display on the screen. Nova could not talk back to CLIPPER since such outside assistance would not be ' permitted while racing. Statistical analysis
could be started while CLIPPER was still sailing, speeding up the analysis and production
of plots and statistics.
2 1
Sampling Rate
Since wave dynamics have an effect on ship's performance, the on-board machine was required to calculate all its resultant information at a 1/4 second rate, or four times the assumed minimum pitch period of 1 second. Limitations in the rate at which data could be sent via telemetry allowed only two samples per second to be sent ashore for analysis, but it seemed to be enough to get the information on
wave action.
Closing the Wind Triangles
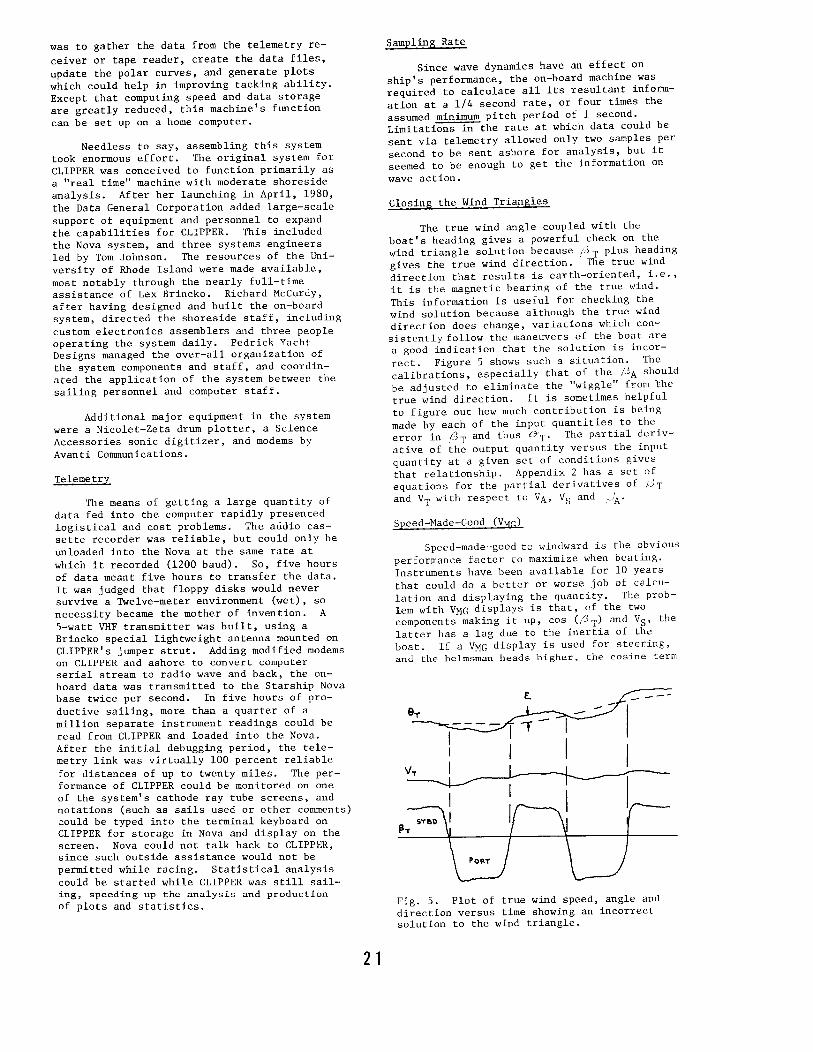
The true wind angle coupled with the boat's heading gives a powerful check on the wind triangle solution because (3 T plus heading gives the true wind direction. The true wind direction that results is earth-oriented, i.e., it is the magnetic bearing of the true wind.
This information is useful for checking the wind solution because although the true wind direction does change, variations which consistently follow the maneuvers of the boat are a good indication that the solution is incor
rect. Figure 5 shows such a situation. The calibrations, especially that of the /OA should
be adjusted to eliminate the "wiggle" from the true wind direction. It is sometimes helpful to figure out how much contribution is being
made by each of the input quantities to the error in (3 T and thus &T. The partial deriv
ative of the output quantity versus the input quantity at a given set of conditions gives that relationship. Appendix 2 has a set of equations for the partial derivatives of /)T
and VT with respect to VA, Vs and ---'A"
Speed-Made-Good (VMG)
Speed-made-good to windward is the obvious
performance factor to maximize when beating. Instruments have been available for 10 years
that could do a better or worse job of calculation and displaying the quantity. The problem with VMG displays is that, of the two components making it up, cos (f3T) and Vs, the latter has a lag due to the inertia of the boat. If a VMG display is used for steering, and the helmsman heads higher, the cosine term
I I I I ~a 1/\1 r BO
Fig. 5. Plot of true wind speed, angle and direction versus time showing an incorrect solution to the wind triangle.
increases immediately, without the corresponding drop in Vs, and thus the VMG reading increases. If he heads off, VMG decreases immediately. The VMG displayed is truthful, but the dynamics are misleading. VMG displays can be used, but very carefully, and should have a large averaging to show the long term progress to windward under conditions maintained by some other sailing attitude indicator like wind angle or boat speed.
Polar Curves
Polar curves are very useful tools, not only for sail selection, but for predicting performance under planned future conditions. In the CLIPPER computer system, they served as the predicted boat speed input for estimating the next leg apparent wind, and in determining the best course to take toward a mark.
The predicted apparent wind is merely a backwards solution of the wind triangle, using the future course-~N• the true wind direction
-Et-T and speed VT, and the polar curve prediction of Vs. The calculation is as follows:
The predicted true wind angle is ./3TP = G-N --&T
The predicted boatspeed is Vsp = polarq3TP• VT)
The predicted apparent wind components are then
VAL= VT cos((3TP) + VSP (all V or f3 with subscripts)
and the predicted wind is given by
VAA
l '.1 AP = arc tan VAL
v =vz+v·z-AP\AA AL
Note that heel and other corrections are not included in this simple algorithm because they introduce only a small error when going from true to apparent.
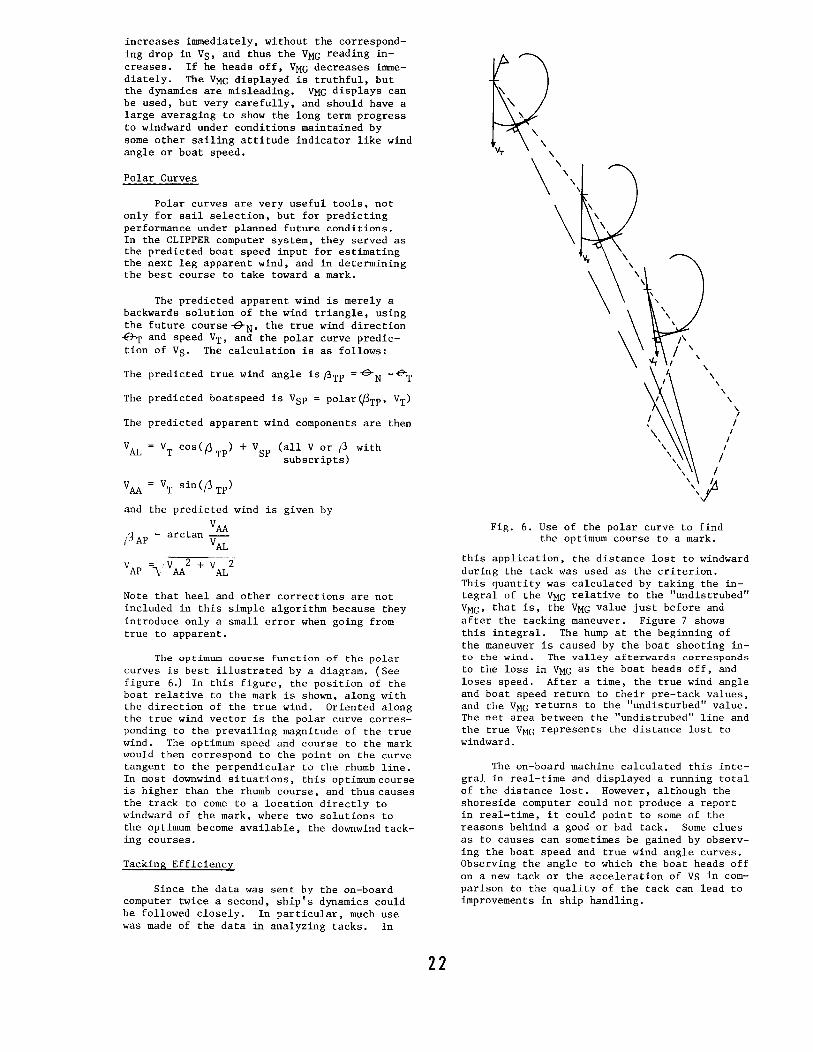
The optimum course function of the polar curves is best illustrated by a diagram. (See figure 6.) In this figure, the position of the boat relative to the mark is shown, along with the direction of the true wind. Oriented along the true wind vector is the polar curve corresponding to the prevailing magnitude of the true wind. The optimum speed and course to the mark would then correspond to the point on the curve tangent to the perpendicular to the rhumb line. In most downwind situations, this optimum course is higher than the rhumb course, and thus causes the track to come to a location directly to windward of the mark, where two solutions to the optimum become available, the downwind tacking courses.
Tacking Efficiency
Since the data was sent by the on-board computer twice a second, ship's dynamics could be followed closely. In particular, much use was made of the data in analyzing tacks. In
22
' ' ' ' ' ' ! I
I I
I
I I
Fig. 6. Use of the polar curve to find the optimum course to a mark.
this application, the distance lost to windward during the tack was used as the criterion. This quantity was calculated by taking the integral of the VMG relative to the "undistrubed" VMG• that is, the VMG value just before and after the tacking maneuver. Figure 7 shows this integral. The hump at the beginning of the maneuver is caused by the boat shooting into the wind. The valley afterwards corresponds to the loss in VMG as the boat heads off, and loses speed. After a time, the true wind angle and boat speed return to their pre-tack values, and the VMG returns to the "undisturbed" value. The net area between the "undistrubed" line and the true VMG represents the distance lost to windward.
The on-board machine calculated this integral in real-time and displayed a running total of the distance lost. However, although the shoreside computer could not produce a report in real-time, it could point to some of the reasons behind a good or bad tack. Some clues as to causes can sometimes be gained by observing the boat speed and true wind angle curves. Observing the angle to which the boat heads off on a new tack or the acceleration of VS in comparison to the quality of the tack can lead to improvements in ship handling.
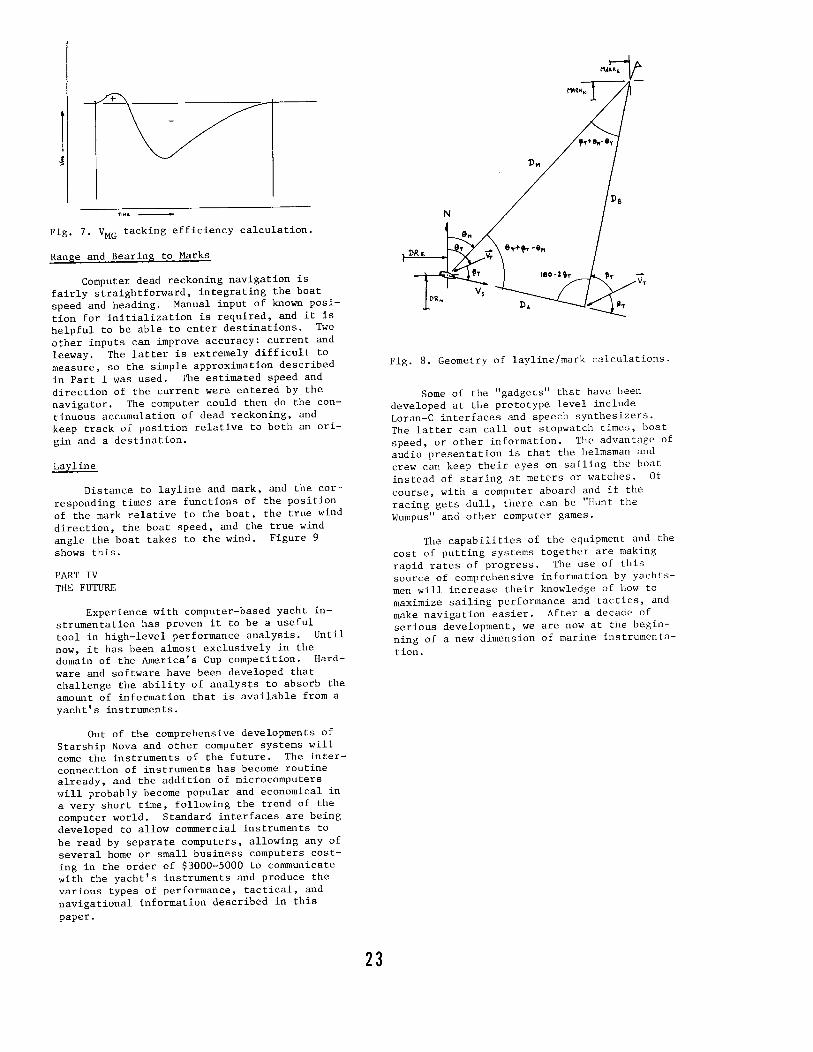
Fig. 7. VMG tacking efficiency calculation.
Range and Bearing to Marks
Computer dead reckoning navigation is fairly straightforward, integrating the boat
speed and heading. Manual input of known posi
tion for initialization is required, and it is helpful to be able to enter destinations. Two
other inputs can improve accuracy: current and
leeway. The latter is extremely difficult to
measure, so the simple approximation described
in Part I was used. The estimated speed and
direction of the current were entered by the
navigator. The computer could then do the con
tinuous accumulation of dead reckoning, and
keep track of position relative to both an ori
gin and a destination.
Lay line
Distance to layline and mark, and the cor
responding times are functions of the position
of the mark relative to the boat, the true wind
direction, the boat speed, and the true wind
angle the boat takes to the wind. Figure 9
shows this.
PART IV THE FUTURE
Experience with computer-based yacht in
strumentation has proven it to be a useful
tool in high-level performance analysis. Until
now, it has been almost exclusively in the domain of the America's Cup competition. Hard
ware and software have been developed that challenge the ability of analysts to absorb the
amount of information that is available from a
yacht's instruments.
Out of the comprehensive developments of
Starship Nova and other computer systems will come the instruments of the future. The interconnection of instruments has become routine already, and the addition of microcomputers
will probably become popular and economical in
a very short time, following the trend of the
computer world. Standard interfaces are being
developed to allow commercial instruments to
be read by separate computers, allowing any of several home or small business computers cost
ing in the order of $3000-5000 to communicate
with the yacht's instruments and produce the
various types of performance, tactical, and
navigational information described in this
paper.
23
DR1t
Fig. 8. Geometry of layline/mark calculations.
Some of the "gadgets" that have been developed at the prototype level include Loran-C interfaces and speech synthesizers. The latter can call out stopwatch times, boat
speed, or other information. The advantage of audio presentation is that the helmsman and crew can keep their eyes on sailing the boat
instead of staring at meters or watches. Of
course, with a computer aboard and if the racing gets dull, there can be "Hunt the
Wumpus" and other computer games.
The capabilities of the equipment and the
cost of putting systems together are making
rapid rates of progress. The use of this
source of comprehensive information by yachts
men will increase their knowledge of how to
maximize sailing performance and tactics, and
make navigation easier. After a decade of serious development, we are now at the begin
ning of a new dimension of marine instrumenta
tion.
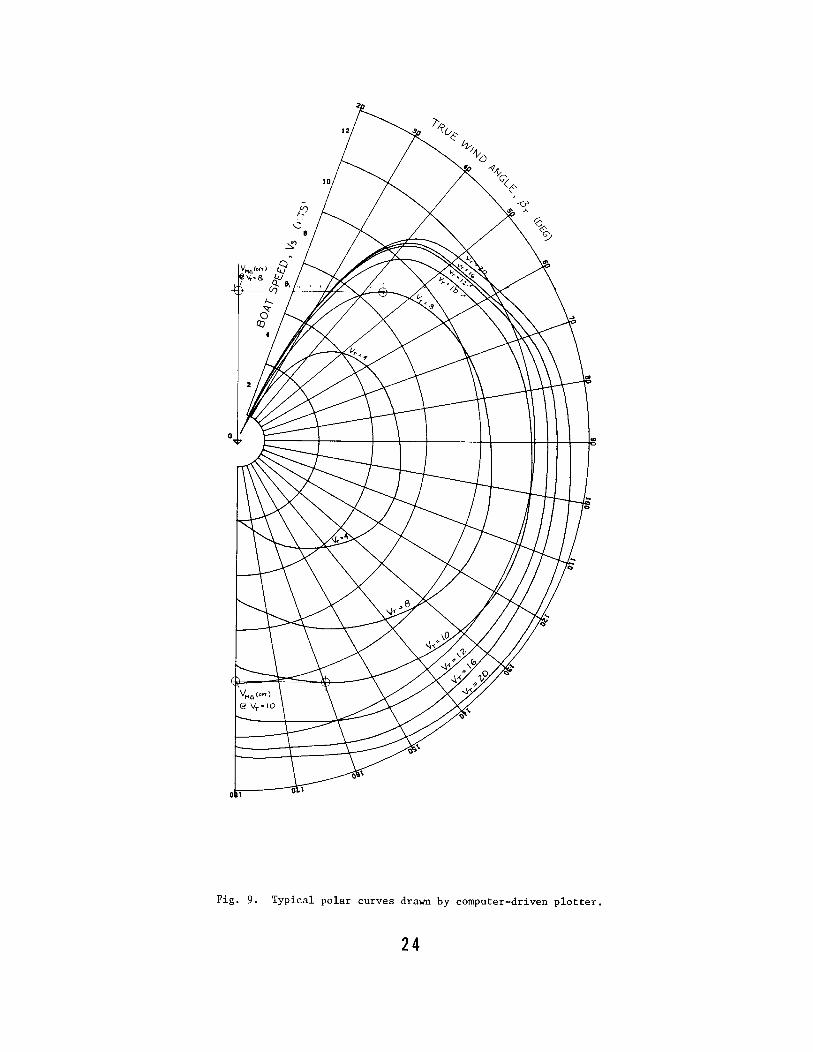
Fig. 9. Typical polar curves drawn by computer-driven plotter.
24
"-l (.J'1
APPENDIX 1 PROGRAM TO CALCULATE TRUE WIND, VNG' AND TACKING ANGLE
HP-65 User Instructions. r"le __ J{,_j!_Q _U{'.._T__l__QAf_Qf___J..!\IS_T'KU_'1_f;l:,tr ___ !'A.IA_ r\1r~·~ - i. ti' 2.
Prc1q· 1mrn·,·1 _l/!t'l •_l.L_R_._~-----·--------~------~ Ueh' J_3_ (([L7 r'
[ I I I I --;t~ (1 . 6 -- I j -:-zl ' I I
STEP INSTRUCTIONS INPUT r KEYS 1 OUTPUT
t-+-------------~D~AT~Ai'..!'_UN!!!_IT!=.S DATA/UNITS
. -- -- - vs [ - II A I g~_g_!(_JL(I~Li: ,_QlSf'L4t __ :u-~~~- -~if~ _ l __ ~-_]-;!sJ ?_
.Ofl:f'K_E>_Q~T' .SflEIL ____ _ /...
J i:1o1__u_~!!1~mLAPl>tf_~~-~,_~.1_1~_.VP --~4'.r,r _ ~_l~r.s I I ' I .._f..JT_!ic~e.<i'1fl/f Wtf..10 li¥JL/~~~-- - c::JL~----1
__E~__L0-5't!:1!:tl; _ _o1sfMj' _T_/e.UI f!J!J.lD ~Pq_. _____ f3- CJ _____ l_~!~J~ _VT
.<' l2LS.PLA '( U\Jf! VJl/1£.Af_!_t;~---- c=:J~ t -- - {~~~]-=--1 ~ =~-=-1
CJc::=J G,. Qi_$_f'LAY SPUD -MAPl!-C~co-ro •UJ1!:2f-.J•J_4_e,,Q_ _
Ctm"~-'~--2.£.llQv~K r._L ___ _ I . T'~'' '~ TA~~~'-~NC~.·~~·.· I
I ,-
i'o~e,i_1t£i;T_____i_'._£_~ __ S!:B~-~l-~IL.
_ _ADD I • TO Por~ _ _l!!-'?'2~- __
t_'_:rr,_: __ !l'flQ'_i_f(,__ :SOJ..UT!O~J -~'~_r_
~E_!;_1_!_} .CLJ.L<;__~< Tr _;>_5 _:S-+ {., ~ ::L _
_______ ,L_JCS[DL ~·6 c=J~ c:::rE:J t=Jt:=j cJCj-t=-=:Jt='=Jl CJC:J' - - - - _L_ CJc=J c~ft:~:::J"-c:JE:J
TL
c:JCJ~---- --C:=Jc::J -- ----·c:Jc::J
~- _J--r! r-l
____________ _.___ __ -Jt~ _ _:::jc:Jl
I ~ ~ .
HP-65 Program Form , ,, .. __ _Ks; D_\lLUQti ___ QE_J N_5TB.U_Mfl'lI _[J,\TA __ f\-,;)('_ _r.f
~W>!(.H TQ W'f'Rt."4 P~FSS L_! 1 L~_J TO ClEll.~ ~f~'Oil f
I KEY- cooE c~·MENTS KEY CODE COMMENTS I REG1s~;;-ENTnY SHOWN ' ;..:E::;N:..:T:.;R;,.Y.+;S:cHO=..W=N+------------l
µ~_L_ '" J·I 3Z. ----- R1'<'.s_.-:---= f--A // "-J.JTJl'V. T .. , e(._~---------------1 ___ _
--------
t_~.=:_;~_.J!_filf~-----= ~~-;-~ ---=----===---= tR2 !l'~ :...-=
tTO Z. ·;n az. II."''"' i'.'!J" ll. ___ _
'X..~I 11' ..... 07 -- (,JI (,,' 01 ----------
_.:L::_t--· J' J_ at; __ R3 Y'-:,,,_ __ _ fX oq __ 1--~0"-~'-~"-"-+----------~
..!. ''i I + _i_!__, ,. - ---
" 'l o'I l..rTo -~ :n o.r~n.1· 1 ~ ~~·1'.~-1 /'. "'If '), ~ ::!.-"' IP'C-C.. 7 "34 ~~'-_~ f°".----
ls~~_,s7_ 3"J -~~-~~ir_u_~ ~~0t ._ -=- --=---==-- ~L '~f-zi~ :.t ff >JTFiLf3---- '°C~ - ~}->-_==--==-~-==--=-r--:_,-~~~-
I-'-'-'-'. ci-n_-1 3_;; _c_':i_~---------- ______ .~L _ _£ li_b f_ _ ___ _______ _ _ Rs _!l_ __
c~s_----·~ ------------=_----= ~~--~±_===--====~~ --~---==-~ ,~~y;+-I.CN~---- ----~ ---:1-~i ------------- R7 _L_
~~-r:;--~~----------- ~+---~:-· ~- .-_ -%-~..!!!:r o, __&S __ ~-_____::._.r----- _________ IRa-4---- _
'}-Y'-:;! ,.U.J.1_ _ X "'I I
.ll,.-1<:'~ 3( tJ7 -- .,, ~ ~4 tJ:l .. ,,.,,,. -------
" >l•'F :i.< 01 ~ ;riv·"-=-~ :JIR'-----o 3 _.. ~~~-_,'-r--~'!.~·4'+--------
1< ,, ~ .. p "' Ii-- -wt 1--ll!~C~:&.~f-+-'3'4--<1-I-+----------
,--_.,'< _QJ'. - _,., I
'"" P • H ooiit Foo.._...._-#_+---'~~1.,._ ________ _
~ -,f ... , DI ~------
1 01 __ 1"1..-..,,, ....... :!.....µI nlL.-?. ""+--·-:--c--~ #r' ,r./< '1-4 '" !J'J.•" Yr
)<. ,, .r.tlTl"fl;'. I a_,_ CO ._'fiw......,..,...._ .. _.,l.U...._~ot"'-+------r------j
I 2 'l<~;L J_L~1_ ----= f! /_«; "" lr.t<P'-~Y 'I!
rfZ?'o_}_[_J1 f-_.__~-+~~~t+---~---~-1 . ., w (7 • ,- Oil c:c! ___Qj'_ ___ ---II
~'-'P 3!" 01 __ r:.<:-L. / ".!~ Cll
'. ~ 0 <;. I'"\~ og IF:' { -(" ~ _:-~. ~·''-'''-x...,.._ ..... _ _._ ...,~, +-------.,------
,S.<;t._ 4. L.1.4- _<":1 --------- ---- -- --~ - _ _31_ Ql~J_}_'{ _ ___\/_,,. ____ _
~~J~r~t~~ ~.= :_~ Yf }:''}~: •· _ ~"'L 2 ~J __ <'.lL~ _ .£..1.L~Q lll~!''.J .. JL.It, ___ _
f_ ~1--1--- ---------------· ------------
c;-~- -}f L----------~ 10() -·------- ---TOMCOM ~ ..... , lllAloN(~1c c ... -.n WITH SWITCM..,. AT ... riw;;.M
LABELS ,. ___ _ •--c_ -- -o ___ _ E ----Q ___ _
, ----
2 ------3 ------" -------5 -----6 ____ _
7 ___ --
•------· g _______ -
~l.AGS
2 --- --- --.
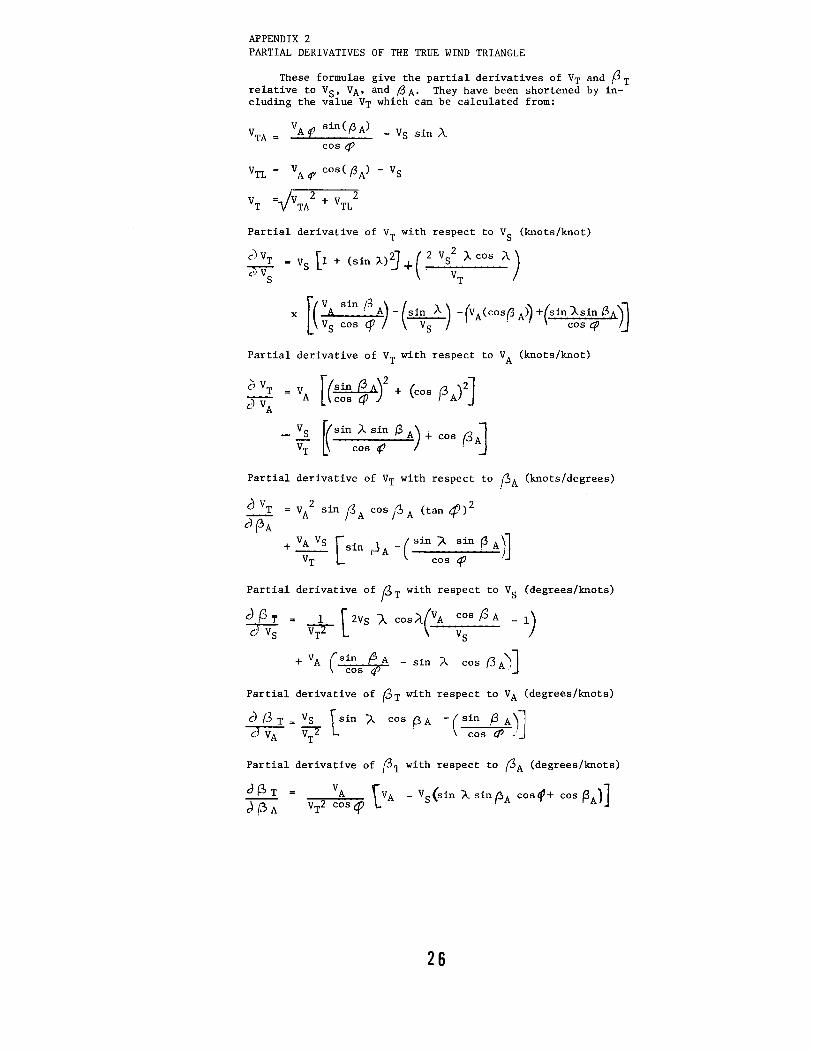
APPENDIX 2 PARTIAL DERIVATIVES OF THE TRUE WIND TRIANGLE
These formulae give the partial derivatives of Vr and /3r relative to Vs, VA, and f3A· They have been shortened by including the value Vr which can be calculated from:
- Vs sin A. cos cp
VTL = VAtf' cos(f3A) - Vs
VT =.,,/vTA2 + VTL2
Partial derivative of VT with respect to VS (knots/knot)
cJVr =Vs [1 +(sin ;q:J +( .2 vs2 ;A cos /\.) ,~vs vr
x f1( VA sin f?i A) -(sin A) -(v A (cos~ A~ +(.sin A sin f?A)il L vs cos q:i / -v;- cos cp '._}
Partial derivative of VT with respect to VA (knots/knot)
[(~!~ ~Ay + (cos (3 A)2]
ft( sin ).. sin (3 A) + cos (3 Al ~ cos q? . J
Partial derivative of Vr with respect to (3A (knots/degrees)
0 VT = v/ sin f3 A cos /3 A (tan 4J) 2
c) (3A +VA Vs [sin ,JA -(sin j1.. sin (3 A)]
VT cos ef'
Partial derivative of /3r with respect to VS (degrees/knots)
c;) PT = 1 [zvs A. cos.A_(VA cos /3 A _ 1) d Vs v;r vs
+ VA (sin f3 A - sin /\. cos (3 AJ] cos (/>
Partial derivative of
c) f3 T = Vs \sin )... CJV;: vr2 l
(3r with respect to VA (degrees/knots)
cos {3 A - ( sin {3 A)] cos cp ./
Partial derivative of f3r with respect to (3A (degrees/knots)
26
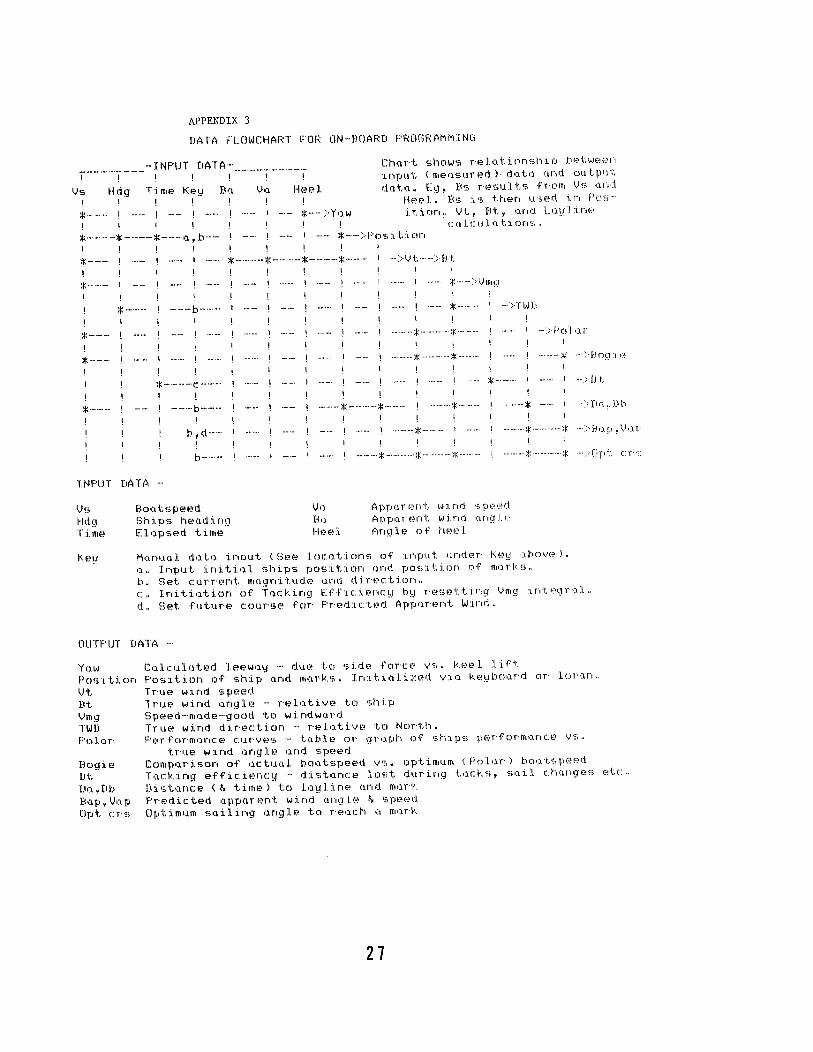
APPENDIX 3
DATA FLOWCHART FOR ON-BOARD PROGRAMMING
----·-···-· -·--- - I NF'LJT DA TA---·-·-··-·-·--··--·- Chart shows relationsh1D between input <measured> data and output data. Eg, Bs results from Vs and
! !
Vs Hd~J I
Ti. me Ke\! !
·--- I -- ! -- I -- *··--··>Yo:1w Heel. Bs is then used in Position, Vt, Bt, and Layline
co:1lculot1on~:; .. \ I ! ! •----•----*---a,b-- ! 1 -- *--)Position I I ! !
*·-·-·-··
*··--·--
*----··
*·----- !
! !
-·--b·-·····-··
*--·-·--·c-··········
--·-·b··---··-
b,d··-····
b-··-·-
*·-········ I >ll,.Jf.I
I ············*····· '*'•' .... ·:,\'-'Cl l •1 f'
···:t:: .*....... ········-··* ··>Bo~n•·:-~
-- *- ->Dt
! ---·----*--- ---*- -* ->Da,Db
····--···:J::······-··- I
INPUT DATA ··-
V~;
Hd<J T:i.m€1
Boot~:.pef.1d
Shi.ps heading El•ipsf.1d time
Vo. f.«1 H€!f.!l
Apporent wind speed Apparent wino angle Angl.~? of hf.!E~l
Key Manual data input (See locations of input under Key above> ..
a. Input initiol ships position ond position of rr~rks.
b. Set current magnitude ond direction. c. Initiation of Tacking Efficiency by resetting Vmg integral.
d. Set future course for Predicted Apporent Wind.
OUTPUT DATA
Yo:1w Pcisition Vt Bt Vmg TWD PoJ.01 ..
Bogif~ [It
Do:1,Db Bo:1p, Vo p Dpt cr·s
Colculated leeway - due to side force vs. keel lift
Position of ship and morks. Initialized via keyboard
Tr·u~! wir1d spf~ed
True wind ongle - relative to ship Speed-mode-good to windword True wind direction - relotive to North.
or·
Performonce curves - table or groph of ships performonce vs.
true wind angle and speed Comporison of octuol bootspeed vs. optimum <Polar) bootspeed
Tacking efficiency - distance lost during tacks, soil changes etc.
Distance C& time> to layline ond mork Predicted opporent wind angle & speed Optimum soiling angle to reoch a mark
27