Embed Size (px)
Citation preview

The Social and economic Value of
PriVaTe and communiTy foundaTionS
Robert J. Shapiro, Ph.D. and Aparna Mathur, Ph.D.
December 2008

table of contents
Introduction 2
The Role and Significance of Private and Community Foundations 6
The Economic and Social Benefits and Value of Foundation Activities 9
Indirect Benefits from Private Foundation Support 32
The Potential Impact of Taxing Foundations and Non-Profit Organizations 34
References 35
About the Authors 36

I. IntroductIon
Over the last decade, the dimensions and consequent impact of philanthropic activities have increased sharply. From 1997 to 2007, foundation giving soared from $16.0 billion to $42.9 billion ($33.2 billion in constant, 1997 dollars), while total foundation assets grew from $329.9 billion to $669.5 billion ($518.2 in constant 1997 dollars).2 By 2007, the assets of U.S. private and commu-nity foundations were equal in value to all of the fixed assets of the American agriculture, mining, and utility industries; and foundation giving in that year exceeded the GDP of 110 of the 180 countries tracked by the International Monetary Fund and the World Bank.3
Given the large financial resources of U.S. private and community foundations and the tax preferences which foundations can claim, the finding that their grants and activities are closely linked to large social and economic benefits should be a matter of significance. While the organizations which use foundation contributions have other sources of financial support and in-kind resources that also contribute to these returns, foundations are the predominant source of the support that generates
these high returns. Each dollar of a foundation grant also produces indirect economic benefits by boosting employment and incomes for the beneficiaries of these private and community foundation activities, and new government revenues based on this additional income. While these indirect benefits also vary substantially across grant areas, we find that the $42.9 billion in foun-dation support extended in 2007 helped to generate nearly $512 billion in additional household income and some $145 billion in additional government revenues.
These estimated returns or economic welfare benefits of some $367.9 billion were distributed across 11 broad, grant areas:
$5.2 billion in private and community foundation •support for arts and culture programs in 2007 helped produce an estimated $51 billion in direct, economic benefits.
$9.7 billion in foundation grants and support for •education-related programs helped produce an esti-mated $49 billion in such direct benefits.
In a period often called a “new golden age of philanthropy,” public interest has increased about the social and
economic effectiveness of philanthropic activities. This study analyzes and estimates the general economic or
welfare benefits generated by the work of these foundations and is, to our knowledge, the first such broad
analysis and estimate conducted in the United States. This analysis finds that the grants and other operations
of foundations generate very large economic returns. While the benefits vary in size across various grant areas,
on average, each dollar that private and community foundations provided in grants and support in 2007 pro-
duced an estimated average return of $8.58 in direct, economic welfare benefits. As a result, the $42.9 billion
in grants and other support provided by private and community foundations in 2007 produced some $367.9
billion in direct, social and economic benefits.
1 This study was conducted with support from The Philanthropic Collaborative. The views and analyses are solely those of the authors. 2 Lawrence, Steven, Algernon Austin, and Reina Mukai. “Foundation Growth and Giving Estimates: Current Outlook.” Foundation Center, 2007,
http://foundationcenter.org/gainknowledge/research/pdf/fgge07.pdf.3 Bureau of Economic Analysis. “Table 3.1E: Current-Cost Net Stock of Private Equipment and Software by Industry,” www.bea.gov/national/
FA2004/TableView.asp?SelectedTable=21&FirstYear=2002&Last. Year=2007&Freq=Year.
the SocIal and economIc Value of PrIVate and communIty foundatIonS1
Robert J. Shapiro, Ph.D. and Aparna Mathur, Ph.D.
2

3
$2.6 billion in foundation grants and support for •environment and animal/wildlife-related programs helped produce estimated benefits of $17.3 billion.
$9.9 billion in foundation grants and support for •health-related programs helped produce an esti-mated $74.9 billion in benefits.
$5.9 billion in foundation grants and support for •human-service programs helped produce estimated benefits of $64.7 billion.
$4.6 billion in foundation grants and support for pub-•lic affairs/society benefit-related programs helped produce an estimated $101 billion in benefits.
$1.2 billion in foundation grants and support for sci-•ence and technology-related programs helped pro-duce estimated benefits of $6.1 billion.
In four other categories of foundation support, there •are no sound metrics for estimating their social and economic benefits. These areas cover programs focused on promoting international peace and human rights, religious faith, social science analy-sis, and “other” areas. While we believe there may well be very substantial benefits arising from these unquantifiable areas of foundation activity, for this analysis we attribute benefits in each of these cat-egories equivalent to their support and grants:
Private and community foundation support pro-•duced benefits of at least $2.3 billion from pro-grams in international affairs, peace, and human rights;
Private and community foundation support pro-•duced benefits of at least $926.4 million from religion-related programs;
Foundation support produced benefits of at •least $581.2 million from social science-related programs;
Foundation support produced benefits of at least •$37.9 million in other, miscellaneous areas.
Such large-scale support and benefits also produce sub-stantial indirect economic and social benefits. For exam-ple, foundation support will generally help generate new jobs in particular communities, which in turn produces
higher household incomes; and this expansion in incomes has what economists call a “multiplier effect” as spending by those who have gained jobs and additional income stimulates additional job creation and income for those who produce and provide the goods and ser-vices consumed by the initial beneficiaries. In addition, much of this additional economic activity generates tax revenues for the federal, state and local governments. Previous research has found, for example, that every dol-lar spent by arts and culture nonprofits generated $1.65 in additional, direct household income and 45-cents in additional, direct federal, state and local revenues.4 To estimate these indirect economic effects linked to foun-dation support, we use employment by nonprofit, 501c(3) charities as a proxy for employment by the organizations and entities receiving foundation support. Using other studies analyzing indirect income effects from additional employment as well as our data on private foundation activity, we estimate that in 2007, the activities of private foundations substantially accounted for:
9,226,000 jobs in 501c(3) entities linked to the activi-•ties of private and community foundations;
$511.9 billion in household income in 2007 that •can be traced to these activities and the associated employment; and
$145.4 billion in total revenues in 2007 that can be •traced to the additional income and the jobs that generate it, including $38.8 billion in local revenues, $44.7 billion in state revenues, and $61.9 billion in federal revenues.
Recent research has estimated that the tax-exempt sta-tus of all charities, including foundations, costs local governments between $8 billion and $13 billion in revenues per-year.5 Based on our analysis of the jobs and incomes generated directly and indirectly by the
The Social and Economic Value of Private and Community Foundations
4 Americans for the Arts. “Arts & Economic Prosperity III: The Economic Impact of Nonprofit Arts and Culture Organizations and Their Audiences,” 2007, http://www.americansforthearts.org/pdf/information_services/research/services/economic_impact/national_findings_summary_report.pdf.
5 Strom, Stephanie. “Tax Exemptions of Charities Face New Challenges.” New York Times, 26 May, 2008, http://www.nytimes.com/2008/05/26/us/26tax.html?_r=1&oref=slogin, and Brody, Evelyn. Property Tax Exemption for Charities: Mapping the Battlefield. Urban Institute Press, 2002.
While the benefits vary in size across various grant
areas, on average, each dollar that private and
community foundations provided in grants and
support in 2007 produced an estimated average
return of $8.58 in direct, economic welfare benefits.

The Social and Economic Value of Private and Community Foundations4
activities of private foundations, these activities gener-ate substantially greater revenues than those foregone by the tax-exempt status of foundations. Since founda-tions depend on tax-preferred donations to carry on their activities, taxing those donations or the assets and income that finance their activities would be equivalent to taxing the public service and social benefits they pro-vide, and potentially would dramatically curtail those activities at a net loss of revenues.
Data and Methodology
Analysis of the economic benefits or value generated by private and community foundations begins with the volume of grants or support which they provide across a range of areas. The Foundation Center issues the most detailed accounting of the provision of grant dollars, distributed across 11 broad topic categories and 15 sub-categories.6 These 11 broad areas of private foundation activity cover: 1) arts and culture; 2) education; 3) envi-ronment and animals/wildlife; 4) health; 5) human ser-vices; 6) international affairs, peace and human rights; 7) public affairs/society benefit; 8) science and technology; 9) social sciences; 10) religion; and 11) “other” areas not covered by the preceding ten categories. As an example of the sub-categories, the Foundation Center classifies grants in the arts and culture category in nine sub-categories, including policy management and infor-mation; arts-multipurpose; media and communications; visual arts and architecture; museums; performing arts; humanities; historic preservation; and other.
The Foundation Center data are based on a sample of 1,263 large U.S. private and community foundations, including 800 of the 1,000 largest foundations, and in
2006 covered $19.1 billion in grants and support, or 49 percent of a reported total of $39.0 billion in total foundation activity that year. This accounting, therefore, is statistically representative of the universe of founda-tion activity in the United States, which totaled $42.9 billion in 2007.7 We rely on the Foundation Center data because their disaggregation into categories and sub-categories enables us to use a vast literature on the value of specific nonprofit and public activities to evalu-ate the economic and social value of the wide and var-ied range of private foundation activities.
This evaluation begins with two adjustments from the 2006 sample: we adjust the totals for the samples of each sub-category and category for the total reported foundation grants in 2006, and then we adjust each of those sub-category and category totals for the increase in total foundation activity from 2006 to 2007. These adjustments provide reliable estimates of the distribution of total private and community foundation activity across categories and sub-categories for 2007. Table 1 provides these sample data and their adjust-ments for the 11 broad categories of private founda-tion activities.
Recently, there has been considerable interest in esti-mating the social return on investments generated by charitable contributions and activities, although most nonprofits do not undertake the complex analyses required to calculate such estimates. We surveyed the reports which nonprofits have published in each of the categories, and a summary of many of those reports is available in a recent study co-sponsored by the World Bank.8 To supplement these analyses, we also surveyed the academic literature on economic and social benefits from nonprofit activities, as well as government analyses of public programs in many of these areas. This study draws on more than 90 such studies and evaluations, some of which cover a single foundation or public pro-gram and others which cover many programs. We iden-tify the appropriate sub-category, average the results in cases of multiple evaluations, calculate a weighted average of the reported returns or benefits for each sub-category, and estimate the total returns for each sub-
6 Foundation Center. “FC Stats: Distribution of Foundation Grants by Subject Categories, circa 2006,” http://foundationcenter.org/findfunders/statistics/pdf/04_fund_sub/2006/10_06.pdf.
7 Foundation Center. “Highlights of Foundation Giving Trends.” Foundations Today Series, 2007, http://foundationcenter.org/gainknowledge/research/pdf/fgt07highlights.pdf.
8 Nonprofit Roundtable of Greater Washington, and World Bank Group. “Beyond Charity: Recognizing Return on Investment,” 2007, http://www.nonprofitroundtable.org/media/downloads/beyondcharity.pdf.
Based on our analysis of the jobs and incomes
generated directly and indirectly by the activities
of private foundations, these activities generate
substantially greater revenues than those foregone by
the tax-exempt status of foundations.

The Social and Economic Value of Private and Community Foundations 5
category and category. The current literature, however, does not cover every sub-category of foundation activ-ity, nor is every study representative of all foundation activities in any category or sub-category. Our analysis, therefore, represents an initial effort to generate the broad bounds of the economic benefits generated by private and community foundations, calculated with the rigor that the available literature and data support. As more data become available, these results can be strengthened and refined.
As noted earlier, four categories of foundation activity are assumed to produce benefits or returns equal to their grants or support. In the category of religion, for example, foundation funds for religious organizations such as Acts 1:8 Ministry and the Knox Fellowship sup-port church outreach programs and evangelical activities by churches, ministries and individuals seeking to share their faith. More than 90 percent of the resources of these organizations are devoted to organizing activities at the designated churches and encouraging participa-tion in their outreach programs.9 These activities create direct value in the sense that they energize communities and individuals and presumably provide spiritual and practical nature to their participants. In this case, we assume a return on foundation funding or investment of 1.0:1. The support produces an equivalent level of value or benefits. Based on our review of the activities of
private and community foundations in three other cat-egories, and the available evaluations of those activities, we adopted the same approach for foundation activity related to international affairs, peace and human rights, social science research, and the small, miscellaneous or “other” category.
Finally, we distinguish between the direct and indirect economic and social benefits of foundation activity. There has been relatively little rigorous analysis of the direct benefits of foundation activities, which encom-pass many hard-to-measure economic and social effects which those activities may have on the conditions, people and communities that those foundations seek to improve and help. These benefits can take the form of cost savings to the society or the economic value of broader social benefits. For instance, the benefits aris-ing from foundation projects supporting in-home care for the elderly could be estimated by the number of people helped and the cost savings from in-home care compared to hospitalization, as the direct benefits from projects supporting worker training would be estimated by the number of people trained and the increases in incomes from jobs secured based on their new training. In our examination and analysis, we found hundreds of organizations engaged in diverse areas providing these kinds of benefits. It is often difficult, however, to quantify all of the value of some of these benefits. For instance,
table 1 total Private and community foundation activity in 2007, by category, based on foundation center sample from 2006 ($)
category sample, 2006 share estimated activity based on
$42.9 billion in activity in 2007
Arts and Culture $2,329,708,000 12.2% $5,226,392,067
Education 4,306,090,000 22.5% 9,660,143,940
Environment and Animals 1,145,100,000 6.0% 2,568,880,545
Health 4,394,462,000 23.0% 9,858,394,845
Human Services 2,645,895,000 13.8% 5,935,713,580
International Affairs 1,019,739,000 5.3% 2,287,649,706
Public Affairs/ Society Benefit 2,042,490,000 10.7% 4,582,058,679
Science & Technology 550,591,000 2.9% 1,235,175,914
Social Sciences 259,092,000 1.4% 581,238,668
Religion 429,967,000 2.2% 926,409,978
Other 16,912,000 0.09% 37,939,837
total $19,140,046,000 100% $42,899,997,759
9 Acts Ministries. “Return of Organization Exempt from Income Tax, Form 990,” 2004, http://dynamodata.fdncenter.org/990_pdf_archive/161/161644133/161644133_200412_990.pdf.

The Social and Economic Value of Private and Community Foundations6
the value of providing education may go far beyond the additional income earned by the recipient, as the value of supporting free admission to museums reaches beyond the direct savings to museum goers. In many cases, therefore, our estimates of the direct benefits represent a lower bound estimate of the actual value of those benefits.
A number of previous studies have examined some of the indirect benefits of foundations and other nonprofit organizations, especially the number of paid positions at foundations and the consequent increases in house-hold incomes and tax revenues. Our analysis of indirect
benefits reaches beyond those arising from direct foun-dation employment. The indirect benefits from support for in-home medical care, for example, could include the in-home medical jobs created through the support, the household income generated by their work, the additional jobs created to meet the additional demand generated by those increases in income, and the addi-tional tax revenues paid on both tranches of jobs and incomes. Similarly, the indirect benefits from support for job training would include the training jobs created for such programs, the household income generated by their work, the additional jobs created to meet the additional demand generated by increases in income by both those doing the training and those receiving it, and, again, the tax revenues paid on both tranches of jobs and incomes. Therefore, we begin our analysis of indirect benefits with the employment by the 501c(3) organizations that depend greatly on private and com-munity foundation support. While some policymakers looking for new sources of revenues often note that foundations and most of the nonprofit entities they sup-port are generally tax-exempt, the data also suggest that their activities indirectly generate greater tax rev-enues for governments by employing people directly, helping people find jobs through training or other sup-ports, and generating additional economic activity and jobs that are taxed.
The economic and social benefits of foundations and their activities have become increasingly important as their numbers, assets and disbursements have risen. The number of private and community foundations doubled from 1992 to 2005. Moreover, as noted earlier, founda-tion assets expanded even faster, rising from $330 bil-lion in 1997 to nearly $670 billion in 2007 (or $518 bil-lion in 1997 dollars); while their disbursements over the same 10 years grew from $16 billion to nearly $43 billion (or some $33 billion in 1997 dollars).10 The expansion of these foundations and their support has been accom-panied by the development of new forms of foundation activity, from a hybrid nonprofit/for profit philanthropic effort established by the founders of Google and the
proliferation of donor-advised funds and giving circles, to high-profile donations of vaccines and medicines by pharmaceutical companies. As much of the growth in foundation assets and activities was fueled by the strong stock market of the 1990s and 2002-to-late-2007, how-ever, the recent market setbacks triggered by the hous-ing and financial crises will produce substantial losses for many foundations.
This analysis begins by strictly defining the universe of foundations. Foundations are entities established as nonprofit corporations or charitable trusts with the principal purpose of making grants to unrelated organizations, institutions or individuals for scientific,
2. the role and SIGnIfIcance of PrIVate and communIty foundatIonS
10 Lawrence, Steven, Algernon Austin, and Reina Mukai. “Foundation Growth and Giving Estimates: Current Outlook.” Foundation Center, 2007, http://foundationcenter.org/gainknowledge/research/pdf/fgge07.pdf.
While some policymakers looking for new sources
of revenues often note that foundations and most
of the nonprofit entities they support are generally
tax-exempt, the data also suggest that their
activities indirectly generate greater tax revenues for
governments by employing people directly, helping
people find jobs through training or other supports,
and generating additional economic activity and jobs
that are taxed.

The Social and Economic Value of Private and Community Foundations 7
educational, cultural, religious or other charitable pur-poses. This definition covers both public and private foundations, with the most important difference being that most of the funds of private foundations come from one source, whether an individual, family, or cor-poration, while public foundations normally receive their assets from multiple sources, which may include private foundations, individuals, government agencies, and fees for service.11 Private foundations can be inde-pendent or corporate foundations, including family foundations and most of the new health-related foun-dations, and they represent approximately 89 percent of foundations and 68 percent of foundation giving. The Bill and Melinda Gates Foundation is the largest in the United States, with assets of $29.2 billion.12 By comparison, the number two, Ford Foundation has assets of $11.6 billion. For the purposes of this analy-sis, community foundations are included in the class of private foundations.
Some foundations provide support to a wide variety of nonprofit organizations and purposes; others focus on a specific goal or institution; and still others focus their activities on a specific geographic area or region. Most foundation activity involves monetary gifts to nonprofit organizations, which usually also have tax-exempt sta-tus. All grants as well as administrative expenses are normally funded from investment income generated by the foundation’s endowment.
America’s first, modern foundations were created in the 1880s to benefit particular institutions such as hospitals, libraries or universities, or to respond to a particular need, such as educating poor children or sheltering orphans. Foundation giving, as we know it today, is quite recent. The first “general purpose” foundations with large endowments and broad charters emerged in the United States at the beginning of the last century. The Russell Sage Foundation is often cited as the first such modern foundation, established in 1907, followed closely by the Carnegie and Rockefeller foundations. The establish-ment of private foundations slowed significantly, how-ever, from World War I to the end of World War II, and their numbers grew rapidly again in the post-war boom of the 1950s, especially corporate-sponsored entities. This rapid growth attracted congressional concerns
about secrecy, their use to shelter wealth from tax, self-dealing and other issues. These concerns eventually led to the Tax Reform Act of 1969, which in large measure governs foundations and their giving today. The estab-lishment of new foundations slowed again in the 1970s when unfavorable tax provisions were enacted and the economy slowed; but subsequent revisions of the 1969 Tax Reform Act, including a reduction in the foundation excise tax and changes in pay-out requirements, were followed by the very rapid expansion of foundations and their assets over the last three decades.
In 2007, support from the nation’s more than 72,000 grant-making foundations reached a record level of $42.9 billion. This support has been the second-largest source of funding for the nonprofit sector.13 The largest share of nonprofit funding, however, remains fees for services and goods, such as medical services provided by nonprofit hospitals, tuition payments collected by universities, and ticket sales and admission fees charged by arts organizations.
Since the early days of organized American philanthropy, a disproportionate share of foundation resources has been located in the northeastern states. However, pop-ulation shifts, the booming Sun Belt economies, and the more recent emergence of new industries and wealth in the West and South have contributed to major shifts in the geographic distribution of foundation assets. From 1975 to 2006, for example, the share of all foundation assets located in the Western states increased from 8.1 percent to 27.7 percent (Figure 1 on the next page).
All four major regions reported growth in the numbers of assets, foundations and giving in 2006 and 2007, with those in the Western region reporting the fastest rate of growth by all three measures. Across the 50 states, the greatest percentage increases in assets in 2006 were reported by foundations in South Dakota, Rhode Island, Vermont and Louisiana, while those in Vermont, Louisiana, Nevada and North Carolina reported the largest percentage gains in grants in that year.
From an economic perspective, the existence and role of foundations and the nonprofit organizations they support can be traced to the classic “market failure”
11 Foundation Center. “Learn About Foundations and Fundraising,” updated 2008, http://foundationcenter.org/getstarted/learnabout/foundations.html.
12 This total does not include Warren Buffet’s annual transfers of $1.5 billion to the Gates Foundation for distribution.13 They provide about 12.4 percent of total funding, while nearly 70 percent is derived from services and fees. (Foundation Center).

The Social and Economic Value of Private and Community Foundations8
which occurs in the provision of certain important goods and services. In essence, markets and the exchanges they organize will not produce a society’s optimal level of activity by organizations such as hospitals, institu-tions of higher education, libraries, and museums; and in societies with limited government such as the United States, neither does the public sector. Most nonprofit organizations, therefore, deal with concerns that the private sector and the government either cannot or will not address directly and adequately, meeting needs which families, neighborhoods and communi-ties are unable or unwilling to address. The nation’s first schools were nonprofit, private endeavors, and; health care services for all but the wealthy first came to many communities under nonprofit auspices. More recently, many initiatives to stimulate business devel-opment in aging cities and poor, rural areas begin as nonprofit enterprises, and nonprofit organizations pio-neered and still lead efforts to preserve historical build-ings and art.
The traditional, “social movement literature” empha-sizes as well the role that nonprofits have played in defining social problems in the United States. In addi-tion, however, scholars focus on three other roles that nonprofits play in relation to government: 1) a comple-mentary role in which they help deliver public goods largely financed by government, such as job training, and reinforce the need for public programs; 2) a supple-mentary role in which nonprofits focus on needs unrec-ognized or overlooked by government, such as the pro-vision of personal computers for poor children; and 3) an adversarial role in which they prod the government to change public policies and secure government account-ability.14 Many individual nonprofits serve more than one of these roles. It is common for an organization, at once, to operate projects funded by public contracts, develop private donations to provide additional services unmet by government funding, and play a public policy role focused on advocacy.
While this literature assumes that most nonprofit activ-ity responds to government in one way or another, the theories explaining the existence of nonprofits and the private institutions that provide much of their support emphasize a range of both “demand side” and “sup-ply side” factors. One recent study, for example, clas-sifies as supply-side factors in the formation and work of nonprofits the legal environment, the organizational environment, and the presence of capital and human resources, as well as government policies.15 Another study found that the supply-side factors apart from gov-ernment policies can explain much of the growth of the nonprofit and foundation sectors, both in the United States and other advanced countries.16 Other research-ers, however, emphasize the role of demand-side fac-tors, such as the extent of poverty, unemployment and the heterogeneity of populations.
fIGure 1 Regional Distribution of Foundation Assets, 1975 and 2006
14 Young, Dennis R. “Complementary, supplementary, or adversial? A theoretical and historical examination of nonprofit-government relations in the United States,” in Boris, Elizabeth and C. Eugene Steuerle. Nonprofits and Government Collaboration and Conflict. Washington, DC: Urban Institution Press, 2006.
15 Rikki, Abzug, and Joy K. Turnheim. “Bandwagon or bandaid? A model of nonprofit incorporation by state.” Nonprofit and Voluntary Sector Quarterly 27.3 (1998): 300-322.
16 Salamon, Lester M. “The Nonprofit Sector in Comparative Perspective,” in Powell, Walter W., and Richerd Steinberg. The nonprofit sector: A research handbook. New Haven, CT: Yale University Press, 2006.

The Social and Economic Value of Private and Community Foundations 9
All foundations are legally dedicated to provide support and services for purposes considered charitable and worthy, and therefore that support and those services should produce social and economic benefits. The fol-lowing analysis seeks to provide the first approximate measure of the range and dimensions of the value of the benefits currently produced by U.S. private and com-munity foundations.
We derive our estimates of these benefits for each of the 11 major areas of foundation activity classified by the Foundation Center. As noted earlier, the Center’s most recent public data on foundation grants and support, disaggregated to cover these 11 categories and 51 sub-categories, reflects a 2006 sample of 1,263 foundations, including 800 of the 1,000 largest foundations, totaling $19.2 billion.17 Total private and community foundation grants and support provided in 2006 totaled some $39 billion, rising to $42.9 billion in 2007.18 Since the sample is statistically representative of total foundation spend-ing with a very high degree of certainty, we adjust the
category and sub-categories totals to produce a mea-sure of value for all private foundation activity in 2007. These adjustments were presented in Table 1, on page 5. As noted earlier, we surveyed and analyzed the avail-able reports issued by foundations on the benefits of their grants and support, as well as the scholarly litera-ture on the effects of private and public programs that correspond to the categories and sub-categories of foundation activity. From all of these sources, we have calculated estimates of the direct benefits or value gen-erated in 2007 in each of the 11 major categories of foundation activity. A summary of the estimates of those benefits is presented in the following table:
category 1: arts and culture
As noted below in Table 2, we estimate that some $5.2 billion in foundation grants and support in 2007 gener-ated $51 billion in social and economic benefits, with an average return of 9.77 on foundation investments in grants and support for arts and culture. This estimate
3. the economIc and SocIal benefItS and Value of foundatIon actIVItIeS
category
share of total Grants and
support, 2006 Projected Grants
and support, 2007
estimated Return on
Investment Value of Direct
benefits
Arts and Culture 0.12 $5,226,392,067 9.77 $51,044,431,513
Education 0.23 $9,660,143,940 5.08 $49,034,044,415
Environment & Animals
0.06 $2,568,880,545 6.72 $17,258,127,318
Health 0.23 $9,858,394,845 7.60 $74,922,982,437
Human Services 0.14 $5,935,713,580 10.91 $64,730,079,576
International Affairs 0.05 $2,287,649,706 1.00 $2,287,649,706
Public Affairs/ Society Benefit
0.11 $4,582,058,679 22.04 $100,999,672,814
Religion 0.02 $926,409,978 1.00 $926,409,978
Science & Technology
0.03 $1,235,175,914 4.96 $6,126,867,646
Social Sciences 0.01 $581,238,668 1.00 $581,238,668
Other 0.00 $37,939,837 1.00 $37,939,837
total 1.00 $42,899,997,759 8.58 $367,949,443,908
table 2 estimated Value of the Direct benefits of Private and community foundation activities, by category, 2007
17 Foundation Center. “Highlights of Foundation Giving Trends.” Foundations Today Series, 2007.18 Ibid.

The Social and Economic Value of Private and Community Foundations10
is derived by reviewing existing studies of the results of foundation grants and support over a wide range of arts programs, estimating returns on investments (foundation funding) based on those results, classify-ing those results according to the sub-categories of arts-and-culture funding, calculating the return for each sub-category, calculating a weighted average return on investment for the arts-and-culture category, and finally estimating the total benefits based on that return and total funding for the category in 2007.
Table 3A, below, presents the distribution of arts-and-culture foundation funding across the nine sub-cate-gory classifications of the Foundation Center. Nearly two-thirds of foundation funding in this area focuses on support for the performing arts and museums, and about half of the remaining funding is focused on multi-
purpose arts-and-culture programs and arts-and-culture policy management and information.
The Cultural Alliance of Washington, D.C. has pro-duced one of the broadest analyses of arts and culture nonprofit programs, based on a survey of more than 6,000 nonprofits across the 50 states and the District of Columbia.19 This analysis focuses largely on multi-purpose arts programs and performing arts programs, and found that these programs produced revenues of $103 billion, largely from fees and ticket and admission sales, from outlays of $63 billion. The revenues can be taken to represent a conservative estimate of the ben-efits from the support, since a consumer’s willingness to pay for a good or service represents a lower bound of the value that consumer attaches to it. The rate of return or ROI for the programs included in this survey would be 1.64:1.
We also analyzed the work of programs such as the Patricia M. Sitar Center for the Arts.20 The Center offers arts education classes to all children, regard-less of income, at a charge of $15 per-semester for an unlimited number of classes. Some 80 percent of those participating come from low-income families, most of whom would not be able to send their children to similar programs that do not receive foundation support and cost $200 per-semester.21 In this case, the ROI, based on the benefits generated for the low-income children is 12.3:1. Similarly, World Arts Focus is a nonprofit orga-nization that brings artists and low-income communities together to study the arts, experience performances, and encourage the preservation of cultural performance traditions.22 The program provides arts instructions to adults for $13 per class, compared to $150 for compa-rable classes at for-profit institutions, or benefits yield-ing a 14.3:1 return on foundation investments.
Government and community organizations also have studied the economic benefits and effects of arts pro-grams in their jurisdictions or communities. A study of community-based arts-and-culture organizations in New York (both nonprofit and commercial) estimated that their combined budgets of $5.3 billion produced benefits of $13.4 billion. This estimate was based on several factors, such as the number of visitors to different art venues,
sub-category total support share
Policy Mgt. and Information
$21,931,000 9.4%
Arts-Multipurpose $213,693,000 9.2%
Media and Communications
$176,517,000 7.6%
Visual Arts/Architecture
$167,566,000 7.2%
Museums $710,863,000 30.5%
Performing Arts $807,724,000 34.7%
Humanities $90,941,000 3.9%
Historic Preservation $112,057,000 4.8%
Other $28,416,000 1.2%
total $2,329,708,000 100.0%
table 3a the Distribution of foundation funding for arts and culture, 2007
19 Americans for the Arts. “Arts & Economic Prosperity III: The Economic Impact of Nonprofit Arts and Culture Organizations and Their Audiences,” 2007.
20 Patricia M. Sitar Center for the Arts, http://www.sitarartscenter.org/events/index.php.21 For example: Frye Art Museum, http://fryemuseum.org/press_release/1334.22 World Arts Focus, http://www.joesmovement.org/.
As noted in Table 2, we estimate that some $5.2 billion
in foundation grants and support in 2007 generated
$51 billion in social and economic benefits, with an
average return of 9.77 on foundation investments in
grants and support for arts and culture.

The Social and Economic Value of Private and Community Foundations 11
ticket sales, the average length of stay at museums or other cultural venues, and their total expenditures in the local economy. On average, this suggests an ROI of 2.5:1 for these multi-purpose arts programs. A similar study of arts-and-culture investments and returns in Denver sug-gested $387 million in benefits from $38 million in invest-ments or an ROI of 10:1; another focusing on Wisconsin arts-and-culture programs also reported returns of 10:1; and yet another focused on Columbus Ohio reported returns of 22:1. In much the same vein, cultural-sector expenditures in Florida of $1.2 billion produced audience revenues of $4.5 billion, for a ROI of 3.75:1, or more than double the return reported for a similar analysis of arts and culture organizations in Phoenix, Arizona.
Similarly, a lower-bound estimate of the return on sup-port for museums can be derived from budgets and revenues from visitors. For example, the Louisiana State museum generated expenditures by visitors totaling $37 million in 2004-2005, on an operating budget of $5.3 million, or an ROI of approximately 7:1, while a major museum in New Jersey generated returns of just more than 3:1. A similar analysis of the Scottsdale Center for Performing Arts found direct and indirect benefits of nearly $25 million from an initial investment of $1.6 mil-lion, or 14:1.23 A return of 14:1 also was reported for some $35 million in funding provided for cultural and scientific organizations in the Denver metropolitan area by the Scientific and Cultural Facilities District, includ-ing the Denver Art Museum, the Botanic Gardens, the Museum of Nature and Science, as well as local organi-zations promoting cultural history.
The reported returns were even higher on investments by the Florida State Division of Historical Resources, which estimated that some 43 million tourists per-year visit the state’s 135,000 historic sites and museums, and spend some $3.7 billion. The state’s annual investments in those sites and museums total $212 million, sug-gesting a rate of return of 17.4:1. In the same area, the return on grants by the Kalamazoo Historic Preservation Society to preserve historic buildings has been roughly 12:1. One recipient of those grants, the DKI Building Preservation Program, received $1.8 million over five years to help preserve downtown Kalamazoo, and the grants encouraged investments by program participants of some $22 million.
A table, Table 3B, listing the studies and reports from which we derive our estimate of the average weighted returns on foundation grants to arts and cultural organi-zations is on the next page. Note, we use total founda-tion grant dollars in this area to calculate these returns, while a strict analysis of the purely economic rate of return would include all funds available to arts organiza-tions, including, but not limited to, foundation support. Our calculation, however, accurately describes the social return on foundation investments in this area. Moreover, support from foundations and individuals account for most external funds for arts and cultural organizations.24
We calculate that the social return on foundation sup-port for arts and cultural organizations averages 9.77:1. On this basis, we estimate that $5.23 billion in private and community foundation support in this area in 2007 produced returns of $51.04 billion.
category 2: education
Private and community foundations provided nearly $9.7 billion in grants and support for educational orga-nizations and institutions in 2007, and we estimate that these investments generated more than $49 billion in benefits, with an average social rate of return of 5.08:1. This estimate also is derived by reviewing existing stud-ies of the results of foundation grants and public support over a wide range of educational programs, estimating returns on investments (foundation funding) based on those results, classifying those results according to the sub-categories of educational funding, calculating the return for each sub-category, calculating a weighted average return on investment for the overall education category, and finally, estimating the total benefits based on that return and on total foundation funding for edu-cation in 2007.
23 The study applied a unique methodology to estimate total economic activity generated by the Center, using multipliers developed by the Bureau of Economic Analysis to calculate the effect of a dollars spending on the local economy.
24 See Footnote 3.
Private and community foundations provided nearly
$9.7 billion in grants and support for educational
organizations and institutions in 2007, and we
estimate that these investments generated more than
$49 billion in benefits, with an average social rate of
return of 5.08:1.

The Social and Economic Value of Private and Community Foundations12
Table 4A, on the next page, presents the distribution of education funding by private and community foun-dations across the nine sub-category classifications of the Foundation Center. More than four-fifths of foun-dation funding in this area focuses on support for the elementary and secondary education, higher education, and graduate and professional education. By contrast, foundation support for vocational and technical train-ing programs and for adult and continuing education programs, combined, totals just 1 percent of education grants. This allocation generally mirrors the distribution of public funding for education, presumably reflecting public priorities in this area.
Our estimates of the rate of return on foundation sup-port for education are based on a review of 35 studies of the results of educational programs. The benchmark analysis of the benefits of early childhood education programs is the Perry Preschool Program.25 Launched in Ypsilanti, Michigan in 1962 with comparable sets of low-
income, African-American participants beginning age three and four, and low-income, African-American non-participants of the same age, the researchers from the High/Scope Foundation tracked the results over the fol-lowing decades. The children were randomly assigned to participate or not for two years, and the results showed remarkable benefits for participants and their communi-ties. Perry alumni were significantly more likely to finish high school, earn higher incomes, own their own homes and cars, and open savings accounts. They also were significantly less likely to require social services or be arrested. The longitudinal analysis of these results esti-mated that the $15,166 invested over two years in each participant (constant 2,000 dollars) produced social and economic returns of $258,888, a ROI of 17.1:1. Most of these benefits accrued in the decades after the partici-pants had completed school.
Another pre-school program, Pre-K for All DC, gener-ated much lower returns. This effort is a public education
table 3b social Rates of Return for Public and Private funding for arts and cultural organizations, based on examples, by sub-category
sub-categoryReturn on Investment (RoI)
Cultural Alliance of Greater Washington Arts-Multipurpose 1.63:1
Study of Arts Organizations in NY Arts-Multipurpose 2.50:1
Colorado Arts and Culture Study Arts-Multipurpose 10.00:1
Wisconsin Foundation for the Arts Arts-Multipurpose 10.00:1
Arts in Columbus Arts-Multipurpose 22.00:1
Florida Arts and Culture Arts-Multipurpose 3.75:1
Phoenix Arts and Culture Arts-Multipurpose 1.71:1
Louisiana Arts Arts-Multipurpose 7.00:1
Louisiana State Museum Museums 7.00:1
Battleship Museum, New Jersey Museums 3.06:1
Patricia Sitar M. Center for the Arts Performing Arts 12.33:1
World Arts Focus Performing Arts 14.38:1
Scottsdale Center for Performing Arts Performing Arts 15.00:1
Denver Scientific and Cultural Facilities Humanities 14.00:1
United Fund for Arts and Humanities Humanities 3.00:1
Florida Arts and Culture Historic Preservation 17.44:1
Kalamazoo Historic Preservation Historic Preservation 12.00:1
average Value created, Per Dollar of Investment (Weighted by Grant Dollars) 9.77:1
estimated benefits from 2007 foundation support for arts and culture Programs $51,044,431,513
25 Pennsylvania Build Initiative. “Invest Now or Pay More Later: Early Childhood Education Promises Savings in Pennsylvania School Districts,” 2006, http://www.pde.state.pa.us/early_childhood/lib/early_childhood/BUILD_Report_III.Harvey.Feb061.pdf.

The Social and Economic Value of Private and Community Foundations 13
and advocacy program designed to provide services for any child in the District of Columbia to get a successful start in school. According to a recent study, high-quality pre-K services for all children in the District would cost $58.5 million and provide $81.4 million in financial ben-efits, for a ROI of 1.4:1, derived from lower crime inci-dence that would save $17.62 million in incarceration costs, gains of $27.1 million in additional tax revenue, cost savings for the school system of $29.9 million, and $6.9 million in health-care savings.26
Another example for middle school students, the Higher Achievement Program, offers 650 hours of volunteer-pro-vided supplemental education in a social justice-based curriculum.27 The costs of this supplementary education come to $11,700 per-student, based on a standard wage rate of $18.77 per-hour for volunteer time.28 We base the returns on data showing that program participants are more likely to finish high school and attend college. The Census Bureau reports that a person without a high school diploma earns an average of $23,400 annually, compared to people with college educations who have average incomes of $52,000 annually.29 Since program
participants are more likely to complete high school and somewhat more likely to attend college, we assume that on average these individuals will earn about $40,000. These calculations produce an estimated ROI for this program of 4.2:1.
It is difficult to estimate the economic benefits and returns from programs supporting higher education, since so many of those benefits are intangible or impos-sible to measure. Students who attend public or private universities who otherwise might not, or who participate in university programs which otherwise might not exist, may be exposed to technologies and research which better prepare them for 21st century jobs, or simply become better-educated, more knowledgeable and more highly-skilled workers to their own gain and that of their employers. A few studies have tried to quan-tify these effects, and we use those and other research to estimate the return on foundation support for higher education.
One study of the University of Massachusetts system, for example, found that the state’s investment of $524 million generated economic activity of $4.3 billion, for a ROI of 8.2:1. This calculus includes multiplier effects such as the finding that for every 100 jobs created in the university system, more than 90 additional private-sector jobs are also created in the communities with UMass campuses.30 Since UMass maintains a workforce of 15,000, its economic presence also has created nearly 14,000 private-sector jobs. A similar economic impact study focused on Rutgers University in New Jersey found an estimated economic return on investment for support for the university of 5:1, while an analysis of the economic benefits associated with the operations of the University of Maine system found that every $1 of state appropriation produced a return of $8.10. High ROI also would be expected from foundation-supported scholar-ships targeted to poor students who otherwise might not be able to attend college at all.
While other areas of education draw relatively less foun-dation support, many of those programs also produce high returns on investment. For example, Goodwill of Greater Washington operates a foundation-supported
sub-categoryProjected
support share
Policy Mgt and Information
$68,457,000 0.2%
Elementary and Secondary
$1,360,743,000 31.6%
Vocational and Technical
$13,221,000 0.3%
Higher Education $1,652,129,000 38.4%
Graduate and Professional
$439,777,000 10.2%
Adult and Continuing $32,016,000 0.7%
Library Science/Libraries
$254,211,000 5.9%
Student Services $160,088,000 3.7%
Educational Services $325,448,000 7.6%
total education $4,306,090,000 100.0%
table 4a the Distribution of foundation funding for education, 2007
26 District of Columbia Office of the State Superintendent. “Investing in the Economic Vitality of the District of Columbia through Pre-Kindergarten for All,” June 2006, http://www.osse.dc.gov/seo/lib/seo/pdf/pre-k_for_all_executive_summary.pdf.
27 Higher Achievement Program, http://www.higherachievement.org.28 Independent Sector. “Value of Volunteer Time,” http://www.independentsector.org/programs/research/volunteer_time.html.29 http://www.earnmydegree.com/online-education/learning-center/education-value.html.30 University of Massachusetts. “Economic Impact Methodology,” http://www.massachusetts.edu/econimpact/methodology.html.

The Social and Economic Value of Private and Community Foundations14
program that trains 70 adults per-year for careers in banking, at a cost of $2,250 per student. The program provides intensive job training, one-on-one case man-agement, job placement services, and follow-up sup-port.31 The per-student cost is less than the cost to a bank when an experienced employee leaves, and the average salary of these jobs is an estimated $40,000-$50,000 per year.32 We calculate that this program pro-duces a ROI of about 20:1.
The returns on foundation investments in programs supporting public libraries also are substantial. The Library Research Service of the Colorado State Library, for example, recently conducted a study of the Douglas County Libraries. The researchers found that every $1 invested in the county libraries returned $5.02 in ben-efits to the community. This study employed a model of “contingent valuation” commonly used to value non-market resources. This ROI of 5.02:1, then, was cal-culated by estimating the costs of not having a pub-lic library, including the cost of alternatives sources of information, the estimated cost for users of not obtain-ing information, the library’s purchases from local busi-nesses, the foregone compensation for library employ-ees, and a share of purchases made by library users from businesses close to library facilities.
A table follows, Table 4B, listing the 33 studies and reports used to help us derive our estimate of the aver-age weighted returns on foundation grants to education. As with the analysis of foundation support for arts and cul-tural programs, we derive the estimated value generated from the sampled nonprofit and government programs in each sub-category, calculate the returns, and estimate the total returns based on each sub-category’s share of foundation support in this area. Again, these estimates, while wholly consistent with the academic consensus about the value of investments in education, are approxi-mations which future research and analysis can refine.
We estimate that the social return on foundation sup-port for education averages 5.08:1. On this basis, we estimate that $9.7 billion in private and community foundation support for these organizations produced returns of $49.0 billion in 2007.
category 3: environment and animals/Wildlife
Private and community foundations provided some $2.57 billion in grants and support for environmental and animal/wildlife programs in 2007, and we estimate that these investments generated more than $17 billion in benefits, with an average rate of return of 6.72:1. This estimate is also derived by reviewing existing studies of the results of foundation grants and public support over a wide range of environmental and animal/wildlife pro-grams, estimating returns on investments (foundation funding) based on those results, classifying those results according to the sub-categories of funding in these areas, calculating the return for each sub-category, cal-culating a weighted average return on investment for the environmental and animal/wildlife category, and finally, estimating the total benefits based on that return and on total foundation funding for environmental and animal/wildlife programs in 2007.
Table 5A, on page 16, presents the distribution of envi-ronmental and animal/wildlife funding by private and community foundations between the two sub-categories set out by the Foundation Center. More than four-fifths of foundation funding in this area focuses on support for environmental programs, with the remainder targeted to animal and wildlife-related efforts. As with education, this allocation generally reflects the distribution of pub-lic funding in this area.
Our estimates of the rate of return on foundation sup-port for the environment and animals/wildlife are based on a review of available studies of the results of private and public programs in these areas. The most extensive analyses are government studies of the impact of spe-cific environmental investments. These studies suggest average returns on support for environmental efforts of between 2:1 and 6:1, although studies of some cases found returns as high as nearly 14:1, for plan-ning efforts to address coastal erosion in Texas.33 The analysis of those Texas efforts found that the returns on investments to protect coastal regions from erosion reflect a broad range of factors, including benefits from reducing soil damage, soil loss and saltwater intrusion
31 Goodwill of Greater Washington, www.dcgoodwill.org.32 PayScale, “Salary Survey Report for Job: Branch Manager, Banking,” http://www.payscale.com/research/US/Job=Branch_Manager%2c_Banking/
Salary/by_Years_Experience.33 Koenings, Jeff. “The Benefits from Sound Stewardship.” Washington Department of Fish and Wildlife, December 2002, http://wdfw.wa.gov/
pubaffrs/benefits_stewardship.htm, and, Surfrider Foundation. “State of the Beach,” http://www.surfrider.org/stateofthebeach/05-sr/state.asp?zone=GS&state=tx&cat=ba.

The Social and Economic Value of Private and Community Foundations 15
on both private and public properties, savings from protecting infrastructure, as well as more indirect gains from increases in business activity and their associated tax revenues. The study placed an economic value
on each of these benefits, compared to the cost if no action were taken to prevent soil erosion, and found that the direct benefits represented a return on invest-ment of 13.9:1.
sub-categoryReturn on Investment (RoI)
Pre-K For All DC Elementary/ Secondary 1.39:1
Chicago Child Parent Centers Elementary/ Secondary 17.07:1
Success for All Elementary/ Secondary 1.66:1
First Things First Elementary/ Secondary 2.38:1
Talent and Development Elementary/ Secondary 6.72:1
Check and Connect Elementary/ Secondary 6.56:1
Achievement for Latinos Thru Academic Success Elementary/ Secondary 4.77:1
Early Childhood Education, Low-Income Children Elementary/ Secondary 2.90:1
Home Instruction Program, Pre-school Children Elementary/ Secondary 2.36:1
Parents as Teachers Elementary/ Secondary 1.80:1
Quantum Opportunity Program Elementary/ Secondary 1.23:1
Big Brothers, Big Sisters Elementary/ Secondary 0.42:1
Perry Pre-School Elementary/ Secondary 1.01:1
Goodwill of Greater Washington Training Prog. Vocational/Technical 20.00:1
Higher Achievements Program Higher Education 3.42:1
Return on Community Colleges Higher Education 11.90:1
University of Massachusetts Higher Education 8.00:1
Rutgers University Higher Education 5.00:1
University of Maine Higher Education 8.10:1
Literacy Volunteers of America Adult/Continuing 33.00:1
Pennsylvania Public Libraries Libraries 5.50:1
Florida Public Library System Libraries 6.54:1
St. Louis Public Library System Libraries 4.38:1
Suffolk County, NY Public Libraries Libraries 3.93:1
Vermont Public Library Libraries 5.36:1
Fort Morgan Public Library Libraries 8.80:1
Montrose Library District Libraries 5.33:1
Douglas County Public Library Libraries 5.02:1
Denver Public Library Libraries 4.96:1
Rangeview Library District Libraries 4.81:1
Mesa County Public Library District Libraries 4.57:1
Eagle Valley Library District Libraries 4.28:1
Good Samaritan Foundation Educational Services 13.33:1
average Value created, Per Dollar of Investment (Weighted by Grant Dollars) 5.08:1
estimated benefits from foundation support for education-Related Programs in 2007
$49,034,044,415
table 4b social Rates of Return for Public and Private funding for education, based on examples, by sub-category

The Social and Economic Value of Private and Community Foundations16
Another approach that appears to produce high returns is one adopted by the Washington Department of Fish and Wildlife to protect natural habitats, especially for marine life. These efforts include fish enhancement proj-ects, hunter education, restoration of salmon habitats, and educational outreach. The study found that recre-ational fishing, hunting and wildlife viewing contribute some $4.4 billion to the state’s economy, and the value of the commercial fishing industry preserved by these efforts brings in $4.7 billion, producing an estimated ROI of 16:1. Similarly, the Piedmont Environmental Council’s programs have focused on protecting and promoting the Virginia Piedmont’s natural resources, history and beauty. The key program promotes private donations of land for conservation purposes and, when necessary, uses foundation and other funds to purchase properties. By conserving two acres for each acre purchased, the program produces a ROI of at least 2:1, and when all other factors are considered, a much higher return.34
Programs to protect and enhance state parks also pro-duce benefits that can be readily compared to many foundation-backed programs focused on preserving natural areas for recreational and other uses. One lower-bound measure of these benefits can be gauged by using visitors’ expenditures in such places. The Louisiana State
Park, for example, reports direct expenditures in 2004-2005 totaling $41.1 million, compared to state spend-ing of less than $19 million, or a ROI of 2.09:1. Using the same calculus, projects of the Wildlife and Natural Resources Trust of Wyoming yield a return on investment of 6 to1, the programs of the Wildlife Refuge produce a ROI of 4.0:1, those of the National Fish and Wildlife Foundation yield returns of 3 to 1, and the Pinellas County Environmental Foundation has a ROI of 2.4:1.
A number of other programs bridge the Foundation Center’s distinction between “environmental” programs and those focused on “animals and wildlife.” For exam-ple, Utah’s Watershed Restoration Initiative is a part-nership-driven effort to conserve, restore and manage ecosystems in order to enhance the state’s native wild-life and biological diversity, improve water quality and water yields for municipal, agricultural and other uses, and promote sustainable agriculture and outdoor recre-ation activities. Research conducted for Utah’s Partners for Conservation and Development found that the read-ily quantifiable benefits from the program alone exceed the costs by at least three times.
Similarly, a number of other programs, including several public programs, could be classified as either environ-mental or science/technology efforts. For example, oil and gas R&D programs supported by the Office of Fossil Energy in the Department of Energy focus on developing new technologies that can keep existing fields productive and developing new fields with minimal costs to the envi-ronment.35 These initiatives fund efforts in flue gas desul-furization, coal combustion waste management and utili-zation, and well drilling, completion and stimulation. Their economic returns can be calculated using several criteria. For instance, the benefits from developing a technology that reduces the amount of fuel required to produce a given amount of energy services, such as cooling or heat-ing of a home, or miles driven, can be measured by the reduction in the amounts of energy use, multiplied by the market price of that energy. A technology that increases drilling efficiency would have net benefits measured by the reduction in drilling costs; and the benefits of another technology that increases the nation’s ability to find and extract natural resources from deep deposits would be based on the value of the additional resources, net of
Private and community foundations provided some
$2.57 billion in grants and support for environmental
and animal/wildlife programs in 2007, and we estimate
that these investments generated more than $17 billion
in benefits, with an average rate of return of 6.72:1.
sub-categoryProjected
support share
Environment $2,071,184,220 80.6%
Animals and Wildlife $497,696,325 19.4%
total environment/animals
$2,568,880,545 100.0%
table 5a the Distribution of foundation funding for environment and animal/Wildlife Programs, 2007
34 Piedmont Environmental Council, http://www.pecva.org/anx/index.cfm.35 Committee on Benefits of Department of Energy R&D on Energy Efficiency and Fossil Energy, Commission on Engineering and Technical
Systems, National Research Council. “Energy Research at DOE: Was It Worth It? Energy Efficiency and Fossil Energy Research 1978-2000.” National Academies Press, 2001.

The Social and Economic Value of Private and Community Foundations 17
the costs of the exploratory, development, and produc-tion activities needed to find and extract those resources. A committee evaluating these benefits concluded that these three programs had positive returns on the order of 1.90:1 for investments in flue gas desulfurization, 16.95:1 for waste management programs, and 9.01:1 for the pro-gram in drilling, completion and stimulation.
The table above, Table 5B, lists the studies and reports used to derive an estimate of the average weighted returns on foundation grants for environmental and ani-mal/wildlife activities. As with the analyses of foundation support in other areas, we derive the estimated value generated from the sampled nonprofit and government programs in each sub-category, calculate the returns, and estimate the total returns based on each sub-category’s share of foundation support in this area. These estimates also should be considered to be approximations which additional research and analysis will refine.
We estimate that the economic and social return on foundation support for efforts in the areas of the envi-ronment, animals and wildlife averages 6.72:1. On this basis, we estimate that less than $2.6 billion in private and community foundation support for these efforts pro-duced benefits valued at more than $17 billion in 2007.
category 4: Health
Private and community foundations provided $9.86 bil-lion in grants and support for health-related organiza-tions and programs in 2007, and we estimate that these investments generated nearly $75 billion in benefits, with an average social rate of return of 7.60:1. Like our previ-ous estimates, this one is derived by reviewing existing studies of the results of both foundation and government grants and support over a range of health and medical-related efforts and programs; assessing the results and estimating the consequent returns on those investments (public or foundation funding); classifying those results according to the sub-categories of health and medi-cal-related funding and calculating the return for each sub-category; calculating a weighted average return on investment for the health category; and finally, estimating the total benefits based on that return and on foundation funding for health and medical-related efforts in 2007.
Table 6A, on the next page, presents the distribution of health and medical-related funding by private foun-dations across the eight sub-categories for which the Foundation Center publishes funding totals. More than two-thirds of foundation funding in this area focuses on support for hospitals and medical care, public health
sub-categoryReturn on Investment (RoI)
Piedmont Environmental Council Environment 2.00:1
Coastal Erosion Planning, Texas Environment 13.80:1
Watershed Restoration Initiative Environment 3.00:1
National Parks Conservation Assn Environment 2.00:1
Improvement of the Flue Gas Desulfurization Program (DOE) Environment 1.90:1
Waste Management/Utilization Technologies Program (DOE) Environment 16.95:1
Drilling, Completion and Stimulation Program (DOE) Environment 9.01:1
Louisiana State Park Animals/Wildlife 2.09:1
Wyoming Wildlife & Natural Resources Trust Animals/Wildlife 6.00:1
National Wildlife Refuge Animals/Wildlife 4.00:1
National Fish & Wildlife Foundation Animals/Wildlife 3.00:1
Pinellas Co. Environmental Foundation Animals/Wildlife 2.40:1
Washington Fish & Wildlife Department Animals/Wildlife 16.00:1
average Value created, Per Dollar of Investment (Weighted by Grant Dollars) 6.72:1
estimated benefits from foundation support for environmental and animal/Wildlife Programs in 2007
$17,258,127,318
table 5b social Rates of Return for selected Public and Private funding of environmental and animal/Wildlife efforts, by sub-category

The Social and Economic Value of Private and Community Foundations18
programs, and medical research. By contrast, founda-tion support for mental health and reproductive health, together, account for about 10 percent on health and medical-related grants. This allocation, again, generally mirrors the priorities of public funding for health care.
Our estimates of the rate of return on foundation sup-port for health care are based on a review of 27 studies which estimated the value of health care-related pro-grams or reported results from which those estimates could be derived. For example, the Jewish Social Services Agency provides quality in-home eldercare at an annual cost of $5,000 to $6,000 per-person, com-pared to nursing home care which costs an average of $96,000 per-person, per-year.36 This suggests a ROI
of 17.45:1, without taking account of the benefits for those using the eldercare program and their families from enabling them to continue living on their own. Similarly, the Cornerstone program finances the pur-chase of renovation of housing units for people with serious mental illnesses, many of whom would otherwise require intermittent or ongoing hospitalization. It costs Cornerstone $175 per-patient, per-day, compared to $425 per-day in a facility such as St. Elizabeth’s Hospital near Washington, D.C. Here too, without including the value of the personal benefits for the patients and their families, the program saves up to $100,000 per-patient, per-year, and a minimal ROI of 1.43:1.
Sound returns are also achieved by the District of Columbia Primary Care Association, which helps main-tain a network of more than 60 “safety net” community health centers for low-income, uninsured, and medically vulnerable people.37 In one recent year, these health centers served more than 100,000 District residents, one-third of them without insurance coverage. The cost for the Association is about $65 per-patient visit, com-pared to an average of $165 through the standard pub-lic hospital procedure; and that saving does not include the economic benefits of providing uninsured people more rapid and certain treatment. Similarly, the Center for Alexandria’s Children (CAC) helps protect vulner-able children by applying a coordinated, comprehensive approach to preventing, investigating, and treating child abuse.38 It also costs about $2,900 per-case, compared to $3,900 for a state, multi-agency child abuse investiga-tion, and is more successful in preventing further abuse.
Many health-related programs recently have turned to prevention strategies, which also can produce high returns. For example, a study from Cornell University has estimated the average, lifetime cost of caring for a person with HIV at $618,900. The program, Metro TeenAIDS (MTA), focuses half of its annual $1 million budget on HIV prevention education for young peo-ple, with the other half devoted to case management, mental health, youth leadership, and outreach.39 If the
sub-categoryProjected
support share
Policy Mgt and Information
$309,755,262 3.1%
Hospitals and Medical Care
$2,070,500,669 21.0%
Reproductive Health Care
$570,324,683 5.8%
Public Health $2,071,478,778 21.0%
Other $330,039,794 3.3%
Specific Diseases $1,461,235,607 14.8%
Medical Research $2,603,338,675 26.4%
Mental Health $441,721,376 4.5%
total Health $9,858,394,845 100.0%
table 6a the Distribution of foundation funding for Health, 2007
36 Nonprofit Roundtable of Greater Washington and World Bank Group. “Beyond Charity: Recognizing Return on Investment,” 2007. According to the Metlife Market Survey of Nursing Home and Home Care Costs (September 2005) the average daily cost of a semiprivate room in a nursing home in DC in 2005 was $268 ($97,820 per year). A semiprivate room in Silver Spring averaged $196 ($71,540 per year).
37 District of Columbia Department of Health. “Healthcare Alliance Payment Rate Comparative Benchmarking Report,” 2006, http://www.dcpca.org/index.php?option=com_content&task=view&id=433&Itemid=299.
38 The Center for Alexandria’s Children, www.centerforalexandriaschildren.org.39 Schakman, Bruce R., et al. “The Lifetime Cost of Current HIV Care in the United States.” Medical Care 44(11): 990-997, November 2006;
Projected life expectancy for infected individuals, if they remain in optimal HIV care, has increased to 24.2 years, so average lifetime HIV care cost is now $618,900 per person.
Private and community foundations provided $9.86
billion in grants and support for health-related
organizations and programs in 2007, and we estimate
that these investments generated nearly $75 billion in
benefits, with an average social rate of return of 7.60:1.

The Social and Economic Value of Private and Community Foundations 19
program prevents two HIV infections per-year, it would save $737,800.40 Without taking account of large, addi-tional benefits from the greater economic productiv-ity of people who avoid HIV infection as a result of the program, and the fewer number of people becoming infected from those who have now avoided infection themselves, the ROI is 1.48:1.
Many other programs focus on the best management of particular conditions. A recent study reviewed the health care costs savings associated with an HMO-sponsored diabetes management program in Pennsylvania.41 The program emphasizes primary care-based nurse educa-tion and case management of patients with diabetes mellitus. The participants in the program had slightly more health insurance claims related to their diabetes care, but substantially fewer total claims, with a ROI of 3.00:1. Moreover, those benefits do not include the HMO’s savings from decreased variation in its month-to-month costs and greater local recognition of the quality care they provide.
A more extensive study analyzed the return on invest-ments for certain innovative approaches for treating four specific conditions.42 The study created a baseline of the average ROI for additional health care expenditures used in 2000, compared to 1980; estimated the ROI for Medicare treatments for heart attacks, strokes, type 2 diabetes, and breast cancer from 1985 to 2000, based on National Long-Term Care Survey data and Medicare claims; and then estimated the ROI for selected, major innovations introduced over that period to treat the four conditions. They calculated that each additional dol-lar spent on new health care services for heart attacks, strokes, type 2 diabetes and breast cancer produced health gains with ROIs, respectively, of 1.10:1, 1.49:1, 1.55:1 and 4.80:1. The ROI for particular innovations ranged from 1.12:1 to 38.0:1.
High returns also were achieved by the programs of the Michigan Athletic Trainers’ Society (MATS), which provide continuing education and research in prevent-ing, recognizing and treating injuries. According to data
collected by the National Athletic Trainers Association, each $1 invested in injury prevention and rehabilitation measures produces returns of $7 in productivity and saved medical costs.
The Trust for America’s Health and the Urban Institute conducted a study that analyzed how much the United States could save in health care costs if more money was invested in disease prevention, specifically by fund-ing proven community-based programs that result in increased levels of physical activity, improved nutrition, and a reduction in smoking and other tobacco use rates. One program examined by the study, for example, pro-vides nutritious foods for schoolchildren, keeps those schools open after hours to offer adult supervision for after-school play, and educates young mothers about nutrition and ways to quit smoking. The per-capita cost of these community-based programs was less than $10 per-year and produced remarkable results: 5 percent reductions in rates of type 2 diabetes and high blood pressure within two years, 5 percent reductions in rates of heart disease, kidney disease, and stroke within 5 years, and 2.5 percent reductions in some cancers, arthri-tis, and chronic obstructive pulmonary disease over 10 to 20 years. According to conservative estimates, these efforts produce a ROI of 5.6:1.43
The table on the next page, Table 6B, lists the studies and reports used to derive a measure of the average weighted returns on foundation grants for health and medical-related activities. As in other areas, we derive the estimated value generated from the sampled non-profit and government programs in each sub-category, calculate returns, and estimate the total returns based on each sub-category’s share of foundation support in this area. These estimates, again, should be viewed as approximations.
We estimate that the social return on foundation sup-port for health and medical care averages 7.60:1. On this basis, we estimate that $9.86 billion in private and community foundation support for these efforts in 2007 produced benefits valued at more than $74.9 billion.
40 $618,900–$250,000, (half the prevention budget) = $368,900, times two cases = $737,800.41 Sidorov, Jaan, Peter Paulick, and Lila Sobel. “What is the Return on Investment Associated with Diabetes Disease Management? A Report
from One Managed Care Organization in Pennsylvania.” Wolters Kluwer Health 11.9 (2003): 565-570, http://ideas.repec.org/a/wkh/dmhout/v11y2003i9p565-570.html.
42 Luce, Bryan, et. al. “The Return on Investment in Health Care: From 1980 to 2000.” Value in Health 9.3 (2006): 1096-3015, http://cat.inist.fr/?aModele=afficheN&cpsidt=17873832.
43 Trust for America’s Health. “Prevention for a Healthier America: Investments in Disease Prevention Yield Significant Savings, Stronger Communities,” July 2008, http://healthyamericans.org/reports/prevention08/Prevention08.pdf.

The Social and Economic Value of Private and Community Foundations20
category 5: Human services
Private and community foundations provided nearly $5.94 billion in grants and support for human services-related programs in 2007 and we estimate that these
investments generated more than $64.73 billion in ben-efits, with an average social rate of return of 10.91:1. These estimates, like those preceding them in this study, are derived by reviewing existing analyses of the results of foundation grants and government support over a
sub-categoryReturn on Investment (RoI)
JSSA—in-home care for elderly people homes Hospitals/ Medical Care 17.45:1
Teen Outreach Program Reproductive Health Care 1.29:1
Children’s Aid Society/Carrera Program Reproductive Health Care 0.21:1
Nurse Family Partnership for Mothers/ Infants Reproductive Health Care 2.68:1
DC Primary Care Association Public Health 1.54:1
Trust for America’s Health Study (nationwide) Public Health 0.34:1
Trust for America’s Health Study (Alabama) Public Health 5.55:1
Trust for America’s Health Study (Alaska) Public health 7.20:1
Trust for America’s Health Study(Arizona) Public Health 4.22:1
Trust for America’s Health Study (Arkansas) Public health 5.09:1
Trust for America’s Health Study (California) Public Health 4.84:1
Trust for America’s Health Study (Colorado) Public Health 5.05:1
Center for Alexandria’s Children Other 7.00:1
Michigan Athletic Trainers Other 5.60:1
MetroTeen Aids Specific Diseases 1.48:1
Diabetes Management Program Specific Diseases 3.00:1
Treatment for Heart Attack Specific Diseases 1.10:1
Treatment for Stroke Specific Diseases 1.49:1
Treatment for Type 2 Diabetes Specific Diseases 1.55:1
Treatment for Breast Cancer Specific Diseases 4.80:1
The National Cancer Institute—chemotherapy for advanced testicular cancer (1970-87)
Medical Research 2.40:1
The National Eye Institute—laser treatment for blindness caused by diabetes (1971-92)
Medical Research 8.86:1
National Heart, Lung, and Blood Institute—treatment or surgery for people whose coronary bypass can be deferred (1973-84)
Medical Research 22.03:
National Institute for Allergy and Infectious Diseases—formulated the Hepatitis B vaccine
Medical Research 4.69:1
National Institute for Allergy and Infectious Diseases—intervention for infants with haemophilus influenzae Type B
Medical Research 22.99:1
Cornerstone Study Medical Research 1.43:1
Supportive Housing for Mentally Ill Medical Research 5.20:1
average Value created, Per Dollar of Investment (Weighted by Grant Dollars) 7.60:1
estimated benefits from foundation support for Health and Medical-Related Programs in 2007
$74,922,982,437
table 6b social Rates of Return for selected Public and Private funding of Health Related Programs, by sub-category

The Social and Economic Value of Private and Community Foundations 21
wide range of human-service programs and areas, esti-mating the returns on investments (foundation funding) based on those results, classifying those results accord-ing to the sub-categories of funding in these areas, cal-culating the return for each sub-category, calculating a weighted average return on investment for the human service category, and finally, estimating the total benefits based on that return and on total foundation funding for human service-related grants and programs in 2007.
Table 7A, below, presents the distribution of human service-related funding by private and community foun-dations across the eight sub-categories for which the Foundation Center provides funding data. More than two-fifths of foundation funding in this general area focus does not fall into a single, clear category but rather is classified “human services-multipurpose.” The largest single-purpose sub-categories, by amount of grants, are youth development, recreation and sports, and housing and shelter. In this case, the distribution does not mirror the priorities of public funding in this general area as it does in some other areas of foundation funding; here, employment, nutrition, and criminal justice- related pro-grams all receive less foundation support than programs for recreation and sports or youth development.
Our review of available studies of the results of public and private human services-related programs provides the basis for our estimates of the rate of return on foundation support fort efforts in this area. For example, the Friends of Guest House program in Northern Virginia provides transitional housing and support services to women leav-ing prison. After a six-month stay at a per-person cost of $7,200, nearly 100 percent of the women who go through the Friends of Guest House find employment and stay out of prison.44 By contrast, incarceration by the Northern Virginia Department of Corrections costs approximately $20,000 per year, and the national rate of recidivism by parolees who receive no assistance in finding homes and jobs is 67 percent. Without taking account of the costs imposed by those who revert to criminal behavior beyond the cost of incarceration – the costs of their crimes and tri-als, for example – this program generates a rate of return of 1.78:1.45 Similarly, the Our Place DC program provides an array of services to women in the District of Columbia coming out of prison. The program spends about $5,000 per-person to provide these services for a year, compared to $30,000 a year to incarcerate a woman. On this basis, the program generates a ROI of 6.0:1.46
Workforce development efforts also evidence strong rates of return. The Northern Virginia Family Services’ Training Futures Program, for example, has helped more than 1,000 people move up from low-wage jobs to office careers with higher wages, benefits, and opportunities for advancement. The returns include the increased wages and often moving people off public assistance and onto private payrolls, which in turn produce tax rev-enues. A study of this program found that it generates a direct ROI of 18.0:1, a higher rate of return than most investors can earn on stocks or mutual funds.47
Private and community foundations provided
nearly $5.94 billion in grants and support for human
services-related programs in 2007 and we estimate
that these investments generated more than $64.73
billion in benefits, with an average social rate of
return of 10.91:1.
44 Friends of Guest House, www.friendsofguesthouse.org.45 Aborn, Richard M. “Time to End Recidivism.” The Nation, 4 March 2005, http://www.thenation.com/doc/20050321/aborn.46 Aizenman, N.C. “The High Cost of Incarceration.” Washington Post, 29 February 2008, http://www.denverpost.com/ci_8400051.47 Northern Virginia Family Service. “Trickle Up: A Case Study on Community Benefits of Workforce Development,” http://www.nvfs.org/
publications/trickleup.pdf.
sub-categoryProjected
support share
Crime, Justice and Legal Services
$429,661,031 7.24%
Employment $302,946,640 5.1%
Food, Nutrition and Agriculture’
$413,109,463 6.96%
Housing and Shelter $552,637,971 9.31%
Safety and Disaster Relief
$261,316,463 4.4%
Recreation and Sports $714,898,525 12.0%
Youth Development $736,091,621 12.4%
Human Services-multipurpose
$2,525,051,867 42.5%
total $5,935,713,580 100%
table 7a the Distribution of foundation funding for Human services Programs, 2007

The Social and Economic Value of Private and Community Foundations22
A study conducted by the Washington State Institute for Public Policy for the Washington State Legislature examined the ROI of a range of publically-funded prevention and early intervention programs for youth across the country since 1970. Researchers constructed a cost-benefit model to estimate the value of observed changes in education, crime, substance abuse and neglect, teen pregnancy, and public assistance use. Among the findings: 48
A Nurse Family Partnership Program for first-time •mothers and their infants provided intensive home visits by nurses during the pregnancies of low-income, at-risk women and the first two years follow-ing their children’s birth. The program cost $9,118 per participant, and returned $26,298 in economic benefits to society, for a ROI of 2.88:1.
The All Stars program, a school and community-•based project to prevent risky behavior in youth ages 11 to 15, holds 22 to 29 sessions over two years to foster positive attitudes and reduce substance use, violence, and premature sexual activity. All Stars costs $49 per-person and yields benefits valued at $169, for a return of 3.43:1.
Project Northland is a multilevel intervention program •involving students in grades 6 to 8, their parents, and other community members in weekly meetings aimed at delaying the age when adolescents begin drinking and reducing alcohol use among those already drinking. The program costs $152 per stu-dent and produces an estimated $1,575 in economic gains per-participant, or a return of 10.39:1.
The Functional Family Therapy project is a struc-•tured, family-based intervention program operated by Washington State juvenile courts. Its aim is to reduce a range of risk factors in family dynamics by teaching problem-solving skills. The cost per-family is $2,140, and its estimated benefits are $16,455 for a ROI of 7.69:1.
The Dialectical Behavior Therapy project is a cog-•nitive behavioral treatment program for juvenile offenders with hard-to-treat mental disorders. The program focuses on enhancing their capacity
to handle difficult situations, motivating them to change their dysfunctional behaviors, and training and consultations to improve the counselors’ skills. The total cost per-person is $843, and the estimated economic benefits are $32,087, returning $38.05 for each dollar invested.
Among a broad range of other youth training pro-•grams, the Youthbuild program at Sasha Bruce pre-pares young high school dropouts for positions in the construction industry. The services cost $26,125 per-person to prepare them for positions with start-ing salaries of $35,000 to $45,000 annually, which implies a ROI of 1.78:1. In another example, the Urban Alliance Foundation operates a comprehen-sive employment program for high school students in Washington, D.C. Some 96 percent of its clients finish high school, compared to the citywide aver-age of less than 60 percent; and 88 percent enroll in college compared to 29 percent of all D.C. public school students. At a cost per-participant of $4,000, the program generates a rate of return of 11.25:1.
In other youth services, the Stop Child Abuse Now (SCAN) program uses volunteer “Court Appointed Special Advocates” (CASAs) to represent the interests of neglected or abused children in the Northern Virginia court system. Counting only the value of the advocates time and the state’s savings from not having to hire attorneys to oversee child abuse cases (“Guardians ad Litem”), the program generates returns of 1.54:1. Or, the private Adoptions Together program works with local governments to place children with families, at a cost of $7,200 per-child compared to an estimated $25,000 per-child if the state did it alone.49 The overall benefits produce a ROI of 2.47:1.
Moreover, a comprehensive study of the social returns on investments in youth intervention and mentoring programs in Minnesota found even higher returns.50 Broad intervention programs for children with histories of truancy and alcohol or drug abuse generated social returns of 4.89:1; and efforts targeted at youth con-victed of property crimes produced ROI of 8.18:1. Other studies of youth mentoring programs have documented
48 Aos, S., Miller, M., and Mayfield, J. “Benefits and Costs of Prevention and Early Intervention Programs for Youth.” Washington State Institute of Public Policy, 2004, http://www.wsipp.wa.gov/pub.asp?docid=04-07-3901.
49 Stop Child Abuse Now of Northern Virginia, Alexandria/Arlington, CASA Program, www.scanva.org/casa_program.htm.50 Office of Dakota County Attorney. “Comments of Dakota County Attorney James C. Backstrom Concerning a Recent Evaluation of the
Social Return on Investment in Youth Intervention and Mentoring Program,” 2007, http://www.co.dakota.mn.us/NR/rdonlyres/00001458/pjkmiufshijlhydztlpozwsixobphfnu/WilderFoundation%2007.pdf.

The Social and Economic Value of Private and Community Foundations 23
benefits of $2.72 for every dollar invested. Finally, many programs providing quality child care programs have been found to increase family incomes, improve later school performance, and reduce future public expendi-tures. Federal Reserve economists estimate that quality child care programs generate a return on investment of 16.0:1.
Programs for very poor and often homeless people also can generate large benefits, although not always. For example, the Manna Food Center in Montgomery County, Maryland turns each dollar of their financial resources into five dollars of food through food dona-tions and volunteer distribution, generating a ROI of 5.0:1.51 The Coalition for the Homeless in the District of Columbia moves more than 300 people into permanent housing and jobs every year. Yet, a study of similar pro-grams by Abt Associates found that they entail costly, intensive efforts, and produce a ROI of less than one: 0.87:1.52
The table on the next page, Table 7B, lists the studies and reports used to derive a measure of the average weighted returns on foundation grants for human ser-vices-related activities. Here, as elsewhere, we derive the estimated value generated from the sampled nonprofit and government programs in each sub-category, calcu-late the returns, and estimate the total returns based on each sub-category’s share of foundation support in this area. These estimates also should be considered to be approximations.
We estimate that the social return on foundation sup-port in the human services area averages 10.91:1. On this basis, we estimate that $5.94 billion in private and community foundation support for these efforts in 2007 produced benefits valued at more than $64.7 billion.
category 6: Public affairs/society benefit
Private and community foundations provided $4.58 billion in grants and support for public affairs/society benefit-related programs in 2007, and we estimate that these investments generated a remarkable total of $101 billion in benefits, with an average social rate of return of 22.04:1. This estimate may be biased by the results for two programs which produced unusually large rates of return; but even if those studies are set aside, the
estimated return on other public affairs/society benefit-related support would remain very high.
These estimates, like those preceding it in this study, are derived from reviewing existing analyses of the results of grants and other support over a wide range of public affairs/society benefit-related programs and areas, esti-mating the returns on investments (foundation funding) based on those results, classifying those results accord-ing to the sub-categories of funding in these areas, cal-culating the return for each sub-category, calculating a weighted average return on investment for the human service category, and finally, estimating the total benefits based on that return and on total foundation funding for human service-related grants and programs in 2007.
Table 8A, on page 25, presents the distribution of pub-lic affairs/society benefit-related funding by private and community foundations across the four sub-categories of the Foundation Center. Nearly 70 percent of founda-tion funding in this area focuses on philanthropy and voluntarism programs and community improvement and development projects. The remainder of this funding is claimed by civil rights and social activism programs and general public affairs/society benefit efforts.
Our estimates of the rate of return on foundation sup-port in the public affairs/society benefit area are based on a review of existing studies and reports that estimate the value of public affairs/society benefit-related pro-grams or report results from which those estimates can be derived. For example, the Stepping Stones initiative of the Washington Area Women’s Foundation is the first comprehensive, regional initiative to help low-income, women-headed families improve their economic condi-tions. The initiative invested $2 million in direct grants to help low-income women build income and create assets valued at $11 million over two years, yielding a return
51 Manna Food Center. “White Paper on ‘Hunger: A Hidden but Prevent Problem in Montgomery County,’” www.mannafood.org/montgomery.52 Long, David A., and Jean M. Amendolia. “Promoting Employment for Homeless People: Final Cost-effectiveness Study,” 2003.
Private and community foundations provided $4.58
billion in grants and support for public affairs/society
benefit-related programs in 2007, and we estimate
that these investments generated a remarkable total
of $101 billion in benefits, with an average social rate
of return of 22.04:1.

The Social and Economic Value of Private and Community Foundations24
sub-categoryReturn on Investment (RoI)
Friends of Guest House: Transitional housing and support for women leaving prison, Virginia
Crime, Justice, Legal Services 1.78:1
Our Place D.C. Crime, Justice, Legal Services 6.00:1
Northern Virginia Family Services Employment 18.0:1
Dislocated Worker Program (Iowa) Employment 4.83:1
Santa Ana WORK Center (a one-stop center) Employment 4.83:1
Manna Food Center Food, Nutrition, Agriculture 4.00:1
D.C. Central Kitchen Food, Nutrition, Agriculture 11.11:1
Coalition for the Homeless/Abt Study Housing and Shelter 1.87:1
Sasha Bruce Youthwork/DC Habitat for Humanity Youth Development 1.72:1
Urban Alliance Foundation Youth Development 11.25:1
Seattle Social Development Project Youth Development 3.14:1
Guiding Good Choices Youth Development 11.07:1
Strengthening Families, Parents and Youth 10-14 Youth Development 7.82:1
Child Development Project Youth Development 28.42:1
Good Behavior Game Youth Development 25.92:1
CASA-START (Striving Together to Achieve Rewarding Tomorrows)
Youth Development 0.89:1
Youth Intervention Program Youth Development 4.89:1
Youth Program for Reducing Recidivism Youth Development 8.18:1
Youth Mentoring Program Youth Development 2.72:1
CASA for SCAN, child abuse prevention Human Services-multipurpose 1.54:1
Adoptions Together Human Services-multipurpose 2.47:1
Childcare Industry, New Jersey Human Services-multipurpose 16.00:1
Adolescent Transitions Program Human Services-multipurpose 5.02:1
Project Northland Human Services-multipurpose 10.39:1
Family Matters Human Services-multipurpose 8.02:1
Life Skills Training Human Services-multipurpose 25.61:1
Project STAR (Students Taught Awareness and Resistance Human Services-multipurpose 5.29:1
All Stars Human Services-multipurpose 3.43:1
Dialectical Behavior Therapy Human Services-multipurpose 38.05:1
Adolescent Diversion Program Human Services-multipurpose 13.54:1
Functional Family Therapy Human Services-multipurpose 13.25:1
Multi-Systemic Therapy Human Services-multipurpose 2.04:1
Aggression Replacement Training Human Services-multipurpose 20.56:1
average Value created, Per Dollar of Investment (Weighted by Grant Dollars) 10.91:1
estimated benefits from foundation support for Human service-Related Programs in 2007
$64,730,079,576
table 7b social Rates of Return for selected Public and Private funding of Human services Programs, by sub-category

The Social and Economic Value of Private and Community Foundations 25
on investment of 5.5:1.53 The $11 million in assets and income include: $2.9 million in savings generated by refinancing loans to avoid home foreclosures; $120,000 in debt reductions, $260,000 in increased home equity; and a $200,000 increase in income from placements in higher wage jobs. It also includes $7.5 million in addi-tional income from the passage of a $11.75 “living wage” law in the District of Columbia, the passage of which was led a Stepping Stones grantee partner.
Another study reports on the operations of the Tahirih Justice Center, which targets assistance to immigrant women fleeing gender-based violence. The Center’s programs include a Pro Bono Attorney Network with 440 volunteer lawyers, as well as counseling and job and housing assistance.54 Based on the value of the donated services and data on job placements, we estimate the Tahirih Justice Center produces returns of 3.09:1 on its foundation funding. Similarly, Casa de Maryland uses pro bono legal services provided by such prestigious firms as Skadden Arps Slate Meagher & Flom LLP, and Covington & Burling to help workers recover unpaid wages in nearly 1,200 cases per-year. The program also trains tenants, workers, and women to organize their
neighbors, colleagues, and friends to press for commu-nity improvements.55 Based on the value of the donated services and the results of CASA-sponsored efforts, we estimate that the program generated a 1.45:1 rate of return on its funding.
In other examples, the Capital Area Asset Builders oper-ates an “individual development account” program that helps low-income people and families save for educa-tion, job training, home purchases, or to start a business. Savers receive a $3-to-$1 match for their own saving, as well as intensive training to help them understand credit, eliminate debt, stick to a budget, and save.56 The program generates an estimated ROI of 3.0:1. The same return is produced by the D.C. Appleseed program, which uses pro bono services from local law and accounting firms to organize business leaders, community experts and citizens to identify, research, and advocate on commu-nity issues. Based on the value of its donated services, D.C. Appleseed also produces returns of 3.0:1.57 And in another sub-category, the Center for Needs Assessment and Planning and Florida Taxwatch conducted an analysis of the returns on investments in a broad range of job train-ing and education programs. This study found that every dollar invested in education at correctional institutions, for example, produced benefits valued at $3.20, while the returns on special education programs were 3.53:1.58
Three programs in this category reported unusually high rates of return. The OAR project, for example, recruits volunteers to teach ex-offenders how to find and keep jobs and housing, provide community service, obtain health care, and stay within the law.59 Based on its costs and the average salary of those placed in jobs, the pro-gram produces a very high ROI of 48.7:1. In another case, the Solidago Foundation supports groups doing grassroots work to improve their communities by clos-ing or preventing high-polluting facilities, preserving and expanding affordable housing, creating zoning and community land trusts, and protecting tenants’ rights.60 Solidago’s grantees have secured major federal funding
sub-categoryProjected
support share
Civil Rights and Social Action
$490,314,968 10.7%
Community Improvement & Development
$1,570,633,441 32.3%
Philanthropy and Voluntarism
$1,690,400,122 36.9%
Public Affairs/Society Benefit—General
$830,710,148 18.1%
total $4,582,058,679 100.0%
table 8a the Distribution of foundation funding for Public affairs/society benefit-Related Programs, 2007
53 Washington Area Women’s Foundation. “A Portrait of Women and Girls in the Washington Metropolitan Area,” and “Stepping Stones Reports 2005-2007,” http://thewomensfoundation.org/our-work/research.
54 Tahirih Justice Center, www.tahirih.org.55 Casa de Maryland, http://www.casademaryland.org/.56 Capital Area Asset Builders, www.caab.org.57 DC Appleseed, http://www.dcappleseed.org/.58 Moore, Michael W. “Return on Investment for Correctional Education in Florida.” Florida Department of Corrections: Bureau of Data and
Research Analysis, June 1999, http://www.dc.state.fl.us/pub/taxwatch.59 Offender Aid and Restoration, www.oaronline.org.60 Solidago Foundation, “Measuring the Impact on Community Organizing,” http://www.solidago.org/080429%20Short%20Report_Final_From%20
Kathy%20Sharkey.pdf.

The Social and Economic Value of Private and Community Foundations26
to clean up contaminated sites and help victims, con-duct air quality research, and train people in environ-mental health and justice issues. A recent study found that for every dollar which Solidago invested in grant-ees, their communities received $59 in benefits. Finally, the project, Towards No Tobacco Use reports health-related benefits equal to $55 for every $1 expended by the program. If these three examples are treated as outliers, the return on investment in this category would be closer to 10:1 than 22:1. Yet, there is also no basis to discount the results of these programs.
The following table, Table 8B, lists the studies and reports used to derive the average weighted returns on foundation grants for public affairs/society benefit-related activities. Here, as elsewhere, the value gener-ated by the sampled nonprofit and government pro-grams is generated in each sub-category, the returns are calculated and then the total returns are estimated based on each sub-category’s share of total foundation support in this area.
We estimate that the social return on foundation sup-port for public affairs/society benefit-related programs averages 22.04:1. On this basis, we estimate that $4.58
billion in private and community foundation support for these efforts in 2007 produced benefits valued at nearly $101 billion.
category 7: science and technology
Private and community foundations provided nearly $1.24 billion in grants and support for science and tech-nology programs in 2007, and we estimate that these investments generated a total of $6.13 billion in bene-fits, with an average social rate of return of 4.96:1. Some of the programs cited in this area are similar to those in the health area, especially those involving medical research. These programs could be classified in either category as instances of scientific research that have led to improvements in health care.
The estimates of returns in this area, as in all others, are derived from reviewing existing analyses of the results of grants and other support over a wide range of sci-ence and technology programs, estimating the returns on investments (foundation funding) based on those results, classifying those results according to the sub-categories of funding in this area, calculating the return for each sub-category, calculating a weighted average
sub-categoryReturn on Investment (RoI)
Washington Area Women’s Foundation Civil Rights & Social Action 5.50:1
Tahirih Justice Center Civil Rights & Social Action 3.09:1
Capital Area Asset Builders Community Improvement & Development 3.00:1
Solidago Community Improvement & Development 59.00:1
Project Towards No Tobacco Use Community Improvement & Development 55.84:1
Casa de Maryland Philanthropy & Voluntarism 1.45:1
OAR of Arlington County Philanthropy & Voluntarism 48.69:1
DC Campaign to End Teen Pregnancy Public Affairs/Society Benefit 1.62:1
DC Appleseed Public Affairs/Society Benefit 3.00:1
Juvenile Offender Interagency Coordination Public Affairs/Society Benefit 15.49:1
Mentoring in the Juvenile Justice System Public Affairs/Society Benefit 1.78:1
Project ALERT Public Affairs/Society Benefit 18.02:1
Florida Investment in Correctional Education Public Affairs/Society Benefit 3.20:1
average Value created, Per Dollar of Investment (Weighted by Grant Dollars) 22.04:1
estimated benefits from foundation support for Public affairs/society benefit-Related Programs in 2007
$100,999,672,814
table 8b social Rates of Return for selected Public and Private funding of Public affairs/society benefit-Related Programs, by sub-category

The Social and Economic Value of Private and Community Foundations 27
return on investment for the human service category, and finally, estimating the total benefits based on that return and on total foundation funding for human ser-vice-related grants and programs in 2007.
Table 9A, below, presents the distribution of science and technology funding by private and community founda-tions across the six sub-categories for the Foundation Center funding data. The largest sub-category is gen-eral science, followed by programs in the physical sci-ences, life sciences and technology.
Our estimates of the rate of return on foundation sup-port for science and technology, as in other areas, are based on a review of studies and reports estimating the benefits generated by public and private science and technology programs or data from which those esti-mates can be derived. For example, the training pro-gram at the nonprofit Computer C.O.R.E. trains low-income adults in technological and workplace skills. The program reports that the average hourly wage of those who take new jobs prior to graduating increased from $8.49 prior to enrollment to $11.73, and 25 per-cent receive subsequent promotions. Furthermore, some 45 percent of program participants go on to more advanced training or higher education, primar-ily at Northern Virginia Community College, and some graduates found successful businesses.61 On average, the cost per- participant is $1,000, compared to average annual salary increases of $3,000 to $4,000, for a return on investment of at least 3.0:1.
In the technology research area, Science Foundation Arizona has funded work by Professors David Lynch of the University of Arizona and Harald Øye of the Norwegian University of Science, through the Solar Technology Research Corporation (STRC), to develop a new method of refining silicon using metallurgical processes for more efficient solar energy. The photovoltaic industry relies on high-purity silicon, a critical and costly material for solar panels, usually produced in submerged arc fur-naces using the industry standard, Siemens™ process. Demand for high purity silicon has exceeded supply since 2006, with prices increasing 12-fold to $300 per-kg since the mid-1990s. STRC expects its new refining pro-cess to reduce those costs by up to 50 percent, reducing the cost of solar panels by one-quarter. The cost sav-ings are estimated close to $300 million, compared to an investment of $78 million, for a ROI of 3.85:1.
In other research programs, a comprehensive review of federal R&D efforts to advance more energy-efficient fossil-fuel technologies by a committee of the National Research Council of the National Academies found that those programs significant economic, environmental, and national security benefits. The report analyzed 17 R&D programs in energy efficiency and 22 programs in fossil energy funded by the U.S. Department of Energy (DOE) and found that they produced economic returns estimated at $40 billion from investments of $13 billion, for a ROI of 3.08:1.62
In the sub-category of policy and management, the City of Rancho Cucamonga, California, formed a municipal utility in August 2001. The purposes included greater local control over energy sources, reducing the impact of CPUC/Edison, shielding the Victoria Arbors area from some of the price volatility for electrical energy, tailor-ing energy conservation efforts for local residents, and
sub-categoryProjected
support share
Policy, Management and Information
$47,406,850 3.84%
General Science $505,697,741 40.94%
Physical Science $262,251,947 21.23%
Technology $198,419,158 16.06%
Life Science $220,502,871 17.85%
Other $897,347 0.73%
total $1,235,175,914 100%
table 9a the Distribution of foundation funding for science and technology Programs, 2007
61 Computer C.O.RE., www.computercore.org.62 Three energy-efficiency programs, costing about $11 million, produced nearly three-quarters of these benefits; Committee on Benefits of DOE
R&D on Energy Efficiency and Fossil Energy, Commission on Engineering and Technical Systems, National Research Council. “Energy Research at DOE: Was It Worth It? Energy Efficiency and Fossil Energy Research 1978-2000.” National Academies Press, 2001.
Private and community foundations provided nearly
$1.24 billion in grants and support for science and
technology programs in 2007, and we estimate that
these investments generated a total of $6.13 billion
in benefits, with an average social rate of return of
4.96:1.

The Social and Economic Value of Private and Community Foundations28
generating additional for public services. A study of the project found it produced returns of 10.8:1.
In the life sciences sub-category, studies of support for three medical research efforts also found strong returns. A 17-year effort by the National Institute for Allergy and Infectious Diseases to develop a Hepatitis B vac-cine generated returns of 3.07:1; a 21-year program by the National Eye Institute to perfect laser treatments for blindness caused by diabetes produced even higher returns, 4.61:1; and a 17-year program by the National Cancer Institute to develop new chemotherapies for advanced testicular cancer generated a return on the investments of 8:86:1.
The following table, Table 9B, lists these and other studies used to derive a measure of the average weighted returns on foundation grants for science and technology:
We estimate that the social return on foundation support for science and technology programs averages 4.96:1. On this basis, we estimate that $1.24 billion in private and community foundation support for these efforts in 2007 produced benefits valued at $6.13 billion.
* * *
Four other categories of foundation activity focus on needs and concerns which produce results, but their benefits cannot be directly measured: 1) International Affairs, Peace and Human Rights; 2) Social Sciences; 3) Religion; and 4) “Other.”
category 8: International affairs, Peace, Human Rights
Private foundations provided an estimated $2.29 bil-lion in grants and support for programs focused on international affairs, peace and human rights in 2007. We reviewed studies and reports from nonprofit orga-nizations focused on these concerns. Some of these programs provide public education that may produce better-informed voters, who in turn may become active advocates for non-military responses to international ten-sion, conceivably avoiding enormous expenditures and untold suffering. Other programs help organize public pressures to relieve the suffering of political prisoners, again alleviating suffering and perhaps improving politi-cal and social conditions. Yet other programs promote greater comity and cooperation at local levels. Unlike the other program areas we have reviewed above, there are no scientific metrics to measure the economic or social benefits from these efforts.
sub-categoryReturn on Investment (RoI)
Municipal Utility Project, California General Science 10.80:1
Solar Technology Research Corporation Physical Science 3.85:1
Hybrid Corn Physical Science 7.00:1
Pharmaceutical Research Physical Science 1.16:1
Health Physical Science 2.40:1
Computer C.O.R.E Technology 3.00:1
Energy Efficient Fossil Fuel Technologies Technology 3.08:1
National Institute for Allergy and Infectious Diseases—hepatitis B vaccine (1964-1981)
Life Science 3.07:1
National Eye Institute—laser treatment for blindness caused by diabetes (1971-1992)
Life Science 4.62:1
National Cancer Institute—chemotherapy for advanced testicular cancer (1970-1987)
Life Science 8.86:1
average Value created, Per Dollar of Investment (Weighted by Grant Dollars) 4.96:1
estimated benefits from foundation support for science and technology Programs in 2007
$6,126,867,646
table 9b social Rates of Return for selected Public and Private funding of science and technology Programs, by sub-category

The Social and Economic Value of Private and Community Foundations 29
For example, the City at Peace project promotes cross-cultural understanding, provides training in conflict resolution, and tries to discourage youth violence by bringing together teenagers to create musical theater productions based on their life stories.63 The theater pro-gram is an intensive year-long process that culminates in public performances aimed at building trust and rela-tionships among teens and, ultimately, creating positive changes in their lives, their families, schools, and com-munities. Some 90 percent of the project’s funding is used directly to provide training and organize the per-formances.64 Another example is the International Alert program,65 an independent “peace-building” organiza-tion that uses 85 percent of its funding to provide public education in international affairs that could affect the prospects for peace and work with people to organize around war and peace issues.
The vast bulk of the funding that these organizations receive is devoted to promoting cross-cultural activities or international peace, and these activities themselves can be properly considered to represent the value of the program. The return on investments for these programs and organizations, therefore, is approximately 1.0:1. Further, a significant share of their resources comes from fees for their activities, such as the ticket sales for the public performance of City at Peace. These fees also
can be considered a measure of the value created, since they represent people’s minimum valuation of the ser-vices these organizations provide. In this regard, as well as with regard to the general benefits from their human rights and peace-related public education and activ-ism, the actual ROI for these activities is almost certainly greater than 1.0:1. Since we cannot measure those ben-efits, however, we assume that these programs yield returns of approximately 1.0:1.
On this basis, we estimate that $2.29 billion in private and community foundation support for these efforts in 2007 produced benefits valued at a minimum of $2.29 billion.
category 9: social sciences
Private and community foundations provided an esti-mated $581 million in grants and support for social sci-ence programs and organizations in 2007. We reviewed studies and reports from many of those programs and organizations. Most of these programs support research and publication at educational or public policy institu-tions, while others fund more academic-based advocacy activities. According to the Foundation Center, about one-third of the grants and support in this area go to social science and economic research and related activi-ties, while two-thirds go to interdisciplinary research and activities. As with support for the programs in inter-national affairs, peace and human rights, there are no accepted measures that can estimate the social and economic benefits of this support.
The Aspen Institute, for example, funds a range of pub-lic policy research, public programs to discuss research, campus activities and seminars related to this research, a global leadership network program, and other similar activities. More than 92 percent of the Institute’s funding goes for these program expenses, yielding an approxi-mate rate of return of 1.0:1.66 Similarly, the Center for
63 City at Peace, www.cityatpeacedc.org.64 City at Peace. “Return of Organization Exempt from Income Tax, Form 990,” 2006, http://dynamodata.fdncenter.org/990_pdf_archive/521/5219
13537/521913537_200706_990.pdf.65 International Alert. “2007 Annual Review,” 2007, http://www.international-alert.org/pdfs/Annual_Review_2007.pdf.66 The Aspen Institute, http://www.aspeninstitute.org.
ProgramReturn on Investment
City at Peace 1.0:1
International Alert 1.0:1
average Value created, Per Dollar of Investment
1.0.1
total funding $2,287,649,706
estimated benefits from foundation support for Program In International affairs, Peace, and Human Rights in 2007
$2,287,649,706
table 10 social Rates of Return for selected Private funding of Programs focused on International affairs, Peace, and Human Rights
Private foundations provided an estimated $2.29
billion in grants and support for programs focused on
international affairs, peace and human rights in 2007.

The Social and Economic Value of Private and Community Foundations30
Economic and Policy Research (CEPR) focuses its fund-ing on two programs: a domestic economic policy proj-ect which analyzes government data and distributes the findings, and a globalization project which focuses on research and public education in that area. All of the funding can be considered to contribute to the orga-nization’s social and economic impact. Funding for the Center for Strategic and International Studies (CSIS), a research and analysis organization for issues in stra-tegic and international affairs, similarly contributes to its impact in these areas.67 While the benefits from the funding for these organizations may be large insofar as they help promote and advance positive changes in public policies, there are no means of measuring the
relationship between the work of CEPR or CSIS and those changes. Therefore, we attribute a ROI of 1.0:1 to the investments in these projects.68
We ascribe the same return to the Alliance for Justice, which uses its funding for nonprofit advocacy, research and advocacy related to judicial selection and to foun-dation and other nonprofit activities, a fellows program, a public policy project for youth, and other similar activi-ties.69 The funds are used to operate workshops, conduct and publish research, and hold public forums and other events. We also assume a ROI of 1.0:1 for investments in the National Strategy Information Center, which uses its funding to support activities in three areas: a consortium for the study of the use of intelligence, which produces research and analysis for public officials and scholars; a collaborative research project in transnational coopera-tion; and a program on the culture of lawfulness, which works with local leaders from many countries to pro-mote the rule of law.
On this basis, we estimate that $581 million in private and community foundation support for these efforts in 2007 produced benefits valued at a minimum of $581 million.
categories 10 and 11: Religion and “other”
Private and community foundations provided an esti-mated $926 million in grants and support for religion-related programs, plus a residual of about $37 million
sub-category Projected support share
Social Sciences and Economics
$193,436,228.6 33.28%
Interdisciplinary/Other
$387,802,438.9 66.72%
total $581,238,667.5 100.0%
table 11a the Distribution of foundation funding for social science Programs and organizations, 2007
67 Center for Strategic and International Studies, http://www.csis.org.68 Center for Economic and Policy Research, http://www.cepr.net.69 Alliance for Justice, http://www.afj.org.
sub-categoryReturn on Investment (RoI)
Center for Economic and Policy Research Social Sciences & Economics 1.0:1
The Aspen Institute Social Sciences/ Economics 1.0:1
Alliance for Justice Interdisciplinary/Other 1.0:1
Center for Strategic and International Studies Interdisciplinary/Other 1.0:1
National Strategy Information Center Interdisciplinary/Other 1.0:1
average Value created, Per Dollar of Investment 1.0:1 1.0:1
total funding $581,238,667.5
estimated benefits from foundation support for science and technology Programs in 2007
$581,238,667.5
table 11b social Rates of Return for selected Private funding of Programs focused on the social sciences, 2007
Private and community foundations provided an
estimated $581 million in grants and support for social
science programs and organizations in 2007.

The Social and Economic Value of Private and Community Foundations 31
in support for activities that do not fall under any of the other 10 categories. We do not analyze the programs and other activities classified by the Foundation Center as “other,” as they represent less than 1 percent of all private foundation funding. We did examine reports from some religion-related programs, which generally support religious outreach and evangelism. As with support for the programs in the social sciences and in international affairs, peace and human rights, there are no accepted metrics for estimating the social and eco-nomic benefits of support for religion-related activities.
Religious organizations such as the Acts 1:8 Ministry and the Knox Fellowship provide free, church-outreach pro-grams and evangelical materials to churches, ministries and individuals seeking to share their faith. The Acts 1:8 Ministry, for example, operates a program called Planned Acts of Christian Kindness (PACK) to spread Christian beliefs and faith. Again, these organizations devote more than 90 percent of their resources to religious organizing activities and encouraging participation in their outreach programs.70 These activities may provide spiritual and practical support and assistance to their participants, which may in turn produce personal changes that yield significant social and economic benefits. However, there is no scientific way to establish and measure the links
between such changes and foundation support for those activities. Therefore, we attribute a return of 1.0:1 to that support; these investments produce equivalent value.
On this basis, we estimate that $964 million in private and community foundation support for religion-related and other activities produced benefits valued at a mini-mum of $964 million.
70 Acts Ministries. “Return of Organization Exempt from Income Tax, Form 990,” 2004.
Private and community foundations provided an
estimated $926 million in grants and support for
religion-related programs, plus a residual of about
$37 million in support for activities that do not fall
under any of the other 10 categories.
sub-category Projected support share
Religion $926,409,977.6 96.04%
Other $37,939,837.4 3.96%
total $964,349,815 100.0%
table 12a the Distribution of foundation funding for Religion-Related and “other” Programs, 2007
table 12b social Rates of Return for selected Private funding of Programs focused on Religion and other areas, 2007
sub-categoryReturn on Investment (RoI)
Acts 1:8 Ministry Religion 1.0:1
Knox Fellowship Religion 1.0:1
Other Other 1.0:1
average Value created, Per Dollar of Investment 1.0:1 1.01:1
total funding $964,349,815
estimated benefits from foundation support for Religion-Related and other Programs in 2007
$964,349,815

The Social and Economic Value of Private and Community Foundations32
The funding and other activities of private and community foundations generate not only very substantial direct ben-efits, primarily for the organizations they support and the people those organizations assist, but also, even greater indirect benefits for the communities which their fund-ing and activities affect. Many foundation activities create jobs and incomes for both employees and participants in the programs supported by those foundations, and those jobs and higher incomes produce greater spend-ing which has “multiplier effects.” The additional spend-ing increases demand which businesses satisfy by creat-ing additional jobs, triggering another cycle of higher incomes and yet more jobs. All of the jobs and additional income generated in this manner also produce additional tax revenues for federal, state and local governments.
The wide-ranging study by the Cultural Alliance of Greater Washington and Americans for the Arts, noted earlier in this study, also examined the indirect eco-nomic effects of the operations of nonprofit arts and culture organizations and institutions, including new jobs, additional household income, and tax revenues.71 This study sampled more than 6,000 nonprofit arts and cultural entities in 156 regions across the United States. The researchers estimated that expenditures of $63.1 billion by these organizations and institutions gener-ated $104.2 billion in additional household income, $12.6 billion in additional federal tax revenues, $9.1 bil-lion in additional state tax revenues, and $7.9 in addi-tional local tax revenues. These findings indicate that every dollar invested by foundations in arts and culture-related activities yields an additional $1.65 in household incomes (the “income multiplier”), $0.199 in federal tax revenues (the “federal tax multiplier”), $0.144 in state tax revenues (“state tax multiplier”), and $0.125 in local
tax revenues (“local tax multiplier”). Based on esti-mated foundation support for arts and culture in 2007 of approximately $5.23 billion, we estimate that those investments will generate approximately $8.62 billion in additional household incomes, $993 million in addi-tional federal tax revenues, $731 million in additional state taxes, and $627 million in additional local taxes.
The critical factor generating these indirect benefits is the employment, and we can use the findings of the study by the Cultural Alliance to roughly estimate the indirect benefits from private foundation support in other areas, by using the employment-producing capacity of non-profit activities in arts and culture and the employment of nonprofits in other areas to extrapolate the income and revenue effects in those other areas. The Center for Civil Society Studies at Johns Hopkins University collects data on employment in charitable nonprofits (501c(3)s) working in diverse areas, and issued a report on total paid employment generated by the nonprofit sector in different fields in 2004.72 We use these data as a rough proxy for the employment effects of foundation activities, since charitable nonprofits depend largely on founda-tion support, and foundations target most of their sup-port to charitable nonprofits. The table on the next page, Table 13, shows employment in each grant area relative to employment associated with the activities of arts and culture nonprofits. For example, the number of jobs cre-ated by education-related charitable nonprofits is nearly 5.7 times the jobs created by arts and culture nonprofits, while health-related charitable nonprofits generate nearly 21.8 times more jobs than arts and culture nonprofits.
If we assume that the average wage paid in each cat-egory is similar, we can use the findings of the study of arts and culture nonprofits to estimate the additional household income and taxes generated by each area of foundation support.73 These estimates entail multiply-ing the foundation dollar support in each category first by the employment factors relative to arts and culture, presented in the table above, and then by the “income multipliers” and “tax multipliers” established by the Cultural Alliance analysis. For example, we would esti-mate that the activities of education-related nonprofits would generate additional household income equal to
4. IndIrect benefItS from PrIVate foundatIon SuPPort
71 Americans for the Arts. “Arts & Economic Prosperity III: The Economic Impact of Nonprofit Arts and Culture Organizations and Their Audiences,” 2007.72 Salamon, Lester M., and S. Wojciech Sokolowski. “Employment in America’s Charities: A Profile.” The Johns Hopkins Center for Civil Society
Studies, 2006, http://www.jhu.edu/ccss/research/pdf/Employment%20in%20Americas%20Charities.pdf73 Ibid; The average weekly wage in the nonprofit sector is approximately $627. For most sectors, the average wage was close to this number,
though hospitals have much higher average wages.
The funding and other activities of private and com-
munity foundations generate not only very substantial
direct benefits, primarily for the organizations they
support and the people those organizations assist, but
also, even greater indirect benefits for the communi-
ties which their funding and activities affect.
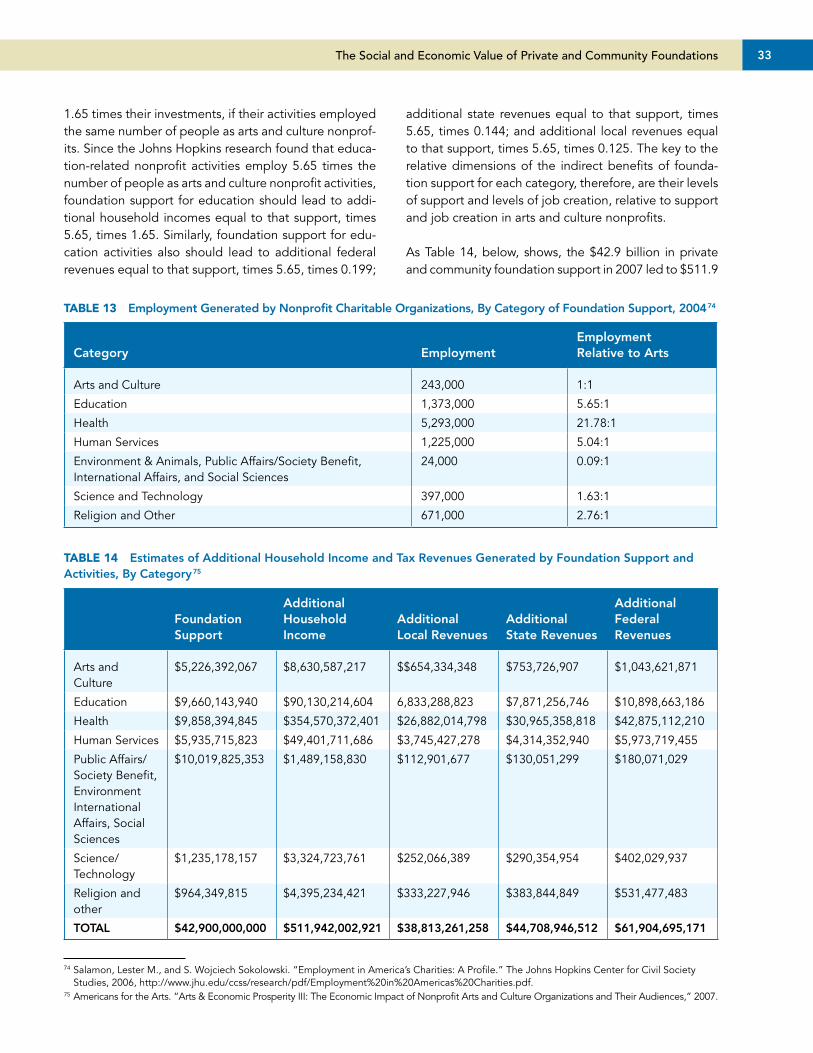
The Social and Economic Value of Private and Community Foundations 33
1.65 times their investments, if their activities employed the same number of people as arts and culture nonprof-its. Since the Johns Hopkins research found that educa-tion-related nonprofit activities employ 5.65 times the number of people as arts and culture nonprofit activities, foundation support for education should lead to addi-tional household incomes equal to that support, times 5.65, times 1.65. Similarly, foundation support for edu-cation activities also should lead to additional federal revenues equal to that support, times 5.65, times 0.199;
additional state revenues equal to that support, times 5.65, times 0.144; and additional local revenues equal to that support, times 5.65, times 0.125. The key to the relative dimensions of the indirect benefits of founda-tion support for each category, therefore, are their levels of support and levels of job creation, relative to support and job creation in arts and culture nonprofits.
As Table 14, below, shows, the $42.9 billion in private and community foundation support in 2007 led to $511.9
category employment employment Relative to arts
Arts and Culture 243,000 1:1
Education 1,373,000 5.65:1
Health 5,293,000 21.78:1
Human Services 1,225,000 5.04:1
Environment & Animals, Public Affairs/Society Benefit, International Affairs, and Social Sciences
24,000 0.09:1
Science and Technology 397,000 1.63:1
Religion and Other 671,000 2.76:1
table 13 employment Generated by nonprofit charitable organizations, by category of foundation support, 200474
74 Salamon, Lester M., and S. Wojciech Sokolowski. “Employment in America’s Charities: A Profile.” The Johns Hopkins Center for Civil Society Studies, 2006, http://www.jhu.edu/ccss/research/pdf/Employment%20in%20Americas%20Charities.pdf.
75 Americans for the Arts. “Arts & Economic Prosperity III: The Economic Impact of Nonprofit Arts and Culture Organizations and Their Audiences,” 2007.
foundation support
additional Household Income
additional local Revenues
additional state Revenues
additional federal Revenues
Arts and Culture
$5,226,392,067 $8,630,587,217 $$654,334,348 $753,726,907 $1,043,621,871
Education $9,660,143,940 $90,130,214,604 6,833,288,823 $7,871,256,746 $10,898,663,186
Health $9,858,394,845 $354,570,372,401 $26,882,014,798 $30,965,358,818 $42,875,112,210
Human Services $5,935,715,823 $49,401,711,686 $3,745,427,278 $4,314,352,940 $5,973,719,455
Public Affairs/Society Benefit, Environment International Affairs, Social Sciences
$10,019,825,353 $1,489,158,830 $112,901,677 $130,051,299 $180,071,029
Science/ Technology
$1,235,178,157 $3,324,723,761 $252,066,389 $290,354,954 $402,029,937
Religion and other
$964,349,815 $4,395,234,421 $333,227,946 $383,844,849 $531,477,483
total $42,900,000,000 $511,942,002,921 $38,813,261,258 $44,708,946,512 $61,904,695,171
table 14 estimates of additional Household Income and tax Revenues Generated by foundation support and activities, by category75

The Social and Economic Value of Private and Community Foundations34
billion in additional household income, through various multiplier effects, and additional tax revenues of $61.9
billion for the federal government, $44.7 billion for state governments, and $38.8 billion for local governments.
5. the PotentIal ImPact of taxInG foundatIonS and nonProfIt orGanIzatIonS
The New York Times reported recently that researchers have estimated that the tax-exempt status of charities costs local governments some $8 billion to $13 billion annually, in foregone revenues.76 Our analysis suggests that private and community foundation activities alone generate revenues equal to at least three times those estimated losses, and the same inference is probably applicable to state and federal taxation. In fact, if foun-dations were subject to tax on their incomes, local, state and federal governments might lose revenues if the taxes were high and significantly reduced the activities of those organizations. Many nonprofit organizations operate on a shoe string with volunteer staff working at kitchen tables. If these organizations were taxed or the foundations providing their support reduced their fund-ing due to high taxes, some of them could be forced to close. These effects could reduce the compassion-ate activities, innovation, and intellectual and ideologi-cal diversity, which private foundations help generate across the United States.
Taxing foundations also could be problematic and enor-mously complex. Most for-profit entities calculate their taxes based on the difference between their revenues and their costs, after allowing for numerous credits and deductions. Their revenues are generated from their actual operations, such as the sale of products and ser-vices from automobiles to medical advice or legal repre-sentation. The costs include payments to employees and purchases of goods and other services directly involved in the production of their products or services. These categories and distinctions, however, are not directly
applicable to nonprofit organizations. For example, one of the main sources of revenues for foundations is dona-tions from individuals, corporations, other nonprofits or government. Many nonprofits also charge fees for vari-ous services, which may be billed directly to the person receiving the service or to third parties such as the gov-ernment. However, these fees rarely cover the actual costs or value of the services provided. As is evident from many of the examples described in this analysis, the market value of an art class, for example, is much higher than the fees which the nonprofit providing it charges. Furthermore, while nonprofits pay employees and purchase goods and services, a significant share of the labor, goods and services they use are donated. If nonprofits were taxed, it is unclear whether the value of these donations should be considered income or implicit revenues, or costs. Since nonprofits do not price their services in order to earn an excess over their cost, a workable concept of profit for their activities also could be highly problematic.
Nonprofit organizations can operate and survive only if their various forms of donated support are sufficient to provide the services for which they exist. Taxing the activities of private and community foundations would be equivalent to taxing the public services and public goods they provide, and which in 2007 already gener-ated an estimated $367.9 billion in direct benefits, $511.9 billion in additional household income, and $145.4 bil-lion in additional local, state and federal revenues.
On balance, the very substantial economic and social benefits produced through the funding and other activities of private and community foundations argue strongly against taxing the assets or income that ulti-mately produce those benefits.
76 Strom, Stephanie. “Tax Exemptions of Charities Face New Challenges.” New York Times, 26 May, 2008, http://www.nytimes.com/2008/05/26/us/26tax.html?_r=1&oref=slogin, and Brody, Evelyn. Property Tax Exemption for Charities: Mapping the Battlefield. Urban Institute Press, 2002.
Taxing foundations also could be problematic and
enormously complex.

The Social and Economic Value of Private and Community Foundations 35
Aborn, Richard M. “Time to End Recidivism.” The Nation, 4 March 2005. http://www.thenation.com/doc/20050321/aborn.
Abzug, Rikki, and Joy K. Turnheim. “Bandwagon or bandaid? A model of nonprofit incorporation by state” Nonprofit and Voluntary Sector Quarterly 27 (1998): 300-322.
Acts Ministries. “Return of Organization Exempt from Income Tax, Form 990,” 2004. http://dynamodata.fdncenter.org/990_pdf_archive/161/161644133/161644133_200412_990.pdf
Aizenman, N.C. “The High Cost of Incarceration.” Washington Post, 29 February 2008. http://www.denverpost.com/ci_8400051.
Alliance for Justice, http://www.afj.org.
Americans for the Arts. “Arts & Economic Prosperity III: The Economic Impact of Nonprofit Arts and Culture Organizations and Their Audiences,” 2007. http://www.artsusa.org/pdf/information_services/research/services/economic_impact/aepiii/highlights.pdf
Aos, S., Miller, M., and Mayfield, J (2004). “Benefits and Costs of Prevention and EarlyIntervention Programs for Youth,” Olympia, WA: Washington State Institute of PublicPolicy. http://www.wsipp.wa.gov/pub.asp?docid=04-07-3901.
Aspen Institute, http://www.aspeninstitute.org.
Beckett, Megan. “Current Generation Youth Programs: What Works, What Doesn’t, andAt What Cost?” RAND Corporation, 2008.
Belfield, Clive R. “Investing in the Economic Vitality of the District of Columbiathrough Pre-Kindergarten for All, September 2006. http://www.osse.dc.gov/seo/lib/seo/pdf/pre-k_for_all_executive_summary.pdf.
Belfield, Clive R., and Henry M. Levin. “The Return on Investment for Improving California’s High School Graduation Rate.” California Dropout Research Project, August 2007. http://www.cbcse.org/media/download_gallery/California%20Dropout%20Study%20Report%202FINAL.pdf.
Belfield, Clive R., and Henry M. Levin. “Investments in K-12 Education for Minnesota:What Works?” Growth and Justice Conference, Minnesota, November 2007. http://www.cbcse.org/media/download_gallery/GROWTH_JUSTICE_PAPER.pdf.
Brody, Evelyn. Property-Tax Exemption for Charities: Mapping the Battlefield. Washington, DC: Urban Institute Press, 2002. http://www.urban.org/books/PropTax/intro.cfm.
Bureau of Economic Analysis. “Table 3.1E: Current-Cost Net Stock of Private Equipment and Software by Industry.” www.bea.gov/national/FA2004/TableView.asp?SelectedTable=21&FirstYear=202&Lat Year=2007&Freq=Year.
Capital Area Asset Builders, http://www.caab.org.
Casa de Maryland, http://www.casademaryland.org/.
Center for Alexandria’s Children, http://www.centerforalexandriaschildren.org.
Center for Economic and Policy Research, http://www.cepr.net.
Center for Strategic and International Studies, http://www.csis.org.
Christophersen, Kjell A., and Robison, Henry M. “The Economic Contribution of Maryland’s Community Colleges.” State of Maryland, December 2007. http://www.mdacc.org/PDFs/ccbenefits07/ccbenefits_executive_summary.pdf.
City at Peace, http://www.cityatpeacedc.org.
City at Peace “Return of Organization Exempt from Income Tax, Form 990,” 2006. http://dynamodata.fdncenter.org/990_pdf_archive/521/521913537/521913537_200706_990.pdf.
Colimore, Edward. “Battleship New Jersey Wrestles with State Budget Cuts.” Philadelphia Inquirer, 26 August 2008. http://www.philly.com/philly/business/homepage/ 20080826_Battleship_New_Jersey_wrestles_with_state_budget_cuts.html.
Colorado Arts and Culture. “Economic Development Impact Studies.” http://www.coloarts.state.co.us/programs/economic/impact/index.htm.
Columbus Cultural Leadership Consortium. “Thrive in Five Proposal,” 2007. http://www.columbuspartnership.com/images/CCLCThrive_In_Five2007.pdf.
referenceS

The Social and Economic Value of Private and Community Foundations36
Committee on Benefits of DOE R&D on Energy Efficiency and Fossil Energy, Commission on Engineering and Technical Systems, National Research Council. “Energy Research at DOE: Was It Worth It? Energy Efficiency and Fossil Energy Research 1978-2000.” National Academies Press, 2001.
Community Coordinated Childcare. “The Economic Impact of the Child Care Industry in Jefferson County,” 2003. http://www.4cforkids.org/files/pdf/executive_summary_final_jeff.pdf.
Community Foundation of Tompkins County and Community Arts Partnership (CAP). “Arts and Culture, Commerce and Community: Independent and Interdependent,” 31 March 2004. http://www.communityfoundationoftc.org/library/documents/CriticalIssuesArtsRoundtableFinalSum.doc
Computer C.O.R.E, www.computercore.org.
Connecticut Commission on Children. “A Children’s Stock Portfolio: One Smart Investment, April 2007. http://www.cga.ct.gov/COC/PDFs/prevention/040207_stockportfolio_v1.pdf.
Connell, Kathleen. “Community Colleges: A Great Return on Investment.” Christian Science Monitor, 4 August 2008. http://www.csmonitor.com/2008/0804/p16s01-wmgn.html.
Cornerstone, www.cornerstonedc.org.
Dempsy, Dave, Jane Elder, and Donald Scavia. “Great Lakes Restoration and the Threat of Global Warming.” Healing Our Waters – Great Lakes Coalition, May 2008. http://www.healthylakes.org/wordpress/wp-content/uploads/2008/05/how-global-warming-report-08.pdf.
District of Columbia Access Program, District of Columbia Education Compact, District of Columbia Public Schools, and District of Columbia Education Office. “Double the Numbers for College Success: A Call to Action for the District of Columbia,” 2006. www.doublethenumbersdc.org/resources.
District of Columbia Appleseed, http://www.dcappleseed.org.
District of Columbia Central Kitchen, www.dccentralkitchen.org.
District of Columbia Department of Health. “Healthcare Alliance Payment Rate Comparative Benchmarking Report,” 2006. http://www.dcpca.org/index.php?option=com_content& task=view&id=433&Iteid=299.
District of Columbia Habitat for Humanity, www.dchabitat.org.
District of Columbia Office of the State Superintendent. “Investing in the Economic Vitality of the District of Columbia through Pre-Kindergarten for All,” June 2006. http://www.osse.dc.gov/seo/lib/seo/pdf/pre-k_for_all_executive_summary.pdf
District of Columbia Primary Care Association, http://www.dcpca.org.
Doorways for Women and Families, www.doorwaysva.org.
Frey, Lauren L., Sarah B. Greenblatt, and Jim Brown. “A Call to Action: An Integrated Approach to Youth Permanency and Preparation for Adulthood.” Casey Family Services, April 2005. http://www.caseyfamilyservices.org/pdfs/casey_permanency_0505.pdf.
Friends of Guest House, www.friendsofguesthouse.org.
Florida Division of Cultural Affairs. “ROI Factsheet.” http://www.florida-arts.org/resources/documents/DOSbrochurePage2.pdf.
Foundation Center. “FC Stats: Distribution of Foundation Grants by Subject Categories, circa 2006.” http://foundationcenter.org/findfunders/statistics/pdf/04_fund_sub/2006/10_06.pdf.
Foundation Center. “Highlights of Foundation Giving Trends.” Foundations Today` Series, 2007. http://foundationcenter.org/gainknowledge/research/pdf/fgt07highlights.pdf.
Foundation Center. “Learn About Foundations and Fundraising,” updated 2008. http://foundationcenter.org/getstarted/learnabout/foundations.html.
French, M.T., et al. “Benefit-Cost Analysis of a Modified Therapeutic Community for Mentally Ill Chemical Abuses.” Evaluation and Program Planning 25.1 (2002): 137-148, 2002.
Frye Art Museum. “Frye Art Museum Offers Summer Studio Classes and Art History Course.” April 2008. http://fryemuseum.org/press_release/1334.
Good Samaritan Foundation, www.gsf-dc.org.
Goodwill of Greater Washington, www.dcgoodwill.org.
Greater Austin Chamber of Commerce. “2005 InterCity Visit: Performing Arts.” http://www.austinchamber.org.
The Social and Economic Value of Private and Community Foundations 37
Grens, Kerry. “An Economic Gamble: What Does Society Get for the Billions It Spends on Science?” The Scientist 20(7), 1 July 2007. http://www.thescientist.com/article/display/53302.
Higher Achievement Program, www.higherachievement.org.
Hoppe, Mary K. “Sound Investments: Spotlight on Pinellas County Environmental Foundation.” Bay Soundings. http://www.baysoundings.com/spring03/pcef.html.
Independent Sector. “Value of Volunteer Time.” http://www.independentsector.org/programs/research/volunteer_time.html.
International Alert, www.international-alert.org.
Isaacs, Julia B. “Cost-effective Investments in Children.” Brookings Institution: Budget Options Series, 2007. http://www.cbcse.org/media/download_gallery/California%20Dropout%20Study%20Report%202FINAL.pdf.
Jewish Social Services Agency, www.jssa.org.
Kalamazoo Historic Preservation. “Annual Report 2005.” http://www.kalamazoocity.org.
Kamer, Pearl M. “Placing an Economic Value on the Services of Public Libraries in Suffolk County, New York.” Long Island Association, June 2005. http://scls.suffolk.lib.ny.us/pdf/librarystudy.pdf.
Koenings, Jeff. “The Benefits from Sound Stewardship.” Washington Department of Fish and Wildlife, December 2002. http://wdfw.wa.gov/pubaffrs/benefits_stewardship.htm.
Lawrence, Steven, Algernon Austin, and Reina Mukai. “Foundation Growth and Giving Estimates: Current Outlook.” Foundation Center, 2007. http://foundationcenter.org/gainknowledge/research/pdf/fgge07.pdf.
Library Research Service. “Return on Investment for Colorado Public Libraries,” 2006. http://www.lrs.org/public/roi.
Literacy Volunteers of America, http://www.proliteracy.org.
Long, David A., and Jean M. Amendolia. “Promoting Employment for Homeless People: Final Cost-effectiveness Study,” 2003.
Louisiana Research Team. “Louisiana State Museum.” Prepared for the Louisiana Department of Culture, Recreation and Tourism. http://www.crt.state.la.us/impactreport/download/Museum.pdf.
Louisiana Research Team. “Louisiana State Parks.” Prepared for the Louisiana Department of Culture, Recreation and Tourism. http://www.crt.state.la.us/impactreport/download/State%20Parks.pdf..
Luce, Bryan, et. al. “The Return on Investment in Health Care: From 1980 to 2000.” Value in Health 9.3 (2006): 1096-3015. http://cat.inist.fr/?aModele=afficheN&cpsidt=17873832.
Lynch, Thomas, and Julie Harrington. “A Study of Taxpayer Return on Investments in Florida Public Libraries” Florida State University, Center for Economic Forecasting and Analysis, 2004. http://dlis.dos.state.fl.us/bld/roi/pdfs/flroipartiii.pdf.
Maine’s Public Universities, “Economic Impact on the State of Maine: The Connection between the University of Maine System and the State of Maine.” September 2007.
Manna Food Center. “White Paper on ‘Hunger: A Hidden but Prevent Problem in Montgomery County.’” www.mannafood.org/montgomery.
Marie Griffiths, Jose, Donald W. King, and Sarah E. Aerni, “Taxpayer Return on Investment in Pennsylvania Public Libraries.” UNC School of Information and Library Science, September 2006. http://www.statelibrary.state.pa.us/libraries/lib/libraries/paroireportfinal7.pdf.
Michigan Athletic Trainers Society. “About MATS.” http://www.matsonline.org/mc/page.do?sitePageId=26448.
Moore, Michael W. “Return on Investment for Correctional Education in Florida.” Florida Department of Corrections: Bureau of Data and Research Analysis, June 1999. http://www.dc.state.fl.us/pub/taxwatch.
Municipal Utility Project of California. “Project Overview: The Victoria Arbors ‘Greenfield’ Electrical Service Project.” http://www.ci.rancho-cucamonga.ca.us/pdf/ProjOverview.pdf.
National Fish and Wildlife Foundation. “Generating New Value for Conservation” http://www.ncdot.org/download/about/board/eppc/presentations/2005/NFWFNCDOT.pdf
National Wildlife Refu, http://news.mongabay.com/2007/1128-reserves.html.
Nelson, Noelle. “Are We There Yet? A Fourteen Year Analysis of Teen Pregnancy Data in Washington, DC – 1992-2005.” DC Campaign to Prevent Teen Pregnancy, October 2005. http://www.dccampaign.org/images/stories/publications/are_we_there_yet.pdf.

The Social and Economic Value of Private and Community Foundations38
Nonprofit Roundtable of Greater Washington, and World Bank Group. “Beyond Charity: Recognizing Return on Investment,” 2007. http://www.nonprofitroundtable.org/media/downloads/beyondcharity.pdf.
Northern Virginia Family Service. “Trickle Up: A Case Study on Community Benefits of Workforce Development.” http://www.nvfs.org/publications/trickleup.pdf.
Offender Aid and Restoration of Arlington, www.oaronline.org.
Office of Dakota County Attorney. “Comments of Dakota County Attorney James C. Backstrom Concerning a Recent Evaluation of the Social Return on Investment in Youth Intervention and Mentoring Program,” 2007. http://www.co.dakota.mn.us/NR/rdonlyres/00001458/pjkmiufshijlhydztlpozwsixobphfnu/WilderFoundation07.pdf.
Our Place DC, www.ourplacedc.org.
Patricia M. Sitar Center for the Arts, www.sitarartscenter.org.
PayScale, “Salary Survey Report for Job: Branch Manager, Banking.” http://www.payscale.com/research/US/Job=Branch_Manager,_Banking/Salary.
Pennsylvania Build Initiative. “Invest Now or Pay More Later: Early Childhood Education Promises Savings in Pennsylvania School Districts,” 2006. http://www.pde.state.pa.us/early_childhood/lib/early_childhood/BUILD_Report_III.Harvey.Feb061.pdf.
Piedmont Environmental Council, www.pecva.org.
Rikki, Abzug, and Joy K. Turnheim. “Bandwagon or bandaid? A model of nonprofit incorporation by state.” Nonprofit and Voluntary Sector Quarterly 27.3 (1998): 300-322.
Rutgers University. “The Economic Benefits to the Citizens of New Jersey,” 2004 http://oirap.rutgers.edu/reports/ecom_imp/EIPrintable04.pdf.
Salamon, Lester M. “The Nonprofit Sector in Comparative Perspective,” in Powell, Walter W., and Richard Steinberg. The nonprofit sector: A research handbook. New Haven, CT: Yale University Press, 2006.
Salamon, Lester M., and S. Wojciech Sokolowski. “Employment in America’s Charities: A Profile.” The Johns Hopkins Center for Civil Society Studies, 2006. http://www.jhu.edu/ccss/research/pdf/Employment%20in%20Americas%20Charities.pdf.
Santa Ana Workforce Investment Board. “Return on Investment for Universal Access Clients: A Special Demonstration Project PY 2003-2004,” 2004. http://www.santaanawib.com.
Sasha Bruce Youthwork, www.sashabruce.org.
Schakman, Bruce R., et al. “The Lifetime Cost of Current HIV Care in the United States.” Medical Care 44(11): 990-997, November 2006.
Scotsdale Cultural Council. “Part 5: Economic Activity Report.” Community Cultural Assessment, 2007. http://www.sccarts.org/documents/Economic%20Activity%20Analysis%20%20web.pdf.
Sidorov, Jaan, Peter Paulick, and Lila Sobel. “What is the Return on InvestmentAssociated with Diabetes Disease Management? A Report from One Managed Care Organization in Pennsylvania.” Wolters Kluwer Health 11.9 (2003): 565570. http://ideas.repec.org/a/wkh/dmhout/v11y2003i9p565-570.html.
Solidago Foundation, “Measuring the Impact on Community Organizing.” http://www.solidago.org/080429%20Short%20Report_Final_From%20Kathy%20Sharkey.pdf.
State of Vermont. “The Economic Value of Vermont’s Public Libraries, 2006-2007.” http://www.libraries.vermont.gov/sites/libraries/files/misc/plvalue06-07.pdf.
Stop Child Abuse Now of Northern Virginia, http://www.scanva.org.
Strom, Stephanie. “Tax Exemptions of Charities Face New Challenges.” New York Times, 26 May, 2008. http://www.nytimes.com/2008/05/26/us/26tax.html?_r=1&oref=slogin.
Surfrider Foundation. “State of the Beach.” http://www.surfrider.org/stateofthebeach/05-sr/state.asp?zone=GS&state=tx&cat=ba.
Tahirih Justice Center, www.tahirih.org.
Trust for America’s Health. “Prevention for a Healthier America: Investments in Disease Prevention Yield Significant Savings, Stronger Communities,” July 2008. http://healthyamericans.org/reports/prevention08/Prevention08.pdf.
United Fund for Arts and Humanities, http://www.ufah.org/campaign.html.

The Social and Economic Value of Private and Community Foundations 39
United States Congress, Joint Economic Committee. “The Benefits of Medical Research and the Role of the NIH,” May 2000. http://hsc.utoledo.edu/research/nih_research_benefits.pdf.
University of Massachusetts. “Economic Impact Methodology” http://www.massachusetts.edu/econimpact/methodology.html.
Urban Alliance Foundation, www.urbanalliancefoundation.org.
Utah Partners for Conservation and Development, http://www.blm.gov.
Washington Area Women’s Foundation. “A Portrait of Women and Girls in the Washington Metropolitan Area.” http://thewomensfoundation.org/images/PortraitFinal.pdf.
Washington Area Women’s Foundation. “Stepping Stones Reports 2005-2007.” http://thewomensfoundation.org/our-work/research.
Wisconsin Foundation for the Arts. “Legislative Council Committee on Arts Funding Presentation,” 21 September 2000. http://www.legis.state.wi.us/lc/committees/study/2000/ARTS/files/williams_testimony.pdf.
World Arts Focus and Joe’s Movement Emporium, www.joesmovement.org.
Wyoming Cultural Trust Fund. “Minutes from Board Meeting,” 22 February 2008. http://wyospcr.state.wy.us/CTF/WCTFFeb2008Minutes.pdf.
Young, Dennis R. “Complementary, Supplementary, or Adverbial? A theoretical and historical examination of nonprofit-government relations in the United States,” in Boris, Elizabeth and C. Eugene Steuerle. Nonprofits and Government Collaboration and Conflict. Washington, DC: Urban Institution Press, 2006.

The Social and Economic Value of Private and Community Foundations40
Robert J. shapiro is the chairman of Sonecon, LLC, a private firm that advises U.S. and foreign businesses, governments and nonprofit organizations. Dr. Shapiro has advised, among others, U.S. President Bill Clinton and British Prime Minister Tony Blair; private firms including Amgen, AT&T, Gilead Sciences, Google, MCI, Inc., SLM Corporation, Nordstjernan of Sweden, and Fujitsu of Japan; and nonprofit organizations including the American Public Transportation Association, the Education Finance Council, BIO, and the U.S. Chamber of Commerce. He is also a senior fellow of the Georgetown University Business School and the Progressive Policy Institute (PPI), chairman of the Globalization Initiative of NDN, co-chair of the Climate Task Force and American Task Force Argentina, and a director of the Ax:son-Johnson Foundation in Sweden. From 1997 to 2001, he was Under Secretary of Commerce for Economic Affairs, where he directed economic policy for the U.S. Commerce Department and oversaw the nation’s major statistical agencies. Prior to that, he was co-founder and Vice President of PPI. Dr. Shapiro also served as principal economic advisor in William Clinton’s 1991-1992 presidential campaign, senior economic advisor to Albert Gore, Jr. in 2000, Legislative Director for Senator Daniel P. Moynihan, and Associate Editor of U.S. News & World Report. In 2008, he advised the campaign of Barack Obama. He also has been a Fellow of Harvard University, the Brookings Institution, the National Bureau of Economic Research, and the Georgetown Business School. He holds a Ph.D. and M.A. from Harvard, as well as an A.B. from the University of Chicago and a M.Sc. from the London School of Economics and Political Science.
aparna Mathur is Research Fellow at the American Enterprise Institute, where she focuses on health care and health policy issues as well as tax policy. Dr. Mathur is also a noted scholar in international finance and econometrics, and an affiliate analyst for Sonecon, LLC. She also has been a consultant to the World Bank, a researcher at the Tata Energy Research Institute, and an instructor in economics at the University of Maryland. Dr. Mathur holds a Ph.D. and M.A. from the University of Maryland, as well as degrees from Hindu College and the Delhi School of Economics of Delhi University.
about the authorS