Embed Size (px)
Citation preview

8/2/2019 Community Economic Analysis
http://slidepdf.com/reader/full/community-economic-analysis 1/97
Community Economic Analysis:A H ow To Manual
ByRonald J. Hustedde
Ron Shafferand
Glen Pulver
1st Printing, November 1984Revised Edition, December 1993
This project was funded by the North Central Regional Center for RuralDevelopment and the University of Wisconsin-Extension, Madison,
Wisconsin.
Ronald J. Hustedde is an assistant extension professor in the sociologydepartment, College of Agriculture, University of Kentucky, Lexington,
Kentucky.
Ron Shaffer is a professor in the department of agricultural economics,University of Wisconsin-Extension, Madison, Wisconsin.
Glen Pulver is a professor emeritus in the department of agriculturaleconomics, University of Wisconsin-Extension, Madison, Wisconsin.

8/2/2019 Community Economic Analysis
http://slidepdf.com/reader/full/community-economic-analysis 2/97
December 1993Library of Congress Catalog Card Number: 93-86303ISBN 0-936913-06-1
RRD 141 is available from:
North Central Regional Center for Rural Development404 East H allIowa State UniversityAmes, IA 50011
(515) 294-8321(515) 294-2303 fax [email protected]
Printed by Iowa State University Printing Services
This material is based upon work supported by the Extension Service, U.S.Department of Agriculture, under special project number 93-ERRD-1-8505.
ii

8/2/2019 Community Economic Analysis
http://slidepdf.com/reader/full/community-economic-analysis 3/97
Table of Contents
Preface . . . . . . . . . . . . . . . . . . . . . . . . . . . . . . . . . . . . . . . . . . . . . . . . . . . . vWhy a Community Economic Analysis Manual? . . . . . . . . . . . . . . . . . . . 1N onlocal Markets Linkage . . . . . . . . . . . . . . . . . . . . . . . . . . . . . . . . . . . . . 5Strategies for Economic Development . . . . . . . . . . . . . . . . . . . . . . . . . . . . 6Multipliers . . . . . . . . . . . . . . . . . . . . . . . . . . . . . . . . . . . . . . . . . . . . . . . . . 8
Employment Multipliers . . . . . . . . . . . . . . . . . . . . . . . . . . . . . . . . . . . 8Income Multipliers . . . . . . . . . . . . . . . . . . . . . . . . . . . . . . . . . . . . . . 11Turnover . . . . . . . . . . . . . . . . . . . . . . . . . . . . . . . . . . . . . . . . . . . . . . 13Multiplier Influences . . . . . . . . . . . . . . . . . . . . . . . . . . . . . . . . . . . . . 14
Assessing the Size and Shape of a Community's Trade Area . . . . . . . . . . . . . . . . . . . . . . . . . . . . . . . . . . . 15
Reilly's Law . . . . . . . . . . . . . . . . . . . . . . . . . . . . . . . . . . . . . . . . . . . . 16Trade Area Capture . . . . . . . . . . . . . . . . . . . . . . . . . . . . . . . . . . . . . . 20Pull Factors . . . . . . . . . . . . . . . . . . . . . . . . . . . . . . . . . . . . . . . . . . . . 21
Keeping Local Dollars in the Community . . . . . . . . . . . . . . . . . . . . . . . . 23Trade (Sales) Potential . . . . . . . . . . . . . . . . . . . . . . . . . . . . . . . . . . . . 24Location Q uotients . . . . . . . . . . . . . . . . . . . . . . . . . . . . . . . . . . . . . . 25Population—Employment Ratios . . . . . . . . . . . . . . . . . . . . . . . . . . . 28
Measuring the Efficiency of Local Firms . . . . . . . . . . . . . . . . . . . . . . . . . 30Shift Share Analysis . . . . . . . . . . . . . . . . . . . . . . . . . . . . . . . . . . . . . . 31N ational Growth Component . . . . . . . . . . . . . . . . . . . . . . . . . . . . . 31Industrial Mix Component . . . . . . . . . . . . . . . . . . . . . . . . . . . . . . . . 31Competitive Share Component . . . . . . . . . . . . . . . . . . . . . . . . . . . . 32Improving Efficiency . . . . . . . . . . . . . . . . . . . . . . . . . . . . . . . . . . . . 34
O ther Strategies . . . . . . . . . . . . . . . . . . . . . . . . . . . . . . . . . . . . . . . . . . . . 34Stimulating N ew Firm Creation . . . . . . . . . . . . . . . . . . . . . . . . . . . . 34Increased Aids From Government Units . . . . . . . . . . . . . . . . . . . . . 34
iii

8/2/2019 Community Economic Analysis
http://slidepdf.com/reader/full/community-economic-analysis 4/97
Appendix . . . . . . . . . . . . . . . . . . . . . . . . . . . . . . . . . . . . . . . . . . . . . . . . . 37Reilly' s Law . . . . . . . . . . . . . . . . . . . . . . . . . . . . . . . . . . . . . . . . . . . . 39Trade Area Capture . . . . . . . . . . . . . . . . . . . . . . . . . . . . . . . . . . . . . . 41Pull Factor . . . . . . . . . . . . . . . . . . . . . . . . . . . . . . . . . . . . . . . . . . . . . 43Potential Sales . . . . . . . . . . . . . . . . . . . . . . . . . . . . . . . . . . . . . . . . . . 44Location Q uotient . . . . . . . . . . . . . . . . . . . . . . . . . . . . . . . . . . . . . . 45Population Employment Ratio . . . . . . . . . . . . . . . . . . . . . . . . . . . . . 47Shift-Share . . . . . . . . . . . . . . . . . . . . . . . . . . . . . . . . . . . . . . . . . . . . . 48
N ational Growth Component . . . . . . . . . . . . . . . . . . . . . . . . . . 48Industrial Mix Component . . . . . . . . . . . . . . . . . . . . . . . . . . . . 50Competitive Share Component . . . . . . . . . . . . . . . . . . . . . . . . . 51
Employment Multiplier . . . . . . . . . . . . . . . . . . . . . . . . . . . . . . . . . . 52Income Multiplier . . . . . . . . . . . . . . . . . . . . . . . . . . . . . . . . . . . . . . . 54
Bibliography . . . . . . . . . . . . . . . . . . . . . . . . . . . . . . . . . . . . . . . . . . . . . . . 57Index . . . . . . . . . . . . . . . . . . . . . . . . . . . . . . . . . . . . . . . . . . . . . . . . . . . . . 62
Figures
Figure 1 - The Community Economy Simplified . . . . . . . . . . . . . . . . . . . 2Figure 2 - Multipliers and T urnovers . . . . . . . . . . . . . . . . . . . . . . . . . . . . 14Figure 3 - Example Trade Area . . . . . . . . . . . . . . . . . . . . . . . . . . . . . . . . 18
Tables
Table 1 - Estimat ing Trade Area Population . . . . . . . . . . . . . . . . . . . . . . 19Table 2 - Example Trade Area Capture And
Pull Factor Analysis . . . . . . . . . . . . . . . . . . . . . . . . . . . . . . . . . 22
iv

8/2/2019 Community Economic Analysis
http://slidepdf.com/reader/full/community-economic-analysis 5/97
Preface
This manual is intended for the individual interested in the analysis of a community' s economy. It is not designed for direct use in citizens'meetings. Rather the publication is designed to assist individuals who needto bring information to a group of citizens or decision makers concernedwith the economic future of a community.
We encourage the user to first read the document completely. Themanual poses a series of questions that might occur to someone who ispreparing to share information with a group of people, or to someone whois just starting to build an understanding of community economic analysis.This publication contains analytical tools that are usually found indisparate sources. Our purpose is to demonstrate the need to integratedifferent forms of analysis. H owever, this publication is not acomprehensive report of community economic analysis tools and thereader is encouraged to pursue further understanding through the readingsin the bibliography.
After reading the entire manual, the table of contents and the index canbe used to locate specific items that are of particular interest.
v

8/2/2019 Community Economic Analysis
http://slidepdf.com/reader/full/community-economic-analysis 6/97

8/2/2019 Community Economic Analysis
http://slidepdf.com/reader/full/community-economic-analysis 7/97
Why a Community Economic
Analysis Manual?Recent swings in the national economy have heightened the interest of
individuals and businesses about economic conditions in their communities andwhat might be done about them. A community 's economy lends itself toanalysis similar to that of households and businesses. While the specific forms of this analysis may not be widely known, it still raises the same questions. Whatare the current economic conditions in the community? What components of the community have been growing or what components have been declining?What are the community' s options for improving its economic future and whichof those options should be pursued first?
Numerous tools and techniques can be used to give some insight to thefunctioning of a community's economy. This insight is part of the earlypreparation necessary before the community can initiate an effective strategy forchange. The following considerations must be an important part of anycommunity economic analysis:
First, no single number generated by the analysis provides the answer to allof a community's concerns. For instance, when a firm experiences anincrease in profits, it is still unknown whether the increase is caused bygreater sales or more cost efficient production. Each of those sourcessuggests a different strategy by the owner.
Second, it is important to make comparisons among communities becausethe numbers used are not absolute. Again, just as any owner of a firm wouldcompare his/ her success against the industry average or similar firms, it isimportant for communities to make similar comparisons. Thesecomparisons need to be among similar communities to increase their
legitimacy.
Third, it is important to compare changes over time to sense the directionof community change. This comparison helps to confirm or denyperceptions of current and recent conditions.
1

8/2/2019 Community Economic Analysis
http://slidepdf.com/reader/full/community-economic-analysis 8/97
Fourth, it is crucial to use a variety of information sources. The stepsoutlined in this publication indicate that "hard data" collected from variousagencies is a starting point. It is also important for the analyst toincorporate the insights that local citizens have about their community andits economy. If there are differences, then both sets of information need tobe challenged to determine which more accurately reflects currentconditions.
The following pages outline, through a series of questions, some elementalsteps that might be undertaken by a community examining its economy and itseconomic future. An appendix describes how to calculate the specific tools alongwith needed data and interpretation. Readers are referred to the bibliography foradditional readings and r esource material.
Perhaps one way to think of community economic analysis is to imaginethe community' s economy as a barrel with money and goods flowing into thetop as well as spilling out (see Figure 1). The barrel analogy represents a number
of key concepts. First, the community is intimately linked with the rest of theworld through the inflow and outflow of income and goods. Second, thecommunity uses resources to produce the output it sells. These resources can beavailable locally or purchased elsewhere. Third, the size of the barrel isdetermined essentially by the inflow of outside income, the lack of leakage of income, and the volume of resources used to produce the community' s output.
Figure 1. The Community Economy Simplified
2

8/2/2019 Community Economic Analysis
http://slidepdf.com/reader/full/community-economic-analysis 9/97
Community economic analysis is a systematic examination of thecomponents of this barrel. This examination is concerned with the forces of demand and supply and their institut ional environment . Th is can be tr anslatedinto some elemental questions: What are the linkages with the rest of the world?What are some ways to increase the potential inflow of income? How can thecommunity better use its existing resources and businesses to produce moreoutput and associated jobs and income? How can the community reduce the lossof resources to improve its local income situation?
1. W hy should a community try to change its local economy? Can't the local
economy take care of itself?
Most communities are not completely satisfied with their local economy.Some want more job opportunities or income growth for all their citizens or forspecific groups such as women, minorities or youth . O ther communities wantmanageable economic growth so they can carefully plan their sewers, streets,schools and other parts of the local infrastructure. Some communities are
concerned primarily with their environment and quality of life and wanteconomic growth to reflect those concerns. Other communities are faced witheconomic decline and wish to alter the current trend.
Few communities choose to remain completely passive. For example, mosthave chambers of commerce, economic development commissions, zoning laws,or community-owned industrial parks. They may use promotional efforts,government grants and various financing tools to influence economic change.Community economic analysis is a way to link and focus those efforts.
2. Exactly w hat is meant by community economic analysis?
There is nothing particularly unique about community economic analysis.It is simply an examination of how a community functions economically. It issimilar to how a business examines new products, new markets or new ways tomake or distribute existing products. A community can do the same type of analysis for the goods and services it provides. H owever, the products aresatisfactory jobs and income for current and future residents of the community.
3. How can community economic analysis help a community do something
about its job and income situation?
That is the central purpose of community economic analysis. Whilecommunity economic analysis does not provide solutions to the problem, itprovides useful information for decision-making. It uses analytical tools toanswer some of the questions a community needs to ask, as it attempts to alterits job and income situation.
3

8/2/2019 Community Economic Analysis
http://slidepdf.com/reader/full/community-economic-analysis 10/97
4. W hat type of questions?
The questions vary, but some examples include: What is the major source of local income growth? What types of commercial activities might be possible?What changes have been occurr ing in the trade area?
5. Y ou mentioned income and employment change. Does that m ean the
comm unity needs to hav e that type of information available?
That is correct. While information is not always readily available, it is oftencollected by a variety of state and federal agencies. This means checking with theappropriate agency in your state or locale. Comprehensive information withspecific application to the question at hand is always desired, but highlyunlikely.
6. W ho might prov ide the necessary information?
The county extension office, planning office (regional, county or city) andlocal public library (larger cities) often have this information available in theirreference section. State agencies are major collectors of this data. They collect itfor administrative purposes, such as unemployment insurance, sales taxinformation, etc. Appropriate information can often be acquired from a StateData Center. The Census of Business (retail trade, selected services andmanufacturing) along with County Business Patterns are prime data sources. Thebook, A Comm unity Researcher's Guide to Rural Data by Priscilla Salant (IslandPress, 1990), contains some useful information about where to locate datasources at the state and federal level.
7. W hat type of information will be needed?
The type of information needed will depend on the particular questionsbeing asked plus the amount of time the community wishes to devote tocollecting data. Generally, a minimum of thr ee types of data are needed:employment, income by source and amount, and sales by economic sector.
8. W hat do you mean by economic sector?
Typically, data is collected by economic sector (e.g., farming, durablemanufacturing, retail trade). Thus, it can be categorized by the major outputproduced. The classification scheme most often used is the Standard Industr ialClassification (SIC) code. It is a way of categorizing economic activity intoeconomic sectors.
One of the more elementary forms of analysis is to compare thedistribut ion of employment in the community in various sectors with state ornational averages. This comparison becomes an initial mechanism fordetermining how different or similar the local economy
4

8/2/2019 Community Economic Analysis
http://slidepdf.com/reader/full/community-economic-analysis 11/97
is with some "standard." A slight ly different version of this form of analysis isto compare income by type (e.g., wages and salaries, transfers) or source (e.g.,agriculture, manufacturing, government). Again, this provides a means of identifying significant sources of income. This begins to give some insight tohow dependent the community is on certain economic sectors for employmentor income.
9. W hat are some of the questions community economic analysis addresses?
The questions vary by community and there is no standard list. Thishandbook presents tools to help provide answers to the following:
What businesses are linked to outside/ nonlocal markets?H ow will a change in these businesses affect the rest of the local economy?What is the geographic area community merchants might expect to sell to?What are the potential retail and service sales for the community?How effective has the community been in attracting and keeping retail and
service sales?H ave recent employment changes in the community been due to nationaleconomic conditions, the type of local businesses or the efficiency of localbusinesses?
10. How do these questions relate to community economic analysis?
A community can be perceived as responding to two sets of marketforces—local and nonlocal. Community economic analysis is largely an analysisof how the community r esponds to these forces. The community' s linkage tononlocal markets and how that is translated back into the community is a majorsource of economic change for the community. An equally important force is
how the community serves and uses the local market to create jobs and income.
N onlocal Markets Linkage11. How are communities link ed to nonlocal markets?
They are linked through the sales of both goods and services to nonlocalconsumers or by the attraction of consumers to the community. They also arelinked through the purchases of both goods and services from outside thecommunity.
12. A community's economy is complex. How can one start to make sense out of
it?
Business leaders and others involved in community economic developmenthave often explained the complexity of the local economy
5

8/2/2019 Community Economic Analysis
http://slidepdf.com/reader/full/community-economic-analysis 12/97
by dividing it into two parts. One part att racts money into the commu-nityfrom the outside (i.e., nonlocal markets). The other part uses the money once itis in the community (i.e., local markets).
13. W hat do you mean "attracts money"?
Income enters the community from manufacturing, mining and agriculture,as well as tourism, un iversities and technical schools, insurance companies,hospitals, and transportation selling their output to nonlocal customers. Acommunity can sell goods and services (e.g., manufactured goods or insurancecoverage) to nonlocal markets to be used elsewhere. Or the nonlocal consumercan come to the community for consumption as illustrated by tourism or healthcare. In any case, the money is generated from outside the community'sboundaries. The businesses that bring money into the community are oftenreferred to as the basic or export sector.
14. W hat happens to that money once it is in the community? Should we be
concerned how it is used?
The community should definitely be concerned with how money is usedonce it is attracted to the community. There are really two possible uses. First,the local economy must offer consumers a chance to spend their money locally.If not, the income flows out, which is the second consideration. Income flowsout of the community in various ways. For example, when a local householdpurchases goods and services outside the local community, money leaks out of the local economy. When a local firm buys from a supplier outside thecommunity, those dollars also flow out of the community. As a result of thatleakage, potential income and jobs in the community are lost.
15. It was mentioned that export firm s bring in income. A re all businessesexporters?
No. Many are referred to as non-export because they do not att ract thelargest por tion of their sales from outside. N on-export businesses serve the needsof local consumers and firms. The community needs to identify export and non-export sectors, not because one is more or less important than the other, butbecause they respond to different economic forces (i.e., local versus nonlocalforces).
Strategies for EconomicDevelopment16. Traditionally many communities have focused their efforts to build export
links by attracting manufacturing firms. Are there other opportunities for
job and income dev elopment?
6

8/2/2019 Community Economic Analysis
http://slidepdf.com/reader/full/community-economic-analysis 13/97
The traditional response of communities has been to build industrial parksto lure manufacturers to their municipality. H owever, the many vacantindustrial parks scattered throughout the country are poignant reminders thatrural communities should also look at other possibilities for economic growth.For example, computer services, insurance, health care, tourism and service-related businesses are grow-ing faster than manufactur ing. Job and incomegrowth is also generated through Social Security and pension benefits, foodstamp programs, and other sorts of government aid. These are mechanisms toincrease the flow of income into the community (e.g., inflow to the barrel).Establishing new businesses also plays a significant role in new job formation.Improving the efficiency of existing firms is another important avenue.Communities cannot afford to overlook any of these opportunities.
17. Does this mean that m anufacturing is no longer a viable av enue to
community economic development?
Most communities interested in increasing their income and employment
should continue recruiting manufacturing firms to their area. However,communities must look to other avenues for economic development as well if they want to increase their chances for job and income expansion. First, theyneed to expand their definition of the basic sector to include more than justmanufacturing. Second, a frequent shortcoming of many community economicdevelopment programs is the emphasis on export businesses and the failure touse other avenues for economic development that may be more successful andefficient.
18. W hat are these other economic development alternatives?
O ne way to determine if a community has thought through all of its
alternatives is to see if it is actively pursuing each of the following five generalstrategies:
Att racting new basic or export employers.Capturing existing markets.Encouraging the start-up of new firms.H elping existing firms become more efficient.Using aids and programs from broader levels of government.
There is nothing sacrosanct about these five, and you may wish to generateyour own list. The critical point is that t raditional community economicdevelopment efforts have too often been limited to attracting new exportemployers.
19. Y ou mention fiv e strategies for community economic development. A re
there tools or techniques that can help m e determine which of those
strategies is most appropriate?
Not really. The tools reviewed in this manual can be used to provide someguidance about which strategy and what components of
7

8/2/2019 Community Economic Analysis
http://slidepdf.com/reader/full/community-economic-analysis 14/97
that strategy might be most appropriate. But there is no one-to-one match of tool and strategy. One needs to keep the strategies in mind when interpretingthe information gained from the tools. Then you can use that information tohelp reach a decision about a given strategy.
Multipliers20. W hat is so significant about attracting a new export employer?
The significance of new export employers is that generally they are able to
create more jobs and income in the community than are found at the site of the
new export employer. Fur thermore, they tend to be a highly visible source of
employment change.
21. Is that the multiplier process that is so well known?
Yes it is. But the multiplier is probably over-rated and overused incommunity economic analysis.22. W hat do you mean?
The multiplier essentially assumes that once an export employer locates or
expands in the community the multiplier effect will occur automatically and the
effect will be local. This is not accurate. Furthermore, most estimates of the
mult iplier exceed the reality of the change.
23. Just what is a multiplier?
The multiplier arises from the linkages and interaction of the export sector
(water pouring in the top of our barrel—dollars entering the community) and
the other businesses and households in the community. If there are no linkages
(e.g., local purchases of labor , suppliers, materials), then there can be no
mult iplier effect.
24. Y ou indicate there are different types of link ages.
Yes. These linkages can occur through the hiring of workers, the disbursing
of a payroll, the purchase of inputs and supplies, or consumption by households.
25. Does that m ean there are different types of multipliers?
Yes there are. Let's examine employment multipliers first. An employment
multiplier is a simple expression of the relationship between the number of
workers in export businesses and the total employment in the community.
26. How is that done?
A ratio is formed of total employment divided by export employment and8

8/2/2019 Community Economic Analysis
http://slidepdf.com/reader/full/community-economic-analysis 15/97
this gives the multiplier estimate:

8/2/2019 Community Economic Analysis
http://slidepdf.com/reader/full/community-economic-analysis 16/97
Total Employment in CommunityEmployment Multiplier
Export Employment in Community
This is known as the average employment multiplier.
27. W hat do you mean average employment multiplier?
It represents an average in two senses. First, it estimates the average of all
the different types of businesses in the export sector. Any one of those
businesses may have a multiplier larger or smaller than the estimate. The export
multiplier is a "quick and dirty" way to estimate multipliers. If you wanted a
mult iplier for a specific sector of the local economy, you would have to use
input-output analysis, which will not be discussed in this manual because it
requires a substantial amount of data and computer capacity.
Second, the multiplier estimated above represents an average because itmeasures the relationship between the export base and the total economy at one
point in time rather than the change in employment over t ime as would be the
case if the export sector increased or declined. The mult ipliers estimated from
changes in employment are often labeled marginal employment multipliers.
28. How is the marginal employment multiplier calculated?
The easiest way to calculate the marginal employment multiplier is to use
this ratio:
Change in Total EmploymentMarginal Employment MultiplierChange in Export Employment
29. W hich is the better estim ate?
Again, it depends on what you wish to do with the estimate. The marginal
mult iplier is preferred, but in most cases, the average multiplier is sufficientlyaccurate.
30. How can the export sector in the denominator be identified?
The export sector is the businesses that sell their product to nonlocal
markets. One way to identify them is by observation. That is fairly easy in small
communities, but is subject to a lot of error.
31. Error in what sense?
10

8/2/2019 Community Economic Analysis
http://slidepdf.com/reader/full/community-economic-analysis 17/97
The classic problem is that all the workers at any given business are seldom
engaged in production for nonlocal markets only. Some are producing for local
markets. The question becomes how can the workers be allocated to the proper
market they are serving.

8/2/2019 Community Economic Analysis
http://slidepdf.com/reader/full/community-economic-analysis 18/97
32. W hy is that so important?
Let's take a simple example. We have a community with a total
employment of 350 jobs. Export employment could vary depending on whether
all or just part of the workers in some businesses are counted as serving a
non local market. T he significance is how this difference affects the mult iplierestimate:
TotalMultiplier
Export
In our example, if 100 jobs
are in the export sector, the multiplier is 3.5, but if 175 jobs are in the export
sector the multiplier is 2.0.
33. How can the export sector be estimated to capture only the nonlocal m arket
workers?
Location quotients can be used to distinguish the proportion of a business's
workforce serving local or nonlocal markets. (Location quotients are explained
more fully on pages 25-28).
34. How about a simple example of how this is done?
To determine the export employment for any business or sector the
following formula can be used:
1Percent Export 1 x 100%LQ
This formula is
used only for those businesses or sectors that have a location quotient greater
than one (1). To determine the number of export employees in the community
the total employment of each business or sector is multiplied by the appropriate
percentage and summed over all sectors.
Let's say the community has three sectors and their location quotients are as
indicated. The export employment would total 55.
Sector EmploymentTotal
QuotientLocation Percent Export
EmploymentExport
A 50 2.00 50 25
B 5 .75 0 0
C 40 4.00 75 30
TOTAL 95 55
12

8/2/2019 Community Economic Analysis
http://slidepdf.com/reader/full/community-economic-analysis 19/97
95Employment Multiplier 1.73
55
35. If the export
sector includes businesses that bring income into the community then i t
could include more than just the traditional export activ ities such as
farming and manufacturing?
Correct. For the most part, the location quotient approach allows you to
identify most of the "non-traditional" export activities.
36. W hat do you mean by m ost of the non-traditional activ ities?
A very definite export activity in many communities is the income received
by retirees through their social security, medicare, private retirement programs,
etc. These also need to be included.
37. How?
It is actually a lot easier than you might expect. You simply add the number
of social security recipients in the community to the export employment
estimated using the location quotient approach. Because the social security
recipients represent a "pure" inflow of funds to the community, they can all be
counted as part of the export sector.
So in our previous example, if our community had eight social security
recipients, they would be added to the 55 export based employees to give a new
export base of 63. Since they are not actually employees they should not be
added to total employment. The new multiplier would be:
951.51
63
38. That sounds easy enough.
It is, but then again employment multipliers are easier to estimate than
income multipliers.
39. W hat do you mean?
While the same relationship between the export sector and the total
economy holds, the estimation of the export sector income is more difficult.
40. How is an income multiplier calculated?
It is determined by using the formula:
13

8/2/2019 Community Economic Analysis
http://slidepdf.com/reader/full/community-economic-analysis 20/97

8/2/2019 Community Economic Analysis
http://slidepdf.com/reader/full/community-economic-analysis 21/97
1Local Income Multiplier
1 MPCL
x PSY
The
marginal propensity to consume locally (MPC ) represents the proportion of L
total income people spend locally. One can make a crude estimate of the MPCL
by asking "What proportion of people's incomes is likely to be spent locally?" If
it is high, one would use an MPC such as .60 to .80. On the other hand, if aL
community is small and most goods and services are purchased elsewhere, the
MPC might be as low as .20. This varies by community. The MPC typicallyL L
ranges from .20 to .70. The most common values range from .30 to .60.
41. W hat reduces the MPC ? L
The MPC is reduced by 1) in-commuters spending their wages where theyL
live—not where they work, 2) the portion of workers' pay-checks withheld fortaxes and fringe benefits—ranging from 15 percent to 30 percent of payroll, and
3) local residents spending some of their wages in neighboring communities or
larger r egional shopping centers.
42. W hat does PSY represent?
PSY is the percentage of money spent locally that becomes local income.
Local income is local wages, salaries, profits and interest. The PSY will t ypically
range from .25 to .75. This variable measures how much local labor, interest and
profit is involved in the final price of the product. For local fast food restaurants
it may be high, while for auto sales it may be quite low.
43. How can MPC and PSY affect the multiplier? L
An example might help demonstrate their affect. If the MPC is high (e.g.,L
.8) and the PSY is high (e.g., .75) the multiplier will be larger.
12.5
1 .8 x .75
This multiplier is more likely in a larger community (50,000 people or more)
than in a smaller community. The other extreme occurs when most of a
community's income is spent elsewhere (low MPC ), and little of the localL
spending becomes local income (low PSY). In this case let MPC equal .2 andL
PSY equal .25. H ere the mult iplier becomes:
11.05
1 .2 x .25
The total change in
community income is only slightly larger than the gross payroll of the business.15

8/2/2019 Community Economic Analysis
http://slidepdf.com/reader/full/community-economic-analysis 22/97
44. Are there other types of multipliers?
Yes. There are sales or output multipliers, solid waste or environmental
discharge mult ipliers, etc. Essentially, if you can estimate a ratio of changes in
output and the item of concern, you can create a mult iplier.
45. I hav e heard of a turnover ratio. Is that a multiplier?
It is a form of sales or output multiplier, but it is not a true multiplier.
46. W hat is turnover?
Turnover is the number of times a dollar changes hands in the community.
It does not represent an economic linkage, which is critical to multiplier
analysis. In Figure 2, the turnover is five, but only one cent is still in the
community for that fifth turnover. The multiplier is only 1.66 in th is example.
47. I am still not sure I understand w hat you are saying?
Let's say a community is able to expand one of its export businesses. How
will a one dollar change in output by that particular business affect other sectors
of the local economy? Let's look at the original dollar coming into the
community. Say 60 cents of that dollar flows out of the community through
nonlocal taxes, equipment pur-chases and other items. So 40 cents remains for
local wages, taxes, raw materials and rent. O f the 40 cents that is spent locally,
only 16 cents remain in the community (again a 60 percent leakage). Of the 16
cents respent locally only six cents remain, and when that is respent only threecents remain, and finally less than one cent. At this point, it is hard to measure
further effects. This example illustrates that the economic impacts resulting from
a one dollar change in export activity leads to a change of $1.66 in the local
economy. The multiplier here is 1.66. Figure 2 depicts this process.
48. W hy is this distinction important?
It becomes important for planning. If you are merchant planning an
expansion because of a new export employer, you need to use 1.66 rather than 5,
in our example, or you will overexpand.
49. Is it easy to misuse multip liers?
Yes! Some people have viewed the employment and income multi-plier as
the same thing. It should be stressed they are different even though they have
similar values. So you cannot use one for the other. It should also be mentioned
that no matter how one estimates the multiplier, it tends to be inflated.
16

8/2/2019 Community Economic Analysis
http://slidepdf.com/reader/full/community-economic-analysis 23/97
Figure 2. Multipliers and Turnover
50. W hat do you mean?
Multipliers presume there will be no change in the local economy without a
change in the export sector. Th is fails to capture the possible changes in MPCL
and PSY that may occur. (See later discussion about transferring multipliers.)
Furthermore, it takes time for the multiplier to become fully implemented.
Other changes will often dampen its effect.
51. W hat can a comm unity learn from a multiplier?
The community can use the multiplier to estimate the total effect of a
development event before it happens. Such estimates will help the community
prepare for the event.
52. Can a community apply a multiplier from a similar locale to its situation?
It is important to note that the multiplier is not automatically transferrablefrom one place or period to another. Some of the conditions that influence the
size of a community's multiplier are:
Population: The value of a multiplier varies with the population. Smaller
communities, for example, have smaller multipliers because they cannot
profitably produce or sell (insufficient market) all the goods and services
needed locally to capture consumer spending (i.e., a lower marginal
propensity to consume locally [MPC ]).L
17

8/2/2019 Community Economic Analysis
http://slidepdf.com/reader/full/community-economic-analysis 24/97
Geographic Size of th e Comm un ity: The larger the geographic area
considered, the greater the ability of the area to supply and consume the
goods and services desired (i.e., higher MPC ).L

8/2/2019 Community Economic Analysis
http://slidepdf.com/reader/full/community-economic-analysis 25/97
Transportation Networks: Easy access to competing nonlocal sources of
goods and services will reduce the local multiplier.
Income Changes: The multiplier is not likely to remain constant as
community income changes. If a new economic activity leads to population
changes by attracting more workers to the community, local consumptionis likely to increase because new stores will appear. O r if the activity leads
to more income per person but little population change, local people may
purchase more nonlocal goods, their taxes increase and they may increase
their savings, which leads to a lower multiplier.
Economic Specialization: A highly specialized economy, such as isolated
mining towns that are less able to meet the needs of local households, will
find consumers making periodic nonlocal shop-ping trips or using mail
order catalogues. These reduce the local mult iplier.
Time: Multipliers change over time. Let' s say a firm moves into a
community. At first it may depend on its former non local suppliers.
However, as time progresses it may switch to local suppliers. New support
businesses may also eventually emerge to capture local dollars. It takes time
for the multiplier effects to occur. First, local merchants may need to
change merchandise lines and/ or expand to meet new demands. Second, it
requires time before individual merchants perceive and react to the changes
in their market.
53. Suppose a community determines it wants to attract a certain kind of
industry. W hat steps can it tak e to attract new export employers?
Community leaders have encouraged the location of export indus-tries to
their locale by establishing industr ial parks, offering attractive financial
packages, extending utility lines, providing supportive services such as excellent
schools and health care facilities, and similar activities.
Assessing the Size and Shape of
a Community's Trade Area54. W hat is most important in the creation of local jobs and income— the
dollars that flow into the community from the outside or the money already
in the local economy?
Both are equally important. To understand why this is true, let's return to
the barrel analogy of the local economy. It is important to keep dollars
circulating in the community in order to generate local jobs and income. If the
barrel is like a sieve, the economic activity pour ing in will have little effect.19

8/2/2019 Community Economic Analysis
http://slidepdf.com/reader/full/community-economic-analysis 26/97
Those outside dollars leak out if the holes in the sieve are not plugged. Once the
dollars leak out, t hey do the

8/2/2019 Community Economic Analysis
http://slidepdf.com/reader/full/community-economic-analysis 27/97
community economy litt le good. Retailers, service businesses and suppliers that
sell to local citizens and firms help keep dollars circulating locally. Those
businesses also supply jobs and income to the community. The important point
is the community needs to pursue both avenues in its development effort
because neither can exist without the other.
55. Let' s look at retail and serv ice businesses. It is obvious a community sells to
people w ho do not liv e within the municipal boundaries, such as farmers
and people from nearby areas. How can a village or city determine from
how far it attracts people?
This really starts to ask what is the community's trade area. A trade area is
the geographic area from which the community draws the majority of its retail
trade customers. It usually extends beyond the municipal boundaries. The
general criteria is that the majority of trade area residents shop in the
community.
56. How can a comm unity estimate the size and shape of its trade area?
One way is to determine how far the subscribers of the local newspaper
reside from the community, because newspaper advertising is often important in
people's shopping decisions. Another approach is to conduct an areawide survey
of shopping habits (i.e., where people shop and what they purchase). This can be
used to develop a map of the tr ade area. A simple approach is known as Reilly' s
Law of Retail Gravitation.
57. W hat is Reilly's Law?
Reilly's Law can help a community determine its retail trade boundaries. It
is appropriate for shopping goods (furniture, medical services and automobiles,
etc.), which are the goods and services bought after comparing price, quality and
style. It is less appropriate for convenience goods (groceries, gasoline, etc.),
which are bought with a minimum amount of comparison. But remember,
shoppers come to town for a variety of reasons and often while they are there
they will also buy convenience goods.
58. Let me repeat the question, w hat does Reilly's Law really tell us?
Reilly's Law gives an estimate of the maximum distance customers travel to
shop in a certain community. It can be used by the chamber of commerce or
merchant group in a city to find out how far their trade area extends toward a
neighboring city. Reilly' s Law argues people are attracted to bigger places to do
their shopping, but the time and distance they must travel influences their
willingness to shop there.
21

8/2/2019 Community Economic Analysis
http://slidepdf.com/reader/full/community-economic-analysis 28/97
59. W hat information is needed to use Reilly's Law?
To use Reilly's Law, data is required on: 1) the population of City X and
City Y and 2) the road distance between the two places being compared.
60. How do we use this information?
Suppose City X has a population of 8,000 and City Y has a population of
6,000. The road distance between the two municipalities is 20 miles. Reilly' s
Law is represented by this formula:
Distance from Distance Between City X and City YSmaller Community (Y)
Population of Larger Community (X)1
Population of Smaller Community (Y)
If we plug the example numbers into the formula:
20 20 20 209.28milesfromCityY.
1 1.155 2.1551 1.3338,0001
6,000
This means the retail trade area of City Y extends 9.28 miles from City Y
towards City X. The result indicates the distance from the smaller community.
Consumers who live more than 9.28 miles from City Y are assumed to shop in
City X rather than in City Y.
61. How can Reilly 's Law be used to draw a trade area?
To use Reilly's Law to outline a trade area requires computing the formula
for each nearby community that is competing with the community. Then
connect the points dividing the travel distance between communities and create
a map (circle) of the retail trade area. When drawing the map, un ique barriers to
travel, such as rivers without bridges or major highways that divert traffic,
should be considered or the map will be distor ted. Another distortion could be
institutional in nature, such as school district boundaries or county lines. If such
distortions exist, the analyst needs to modify the results of Reilly's Law.
62. A fter the retail trade area map is draw n, w hat does the community do with
it?
The next step is to use census data to gain further insight about the
population, income level, age and other demographic data in the area. These
figures are available in the census of population for each township, village and
city located with in the tr ade area. These figures can be used to estimate the
market potential for the community. 22

8/2/2019 Community Economic Analysis
http://slidepdf.com/reader/full/community-economic-analysis 29/97
63. W hat if our trade area includes only a portion of nearby municipalities?
It is common for a trade area to include portions of some municipalities. If
half a township is located within the trade area, count half of that population
and income. Remember, we are only generating an estimate of the true trade
area and its characteristics.
64. This approach sounds somewhat arbitrary.
Perhaps it does, but it really is not. Remember, you have identified the
distance people are willing to travel to shop in this community recognizing the
physical barriers impeding the flow of traffic. The other portion of the
arbitrariness in the estimate is computing the number of people in the trade area.
This again is subject to some interpretation and difference of opinion. It is
important to remember the purpose is not to provide a precise estimate as much
as it is to provide a reasonable estimate of trade area population to be used with
other bits of information.
65. I'm not sure I understand what you mean.
Let's take an example. Let Community Y have a trade area that extends
9.28 miles towards Community X, 6 miles toward Community Z, 14 miles
toward Community A, and 8 miles towards Community B. This was estimated
using Reilly' s Law and is displayed on the map in Figure 3.
Figure 3. Example Trade Area
23

8/2/2019 Community Economic Analysis
http://slidepdf.com/reader/full/community-economic-analysis 30/97
N ote that in the townships where only part of the township was included,
only part of the population was counted. In Township C if the population was
concentrated near Z then the estimate of 15 percent would be reduced. The
unique trade area boundary in Township G represents the presence of a large
lake and a road system focused on City X rather than City Y. The grid
represents the unincorporated rural townships surrounding City Y. Table 1indicates how the trade area population could be estimated.
Table 1: Estimating Trade Area Population
Municipality Total Population x in City YShare Shopping
= MarketCity Y
YABC
DEFGHIJKLMNP
TOTAL
6000500400300
50015015001200800675300770560280415625
100%0
1015
500
60100
80505
1050
60000
4045
2500
720800540
150
2828210
8,262
66. Are there any limitations in applying Reilly's Law?
There are several limitations:
The population in the comparative communities must be relatively
homogeneous from cultural, economic and social perspectives. For
example, Reilly's Law is probably not very useful in estimating the
boundary between an extremely wealthy and an extremely poor
community.
It should not be used to delineate neighborhood trade areas in urban
areas. It is better to use Reilly's Law for independent communities
surrounded by countryside rather than suburbs or urban
neighborhoods.
It should be used between similar-sized communities. For example, it
should not be used to develop boundaries between a community of
200,000 people and 500 people.
24

8/2/2019 Community Economic Analysis
http://slidepdf.com/reader/full/community-economic-analysis 31/97
It tends to overestimate the shopping population because it assumes
that everyone inside the trade area shops locally for locally available
goods and services. It does not recognize that local people do some of
their shopping outside the community or that some people outside the
trade area will sometimes shop in the community rather than always
shopping in their home community.
It should be remembered that all one is estimating is an average trade
area boundary. This means some goods or services offered by the
community will have larger or smaller trade areas.
In spite of its limitations, Reilly's Law can be very useful. It can help
individual merchants, chambers of commerce and other groups map the
community 's trade area.
67. Reilly 's Law giv es us an idea of the potential retail trade area and its
population and income. Is it possible to find out how many customers are
actually drawn to a certain locale?
Trade area capture analysis can provide an estimate of the number of
customers actually drawn to a community. Trade area capture analysis
essentially assumes local people will buy goods and services at the same rate as
the state per capita average. The only force causing a variation in spending
patterns is income. Trade area capture analysis estimates customer equivalents
by dividing actual local sales by the state per capita sales adjusted by relative
local income.
Actual Retail Sales of Merchandise Type Y in the Community
Trade Area CaptureState Per Capita
Community Per Capita IncomeExpenditure for x
State Per Capita IncomeMerchandise Type Y
68. W hat data is needed?
First, one must measure the retail sales for the community and the state.
These figures are found in the Census of Business and are published every five
years (i.e., 1982, 1987 and 1992). In some states, sales tax data can be used.
Private data sources such as Standard Rate and Data or Sales Management are
alternative estimates of retail sales volume. These sources generally do not
provide information on smaller communities. Per capita income for the county
and state are also needed. These are typically available from various state
agencies, such as the Department of Administration or Department of Revenue.
25

8/2/2019 Community Economic Analysis
http://slidepdf.com/reader/full/community-economic-analysis 32/97
69. Can we do an example?
Let Village Y have $390,000 in furniture sales in 1987. Its 1987 local per
capita income was $3,457 and the state per capita income was $4,266. In 1987,
state per capita expenditures for furniture were $96.74. Plugging these numbers
into the formula you get:
$390,000
$96.74 x$3,457
390,000
96.74 x .81
390,000
78.364,977
$4,266
The
trade area capture for Village Y indicates sales in local furn iture stores equaled
that of 4,977 people assuming they had purchased furn iture at the average rate of
all state residents and adjusting for r elative income levels. The number is not the
actual number of people sold to, but rather represents customer equivalents.
70. Can you help with the interpretation of this number?
If the trade area capture is larger than the municipal population, the
community is attracting consumers from outside its boundaries or local people
are spending more for this item than the statewide average. It will require
further analysis to determine the cause. If the trade area capture is less than the
municipal population, then the community is not capturing the retail/ service
purchases of its own residents or local residents are spending relatively less than
the statewide average.
71. Are there other uses for the trade area capture estimate?
Yes. Remember that this number provides an estimate of the number of
people shopped for in the community. O ne important insight it can provide is
the change in customers shopped for over time. Let's say that the 1992 trade area
capture indicates Village Y drew 3,727 furn iture customers. The village has lost
1,250 furn iture customers within a five-year period. The village needs to ask
itself why this occurred.
72. T he trade area capture estim ate includes resident consumers and those
liv ing outside the city. Is there a way for a community to find out howmany customers it is attracting from outside its boundaries?
O ne method to estimate the port ion of customers a community draws from
outside its municipal boundaries is a ratio called the pull factor . A merchant can
look at the change in pull factor s over time to determine his/ her success in
drawing customers from outside the village or city boundaries.
26

8/2/2019 Community Economic Analysis
http://slidepdf.com/reader/full/community-economic-analysis 33/97
73. How are pull factors calculated?
The pull factor, for a certain type of retail good or service, is the trade area
capture estimate for that retail good or service divided by the municipal
population.
Trade Area Capture Estimate for Item JPull Factor for Item JMunicipal Population
The division by municipal population removes the influence of population
change within a city or village and focuses attention on the community's ability
to draw customers from the surrounding area.
74. Please giv e an example of how trade area capture and pull factors are used.
Let's take a community with a 1987 population of 7,821 and 1992
population of 7,833. Sales data are obtained from the 1987 and 1992 Census of
Retail Trade. Per capita income information for 1987 and 1992 gathered fromstate agencies shows an increase from $3,457 in 1987 to $5,539 in 1992. Table 2
shows that, in spite of a 6.6 percent increase in total retail sales, the community
experienced a 1.8 percent decrease in trade area capture. Its sales gain could be
from inflation, not from capturing more nonlocal customers.
Table 2. Example Trade Area Capture and Pull Factor Analysis
1987 1992
Actual Trade Actual TradeSales Area Pull Sales Area Pull
Retail Category (000's) Capture Factor (000's) Capture Factor
Hardware, Build 2,313 19,034 2.43 $4,007 28,845 3.68ing Materials,Garden Supply
General 3,760 13,577 1.74 1,086 4,004 0.51Merchandise
Food 5,180 12,441 1.59 5,757 13,244 1.69
Apparel andAccessory
2,298 28,700 3.67 2,662 33,535 4.28
Furniture, Home 2,065 22,599 2.89 1,684 17,471 2.23Furnishing,
Equipment
Drug and 1,338 12,659 1.62 3,216 15,193 1.94Proprietary
Misc. Retail 2,385 12,659 1.62 3,216 15,193 1.94(Excepting Drug)
Total Retail* 34,676 17,878 2.29 36,970 17,559 2.24
* Includes more items than those listed above.
27

8/2/2019 Community Economic Analysis
http://slidepdf.com/reader/full/community-economic-analysis 34/97

8/2/2019 Community Economic Analysis
http://slidepdf.com/reader/full/community-economic-analysis 35/97
action may require education, better marketing,

8/2/2019 Community Economic Analysis
http://slidepdf.com/reader/full/community-economic-analysis 36/97
or the development of special financial packages for retailers. Each community
will have a distinct approach reflecting local conditions in addressing its ability
to capture local dollars.
A part ial list of things that can be done includes:
Identify market potential of retail outlets th rough survey of consumer
needs and buying habits.
Improve share of retail market captured through a downtown analysis
and renewal.
Aid employers in developing employee training programs to improve
quality of service.
Expand purchases by nonlocal people (tourists, neighboring citizens)
through appropriate advertising.
Encourage citizens and businesses to buy locally through infor
mational programs about locally available goods and services.Take collective action through the formation of organizations like
downtown revitalization groups or chambers of commerce.
79. How can a community tell if it is losing trade dollars?
The first step is to examine the change in trade area capture and pull factors.
The second is to estimate sales potential and compare it with the actual sales. If
actual sales are less than the potential, then the community is losing some sales.
If possible, two different times should be used to determine the direction of
change.
80. How does that work?
Let's say that Community Y has a population of 7,833 people and a local
per capita income of $5,539. The trade area population is estimated as 24,000
people. The state income averages $6,864 per person and furn iture sales are
$98.61 per person. The potential furniture sales are computed from the
following formula:
Potent ial Trade Area State Per Local Per Capita Incomex
Sales Population Capita Sales
x
State Per Capita IncomeInserting the data from the example in the formula yields:
$5,539$1,909,793 24,000 x $98.61 x
$6,864
This is the potential furniture sales in this community if trade area residents
spend at the same rate as the statewide average adjusted for relative per capita
income, and all trade area residents shop in this community.
30

8/2/2019 Community Economic Analysis
http://slidepdf.com/reader/full/community-economic-analysis 37/97

8/2/2019 Community Economic Analysis
http://slidepdf.com/reader/full/community-economic-analysis 38/97
81. How do I determine the percent of trade potential being captured?
This is done by dividing actual sales collected by the Census of Business by
potential sales. In Table 2, the actual 1992 furn iture sales were $1,684,000. In th is
example, the community is capturing only 88.2 percent of its potential furniture
sales:
$1,684,00088.2% x 100%
$1,909,793
82. T hat seems appropriate if sales data is available. W hat if it's not?
If sales data is not available, then another indicator must be used. Actual
sales data is difficult to obtain in smaller communit ies. In very small
communities, it may be possible to interview individual stores and acquire an
estimate of actual sales. In some states, sales tax information is sufficiently good;
it permits identifying the sales of particular types of businesses in specific locales.
O r it may be possible to count the number of workers in particular retail and
service establishments. If they are assumed to produce sales equal to a per
employee average for the state or similar community, it would allow an estimate
of local sales.
83. W e hav e discussed sales potential and actual sales. A re there other
techniques to estim ate sales potential or even other types of retail and
serv ice activ ities that m ight be feasible in the community?
Yes. Three other techniques that might yield some insight are locationquotients, population-employment ratios and demand thresholds.
84. W hat do location quotients tell me?
Location quotients can indicate if a community produces more than is
needed for its own use and is selling the excess to nonlocal markets. It can also
tell us which types of businesses are not accommodating local needs and are a
source of consumption leakage.
85. How do location quotients give that information?
The location quotient approach assumes the national economy is self-
sufficient. While that is not completely true, it is more appropriate to make that
assumption for the national economy than a state, multistate, or multicounty
economy. The local economy is compared against that standard of self-
sufficiency. If the local economy has relatively less economic activity in a
particular sector , that suggests the good or service is being impor ted from other
communities. If the local economy has relatively more economic activity in a
particular sector, that suggests the good or service is being exported to other32

8/2/2019 Community Economic Analysis
http://slidepdf.com/reader/full/community-economic-analysis 39/97
communities.

8/2/2019 Community Economic Analysis
http://slidepdf.com/reader/full/community-economic-analysis 40/97
86. How are location quotients calculated?
First, determine the percentage of local employment in a particular sector
or activity. Then, calculate the percentage of national employment in that same
sector or activity. The third step involves dividing the percentage of local
employment in a given activity by the percentage of national employment inthat same activity. This equation determines the location quotient:
% of Local Employment in Activity XLocation Quotient
% of National Employment in Activity X
87. How is the location quotient interpreted?
The location quotient provides information for two important conditions.
A location quotient greater than one (1) indicates the sector is an export activity
and is an important link to the outside economy (see discussion of employment
multipliers). It is important to recognize, however, that a location quot ientprobably needs to exceed 1.25 before it represents much export activity. The
second important value is a location quotient less than one (1), particularly .75
or less. It suggests that part icular sector is not meeting local needs. The use of
the range .75 to 1.25 is recognition of data imperfections. The minimum and
maximum number essentially tries to restrict the analysis to those sectors that
are extremes.
88. After a location quotient has been calculated, how can it be used for
community economic analysis?
One has to be careful in making hasty conclusions from location quotients.
For example, a location quotient less than one does not mean the community
should strive for self-sufficiency in that activity. Each community need not be
completely self-sufficient in all sectors (e.g., steel mills or shoe manufacturers).
However, if the location quotient is less than one in a trade or service activity, it
suggests there may be a gap in the local economy, because most t rade and service
activities are expected to be present in most cities and villages.
89. That indicates one has to use a sense of judgement w hen interpreting
location quotients. W hat k inds of questions should a community ask itself to
interpret it s location quotients?
To a large extent that judgement is based on the question, "Is it feasible to
have this type of trade or service activity in this particular community?" If the
answer is yes, there are several additional items to consider.
34

8/2/2019 Community Economic Analysis
http://slidepdf.com/reader/full/community-economic-analysis 41/97
90. W hat other items should be considered?
The community can compare its location quot ient with the location
quotient of similar communities. If those communities are export ing (LQ> 1) or
are at least self-sufficient (LQ= 1) in th is sector, that reinforces the idea that the
community could expand that sector.
Remember, the location quotient is only a first cut at possible activities.
The real answer comes from a feasibility study. Such studies give information
about potential customers, the anticipated profitability of a particular business,
and offer more conclusive information about the possibility of expansion in a
certain activity. People who understand marketing can conduct such studies. But
it is senseless to spend a great deal of money and t ime on a feasibility study
unless one first calculates the location quotients, compares them to similar
communities, and calculates the population-employment ratios (to be discussed
later) to narrow the possibilities.
91. W hat type of information is needed to compute location quotients?
Employment data by sector of the local and national economy. Generally,
this is just wage and salary employment and does not include proprietors.
92. Location quotients seem to be fairly easy to calculate. Are there some
cautions in their use?
Just like any other tool, location quotients need to be used with caution
because some elemental assumptions can lead to errors if they are violated. Thetechnique requires you to assume local and nonlocal demand and productivity
are similar.
93. W hy is this so important?
Remember, we are trying to identify economic opportunities. If the local
economy has a local demand that varies substantially from the national
conditions, then the level of self-sufficiency may be quite different from that
implied. For example, the local community is growing and has a relatively large
share of its employment in residential housing construction because thecommunity is experiencing a housing boom, not because it is exporting houses
to other locales. Productivity is also important because if the local workforce is
less productive than the national average, then relatively more people need to be
employed to just meet local needs. In this case, the relatively high share of local
employment in a particular sector reflects poor management or workers who do
not produce at a comparable rate to the national average. Yet, the location
quotient would suggest they are exporting.
35

8/2/2019 Community Economic Analysis
http://slidepdf.com/reader/full/community-economic-analysis 42/97
94. Are there any other limitations of location quotients?
Another caution is the aggregation of the data—location quotient values can
vary because of the data used. For example, Standard Industr ial Code (SIC) 37 is
transportation equipment manufacturing while SIC code 3732 represents the
manufacturing of pleasure boats. A community may have a location quotient of less than one at the two-digit level, which suggests no exports. But if the data
were broken down to the four-digit SIC code level, the production of pleasure
boats, the location quotient might indicate the community is an exporter.
Although the ideal is to use three- or four-digit SIC codes for calculating
location quotient, it is not always feasible. Most employment data for
communit ies is only available at the two-digit level, so finding more precise data
may not be feasible.
95. Are there other measures a comm unity can use to understand its trade and
serv ice sectors?
There is the population-employment ratio. It measures the number of
people in the local market who support each trade or service job. It is a simple
ratio to make intercommunity comparisons of trade and service activities. These
ratios are relative and vary by size of the community.
96. W hat do you mean relativ e?
Location quotients have a critical value of one (1). Population-employment
ratios have no single critical value. Rather, the critical value is the average of several similar-sized communities. A population-employment ratio larger than
the average indicates each local worker is selling to more customers than the
average for similar-sized communities. This suggests there may be an
opportunity to expand employment in this trade or service activity.
97. W hat in formation do we get from population-employment ratios that
location quotients do not tell us?
Population-employment ratios use the entire population which includes all
consumers, not just those who are working, as location quotients do. Thus, forcommunities with either a lot of younger people and/ or older people who are
not working, the location quotient may yield biased results.
98. How are population-employment ratios calculated?
First, the data required is the population of the cities being compared and
the number of employees in a particular t rade or service activity in each city.
The population-employment ratio for each city is determined by dividing the
population in each city by the employment in a particular trade or service36

8/2/2019 Community Economic Analysis
http://slidepdf.com/reader/full/community-economic-analysis 43/97
activity:

8/2/2019 Community Economic Analysis
http://slidepdf.com/reader/full/community-economic-analysis 44/97
Population of a CityPopulation-employment Ratio
Number of Employees in a ParticularTrade or Service Activity in that City
99. Could you share an example?
Suppose there are five small cities with populations between 6,000 and
9,000. Each city is the county seat, none contains a sizeable federal or state
employer and none is closely linked to a major metropolitan center. Let's say the
sector for comparison is furn iture retailing, SIC code 57.
Suppose the population -employment ratios for the five cities are as follows:
City A, 250; City B, 249; City C, 350; City D, 193; City E, 549. The average
ratio for these five cities is 318. This suggests cities A, B and D have more than
the average number of employees in furniture retailing relative to their
population while cities C and E have less. City E's relatively high ratio indicatesit may have expansion opportunities in furniture retailing. Yet, before making a
final judgement on expanded furniture retailing, it is important to examine other
obvious factors not captured in the employment data.
100. Such as?
The most obvious is a nearby community with an aggressive merchant,
which would make it more difficult to operate or start a firm successfully.
Second, the assumptions of similar demand and productivity among
communities may not be valid. Just like location quotients, if demand or
productivity are not similar it requires further analysis, because one cannot besure what the data show.
101. Do the population-employment ratio and the location quotient giv e us the
same information?
They are similar, but not duplicative. A relatively high population-
employment ratio and a location quotient less than one suggest an expansion
possibility. A relatively low population-employment ratio and a high location
quotient suggest expansion possibilities are limited. Other combinations of
location quotients and population-employment ratios require additional analysisbefore you can make a judgement.
102. If w e are looking at the market supporting a particular trade or service
worker should we not use the trade area rather than municipal
population?
To be correct, you probably should. But then, you need to include all the
workers in that particular activity in the smaller communities in your trade area.
This would need to be done for all the comparison communities. Furthermore,38

8/2/2019 Community Economic Analysis
http://slidepdf.com/reader/full/community-economic-analysis 45/97
the trade area for different goods and

8/2/2019 Community Economic Analysis
http://slidepdf.com/reader/full/community-economic-analysis 46/97
services vary so the market population also varies. It is questionable whether it is
worth the additional trouble. Again, remember no single number will be
sufficient to make a decision.
103. Y ou mentioned demand thresholds could be used to judge the potential for
particular types of retail and service activ ities.
That is true to some degree. Demand thresholds are estimates of the
average number of people found in a community with a given number of a
particular establishment.
104. Just what does that m ean?
Let's say a community of 2,700 people would like to have a shoe store. A
demand threshold estimate might indicate that on the average, a shoe store is not
found in communities of less than 3,000 people. This means that an average size
shoe store is not likely to have a sufficient local market to support its operation.
But remember averages and general rules of thumb have almost as many
exceptions as accurate predictions.
105. Are you saying that demand thresholds may be misleading?
Any of the techniques discussed in this manual can yield misleading results
if not used with care and some sensitivity to other sources of information and
insight.
106. Recognizing those limitations, are there some general estim ates of demand thresholds that are applicable in most communities?
Yes there are, but the value of the estimate will change over time and
among different areas of the country. Thus, there are no general numbers
appropriate in every community. O ften the best source of market/ demand
threshold information for a specific type of business (e.g., hardware store,
pharmacy etc.) is to make contact with that trade association and ask them about
some general market needs for a successful operation.
Measuring the Efficiencyof Local Firms
107. These tools giv e some idea about examining the trade or service sector. Are
there other ways a community can address the question of community
economic dev elopment?
Yes, there are. It is important to remember there are no distinct divisions40

8/2/2019 Community Economic Analysis
http://slidepdf.com/reader/full/community-economic-analysis 47/97
among these approaches. Another approach is to examine the efficiency of firms.

8/2/2019 Community Economic Analysis
http://slidepdf.com/reader/full/community-economic-analysis 48/97
108. W hy examine efficiency of firms?
A key mechanism for community economic development is to work with
existing businesses to improve their efficiency and competitiveness. This helps
the community because, if existing businesses become more competitive, they
will be more viable and are more likely to generate employment opportunities.
109. How can a community tell if its businesses are more competitiv e than
others?
One way to examine the competitiveness of local business would be to
look at the forces affecting their growth or decline. These forces of change can
come from three sources. The first is local growth (decline) stimulated by
national growth (decline). The second is local growth (decline) stimulated
because of a local concentration of businesses in r elatively faster (slower) growth
economic sectors. The third is local growth (decline) arising from more (less)
competitive firms locally than the national average for that sector.
110. Can the impact of these three factors on the local community be estim ated?
Shift-share analysis can provide some insight to the magnitude of these
factors. It is a descriptive tool and does not indicate why employment changed.
Rather, it is a starting point for further analysis.
111. W hat is shift-share analysis?
It measures the movement (shift) of the local economy into faster or slowergrowth sectors and the community 's larger or smaller portion (share) of the
growth occurring in a given economic sector.
112. How do you calculate shift-share?
The first step is to calculate the national growth component (NG). It
measures the potential change in local employment assuming the local economy
is similar to the national economy. The national growth component is calculated
by multiplying the base year employment in each sector by the national average
employment growth rate, and then summing over all the sectors. The resultsshow how many new jobs were created locally due to national economic trends,
assuming the local and national economy are identical.
113. How can a community measure whether it has more/ fewer faster growth
businesses than the national average?
The second step in shift-share is to compute the industrial mix component
(IM). The industrial mix component is determined by multiplying the local
employment in each economic sector by the42

8/2/2019 Community Economic Analysis
http://slidepdf.com/reader/full/community-economic-analysis 49/97
difference in the national growth rate for that sector and the growth rate for the
whole economy. A positive industrial mix indicates the majority of local
employment is in sectors growing faster than national total employment. A
negative industr ial mix indicates just the opposite.
114. W hat might cause the slower growth?
There are several reasons for a negative IM. The community may have
businesses with declining long-run growth prospects. It may also indicate
businesses are undergoing a cyclic downturn . It could also be due to poor
management, obsolete technology or a shift in markets.
The community needs to examine both the total industrial mix as well as
the industr ial mix for specific sectors. The community could ask businesses in
negative sectors what kinds of assistance they might need. If the community
wants to stimulate internal growth, it needs to consider both positive and
negative industr ial mix businesses. But just as importantly, sectors with a
positive or negative industrial mix generally require different responses from the
community.
115. How can a community m easure whether local businesses are growing faster
or slower than similar businesses nationally?
The competitive share component (CS) measures the ability of the local
economy to capture an increasing (decreasing) share of a part icular sector' s
growth. It is computed by multiplying the local employment in each economic
sector by the difference in the growth rate of that sector nationally and locally.After doing this for all sectors, the results are summed to give the community
competitive share.
A positive competitive share indicates the community gained additional
jobs over that due to national growth and it s industrial structure. This gain
suggests the community is more competitive (efficient) in securing additional
employment than the rest of the nation. It is important to examine the
competitive share for both the community and particular sectors. Each yields
different information.
116. Could we go through a simple example of shift-share analysis?
Let's assume that the national employment grew at a rate of 5 percent over
the last two years and nationally sector A grew 7 percent and sector B 4 percent.
In the community, total employment grew 5.6 percent and sectors A and B grew
6 percent and 5 percent respectively. The initial local employment in these two
sectors was 200 and 120. The national growth component is calculated as:
43

8/2/2019 Community Economic Analysis
http://slidepdf.com/reader/full/community-economic-analysis 50/97
NationalBase Growth
Sector Employment Rate
A 200 x 5% = 10B 120 x 5% = 6
National Growth Component 16
The industrial mix component is calculated as:
Sector National
Sector EmploymentBase
RateGrowth
Growth RateAverage
A 200 xB 120 x
Industrial Mix Component
(7%(4%
--
5%)5%)
==
4.0-1.22.8
The competitive share component is calculated as:
LocalSector National Sector
Base Growth Growth RateSector Employment Rate
A 200 x (6% - 7%) = -2.0B 120 x (5% - 4%) = 1.2
Competitive Share Component -.8
This community gained 18 new jobs over the last two years. Most of thatgain (16 jobs) was due to national economic growth. The majority of local
employment is in relatively fast growing sectors because the community has a
positive industr ial mix (2.8 jobs). But these sectors are not very competitive
compared to national standards (a competit ive share loss of .8 jobs). N ote that
sector B had a positive competit ive share that was offset by the negative
competitive share in sector A. This suggests the community needs to determine
how it can support sector B's continued competitive position and help sector A
improve its competitive prospects. Likewise, the community must recognize
that sector B is currently growing slower than the national average. This may be
due to business cycles or shifts in demand, etc.
117. W here do you get data to compute the national growth component,
industrial mix and competitiv e share?
The data can be acquired from County Business Patterns, which is published
annually. The data is also available from the state Job Service of the state
Department of Labor.
44

8/2/2019 Community Economic Analysis
http://slidepdf.com/reader/full/community-economic-analysis 51/97
118. Suppose shift-share analysis suggests some local businesses are not as
efficient as they could be. How can a community improve the efficiency of
its existing firms?
Again there is no single avenue to success, but the community could:
Strengthen management capacities of existing firms through
educational programs (personnel, finance, organization, etc.).
Encourage business growth through identification of capital sources:
1. Loans (S.B.A., banks, industrial revenue bonding).
2. Equity (small business investment corporations, investment
groups).
Increase knowledge of new technology through educational programs
in science and engineering.
Aid employers in improving work force quality through educational
programs, employment counseling and social services (e.g., day care,
health services).
Develop community and regional facilities that improve local business
efficiency and access to nonlocal markets (e.g., t ransportation, services,
communications).
O ther Strategies
119. Another important aspect of comm unity economic development is the
creation of new firms. What steps can a community take to encourage the
formation of new firms and w hy is it so important?
There is a continuing need for new businesses to meet changing needs. The
rapid growth of the fast food industry for example, indicates how consumers'
preferences have changed. The computer service industry sprang from a change
in technologies. Population growth and shifts can also lead to business
expansion.
A community economic development program should encourage
entrepreneurs to form businesses that have a good chance of success. Assistance
can be provided through management counseling, packaging necessary capitaland other mechanisms.
120. Another opportunity for improving community income and employment is
to increase aids receiv ed from broader units of government. W hy is it so
important?
A significant portion of many communities' income comes from payment
received from broader units of government, such as counties, states and the
nation. Individuals receive payments such as social security, veterans' benefits,45

8/2/2019 Community Economic Analysis
http://slidepdf.com/reader/full/community-economic-analysis 52/97
aid for dependent children and retirement income. (See discussion of
employment mult ipliers.) Businesses receive

8/2/2019 Community Economic Analysis
http://slidepdf.com/reader/full/community-economic-analysis 53/97
agricultural land conservation payments, military contracts and service
contracts. Local governments receive aids for schools, park and recreational
development, streets, and other things.
121. W e hav e looked at many d ifferent tools of community economic analysis.
Are there any other tools that should be considered?
This manual is not exhaustive. We have only explored some of the tools
for economic analysis. Some tools are too costly, or use data that is difficult to
find. For example, a community economic analysis technique not discussed in
this manual is input-output analysis. This manual also did not explore
descriptive data that can tell us a great deal about a particular community. The
worth of such data is obvious and self-explanatory. However, this manual's
primary focus is on economic analysis tools that will be helpful to community
economic developers. Interested readers are referred to the bibliography for
more detail.
122. This manual mak es an argument that a comm unity can learn more about
its economy through community economic analysis. But how can we make
sure the analysis leads to action and is not forgotten?
There is no guarantee that analysis will lead to action. However, the
chances for action are increased considerably if local leaders and citizens are
involved in the early stages of analysis and are given the opportunity to ask
questions, to learn how to calculate and interpret the tools, to identify problem
areas, and to set achievable goals.
47

8/2/2019 Community Economic Analysis
http://slidepdf.com/reader/full/community-economic-analysis 54/97

8/2/2019 Community Economic Analysis
http://slidepdf.com/reader/full/community-economic-analysis 55/97
Appendix
49

8/2/2019 Community Economic Analysis
http://slidepdf.com/reader/full/community-economic-analysis 56/97

8/2/2019 Community Economic Analysis
http://slidepdf.com/reader/full/community-economic-analysis 57/97
H ypothetical Case Example
Using Community
Economic Analyses Tools
Reilly's Law
Purpose
To determine the maximum distance customers will travel to shop in a
certain community. The information is generally used to develop a trade area
map of the community.
Example
We want to know how far the trade area extends from the city of Riverside
to the cities of Mountainview, Centerville, River Falls and Forest Grove.
Data Needed
1. Population of each city to be compared with our community (i.e.,
Riverside). Each state generally makes annual estimates of community
population for various official purposes. Contact the local community or
call a state office, such as the administration department or the sociology
department of a nearby university for this information.
2. The road distance from our community (e.g., Riverside to similar citiessurrounding it—Mountainview, etc). The distance between communities
can be read from road maps.
51

8/2/2019 Community Economic Analysis
http://slidepdf.com/reader/full/community-economic-analysis 58/97

8/2/2019 Community Economic Analysis
http://slidepdf.com/reader/full/community-economic-analysis 59/97
Reilly's Law Formula
Distance from Distance Between City X and City YSmaller Community
Population of Larger Municipality1
Population of Smaller Municipality
H ow to Calculate Trade Area Boundaries
Compute the boundary between Riverside and Mountainview by plugging
the numbers into the formula.
23 23 239.31 miles from Mountainview
1
7,052 1 2.163 1 1.47
3,260
Compare Riverside and Centerville by using the same formula:
61 61 6123.47 miles from Riverside
1 1.601 2.55518,0231
7,052
Interpretation
The Riverside-Mountainview result means that the trade area for Riverside
extends up to 9.31 miles from Mountainview. The people, who live within 9.31
miles of Mountainview will be reluctant to shop in Riverside. The Riverside-
Centerville comparison suggests that the trade area for Riverside extends up to
23.47 miles from the city of Riverside. Remember, the final number derived in
the formula is the trade area boundary distance from the smaller community.
After calculating the trade area distances for surrounding communit ies, connect
the points. This yields a map of the trade area.
53

8/2/2019 Community Economic Analysis
http://slidepdf.com/reader/full/community-economic-analysis 60/97
The Riverside trade area map: [not drawn to scale]
After the trade area has been identified, the population, income and other
information about municipalities within the trade area can be used to help
Riverside merchants understand their trade potential.
Trade Area Capture
Purpose
To tell how many customers are drawn to a particular community to shop
for a certain type of product at any given time.
Example
The city of Riverside wants to know how many customers it has attracted
in recent years. Riverside is especially interested in it s auto dealers. They want to
know if they lost or attracted more customers between 1987 and 1992.
Data Needed
1. Actual retail sales in a particular sector (i.e., Riverside auto sales in 1987
and 1992). The retail sales for the community and the state are located in
the Census of Business. This information is published every five years (i.e.,
1982, 1987 and 1992). If you are analyzing a community larger than 2,500
people, you can obtain up-to-date retail sales information from private
sources such as Standard Rate and Data or Sales Management. These are
often available in newspaper offices, larger retail firms, or libraries in54

8/2/2019 Community Economic Analysis
http://slidepdf.com/reader/full/community-economic-analysis 61/97
universities and business colleges. In some states, sales tax data can be used.
This can be obtained from the appropriate state agency.
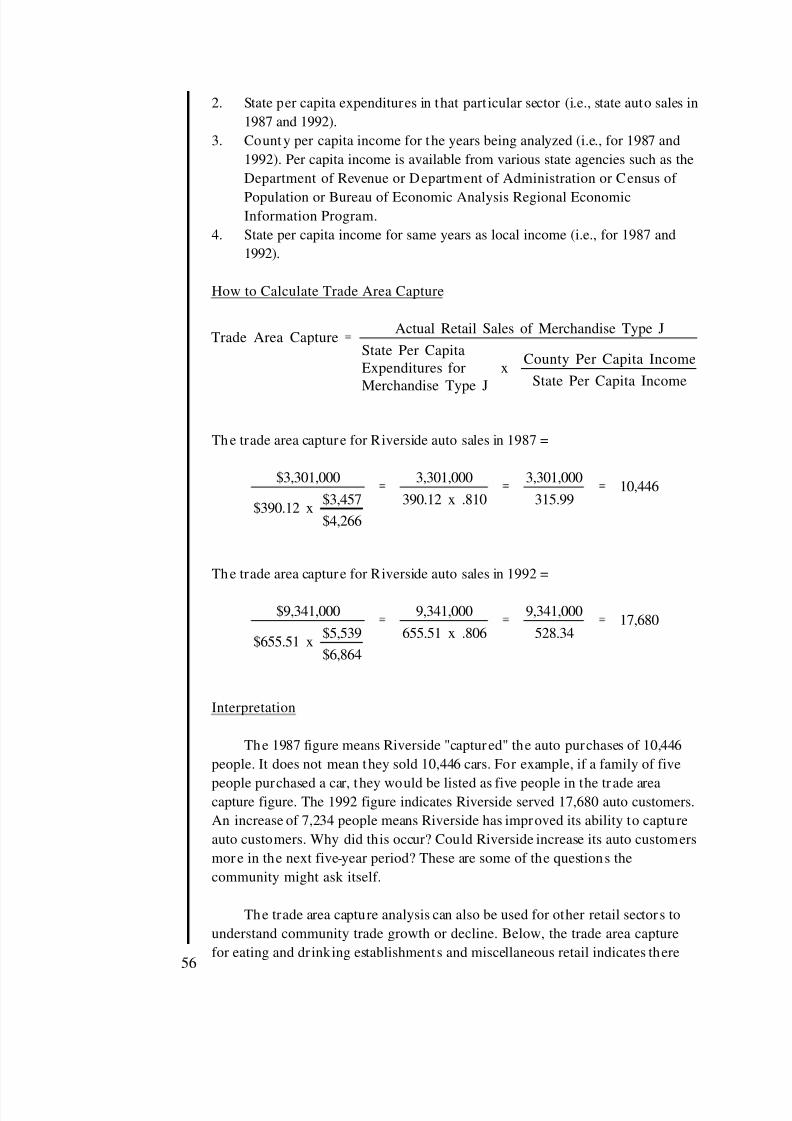
8/2/2019 Community Economic Analysis
http://slidepdf.com/reader/full/community-economic-analysis 62/97
2. State per capita expenditures in that part icular sector (i.e., state auto sales in
1987 and 1992).
3. County per capita income for the years being analyzed (i.e., for 1987 and
1992). Per capita income is available from various state agencies such as the
Department of Revenue or Department of Administration or Census of
Population or Bureau of Economic Analysis Regional EconomicInformation Program.
4. State per capita income for same years as local income (i.e., for 1987 and
1992).
How to Calculate Trade Area Capture
Actual Retail Sales of Merchandise Type JTrade Area Capture
State Per CapitaCounty Per Capita Income
Expenditures for xState Per Capita Income
Merchandise Type J
The trade area capture for Riverside auto sales in 1987 =
$3,301,000 3,301,000 3,301,00010,446
$3,457 390.12 x .810 315.99$390.12 x
$4,266
The trade area capture for Riverside auto sales in 1992 =
$9,341,000 9,341,000 9,341,00017,680
$5,539 655.51 x .806 528.34$655.51 x
$6,864
Interpretation
The 1987 figure means Riverside "captured" the auto purchases of 10,446
people. It does not mean they sold 10,446 cars. For example, if a family of five
people purchased a car, they would be listed as five people in the tr ade areacapture figure. The 1992 figure indicates Riverside served 17,680 auto customers.
An increase of 7,234 people means Riverside has improved its ability to capture
auto customers. Why did this occur? Could Riverside increase its auto customers
more in the next five-year period? These are some of the questions the
community might ask itself.
The trade area capture analysis can also be used for other retail sector s to
understand community trade growth or decline. Below, the trade area capture
for eating and drinking establishments and miscellaneous retail indicates there56

8/2/2019 Community Economic Analysis
http://slidepdf.com/reader/full/community-economic-analysis 63/97
has been a loss in customers. Why did it occur? What can Riverside do to
promote those two sectors? These are some of the questions that follow trade
area capture analysis.

8/2/2019 Community Economic Analysis
http://slidepdf.com/reader/full/community-economic-analysis 64/97
Retail Category
1987 1992
(000s)
ActualSales
CaptureTrade Area
(000s) Capture
Actual TradeSales Area
Food
Auto
Furniture
Eating and Drinking
Miscellaneous Retail
Total Retail*
5,122
3,301
1,527
2,187
1,300
22,505
14,320
10,446
19,489
12,962
7,399
13,500
9,241 17,203
9,341 17,680
2,603 21,922
2,889 10,885
1,599 6,113
37,971 15,270
*Includes categories not explicitly identified.
Pull Factor
Purpose
To determine the portion of customers a community draws from outside
its boundaries. Pull factors should be compared over several time periods to
determine trends. While not a general occurrence, the pull factor could be less
than one.
Example
The City of Riverside wants to know what port ion of its automobile
customers are coming from outside its boundaries. They are interested in
knowing if they have improved on their ability to attract outsiders between the
years 1987 and 1992.
Data Needed
1. Trade area capture for a particular sector for two time periods (i.e.,
Riverside auto sales trade area capture for 1987 and 1992).
2. Population of the community (i.e., Riverside population in 1987 and 1992).
Annual estimates of the community population are available from the locallibrary, city hall, or a state agency such as the Department of
Administration or Department of Revenue.
H ow to Calculate Pull Factors
To calculate a pull factor for a certain type of retail good, divide the trade
area capture estimate by the community population for the same year as the
trade area estimate:
58

8/2/2019 Community Economic Analysis
http://slidepdf.com/reader/full/community-economic-analysis 65/97
Trade Area Capture EstimatePull Factor
Community Population

8/2/2019 Community Economic Analysis
http://slidepdf.com/reader/full/community-economic-analysis 66/97

8/2/2019 Community Economic Analysis
http://slidepdf.com/reader/full/community-economic-analysis 67/97

8/2/2019 Community Economic Analysis
http://slidepdf.com/reader/full/community-economic-analysis 68/97
2. Trade area population is estimated from Reilly's Law and the Census of
Population.
3. State average expenditures per person for a particular retail/ service activity
can be collected from the appropriate Census of Business or sales tax data.
4. State and local per capita income data can be collected from Bureau of
Economic Analysis data, state income tax data or Census of Population.
Calculating Sales Potential
The formula is:
Potential Trade Area State Per Local Per Capita Incomex
Sales Population Capita Salesx
State Per Capita Income
For the city of Riverside, the following data is used in the above formula:
trade area population , 22,500; local per capita income, $5,539; state per capita
income, $6,864; and state per capita auto sales, $655.61.
$5,539$11,903,704 22,500 x $655.61 x
$6,864
The proportion of potential sales that are captured can be estimated by
using the following formula:
Proportion Actual Salesx 100%
Captured Potential Sales
In this example, the formula becomes:
$9,341,00078.5% x 100%
$11,903,704
Interpretation
The city of Riverside is captur ing only 78.5 percent of its estimated
potential sales in new automobile purchases. This could be due to a variety of
reasons including non-aggressive local businesses, nearby competit ion, poor
choice, and product selection, etc. N ote these numbers tend to support the
insight gained from trade area capture, which indicated the city was capturing
only 17,680 customers out of the 22,500 in the trade area.
Location Quotient
Purpose
1. To determine a community' s degree of self-sufficiency in a particular retail
or trade sector.
62

8/2/2019 Community Economic Analysis
http://slidepdf.com/reader/full/community-economic-analysis 69/97
2. To determine if a community is losing its local trade dollars to nonlocal
markets.
3. To determine if a community is producing more than needed for its own
use and is selling the excess to nonlocal markets (i.e., identify export
activity).
Example
Business leaders in Riverside want to know if the community is self-
sufficient in apparel and accessory stores.
Data N eeded
1. The Standard Industr ial Classification code for Sector J (e.g., apparel and
accessory stores). First, define the type of business to be investigated in
terms of its SIC code. These codes are published by the U.S. Department of Commerce and Labor. The local Job Service is likely to have a copy.
Generally, three-digit SIC codes should be used to determine location
quotients, but data may be unavailable in smaller communities.
2. The percentage of local labor force employed in Sector J (e.g., apparel and
accessory stores). This percentage is determined by dividing the number of
local people employed in Sector J by the total local employment. This
employment information is available from the Job Service, Department of
Labor or County Business Patterns. It is categorized in t erms of SIC codes.
3. The percentage of workers employed nationally in Sector J (e.g., apparel
and accessory stores). This information is available through Job Service or
the state Department of Labor. Another source is the Employment and
Earnings repor t published by the U.S. Bureau of Labor Statistics. County
Business Patterns is also a potential source for state or national data.
How to Calculate Location Quotients
Location quotients are calculated by dividing the percentage of those
employed locally in a particular sector by the percentage of those employed in
the same sector nationally.
% of Local Employment in Sector JLocation Quotient% of National Employment in Sector J
Looking at Riverside again, the Standard Industr ial Classification code for
retail apparel and accessories is 56. In 1992, let us say that 1.38 percent of
national employment is found in SIC code 56. Riverside has 1.29 percent of its
1992 employment in SIC 56. The apparel and accessory location quotient for
Riverside is:
1.29.94
63 1.38

8/2/2019 Community Economic Analysis
http://slidepdf.com/reader/full/community-economic-analysis 70/97

8/2/2019 Community Economic Analysis
http://slidepdf.com/reader/full/community-economic-analysis 71/97
Interpretation
A location quotient of .94 for Riverside's apparel and accessory shops is
almost one. It suggests the city is approximately self-sufficient in apparel and
accessory shops. A location quotient generally between the values of .75 and
1.25 probably indicates the community is just self-sufficient .
If thr ee digit SIC codes had been used, the analysis might indicate self-
sufficiency for men' s clothing (SIC 561) but not women's clothing (SIC 562).
This indicates the desirability of using at least three-digit SIC codes.
A location quot ient less than 1 suggests the community is not self-sufficient
and may be able to supply locally what it previously imported. To make this
judgement requires comparing location quotients among similar communities,
plus examining the population-employment ratios and eventually doing
feasibility studies.
Population-Employment Ratio
Purpose
To measure the number of people in the local market per job in a particular
trade or service sector. It is used to make intercommunity comparisons of trade
and service sectors.
Example
The community of Riverside is interested in learning about its apparel and
accessory sector (SIC code 56). Some people believe there is little room for
expansion in this field. Others argue that the community could support more
apparel stores or that existing apparel stores should expand. Riverside uses the
population-employment ratio to compare its retail apparel sector with similar
communit ies (e.g., Mountainview, Booneville, Forest Grove and Porterville).
Data Needed
1. Population of each community. The population of the three or fourcommunities to be compared with the community. Annual population
estimates are available from state agencies such as the Department of
Administration or the Department of Revenue. Precise figures are available
for census years (i.e., 1980 and 1990) from the Census of Population.
2. The number of local workers in a particular sector, defined by SIC code.
The number of local workers in each sector (i.e., SIC code 56, apparel and
accessory stores) is available from the State Department of Labor or Job
Service.
65

8/2/2019 Community Economic Analysis
http://slidepdf.com/reader/full/community-economic-analysis 72/97
H ow to Calculate the Population-Employment Ratio
The population of a particular city or village divided by the number of
people employed in a particular trade or service sector in that city yields the
population-employment ratio.
Population of a CityPopulation Employment Ratio
Number of Employees in a ParticularTrade or Service in That City
The following data is needed to compute the ratios:
Employment inCity Population Apparel and Accessory
Riverside 7,052 244Forest Grove 6,758 123
Booneville 7,826 175Mountainview 3,260 71
Porterville 7,833 108
7,052Riverside Population-Employment Ratio 28.90
244
6,758Forest Grove Population-Employment Ratio 54.94
123
Booneville, Mountainview and Porterville have population-employment
ratios of 44.72, 45.92 and 72.53, respectively. The next step is to compute the
average, which is 49.40.
Interpretation
O n the average, each retail apparel store worker "sells" to about 50 people.
However, in Riverside each retail apparel store worker only sells to about 29
people. Why does Riverside have such a low population-employment ratio? It
could be because the local merchant is aggressive and is servicing a much larger
nonlocal market, or the local merchant is over-staffed. In any case, the
population-employment ratio here does not suggest any room for expansion.
This agrees with the location quotient analysis.
Shift-Share: National Growth Component
Purpose
To measure how many new jobs were created locally due to national
economic trends.
66

8/2/2019 Community Economic Analysis
http://slidepdf.com/reader/full/community-economic-analysis 73/97

8/2/2019 Community Economic Analysis
http://slidepdf.com/reader/full/community-economic-analysis 74/97
Sector Employment Growth RateLocal 1990 National Average
ComponentNational Growth
A 50 x 32.03
B 70 x 32.03
C 80 x 32.03
D 65 x 32.03
Community National Growth Component
=
=
=
=
=
16.02
22.41
25.62
20.81
84.86
Interpretation
The national growth component of 84.86 means 85 of the 140 new jobs in
the sectors A, B, C and D were due to national economic trends. Thus, if the
Riverside economy was like the national economy it should have grown by 85
jobs. Likewise, sector A would have grown by 16.02 jobs if it was like thenational economy, etc.
Shift-Share: Industrial Mix Component
Purpose
To determine whether the local economy is concentrated in industries that
are growing slower or faster than the national average.
Data N eeded
Same as the calculations of the national growth component.
H ow to Calculate
The industrial mix component is computed by multiplying the local
employment in each economic sector by the difference in the national growth
rate for that sector and the whole economy.
Sector Employment
1990Riverside
Growth Rate
Sector'sNational
(%)Growth Rate
NationalAverage
(%)Component
Industrial Mix
A 50 x ( 80.00 - 32.03) = 23.98
B 70 x ( 33.33 - 32.03) = .91
C 80 x ( -5.56 - 32.03) = -30.07
D 65 x (-27.78 - 32.03) = -38.88
68

8/2/2019 Community Economic Analysis
http://slidepdf.com/reader/full/community-economic-analysis 75/97
Community Industrial Mix Component= -44.07

8/2/2019 Community Economic Analysis
http://slidepdf.com/reader/full/community-economic-analysis 76/97
Interpretation
The industrial mix component is negative. It suggests that Riverside's
economy has 44.07 jobs less than it would have if its economic structure were
identical to the nation. Sectors A and B are growing faster than the national
average. However, that growth is offset by sectors C and D, which are growingslower than the national average. The negative industrial mix means that
independent of national influences, the local sectors, on balance, grew slower
than the national average and reduced local employment growth. Sectors C and
D were the cause. If the industrial mix component were positive, it would
suggest the local economy has relatively more people employed in fast growth
sectors than the national average.
Riverside's negative industrial mix should lead the community to examine
what is causing the slower growth. There are several reasons for a negative
industr ial mix. It could be a cyclic downtown. It could also be due to a shift inmarkets or depletion of a resource. The negative industrial mix means the
community needs to consciously seek economic activity that will offset the
declining sectors. At the very least, the community should not seek activity
linked to the declining sectors.
It is important to note that not all sectors of the local economy had a
negative industrial mix. The community needs to identify its faster growing
firms/ sectors to determine if these sectors are likely to continue contr ibuting to
local employment change.
Shift-Share: Competitive Share Component
Purpose
To determine whether local businesses are growing faster or slower than
similar businesses nationally (i.e., more or less competit ive).
Date Needed
Same as for the calculations of the national growth component.
H ow to Calculate
The competitive share component is calculated by multiplying the local
employment in each economic sector by the difference in the growth rate for
that sector nationally and locally. The results for each sector are summed up to
give the community's competitive share. The Riverside case illustrates how to
compute competitive share.
70
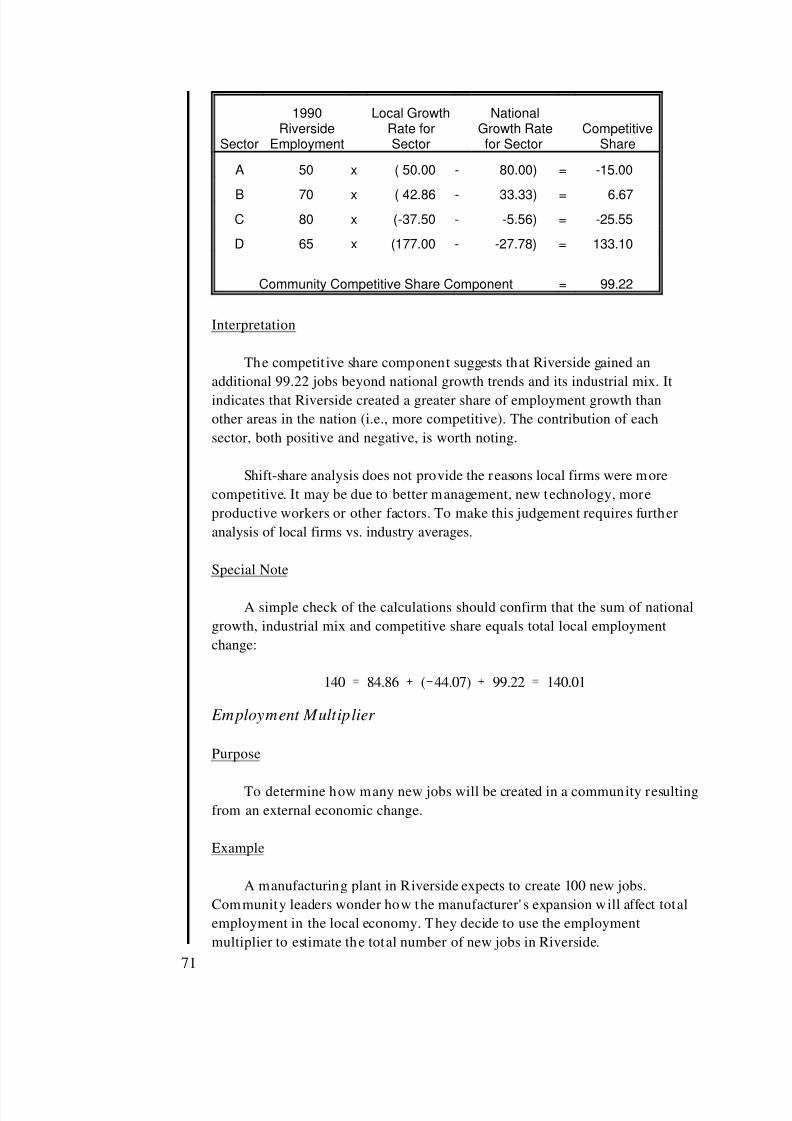
8/2/2019 Community Economic Analysis
http://slidepdf.com/reader/full/community-economic-analysis 77/97
Sector Employment Sector for Sector
1990 Local Growth NationalRiverside Rate for Growth Rate
ShareCompetitive
A 50 x ( 50.00 - 80.00) =
B 70 x ( 42.86 - 33.33) =
C 80 x (-37.50 - -5.56) =
D 65 x (177.00 - -27.78) =
Community Competitive Share Component =
-15.00
6.67
-25.55
133.10
99.22
Interpretation
The competit ive share component suggests that Riverside gained an
additional 99.22 jobs beyond national growth trends and its industrial mix. It
indicates that Riverside created a greater share of employment growth than
other areas in the nation (i.e., more competitive). The contribution of each
sector, both positive and negative, is worth noting.
Shift-share analysis does not provide the reasons local firms were more
competitive. It may be due to better management, new technology, more
productive workers or other factors. To make this judgement requires further
analysis of local firms vs. industry averages.
Special Note
A simple check of the calculations should confirm that the sum of national
growth, industrial mix and competitive share equals total local employment
change:
140 84.86 ( 44.07) 99.22 140.01
Employment Multiplier
Purpose
To determine how many new jobs will be created in a community resulting
from an external economic change.
Example
A manufacturing plant in Riverside expects to create 100 new jobs.
Community leaders wonder how the manufacturer' s expansion will affect total
employment in the local economy. They decide to use the employment
multiplier to estimate the total number of new jobs in Riverside.
71

8/2/2019 Community Economic Analysis
http://slidepdf.com/reader/full/community-economic-analysis 78/97
Data Needed
1. Location quot ients for the major employment sectors in the community
(see section on location quot ients).
2. Employment in the community by sector is available from the State
Department of Labor or Job Service.
H ow to Calculate the Employment Multiplier
For simplicity, let's say Riverside has a two-sector economy. One sector is
manufacturing and the other is trade. The information we need is:
1992 LQ 1992 Employment
Manufacturing 4 1,500Trade 2 1,832Total 3,332
The next step is to determine the percentage of each sector serving
nonlocal needs. The formula for determining that percentage is:1
(1 - ) x 100% = percentage of theLQ community economy serving
nonlocal needs. This is only computed for sectors with a location quotient
greater than one (1), sectors with a LQ less than one (1) are assumed to serve
only local (non-export) markets.
For manufacturing, the proportion of manufacturing employment servingnonlocal needs is 1 - ¼ = ¾ = 75 percent. There were 1,500 workers employed
in Riverside manufactur ing plants. By multiplying 1,500 workers by 75 percent ,
we find 1,125 workers are serving nonlocal needs. Fifty percent of the workers
in the trade sector serve nonlocal needs (e.g., 1 - ½ = 50%). If we mult iply 50
percent by the number of workers in that sector , we get 916. We add the
number of workers in each sector serving nonlocal needs (1,125 + 916 = 2,041).
In other words, 2,041 workers in the Riverside economy are serving nonlocal
needs.
The employment multiplier is the total employment divided by the
employment serving nonlocal needs (i.e., export).
Total EmploymentEmployment Multiplier
Export Employment
3,3321.63
2,041
72

8/2/2019 Community Economic Analysis
http://slidepdf.com/reader/full/community-economic-analysis 79/97

8/2/2019 Community Economic Analysis
http://slidepdf.com/reader/full/community-economic-analysis 80/97

8/2/2019 Community Economic Analysis
http://slidepdf.com/reader/full/community-economic-analysis 81/97

8/2/2019 Community Economic Analysis
http://slidepdf.com/reader/full/community-economic-analysis 82/97
Bibliography
Note to the Dedicated R eader of Bibliographies
The following list of readings may at first appear unusual since some of the
papers seem to contradict each other and in some cases present a strong
argument that the tool does not accomplish its stated purpose. However, the
purpose of the bibliography is: 1) to give the reader more detailed insight aboutthe tool and 2) to create some sensitivity to misuse and misinterpretation of the
tool. This is to highlight the still imperfect understanding we have of
community economic analysis. Many users of this manual will need to push
ahead with imperfect data and tools, but we hope with a little better
understanding of what they are doing.
Export Base/ Multipliers
Salant, Priscilla. 1990. A Comm unity Researcher's Guide to Rural Data.
Washington, D.C.: Island Press and The Aspen Institute.
Export Base/ Multipliers
Bendavid, Avrom. 1974. "Introduction to Economic Base Theory and Method."
Chapter 4. Regional Economic Analysis for Practit ioners. N ew York: Praeger.
Braschler, Curtis, John A. Kuehn and John Croll. 1977. The Community
Economic Base: How to Compute, Evaluate and Use. Guide DM 3005.
Columbia, MO: University of Missouri Extension.
Erickson, Rodney A. 1978. "Purchasing Patterns and the Regional Trade
Multiplier." Growth and Change 9 (April):49-51.
Gibson, Lay James and Marshall A. Warden. 1981. "Estimating the Economic
Base Multiplier: A Test of Alternative Procedures." Economic Geography
57:146-159.
Gordon, John and David Mulkey. 1978. "Income Multipliers for Community
Impact Analysis—What Size is Reasonable?" Journal of the Comm unity
Development Society 9 (Fall):85-93. 76

8/2/2019 Community Economic Analysis
http://slidepdf.com/reader/full/community-economic-analysis 83/97

8/2/2019 Community Economic Analysis
http://slidepdf.com/reader/full/community-economic-analysis 84/97

8/2/2019 Community Economic Analysis
http://slidepdf.com/reader/full/community-economic-analysis 85/97
Development. Grand Forks, ND: University of North Dakota, Bureau of
Business and Economic Research.

8/2/2019 Community Economic Analysis
http://slidepdf.com/reader/full/community-economic-analysis 86/97

8/2/2019 Community Economic Analysis
http://slidepdf.com/reader/full/community-economic-analysis 87/97

8/2/2019 Community Economic Analysis
http://slidepdf.com/reader/full/community-economic-analysis 88/97

8/2/2019 Community Economic Analysis
http://slidepdf.com/reader/full/community-economic-analysis 89/97

8/2/2019 Community Economic Analysis
http://slidepdf.com/reader/full/community-economic-analysis 90/97
Miernyk, William H. 1965. The Elements of Input-Output Analysis, New York:
Random House.
Richardson, Harry W. 1972. Input-Output and Regional Economics, New York:
H alstead Press.
84

8/2/2019 Community Economic Analysis
http://slidepdf.com/reader/full/community-economic-analysis 91/97
Index
Page
A:
Aids from government units . . . . . . . . . . . . . . . . . . . . . . . . . . . . . . . . . . . 6, 7, 34Average employment multiplier . . . . . . . . . . . . . . . . . . . . . . . . . . . . . 8-11, 52-54B:
Basic sector . . . . . . . . . . . . . . . . . . . . . . . . . . . . . . . . . . . . . . . . . . . . . . . . . . . . 6, 7C:
Community competitive share (see competitive share)Community economic questions . . . . . . . . . . . . . . . . . . . . . . . . . . . . . . . . . . . 4-5Community economy simplified . . . . . . . . . . . . . . . . . . . . . . . . . . . . . . . . . . . . 2Community improving its capacity to keep local dollars . . . . . . . . . . . . . . . 23-24
Community industrial mix component (see industrial mix component)Community national growth component (see national growth component)Community trade area (also see Reilly 's Law) . . . . . . . . . . . . . . . . . . . . . . . 15-16Compet it ive share component (CS) . . . . . . . . . . . . . . . . . . . . . . . . . 32-33, 51-52
calculation of . . . . . . . . . . . . . . . . . . . . . . . . . . . . . . . . . . . . . . . . . . 33, 51-52interpretation of . . . . . . . . . . . . . . . . . . . . . . . . . . . . . . . . . . . . . . . . 32-33, 52
Creation of new firms . . . . . . . . . . . . . . . . . . . . . . . . . . . . . . . . . . . . . . . . . . 7, 34Customers drawn to a community . . . . . . . . . . . . . . . . . . . . . . . . . . . . . . . . 20-21D:
Data for economic analysis . . . . . . . . . . . . . . . . . . . . . . . . . . . . . . . . . . . . . . . . 4-5Demand thresholds . . . . . . . . . . . . . . . . . . . . . . . . . . . . . . . . . . . . . . . . . . . . . . 30Dollar turnover . . . . . . . . . . . . . . . . . . . . . . . . . . . . . . . . . . . . . . . . . . . . . . . 13-14E:
Economic development alternatives . . . . . . . . . . . . . . . . . . . . . . . . . . . . . . . . . 6-7Economic sector, definition of . . . . . . . . . . . . . . . . . . . . . . . . . . . . . . . . . . . . . . 4Efficiency of firms (see also shift share analysis) . . . . . . . . . . . . . . . . . 7, 30-31, 3485

8/2/2019 Community Economic Analysis
http://slidepdf.com/reader/full/community-economic-analysis 92/97

8/2/2019 Community Economic Analysis
http://slidepdf.com/reader/full/community-economic-analysis 93/97
Employment multiplier . . . . . . . . . . . . . . . . . . . . . . . . . . . . . . . . . . . . 8-11, 52-54calculation of . . . . . . . . . . . . . . . . . . . . . . . . . . . . . . . . . . . . . . 8, 10-11, 52-54interpretation of . . . . . . . . . . . . . . . . . . . . . . . . . . . . . . . . . . . . . . . . . . . . . 54
Estimating community trade area (see also Reilly's Law) . . . . . . . . . . . . . . . 15-16Export businesses . . . . . . . . . . . . . . . . . . . . . . . . . . . . . . . . . . . . . . . . . . . . . . 5-7, 9Export employers, attraction of . . . . . . . . . . . . . . . . . . . . . . . . . . . . . . . . . . . 7, 8Export employment, determination of . . . . . . . . . . . . . . . . . . . . . . . . . . . . . . 9-11Export multiplier . . . . . . . . . . . . . . . . . . . . . . . . . . . . . . . . . . . . . . . . . . . . . . . . . 8Export sector . . . . . . . . . . . . . . . . . . . . . . . . . . . . . . . . . . . . . . . . . . . . 5, 7-8, 9-11F:
Feasibility of trade and service sectors (see location quotients,population-employment ratios and demand thresholds).
Firm creation . . . . . . . . . . . . . . . . . . . . . . . . . . . . . . . . . . . . . . . . . . . . . . . . . 7, 34Firm efficiency (also see shift share analysis) . . . . . . . . . . . . . . . . . . . 7, 30-31, 34I:
Improving efficiency of local firms . . . . . . . . . . . . . . . . . . . . . . . . . . . . . . . . . . 34Income and employment changes in communit ies . . . . . . . . . . . . . . . . . . . . . . . 4Income flows out of the community . . . . . . . . . . . . . . . . . . . . . . . . . . . . . . . 2, 5-6Income multipliers . . . . . . . . . . . . . . . . . . . . . . . . . . . . . . . . . . . . . . . 11-12, 54-55
calculation of . . . . . . . . . . . . . . . . . . . . . . . . . . . . . . . . . . . . . . . 11-12, 54-55interpretation of . . . . . . . . . . . . . . . . . . . . . . . . . . . . . . . . . . . . . . . . . . 12, 55
Industrial mix component . . . . . . . . . . . . . . . . . . . . . . . . . . . . . . . . . 31-32, 50-51calculation of . . . . . . . . . . . . . . . . . . . . . . . . . . . . . . . . . . . . . . . . . . . . 33, 50interpretation of . . . . . . . . . . . . . . . . . . . . . . . . . . . . . . . . . . . . . . . . . . 33, 51
Input-output analysis . . . . . . . . . . . . . . . . . . . . . . . . . . . . . . . . . . . . . . . . . . . 9, 35J:
Job and income growth, ways to st imulate . . . . . . . . . . . . . . . . . . . . . . 6-7, 34-35K:
Keeping local dollars in community . . . . . . . . . . . . . . . . . . . . . . . . . . . . . . . 23-25
L:
Leakage of money from local economy . . . . . . . . . . . . . . . . . . . . . . 2, 5-6, 23-26Location quotients . . . . . . . . . . . . . . . . . . . . . . . . . . . . . . . . . . 10-11, 25-28, 45-47
calculation of . . . . . . . . . . . . . . . . . . . . . . . . . . . . . . . . . . . . . . . . . 26, 27, 46interpretation of . . . . . . . . . . . . . . . . . . . . . . . . . . . . . . . . . . . . . . . . 25-28, 47
M:87

8/2/2019 Community Economic Analysis
http://slidepdf.com/reader/full/community-economic-analysis 94/97

8/2/2019 Community Economic Analysis
http://slidepdf.com/reader/full/community-economic-analysis 95/97
Marginal propensity to consumer locally (MPC ) . . . . . . . . . . . . . . 11-12, 54-55L
Multipliers, applicability of . . . . . . . . . . . . . . . . . . . . . . . . . . . . . . . . . . . . . . 14-15average employment mult iplier . . . . . . . . . . . . . . . . . . . . . . . . . . 8-11, 52-54employment multiplier . . . . . . . . . . . . . . . . . . . . . . . . . . . . . . . . 8-11, 52-54income multiplier . . . . . . . . . . . . . . . . . . . . . . . . . . . . . . . . . . . . 11-12, 54-55marginal employment multiplier . . . . . . . . . . . . . . . . . . . . . . . . . . . . . . . . . 9misuse of multipliers . . . . . . . . . . . . . . . . . . . . . . . . . . . . . . . . . . . . . . . 13-15
N :
National growth component (NG) . . . . . . . . . . . . . . . . . . . . . . . . 31, 33-34, 48-50calculation of . . . . . . . . . . . . . . . . . . . . . . . . . . . . . . . . . . . . . . . 31, 33, 49-50interpretation of . . . . . . . . . . . . . . . . . . . . . . . . . . . . . . . . . . . . . . . 31, 33, 50
N ew firm creation . . . . . . . . . . . . . . . . . . . . . . . . . . . . . . . . . . . . . . . . . . . . . 7, 34N onlocal markets link to local economy . . . . . . . . . . . . . . . . . . . . . . . . . . . . . 5-6P:
Payments from government units . . . . . . . . . . . . . . . . . . . . . . . . . . . . . . . 6, 7, 34Percentage of money spent locally
that becomes local income (PSY) . . . . . . . . . . . . . . . . . . . . . . . . 11-13, 54-55Populat ion-employment rat io . . . . . . . . . . . . . . . . . . . . . . . . . . . . 25, 28-29, 47-48
calculation of . . . . . . . . . . . . . . . . . . . . . . . . . . . . . . . . . . . . . . . . . . 28-29, 48interpretation of . . . . . . . . . . . . . . . . . . . . . . . . . . . . . . . . . . . . . . . . . . 29, 48
Potential sales . . . . . . . . . . . . . . . . . . . . . . . . . . . . . . . . . . . . . . . . . . . 24-25, 44-45calculation of . . . . . . . . . . . . . . . . . . . . . . . . . . . . . . . . . . . . . . . . . . 24-25, 45interpretation of . . . . . . . . . . . . . . . . . . . . . . . . . . . . . . . . . . . . . . . . . . 25, 45
Pull factors . . . . . . . . . . . . . . . . . . . . . . . . . . . . . . . . . . . . . . . . . . . . . . . . 21-23, 43calculation of . . . . . . . . . . . . . . . . . . . . . . . . . . . . . . . . . . . . . . . . . . 22, 43-44interpretation of . . . . . . . . . . . . . . . . . . . . . . . . . . . . . . . . . . . . . . . . . . 23, 44
R:
Reilly's Law . . . . . . . . . . . . . . . . . . . . . . . . . . . . . . . . . . . . . . . . . . . . 16-20, 39-41calculation of . . . . . . . . . . . . . . . . . . . . . . . . . . . . . . . . . . . . . . . . . . 17-19, 40interpretation of . . . . . . . . . . . . . . . . . . . . . . . . . . . . . . . . . . . . . 17-19, 40-41limitations of . . . . . . . . . . . . . . . . . . . . . . . . . . . . . . . . . . . . . . . . . . . . . 19-20
Retail trade (see Reilly's Law, trade area capture, pull factors
and other analysis tools listed in this manual).S:
Sales data . . . . . . . . . . . . . . . . . . . . . . . . . . . . . . . . . . . . . . . . . . . . . . . . . . . . . . 25Sales, potential (see potential sales)Sector (see economic sector)Shift-share analysis . . . . . . . . . . . . . . . . . . . . . . . . . . . . . . . . . . . . . . . 31-34, 48-52
89

8/2/2019 Community Economic Analysis
http://slidepdf.com/reader/full/community-economic-analysis 96/97

8/2/2019 Community Economic Analysis
http://slidepdf.com/reader/full/community-economic-analysis 97/97
Social Security . . . . . . . . . . . . . . . . . . . . . . . . . . . . . . . . . . . . . . . . . . . . . 7, 11, 34Standard industrial classification code (SIC) . . . . . . . . . . . . . . . . . . . . . . 4, 28, 46T:
Trade area capture . . . . . . . . . . . . . . . . . . . . . . . . . . . . . . . . . . . . . . . 20-21, 41-43calculation of . . . . . . . . . . . . . . . . . . . . . . . . . . . . . . . . . . . . . . . . . . . . 20, 42interpretation of . . . . . . . . . . . . . . . . . . . . . . . . . . . . . . . . . . . . . . . . 21, 42-43
Trade area of a community . . . . . . . . . . . . . . . . . . . . . . . . . . . . . . . . . . . . . . 15-16T rade potential, determination of . . . . . . . . . . . . . . . . . . . . . . . . . . . . . . . . . 25-26Turnover (see dollar turnover)