Embed Size (px)
Citation preview

The SITECO Cost Efficiency Calculator
In General
The Siteco Cost Efficiency Calculator is a web application for evaluating the costefficiency of two outdoor lighting installations.
The installations ('comparison facility and 'new facility') can be compared to each other overa variable service life in terms of investment costs and operating costs.For evaluating cost efficiency the amortisation of an investment over the service life iscalculated both statically and dynamically and displayed in figures and tables.
The Siteco Cost Efficiency Calculator is
- available in the Customer Service Centre for registered users. The projects of the userare centrally saved on the Siteco server under his partner number and can subsequentlybe called up at any time or deleted
- generally available on the Siteco internet page under 'Planning Tools'.Here deleting is not possible but all other functions are available.
For each project, a comparison of two installations ('comparison facility and 'new facility ') ispossible.
Note on navigation
Via the navigation bar above you can change between the individual input and output pagesof the application. You do not have to follow a specific sequence, but you must note thatwithout corresponding entries, the output pages will show no results.The current page is highlighted in green in the navigation bar.Alternatively to using the navigation bar you jump backwards and forwards a page with'Forward' or 'Back'.
The application is divided into input pages for inputting data, and output pages that conciselyshow you the results.
Input pages are:- Main data- Investment costs- Operating costs without energy- Energy costsOutput pages are:

- Cost overview- Cost graphic- CO2 graphic- Amortization graphic
Please note:
- Entered values are only saved when you move on to a new page!
- Numerical values (e.g. percentage values) can be entered in the form of 'x.y' (with adot) and 'x,y' (with a comma). In the latter case the value is converted to the firstform when the field is completed.
- Via the 'Help' link at top right you have a PDF document with suggestions forspecific input fields.
Note:With the project shown on the following pages, this concerns a real project. Theentered values (fictitious) are only for operating the program though.
1. New / load
1.1 My projects
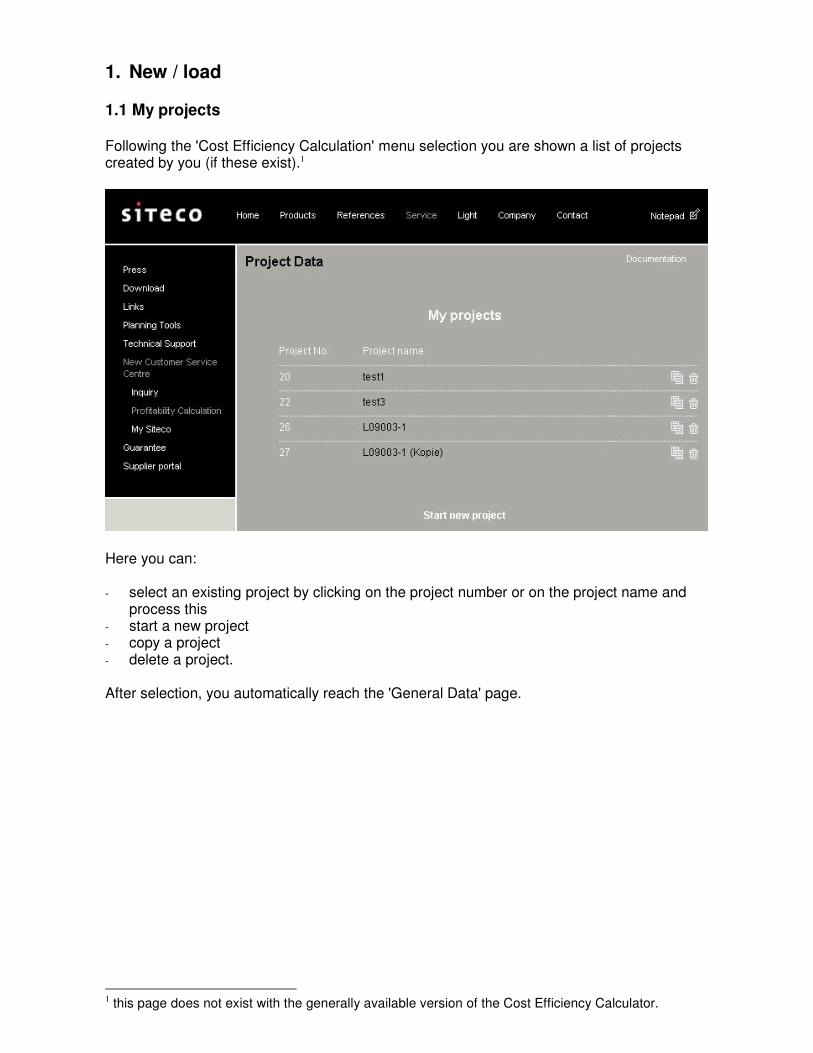
Following the 'Cost Efficiency Calculation' menu selection you are shown a list of projectscreated by you (if these exist).1
Here you can:
- select an existing project by clicking on the project number or on the project name andprocess this
- start a new project- copy a project- delete a project.
After selection, you automatically reach the 'General Data' page.
1 this page does not exist with the generally available version of the Cost Efficiency Calculator.

2. Main data
2.1 General project data
Here you can:
- Assign a project name- Fill in the ‚Owner‘, 'Planning company', and 'Planning agent' and the corresponding
contact fields.
The entries in the right-hand column are read out from your customer data (if these exist)and are automatically displayed. You can however overwrite the fields at any time; themodified entries are then saved in this project.
The project number is automatically assigned by the system.

2.2 Main data for dynamic calculation
Enter the data here that are needed for dynamic amortisation:- Yearly rate of inflation (%)- Rate of price increases for electricity (%)- General interest rate (%)
3. Investment costs
Enter the investment costs here for the 'comparison facility' (i.e. the old installation) and the'new facility'.
If when the 'Article No.' field is left the entered article number is found in the electroniccatalogue, corresponding data (e.g. designation, no. of lamps/luminaires, price/luminaire) are
determined from the luminaire data and entered into the corresponding fields on this pageand the following pages.2
The values can be manually modified and saved afterwards at any time.The investment costs of the installations are automatically calculated again if a field entry ischanged.In the above example the modernisation of an existing installation with new luminaires isassessed, the price/luminaire on the left is therefore 0.00 EUR.In order to be able to economically compare the old installation over many years with thenew installation, new lamps are fitted in the old installation.
Save all your entries by navigating to another page with 'Forward' or 'Back' or via thenavigation bar above.
2 only empty fields are automatically filled. Click on ‚Delete entries‘ to delete all field entries in the input mask.

4. Operating costs without energy
Article number and designation are displayed on this page for information purposes; thesecannot be modified.
Enter the operating costs for the 'comparison facility' (i.e. the old installation) on the left andfor the 'new facility‘ on the right.
Vales that are automatically calculated- total count of lamps- operation costs without energy costs on average (static calculation)- operation costs without energy costs on average (dynamic calculation)
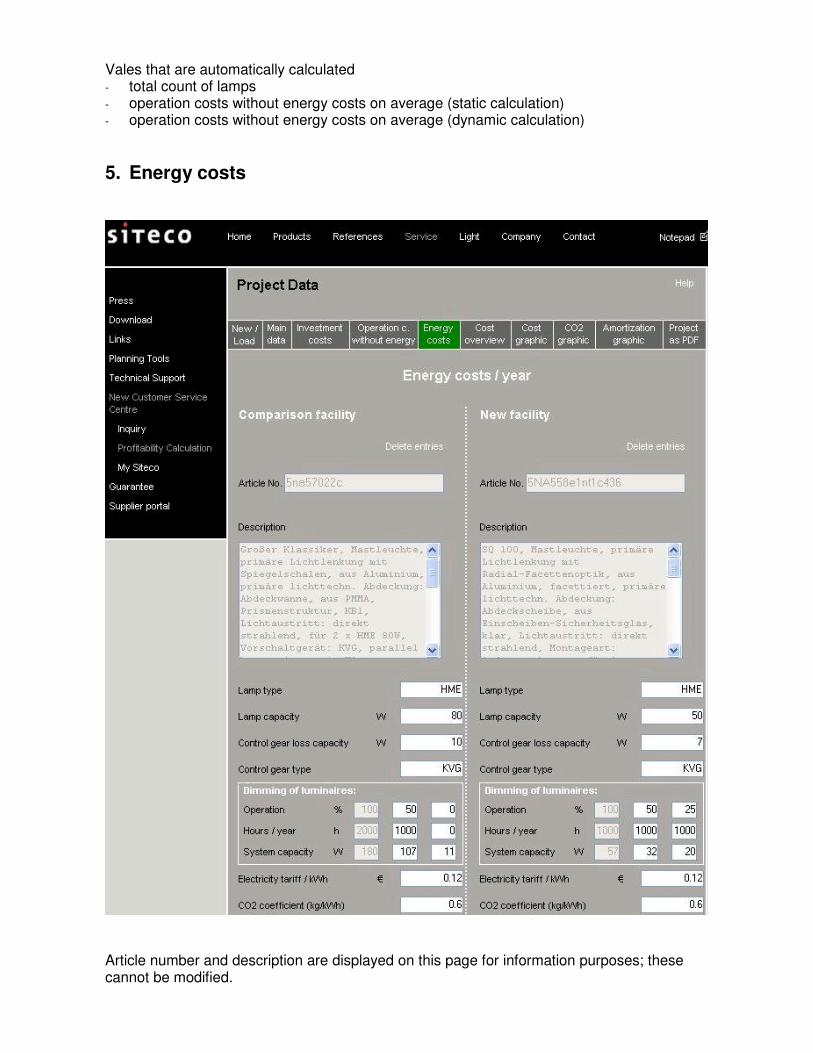
5. Energy costs
Article number and description are displayed on this page for information purposes; thesecannot be modified.

Enter the required data for the 'comparison facility' (i.e. the old installation) on the left and forthe 'new facility' on the right.Lamp capacity and loss capacity of the control gear are added to the lamp system capacity.
Dimming of luminaires
The first column cannot be edited. The following values are preset:- operation: 100% (i.e. not dimmed)- hours / year: the previously entered yearly number of operational hours.- system capacity (of the luminaire): product of lamp number / luminaire and the lamp
system capacity (see above)
The columns in the middle and on the right can be used to integrate regular dimming periods.
In the above example a third of the 'comparison installation' is to be operated at 50%.The '50' entry is only for documentation purposes and does not represent a calculative value.Decisive for the calculation is the 'Time period / year' - here set to 1000 hours - and the(luminaire) system capacity that with 50% operation must be determined from themanufacturer's data.
The 'new facility' in the above example is operated to a third in each case with 25%, 50%and 100% power .
Suggestions for the electricity price and the location-dependent C02 factor can be called upvia the 'Help' link at top right.
Factors to be calculated:- Power input of facilities- Energy consumption / year (under consideration of possible dimming)- CO2 emission of facilities / year- Energy costs per year on average (static and dynamic)

6. Cost overview
On the 'Cost overview' output page you can switch between static and dynamic view (C3/C4method) in the expanded navigation bar.
6.1 Static view
In the cost overview, the individual cost positions and CO2 emission are compared inabsolute and percentage terms.With static analysis the 'linear depreciation of the facility' is defined from the costs forluminaires added to the mounting costs and this is spread across the years of service life.In the comparison facility example, no new luminaires were installed.

6.2 Dynamic view (C3 method)
Note on C3 method
The saved operating costs over the service life are calculated.
- The end value is used for calculating, i.e. it is specified which value has been achieved per yearvia the added investment (for the new installation).
- The end value is defined from the sum of the saved operating costs; these are accumulated asrates of an exponentially increasing benefit with the calculation interest rate to the final point oftime.
- The profitability rate of return is the dissolution of the general compound interest according to therate of interest.

6.3 Dynamic view (C4 method)
Note on C4 method
The saved operating costs, less the accumulated investment costs, represent the surplus amountcompared to general capital interest.
- The end value is used for calculating, i.e. it is specified which value has been achieved per yearvia the added investment (for the new installation).
- The end value is defined from the sum of the saved operating costs; these are accumulated asrates of an exponentially increasing pension with the calculation interest rate to the final point oftime.
- Finally the end value is reduced by the use of the required added investments under considerationof the interest rate to be applied.
- The profitability rate of interest is the dissolution of the general compound interest according to therate of interest.

7. Cost graphic
7.1 Static view
The figure represents total annual costs with its components of 'linear depreciation of thefacility, 'operation costs without energy costs' and 'energy costs'.

7.2 Dynamic view (C3)
The figure shows pure operating costs accumulating during the complete service life.

7.3 Dynamic view (C4)
The figure shows operating costs and the accumulated investment costs that have comeabout during the complete service life.

8. CO2
The CO2 figure shows yearly CO2 emissions caused by operation of both facilities.

9. Amortization graphic
9.1 Static view
This figure shows the time point for static amortisation.In the example the added investment costs of the 'new facility are balanced by the loweroperating costs after 9.37 years. From then onwards the 'net use‘ is positive.

9.2 Dynamic view (C3 method)
This figure represents the course of operating cost savings and monetary return over theservice life.

9.3 Dynamic view (C4 method)
This figure represents the course of amortisation and monetary return over the service life.With this dynamic analysis, amortisation of the new installation is achieved already after 9.00years.

10. Project as PDF
By clicking on 'Project as PDF' a PDF file is generated containing all data and results of theproject.
Here is the first page:
You can use this PDF document for saving to your hard disk or for printing.


![Atrium Siteco Mirrortech System · 150 200 300 500 750 Illuminance [lx] ... 1.3.4 Isolines representation, ... Siteco Mirrortech-System: Atrium: 11/2013](https://img.pdfslide.us/doc/110x75/5b598dc07f8b9a6c4f8d5f14/atrium-siteco-mirrortech-150-200-300-500-750-illuminance-lx-134-isolines.jpg)