Embed Size (px)
Citation preview
Scholars' Mine Scholars' Mine
Masters Theses Student Theses and Dissertations
1965
The shear graph and cohesive soil The shear graph and cohesive soil
Charles Rees Nickerson
Follow this and additional works at: https://scholarsmine.mst.edu/masters_theses
Part of the Civil Engineering Commons
Department: Department:
Recommended Citation Recommended Citation Nickerson, Charles Rees, "The shear graph and cohesive soil" (1965). Masters Theses. 7011. https://scholarsmine.mst.edu/masters_theses/7011
This thesis is brought to you by Scholars' Mine, a service of the Missouri S&T Library and Learning Resources. This work is protected by U. S. Copyright Law. Unauthorized use including reproduction for redistribution requires the permission of the copyright holder. For more information, please contact [email protected].

THE SHEAR GBAPH AND COHESIVE SOIL
BY
CHARLES REES NICKERSON
A
THESIS
submitted to the faculty of the
UNIVERSITY OF MISSOURI AT ROLLA
in partial fulfillment of the requirements for the
Degree of
MASTER OF SCIENCE • CIVIL ENGINEERING
Rolla, Missouri
1965
Approved by
1/ !
'1 ~ .J. ?"'1 (adviso£r--- _,.,.........,..___....__.._,_.~........._-
~·~ ~c,~

ii
ABSTRACT
Some existing test procedures for measuring shearing properties
of soils are reviewed. The correlation between the shear strength
of two fine-grained soils as indicated by the unconfined compression
test and the shear graph test is investigated. This is accomplished
by comparing the test results at varying moisture contents and dry
densities. One of the soils used is a red plastic clay, the other
a silty clay. The test results indicate that for soils wet of op
timum the shear graph strength can be taken as being equal to the
unconfined compressive strength. This will be conservative for soils
that exhibit an appreciable angle of internal friction. Two design
changes are suggested that would make the shear graph results more
reliable.

iii
ACKNOWLEDGMENT
The author expresses his appreciation to Dr. Thomas S. Fry
for his guidance and counsel during the preparation of this paper.
Acknowledgment is also due Professor John B. Heagler, Jr. for his
helpful recommendations and to Mr. Orrin Stemler for suggesting
the shear graph as a topic for research. Also, thanks to Mr.
Stemler and Paul Hustad for their aid in obtaining soil samples.
Special thanks go to Caterpillar Tractor Company for the use of
the shear graph to conduct this research and particularly to Mr.
Del Cobb of Soils Research.
Recognition is due my wife for her help and encouragement
have made this paper possible.

TABLE OF CONTENTS
ABSTRACT . . . .. . . . . . . . . . . . . . . . . . .. . . . . . . . . . . . . . . . . . . . . . . . . ..... ACKNOWLEDGMENT .•...•..••..•....••.....•...................•
LIST OF FIGURES ••......•..................................•
LIST OF TABLES •....•..............•......................••
I. INTRODUCTION •.......•.................•.............•
II • TYPES OF SHEAR TESTS ••...•........•................••
III. TESTING AND MATERIALS
IV. DISCUSSION OF RESULTS
V. CONCLUSIONS ••.......................................•
VI. RECOMMENDATIONS .•...•.........•.................•...•
APPENDIX Ao THEORY OF SOIL FAILURE WITH THE SHEAR GRAPH .••
APPEND IX B. DATA • . . . . . . . • . . • . . . . . . . . . . . . . . . . . . . . . . . . . . . ..•
BIBLIOGRAPHY ••...•.•............•..•.....................••
VITA ••.................................•.................••
iv
Page
ii
iii
v
vi
1
3
15
20
39
40
41
46
54
57

Figure
1
2
3
4
5
6
7
8
9
10
11
12
13
14
15
16
17
18
19
20
21
LIST OF FIGURES
DIRECT SHEAR TEST ••..•.......••.•.••.••••.••••••
TRIAXIAL TEST • • . • . . . . . • . . . . • . . . . . • . . • . • . . • . . • . . .
VANE SHEAR APPARATUS •••.•••..•••.•••••.•.•••••••
sHEAR GRAPH • . I • • • • • • • • • • • • • • • • • • • • • • • • • • • • • • • • • •
SHEAR GRAPH RESULTS ••...•.•.•.•••••••••.••.•••••
EFFECTS OF COMPACTION ON STRUCTURE ••..••••.••.••
UNDISTURBED RED PLASTIC CLAY
UNDISTURBED RED PLASTIC CLAY
UNDISTURBED RED PLASTIC CLAY
.................... • 0 ••••••• 0 ••••••••••
................... REMOLDED RED PLASTIC CLAY
REMOLDED RED PLASTIC CLAY
......................
...................... REMOLDED RED PLASTIC CLAY ••....•..•.••...••••.•
REMOLDED RED PLASTIC CLAY •••.•.••..•.••.•.••.••
UNDISTURBED SILTY CLAY •..•..•..•••.•••••.••.•••
UNDISTURBED SILTY CLAY ......................... UNDISTURBED SILTY CLAY •••••••• 0 ••••• 0 ••••••••••
REMOLDED SILTY CLAY ••.•••••.•••.••.•..•••••••••
REMOLDED SILTY CLAY •••....•••••..••.•••.••...••
REMOLDED SILTY CLAY o •••••••••••••••••••• • ••• • • •
REMOLDED SILTY CLAY o •••••••••••••••••••• • ••• • • •
STRESS DISTRIBUTION •..•.••...•.....•.........••
v
Page
4
7
9
12
14
22
24
25
26
26
28
29
30
31
31
33
33
34
35
36
43

Table
I.
II.
III.
IV.
v.
LIST OF TABLES
PHYSICAL PROPERTIES OF THE SOILS •.•.•••.••..••••
UNDISTURBED RED PLASTIC CLAY (DATA) •......••••••
REMOLDED RED PLASTIC CLAY (DATA) ••··········••••
UNDISTURBED SILTY CLAY (DATA) ••••·••••••••·•·•••
REMOLDED SILTY CLAY (DATA) •..•...••..•••••••••••
vi
)?age
17
47
50
52
53

I. INTRODUCTION
Because of the complicated structure and composition of soils,
the stress and strain relations are not as simple as for other fa
miliar materials. Soils seldom fail due to simple tensile or com
pressive stresses. The stresses in a soil mass at failure are a
critical combination of both normal and shear stresses.(l) The
shear strength of a soil is a controlling factor in the design of
retaining walls, embankments, bracing for excavations, foundations,
and for efficiency evaluations of construction equipment. If the
soil shear strength is exceeded, a failure in the soil mass will
occur and result in inefficient construction operations and may
even endanger lives and property.
Several pieces of equipment and test procedures have been used
to measure the shear strength of soil. The principal shear tests in
use today are the direct, torsional, triaxial, and shear vane test.
A new device, called the shear graph, has been developed for measur
ing the shear strength of soils in situ. These tests and devices
are explained and discussed under the heading of types of shear
tests.
The shear graph has been used and proven to be a fairly reli
able method of evaluating the shearing characteristics of granular
soils. However, the shear graph results have not been compared to
a proven method of determining shear strength for cohesive or fine
grained soils. The objective of this research is to investigate the
correlation between the shear strength as indicated by the shear

graph and the shear strength as determined from the unconfined com
pression test.
2

II. TYPES OF SHEAR TESTS
During the past forty years a variety of tests have been de
veloped for the purpose of evaluating the shear strength of soils.
The first test used was the direct shear test, of which there are
two classes, the translatory shear and torsional shear. These
tests require the application of a normal stress and the measure
ment of a shear stress on a known failure plane.(2,3)
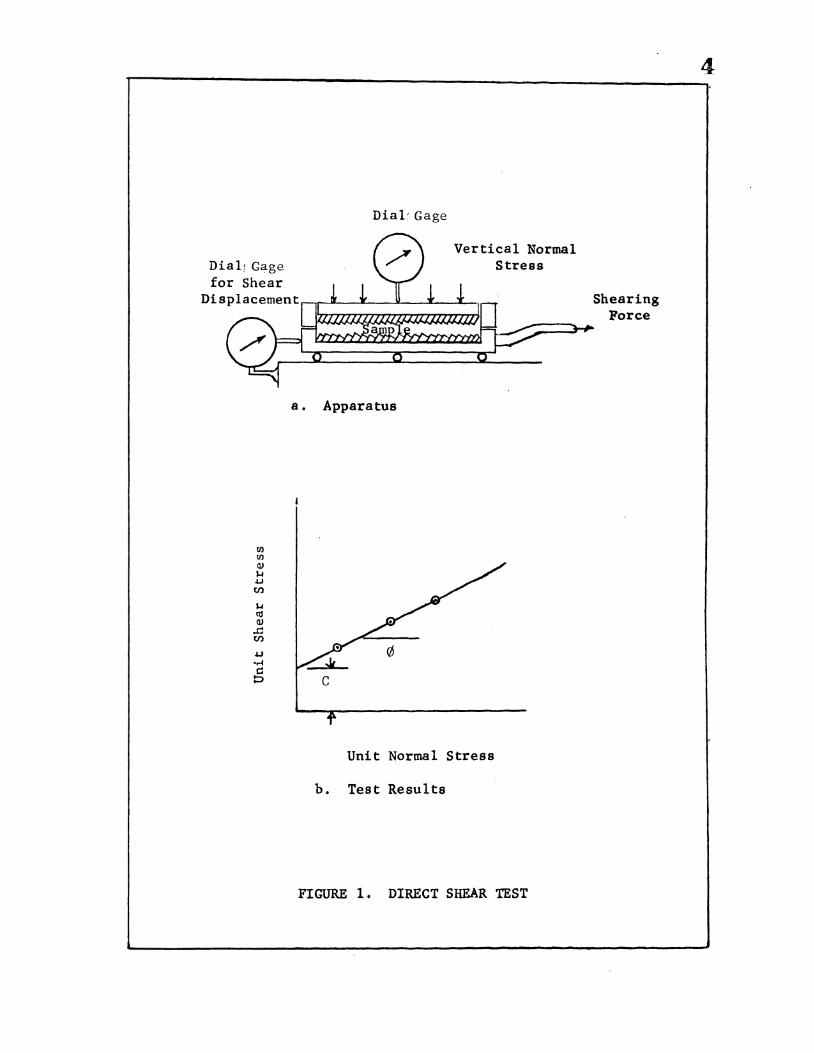
The translatory shear test requires that a vertical load be
applied to the upper portion of the apparatus which is fixed, while
the lower is forced in the horizontal direction until failure. A
direct shear device is shown in Figure la. The torsional shear test
is similar to the translatory except that the moving part of the
mechanism is rotated to obtain failure in a horizontal plane. To
determine the shear stress on the sample, the shear force is divided
by the shear area. The shear strength parameters of cohesion and
angle of internal friction are determined from a plot of shear and
normal stresses. This graph requires the performance of several
tests at different normal pressures for which the shear strength is
determined. A sample plot of test results is shown in Figure lb.
There are several advantages in using the direct shear test. The
apparatus is simple in construction, easy to operate and equipped
with drainage facilities which make the test a relatively fast one
when drained conditions are desired. Another advantage only with
the torsional shear test is that the cross sectional area of the
sample remains constant throughout the test.
3
4
Dial' Gage
Vertical Normal Dialr Gage Stress for Shear
Displacement Shearing Force
a. Apparatus
Unit Normal Stress
b. Test Results
FIGURE 1. DIRECT SHEAR TEST

The principal disadvantage of the translatory direct shear
test is that the cross sectional area of the sample changes with
changing strain. This varying area causes non-uniform stress dis
tributions on the failure surface bringing about a progressive
failure of the specimen. Some drainage will also occur in all
tests making it impossible to perform a truly quick test. All
direct shear tests using granular soils are drained tests since
drainage cannot be prevented. Another unfavorable factor in the
translatory test is the difficulty in preventing disturbance of
samples when fitting them to the irregular surfaces of the base
plates. Also, when testing at small normal loads, the moving
portion of the apparatus may ride over the sample making test
results unreliable. For these reasons the movement of the frame
and loading plate is not indicative of the true strains and volume
changes taking place on the failure plane.
The principal disadvantage of the torsional test is that the
stress, strain, and unit volume change are non-uniform from the
center of the specimen outward. This causes a variable distribu
tion of normal stresses on the plane of failure. These stress,
strain, and volume change variations make it difficult to correlate
the volume and stress changes to movements of the apparatus.
5
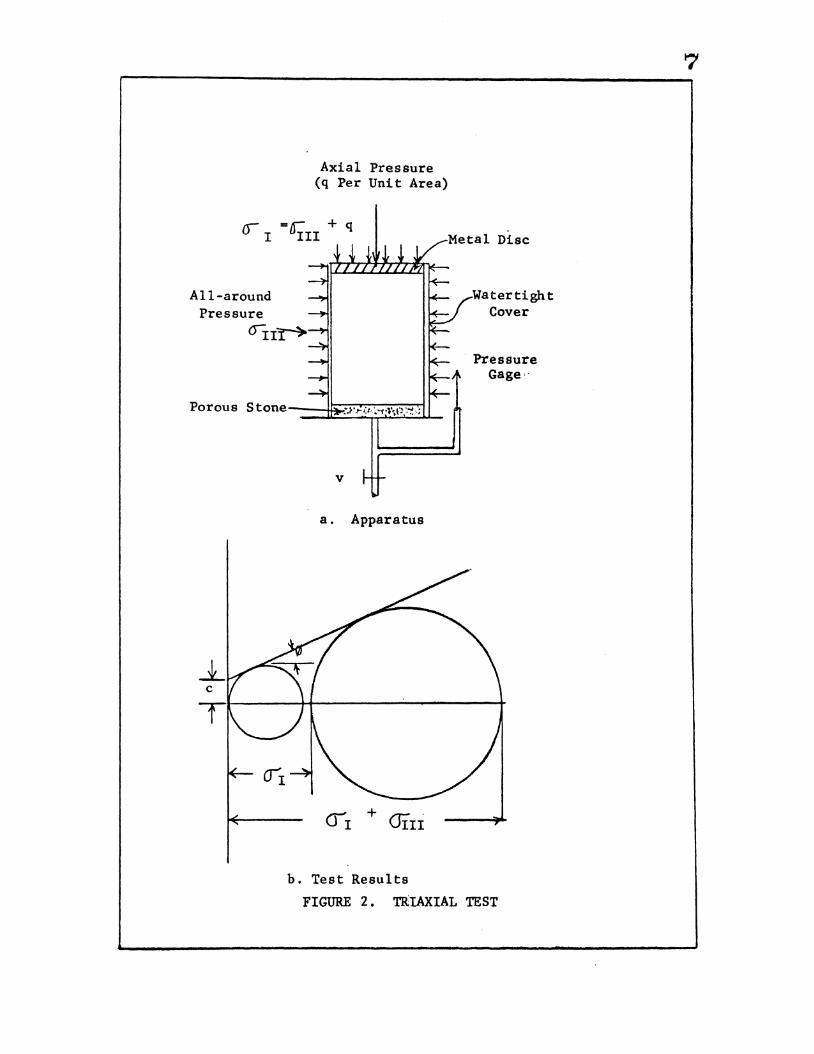
Triaxial compression tests were introduced into the field of
soil mechanics in the 1930's and are the most reliable of the shear
tests.(4) In this test a small cylindrical sample of soil is covered
with an impervious membrane, and placed within a pressure cell where
a fluid or air pressure is applied around the sample as illustrat~ in

Figure 2a. A vertical load is added until failure occurs on a
plane within the sample upon which a critical combination of the
normal and shearing forces exists. By the use of varying all
around pressures on a number of samples and determining the re
spective axial failure loads, a series of tests is completed and
a Mohr failure envelope can be plotted as shown in Figure 2b.
From this curve the shearing properties of cohesion and angle of
internal friction can be evaluated.
There are three basic types of triaxial tests including:
1) the Drained test in which the loading is performed slowly
enough to allow full drainage and consolidation of the specimen
during the application of the lateral and vertical pressures; 2)
the Consolidated-Undrained test in which the sample is allowed to
drain during the application of the all-around pressure, and then
further drainage is prevented as the vertical load is added; and
3) the Undrained or Quick test in which no drainage is permitted
during either stage of applying loads.(5) The choice of test to
be used for a given circumstance depends upon the conditions that
are likely to exist in the soil strata at failure.
One of the advantages of the triaxial test is that existing
stress conditions in the field often can be very closely simulated.
Also, the sample is free to fail in a weak zone, if there is one,
rather than along some forced failure plane. In the triaxial test
very accurate measurement of volume changes are possible and the
complete state of stress is known at all stages.
6
All-around Pressure
6l:ir~
Axial Pressure (q Per Unit Area)
v
a. Apparatus
Clr + O!II
b. Test Results
Disc
Watertight Cover
Pressure Gage··
FIGURE 2. TRIAXIAL TEST
7

8 Even though the triaxial test can simulate almost all possi
bilities of shearing failure in soil, it has the disadvantage of be
ing complicated and time consuming, where drainage is needed, because
of the relatively long drainage paths in the sample. Also, if the
failure zone intercepts the base or loading plate, a small amount of
error is introduced.
A third type of shear test is the shear vane test, the apparatus
of which is shown in Figure 3. ( 6) This test is performed by insert
ing a rod with blades attached at the extreme lower end into the soil
and twisting until failure occurs at the outer extremities of the
vanes. The moment required to rotate the vanes is proportioned by
the area sheared to give the shearing resistance on the plane of
failure. The normal force cannot be varied on the failure plane
making it impossible to divide the shearing stress into the compo
nents of cohesion and angle of internal friction. The vane test is
an Unconsolidated-Undrained or Quick test with the normal force on
the plane of failure being a function of the effective overburden
pressure. This makes the shear vane most reliable in clays which
when nearly 100% saturated have no angle of internal friction and
in which all of the shearing strength is due to cohesion. The main
advantage of this test is the ability to determine the shearing
strength of a soil strata in situ and is particularly applicable
to cases where the natural soil is too soft to obtain good undis
turbed samples for laboratory testing.C7)
A special case of the triaxial compression test is one in
which the lateral or all-around pressure is zero. Under this

I
I
I I I
I
H
\~
Torque
Ar
See A-A~ ~\ ..... ,~"T""t\1
W-...}....'---'-,\1 \
1\ ~
Shear • Torque
(n2H + n3) 7{- -2 . 6
FIGURE 3. VANE SHEAR APPARATUS
9
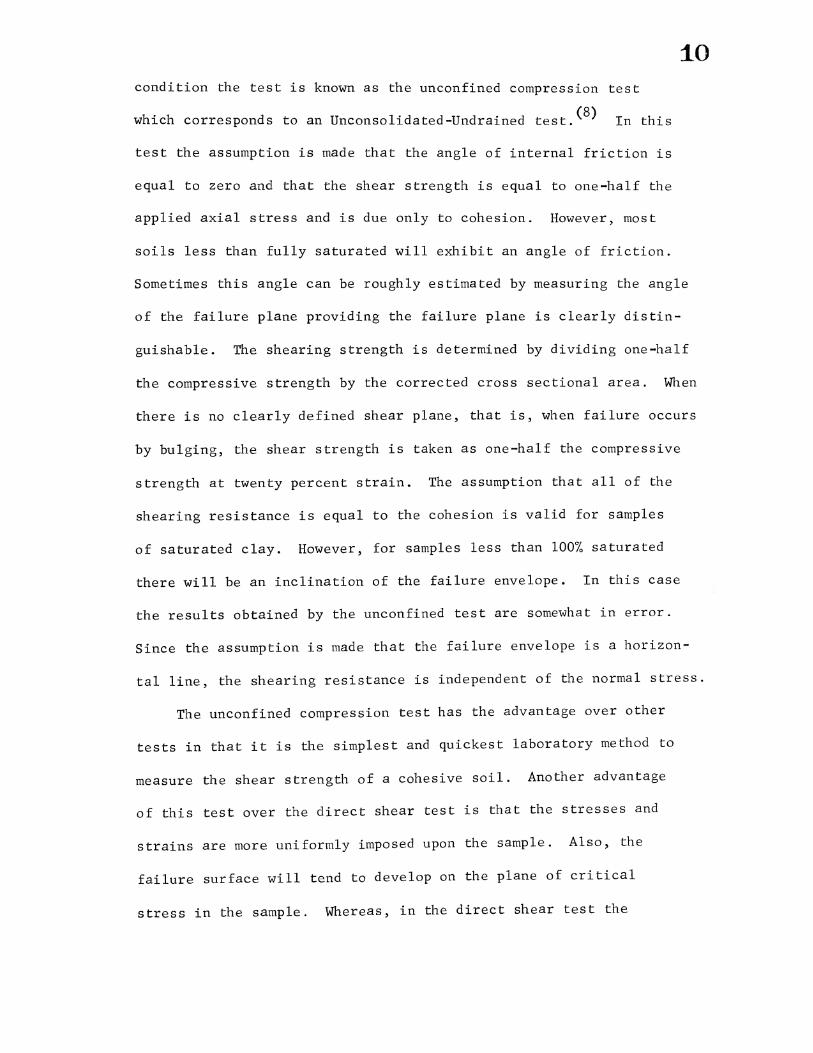
condition the test is known as the unconfined compression test
which corresponds to an Unconsolidated-Undrained test.(S) In this
test the assumption is made that the angle of internal friction is
equal to zero and that the shear strength is equal to one-half the
applied axial stress and is due only to cohesion. However, most
10
soils less than fully saturated will exhibit an angle of friction.
Sometimes this angle can be roughly estimated by measuring the angle
of the failure plane providing the failure plane is clearly distin
guishable. The shearing strength is determined by dividing one-half
the compressive strength by the corrected cross sectional area. When
there is no clearly defined shear plane, that is, when failure occurs
by bulging, the shear strength is taken as one-half the compressive
strength at twenty percent strain. The assumption that all of the
shearing resistance is equal to the cohesion is valid for samples
of saturated clay. However, for samples less than 100% saturated
there will be an inclination of the failure envelope. In this case
the results obtained by the unconfined test are somewhat in error.
Since the assumption is made that the failure envelope is a horizon
tal line, the shearing resistance is independent of the normal stress.
The unconfined compression test has the advantage over other
tests in that it is the simplest and quickest laboratory method to
measure the shear strength of a cohesive soil. Another advantage
of this test over the direct shear test is that the stresses and
strains are more uniformly imposed upon the sample. Also, the
failure surface will tend to develop on the plane of critical
stress in the sample. Whereas, in the direct shear test the

11 failure plane is forced along a predetermined surface which may not
be the critical plane.
One of the latest developments in equipment to measure the shear
strength of a soil is the shear graph. This instrument was introduced
in the early fifties by two Englishmen as a device for measurina the d
shear strength of a soil in situ.<9) This mechanism developed by
Payne and Fountaine is a combination of a shear vane test and a
direct shear test. The device consists of a large shear head with
attached vanes for shearing the soil and a calibrated handle to
measure the torque necessary for failure. Weights are added onto
the shear head to provide a normal force on the plane of failure.
Unconsolidated-Undrained conditions exist as this test is performed
on clays because no time is allowed for drainage while applying the
normal and shearing forces. In granular soils the test will be a
Consolidated-Drained test because drainage cannot be prevented.
Although portable,Payne's device requires a great deal of sample
preparation and the necessary weights are quite cumbersome. Mr.
G. T. Cohron refined the design using the same principles and de
(10) veloped the shear graph, shown in Figure 4. To make the shear
graph easily hand operated, he decreased the size of the shear head,
and replaced the weights by a spring. The spring is calibrated for
both normal and torsional properties to indicate both normal load
and the torsional shear stress on the plane of failure. To make the
shear graph self recording, a scribe is attached to the shear head
extending upward to the recording drum where it marks on sensitized
graph paper.

12
Handle
Recording Drum
~Shear Head
FIGURE 4. SHEAR GRAPH

The shear graph is similar in operation to the torsional di
rect shear test, with the mass of soil acting as the rigid base and
the shear head behaving as the moving part. The shear graph test is
a stress controlled test because there is no provision made for meas
uring strains. The theory of soil failure, with the shear graph,
used for calibration is attached in Appendix A.
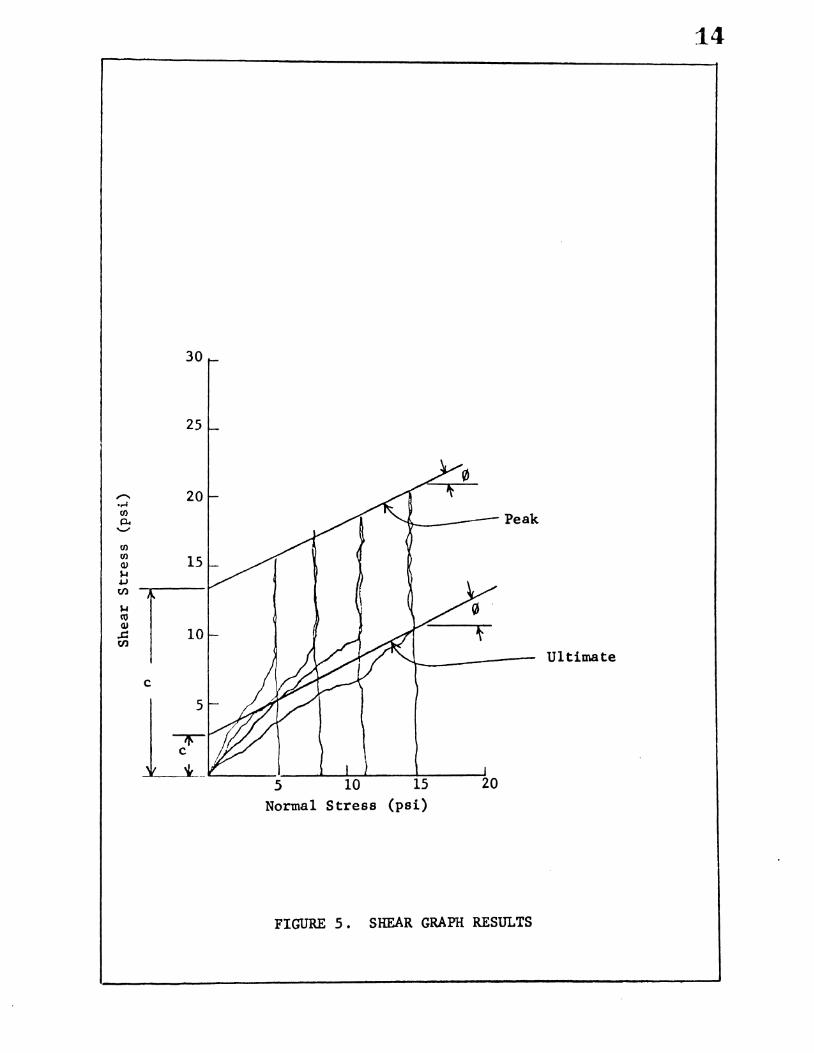
The shear graph is used at varying normal pressures to obtain
a Mohr failure envelope as illustrated in Figure 5. From this
failure envelope the cohesion and coefficient of internal friction
are obtained enabling the calculation of shearing strength.
In using the shear graph in cohesionless or granular soils, it
has been found that there is a close correlation between this test
and the other methods of determining the shear strength of granular
soils. However, previous to this research no attempt has been made
to correlate the shear graph strength with a standard method of test
ing natural cohesive or fine-grained soils.
14
Peak
15
Ultimate
5 10 15 20 Normal Stress (psi)
FIGURE 5. SHEAR GRAPH RESULTS

III. TESTS AND MATERIALS
The steps in using the shear graph for evaluating the shear
ing properties of a clay soil are relatively simple. (lO) The
first step is to fasten the sensitized chart on the recording
drum and position it. If the shear graph is to be used in a
vertical position, the recording marker should be adjusted to
read one-half psi to compensate for the weight of the central
shaft, the shear head, and the spring.
15
After the chart has been positioned, the shear head is placed
upon a smooth surface of soil. A normal force is applied to the
handle forcing the shear head into the soil, thereby, seating it.
In the harder soils it is permissable, and often required, to com-
pletely compress the spring when seating the shear head. There are
holes in the shear head allowing air to escape so that the upper
plate will be in contact with the soil when the shear head is in-
serted. This contact is necessary to assure that the normal stress,
created by the spr;i..ng, is actually being applied to the soil.
After full insertion of the shear head is accomplished, cohesive
soil is removed from around the periphery to the total depth of pene-
tration. This is to prevent soil from sticking to the outer surface
of the shear ring, giving an unrealistically high value of shear
stress. Next, a normal stress is carefully applied to the shear
head by compressing the spring. The handle is then rotated counter
clockwise maintaining an essentially constant normal stress until a
peak shear stress failure occurs. In obtaining this peak it is very

important that the shear head remain level and not be tilted. If
tilted, the soil will be broken reducing the shear area causing an
unrealistic shear value. When the peak has been obtained, the handle
is again rotated slowly in the same direction to start motion of the
head. As this motion starts the operator slowly reduces the normal
stress to zero allowing the marker to trace back a curve of shear
stress versus normal stress. The shear head is cleaned and a number
of repetitions of the test on the same soil are made at different
normal pressures to obtain a sufficient amount of data to assure
reliable peak and ultimate values. The peak strength of the soil
as indicated on the shear graph is obtained by fitting a line to
the peak points taken at different normal stresses, while the ulti
mate shear strength is established by fitting a line to the family
of trace back curves shown in Figure 5.
In using the shear graph it was noticed that the trace back
curves were not conforming to the expected results. The curves
were in a fan type array from zero making it impossible to fit
them with a line. In the remolded samples it was almost impos
sible to obtain the trace back curves because the shear head tended
to move sideways as motion started. As the result of this motion,
the supporting ring came in contact with the soil and gave an un
realistic trace back curve. Also, it seems that using the trace
back curves for the ultimate values is in error since part of the
trace back is due to the elastic properties of the spring. For
these reasons and since all samples except the undisturbed red
plastic clay exhibited peak strength, the indicated peak strength

of the shear graph was used as a basis of comparison with the un
confined test.
Two local soils having wide variation in physical properties
were selected for testing. One of the samples was a red plastic
clay obtained from the floor of Onyx Cave located approximately
twenty miles southwest of Rolla. The other soil was a residual
silty clay obtained from a field located approximately six miles
east of Rolla. The physical characteristics of the t\vo soils are
listed in Table I.
TABLE I. PHYSICAL CHARACTERISTICS OF THE SOILS
Silty Clay Plastic Red Clay
Field M. c. 28.0% 86.0%
Liquid Limit 37.4% 112.4%
Plastic Limit 19.0% 34.0%
Specific Gravity of Solids 2.72 2.70
Optimum M. c. 20.00% 30 • 00/o
The tabulated values were obtained from the Atterberg limits,
specific gravity, standard proctor, and hydrometer tests performed
according to the specifications of the American Societyfor Testing
Materials (ASTM), Procedure for Testing Soils.
17
To perform unconfined compression tests on the soils in the un
disturbed state, it was necessary to obtain a number of samples.
These samples were obtained by using thin-walled shelby tubes having
an outside diameter of three inches and an inside diameter of t\vo and
seven eighths inches. The tubes were 24 inches in length and swedged
at one end to minimize disturbance to the soil when being filled.

~8
Forty undisturbed samples of the plastic red clay were obtained
from the floor of Onyx Cave. The tubes were pushed 18 inches into
the clay deposit, twisted at least one revolution, extracted, and im
mediately transported to the laboratory. The samples were covered
with cloths and stored in the moist room until tested to insure pres
ervation of the natural field moisture content.
The shear graph was used to obtain the shearing strength of the
natural clay deposit in the cave. Three series of tests were per
formed at ten locations over the site from which the shelby tube
samples had been extracted. These tests were conducted at six inch
lifts within the clay deposit.
Thirty six samples were extracted from the silty clay deposit
by driving three inch shelby tubes 18 inches with a 50 pound hammer.
After driving the tubes they were twisted, breaking the lower end free.
As the tubes were pulled from the soil, each end was sealed with wax
to maintain the field moisture content. After being sealed the
samples were then transported to the laboratory and stored until
tested. A series of shear graph tests were conducted on the silty
clay at the depths and location from which the shelby tube samples
were procured.
When testing the undisturbed samples in the laboratory, the
first step was to extrude a portion of the sample and trim it flush
with the end of the tubes. Then the shear graph was inserted into
the tubes and a shearing strength determined. Upon completion of
the shear graph test a sample was extruded from the tubes four to
six inches in length and the standard unconfined compressive strength
test performed.
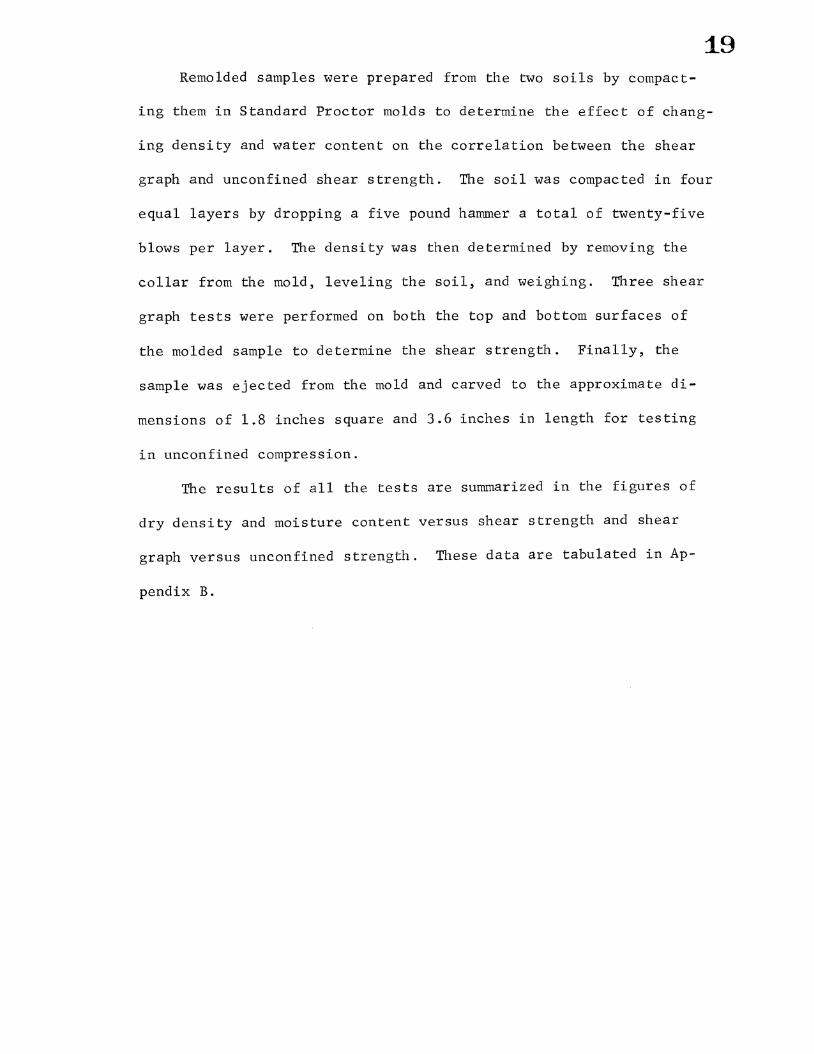
Remolded samples were prepared from the two soils by compact
ing them in Standard Proctor molds to determine the effect of chang
ing density and water content on the correlation between the shear
graph and unconfined shear strength. The soil was compacted in four
equal layers by dropping a five pound hammer a total of twenty-five
blows per layer. The density was then determined by removing the
collar from the mold, leveling the soil, and weighing. Three shear
graph tests were performed on both the top and bottom surfaces of
the molded sample to determine the shear strength. Finally, the
sample was ejected from the mold and carved to the approximate di
mensions of 1.8 inches square and 3.6 inches in length for testing
in unconfined compression.
The results of all the tests are summarized in the figures of
dry density and moisture content versus shear strength and shear
graph versus unconfined strength. These data are tabulated in Ap
pendix B.

20 IV. DISCUSSION OF RESULTS
The magnitude of resistance to shear displacement of the soil
depends on several factors some of which are: internal structure,
water content, and mineralogy. These factors are inter-related
and as a result cannot be separated from one another when discuss
ing shear strength.
Undisturbed clay deposits can exist with either flocculent
or dispersed structures depending upon mineralogy, the ion con
centration of the pore fluid and the stress history. Structure is
an important factor of shear strength since a flocculent structure
will exhibit a higher strength than a dispersed structure. The
higher strength in the flocculent soil is probably due to the fact
that a greater number of inter particle contacts must be disrupted
during the shearing process.
As the natural water content increases, which increases void
ratio and degree of saturation, the shear strength of clays decrease
since the particles are forced apart, thereby decreasing the magni
tude of the attractive forces. This infers that the shear strength
components of cohesion and angle of internal friction decrease with
increasing water content.
In discussing remolded shear strength, reference is made to
compacted samples. The states of particle arrangement (structure)
that exist at various phases of compaction are shown in Figure 6.
The changes in the arrangement of clay particles are explained as
follows: at point A, the electrolyte concentration is very high due

to the low water content and prevents the diffuse double layer of
ions surrounding each particle from developing fully. The depres
sion of the diffuse layer leads to low inter particle repulsion re
sulting in a tendency towards flocculation of the colloids. If the
water content is increased to point B, the electrolyte concentration
is reduced, resulting in an expansion of the double layer, increased
repulsion between particles and a lower degree of flocculation, which
is an increased degree of particle orientation. Further increase in
water content to point C increases the effect and results in a still
greater increase in particle orientation.
The mineralogical composition of the soil will determine the
magnitude of variation of structure with moisture content. As shown
in Figure 6, some soils can exhibit an extreme variation ranging from
a flocculent to a parallel orientation. It is possible also that
only a slight change of orientation will occur with increased mold
ing water in some soils. The smaller variation occurs in soils
which are well dispersed, dry of optimum moisture content, or those
which are still partly flocculated when wet of optimum. With such
soils, increasing the moisture content improves the orientation, but
the improvement is still less than the extreme case shown in Figure
6.
The above discussion explains the effect of moisture content
and mineralogy on the shear strength of remolded samples of cohesive
soil. At water contents dry of optimum the shear strength of a clay
increases to a maximum and then decreases with increasing water con
tent. The increase in strength at low water contents indicates that

22
Moisture Content
FIGURE 6. EFFECTS OF COMPACTION ON STRUCTURE .

23
there is a certain water content required before the diffuse
double layer is satisfied. Additional water added above optimum
then reduces the electrolyte concentration, thereby, allowing
changes in particle orientation which decreases the shear strength.
The undisturbed red plastic clay exists at water contents
above optimum. Therefore, the shear strength of the clay should
decrease with an increase in water content and a decrease in dry
density. Figures 7 and 8 show a decrease in strength with an in
crease in water content and a decrease in dry density. The shear
strength of the plastic clay in the natural state is very low, and
for a large increase in water content and decrease in dry density
the strength change is small.
Figures 7, 8 and 9 indicate that a definite relationship
exists between the unconfined strength and the shear graph strength.
Figure 7, the dry density shear stress relations, shows the shear
graph strength is approximately equal to 2.7 times the unconfined
shear strength. Figure 8, moisture content versus shear stress,
indicates the shear graph strength is approximately equal to 2.66
times unconfined shear strength. Figure 9, shear graph strength
unconfined shear, shows the shear graph is approximately equal to
2. 5 times the unconfined shear strength. From the above values the
generalization can be made that the shear graph strength is approxi
mately equal to 2.6 times the unconfined shear strength for the un-
disturbed red plastic clay.
For the remolded plastic clay a curve of dry density versus
moisture content is shown in Figure 11. This curve has the same

24
Shear-Dry Density Relations
Q Unconfined Test
~ Shear Graph Test
5 6 7 8 Shear Stress (psi)
FIGURE 7. UNDISTURBED RED PLASTIC CLAY

25
Shear-Moisture qontent Relations
e Unconfined Compression Test
140 ~ Shear Graph Test
130
120
110
90 ,-... o-.e ........ .j..) 80 c: Q)
.j..)
c: 0 70 C)
Q) 1-1 :1 .j..)
60 C/)
•.-1 0 ~
i)0 :~£~ ~A e A
50 cP <" A 0 bS.
~ ~ A A fl'
40 <to ~ a a AA A
e ti)
30 - ~ ~ • e 00 A A
C!) A
Shear Stress
FIGURE 8. UNDISTURBED RED PLASTIC CLAY

'0 Cl) c
•.-l 4-1 c 0 0 c ~
,-... •.-l tl)
0.. '-'
...c: .w bO c Cl)
1-l .w U)
1-l til Q)
...c: U)
"'0 Q)
c •.-l 4-1 c 0 0 c ~
26
Shear Graph-Unconfined Relations
Shear Graph Strength (psi)
FIGURE 9. UNDISTURB~D RED PLASTIC CLAY
Shear Graph-Unconfined Relations
10 -
5
Shear Graph Strength (psi)
FIGURE 10. R.ID'.!OLDED RED PLASTIC CLAY

shape as a standard Proctor curve on the wet side of optimum indi
cating that the date are within experimental accuracy.
27
The plot of dry density versus shear strength shown in Figure
12, indicates that as the dry density decreases the shear strength
decreases. A graph of water content versus shear strength, Figure
13, indicates a decrease in strength with an increase in water con
tent. These relationships are valid for a dispersed clay wet of
optimum. As the water content increases there are fewer soil
particles per unit volume so that there is a decrease in dry
density. Also, with an increase in water content the soil mass
becomes more fluid, thereby, decreasing the strength.
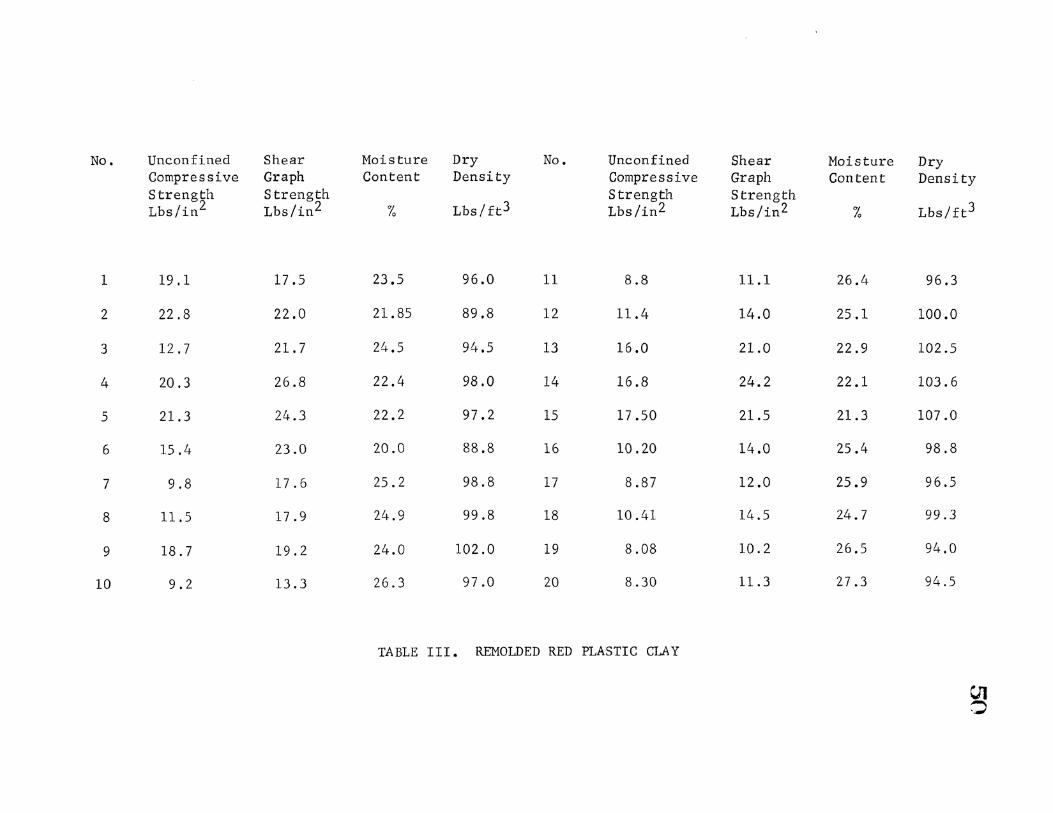
The curves for the remolded plastic clay, Figures 10, 12,
and 13, show a definite relation between the unconfined strength
and the shear graph strength. The dry density, moisture content
versus shear strength curves are approximately parallel. From
these curves it appears that the shear graph strength is approxi
mately equal to 1.5 times the shear strength as indicated by the un
confined test.
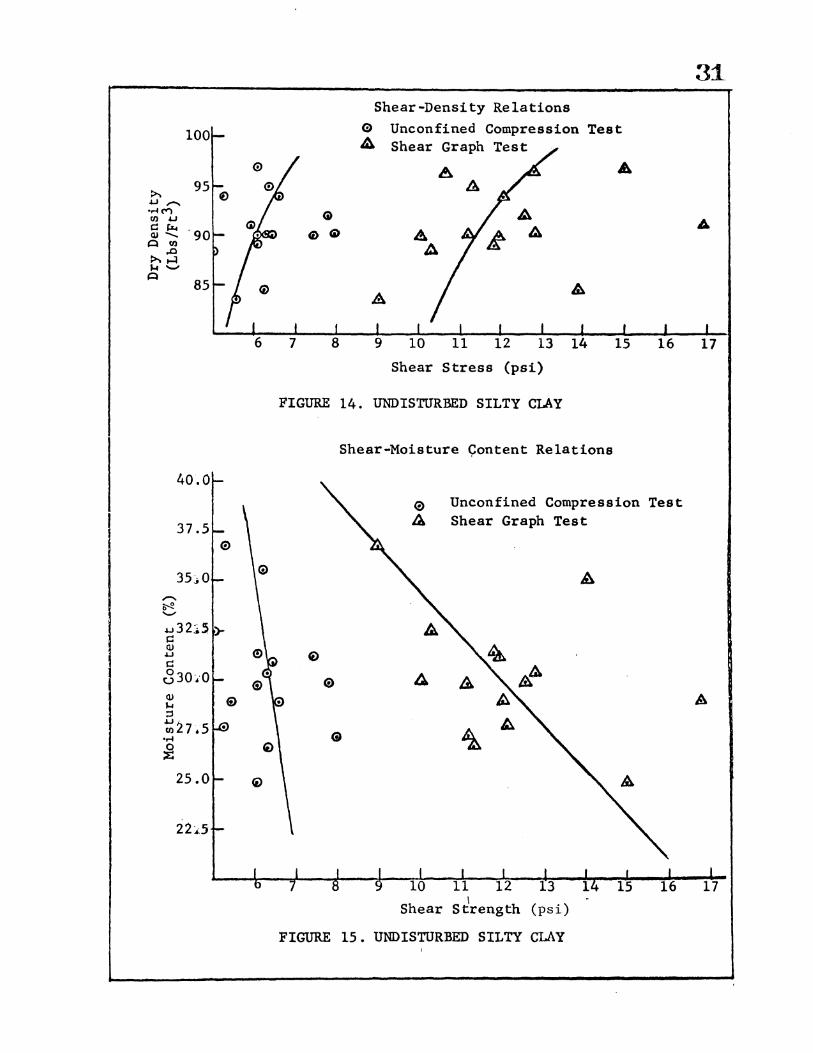
Because of the small variation in water content in the silty
clay samples it is difficult to find any correlation between water
content and dry density versus shear strength. However, the plots
of dry density versus shear stress, Figure 14, and moisture con
tent versus shear stress, Figure 15, show that shear strength de
creases with a decreasing density and increasing water content.
Since there is such a wide scatter in the data for the un
disturbed silty clay, it is difficult to relate the shear graph and

28
Dry Density-Water Content Relations
108
106
104
-102 -("")
.w ~ -II) 100 ..0 ,..:I '-"
:>.. .w 98 •M II)
s:: Q.l
A
:>.. 96 ,... t:l
94
92
90
Water Content %
FIGURE 11. REMOLDED RED PLASTIC CLAY

29
Shear-Dry Den~ity Relations
G> Unconfined Compression Test
A Shear Graph Test
Shear Stress
FIGURE 12. REMOLDED RED PLASTIC CLAY

30
Shear-Moisture Content Relations
26 $ Unconfined Compression Test
24 ~ Shear Graph Test
22 A
20
- 18 ·~ til p. ........
.c: 16 .j.J
bO ~ <1.1 1-1
14 .j.J
C/)
1-1 co <1.1
12 .c: C/)
10
8
6
Moisture Content %
FIGURE 13 • REMOLDED RED PLASTIC CLAY
37.5
.u32:i.5 s:: (I) .u s:: 330-.·0 (I) J-1 ::I
~27 .5 • ..... ~
25.0
22~.5
Shear-Density Relations 0 Unconfined Compression Test ~ Shear Graph Test
A A
Shear Stress (psi)
FIGURE 14. UNDISTURBED SILTY CLAY
Shear-Moisture 9ontent Relations
0 Unconfined Compression Test ~ Shear Graph Test
Shear (psi)
FIGURE 15. UNDISTURBED SILTY CLAY
31_
17

unconfined shear strength. From the curves shown in Figures 14,
15 and 16, it can be seen that the shear graph strength is ap
proximately equal to twice the unconfined shear strength.
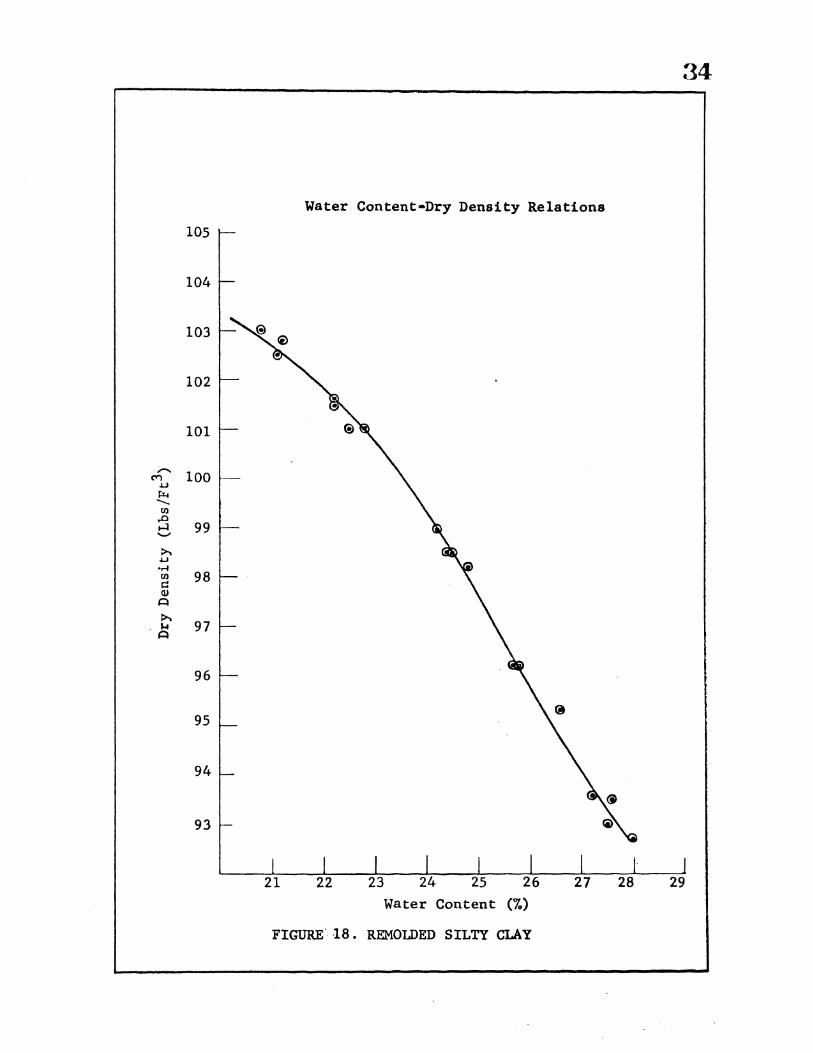
To investigate the reliability of the data for the remolded
32
silty clay samples, a plot of dry density versus water content was
made, Figure 18. This curve has the same shape as a standard Proctor
curve for silty clay soils wet of optimum, and indicates that the data
are within desired experimental accuracy. The dry density - shear
stress and moisture content - shear stress relations, Figures 19 and
20, indicate the expected results of a decrease in shear strength
with a decrease in dry density and increase of water content. The
decrease of strength is due to the decrease in electrolyte concen
tration in the soil mass which decreases the attractive forces be
tween particles and decreases shear strength.
No relation between the shear graph and unconfined strength can
be obtained from the dry density - shear stress and moisture content -
shear stress curves, Figures 19 and 20. The shear graph values have
a very good straight line relationship, but when the unconfined values
are fitted with a line, a curve results. The unconfined test is not
a very reliable indicator of shear strength for a silty soil in which
there may be an appreciable angle of internal friction. At water con
tents considerably above optimum (10 percent above optimum for the
silty clay tested) the unconfined strength is fairly accurate be
cause that portion of shear strength due to friction decreases as
the number of inter particle contacts decrease. As the water content
decreases there is an increase in effective stress between particles

(/) (/)
Q)
1-f +.I tfl
1-f CIS <U .a tfl
Shear Graph-Unconfined Relations
Shear Graph Strength
FIGURE 16. UNDISTURBED SILTY CLAY
Shear Graph-Unco*fined Relations
Shear Graph Strength
FIGURE 17 . REMOLDED SILTY CLAY
33
34
Water Content-Dry Density Relations
105
104
103
102
101
- 100 M .u ~ -l1l ,..0 ...:1 99 '-'
~ .u •r-1 l1l 98 s:: Ql A ~
97 .1-1 A
96
95
94
93
Water Content
FIGURE'18. REMOLDED SILTY CLAY

,....... M
.u ~ ........ (/)
.a ...:I -:>. ··--.u •.-1 (/)
l=l (1J
A
:>.
'"' A
99
98
97
95
Shear-Dry Density Relations
~ Unconfined Compression Test
.&. Shear Graph
Shear Streqgth (psi)
FIGURE 19. REMOLDED SILTY CLAY
35

36
Shear-Moisture Cdntent Relations
Q Unconfined Compression Test
4 Sl\ear Graph
29
28
27
- 26 ~ '-'
.j.J
~ c:u 25 .j.J
~ 0 u c:u 24 ~ :::1 .j.J fl)
-..l
~. 23
22
21 e•
Shear Strength
FIGURE 20. REMOLDED SILTY CLAY

due to the surface tension exhibited at the air water interfaces.
This increased effective stress increases the friction component
of strength making the unconfined test less reliable. The shear
graph is equipped to take into account the change in friction,
therefore, provides data which plots as a straight line.
Since the unconfined data for the remolded silty clay are
questionable, Figures 17, 19, and 20, no attempt is made tore
late the shear graph and unconfined test.
Test results indicate that the peak shear graph strength is
equal to the unconfined compressive strength for fine-grained
soils. This would be conservative in fine-grained soils that
exhibit an appreciable angle of internal friction.
The shear graph appears to give fairly reliable results but
there is some question as to the reliability of the components of
cohesion and angle of internal friction.
It is believed that some design changes would make the shear
graph more useful. It is not certain that the normal stress being
applied to the soil is the same as that indicated on the shear
graph. The supporting ring for the vanes can carry some of the
applied normal stress since the area of this ring is approximately
16 percent of the shear area. When inserting the shear head, the
sides of rim and vanes may provide enough frictional resistance to
depress the soil in this region, thereby, reducing the area to
which the normal stress is applied. To prevent these errors an
attachment could be made for the shear graph. This would be a
cutting tool of the same diameter as the shear head but with a
37

38 greater height. The tool would be inserted into the soil and removed,
thereby, leaving a slot for the rim and vanes. By cutting to a depth
greater than the penetration of the shear head there would be no rim
support and the area to which the normal stress would be applied
would be correct.
It is also felt that there should be an attachment for measuring
strain and strain rate. Some soils are very sensitive to strain rate
and since there is no way of knowing this rate for the existing shear
graph, large errors in data can result.

V. CONCLUSIONS
The objective of this research was to investigate the re
lationship between the shear strength of fine grained soils as
indicated by the shear graph and that obtained from the unconfined
compression test.
The results of the tests indicate the following conclusions:
1. Shearing strength for soils wet of optimum decreases
with an increase in water content.
2. The unconfined compression test results are not a very
reliable measure of the shear strength of soils dry of optimum that
have an appreciable angle of internal friction.
3. The shear graph gives most reliable results in co
hesive soils that are nearly saturated and have a dispersed
structure.
4. The shear graph peak shear stress is approximately
equal to the unconfined compressive strength of cohesive or fine
grained soils.

VI. RECOMMENDATIONS
In using the shear graph for this research certain disad
vantages were noticed that could be corrected by the following
design changes:
40
1. Attach a cutting tool to cut grooves for the rim and
vanes to a depth greater than the penetration of the shear head.
This would help assure that the applied normal stress as indicated
by the shear graph is being applied to the soils.
2. A device for measuring strain and strain rate should
be attached so that stress strain relations will be known.
A need for additional research using the shear graph in natural
fine-grained soils has been indicated by this research. Recommenda
tions for future study include the following:
1. A greater number of tests should be run using the
shear graph compared to the results from triaxial tests for soils
which have an appreciable angle of internal friction.
2. Research should be conducted using a greater variety
of soil types.
3. If a strain measuring device is added a series of
tests should be conducted in differing soil types to determine
the most favorable strain rate to use in testing.

41
APPENDIX A
THEORY OF SOIL FAILURE WITH THE SHEAR GRAPH

42 THEORY OF SOIL FAILURE WITH THE SHEAR GRAPH
It is commonly assumed that soil shearing stress after failure
is not strain dependent and that the soil is in the plastic state so
that the shear stress remains constant with varying strain. This
fact was used in calibrating the shear graph using the following pro-
cedure.
After failure has been reached, the soil on the failure plane
has gone into the plastic state. When this occurs the assumption
can be made that a constant ultimate shear stress (~ ) exists across u
any radius of the shear head (Figure 2la). The resisting moment of
the shear stress is found by integrating over the shear area where r
is the distance from the center to the differential element and r is 0
the radius of the shear head (the subscript indicates ultimate values). u
~ : Stress.Area.Moment Arm
: 2 7T 1;'ur2dr
Mu : 2 -rr 7:u {ror2dr
30 : 2 1( 'Z"'uro /3
M : 2/3 711:'uro 3 u
The effective radius of the area (re) can be found by dividing
2 the resisting moment by the total shear force (F), re = /3r 0 . Know-
ing the shear force and the effective radius of the force makes it
possible to calibrate the shear graph record in terms of ultimate
shearing stress.

43
a. Complete Plastic Distribution
1:p
b. Non-Plastic Stress Distribution
FIGURE 21. STRE~S DIS'rRIBUTION

44 The problem of determining peak shear stress (~p) is more
complicated, particularly since the theory of linear stress-strain
relationships prior to initial failure has not been proven. If
this theory is assumed to be correct and if it is further assumed
that the arrangement of the shear head vanes is adequate to produce
uniformly increasing strain across any radius, and that normal stress
is uniform, a linear stress distribution may also be assumed (Figure
2lb). It also follows that the outermost fiber in the torsional
shear test area will be the first to reach the maximum peak shear
stress. The resisting moment of a stress distribution such as this
will not be the same as in the plastic case. Intermediate values of
stress depend upon the distance from the center of rotation and reach
a maximum of-rp at r 0 . The resisting peak moment for the triangular
distribution is found by integrating.
~ = Stress.Area.Moment Arm
dMP = "t'· 2 7rrdr. r
"'t" = r I r T:. 0 p
dMP = r /r0 1""p. 2 TTrdr .r
fro 3 Mp = 2 7T 't /r r dr p 0 0
Mp = 1/2 7'" 'Z'pr 0 3
Although this equation describes the resisting moment when the
outer fiber has reached its peak shear stress, the shear graph is
not calibrated to record the true value of rp with the assumed
triangular stress distribution.
For some soils when failure is reached, most of the shear area
has gone plastic making the ultimate shear stress calibration valid.

45
However, most soils at the instant of failure will exhibit a stress
distribution that is a combination of both ultimate and peak values.
As the outer fibers are strained a peak stress is reached, but this
stress is not enough to cause failure over the entire area. There
fore, the outer fibers pass into a plastic state and the peak stress
progresses toward the center of rotation until failure occurs with the
inner area under the influence of peak stress and the outer area hav
ing ultimate shear stress.

APPENDIX B
TABULATION OF TEST DATA
46

No.
1
2
3
4
5
6
7
8
9
10
Unconfined Compressive Strength Lbs/in2
1.53
1.54
1. 79
0.93
1.02
1.31
0.92
0.82
0.75
0.58
Shear Graph Strength Lbs/in2
4.10
3.40
2.70
2.20
3.10
2.70
2.60
2.80
2.60
2.90
Moisture Dry Content Density
% Lbs/ ft3
52.8 66.8
60.7 67.8
29.7 90.2
99.5 45.2
55.5 67.7
45.5 71.7
110.0 41.2
118.5 39.0
us .5 38.2
111.5 41.0
No.
11
12
13
14
15
16
17
18
19
20
Unconfined Compressive Strength Lbs/in2
0.93
1. 60
1.15
1.19
2.17
0. 67
1. 33
2.78
1. 91
0.97
TABLE II. UNDISTURBED RED PLASTIC CLAY
Shear Graph Strength Lbs/in2
3.00
3.00
2.00
2.10
3.50
4.40
2.40
4.20
4.80
2.60
Moisture Dry Content Density
% Lbs/ft3
94.0
61.2
67.0
66.8
43.0
66.8
66.8
37.5
26.3
66.8
48.5
63.5
62.3
58.3
76.5
55.0
58.6
82.2
89.6
64.0
~ ~

No.
21
22
23
24
25
26
27
28
29
30
Unconfined Compressive Strength Lbs/in2
0.92
1.49
0. 76
1.62
1.33
2.05
1.24
1. 25
1.80
1. 61
Shear Graph Strength Lbs/in2
2.10
2.80
4.00
4. 70
2.20
4. 70
2.90
2.30
3.50
4.10
Moisture Content
%
43.0
67.0
49.2
48.6
138.2
31.2
36.7
47.5
39.0
39.1
Dry Density
Lbs/ft3
76.3
63.1
57.0
73.6
43.2
87.3
78.6
68.2
78.6
83.4
No.
31
32
33
34
35
36
37
38
39
40
Unconfined Compressive Strength Lbs/in2
0.75
0.66
1.50
1.30
1.01
1.00
0.86
0.40
0.68
1.03
TABLE II. (Continued)
Shear Moisture Graph Content Stren~th
Lbs/in %
1.80 108.7
2.90 100.0
3.80 46.8
1.80 98.0
2.60 81.3
4.20 54.7
1.30 128.5
2.50 135.8
2.60 124.0
2.20 91.0
Dry Density
Lbs/ft3
43.4
45.5
76.3
47.0
57.1
69.3
38.5
23.9
37.8
48.4
~ X

No.
41
42
43
44
45
46
47
48
49
50
Unconfined Compressive Strength Lbs/in2
1.09
1.19
0.63
1.42
0.80
0.99
1.16
1.61
1.48
1.01
Shear Graph Strength Lbs/in2
2.80
2.90
2.80
2.60
2.70
3.20
3.70
3.70
5.40
1.90
Moisture Dry Content Density
% Lbs/ft3
35.5 75.5
45.3 74.0
104.2 45.5
65.3 62.0
90.3 52.1
60.0 62.3
56.9 65.2
53.3 67.4
58.3 66.8
84.2 51.3
No.
51
52
53
54
55
56
57
58
59
60
Unconfined Compressive Strength Lbs/in2
0.97
1.38
1.29
0.98
0.92
1.37
0.94
1.06
1.44
1.42
TABLE II. (Continued)
Shear Graph Strength Lbs/in2
3.50
2.50
3.99
2.80
2.80
2.80
2.50
2.70
4.00
1.60
Moisture Dry Content Density
% Lbs/ft3
65.6
91.7
68.8
99.5
58.3
47.8
56.5
48.1
53.0
45.3
56.4
49.6
60.3
46.3
63.8
69.5
59.8
69.0
63.5
67.6
~ ~
No.
1
2
3
4
5
6
7
8
9
10
Unconfined Compressive Strength Lbs/in2
19.1
22.8
12.7
20.3
21.3
15.4
9.8
11.5
18.7
9.2
Shear Graph Strength Lbs/in2
17.5
22.0
21.7
26.8
24.3
23.0
17.6
17.9
19.2
13.3
Moisture Dry Content Density
% Lbs/ft3
23.5 96.0
21.85 89.8
24.5 94.5
22.4 98.0
22.2 97.2
20.0 88.8
25.2 98.8
24.9 99.8
24.0 102.0
26.3 97.0
No.
11
12
13
14
15
16
17
18
19
20
Unconfined Compressive Strength Lbs/in2
8.8
11.4
16.0
16.8
17.50
10.20
8.87
10.41
8.08
8.30
TABLE III. REMOLDED RED PLASTIC CLAY
Shear Graph Strength Lbs/in2
11.1
14.0
21.0
24.2
21.5
14.0
12.0
14.5
10.2
11.3
Moisture Dry Content Density
% Lbs/ ft3
26.4
25 .1
22.9
22.1
21.3
25.4
25.9
24.7
26.5
27.3
96.3
100.0
102.5
103.6
107.0
98.8
96.5
99.3
94.0
94.5
U1 0

No.
21
22
23
24
Unconfined Compressive Strengt~ Lbs/in
8.00
7.85
7.62
8.52
Shear Graph Strength Lbs/in2
11.0
11.2
11.5
10.3
Moisture Content
%
27.0
27.0
27.8
27.0
Dry Density
Lbs/ft3
94.0
94.9
93.8
94.8
No.
25
26
27
28
Unconfined Compressive Strength Lbs/in2
4.79
5.40
5.50
5.28
TABLE III. (Continued)
Shear Graph Strength Lbs/in2
8.0
8.0
8.0
8.0
Moisture Content
%
30.1
29.6
28.9
29.3
Dry Density
Lbs/ft3
89.5
90.7
91.3
91.1
CJ1 ~

No. Unconfined Shear Compressive Graph Strength Lbs/in2
Strength Lbs/in2
1 5.55 9.0
2 6.03 15.0
3 5. 25 12.1
4 6.33 11.3
5 5.88 16.8
6 5.00 10.3
7 7.77 12.6
8 7.97 11.2
Moisture Dry No. Unconfined Content Density Compressive
Lbs/ft3 Strength
% Lbs/in2
36.7 83.6 9 6.05
24.8 97.0 10 6.44
27.6 94.0 11 7.43
26.6 95.0 12 6.26
28.9 91.0 13 6.11
32.4 88.2 14 6.24
29.8 92.0 15 6.67
27.1 90.1 16 10.70
TABLE IV. UNDISTURBED SILTY CLAY
Shear Moisture Graph Content Strength Lbs/in2 %
11.2 29.7
10.3 30.9
11.9 31.2
12.8 30.8
11.8 31.4
14.1 35.5
12.8 28.0
12.8 28.0
Dry Density
Lbs/ft3
90.0
90.0
90.0
90.5
89.0
84.5
94.0
96.5
CJ1 ~

No. Unconfined
1
2
3
4
5
6
7
8
9
Compressive Strength Lbs/in2
46.5
34.8
47.4
27.5
32.2
30.5
34.8
18.1
16.9
Shear Graph Streng~h Lbs/in
21.7
20.0
21.0
20.0
20.9
20.4
20.9
15.1
15.0
Moisture Dry Content Density
% Lbs/ft3
21.2 102.8
21.1 102.5
20.8 103.0
22.5 101.0
22.2 101.5
22.8 101.0
22.2 101.6
26.6 95.3
25.8 96.2
No.
10
11
12
13
14
15
16
17
18
Unconfined Compressive Strength Lbs/in2
19.1
12.7
12.2
13.7
11.4
21.5
24.3
22.1
25.6
TABLE V. REMOLDED SILTY CLAY
Shear Moisture Graph Content Strength Lbs/in2 %
18.2 25.7
14.0 28.0
13.6 27.5
14.8 27.2
14.4 27.6
17.9 24.5
18.4 24.4
18.5 24.8
18.7 24.2
Dry Density
Lbs/ft3
96.2
92.7
93.0
93.6
93.5
98.5
98.5
98.2
99.0
CJ1 ::J

54 BIBLIOGRAPHY
1. Sprangler, M.G. (1961). "Soil Engineering .. " Second Edition. International Textbook Company, Scranton, Pa.
2. Hvorslev, M. J. (1939). Torsion Shear Tests and Their Place in the Determination of the Shearing Resistance of Soils. Symposium on Shear Testing of Soils. ASTM, Vol. 39, Philadelphia, Pa.
3. Taylor, D. W. (1939. A Comparison of Results of Direct Shear and Cylindrical Compression Tests. Symposium on Shear Testing of Soils. ASTM, Vol. 39, Philadelphia, Pa.
4. Skempton, A. W. (1948). A Study of the Immediate Triaxial Test on Cohesive Soils. Proc. Second International Conference on Soil Mechanical and Foundation Engineering. Vol. 1, p. 192.
5. Bishop, Alan W. and Henkel, D. J. (1957). Rates of Testing. The Measurement of Soil Properties in the Triaxial Test. Appendix 4. Edward Arnold Publishers, London.
6. Jumikis, A. R. (1962). "Soil Mechanics." D. Van Nostrand Co., Inc., Princeton, New Jersey.
7. Symposium on Vane Shear Testing of Soils. (1957). ASTM Spec. Tech. Pub. No. 193.
8. Lambe, T. W., Laboratory Testing Manuel.
9.
10.
Payne and Fountaine, (January 1952). Strength of Soils. Vol. 3, No. 1.
Measuring the Shear Journal of Soil Science,
Cohron, G. T. (1962). The Soil Shear Graph. of Agricultural Engineers.
American Society Paper No. 62-133.
11. Marsal, R. J. (1957). Unconfined Compression and Vane Shear Test in Volcanic Lacustrine Clays. ASTM, No. 232, pp. 229-242. Philadelphia, Pa.
12. Means, R. E. and Parcher, J. U. (1962). Stress-Deformation and Strength Characteristics. Physical Properties of Soils, Chapter 11. Charles E. Merrill Books, Inc., Columbus, Ohio.

13. Liu, T. K. and Thornburn, T. H. (1963). Surficial Soils. ASTM, No. 351, p. 44.
Investigation of Spec. Tech. Pub.
55
14. Bishop, A. W. and Donald, I. B. (1961). The Experimental Study of Partly Saturated Soil in the Triaxial Apparatus. Proc. 5th International Conference on Soil Mechanics and Foundation Engineering. Dunod, Paris.
15. Bennett, G. B. and Mecham, J. G. (1953). Use of Vane Borer on Foundation Investigation of Fill. Proc. Highway Research Board, Vol. 32, p. 486.
16. Moretto, 0. (1948). Effect of Natural Hardening of the Unconfined Compression Strength of Remolded Clays. Proc. Second International Conference on Soil Mechanics and Foundation Engineering. Vol. 1, p. 137.
17. Tschebotarioff, G. P. and Bayliss, J. R. (1948). The Determination of the Shearing Strength of Varved Clays and of their Sensitivity to Remolding. Proc. Second International Conference on Soil Mechanics and Foundation Engineering. Vol. 1, p. 203.
18. Payne, P. C. J. (1958). The Relationship Between the Mechanical Properties of Soil and the Performance of Simple Cultivation Implements. Journal of Agricultural Engineering Research. Vol. 1, No. 1.
19. Payne, P. c. J. and Tanner, D. W. (1959). The Relationship Between Rake Angle and the Performance of Simple Cultivation Implements. Journal of Agricultural Engineering Research. Vol. 4, No. 4.
20. Gray, H. July 1955). Field Vane Shear Tests of Sensitive Cohesive Soils. Proc. American Society of Civil Engineers. Vol. 81.
21. Sowers, G. B. and Sowers, G. F. (1961). Introductory Soil Mechanics and Foundations. Sec. Edition The Macmillan Company, New York.
22 1 R H "Soil and Soil Engineering." Prentice-Hall, • Karo , • . Hew Jersey.

5f) 23. Peck, R. B., Hanson, W. E., and Thornburn, T. H. (1953).
24.
"Foundation Engineering." John Wiley and Son, Inc. New York.
Terzaghi, K. and Peck, R. B. (1948). Engineering Practice." Inc . New York.
"Soil Mechanics in John Wiley and Sons,
25. Scott, R. F. (1963). "Principles of Soil Mechanics" AddisonWesley Pub. Co. Inc., Reading~assachusetts.

57 VITA
Charles Rees Nickerson was born on January 14, 1940, in
Chico, California. He received his primary and secondary educa
tion in Macon County, La Plata, Missouri. He attended Central
Methodist College, Fayette, Missouri, from 1958~1961. His educa
tion was continued at the University of Missouri at Rolla where
he received a Bachelor of Science Degree in Civil Engineering in
1964. Upon fulfillment of these requirements he simultaneously
obtained a Ba~helor of Arts Degree from Central Methodist College.
He has been enrolled in the Graduate School of the University
of Missouri at Rolla since September, 1963. He accepted a graduate
assistantship in January 1964.
Rees Nickerson is married to the former Frances Louise Crowe
of Crystal City, Missouri. They have one daughter, Cynthia Lynne,
born October 29, 1964.