Embed Size (px)
Citation preview
The SEEP Network
1825 Connecticut Avenue NW Washington, DC 20009
PHONE 202.884.8392 FAX 202.884.8479
E-MAIL [email protected]
WEB SITE & BOOKSTORE www.seepnetwork.org
Th
e SE
EP
Netw
ork M
easurin
g P
erform
ance o
f Micro
fin
ance In
stitutio
ns
Measuring Performance of Microfinance Institutions
A Framework for Reporting, Analysis, and Monitoring
Editor
Tillman Bruett, Alternative Credit Technologies (ACT)
Authors
Isabelle Barres, Microfinance Information eXchange (The MIX)
Tillman Bruett, ACT
Lynne Curran, ACCIÓN International
Ana Escalona, Pro Mujer
Elena Patapievici Nelson, ACDI/VOCA
Dan Norell, World Vision
Beth Porter, Freedom from Hunger
Blaine Stephens, The MIX
Maria Stephens, Catholic Relief Services
Contributors
Ruth Dueck Mbeba, MEDA
Joanna Ledgerwood, Chemonics International
Tony Sheldon, Bering Consulting
Chuck Waterfield, MFI Solutions, LLC
Copyright © 2005
The SEEP Network
Sections of this book may be copied or adapted to meet local needs without permission from The SEEP Network, provided the parts copied are distributed for free or at cost—not for profit. Please credit Measuring Performance of Microfinance Institutions: A Framework for Reporting, Analysis, and Monitoring and SEEP for those sections excerpted. For any commercial reproduction, please obtain permission from The SEEP Network, 1825 Connecticut Avenue NW, Washington, DC 20009-5721 USA.
ISBN 0-9722582-7-2
Measuring Performance of Microfinance Institutions: A Framework for Reporting, Analysis, and MonitoringPrinted in the United States of America
Cover photo: Robert Bengtson PhotographyCopyediting and graphic design: TK
Layout: Communication VisualPrinting: Copy General
The Accelerated Microenterprise Advancement Project (AMAP) is a four-year contracting facilitty that USAID/Washington and missions can use to acquire technical services to design, implement, or evaluate microenterprise development, which is an important tool for economic growth and poverty alleviation.
For more information on AMAP and related publications, please visit www.microlinks.org.
Contract Number: GEG-I-00-02-00011-00Task Order: 01Contractor: Development Alternatives, Inc.
The SEEP Network is an organization of more than 50 North American private and voluntary organizations that support micro and small business and finance institutions in the developing world. Its mission is to advance the practice of micro and small enterprise development among its members, their international partners, and other practitioners. The SEEP Network provides collective examination from which emerges learning that advances professional development, increases program impact, fosters continuing innovation, and informs the policy arena.
Alternative Credit Technologies (ACT) is a consulting firm specializing in microenterprise development and finance. Its partners have combined experience in commercial banking, public policy, microfinance institution management, and grassroots community development. ACT facilitates The SEEP Network’s Poverty Outreach Working Group and the Financial Services Working Group.
Measuring Performance of Microfinance Institutions: A Framework for Reporting, Analysis, and Monitoring
iii
Foreword
First Edition
Measuring Performance of Microfinance Institutions: A Framework for Reporting, Analysis, and Monitoring (hereafter referred to as the Framework) is printed in editions. Each successive edition incorporates the most recent changes or additions to the standard definitions of terms, ratios, and adjustments. To ensure using the most current Framework, visit The SEEP Network Web site at www.seepnetwork.org or contact The SEEP Network at 1825 Connecticut Avenue, NW, Washington, D.C. 20009, USA.
Acknowledgments
This Framework is based on the work performed by a roundtable of donors, rating agencies, and The SEEP Network, which produced an earlier work—Microfinance Consensus Guidelines: Definitions of Selected Financial Terms, Ratios, and Adjustments for Microfinance. The Framework is part of a larger Financial Standards Promotion Project, which is supported by the U.S. Agency for International Development (USAID) through the Financial Services Knowledge Generation project of the Accelerated Microenterprise Advancement Project (AMAP) Support. As the prime contractor for AMAP, Development Alternatives, Inc. (DAI) provided significant support to SEEP and Alternative Credit Technologies (ACT), LLC in completing this Framework.
The Financial Services Working Group of The SEEP Network thanks several experts for their contributions to this effort, including John Berry and Barry Lennon of USAID, Colleen Green of DAI, Catherine Johnston of ACT and DAI, Patricia Mwangi of the Consultative Group to Assist the Poor, Julius Mokogi of K-Rep Bank, Alice Negre of PlaNet Finance, Didier Thys of the Microfinance Information eXchange, and Damian von Stauffenberg of MicroRate, and Dr. Mohamed Nasr, CPA. We are particularly grateful for the unfailing support of Dana de Kanter of The SEEP Network.
Endorsements
The SEEP Network trusts that all organizations (practitioners, donors, rating agencies, and others) that have contributed to this effort and are part of this standards process will add their endorsement to this Framework in future editions.

Measuring Performance of Microfinance Institutions: A Framework for Reporting, Analysis, and Monitoring
v
Contents
Foreword . . iii
First Edition . . . . . . . . . . . . . . . . . . . . . . . . . . . . . . . . . . . . . . . . . . . . . . . . . . . . . iii
Acknowledgments . . . . . . . . . . . . . . . . . . . . . . . . . . . . . . . . . . . . . . . . . . . . . . . . iii
Endorsements . . . . . . . . . . . . . . . . . . . . . . . . . . . . . . . . . . . . . . . . . . . . . . . . . . . iii
Abbreviations . . . . . . . . . . . . . . . . . . . . . . . . . . . . . . . . . . . . . . . . . . . . . . . . . . . . . . . . . . . . . . ix
Chapter 1 Developing Standard Definitions of Financial Terms, Ratios, and Adjustments for Microfinance . . . . . . . . . . . . . . . . . . . . . . . . . . . . . . . . .1
1.1 Purpose . . . . . . . . . . . . . . . . . . . . . . . . . . . . . . . . . . . . . . . . . . . . . . . . . . . . . .1
1.2 History . . . . . . . . . . . . . . . . . . . . . . . . . . . . . . . . . . . . . . . . . . . . . . . . . . . . . .2
1.3 Future . . . . . . . . . . . . . . . . . . . . . . . . . . . . . . . . . . . . . . . . . . . . . . . . . . . . . . .3
1.4 Editions . . . . . . . . . . . . . . . . . . . . . . . . . . . . . . . . . . . . . . . . . . . . . . . . . . . . .3
1.5 Content . . . . . . . . . . . . . . . . . . . . . . . . . . . . . . . . . . . . . . . . . . . . . . . . . . . . . .3
1.6 Using the SEEP Performance Monitoring Framework . . . . . . . . . . . . . . . . .6
Chapter 2 Financial Statements and Reports . . . . . . . . . . . . . . . . . . . . . . . . . . . . . . . . .9
2.1 Using the Framework for MFI Statements and Reports . . . . . . . . . . . . . . . .9
2.2 Income Statement . . . . . . . . . . . . . . . . . . . . . . . . . . . . . . . . . . . . . . . . . . . . .11
2.3 Balance Sheet . . . . . . . . . . . . . . . . . . . . . . . . . . . . . . . . . . . . . . . . . . . . . . . .16
2.4 Cash Flow Statement . . . . . . . . . . . . . . . . . . . . . . . . . . . . . . . . . . . . . . . . . .23
2.5 Portfolio Report and Activity Report . . . . . . . . . . . . . . . . . . . . . . . . . . . . . .32
2.6 Non-Financial Data Report . . . . . . . . . . . . . . . . . . . . . . . . . . . . . . . . . . . . .35
2.7 Financial Statements in Perspective . . . . . . . . . . . . . . . . . . . . . . . . . . . . . . .37
Chapter 3 Analytical Adjustments . . . . . . . . . . . . . . . . . . . . . . . . . . . . . . . . . . . . . . . .39
3.1 The Purpose of Adjustments . . . . . . . . . . . . . . . . . . . . . . . . . . . . . . . . . . . .40
3.2 Availability of Data . . . . . . . . . . . . . . . . . . . . . . . . . . . . . . . . . . . . . . . . . . .42
3.3 Methodologies for Adjustments . . . . . . . . . . . . . . . . . . . . . . . . . . . . . . . . . .42
3.4 Adjustments for Subsidies . . . . . . . . . . . . . . . . . . . . . . . . . . . . . . . . . . . . . .42
3.5 Inflation Adjustment . . . . . . . . . . . . . . . . . . . . . . . . . . . . . . . . . . . . . . . . . . .49
3.6 Portfolio at Risk Adjustments . . . . . . . . . . . . . . . . . . . . . . . . . . . . . . . . . . .53
3.7 Creating Adjusted Financial Statements . . . . . . . . . . . . . . . . . . . . . . . . . . .60
Chapter 4 Financial Ratios and Indicators . . . . . . . . . . . . . . . . . . . . . . . . . . . . . . . . . .65
4.1 Profitability and Sustainability Ratios . . . . . . . . . . . . . . . . . . . . . . . . . . . . .68
Measuring Performance of Microfinance Institutions: A Framework for Reporting, Analysis, and Monitoring
vi
4.2 Asset/Liability Management Ratios . . . . . . . . . . . . . . . . . . . . . . . . . . . . . . .71
4.3 Portfolio Quality Ratios . . . . . . . . . . . . . . . . . . . . . . . . . . . . . . . . . . . . . . . .75
4.4 Efficiency and Productivity Indicators . . . . . . . . . . . . . . . . . . . . . . . . . . . . .78
Chapter 5 Creating and Analyzing Performance Monitoring Reports . . . . . . . . . . . . .87
5.1 Analysis of Financial Statements and Indicators . . . . . . . . . . . . . . . . . . . . .87
5.2 Performance Monitoring Reports . . . . . . . . . . . . . . . . . . . . . . . . . . . . . . . . .91
5.3 A Performance Monitoring Checklist . . . . . . . . . . . . . . . . . . . . . . . . . . . .103
Glossary . 105
Bibliography . . . . . . . . . . . . . . . . . . . . . . . . . . . . . . . . . . . . . . . . . . . . . . . . . . . . . . . . . . . . . .109
Measuring Performance of Microfinance Institutions: A Framework for Reporting, Analysis, and Monitoring
vii
List of Tables
2.1 Sample Income Statement . . . . . . . . . . . . . . . . . . . . . . . . . . . . . . . . . . . . . . . . . . . . .12
2.2 Income Statement Detail . . . . . . . . . . . . . . . . . . . . . . . . . . . . . . . . . . . . . . . . . . . . . .13
2.3 Sample Balance Sheet . . . . . . . . . . . . . . . . . . . . . . . . . . . . . . . . . . . . . . . . . . . . . . . .18
2.4 Balance Sheet Detail . . . . . . . . . . . . . . . . . . . . . . . . . . . . . . . . . . . . . . . . . . . . . . . . . .20
2.5 Classification of Cash Receipts and Payments . . . . . . . . . . . . . . . . . . . . . . . . . . . . . .24
2.6 Sample Direct Cash Flow Statement . . . . . . . . . . . . . . . . . . . . . . . . . . . . . . . . . . . . .26
2.7 Direct Cash Flow Statement Detail . . . . . . . . . . . . . . . . . . . . . . . . . . . . . . . . . . . . . .27
2.8 Sample Indirect Cash Flow Statement . . . . . . . . . . . . . . . . . . . . . . . . . . . . . . . . . . . .30
2.9 Indirect Cash Flow Statement Detail . . . . . . . . . . . . . . . . . . . . . . . . . . . . . . . . . . . . .31
2.10 Sample Portfolio Report . . . . . . . . . . . . . . . . . . . . . . . . . . . . . . . . . . . . . . . . . . . . . . .33
2.11 Portfolio Report Detail . . . . . . . . . . . . . . . . . . . . . . . . . . . . . . . . . . . . . . . . . . . . . . . .34
2.12 Sample Non-Financial Data Report . . . . . . . . . . . . . . . . . . . . . . . . . . . . . . . . . . . . . .36
2.13 Non-Financial Data Report Detail . . . . . . . . . . . . . . . . . . . . . . . . . . . . . . . . . . . . . . .36
3.1 Summary of Adjustments . . . . . . . . . . . . . . . . . . . . . . . . . . . . . . . . . . . . . . . . . . . . . .40
3.2 Differences in Subsidized Cost of Fund Adjustment Methodologies . . . . . . . . . . . . .43
3.3 Sample Subsidized Cost of Funds Adjustment for Benchmarking . . . . . . . . . . . . . .45
3.4 Differences in the In-Kind Subsidy Adjustment Methodologies . . . . . . . . . . . . . . . .46
3.5 Sample In-Kind Subsidy Adjustment for Benchmarking . . . . . . . . . . . . . . . . . . . . . .49
3.6 Differences in Inflation Adjustment Methodologies . . . . . . . . . . . . . . . . . . . . . . . . .50
3.7 Inflation Adjustment . . . . . . . . . . . . . . . . . . . . . . . . . . . . . . . . . . . . . . . . . . . . . . . . . .53
3.8 Differences in Impairment Loss Allowance Adjustment Methodologies . . . . . . . . . .54
3.9 Adjustment for Impairment Loss Allowance . . . . . . . . . . . . . . . . . . . . . . . . . . . . . . .57
3.10 Adjustment for Write-offs for Benchmarking . . . . . . . . . . . . . . . . . . . . . . . . . . . . . .59
Measuring Performance of Microfinance Institutions: A Framework for Reporting, Analysis, and Monitoring
viii
3.11 Summary of the Effects of Adjustments . . . . . . . . . . . . . . . . . . . . . . . . . . . . . . . . . . .61
3.12 Adjusted Income Statement . . . . . . . . . . . . . . . . . . . . . . . . . . . . . . . . . . . . . . . . . . . .62
3.13 Adjusted Balance Sheet . . . . . . . . . . . . . . . . . . . . . . . . . . . . . . . . . . . . . . . . . . . . . . .63
3.14 Sample Disclosure for Adjustments . . . . . . . . . . . . . . . . . . . . . . . . . . . . . . . . . . . . . .64
4.1 Summary of 18 Recommended Ratios . . . . . . . . . . . . . . . . . . . . . . . . . . . . . . . . . . . .66
4.2 Calculating the SEEP 18 . . . . . . . . . . . . . . . . . . . . . . . . . . . . . . . . . . . . . . . . . . . . . . .84
5.1 Sample Monthly Management Report . . . . . . . . . . . . . . . . . . . . . . . . . . . . . . . . . . . .93
5.2 Sample Quarterly Income Statement with Revenue Analysis . . . . . . . . . . . . . . . . . .95
5.3 Sample Quarterly Balance Sheet with Asset Allocation Analysis . . . . . . . . . . . . . . .96
5.4 Sample Quarterly Management Report . . . . . . . . . . . . . . . . . . . . . . . . . . . . . . . . . . .97
5.5 Sample Quarterly or Semiannual Board Report . . . . . . . . . . . . . . . . . . . . . . . . . . . . .99
5.6 Sample Semiannual Donor, Creditor, Investor Report . . . . . . . . . . . . . . . . . . . . . . .102
5.7 Sample Reporting Checklist . . . . . . . . . . . . . . . . . . . . . . . . . . . . . . . . . . . . . . . . . . .104
Measuring Performance of Microfinance Institutions: A Framework for Reporting, Analysis, and Monitoring
ix
Abbreviations
ACT Alternative Credit Technologies, LLC
AMAP Accelerated Microenterprise Advancement Project Support
CD certificate of deposit
CGAP Consultative Group to Assist the Poor
CPI Consumer Price Index
DAI Development Alternatives, Inc.
DFID Department for International Development (United Kingdom)
IAS International Accounting Standards
IFRS International Financial Reporting Standards
IMF International Monetary Fund
FSWG Financial Services Working Group
GNI Gross National Income
GNP Gross National Product
MFI microfinance institution
MIS management information system
MIX Microfinance Information eXchange
NGO nongovernmental organization
PAR Portfolio at Risk
SEEP Small Enterprise Education Promotion Network
USAID U.S. Agency for International Development

1
1Developing Standard Definitions of Financial Terms, Ratios, and Adjustments for Microfinance
Microfinance has become a diverse and growing industry. Thousands of microfinance institutions (MFIs) exist, ranging from grass roots self-help groups to commercial banks that provide financial services to millions of microenterprises and low-income households. These MFIs receive support and services not only from donor agencies, but also from investors, lenders, network organizations, rating firms, management consulting firms, and a host of other specialized businesses. These organizations in aggregate make up the thriving global microfinance industry.
As with any global industry, microfinance needs accepted standards by which MFIs can be measured. Common standards allow for microfinance managers and board members to assess more accurately how their institution is performing. Institutions that apply industry standards are more transparent—it makes it harder to hide or obscure bad performance and easier to benchmark good performance. For MFIs, industry-wide standards can make reporting to donors, lenders, and investors easier to do if the recipients of the reports are also in agreement with the standards. Common standards provide the language that enables MFIs to communicate with other participants in the industry, whether they are down the street or across the ocean.
A growing acceptance of standards for microfinance has emerged since the early 1990s. In 1995, The SEEP Network produced a monograph, Financial Ratio Analysis of Microfinance Institutions, which became the standard set of 16 ratios that microfinance institutions monitored. Then, in 2002, microfinance institutions, The SEEP Network, rating firms, and donor agencies jointly developed Microfinance Financial Definitions Guidelines: Definitions of Selected Financial Terms, Ratios, and Adjustments for Microfinance, known as the Financial Definitions Guidelines. These guidelines were the result of painstaking discussions, negotiations, and compromises to develop generally accepted definitions for the industry. The primary objective of the Financial Definitions Guidelines was to put forward standard definitions for selected financial terms and suggest a standard method of calculating certain financial ratios.
This Framework builds on that consensus.
1.1 Purpose
The purpose of this Framework is to provide microfinance practitioners with a means to develop financial statements and reports so that those statements and reports can be used for meaningful analysis and monitoring and are in accordance International Financial Reporting Standards with (IFRS). The authors trust that this Framework will assist MFI managers in developing a consistent performance monitoring system based on international standards that can assist managers in making decisions, informing boards of directors, and reporting to donors, investors, and other interested parties.
Measuring Performance of Microfinance Institutions: A Framework for Reporting, Analysis, and Monitoring
2
Although this Framework is written by and for practitioners, it can be valuable for many other users as well. Producers of information, such as raters or auditors, may also find the Framework useful for their purposes. The Framework can also be used by network organizations, donors, investors, and other users of information who want to use a standardized reporting format for the institutions they support.
This Framework, which uses the Financial Definitions Guidelines as its basis, includes the most up-to-date definitions and calculations in the industry. As the title suggests, the Financial Definitions Guidelines’ terms and ratios were selected because they were commonly used and presented definitional issues. Several terms that are needed to construct a complete set of financial statements were not included, however. For this reason, The SEEP Network developed this Framework, which goes beyond the Financial Definitions Guidelines. This Framework provides sample financial statement and report templates, suggests calculations for adjustments, and makes recommendations on which indicators to monitor.
For MFIs that lack a comprehensive financial reporting framework, this Framework may provide it. Microfinance managers who already have reporting formats may also find this Framework useful to align their own framework with the industry-standard terms, ratios, and adjustments.
1.2 History
The history of microfinance is often associated with the rise of nongovernmental organizations (NGOs) providing microcredit services to the poor and the development of a handful of microfinance banks. In the early 1990s, standards began to emerge calling for stronger financial management of microcredit providers, particularly in their delinquency management and reporting. At the same time, credit unions and banks involved in microlending developed stronger monitoring techniques for their microcredit portfolios.
In 1995, The SEEP Network produced a monograph called Financial Ratio Analysis of Microfinance Institutions or Blue Book for short. Its primary objective was to introduce managers of microfinance organizations to the calculation and interpretation of financial ratios. The authors also hoped that the paper would contribute to the development and adoption of financial reporting standards in the microcredit community—and it did. Since 1995, hundreds of new MFIs have used the Ratios Monograph and other guides to develop financial statements and financial reports.
Since 1995, MFIs have grown in size, type, number, and complexity. At the same time, more emphasis has been placed on financial accountability, management, and viability.
The concept of standards has gained wide acceptance and numerous champions. Network organizations, CGAP and its donor members, the MicroBanking Bulletin, rating firms, and microfinance training centers, to a name a few, have worked hard to promote indicators based on common definitions and calculations.
On closer examination, however, many financial terms and indicators considered “standard” continue to differ in name and content among MFIs. This leads to confusion among practitioners and analysts and causes considerable distortions when comparing MFIs. The industry recognized this deficiency and agreed that developing standard definitions of financial terms and the most common indicators was an important next step in its development.
Measuring Performance of Microfinance Institutions: A Framework for Reporting, Analysis, and Monitoring
3
The 2002 Financial Definitions Guidelines have helped minimize much of the ambiguity by defining nearly 50 financial terms and providing calculation guidelines for 20 ratios. The authors trust that this Framework will move the industry one step further in the standardization effort by providing examples, identifying adjustments, and highlighting the indicators that are most important to monitor.
1.3 Future
This Framework is only one step in a larger Microfinance Performance Standards project developed by The SEEP Network. Gaining acceptance of these standards is a much longer process. SEEP is developing training materials and will be organizing training courses on standards that can be offered by microfinance networks, microfinance training and support centers, and others who want to bring the latest international standards to their market. SEEP is also working with donors, investors, rating firms, and other service providers to encourage them to incorporate the definitions presented here and in the Financial Definitions Guidelines into their own microfinance lexicon.
Standards in microfinance are evolving as the industry diversifies and matures and the authors of this Framework recognize that it does not fully incorporate the developing standards for measuring deposit-taking MFIs, nor does it include any of the growing set of social performance indicators. Both of these issues can be addressed as consensus grows on new indicators related to savings and social performance.
The Microfinance Information eXchange (MIX) is also making an effort to integrate microfinance standards with eXtensible Business Reporting Language (XBRL). XBRL is becoming the standard means of communicating business and financial data electronically, enabling all types of institutions to share and compare data. SEEP will work with the MIX to ensure the Framework can be supported by XBRL in the future.
1.4 Editions
Because this Framework is intended to represent the most up-to-date standards, only a limited number of each edition will be printed. The SEEP Network will update this Framework. To verify that the most current Framework is being used, visit the SEEP Web site at www.seepnetwork.org or contact The SEEP Network at 1825 Connecticut Avenue, NW, Washington, D.C. 20009, USA.
1.5 Content
The Framework currently consists of five chapters.
Chapter 2, Financial Statements and Reports, consists of the three major financial statements:
• Income statement, • Balance sheet, and• Cash flow statement.
Measuring Performance of Microfinance Institutions: A Framework for Reporting, Analysis, and Monitoring
4
It also includes two common MFI reports:
• Portfolio and Activity report and• Non-financial data report.
For each statement or report, a brief explanation of the purpose, a suggested format, and a definition of each account or term are provided.
Chapter 3, Analytical Adjustments, highlights the calculation and application of adjustments to financial statements. The minimum adjustments recommended for benchmarking and measuring “true performance” are as follows:
• Subsidy adjustments,• Inflation adjustment, and• Portfolio at risk adjustments.
Because of the Framework’s structure, the reader should first attempt to create a set of adjusted financial statements, as described in chapter 3, before calculating the ratios in chapter 4. The analytical adjustments are perhaps the most challenging part of this Framework. Although the adjustments are recommended, the user does not need to be able to complete each (or any) adjustment to calculate unadjusted ratios in chapter 4 or create an unadjusted performance report in chapter 5.
Chapter 4, Financial Ratios and Indicators, is dedicated to the definition and calculation of 18 performance ratios, most of which can be calculated on an unadjusted and adjusted basis. The SEEP Network puts forward a “SEEP 18” list of ratios, presented in four different categories:
• Profitability and sustainability,• Asset/liability management,• Portfolio quality, and• Efficiency and productivity.
Chapter 5, Creating and Analyzing Performance Monitoring Reports, provides some examples of different types of reports for different audiences: Management, Board of directors, Donors, Creditors and Investors.
Readers are welcome to create their own reports using this Framework. The reports in chapter 5 are presented only as examples.
Annexes to this Framework will be designed to assist managers who want to create statements and reports similar to those contained in this Framework.
1.6 Using the SEEP Framework
The authors assume the audience is familiar with microfinance institutions and has some basic knowledge of accounting and financial reporting, but they do not assume that all readers have full knowledge of how statements are constructed. Indeed, the purpose of this Framework is to instruct
Measuring Performance of Microfinance Institutions: A Framework for Reporting, Analysis, and Monitoring
5
managers on how to categorize data into statements and reports, analyze them, and use them for monitoring purposes.
The contributors to the Financial Definitions Guidelines and this Framework recognize that all microfinance institutions cannot use the same chart of accounts or accounting standards and practices. This Framework is for performance monitoring only and does not provide a chart of accounts or accounting policies. Regardless of local standards and requirements, an institution commonly develops useful reports for management purposes, board reporting, or external reporting. Even if certain formats are required by local authorities for external reports, this Framework can still be used for internal management purposes. The SEEP Network has engaged donors, investors, and other industry players to gain their acceptance of this reporting format so that MFIs will be able to use this same format for multiple stakeholders.
To use this Framework, the reader should first review the referencing and calculation conventions highlighted below.
1.6.1 Referencing
This Framework uses a reference system to assist the reader in identifying the terms used and to assist in interpreting formulas. For each statement or report, the line items are numbered consecutively and begin with one of the following letters:
I Income StatementB Balance SheetC Cash Flow StatementP Portfolio Report and Activity Report R RatiosA AdjustmentsN Non-Financial Data Report
1.6.2 Multiple Periods
To refer to accounts from different periods (that is, data from a previous period and data from the current period), a superscript number identifies the period as follows:
¹ = end of current period0 = end of previous period
As an example, during the calendar year 2004:
P1 = December 31, 2004P0 = December 31, 2003
If a period is not indicated, then the account is for the current period.
Measuring Performance of Microfinance Institutions: A Framework for Reporting, Analysis, and Monitoring
6
1.6.3 Averaging
Many financial ratios require an average for a balance sheet account. In this Framework, averages are indicated by the use of the superscript letters “avg”—for example:
Pavg
Averages for a period, such as a year, can be calculated by adding a beginning amount and an end amount and dividing the result by two—for example:
Pavg = [(P0 + P¹)/2]
Unfortunately, such simple average calculations often provide a distorted number, particularly for institutions whose loan portfolios are growing quickly or that experience significant seasonal fluctuations in lending activities. Period averages are much more meaningful when they are computed on a monthly or quarterly basis rather than an annual basis. When using multiple-period averages, the numerator is the sum of subperiods and the opening period, and the denominator is the total number of periods added above. As an example, a quarterly average would be calculated as follows:
Pavg = (P0 + P¹ + P2 + P3 + P4)5
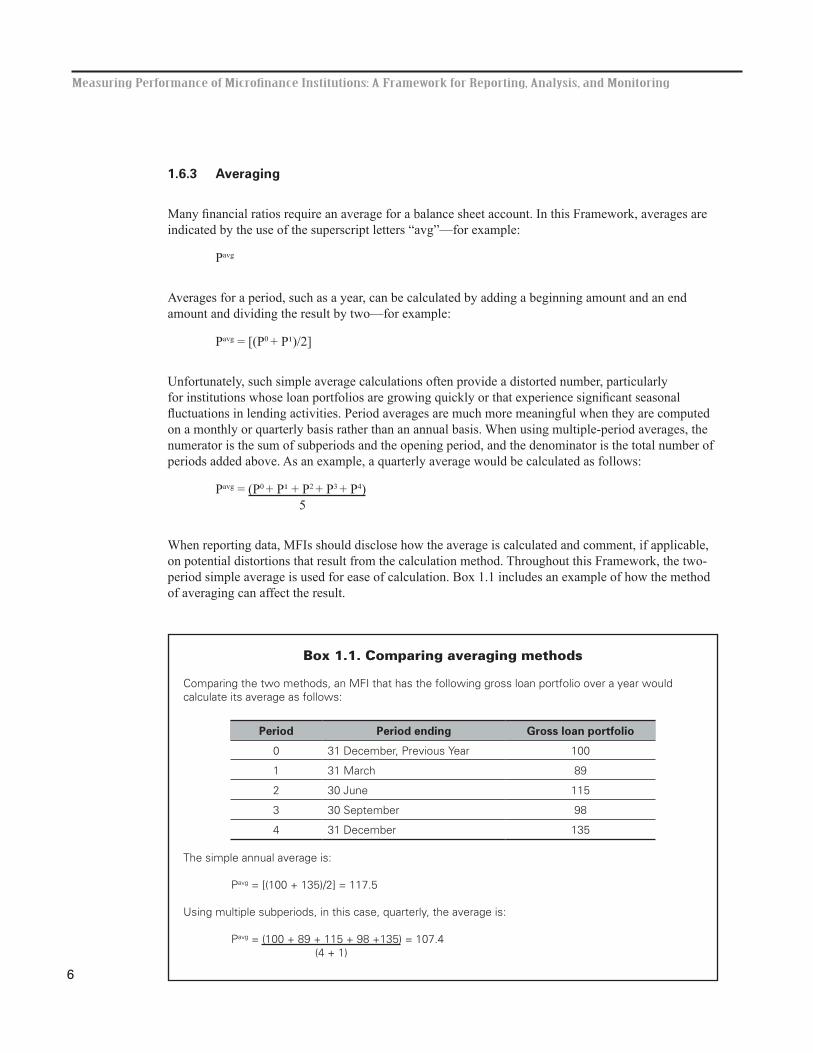
When reporting data, MFIs should disclose how the average is calculated and comment, if applicable, on potential distortions that result from the calculation method. Throughout this Framework, the two-period simple average is used for ease of calculation. Box 1.1 includes an example of how the method of averaging can affect the result.
Box 1.1. Comparing averaging methods
Comparing the two methods, an MFI that has the following gross loan portfolio over a year would calculate its average as follows:
Period Period ending Gross loan portfolio
0 31 December, Previous Year 100
1 31 March 89
2 30 June 115
3 30 September 98
4 31 December 135
The simple annual average is:
Pavg = [(100 + 135)/2] = 117.5
Using multiple subperiods, in this case, quarterly, the average is:
Pavg = (100 + 89 + 115 + 98 +135) = 107.4(4 + 1)
Measuring Performance of Microfinance Institutions: A Framework for Reporting, Analysis, and Monitoring
7
1.6.4 Annualizing
When calculating financial ratios in this Framework, the assumption is that the income statement represents a period of a year. If it does not, most income statement figures must be annualized before they can be compared with previous years or against other MFIs’ annual data.
To annualize a number, use this formula:
AA = [A x (12/M)]
where:
AA = annualized amountA = amountM = number of months in the period
For example, if the MFI has earned $100 in financial income at the end of nine months, the annualized figure is as follows:
AA = [100 x (12/9)] = 133.33
Annex B, “Annualizing Financial Statements,” will provide details on how to create an annualized statement.
1.6.5 Completing the Framework
The Framework is designed to be completed one step at a time. The user should first read chapter 2 and review how to put an MFI’s data into the suggested financial statements and report formats. Chapter 3 instructs the user on how these financial statements can be expressed on an adjusted basis. Financial ratios and indicators are explained in chapter 4 using data from chapters 2 and 3. Finally, chapter 5 provides several templates for performance monitoring reports for different types of users.
The sample statements and reports throughout this Framework include financial data as they would be presented for a typical MFI. Each statement relates to the other just as an MFI’s statements are linked. In this way, the reader can see how to create a performance monitoring system step by step.

9
2Financial Statements and Reports
The starting point for sound financial management is the timely and accurate production of financial reports, which requires punctual and accurate financial records. This begins with accounting: the process of recording financial transactions, grouping them together by category, and summarizing them for a certain period or at a certain point in time. The summarized information of all these transactions is placed in standardized financial statements.
Frequently, MFIs must produce financial statements based on a format required by lenders, donors, local regulators, or network organizations. Such statements may satisfy reporting requirements of one or more of those groups, but the required format may not be helpful as a management tool. Despite efforts to create standard accounting practices or terminology, such as the International Financial Reporting Standards (IFRS) and the Financial Definitions Guidelines, few attempts to harmonize the content and presentation of financial statements have been made.
2.1 Using the Framework for MFI Statements and Reports
As any financial manager can attest to, financial statements can be used to conceal as much as to reveal. If financial statements are to be used as a management tool, each statement should tell the manager, analyst, or other reviewer the true financial performance or financial condition of the MFI. This chapter provides a brief description of MFI financial statements, a description of the main financial accounts, and sample formats that are useful for MFI managers and others.
All MFIs must develop financial statements. These statements are the primary means for an institution to express its financial activities. Some statements contain stock data, which “take stock” or present data at a moment in time. Other statements contain flow data, which report on the flow or summary of transactions over a defined period. Because an MFI’s core business is the provision of financial services, the financial statements and reports are very similar to those of traditional financial institutions. MFI financial statements and reports include the following:
• Income Statements (or profit and loss statements),• Balance Sheets (or statements of financial position), • Cash Flow Statements (or sources and uses of funds statements), and• Portfolio Reports.
To complete this Framework, MFIs will also have to complete a fifth report, a non-financial data report. This report contains information that is needed to calculate financial ratios or adjustments but is not included in the financial statements.
Measuring Performance of Microfinance Institutions: A Framework for Reporting, Analysis, and Monitoring
10
A sixth report, the Statement of Changes in Equity Position (or statement of changes in net worth), is common among for-profit MFIs. This flow statement shows how financial transactions during a particular period have affected the equity of the MFI. It helps investors or donors assess the net worth of the MFI, usually on a per shareholder basis. This statement will not be included in this discussion; an example, however, will be provided in annex D.
In designing the statements, the authors considered the most commonly used formats and selected the ones that contained a reasonable number of accounts organized as clearly as possible. The formats presented below include the minimum breakdown of financial information required to complete the overall Framework and be in accordance with IFRS. These formats have been reviewed for IFRS compliance and, as of this edition, no material conflicts exist.
2.1.1 Mapping Accounts
The authors recognize that different MFIs use different names for accounts. One MFI’s revenue is an-other’s income. MFIs are encouraged to use the terminology in this Framework whenever possible. The definitions presented in this chapter will help the user match an MFI’s accounts to this Framework. An example of how to match or “map” an MFI’s accounts to this Framework will be provided in annex A.
2.1.2 Adding Accounts
Users may want to create subaccounts under some of the income statement and balance sheet accounts for management purposes. As an example, the Framework contains only two categories of Administra-tive Expenses: (I19) Depreciation and Amortization; and (I20) Other Administrative Expenses. Adding subaccounts, such as the following, is easy:
(I20) Other Administrative Expense(I20-1) Rent (I20-2) Transportation Expenses(I20-3) Office Supplies
Adding subaccounts enables users to track certain accounts particular to their business while maintaining consistency with industry standards. Note that this Framework is not a substitute for a chart of accounts, and any accounts added are for analytical rather than accounting purposes.
2.1.3 Segregating Financial and Non-Financial Services
Many organizations conduct both financial and non-financial operations. If non-financial services ac-count for a small portion of the MFI’s activities (that is, if they do not require significant fixed assets or if the services, such as training, are mandatory to receive loans), classifying all income and expenses related to these activities as non-operating items may make sense. If non-financial operations are sig-nificant, a manager should allocate costs among different programs and develop segregated financial statements that treat the financial service operations as a separate business.
Measuring Performance of Microfinance Institutions: A Framework for Reporting, Analysis, and Monitoring
11
For more information on how to allocate costs and segregate financial statements, see Cost Allocation for Multi-Service Microfinance Institutions.1
2.1.4 Cash or Accrual Accounting
Institutions use cash or accrual accounting or some mixture of both. Cash accounting requires that revenue and expense items are not booked until a cash payment is received or paid. Accrual-based ac-counting is a system in which revenues and expenses are recognized and booked in the period in which they arise, regardless of when the cash for the revenue or expense actually changes hands. Institutions using either method can use this Framework. The user should be aware, however, that both methods have some distortion effect.
2.2 Income Statement
The income statement is a flow statement that represents activity over a given period, such as a day, month, quarter, or year. The income statement may also be referred to as a profit and loss statement because it illustrates the overall net profit or loss for that period (nonprofit MFIs may also use the terms net surplus or deficit). The income statement summarizes all the revenue and expense transactions for a defined period, usually the financial year to date. The income statement may have two columns of data showing present and past period performance to facilitate comparison.
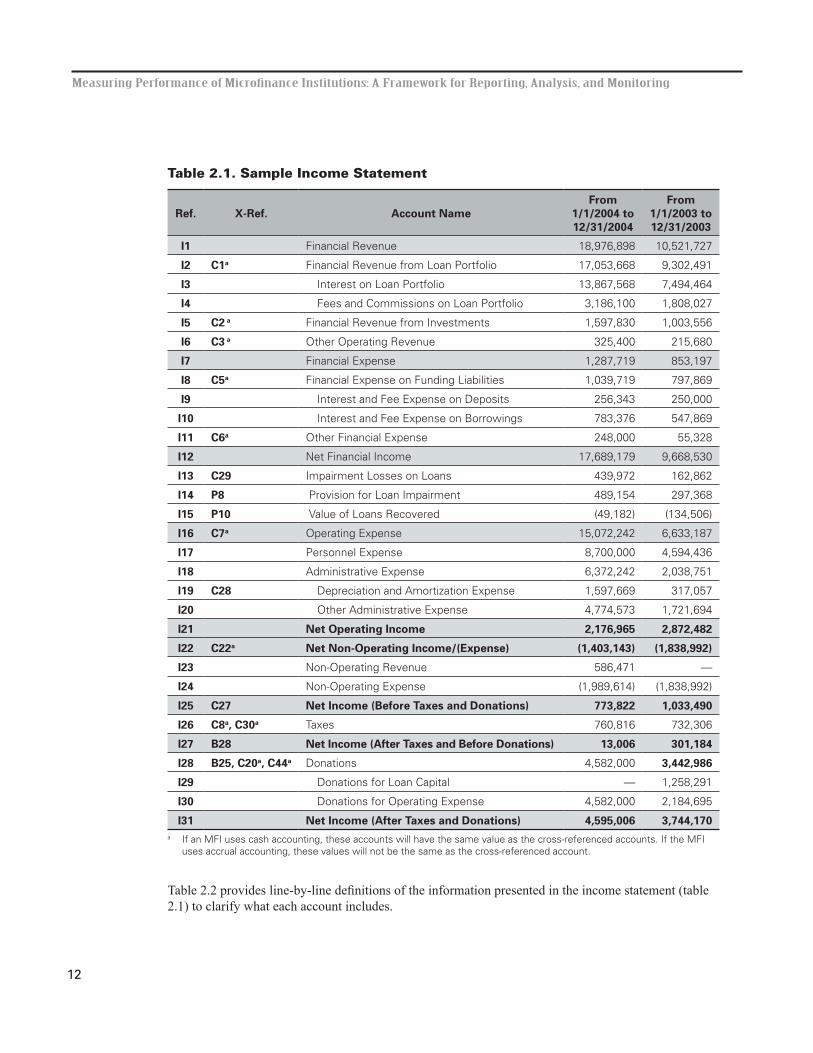
The presentation of the income statement is normally divided between revenue accounts and expense accounts. It also usually includes some division of operating accounts and non-operating accounts. Operating accounts include all revenue and expenses that are directly related to the MFI’s core business of making loans, accepting deposits, borrowing funds, and providing other financial services. Non-operating accounts include all revenue and expenses that result from activities outside the MFI’s core financial business, such as training or the sale of merchandise. Although many MFIs have ongoing support from donors, donations and grant funds from donors are considered to be non-operating revenue. In this Framework, all donations for loan capital and operating expenses are included in the income statement. Table 2.1 shows a sample income statement. Box 2.1 includes a discussion on the “bottom line” of an income statement.
1 Brigit Helms, 1998, Cost Allocation for Multi-Service Microfinance Institutions, Occasional Paper No. 2 (Washington, D.C.: CGAP). http://www.cgap.org/publications/financial_transparency.html.
Measuring Performance of Microfinance Institutions: A Framework for Reporting, Analysis, and Monitoring
12
Table 2.1. Sample Income Statement
Ref. X-Ref. Account NameFrom
1/1/2004 to 12/31/2004
From 1/1/2003 to 12/31/2003
I1 Financial Revenue 18,976,898 10,521,727
I2 C1a Financial Revenue from Loan Portfolio 17,053,668 9,302,491
I3 Interest on Loan Portfolio 13,867,568 7,494,464
I4 Fees and Commissions on Loan Portfolio 3,186,100 1,808,027
I5 C2 a Financial Revenue from Investments 1,597,830 1,003,556
I6 C3 a Other Operating Revenue 325,400 215,680
I7 Financial Expense 1,287,719 853,197
I8 C5a Financial Expense on Funding Liabilities 1,039,719 797,869
I9 Interest and Fee Expense on Deposits 256,343 250,000
I10 Interest and Fee Expense on Borrowings 783,376 547,869
I11 C6a Other Financial Expense 248,000 55,328
I12 Net Financial Income 17,689,179 9,668,530
I13 C29 Impairment Losses on Loans 439,972 162,862
I14 P8 Provision for Loan Impairment 489,154 297,368
I15 P10 Value of Loans Recovered (49,182) (134,506)
I16 C7a Operating Expense 15,072,242 6,633,187
I17 Personnel Expense 8,700,000 4,594,436
I18 Administrative Expense 6,372,242 2,038,751
I19 C28 Depreciation and Amortization Expense 1,597,669 317,057
I20 Other Administrative Expense 4,774,573 1,721,694
I21 Net Operating Income 2,176,965 2,872,482
I22 C22a Net Non-Operating Income/(Expense) (1,403,143) (1,838,992)
I23 Non-Operating Revenue 586,471 —
I24 Non-Operating Expense (1,989,614) (1,838,992)
I25 C27 Net Income (Before Taxes and Donations) 773,822 1,033,490
I26 C8a, C30a Taxes 760,816 732,306
I27 B28 Net Income (After Taxes and Before Donations) 13,006 301,184
I28 B25, C20a, C44a Donations 4,582,000 3,442,986
I29 Donations for Loan Capital — 1,258,291
I30 Donations for Operating Expense 4,582,000 2,184,695
I31 Net Income (After Taxes and Donations) 4,595,006 3,744,170a If an MFI uses cash accounting, these accounts will have the same value as the cross-referenced accounts. If the MFI
uses accrual accounting, these values will not be the same as the cross-referenced account.
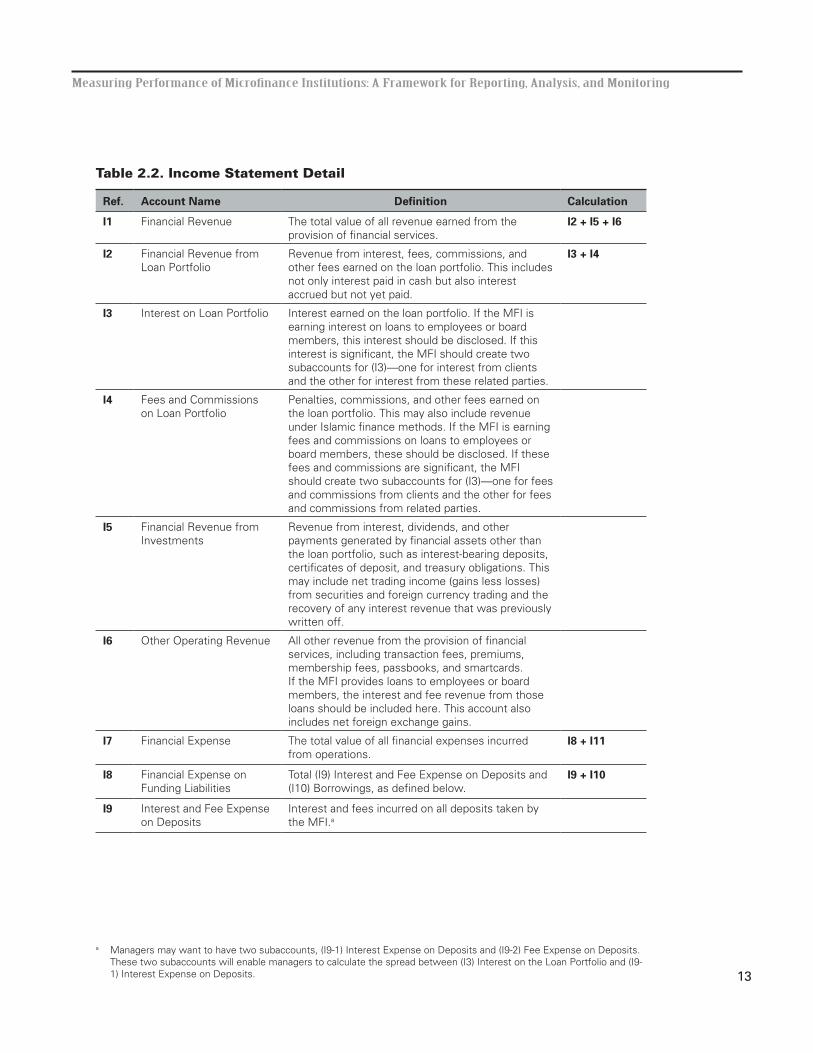
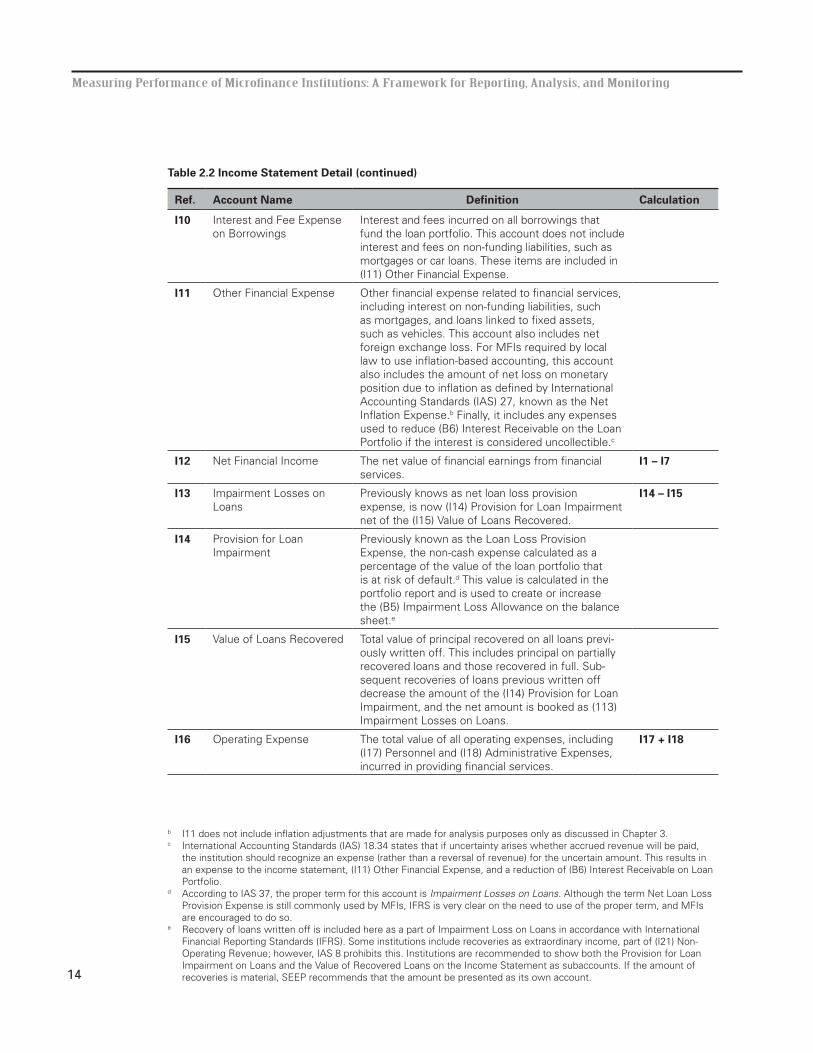
Table 2.2 provides line-by-line definitions of the information presented in the income statement (table 2.1) to clarify what each account includes.
Measuring Performance of Microfinance Institutions: A Framework for Reporting, Analysis, and Monitoring
13
Table 2.2. Income Statement Detail
Ref. Account Name Definition Calculation
I1 Financial Revenue The total value of all revenue earned from the provision of financial services.
I2 + I5 + I6
I2 Financial Revenue from Loan Portfolio
Revenue from interest, fees, commissions, and other fees earned on the loan portfolio. This includes not only interest paid in cash but also interest accrued but not yet paid.
I3 + I4
I3 Interest on Loan Portfolio Interest earned on the loan portfolio. If the MFI is earning interest on loans to employees or board members, this interest should be disclosed. If this interest is significant, the MFI should create two subaccounts for (I3)—one for interest from clients and the other for interest from these related parties.
I4 Fees and Commissions on Loan Portfolio
Penalties, commissions, and other fees earned on the loan portfolio. This may also include revenue under Islamic finance methods. If the MFI is earning fees and commissions on loans to employees or board members, these should be disclosed. If these fees and commissions are significant, the MFI should create two subaccounts for (I3)—one for fees and commissions from clients and the other for fees and commissions from related parties.
I5 Financial Revenue from Investments
Revenue from interest, dividends, and other payments generated by financial assets other than the loan portfolio, such as interest-bearing deposits, certificates of deposit, and treasury obligations. This may include net trading income (gains less losses) from securities and foreign currency trading and the recovery of any interest revenue that was previously written off.
I6 Other Operating Revenue All other revenue from the provision of financial services, including transaction fees, premiums, membership fees, passbooks, and smartcards. If the MFI provides loans to employees or board members, the interest and fee revenue from those loans should be included here. This account also includes net foreign exchange gains.
I7 Financial Expense The total value of all financial expenses incurred from operations.
I8 + I11
I8 Financial Expense on Funding Liabilities
Total (I9) Interest and Fee Expense on Deposits and (I10) Borrowings, as defined below.
I9 + I10
I9 Interest and Fee Expense on Deposits
Interest and fees incurred on all deposits taken by the MFI.a
a Managers may want to have two subaccounts, (I9-1) Interest Expense on Deposits and (I9-2) Fee Expense on Deposits. These two subaccounts will enable managers to calculate the spread between (I3) Interest on the Loan Portfolio and (I9-1) Interest Expense on Deposits.
Measuring Performance of Microfinance Institutions: A Framework for Reporting, Analysis, and Monitoring
14
Ref. Account Name Definition Calculation
I10 Interest and Fee Expense on Borrowings
Interest and fees incurred on all borrowings that fund the loan portfolio. This account does not include interest and fees on non-funding liabilities, such as mortgages or car loans. These items are included in (I11) Other Financial Expense.
I11 Other Financial Expense Other financial expense related to financial services, including interest on non-funding liabilities, such as mortgages, and loans linked to fixed assets, such as vehicles. This account also includes net foreign exchange loss. For MFIs required by local law to use inflation-based accounting, this account also includes the amount of net loss on monetary position due to inflation as defined by International Accounting Standards (IAS) 27, known as the Net Inflation Expense.b Finally, it includes any expenses used to reduce (B6) Interest Receivable on the Loan Portfolio if the interest is considered uncollectible.c
I12 Net Financial Income The net value of financial earnings from financial services.
I1 – I7
I13 Impairment Losses on Loans
Previously knows as net loan loss provision expense, is now (I14) Provision for Loan Impairment net of the (I15) Value of Loans Recovered.
I14 – I15
I14 Provision for Loan Impairment
Previously known as the Loan Loss Provision Expense, the non-cash expense calculated as a percentage of the value of the loan portfolio that is at risk of default.d This value is calculated in the portfolio report and is used to create or increase the (B5) Impairment Loss Allowance on the balance sheet.e
I15 Value of Loans Recovered Total value of principal recovered on all loans previ-ously written off. This includes principal on partially recovered loans and those recovered in full. Sub-sequent recoveries of loans previous written off decrease the amount of the (I14) Provision for Loan Impairment, and the net amount is booked as (113) Impairment Losses on Loans.
I16 Operating Expense The total value of all operating expenses, including (I17) Personnel and (I18) Administrative Expenses, incurred in providing financial services.
I17 + I18
Table 2.2 Income Statement Detail (continued)
b I11 does not include inflation adjustments that are made for analysis purposes only as discussed in Chapter 3.c International Accounting Standards (IAS) 18.34 states that if uncertainty arises whether accrued revenue will be paid,
the institution should recognize an expense (rather than a reversal of revenue) for the uncertain amount. This results in an expense to the income statement, (I11) Other Financial Expense, and a reduction of (B6) Interest Receivable on Loan Portfolio.
d According to IAS 37, the proper term for this account is Impairment Losses on Loans. Although the term Net Loan Loss Provision Expense is still commonly used by MFIs, IFRS is very clear on the need to use of the proper term, and MFIs are encouraged to do so.
e Recovery of loans written off is included here as a part of Impairment Loss on Loans in accordance with International Financial Reporting Standards (IFRS). Some institutions include recoveries as extraordinary income, part of (I21) Non-Operating Revenue; however, IAS 8 prohibits this. Institutions are recommended to show both the Provision for Loan Impairment on Loans and the Value of Recovered Loans on the Income Statement as subaccounts. If the amount of recoveries is material, SEEP recommends that the amount be presented as its own account.
Measuring Performance of Microfinance Institutions: A Framework for Reporting, Analysis, and Monitoring
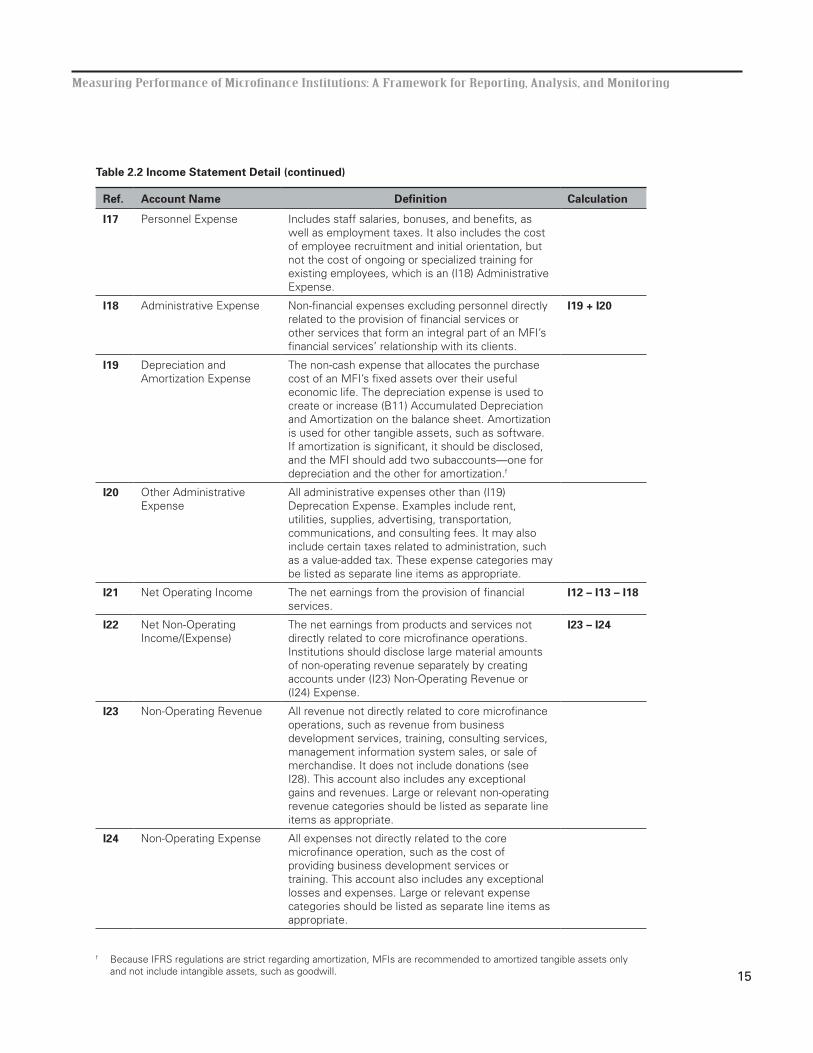
15
Ref. Account Name Definition Calculation
I17 Personnel Expense Includes staff salaries, bonuses, and benefits, as well as employment taxes. It also includes the cost of employee recruitment and initial orientation, but not the cost of ongoing or specialized training for existing employees, which is an (I18) Administrative Expense.
I18 Administrative Expense Non-financial expenses excluding personnel directly related to the provision of financial services or other services that form an integral part of an MFI’s financial services’ relationship with its clients.
I19 + I20
I19 Depreciation and Amortization Expense
The non-cash expense that allocates the purchase cost of an MFI’s fixed assets over their useful economic life. The depreciation expense is used to create or increase (B11) Accumulated Depreciation and Amortization on the balance sheet. Amortization is used for other tangible assets, such as software. If amortization is significant, it should be disclosed, and the MFI should add two subaccounts—one for depreciation and the other for amortization.f
I20 Other Administrative Expense
All administrative expenses other than (I19) Deprecation Expense. Examples include rent, utilities, supplies, advertising, transportation, communications, and consulting fees. It may also include certain taxes related to administration, such as a value-added tax. These expense categories may be listed as separate line items as appropriate.
I21 Net Operating Income The net earnings from the provision of financial services.
I12 – I13 – I18
I22 Net Non-Operating Income/(Expense)
The net earnings from products and services not directly related to core microfinance operations. Institutions should disclose large material amounts of non-operating revenue separately by creating accounts under (I23) Non-Operating Revenue or (I24) Expense.
I23 – I24
I23 Non-Operating Revenue All revenue not directly related to core microfinance operations, such as revenue from business development services, training, consulting services, management information system sales, or sale of merchandise. It does not include donations (see I28). This account also includes any exceptional gains and revenues. Large or relevant non-operating revenue categories should be listed as separate line items as appropriate.
I24 Non-Operating Expense All expenses not directly related to the core microfinance operation, such as the cost of providing business development services or training. This account also includes any exceptional losses and expenses. Large or relevant expense categories should be listed as separate line items as appropriate.
Table 2.2 Income Statement Detail (continued)
f Because IFRS regulations are strict regarding amortization, MFIs are recommended to amortized tangible assets only and not include intangible assets, such as goodwill.
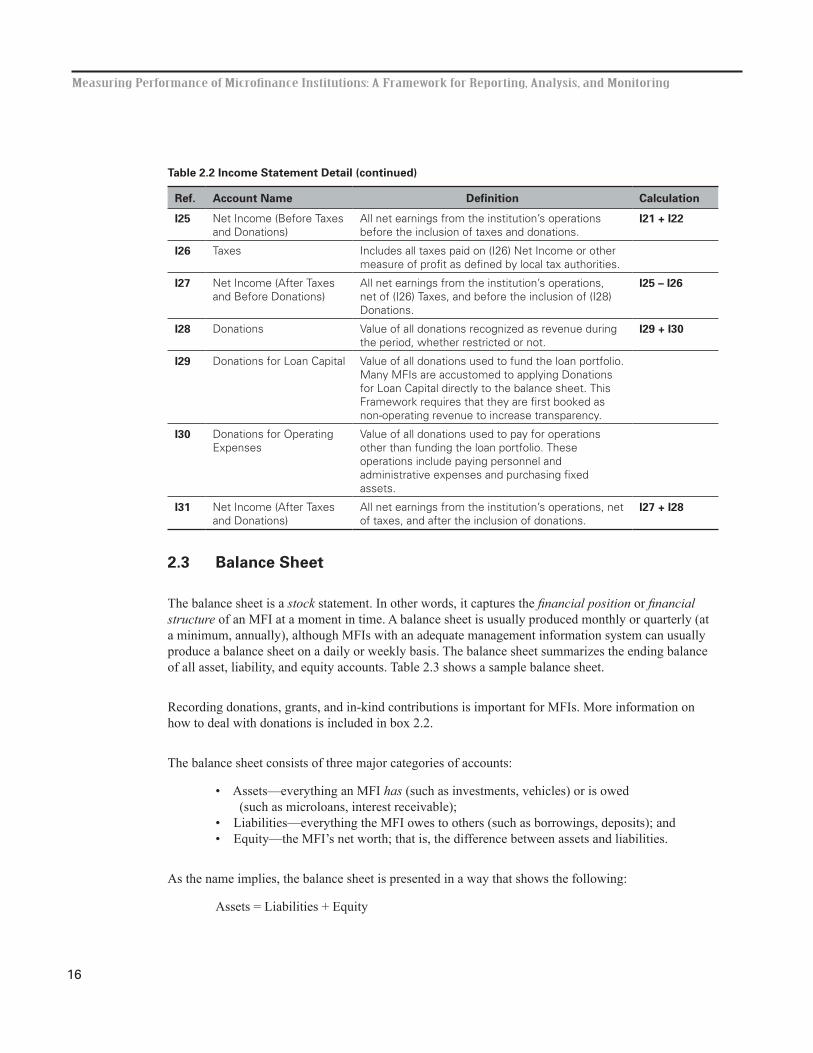
Measuring Performance of Microfinance Institutions: A Framework for Reporting, Analysis, and Monitoring
16
Ref. Account Name Definition Calculation
I25 Net Income (Before Taxes and Donations)
All net earnings from the institution’s operations before the inclusion of taxes and donations.
I21 + I22
I26 Taxes Includes all taxes paid on (I26) Net Income or other measure of profit as defined by local tax authorities.
I27 Net Income (After Taxes and Before Donations)
All net earnings from the institution’s operations, net of (I26) Taxes, and before the inclusion of (I28) Donations.
I25 – I26
I28 Donations Value of all donations recognized as revenue during the period, whether restricted or not.
I29 + I30
I29 Donations for Loan Capital Value of all donations used to fund the loan portfolio. Many MFIs are accustomed to applying Donations for Loan Capital directly to the balance sheet. This Framework requires that they are first booked as non-operating revenue to increase transparency.
I30 Donations for Operating Expenses
Value of all donations used to pay for operations other than funding the loan portfolio. These operations include paying personnel and administrative expenses and purchasing fixed assets.
I31 Net Income (After Taxes and Donations)
All net earnings from the institution’s operations, net of taxes, and after the inclusion of donations.
I27 + I28
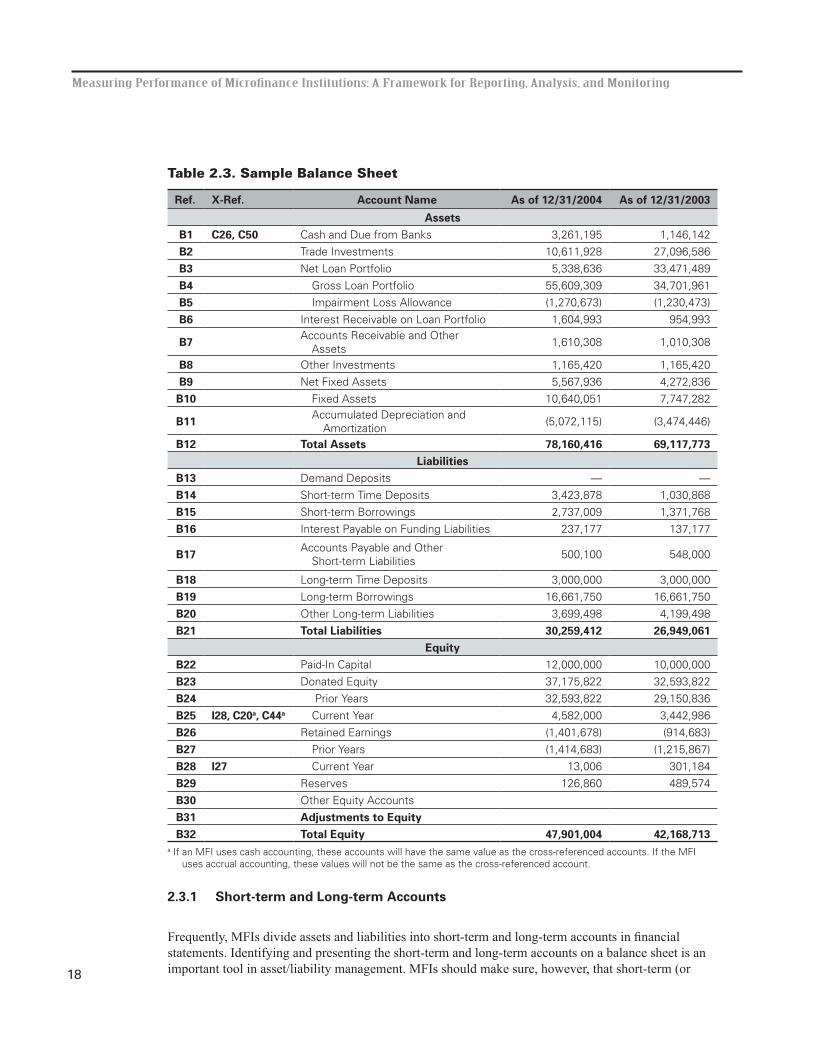
2.3 Balance Sheet
The balance sheet is a stock statement. In other words, it captures the financial position or financial structure of an MFI at a moment in time. A balance sheet is usually produced monthly or quarterly (at a minimum, annually), although MFIs with an adequate management information system can usually produce a balance sheet on a daily or weekly basis. The balance sheet summarizes the ending balance of all asset, liability, and equity accounts. Table 2.3 shows a sample balance sheet.
Recording donations, grants, and in-kind contributions is important for MFIs. More information on how to deal with donations is included in box 2.2.
The balance sheet consists of three major categories of accounts:
• Assets—everything an MFI has (such as investments, vehicles) or is owed (such as microloans, interest receivable);• Liabilities—everything the MFI owes to others (such as borrowings, deposits); and• Equity—the MFI’s net worth; that is, the difference between assets and liabilities.
As the name implies, the balance sheet is presented in a way that shows the following:
Assets = Liabilities + Equity
Table 2.2 Income Statement Detail (continued)

Measuring Performance of Microfinance Institutions: A Framework for Reporting, Analysis, and Monitoring
17
Box 2.1. Where is the Bottom Line?
The bottom line is not as easy to find as it may sound. MFI managers need to know the differences among the many “bottom lines” and recognize that each may have a place in evaluating the financial condition of an institution. Understanding what contributes to the bottom line and clearly defining the bottom line is important in making decisions that will fulfill the MFI’s objectives.
(I21) Net Operating Income. The microfinance industry has traditionally considered revenue from operations less expenses from operations to be the bottom line. This excludes all non-operating items that are considered separate from the core business of providing financial services. Because donations are not included in net operating income, it clearly is a “before donations” measure of profitability. This measure, however, can also be presented on a “before tax” or “after tax” basis.
(I27) Net Income After Taxes and Before Donations. Another bottom line is Net Income After Taxes and Before Donations, which includes other non-operating revenue and all non-operating expenses, but excludes donations. The argument is that even if these revenue and expense items are not directly related to financial services, they do affect the MFI’s ability to operate profitably and, therefore, must be included when considering an MFI’s financial health.
(I31) Net Income After Taxes and Donations. From a regulator’s perspective, the bottom line might be total revenue less total expenses. Although donations and other non-operating items may not be related to the MFI’s core business, they may a normal part of the MFI’s activity (such as training revenue or expenses) that increase or decrease and MFI’s net profit.
Adjusted Net Operating Income. The “adjusted” bottom line also exists. Adjustments are additions or subtractions from net income that are intended to compensate for the effects of inflation, subsidies, and other “hidden” items. MFI analysts often restate an MFI’s income statement on an adjusted basis. The primary adjustments are discussed in chapter 3.
Net Results. To make matters more complex, the microfinance community frequently refers to the “double bottom line,” which highlights its twin goals of reaching financial sustainability while maximizing social returns—that is, reaching more or poorer clients. Many microfinance network organizations have developed social indicators that combine financial and demographic data to determine whether the MFI is serving poorer clients.*
For calculating ratios in this Framework, the “bottom line” is generally considered to be (I21) Net Operating Income less (I26) Taxes or Adjusted Net Income less (I26) Taxes if the user is able to complete the adjustments outlined in chapter 3.
—Adapted from Tillman Bruett, et al., Técnicas de gestão microfinanceira, Programa de Desenvolvlimento Institucional (Rio de Jainero: BNDES), 196.
* For more information on social performance indicators, visit SEEP’s Web site at www.seepnetwork.org and search for Pro-Client Working Group.
Measuring Performance of Microfinance Institutions: A Framework for Reporting, Analysis, and Monitoring
18
Table 2.3. Sample Balance Sheet
Ref. X-Ref. Account Name As of 12/31/2004 As of 12/31/2003
AssetsB1 C26, C50 Cash and Due from Banks 3,261,195 1,146,142
B2 Trade Investments 10,611,928 27,096,586
B3 Net Loan Portfolio 5,338,636 33,471,489
B4 Gross Loan Portfolio 55,609,309 34,701,961
B5 Impairment Loss Allowance (1,270,673) (1,230,473)
B6 Interest Receivable on Loan Portfolio 1,604,993 954,993
B7 Accounts Receivable and Other Assets
1,610,308 1,010,308
B8 Other Investments 1,165,420 1,165,420
B9 Net Fixed Assets 5,567,936 4,272,836
B10 Fixed Assets 10,640,051 7,747,282
B11 Accumulated Depreciation and Amortization
(5,072,115) (3,474,446)
B12 Total Assets 78,160,416 69,117,773Liabilities
B13 Demand Deposits — —
B14 Short-term Time Deposits 3,423,878 1,030,868
B15 Short-term Borrowings 2,737,009 1,371,768
B16 Interest Payable on Funding Liabilities 237,177 137,177
B17 Accounts Payable and Other Short-term Liabilities
500,100 548,000
B18 Long-term Time Deposits 3,000,000 3,000,000
B19 Long-term Borrowings 16,661,750 16,661,750
B20 Other Long-term Liabilities 3,699,498 4,199,498
B21 Total Liabilities 30,259,412 26,949,061Equity
B22 Paid-In Capital 12,000,000 10,000,000
B23 Donated Equity 37,175,822 32,593,822
B24 Prior Years 32,593,822 29,150,836
B25 I28, C20a, C44a Current Year 4,582,000 3,442,986
B26 Retained Earnings (1,401,678) (914,683)
B27 Prior Years (1,414,683) (1,215,867)
B28 I27 Current Year 13,006 301,184
B29 Reserves 126,860 489,574
B30 Other Equity Accounts
B31 Adjustments to EquityB32 Total Equity 47,901,004 42,168,713
a If an MFI uses cash accounting, these accounts will have the same value as the cross-referenced accounts. If the MFI uses accrual accounting, these values will not be the same as the cross-referenced account.
2.3.1 Short-term and Long-term Accounts
Frequently, MFIs divide assets and liabilities into short-term and long-term accounts in financial statements. Identifying and presenting the short-term and long-term accounts on a balance sheet is an important tool in asset/liability management. MFIs should make sure, however, that short-term (or
Measuring Performance of Microfinance Institutions: A Framework for Reporting, Analysis, and Monitoring
19
current) assets and liabilities can be turned into cash within a year from the date of the statement or report—not from the date of disbursement, issuance, or purchase. In addition, short-term assets and liabilities include any portion of a long-term asset or liability that is receivable or payable within a year, even if the final maturity date is more than a year from the report or statement date.
According to IAS, the most useful approach to the classification of assets and liabilities on a balance sheet is to group them first by type and second by maturity.2 For this reason and to simplify this Framework, the entire (B4) Gross Loan Portfolio, regardless of maturity, is contained in a single account. For disclosure purposes, MFIs may want to include two or more subaccounts under Gross Loan Portfolio to separate the portion of all loans due within 12 months and those due after 12 months from the statement date. For example:
(B4) Gross Loan Portfolio(B4-1) Gross Loan Portfolio Due in ≤ 12 Months(B4-2) Gross Loan Portfolio Due in > 12 Months
In addition, MFIs should note that a balance sheet refers to (B2) Trade Investments and (B8) Other Investments rather than short-term and long-term investments. This reflects IFRS principles that state that an MFI’s use or intended use of a financial asset is more relevant than its actual maturity. For example, an MFI may hold a long-term treasury note for only a few months for liquidity management. Therefore, to classify it as a long-term financial instrument is misleading. This Framework has adopted this convention rather than the old method of classifying investments by maturity.
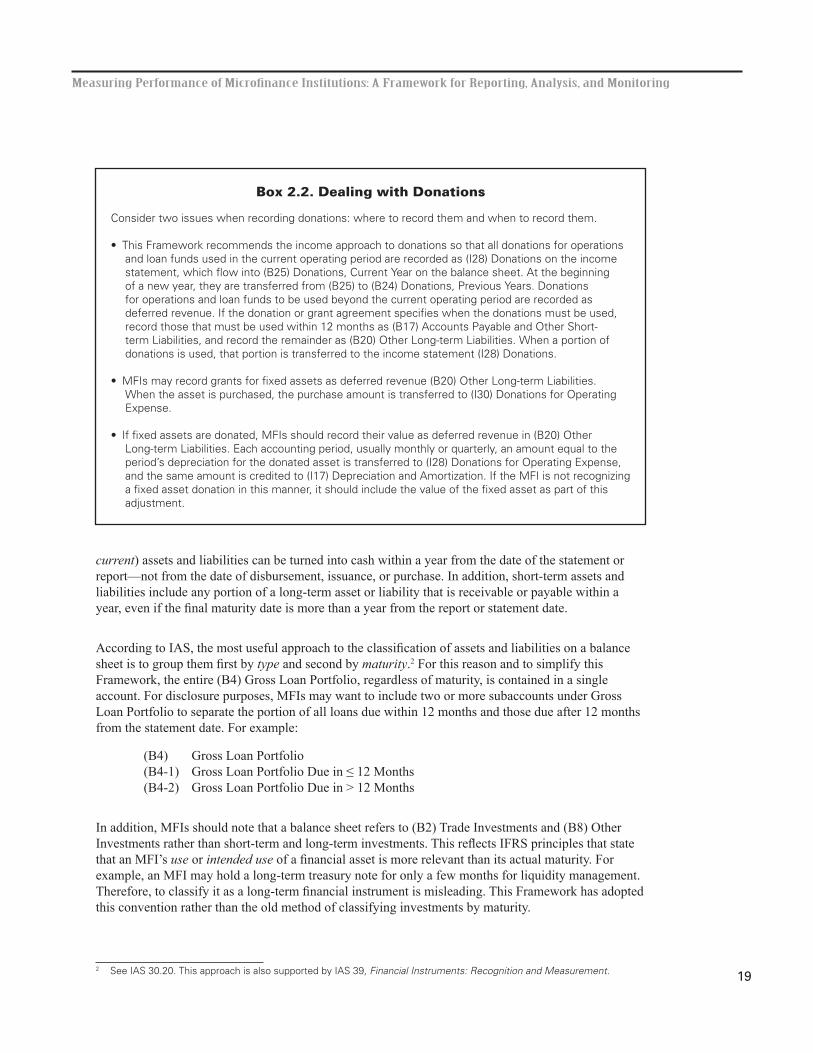
Box 2.2. Dealing with Donations
Consider two issues when recording donations: where to record them and when to record them.
• This Framework recommends the income approach to donations so that all donations for operations and loan funds used in the current operating period are recorded as (I28) Donations on the income statement, which flow into (B25) Donations, Current Year on the balance sheet. At the beginning of a new year, they are transferred from (B25) to (B24) Donations, Previous Years. Donations for operations and loan funds to be used beyond the current operating period are recorded as deferred revenue. If the donation or grant agreement specifies when the donations must be used, record those that must be used within 12 months as (B17) Accounts Payable and Other Short-term Liabilities, and record the remainder as (B20) Other Long-term Liabilities. When a portion of donations is used, that portion is transferred to the income statement (I28) Donations.
• MFIs may record grants for fixed assets as deferred revenue (B20) Other Long-term Liabilities. When the asset is purchased, the purchase amount is transferred to (I30) Donations for Operating Expense.
• If fixed assets are donated, MFIs should record their value as deferred revenue in (B20) Other Long-term Liabilities. Each accounting period, usually monthly or quarterly, an amount equal to the period’s depreciation for the donated asset is transferred to (I28) Donations for Operating Expense, and the same amount is credited to (I17) Depreciation and Amortization. If the MFI is not recognizing a fixed asset donation in this manner, it should include the value of the fixed asset as part of this adjustment.
2 See IAS 30.20. This approach is also supported by IAS 39, Financial Instruments: Recognition and Measurement.
Measuring Performance of Microfinance Institutions: A Framework for Reporting, Analysis, and Monitoring
20
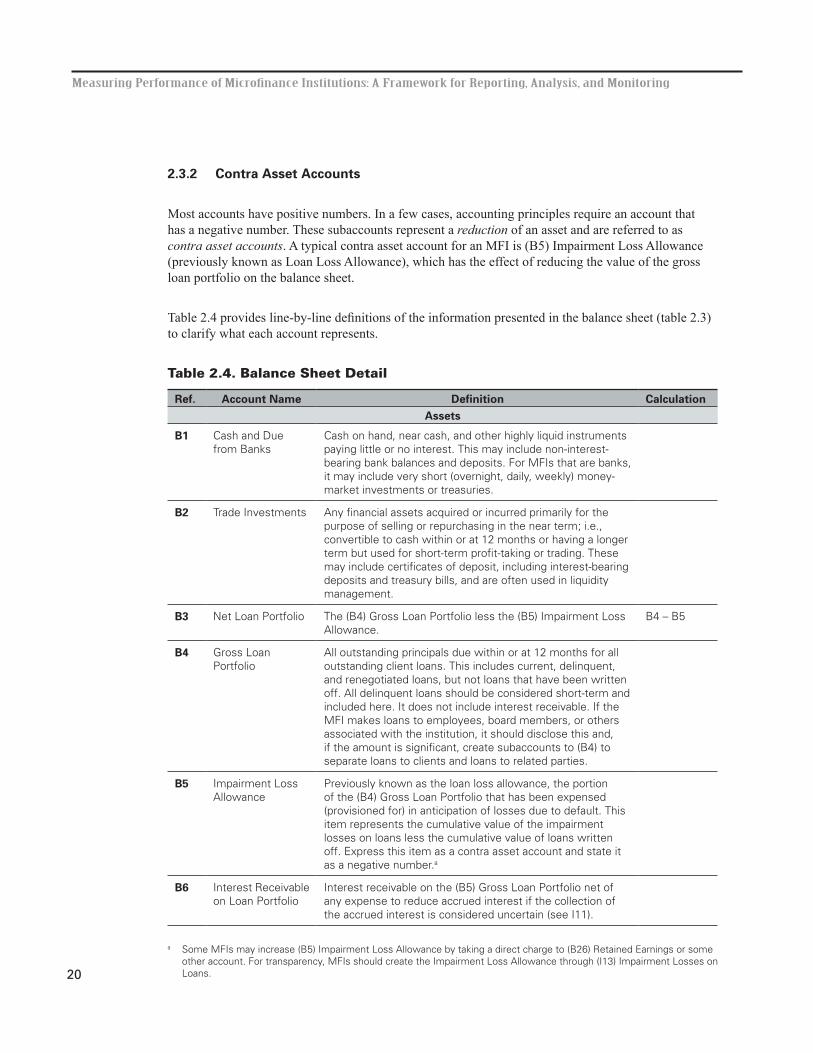
2.3.2 Contra Asset Accounts
Most accounts have positive numbers. In a few cases, accounting principles require an account that has a negative number. These subaccounts represent a reduction of an asset and are referred to as contra asset accounts. A typical contra asset account for an MFI is (B5) Impairment Loss Allowance (previously known as Loan Loss Allowance), which has the effect of reducing the value of the gross loan portfolio on the balance sheet.
Table 2.4 provides line-by-line definitions of the information presented in the balance sheet (table 2.3) to clarify what each account represents.
Table 2.4. Balance Sheet Detail
Ref. Account Name Definition CalculationAssets
B1 Cash and Due from Banks
Cash on hand, near cash, and other highly liquid instruments paying little or no interest. This may include non-interest-bearing bank balances and deposits. For MFIs that are banks, it may include very short (overnight, daily, weekly) money-market investments or treasuries.
B2 Trade Investments Any financial assets acquired or incurred primarily for the purpose of selling or repurchasing in the near term; i.e., convertible to cash within or at 12 months or having a longer term but used for short-term profit-taking or trading. These may include certificates of deposit, including interest-bearing deposits and treasury bills, and are often used in liquidity management.
B3 Net Loan Portfolio The (B4) Gross Loan Portfolio less the (B5) Impairment Loss Allowance.
B4 – B5
B4 Gross Loan Portfolio
All outstanding principals due within or at 12 months for all outstanding client loans. This includes current, delinquent, and renegotiated loans, but not loans that have been written off. All delinquent loans should be considered short-term and included here. It does not include interest receivable. If the MFI makes loans to employees, board members, or others associated with the institution, it should disclose this and, if the amount is significant, create subaccounts to (B4) to separate loans to clients and loans to related parties.
B5 Impairment Loss Allowance
Previously known as the loan loss allowance, the portion of the (B4) Gross Loan Portfolio that has been expensed (provisioned for) in anticipation of losses due to default. This item represents the cumulative value of the impairment losses on loans less the cumulative value of loans written off. Express this item as a contra asset account and state it as a negative number.a
B6 Interest Receivable on Loan Portfolio
Interest receivable on the (B5) Gross Loan Portfolio net of any expense to reduce accrued interest if the collection of the accrued interest is considered uncertain (see I11).
a Some MFIs may increase (B5) Impairment Loss Allowance by taking a direct charge to (B26) Retained Earnings or some other account. For transparency, MFIs should create the Impairment Loss Allowance through (I13) Impairment Losses on Loans.
Measuring Performance of Microfinance Institutions: A Framework for Reporting, Analysis, and Monitoring
21
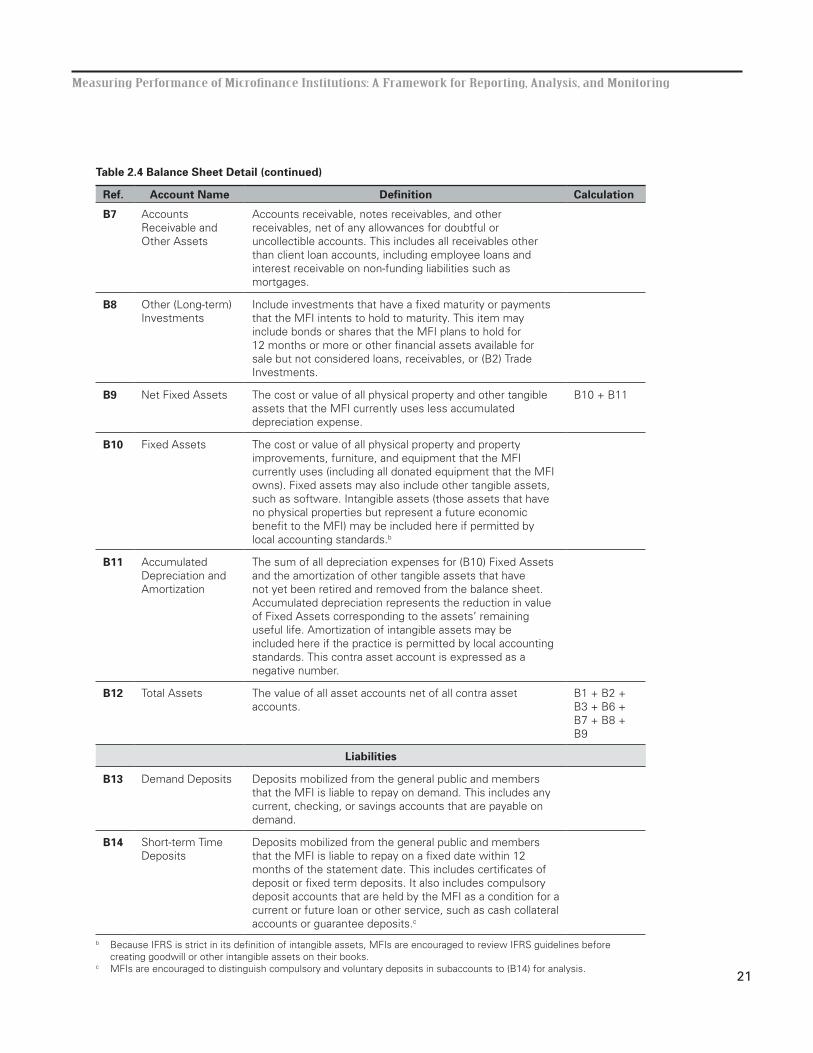
Ref. Account Name Definition Calculation
B7 Accounts Receivable and Other Assets
Accounts receivable, notes receivables, and other receivables, net of any allowances for doubtful or uncollectible accounts. This includes all receivables other than client loan accounts, including employee loans and interest receivable on non-funding liabilities such as mortgages.
B8 Other (Long-term) Investments
Include investments that have a fixed maturity or payments that the MFI intents to hold to maturity. This item may include bonds or shares that the MFI plans to hold for 12 months or more or other financial assets available for sale but not considered loans, receivables, or (B2) Trade Investments.
B9 Net Fixed Assets The cost or value of all physical property and other tangible assets that the MFI currently uses less accumulated depreciation expense.
B10 + B11
B10 Fixed Assets The cost or value of all physical property and property improvements, furniture, and equipment that the MFI currently uses (including all donated equipment that the MFI owns). Fixed assets may also include other tangible assets, such as software. Intangible assets (those assets that have no physical properties but represent a future economic benefit to the MFI) may be included here if permitted by local accounting standards.b
B11 Accumulated Depreciation and Amortization
The sum of all depreciation expenses for (B10) Fixed Assets and the amortization of other tangible assets that have not yet been retired and removed from the balance sheet. Accumulated depreciation represents the reduction in value of Fixed Assets corresponding to the assets’ remaining useful life. Amortization of intangible assets may be included here if the practice is permitted by local accounting standards. This contra asset account is expressed as a negative number.
B12 Total Assets The value of all asset accounts net of all contra asset accounts.
B1 + B2 + B3 + B6 + B7 + B8 + B9
Liabilities
B13 Demand Deposits Deposits mobilized from the general public and members that the MFI is liable to repay on demand. This includes any current, checking, or savings accounts that are payable on demand.
B14 Short-term Time Deposits
Deposits mobilized from the general public and members that the MFI is liable to repay on a fixed date within 12 months of the statement date. This includes certificates of deposit or fixed term deposits. It also includes compulsory deposit accounts that are held by the MFI as a condition for a current or future loan or other service, such as cash collateral accounts or guarantee deposits.c
Table 2.4 Balance Sheet Detail (continued)
b Because IFRS is strict in its definition of intangible assets, MFIs are encouraged to review IFRS guidelines before creating goodwill or other intangible assets on their books.
c MFIs are encouraged to distinguish compulsory and voluntary deposits in subaccounts to (B14) for analysis.
Measuring Performance of Microfinance Institutions: A Framework for Reporting, Analysis, and Monitoring
22
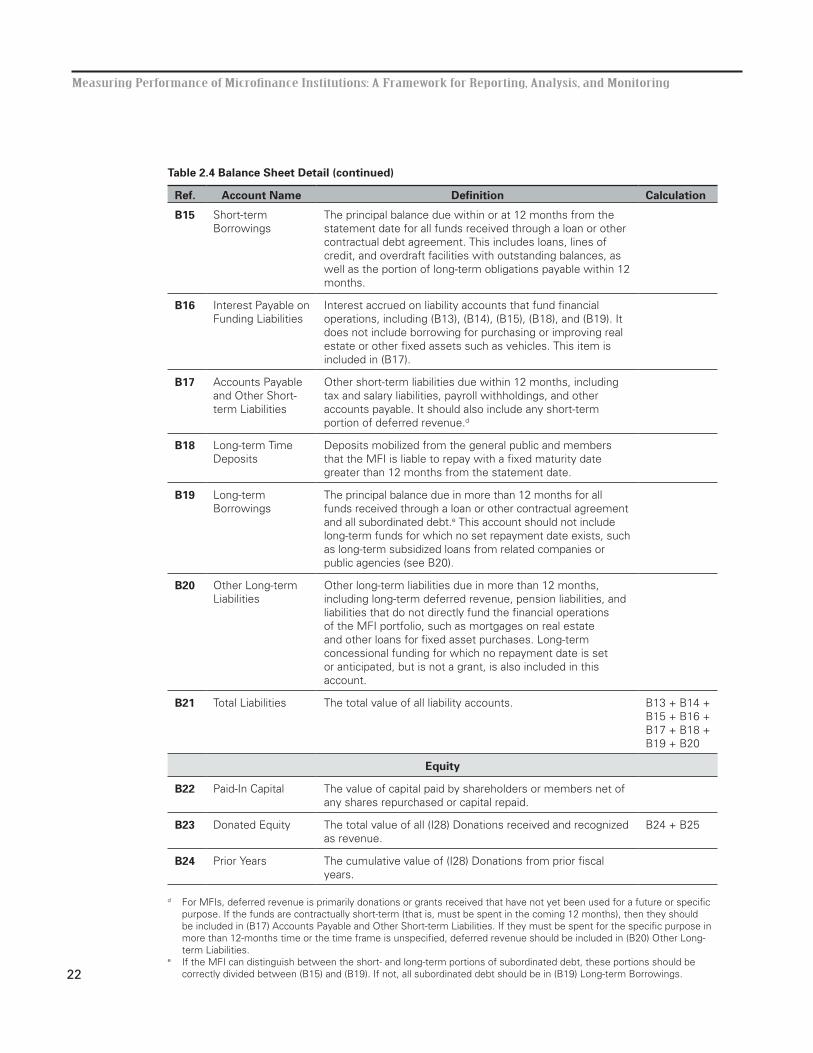
Ref. Account Name Definition Calculation
B15 Short-term Borrowings
The principal balance due within or at 12 months from the statement date for all funds received through a loan or other contractual debt agreement. This includes loans, lines of credit, and overdraft facilities with outstanding balances, as well as the portion of long-term obligations payable within 12 months.
B16 Interest Payable on Funding Liabilities
Interest accrued on liability accounts that fund financial operations, including (B13), (B14), (B15), (B18), and (B19). It does not include borrowing for purchasing or improving real estate or other fixed assets such as vehicles. This item is included in (B17).
B17 Accounts Payable and Other Short-term Liabilities
Other short-term liabilities due within 12 months, including tax and salary liabilities, payroll withholdings, and other accounts payable. It should also include any short-term portion of deferred revenue.d
B18 Long-term Time Deposits
Deposits mobilized from the general public and members that the MFI is liable to repay with a fixed maturity date greater than 12 months from the statement date.
B19 Long-term Borrowings
The principal balance due in more than 12 months for all funds received through a loan or other contractual agreement and all subordinated debt.e This account should not include long-term funds for which no set repayment date exists, such as long-term subsidized loans from related companies or public agencies (see B20).
B20 Other Long-term Liabilities
Other long-term liabilities due in more than 12 months, including long-term deferred revenue, pension liabilities, and liabilities that do not directly fund the financial operations of the MFI portfolio, such as mortgages on real estate and other loans for fixed asset purchases. Long-term concessional funding for which no repayment date is set or anticipated, but is not a grant, is also included in this account.
B21 Total Liabilities The total value of all liability accounts. B13 + B14 + B15 + B16 + B17 + B18 + B19 + B20
Equity
B22 Paid-In Capital The value of capital paid by shareholders or members net of any shares repurchased or capital repaid.
B23 Donated Equity The total value of all (I28) Donations received and recognized as revenue.
B24 + B25
B24 Prior Years The cumulative value of (I28) Donations from prior fiscal years.
Table 2.4 Balance Sheet Detail (continued)
d For MFIs, deferred revenue is primarily donations or grants received that have not yet been used for a future or specific purpose. If the funds are contractually short-term (that is, must be spent in the coming 12 months), then they should be included in (B17) Accounts Payable and Other Short-term Liabilities. If they must be spent for the specific purpose in more than 12-months time or the time frame is unspecified, deferred revenue should be included in (B20) Other Long-term Liabilities.
e If the MFI can distinguish between the short- and long-term portions of subordinated debt, these portions should be correctly divided between (B15) and (B19). If not, all subordinated debt should be in (B19) Long-term Borrowings.
Measuring Performance of Microfinance Institutions: A Framework for Reporting, Analysis, and Monitoring
23
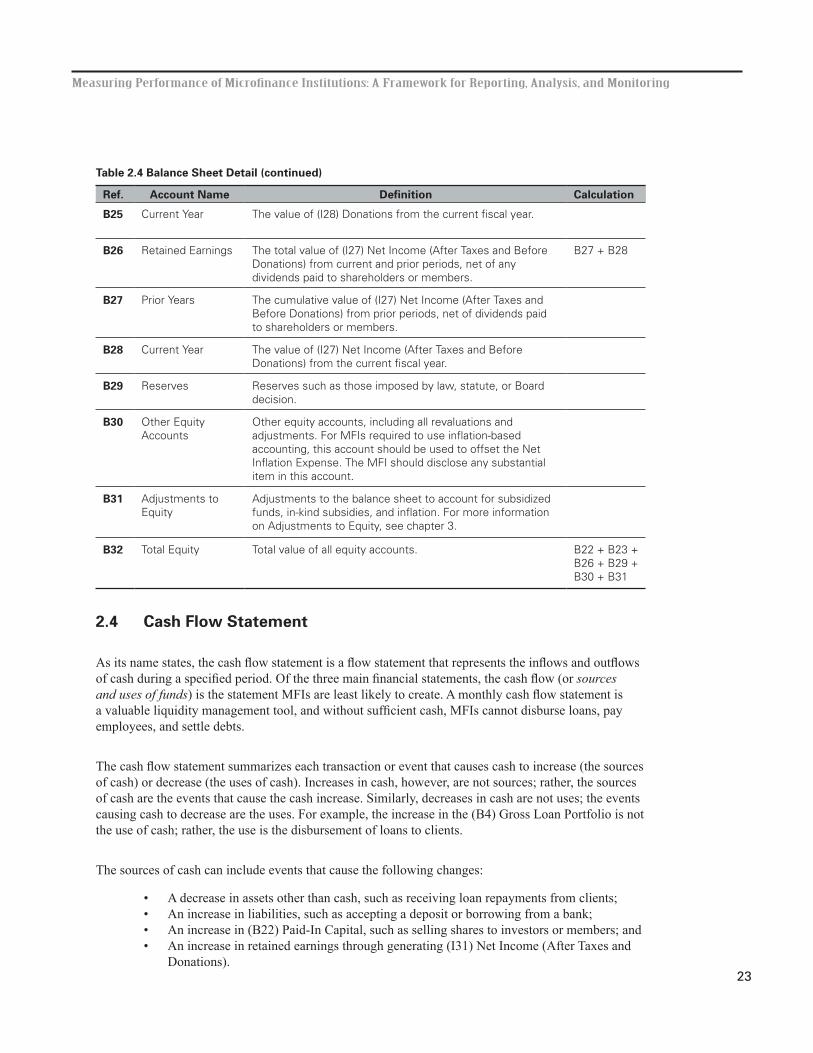
Ref. Account Name Definition Calculation
B25 Current Year The value of (I28) Donations from the current fiscal year.
B26 Retained Earnings The total value of (I27) Net Income (After Taxes and Before Donations) from current and prior periods, net of any dividends paid to shareholders or members.
B27 + B28
B27 Prior Years The cumulative value of (I27) Net Income (After Taxes and Before Donations) from prior periods, net of dividends paid to shareholders or members.
B28 Current Year The value of (I27) Net Income (After Taxes and Before Donations) from the current fiscal year.
B29 Reserves Reserves such as those imposed by law, statute, or Board decision.
B30 Other Equity Accounts
Other equity accounts, including all revaluations and adjustments. For MFIs required to use inflation-based accounting, this account should be used to offset the Net Inflation Expense. The MFI should disclose any substantial item in this account.
B31 Adjustments to Equity
Adjustments to the balance sheet to account for subsidized funds, in-kind subsidies, and inflation. For more information on Adjustments to Equity, see chapter 3.
B32 Total Equity Total value of all equity accounts. B22 + B23 + B26 + B29 + B30 + B31
2.4 Cash Flow Statement
As its name states, the cash flow statement is a flow statement that represents the inflows and outflows of cash during a specified period. Of the three main financial statements, the cash flow (or sources and uses of funds) is the statement MFIs are least likely to create. A monthly cash flow statement is a valuable liquidity management tool, and without sufficient cash, MFIs cannot disburse loans, pay employees, and settle debts.
The cash flow statement summarizes each transaction or event that causes cash to increase (the sources of cash) or decrease (the uses of cash). Increases in cash, however, are not sources; rather, the sources of cash are the events that cause the cash increase. Similarly, decreases in cash are not uses; the events causing cash to decrease are the uses. For example, the increase in the (B4) Gross Loan Portfolio is not the use of cash; rather, the use is the disbursement of loans to clients.
The sources of cash can include events that cause the following changes:
• A decrease in assets other than cash, such as receiving loan repayments from clients; • An increase in liabilities, such as accepting a deposit or borrowing from a bank;• An increase in (B22) Paid-In Capital, such as selling shares to investors or members; and• An increase in retained earnings through generating (I31) Net Income (After Taxes and Donations).
Table 2.4 Balance Sheet Detail (continued)
Measuring Performance of Microfinance Institutions: A Framework for Reporting, Analysis, and Monitoring
24
The uses of cash can include events that cause the following changes:
• Increases in assets other than cash, such as making loans to clients;• Decreases in liabilities, such as repaying a deposit or paying the principal on borrowed funds;• Decreases in (B22) Paid-In Capital, such as repurchasing shares or reimbursing member shares; and• Decreases in retained earnings through generating a net loss (after taxes and donations) or payment of dividends to shareholders.
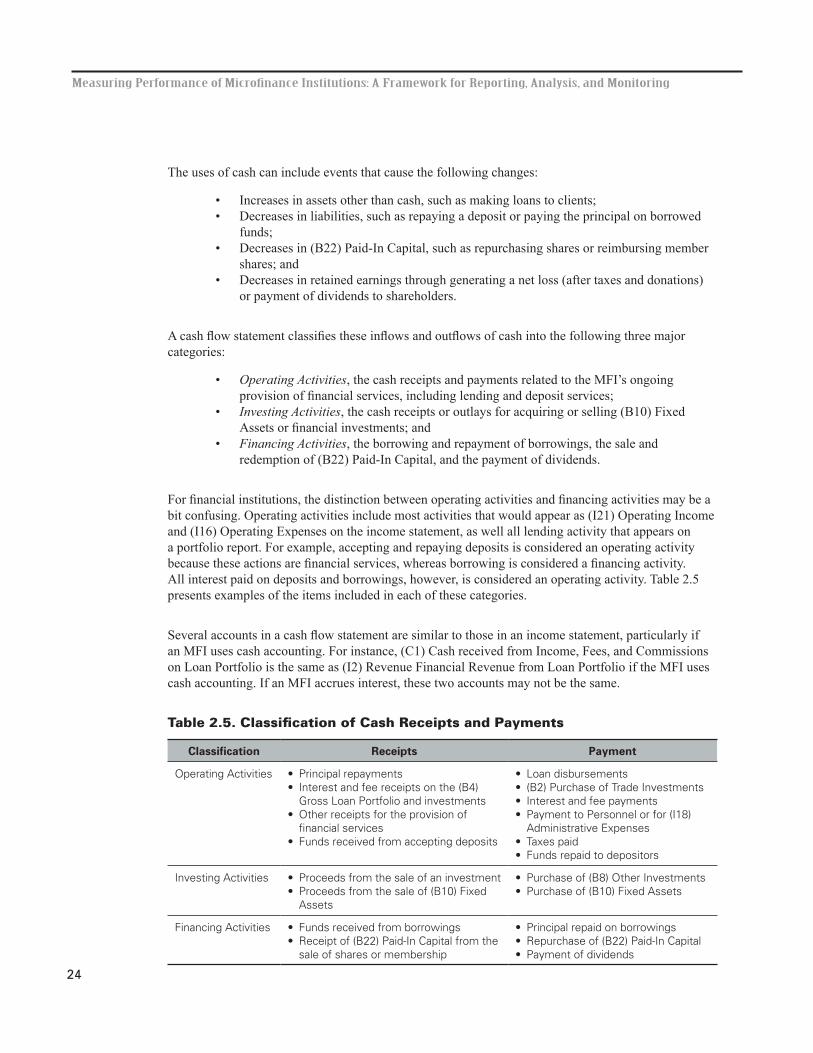
A cash flow statement classifies these inflows and outflows of cash into the following three major categories:
• Operating Activities, the cash receipts and payments related to the MFI’s ongoing provision of financial services, including lending and deposit services;• Investing Activities, the cash receipts or outlays for acquiring or selling (B10) Fixed Assets or financial investments; and • Financing Activities, the borrowing and repayment of borrowings, the sale and redemption of (B22) Paid-In Capital, and the payment of dividends.
For financial institutions, the distinction between operating activities and financing activities may be a bit confusing. Operating activities include most activities that would appear as (I21) Operating Income and (I16) Operating Expenses on the income statement, as well all lending activity that appears on a portfolio report. For example, accepting and repaying deposits is considered an operating activity because these actions are financial services, whereas borrowing is considered a financing activity. All interest paid on deposits and borrowings, however, is considered an operating activity. Table 2.5 presents examples of the items included in each of these categories.
Several accounts in a cash flow statement are similar to those in an income statement, particularly if an MFI uses cash accounting. For instance, (C1) Cash received from Income, Fees, and Commissions on Loan Portfolio is the same as (I2) Revenue Financial Revenue from Loan Portfolio if the MFI uses cash accounting. If an MFI accrues interest, these two accounts may not be the same.
Table 2.5. Classification of Cash Receipts and Payments
Classification Receipts Payment
Operating Activities • Principal repayments• Interest and fee receipts on the (B4) Gross Loan Portfolio and investments• Other receipts for the provision of financial services• Funds received from accepting deposits
• Loan disbursements• (B2) Purchase of Trade Investments• Interest and fee payments• Payment to Personnel or for (I18) Administrative Expenses• Taxes paid • Funds repaid to depositors
Investing Activities • Proceeds from the sale of an investment• Proceeds from the sale of (B10) Fixed Assets
• Purchase of (B8) Other Investments• Purchase of (B10) Fixed Assets
Financing Activities • Funds received from borrowings• Receipt of (B22) Paid-In Capital from the sale of shares or membership
• Principal repaid on borrowings• Repurchase of (B22) Paid-In Capital• Payment of dividends
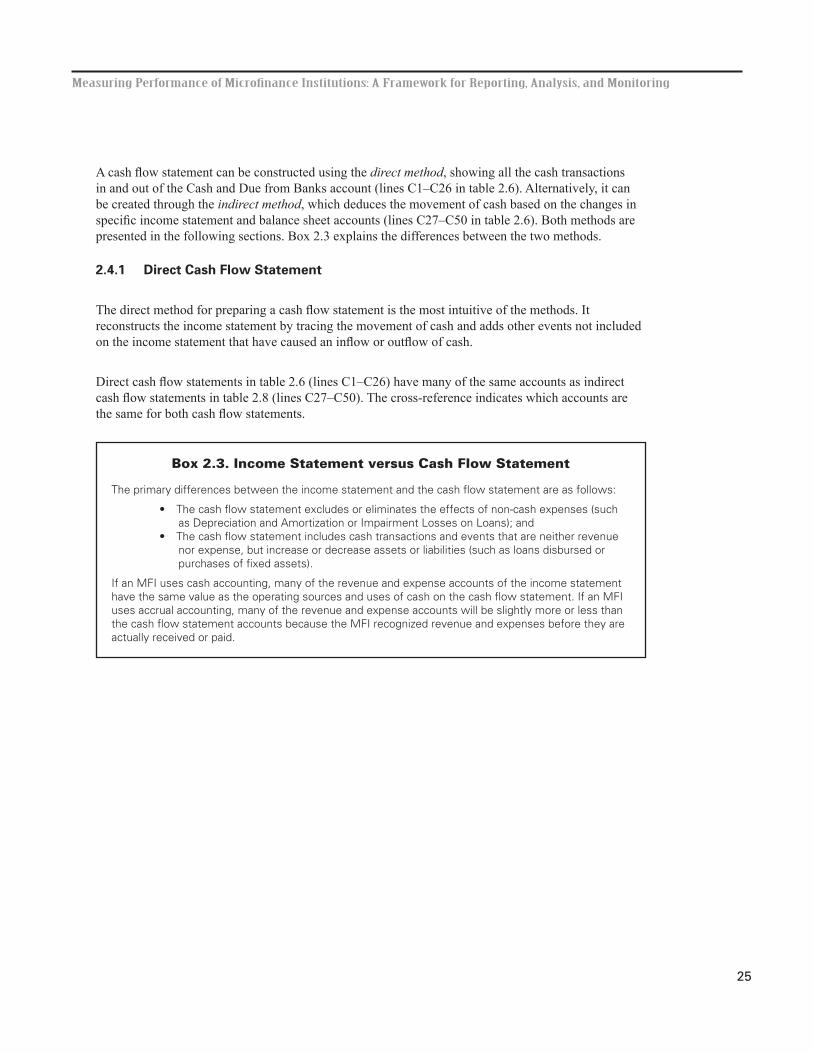
Measuring Performance of Microfinance Institutions: A Framework for Reporting, Analysis, and Monitoring
25
A cash flow statement can be constructed using the direct method, showing all the cash transactions in and out of the Cash and Due from Banks account (lines C1–C26 in table 2.6). Alternatively, it can be created through the indirect method, which deduces the movement of cash based on the changes in specific income statement and balance sheet accounts (lines C27–C50 in table 2.6). Both methods are presented in the following sections. Box 2.3 explains the differences between the two methods.
2.4.1 Direct Cash Flow Statement
The direct method for preparing a cash flow statement is the most intuitive of the methods. It reconstructs the income statement by tracing the movement of cash and adds other events not included on the income statement that have caused an inflow or outflow of cash.
Direct cash flow statements in table 2.6 (lines C1–C26) have many of the same accounts as indirect cash flow statements in table 2.8 (lines C27–C50). The cross-reference indicates which accounts are the same for both cash flow statements.
Box 2.3. Income Statement versus Cash Flow Statement
The primary differences between the income statement and the cash flow statement are as follows:
• The cash flow statement excludes or eliminates the effects of non-cash expenses (such as Depreciation and Amortization or Impairment Losses on Loans); and
• The cash flow statement includes cash transactions and events that are neither revenue nor expense, but increase or decrease assets or liabilities (such as loans disbursed or purchases of fixed assets).
If an MFI uses cash accounting, many of the revenue and expense accounts of the income statement have the same value as the operating sources and uses of cash on the cash flow statement. If an MFI uses accrual accounting, many of the revenue and expense accounts will be slightly more or less than the cash flow statement accounts because the MFI recognized revenue and expenses before they are actually received or paid.
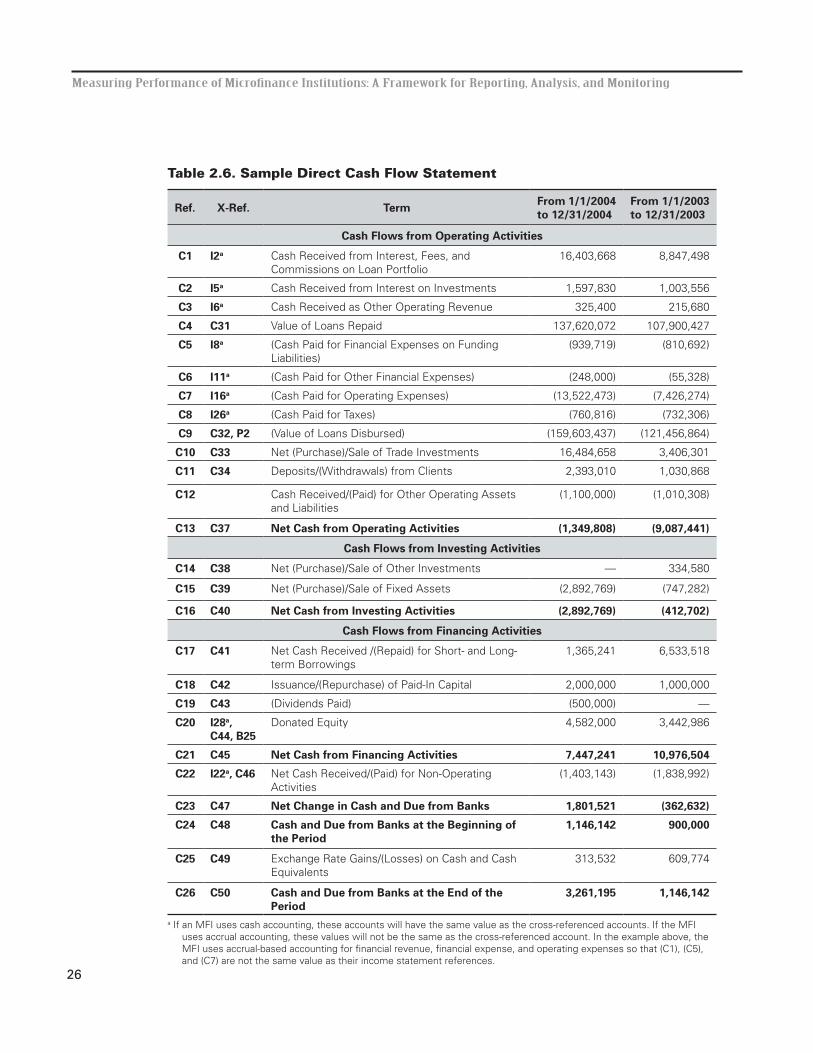
Measuring Performance of Microfinance Institutions: A Framework for Reporting, Analysis, and Monitoring
26
Table 2.6. Sample Direct Cash Flow Statement
Ref. X-Ref. Term From 1/1/2004 to 12/31/2004
From 1/1/2003 to 12/31/2003
Cash Flows from Operating Activities
C1 I2a Cash Received from Interest, Fees, and Commissions on Loan Portfolio
16,403,668 8,847,498
C2 I5a Cash Received from Interest on Investments 1,597,830 1,003,556
C3 I6a Cash Received as Other Operating Revenue 325,400 215,680
C4 C31 Value of Loans Repaid 137,620,072 107,900,427
C5 I8a (Cash Paid for Financial Expenses on Funding Liabilities)
(939,719) (810,692)
C6 I11a (Cash Paid for Other Financial Expenses) (248,000) (55,328)
C7 I16a (Cash Paid for Operating Expenses) (13,522,473) (7,426,274)
C8 I26a (Cash Paid for Taxes) (760,816) (732,306)
C9 C32, P2 (Value of Loans Disbursed) (159,603,437) (121,456,864)
C10 C33 Net (Purchase)/Sale of Trade Investments 16,484,658 3,406,301
C11 C34 Deposits/(Withdrawals) from Clients 2,393,010 1,030,868
C12 Cash Received/(Paid) for Other Operating Assets and Liabilities
(1,100,000) (1,010,308)
C13 C37 Net Cash from Operating Activities (1,349,808) (9,087,441)
Cash Flows from Investing Activities
C14 C38 Net (Purchase)/Sale of Other Investments — 334,580
C15 C39 Net (Purchase)/Sale of Fixed Assets (2,892,769) (747,282)
C16 C40 Net Cash from Investing Activities (2,892,769) (412,702)
Cash Flows from Financing Activities
C17 C41 Net Cash Received /(Repaid) for Short- and Long-term Borrowings
1,365,241 6,533,518
C18 C42 Issuance/(Repurchase) of Paid-In Capital 2,000,000 1,000,000
C19 C43 (Dividends Paid) (500,000) —
C20 I28a, C44, B25
Donated Equity 4,582,000 3,442,986
C21 C45 Net Cash from Financing Activities 7,447,241 10,976,504
C22 I22a, C46 Net Cash Received/(Paid) for Non-Operating Activities
(1,403,143) (1,838,992)
C23 C47 Net Change in Cash and Due from Banks 1,801,521 (362,632)
C24 C48 Cash and Due from Banks at the Beginning of the Period
1,146,142 900,000
C25 C49 Exchange Rate Gains/(Losses) on Cash and Cash Equivalents
313,532 609,774
C26 C50 Cash and Due from Banks at the End of the Period
3,261,195 1,146,142
a If an MFI uses cash accounting, these accounts will have the same value as the cross-referenced accounts. If the MFI uses accrual accounting, these values will not be the same as the cross-referenced account. In the example above, the MFI uses accrual-based accounting for financial revenue, financial expense, and operating expenses so that (C1), (C5), and (C7) are not the same value as their income statement references.
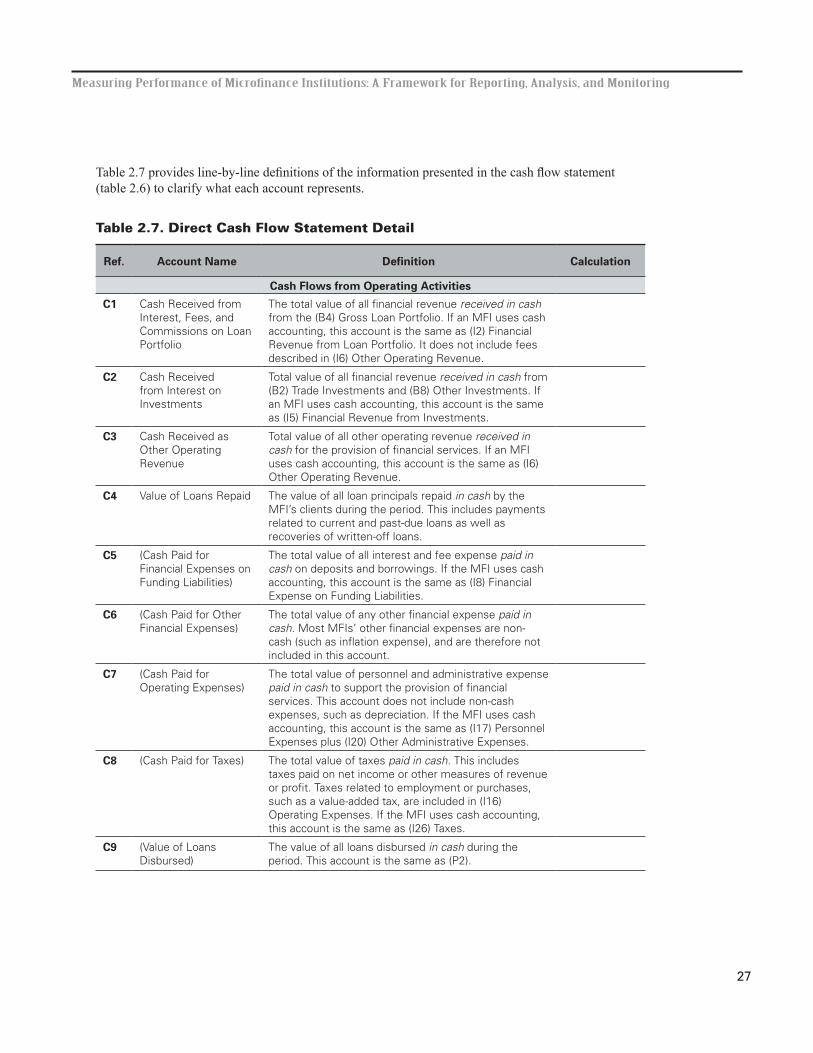
Measuring Performance of Microfinance Institutions: A Framework for Reporting, Analysis, and Monitoring
27
Table 2.7 provides line-by-line definitions of the information presented in the cash flow statement (table 2.6) to clarify what each account represents.
Table 2.7. Direct Cash Flow Statement Detail
Ref. Account Name Definition Calculation
Cash Flows from Operating Activities
C1 Cash Received from Interest, Fees, and Commissions on Loan Portfolio
The total value of all financial revenue received in cash from the (B4) Gross Loan Portfolio. If an MFI uses cash accounting, this account is the same as (I2) Financial Revenue from Loan Portfolio. It does not include fees described in (I6) Other Operating Revenue.
C2 Cash Received from Interest on Investments
Total value of all financial revenue received in cash from (B2) Trade Investments and (B8) Other Investments. If an MFI uses cash accounting, this account is the same as (I5) Financial Revenue from Investments.
C3 Cash Received as Other Operating Revenue
Total value of all other operating revenue received in cash for the provision of financial services. If an MFI uses cash accounting, this account is the same as (I6) Other Operating Revenue.
C4 Value of Loans Repaid The value of all loan principals repaid in cash by the MFI’s clients during the period. This includes payments related to current and past-due loans as well as recoveries of written-off loans.
C5 (Cash Paid for Financial Expenses on Funding Liabilities)
The total value of all interest and fee expense paid in cash on deposits and borrowings. If the MFI uses cash accounting, this account is the same as (I8) Financial Expense on Funding Liabilities.
C6 (Cash Paid for Other Financial Expenses)
The total value of any other financial expense paid in cash. Most MFIs’ other financial expenses are non-cash (such as inflation expense), and are therefore not included in this account.
C7 (Cash Paid for Operating Expenses)
The total value of personnel and administrative expense paid in cash to support the provision of financial services. This account does not include non-cash expenses, such as depreciation. If the MFI uses cash accounting, this account is the same as (I17) Personnel Expenses plus (I20) Other Administrative Expenses.
C8 (Cash Paid for Taxes) The total value of taxes paid in cash. This includes taxes paid on net income or other measures of revenue or profit. Taxes related to employment or purchases, such as a value-added tax, are included in (I16) Operating Expenses. If the MFI uses cash accounting, this account is the same as (I26) Taxes.
C9 (Value of Loans Disbursed)
The value of all loans disbursed in cash during the period. This account is the same as (P2).
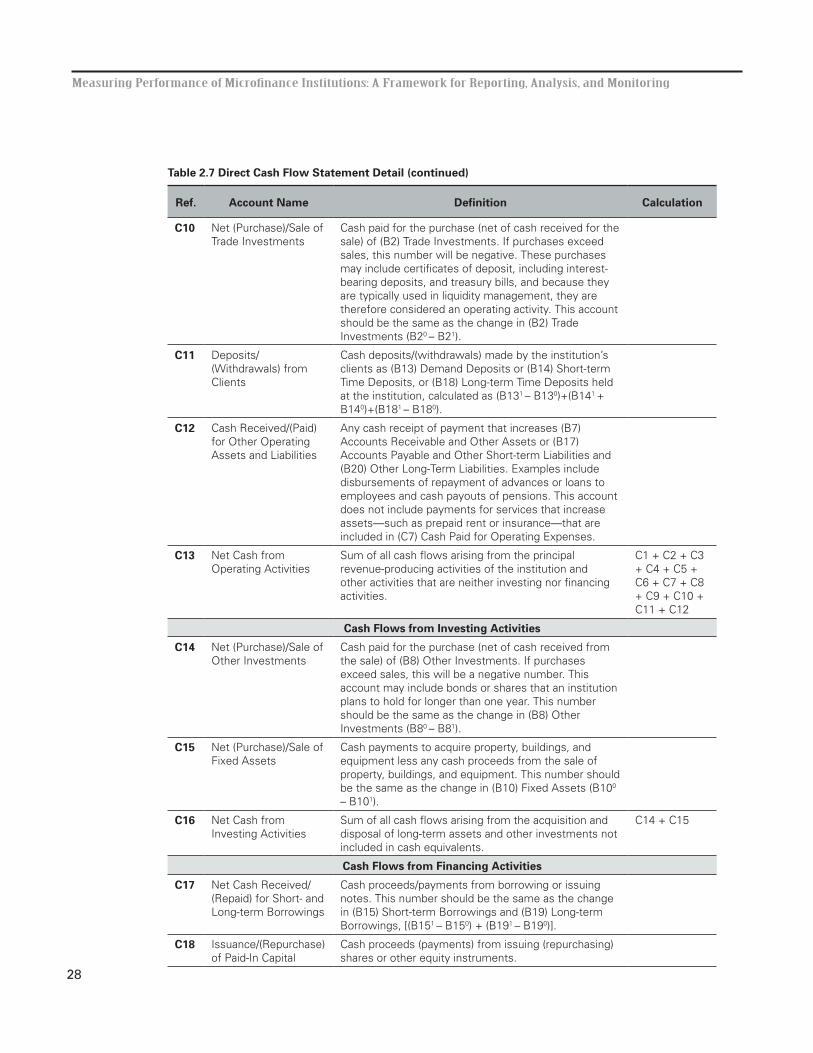
Measuring Performance of Microfinance Institutions: A Framework for Reporting, Analysis, and Monitoring
28
Ref. Account Name Definition Calculation
C10 Net (Purchase)/Sale of Trade Investments
Cash paid for the purchase (net of cash received for the sale) of (B2) Trade Investments. If purchases exceed sales, this number will be negative. These purchases may include certificates of deposit, including interest-bearing deposits, and treasury bills, and because they are typically used in liquidity management, they are therefore considered an operating activity. This account should be the same as the change in (B2) Trade Investments (B20 – B21).
C11 Deposits/(Withdrawals) from Clients
Cash deposits/(withdrawals) made by the institution’s clients as (B13) Demand Deposits or (B14) Short-term Time Deposits, or (B18) Long-term Time Deposits held at the institution, calculated as (B131 – B130)+(B141 + B140)+(B181 – B180).
C12 Cash Received/(Paid) for Other Operating Assets and Liabilities
Any cash receipt of payment that increases (B7) Accounts Receivable and Other Assets or (B17) Accounts Payable and Other Short-term Liabilities and (B20) Other Long-Term Liabilities. Examples include disbursements of repayment of advances or loans to employees and cash payouts of pensions. This account does not include payments for services that increase assets—such as prepaid rent or insurance—that are included in (C7) Cash Paid for Operating Expenses.
C13 Net Cash from Operating Activities
Sum of all cash flows arising from the principal revenue-producing activities of the institution and other activities that are neither investing nor financing activities.
C1 + C2 + C3 + C4 + C5 + C6 + C7 + C8 + C9 + C10 + C11 + C12
Cash Flows from Investing Activities
C14 Net (Purchase)/Sale of Other Investments
Cash paid for the purchase (net of cash received from the sale) of (B8) Other Investments. If purchases exceed sales, this will be a negative number. This account may include bonds or shares that an institution plans to hold for longer than one year. This number should be the same as the change in (B8) Other Investments (B80 – B81).
C15 Net (Purchase)/Sale of Fixed Assets
Cash payments to acquire property, buildings, and equipment less any cash proceeds from the sale of property, buildings, and equipment. This number should be the same as the change in (B10) Fixed Assets (B100
– B101).
C16 Net Cash from Investing Activities
Sum of all cash flows arising from the acquisition and disposal of long-term assets and other investments not included in cash equivalents.
C14 + C15
Cash Flows from Financing Activities
C17 Net Cash Received/ (Repaid) for Short- and Long-term Borrowings
Cash proceeds/payments from borrowing or issuing notes. This number should be the same as the change in (B15) Short-term Borrowings and (B19) Long-term Borrowings, [(B151 – B150) + (B191 – B190)].
C18 Issuance/(Repurchase) of Paid-In Capital
Cash proceeds (payments) from issuing (repurchasing) shares or other equity instruments.
Table 2.7 Direct Cash Flow Statement Detail (continued)
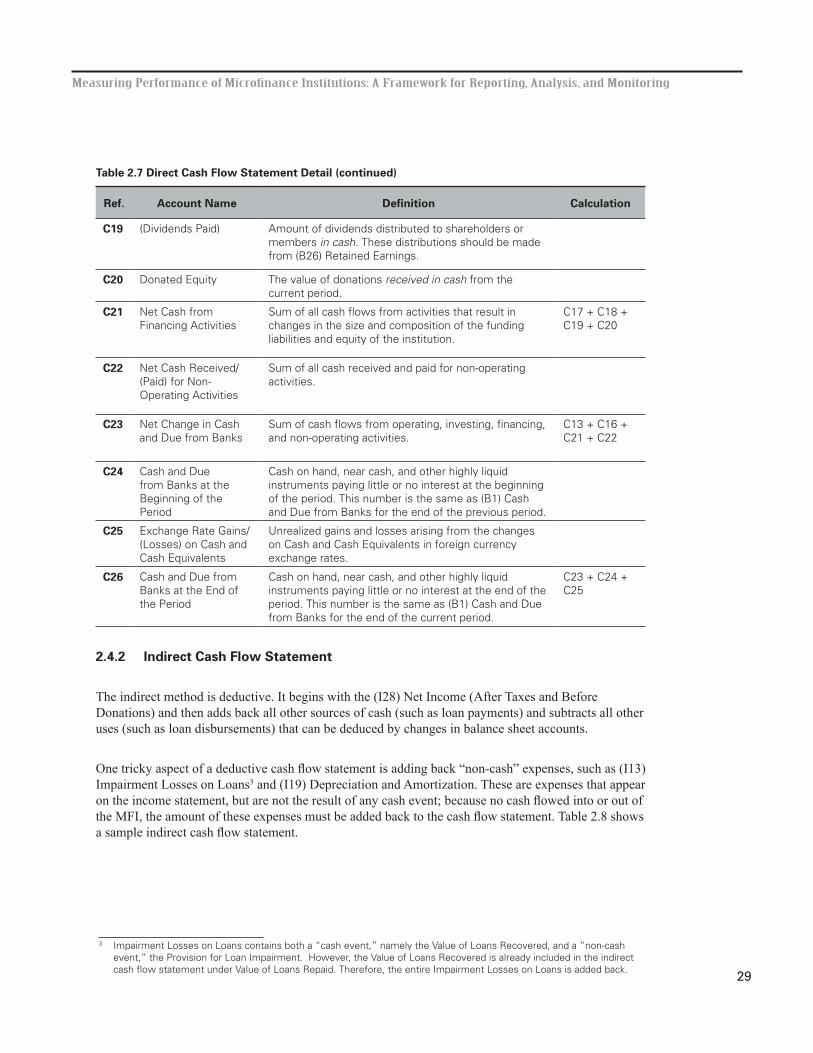
Measuring Performance of Microfinance Institutions: A Framework for Reporting, Analysis, and Monitoring
29
Ref. Account Name Definition Calculation
C19 (Dividends Paid) Amount of dividends distributed to shareholders or members in cash. These distributions should be made from (B26) Retained Earnings.
C20 Donated Equity The value of donations received in cash from the current period.
C21 Net Cash from Financing Activities
Sum of all cash flows from activities that result in changes in the size and composition of the funding liabilities and equity of the institution.
C17 + C18 + C19 + C20
C22 Net Cash Received/(Paid) for Non-Operating Activities
Sum of all cash received and paid for non-operating activities.
C23 Net Change in Cash and Due from Banks
Sum of cash flows from operating, investing, financing, and non-operating activities.
C13 + C16 + C21 + C22
C24 Cash and Due from Banks at the Beginning of the Period
Cash on hand, near cash, and other highly liquid instruments paying little or no interest at the beginning of the period. This number is the same as (B1) Cash and Due from Banks for the end of the previous period.
C25 Exchange Rate Gains/(Losses) on Cash and Cash Equivalents
Unrealized gains and losses arising from the changes on Cash and Cash Equivalents in foreign currency exchange rates.
C26 Cash and Due from Banks at the End of the Period
Cash on hand, near cash, and other highly liquid instruments paying little or no interest at the end of the period. This number is the same as (B1) Cash and Due from Banks for the end of the current period.
C23 + C24 + C25
2.4.2 Indirect Cash Flow Statement
The indirect method is deductive. It begins with the (I28) Net Income (After Taxes and Before Donations) and then adds back all other sources of cash (such as loan payments) and subtracts all other uses (such as loan disbursements) that can be deduced by changes in balance sheet accounts.
One tricky aspect of a deductive cash flow statement is adding back “non-cash” expenses, such as (I13) Impairment Losses on Loans3 and (I19) Depreciation and Amortization. These are expenses that appear on the income statement, but are not the result of any cash event; because no cash flowed into or out of the MFI, the amount of these expenses must be added back to the cash flow statement. Table 2.8 shows a sample indirect cash flow statement.
Table 2.7 Direct Cash Flow Statement Detail (continued)
3 Impairment Losses on Loans contains both a “cash event,” namely the Value of Loans Recovered, and a “non-cash event,” the Provision for Loan Impairment. However, the Value of Loans Recovered is already included in the indirect cash flow statement under Value of Loans Repaid. Therefore, the entire Impairment Losses on Loans is added back.
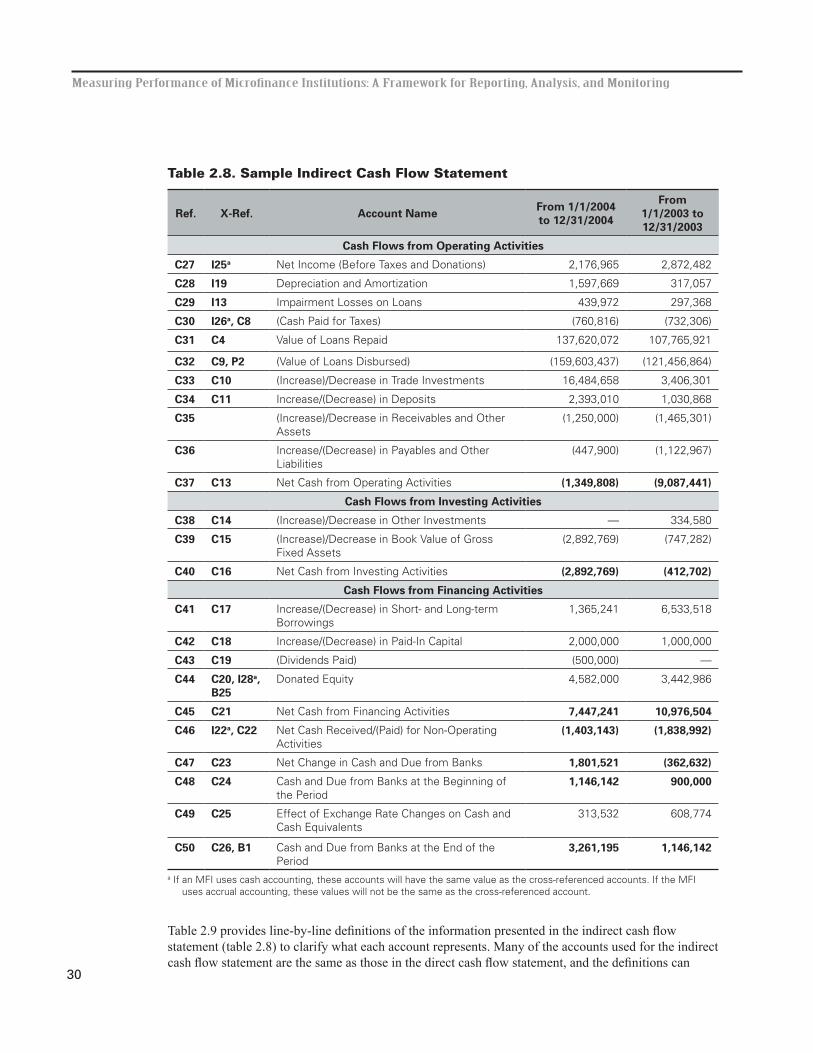
Measuring Performance of Microfinance Institutions: A Framework for Reporting, Analysis, and Monitoring
30
Table 2.8. Sample Indirect Cash Flow Statement
Ref. X-Ref. Account Name From 1/1/2004 to 12/31/2004
From 1/1/2003 to 12/31/2003
Cash Flows from Operating Activities
C27 I25a Net Income (Before Taxes and Donations) 2,176,965 2,872,482
C28 I19 Depreciation and Amortization 1,597,669 317,057
C29 I13 Impairment Losses on Loans 439,972 297,368
C30 I26a, C8 (Cash Paid for Taxes) (760,816) (732,306)
C31 C4 Value of Loans Repaid 137,620,072 107,765,921
C32 C9, P2 (Value of Loans Disbursed) (159,603,437) (121,456,864)
C33 C10 (Increase)/Decrease in Trade Investments 16,484,658 3,406,301
C34 C11 Increase/(Decrease) in Deposits 2,393,010 1,030,868
C35 (Increase)/Decrease in Receivables and Other Assets
(1,250,000) (1,465,301)
C36 Increase/(Decrease) in Payables and Other Liabilities
(447,900) (1,122,967)
C37 C13 Net Cash from Operating Activities (1,349,808) (9,087,441)
Cash Flows from Investing Activities
C38 C14 (Increase)/Decrease in Other Investments — 334,580
C39 C15 (Increase)/Decrease in Book Value of Gross Fixed Assets
(2,892,769) (747,282)
C40 C16 Net Cash from Investing Activities (2,892,769) (412,702)
Cash Flows from Financing Activities
C41 C17 Increase/(Decrease) in Short- and Long-term Borrowings
1,365,241 6,533,518
C42 C18 Increase/(Decrease) in Paid-In Capital 2,000,000 1,000,000
C43 C19 (Dividends Paid) (500,000) —
C44 C20, I28a, B25
Donated Equity 4,582,000 3,442,986
C45 C21 Net Cash from Financing Activities 7,447,241 10,976,504
C46 I22a, C22 Net Cash Received/(Paid) for Non-Operating Activities
(1,403,143) (1,838,992)
C47 C23 Net Change in Cash and Due from Banks 1,801,521 (362,632)
C48 C24 Cash and Due from Banks at the Beginning of the Period
1,146,142 900,000
C49 C25 Effect of Exchange Rate Changes on Cash and Cash Equivalents
313,532 608,774
C50 C26, B1 Cash and Due from Banks at the End of the Period
3,261,195 1,146,142
a If an MFI uses cash accounting, these accounts will have the same value as the cross-referenced accounts. If the MFI uses accrual accounting, these values will not be the same as the cross-referenced account.
Table 2.9 provides line-by-line definitions of the information presented in the indirect cash flow statement (table 2.8) to clarify what each account represents. Many of the accounts used for the indirect cash flow statement are the same as those in the direct cash flow statement, and the definitions can
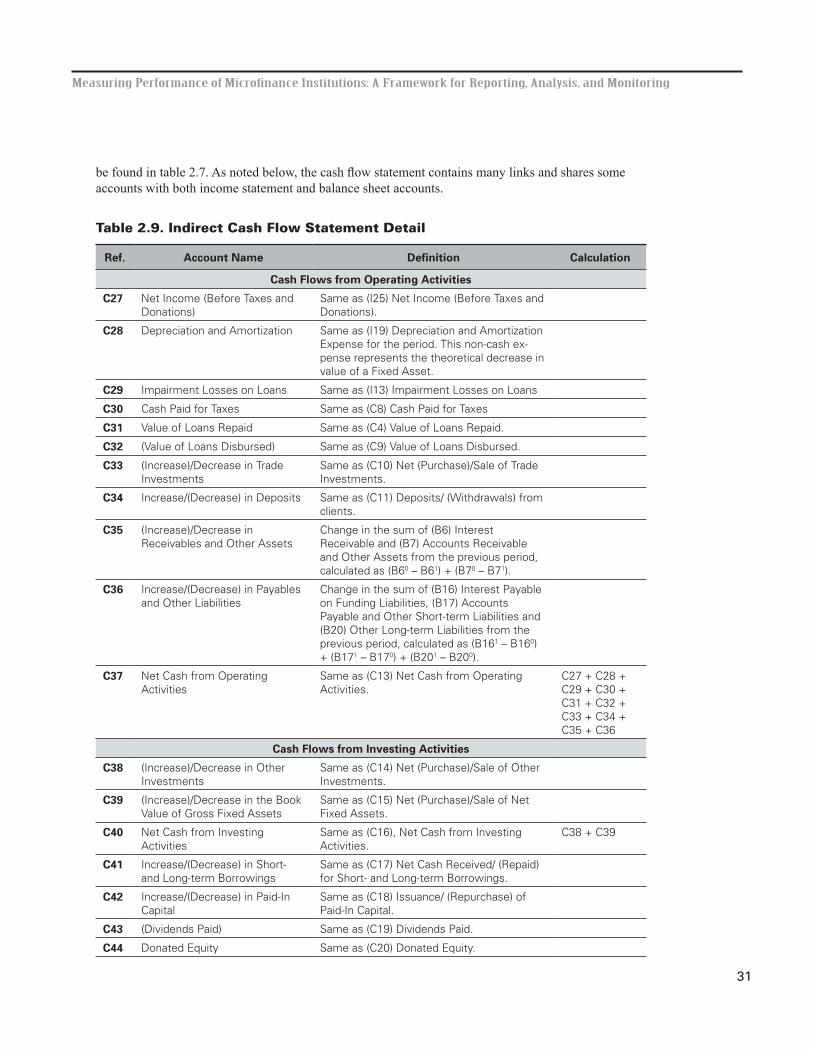
Measuring Performance of Microfinance Institutions: A Framework for Reporting, Analysis, and Monitoring
31
be found in table 2.7. As noted below, the cash flow statement contains many links and shares some accounts with both income statement and balance sheet accounts.
Table 2.9. Indirect Cash Flow Statement Detail
Ref. Account Name Definition Calculation
Cash Flows from Operating Activities
C27 Net Income (Before Taxes and Donations)
Same as (I25) Net Income (Before Taxes and Donations).
C28 Depreciation and Amortization Same as (I19) Depreciation and Amortization Expense for the period. This non-cash ex-pense represents the theoretical decrease in value of a Fixed Asset.
C29 Impairment Losses on Loans Same as (I13) Impairment Losses on Loans
C30 Cash Paid for Taxes Same as (C8) Cash Paid for Taxes
C31 Value of Loans Repaid Same as (C4) Value of Loans Repaid.
C32 (Value of Loans Disbursed) Same as (C9) Value of Loans Disbursed.
C33 (Increase)/Decrease in Trade Investments
Same as (C10) Net (Purchase)/Sale of Trade Investments.
C34 Increase/(Decrease) in Deposits Same as (C11) Deposits/ (Withdrawals) from clients.
C35 (Increase)/Decrease in Receivables and Other Assets
Change in the sum of (B6) Interest Receivable and (B7) Accounts Receivable and Other Assets from the previous period, calculated as (B60 – B61) + (B70 – B71).
C36 Increase/(Decrease) in Payables and Other Liabilities
Change in the sum of (B16) Interest Payable on Funding Liabilities, (B17) Accounts Payable and Other Short-term Liabilities and (B20) Other Long-term Liabilities from the previous period, calculated as (B161 – B160) + (B171 – B170) + (B201 – B200).
C37 Net Cash from Operating Activities
Same as (C13) Net Cash from Operating Activities.
C27 + C28 + C29 + C30 + C31 + C32 + C33 + C34 + C35 + C36
Cash Flows from Investing Activities
C38 (Increase)/Decrease in Other Investments
Same as (C14) Net (Purchase)/Sale of Other Investments.
C39 (Increase)/Decrease in the Book Value of Gross Fixed Assets
Same as (C15) Net (Purchase)/Sale of Net Fixed Assets.
C40 Net Cash from Investing Activities
Same as (C16), Net Cash from Investing Activities.
C38 + C39
C41 Increase/(Decrease) in Short- and Long-term Borrowings
Same as (C17) Net Cash Received/ (Repaid) for Short- and Long-term Borrowings.
C42 Increase/(Decrease) in Paid-In Capital
Same as (C18) Issuance/ (Repurchase) of Paid-In Capital.
C43 (Dividends Paid) Same as (C19) Dividends Paid.
C44 Donated Equity Same as (C20) Donated Equity.
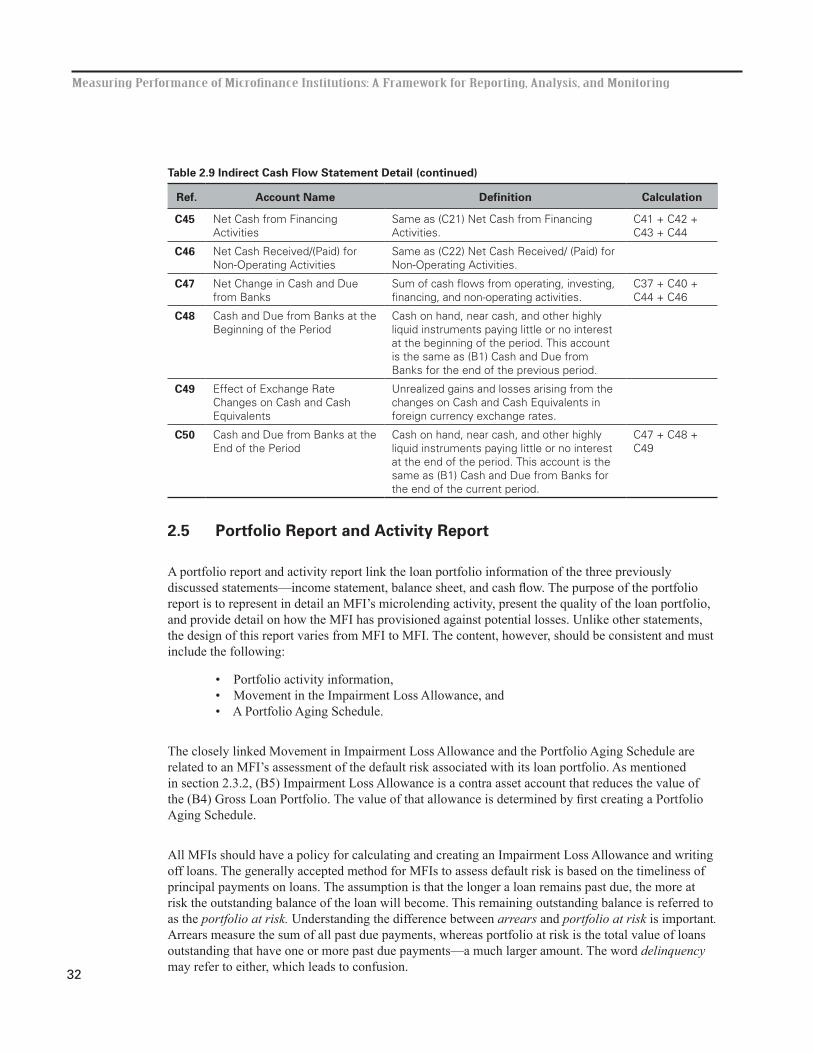
Measuring Performance of Microfinance Institutions: A Framework for Reporting, Analysis, and Monitoring
32
Ref. Account Name Definition Calculation
C45 Net Cash from Financing Activities
Same as (C21) Net Cash from Financing Activities.
C41 + C42 + C43 + C44
C46 Net Cash Received/(Paid) for Non-Operating Activities
Same as (C22) Net Cash Received/ (Paid) for Non-Operating Activities.
C47 Net Change in Cash and Due from Banks
Sum of cash flows from operating, investing, financing, and non-operating activities.
C37 + C40 + C44 + C46
C48 Cash and Due from Banks at the Beginning of the Period
Cash on hand, near cash, and other highly liquid instruments paying little or no interest at the beginning of the period. This account is the same as (B1) Cash and Due from Banks for the end of the previous period.
C49 Effect of Exchange Rate Changes on Cash and Cash Equivalents
Unrealized gains and losses arising from the changes on Cash and Cash Equivalents in foreign currency exchange rates.
C50 Cash and Due from Banks at the End of the Period
Cash on hand, near cash, and other highly liquid instruments paying little or no interest at the end of the period. This account is the same as (B1) Cash and Due from Banks for the end of the current period.
C47 + C48 + C49
2.5 Portfolio Report and Activity Report
A portfolio report and activity report link the loan portfolio information of the three previously discussed statements—income statement, balance sheet, and cash flow. The purpose of the portfolio report is to represent in detail an MFI’s microlending activity, present the quality of the loan portfolio, and provide detail on how the MFI has provisioned against potential losses. Unlike other statements, the design of this report varies from MFI to MFI. The content, however, should be consistent and must include the following:
• Portfolio activity information,• Movement in the Impairment Loss Allowance, and• A Portfolio Aging Schedule.
The closely linked Movement in Impairment Loss Allowance and the Portfolio Aging Schedule are related to an MFI’s assessment of the default risk associated with its loan portfolio. As mentioned in section 2.3.2, (B5) Impairment Loss Allowance is a contra asset account that reduces the value of the (B4) Gross Loan Portfolio. The value of that allowance is determined by first creating a Portfolio Aging Schedule.
All MFIs should have a policy for calculating and creating an Impairment Loss Allowance and writing off loans. The generally accepted method for MFIs to assess default risk is based on the timeliness of principal payments on loans. The assumption is that the longer a loan remains past due, the more at risk the outstanding balance of the loan will become. This remaining outstanding balance is referred to as the portfolio at risk. Understanding the difference between arrears and portfolio at risk is important. Arrears measure the sum of all past due payments, whereas portfolio at risk is the total value of loans outstanding that have one or more past due payments—a much larger amount. The word delinquency may refer to either, which leads to confusion.
Table 2.9 Indirect Cash Flow Statement Detail (continued)
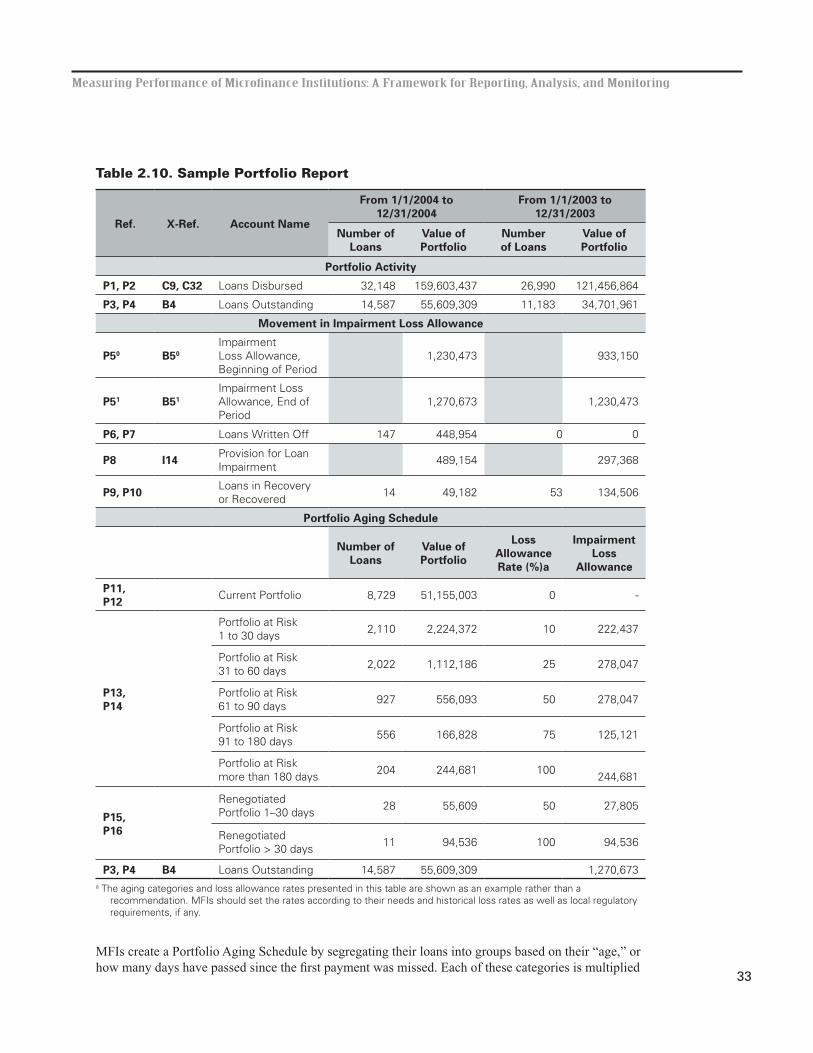
Measuring Performance of Microfinance Institutions: A Framework for Reporting, Analysis, and Monitoring
33
Table 2.10. Sample Portfolio Report
Ref. X-Ref. Account Name
From 1/1/2004 to 12/31/2004
From 1/1/2003 to 12/31/2003
Number of Loans
Value of Portfolio
Numberof Loans
Value of Portfolio
Portfolio Activity
P1, P2 C9, C32 Loans Disbursed 32,148 159,603,437 26,990 121,456,864
P3, P4 B4 Loans Outstanding 14,587 55,609,309 11,183 34,701,961
Movement in Impairment Loss Allowance
P50 B50Impairment Loss Allowance, Beginning of Period
1,230,473 933,150
P51 B51Impairment Loss Allowance, End of Period
1,270,673 1,230,473
P6, P7 Loans Written Off 147 448,954 0 0
P8 I14 Provision for Loan Impairment
489,154 297,368
P9, P10 Loans in Recovery or Recovered
14 49,182 53 134,506
Portfolio Aging Schedule
Number of Loans
Value of Portfolio
LossAllowanceRate (%)a
Impairment Loss
Allowance
P11, P12 Current Portfolio 8,729 51,155,003 0 -
P13, P14
Portfolio at Risk 1 to 30 days
2,110 2,224,372 10 222,437
Portfolio at Risk 31 to 60 days
2,022 1,112,186 25 278,047
Portfolio at Risk 61 to 90 days
927 556,093 50 278,047
Portfolio at Risk 91 to 180 days
556 166,828 75 125,121
Portfolio at Risk more than 180 days
204 244,681 100
244,681
P15, P16
Renegotiated Portfolio 1–30 days
28 55,609 50 27,805
Renegotiated Portfolio > 30 days
11 94,536 100 94,536
P3, P4 B4 Loans Outstanding 14,587 55,609,309 1,270,673 a The aging categories and loss allowance rates presented in this table are shown as an example rather than a
recommendation. MFIs should set the rates according to their needs and historical loss rates as well as local regulatory requirements, if any.
MFIs create a Portfolio Aging Schedule by segregating their loans into groups based on their “age,” or how many days have passed since the first payment was missed. Each of these categories is multiplied
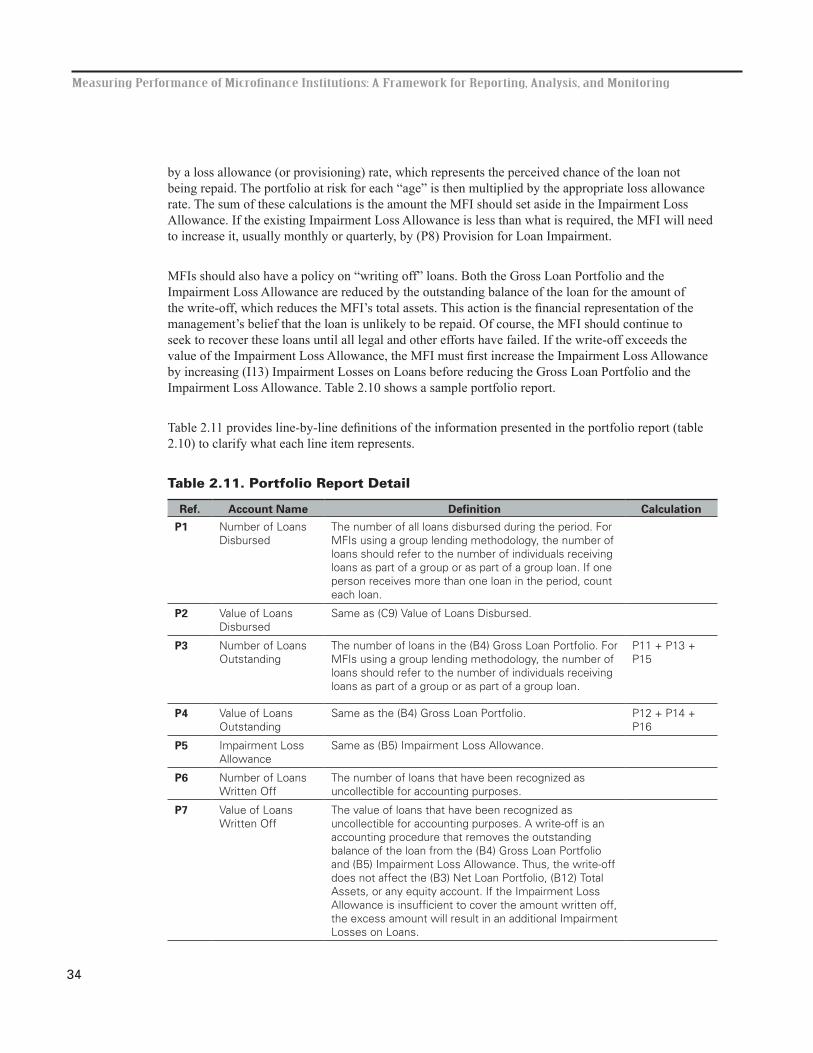
Measuring Performance of Microfinance Institutions: A Framework for Reporting, Analysis, and Monitoring
34
by a loss allowance (or provisioning) rate, which represents the perceived chance of the loan not being repaid. The portfolio at risk for each “age” is then multiplied by the appropriate loss allowance rate. The sum of these calculations is the amount the MFI should set aside in the Impairment Loss Allowance. If the existing Impairment Loss Allowance is less than what is required, the MFI will need to increase it, usually monthly or quarterly, by (P8) Provision for Loan Impairment.
MFIs should also have a policy on “writing off” loans. Both the Gross Loan Portfolio and the Impairment Loss Allowance are reduced by the outstanding balance of the loan for the amount of the write-off, which reduces the MFI’s total assets. This action is the financial representation of the management’s belief that the loan is unlikely to be repaid. Of course, the MFI should continue to seek to recover these loans until all legal and other efforts have failed. If the write-off exceeds the value of the Impairment Loss Allowance, the MFI must first increase the Impairment Loss Allowance by increasing (I13) Impairment Losses on Loans before reducing the Gross Loan Portfolio and the Impairment Loss Allowance. Table 2.10 shows a sample portfolio report.
Table 2.11 provides line-by-line definitions of the information presented in the portfolio report (table 2.10) to clarify what each line item represents.
Table 2.11. Portfolio Report Detail
Ref. Account Name Definition Calculation
P1 Number of Loans Disbursed
The number of all loans disbursed during the period. For MFIs using a group lending methodology, the number of loans should refer to the number of individuals receiving loans as part of a group or as part of a group loan. If one person receives more than one loan in the period, count each loan.
P2 Value of Loans Disbursed
Same as (C9) Value of Loans Disbursed.
P3 Number of Loans Outstanding
The number of loans in the (B4) Gross Loan Portfolio. For MFIs using a group lending methodology, the number of loans should refer to the number of individuals receiving loans as part of a group or as part of a group loan.
P11 + P13 + P15
P4 Value of Loans Outstanding
Same as the (B4) Gross Loan Portfolio. P12 + P14 + P16
P5 Impairment Loss Allowance
Same as (B5) Impairment Loss Allowance.
P6 Number of Loans Written Off
The number of loans that have been recognized as uncollectible for accounting purposes.
P7 Value of Loans Written Off
The value of loans that have been recognized as uncollectible for accounting purposes. A write-off is an accounting procedure that removes the outstanding balance of the loan from the (B4) Gross Loan Portfolio and (B5) Impairment Loss Allowance. Thus, the write-off does not affect the (B3) Net Loan Portfolio, (B12) Total Assets, or any equity account. If the Impairment Loss Allowance is insufficient to cover the amount written off, the excess amount will result in an additional Impairment Losses on Loans.
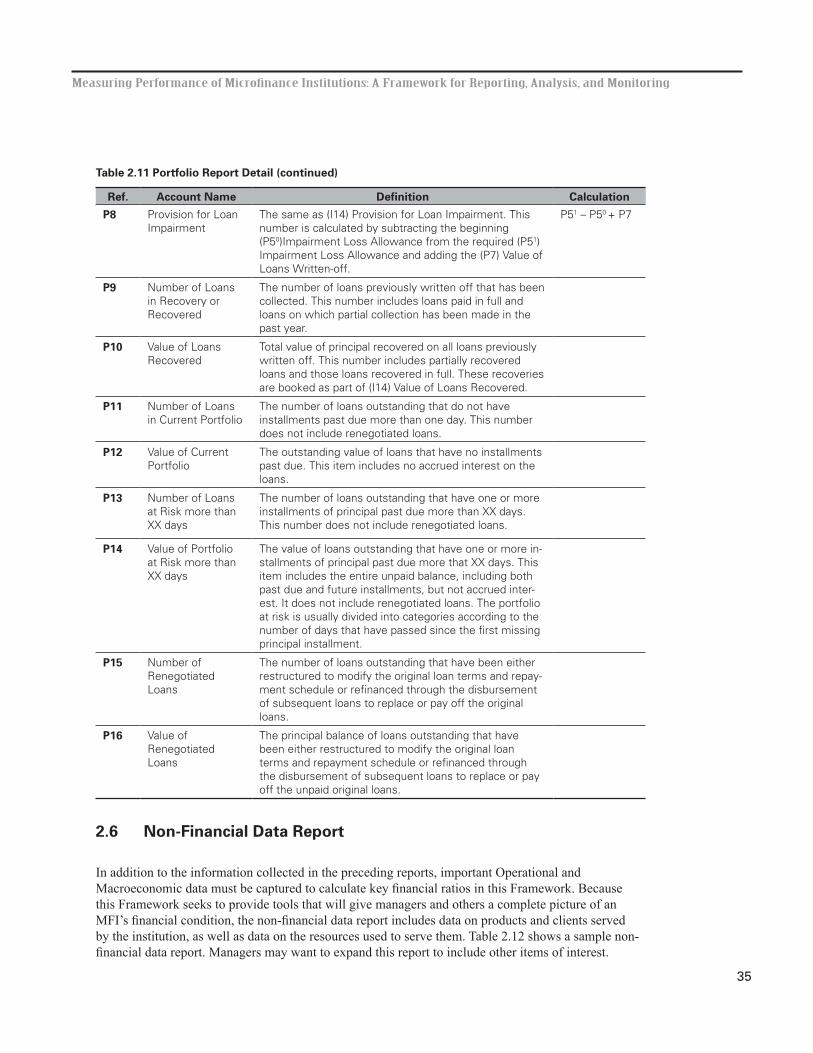
Measuring Performance of Microfinance Institutions: A Framework for Reporting, Analysis, and Monitoring
35
Ref. Account Name Definition Calculation
P8 Provision for Loan Impairment
The same as (I14) Provision for Loan Impairment. This number is calculated by subtracting the beginning (P50)Impairment Loss Allowance from the required (P51) Impairment Loss Allowance and adding the (P7) Value of Loans Written-off.
P51 – P50 + P7
P9 Number of Loans in Recovery or Recovered
The number of loans previously written off that has been collected. This number includes loans paid in full and loans on which partial collection has been made in the past year.
P10 Value of Loans Recovered
Total value of principal recovered on all loans previously written off. This number includes partially recovered loans and those loans recovered in full. These recoveries are booked as part of (I14) Value of Loans Recovered.
P11 Number of Loans in Current Portfolio
The number of loans outstanding that do not have installments past due more than one day. This number does not include renegotiated loans.
P12 Value of Current Portfolio
The outstanding value of loans that have no installments past due. This item includes no accrued interest on the loans.
P13 Number of Loans at Risk more than XX days
The number of loans outstanding that have one or more installments of principal past due more than XX days. This number does not include renegotiated loans.
P14 Value of Portfolio at Risk more than XX days
The value of loans outstanding that have one or more in-stallments of principal past due more that XX days. This item includes the entire unpaid balance, including both past due and future installments, but not accrued inter-est. It does not include renegotiated loans. The portfolio at risk is usually divided into categories according to the number of days that have passed since the first missing principal installment.
P15 Number of Renegotiated Loans
The number of loans outstanding that have been either restructured to modify the original loan terms and repay-ment schedule or refinanced through the disbursement of subsequent loans to replace or pay off the original loans.
P16 Value of Renegotiated Loans
The principal balance of loans outstanding that have been either restructured to modify the original loan terms and repayment schedule or refinanced through the disbursement of subsequent loans to replace or pay off the unpaid original loans.
2.6 Non-Financial Data Report
In addition to the information collected in the preceding reports, important Operational and Macroeconomic data must be captured to calculate key financial ratios in this Framework. Because this Framework seeks to provide tools that will give managers and others a complete picture of an MFI’s financial condition, the non-financial data report includes data on products and clients served by the institution, as well as data on the resources used to serve them. Table 2.12 shows a sample non-financial data report. Managers may want to expand this report to include other items of interest.
Table 2.11 Portfolio Report Detail (continued)
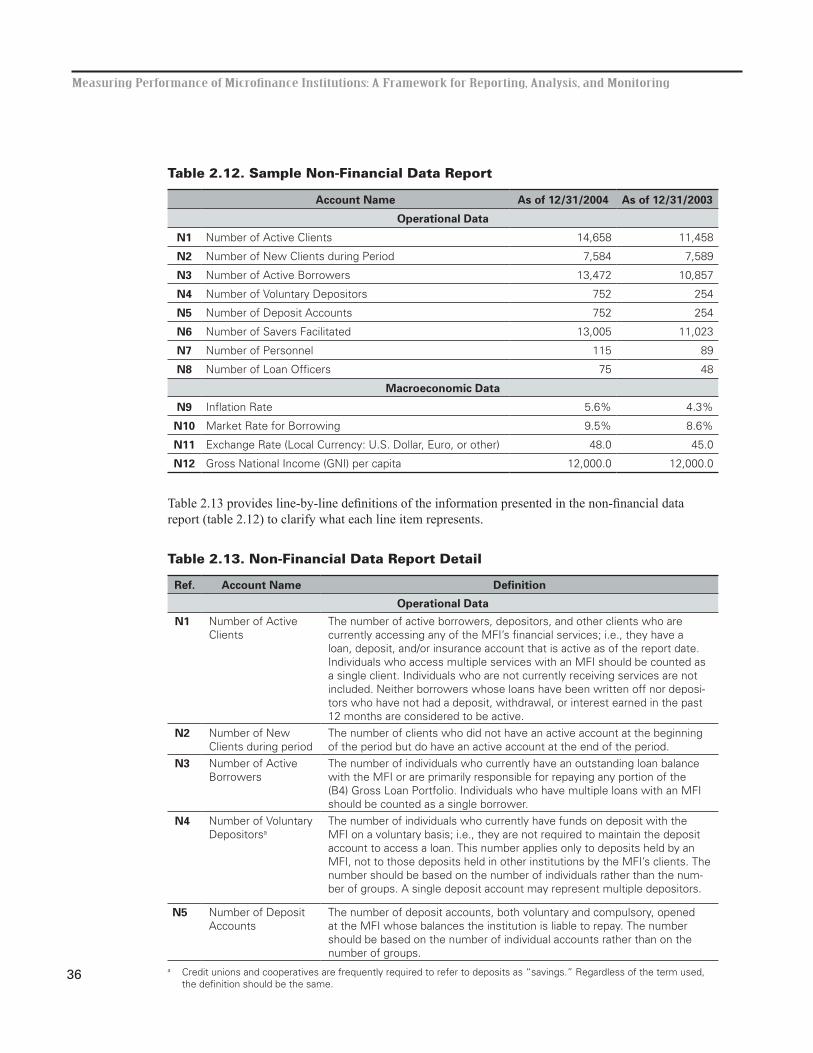
Measuring Performance of Microfinance Institutions: A Framework for Reporting, Analysis, and Monitoring
36
Table 2.12. Sample Non-Financial Data Report
Account Name As of 12/31/2004 As of 12/31/2003
Operational Data
N1 Number of Active Clients 14,658 11,458
N2 Number of New Clients during Period 7,584 7,589
N3 Number of Active Borrowers 13,472 10,857
N4 Number of Voluntary Depositors 752 254
N5 Number of Deposit Accounts 752 254
N6 Number of Savers Facilitated 13,005 11,023
N7 Number of Personnel 115 89
N8 Number of Loan Officers 75 48
Macroeconomic Data
N9 Inflation Rate 5.6% 4.3%
N10 Market Rate for Borrowing 9.5% 8.6%
N11 Exchange Rate (Local Currency: U.S. Dollar, Euro, or other) 48.0 45.0
N12 Gross National Income (GNI) per capita 12,000.0 12,000.0
Table 2.13 provides line-by-line definitions of the information presented in the non-financial data report (table 2.12) to clarify what each line item represents.
Table 2.13. Non-Financial Data Report Detail
Ref. Account Name Definition
Operational Data
N1 Number of Active Clients
The number of active borrowers, depositors, and other clients who are currently accessing any of the MFI’s financial services; i.e., they have a loan, deposit, and/or insurance account that is active as of the report date. Individuals who access multiple services with an MFI should be counted as a single client. Individuals who are not currently receiving services are not included. Neither borrowers whose loans have been written off nor deposi-tors who have not had a deposit, withdrawal, or interest earned in the past 12 months are considered to be active.
N2 Number of New Clients during period
The number of clients who did not have an active account at the beginning of the period but do have an active account at the end of the period.
N3 Number of Active Borrowers
The number of individuals who currently have an outstanding loan balance with the MFI or are primarily responsible for repaying any portion of the (B4) Gross Loan Portfolio. Individuals who have multiple loans with an MFI should be counted as a single borrower.
N4 Number of Voluntary Depositorsa
The number of individuals who currently have funds on deposit with the MFI on a voluntary basis; i.e., they are not required to maintain the deposit account to access a loan. This number applies only to deposits held by an MFI, not to those deposits held in other institutions by the MFI’s clients. The number should be based on the number of individuals rather than the num-ber of groups. A single deposit account may represent multiple depositors.
N5 Number of Deposit Accounts
The number of deposit accounts, both voluntary and compulsory, opened at the MFI whose balances the institution is liable to repay. The number should be based on the number of individual accounts rather than on the number of groups.
a Credit unions and cooperatives are frequently required to refer to deposits as “savings.” Regardless of the term used, the definition should be the same.
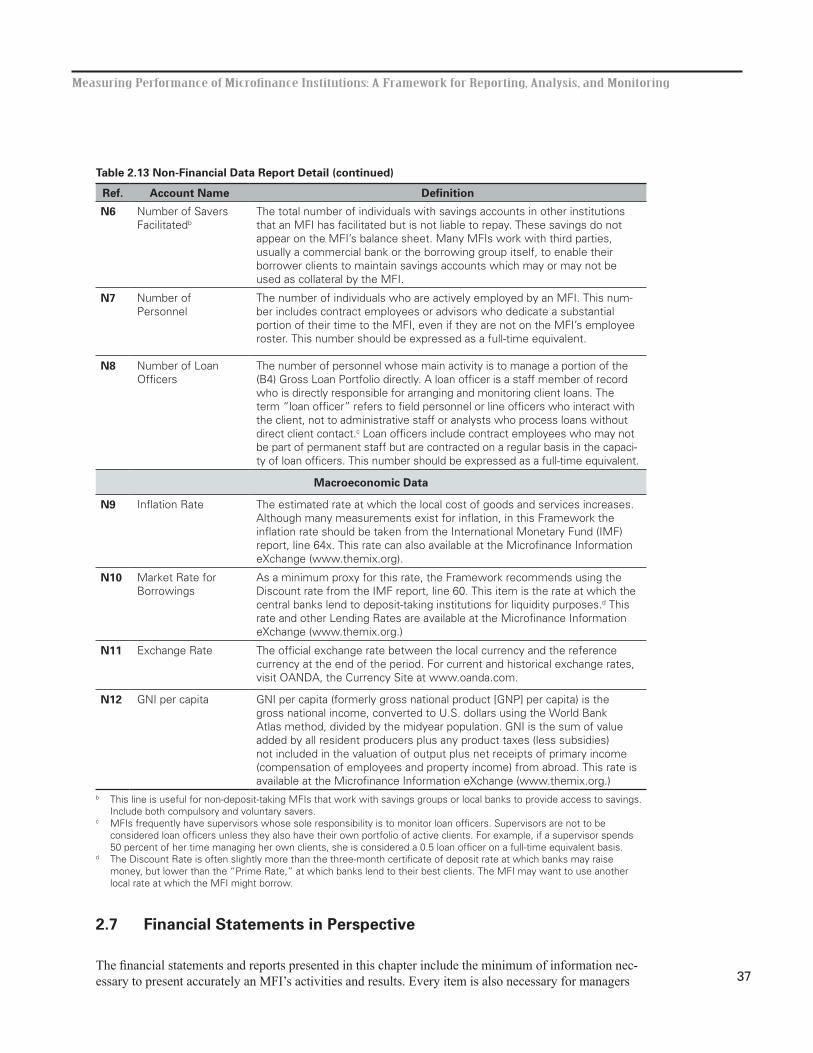
Measuring Performance of Microfinance Institutions: A Framework for Reporting, Analysis, and Monitoring
37
Ref. Account Name Definition
N6 Number of Savers Facilitatedb
The total number of individuals with savings accounts in other institutions that an MFI has facilitated but is not liable to repay. These savings do not appear on the MFI’s balance sheet. Many MFIs work with third parties, usually a commercial bank or the borrowing group itself, to enable their borrower clients to maintain savings accounts which may or may not be used as collateral by the MFI.
N7 Number of Personnel
The number of individuals who are actively employed by an MFI. This num-ber includes contract employees or advisors who dedicate a substantial portion of their time to the MFI, even if they are not on the MFI’s employee roster. This number should be expressed as a full-time equivalent.
N8 Number of Loan Officers
The number of personnel whose main activity is to manage a portion of the (B4) Gross Loan Portfolio directly. A loan officer is a staff member of record who is directly responsible for arranging and monitoring client loans. The term “loan officer” refers to field personnel or line officers who interact with the client, not to administrative staff or analysts who process loans without direct client contact.c Loan officers include contract employees who may not be part of permanent staff but are contracted on a regular basis in the capaci-ty of loan officers. This number should be expressed as a full-time equivalent.
Macroeconomic Data
N9 Inflation Rate The estimated rate at which the local cost of goods and services increases. Although many measurements exist for inflation, in this Framework the inflation rate should be taken from the International Monetary Fund (IMF) report, line 64x. This rate can also available at the Microfinance Information eXchange (www.themix.org).
N10 Market Rate for Borrowings
As a minimum proxy for this rate, the Framework recommends using the Discount rate from the IMF report, line 60. This item is the rate at which the central banks lend to deposit-taking institutions for liquidity purposes.d This rate and other Lending Rates are available at the Microfinance Information eXchange (www.themix.org.)
N11 Exchange Rate The official exchange rate between the local currency and the reference currency at the end of the period. For current and historical exchange rates, visit OANDA, the Currency Site at www.oanda.com.
N12 GNI per capita GNI per capita (formerly gross national product [GNP] per capita) is the gross national income, converted to U.S. dollars using the World Bank Atlas method, divided by the midyear population. GNI is the sum of value added by all resident producers plus any product taxes (less subsidies) not included in the valuation of output plus net receipts of primary income (compensation of employees and property income) from abroad. This rate is available at the Microfinance Information eXchange (www.themix.org.)
b This line is useful for non-deposit-taking MFIs that work with savings groups or local banks to provide access to savings. Include both compulsory and voluntary savers.
c MFIs frequently have supervisors whose sole responsibility is to monitor loan officers. Supervisors are not to be considered loan officers unless they also have their own portfolio of active clients. For example, if a supervisor spends 50 percent of her time managing her own clients, she is considered a 0.5 loan officer on a full-time equivalent basis.
d The Discount Rate is often slightly more than the three-month certificate of deposit rate at which banks may raise money, but lower than the “Prime Rate,” at which banks lend to their best clients. The MFI may want to use another local rate at which the MFI might borrow.
2.7 Financial Statements in Perspective
The financial statements and reports presented in this chapter include the minimum of information nec-essary to present accurately an MFI’s activities and results. Every item is also necessary for managers
Table 2.13 Non-Financial Data Report Detail (continued)
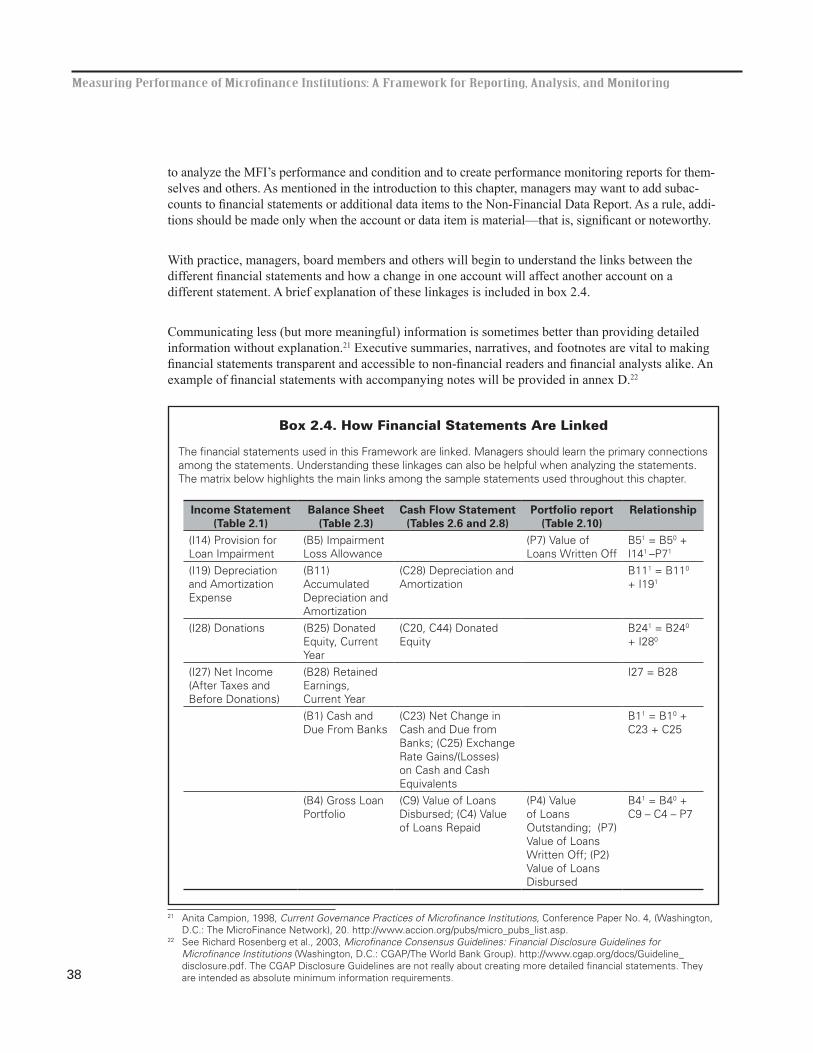
Measuring Performance of Microfinance Institutions: A Framework for Reporting, Analysis, and Monitoring
38
to analyze the MFI’s performance and condition and to create performance monitoring reports for them-selves and others. As mentioned in the introduction to this chapter, managers may want to add subac-counts to financial statements or additional data items to the Non-Financial Data Report. As a rule, addi-tions should be made only when the account or data item is material—that is, significant or noteworthy.
With practice, managers, board members and others will begin to understand the links between the different financial statements and how a change in one account will affect another account on a different statement. A brief explanation of these linkages is included in box 2.4.
Communicating less (but more meaningful) information is sometimes better than providing detailed information without explanation.21 Executive summaries, narratives, and footnotes are vital to making financial statements transparent and accessible to non-financial readers and financial analysts alike. An example of financial statements with accompanying notes will be provided in annex D.22
Box 2.4. How Financial Statements Are Linked
The financial statements used in this Framework are linked. Managers should learn the primary connections among the statements. Understanding these linkages can also be helpful when analyzing the statements. The matrix below highlights the main links among the sample statements used throughout this chapter.
Income Statement (Table 2.1)
Balance Sheet (Table 2.3)
Cash Flow Statement (Tables 2.6 and 2.8)
Portfolio report (Table 2.10)
Relationship
(I14) Provision for Loan Impairment
(B5) Impairment Loss Allowance
(P7) Value of Loans Written Off
B51 = B50 + I141 –P71
(I19) Depreciation and Amortization Expense
(B11) Accumulated Depreciation and Amortization
(C28) Depreciation and Amortization
B111 = B110
+ I191
(I28) Donations (B25) Donated Equity, Current Year
(C20, C44) Donated Equity
B241 = B240 + I280
(I27) Net Income (After Taxes and Before Donations)
(B28) Retained Earnings, Current Year
I27 = B28
(B1) Cash and Due From Banks
(C23) Net Change in Cash and Due from Banks; (C25) Exchange Rate Gains/(Losses) on Cash and Cash Equivalents
B11 = B10 + C23 + C25
(B4) Gross Loan Portfolio
(C9) Value of Loans Disbursed; (C4) Value of Loans Repaid
(P4) Value of Loans Outstanding; (P7) Value of Loans Written Off; (P2) Value of Loans Disbursed
B41 = B40 + C9 – C4 – P7
21 Anita Campion, 1998, Current Governance Practices of Microfinance Institutions, Conference Paper No. 4, (Washington, D.C.: The MicroFinance Network), 20. http://www.accion.org/pubs/micro_pubs_list.asp.
22 See Richard Rosenberg et al., 2003, Microfinance Consensus Guidelines: Financial Disclosure Guidelines for Microfinance Institutions (Washington, D.C.: CGAP/The World Bank Group). http://www.cgap.org/docs/Guideline_disclosure.pdf. The CGAP Disclosure Guidelines are not really about creating more detailed financial statements. They are intended as absolute minimum information requirements.
Measuring Performance of Microfinance Institutions: A Framework for Reporting, Analysis, and Monitoring
39
3Analytical Adjustments
Although most microfinance institution (MFI) managers are accustomed to hearing the term “adjustments” when referring to financial reporting, it means different things to different people. The Microfinance Financial Definitions Guidelines, Definitions of Selected Financial Terms, Ratios and Adjustments for Microfinance, known as the Financial Definitions Guidelines, provides definitions for some of the most common adjustments used in analyzing microfinance institutions. Those guidelines, however, do not address the details of how adjustments are calculated. The purpose of this chapter is to shed light on common adjustment methodologies used in microfinance by examining their differences, similarities, and effects on the bottom line and recommending some standard calculations for managers and others to use.
As noted in the Framework’s introduction, the reader does not need to be able to complete each (or any) of the adjustments to work through the ratios in chapter 4. Properly calculated adjustments, however, provide valuable information to managers.
Three major types of adjustments are traditionally applied to MFIs:
1. Subsidies,2. Inflation, and 3. Portfolio at risk.
For each main category of adjustment, the chapter includes the following information:
• A description of the adjustments, • Highlights of the differences in calculation methodologies, • Recommendations for adjustments for true performance, • Recommendations for a standard adjustment for benchmarking, and• A description of the effects of the adjustments.
Table 3.1 summarizes the adjustments described in this chapter.
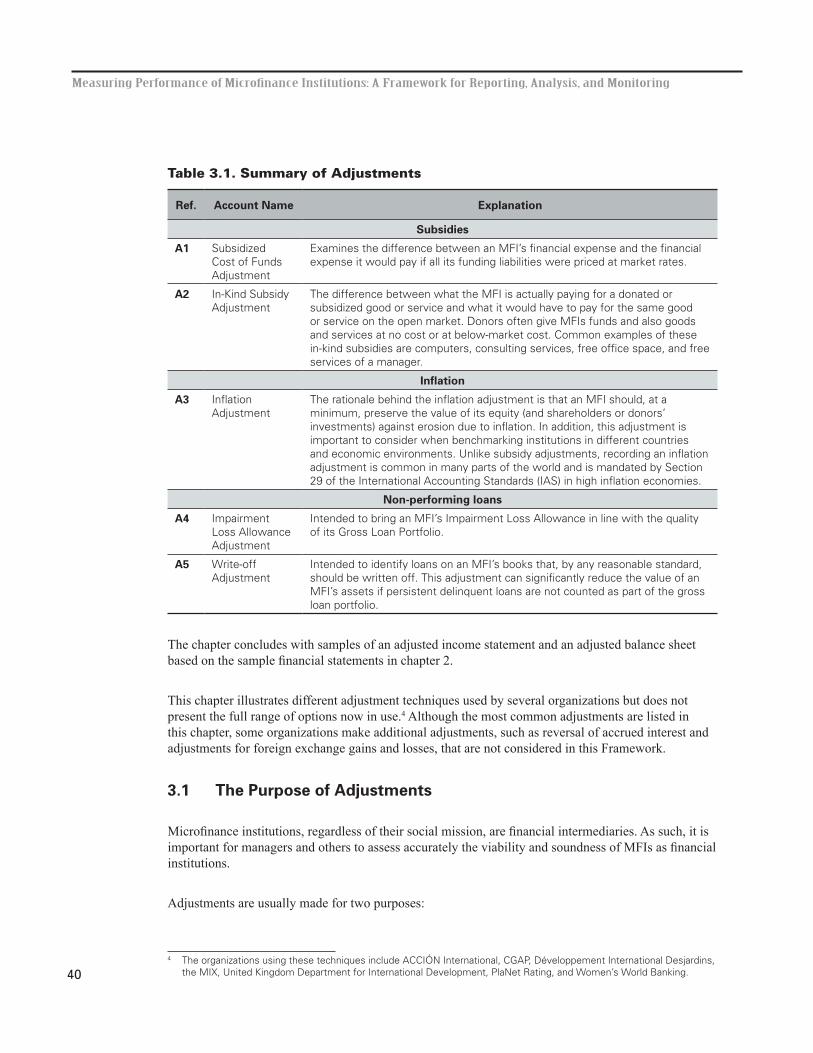
Measuring Performance of Microfinance Institutions: A Framework for Reporting, Analysis, and Monitoring
40
Table 3.1. Summary of Adjustments
Ref. Account Name Explanation
Subsidies
A1 Subsidized Cost of Funds Adjustment
Examines the difference between an MFI’s financial expense and the financial expense it would pay if all its funding liabilities were priced at market rates.
A2 In-Kind Subsidy Adjustment
The difference between what the MFI is actually paying for a donated or subsidized good or service and what it would have to pay for the same good or service on the open market. Donors often give MFIs funds and also goods and services at no cost or at below-market cost. Common examples of these in-kind subsidies are computers, consulting services, free office space, and free services of a manager.
Inflation
A3 Inflation Adjustment
The rationale behind the inflation adjustment is that an MFI should, at a minimum, preserve the value of its equity (and shareholders or donors’ investments) against erosion due to inflation. In addition, this adjustment is important to consider when benchmarking institutions in different countries and economic environments. Unlike subsidy adjustments, recording an inflation adjustment is common in many parts of the world and is mandated by Section 29 of the International Accounting Standards (IAS) in high inflation economies.
Non-performing loans
A4 Impairment Loss Allowance Adjustment
Intended to bring an MFI’s Impairment Loss Allowance in line with the quality of its Gross Loan Portfolio.
A5 Write-off Adjustment
Intended to identify loans on an MFI’s books that, by any reasonable standard, should be written off. This adjustment can significantly reduce the value of an MFI’s assets if persistent delinquent loans are not counted as part of the gross loan portfolio.
The chapter concludes with samples of an adjusted income statement and an adjusted balance sheet based on the sample financial statements in chapter 2.
This chapter illustrates different adjustment techniques used by several organizations but does not present the full range of options now in use.4 Although the most common adjustments are listed in this chapter, some organizations make additional adjustments, such as reversal of accrued interest and adjustments for foreign exchange gains and losses, that are not considered in this Framework.
3.1 The Purpose of Adjustments
Microfinance institutions, regardless of their social mission, are financial intermediaries. As such, it is important for managers and others to assess accurately the viability and soundness of MFIs as financial institutions.
Adjustments are usually made for two purposes:
4 The organizations using these techniques include ACCIÓN International, CGAP, Développement International Desjardins, the MIX, United Kingdom Department for International Development, PlaNet Rating, and Women’s World Banking.
Measuring Performance of Microfinance Institutions: A Framework for Reporting, Analysis, and Monitoring
41
• To reflect the true performance of MFIs (or their ability to maintain their level of operations over the long term) and • To enable benchmarking across a wide range of institutions.
Although commercial banks usually do not concern themselves with adjustments, the need for adjustments in the field of microfinance is gaining acceptance. Adjustments make meaningful comparison of MFIs possible despite the diversity of the industry. Adjustments also enable MFI managers and outside analysts to measure the true performance of an MFI and analyze its long-term viability by studying its ability to cover all costs.
3.1.1 True Performance
True performance adjustments help reverse accounting policies that can present a distorted picture of the MFI’s performance. Unadjusted data—even in the standardized format presented in chapter 2—may misrepresent an MFI’s true performance when the underlying accounting practices and policies do not take into consideration certain risks. Some MFIs operate under rigid banking rules that require certain accounting principles and prudential norms, while others are free to adopt lenient accounting practices or flexible policies that may not ensure long-term sustainability. Some MFIs also operate with subsidies that may not be available in the long run. The common definitions, financial statements, and report formats proposed in chapter 2 may help overcome some of the issues linked to accounting differences, but they do not address the risk management or accounting decisions made by MFIs.
In addition, true performance adjustments can help simulate an MFI’s performance under conditions similar to those of a commercially funded operation. Adjusting financial statements enables managers to quantify the subsidized portion of the operations and the amount of additional revenue or increased efficiency needed to offset that subsidy.
Using adjustments to analyze true performance can be a very detailed exercise and involves myriad choices. Numerous variations exist on how these true performance adjustments can be calculated be-cause the environments in which MFIs operate are quite diverse. In this chapter, a general formula is provided for calculating adjustments for true performance, and the variables are identified. Boxes 3.1 through 3.5 work through one example for a fictitious MFI on how to calculate true performance adjust-ments. Management should determine the variables that are most appropriate for its own environment.
3.1.2 Benchmarking
In addition to providing a better indication of the true performance of a single MFI, adjustments also enable managers and outside analysts to compare or benchmark an MFI’s performance with other MFIs. Adjustments for benchmarking create common minimum standards for recognizing and managing credit, country, and operational risk in financial reporting. These standards eliminate many of the distortions among institutions caused by different legal forms, regulatory environments, and accounting, and other institutional policies.
Throughout the chapter, the standard for benchmarking presented follows the methodology used by the MicroBanking Bulletin.5 The reader can use the adjustments presented in this chapter to develop a set
5 The MicroBanking Bulletin collects financial and portfolio data provided voluntarily by microfinance institutions (MFIs), or-ganizes the data by peer groups, and disseminates the results. Its benchmarks are widely used by investors, donors, and other service providers to facilitate greater standardization and a better understanding of the development of the microfi-nance sector. For more information and recent editions of MicroBanking Bulletin benchmarks, visit www.mixmbb.org.
Measuring Performance of Microfinance Institutions: A Framework for Reporting, Analysis, and Monitoring
42
of adjusted financial statements and compare their performance to international benchmarks regularly published in the MicroBanking Bulletin.6
3.2 Availability of Data
The availability of data is a key issue when deciding which adjustments to make and what method to follow. Adjustments often require information not found in the financial statements. Some adjustments also require estimations, such as the replacement cost of a particular donated good or service or the cost of funds at a market rate.
A trade-off often exists between the precision of data and the cost of gathering it; the more accurate the data the more costly it is to collect. Finding the most accurate data for true performance may require the MFI to spend more time and money in data collection. For benchmarking, this chapter incorporates data that is in the Framework or can be obtained fairly easily and at minimum cost to an MFI.
3.3 Methodologies for Adjustments
Differences in adjustment methodologies arise from different criteria used for the following:
• The accounts that are used for the adjustment, • The period for which the adjustment is made, • The estimation of the rate used in calculating the adjustment, and • The adjustment formula.
Despite the differences encountered, which depend on the purpose of the adjustment and availability of the data, all methodologies follow a similar approach, which is summarized in table 3.1. Several key points that are true for all the adjustments are also addressed in the chapter. They include the following:
• If an adjustment calculation produces a negative number, the adjustment is not applied. A negative number indicates that either the MFI’s accounting practices already meet minimum standards, or the risk is not a significant risk to the institution. • Managers should explain the adjustment calculation and which variables they chose. This explanation should be provided whenever adjusted data is presented. • Adjustments can be applied for any period of time. Adjusted financial statements are typically calculated on an annual basis. Adjustments can be calculated, however, for a quarter or even a month. • The method used to calculate averages makes a difference. Some adjustments are calculated using an average for a period. As discussed in chapter 1, managers should use monthly averages where possible and disclose the averaging method.
The remainder of this chapter is dedicated to presenting each adjustment, including a description of the key differences among adjustment methodologies used by MFI managers, analysts, rating agencies, donors, and investors.
6 Common variables against which performance is benchmarked include age, target market, size, and region.
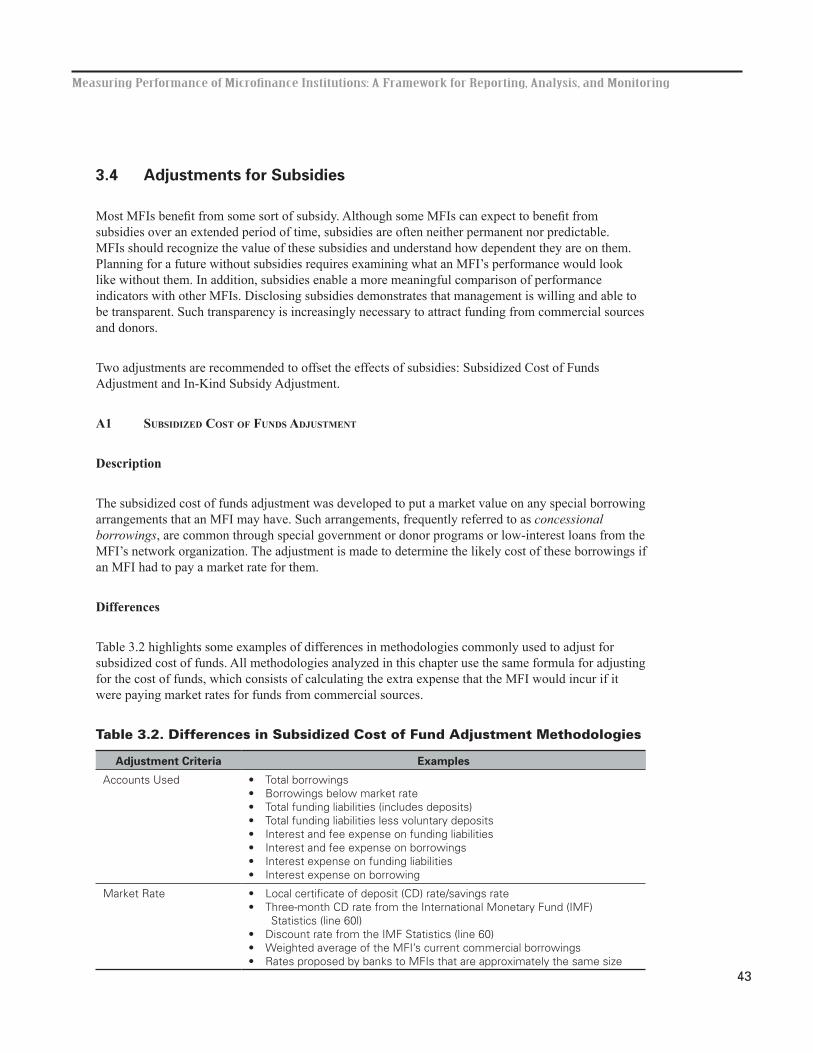
Measuring Performance of Microfinance Institutions: A Framework for Reporting, Analysis, and Monitoring
43
3.4 Adjustments for Subsidies
Most MFIs benefit from some sort of subsidy. Although some MFIs can expect to benefit from subsidies over an extended period of time, subsidies are often neither permanent nor predictable. MFIs should recognize the value of these subsidies and understand how dependent they are on them. Planning for a future without subsidies requires examining what an MFI’s performance would look like without them. In addition, subsidies enable a more meaningful comparison of performance indicators with other MFIs. Disclosing subsidies demonstrates that management is willing and able to be transparent. Such transparency is increasingly necessary to attract funding from commercial sources and donors.
Two adjustments are recommended to offset the effects of subsidies: Subsidized Cost of Funds Adjustment and In-Kind Subsidy Adjustment.
A1 SUBSIDIZED COST OF FUNDS ADJUSTMENT
Description
The subsidized cost of funds adjustment was developed to put a market value on any special borrowing arrangements that an MFI may have. Such arrangements, frequently referred to as concessional borrowings, are common through special government or donor programs or low-interest loans from the MFI’s network organization. The adjustment is made to determine the likely cost of these borrowings if an MFI had to pay a market rate for them.
Differences
Table 3.2 highlights some examples of differences in methodologies commonly used to adjust for subsidized cost of funds. All methodologies analyzed in this chapter use the same formula for adjusting for the cost of funds, which consists of calculating the extra expense that the MFI would incur if it were paying market rates for funds from commercial sources.
Table 3.2. Differences in Subsidized Cost of Fund Adjustment Methodologies
Adjustment Criteria Examples
Accounts Used • Total borrowings• Borrowings below market rate• Total funding liabilities (includes deposits)• Total funding liabilities less voluntary deposits• Interest and fee expense on funding liabilities• Interest and fee expense on borrowings• Interest expense on funding liabilities• Interest expense on borrowing
Market Rate • Local certificate of deposit (CD) rate/savings rate• Three-month CD rate from the International Monetary Fund (IMF) Statistics (line 60l)• Discount rate from the IMF Statistics (line 60)• Weighted average of the MFI’s current commercial borrowings• Rates proposed by banks to MFIs that are approximately the same size
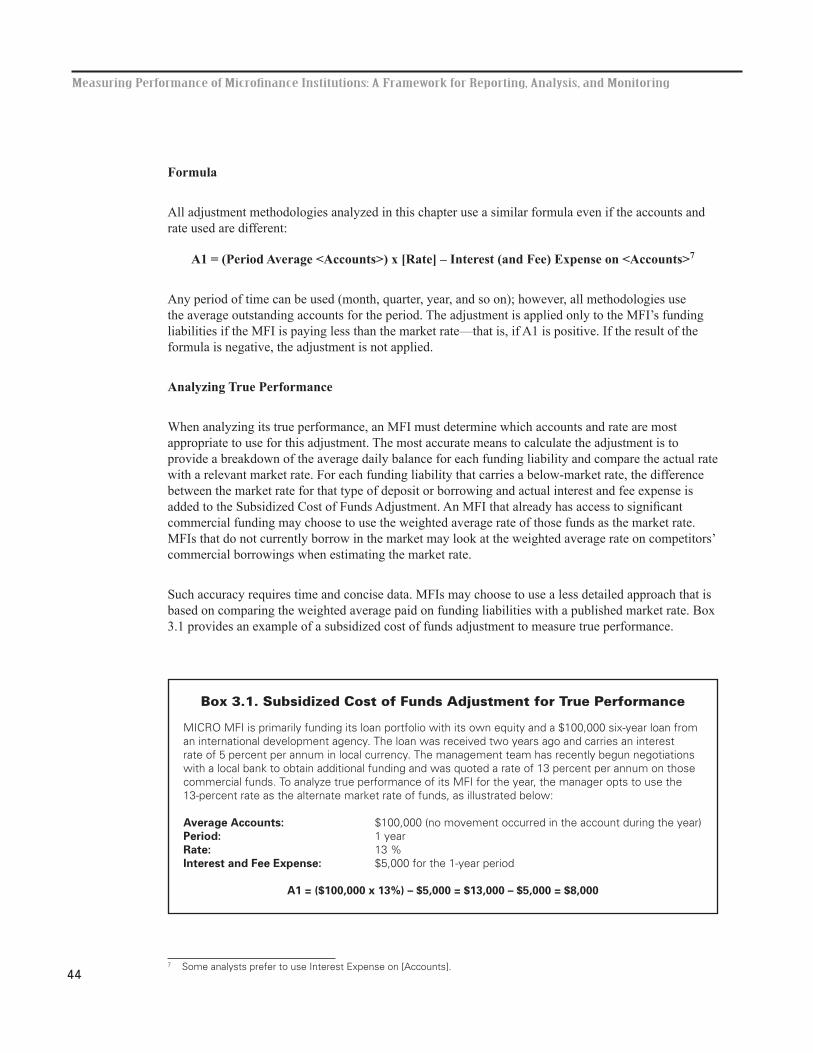
Measuring Performance of Microfinance Institutions: A Framework for Reporting, Analysis, and Monitoring
44
Formula
All adjustment methodologies analyzed in this chapter use a similar formula even if the accounts and rate used are different:
A1 = (Period Average <Accounts>) x [Rate] – Interest (and Fee) Expense on <Accounts>7
Any period of time can be used (month, quarter, year, and so on); however, all methodologies use the average outstanding accounts for the period. The adjustment is applied only to the MFI’s funding liabilities if the MFI is paying less than the market rate—that is, if A1 is positive. If the result of the formula is negative, the adjustment is not applied.
Analyzing True Performance
When analyzing its true performance, an MFI must determine which accounts and rate are most appropriate to use for this adjustment. The most accurate means to calculate the adjustment is to provide a breakdown of the average daily balance for each funding liability and compare the actual rate with a relevant market rate. For each funding liability that carries a below-market rate, the difference between the market rate for that type of deposit or borrowing and actual interest and fee expense is added to the Subsidized Cost of Funds Adjustment. An MFI that already has access to significant commercial funding may choose to use the weighted average rate of those funds as the market rate. MFIs that do not currently borrow in the market may look at the weighted average rate on competitors’ commercial borrowings when estimating the market rate.
Such accuracy requires time and concise data. MFIs may choose to use a less detailed approach that is based on comparing the weighted average paid on funding liabilities with a published market rate. Box 3.1 provides an example of a subsidized cost of funds adjustment to measure true performance.
Box 3.1. Subsidized Cost of Funds Adjustment for True Performance
MICRO MFI is primarily funding its loan portfolio with its own equity and a $100,000 six-year loan from an international development agency. The loan was received two years ago and carries an interest rate of 5 percent per annum in local currency. The management team has recently begun negotiations with a local bank to obtain additional funding and was quoted a rate of 13 percent per annum on those commercial funds. To analyze true performance of its MFI for the year, the manager opts to use the 13-percent rate as the alternate market rate of funds, as illustrated below:
Average Accounts: $100,000 (no movement occurred in the account during the year)Period: 1 yearRate: 13 %Interest and Fee Expense: $5,000 for the 1-year period
A1 = ($100,000 x 13%) – $5,000 = $13,000 – $5,000 = $8,000
7 Some analysts prefer to use Interest Expense on [Accounts].
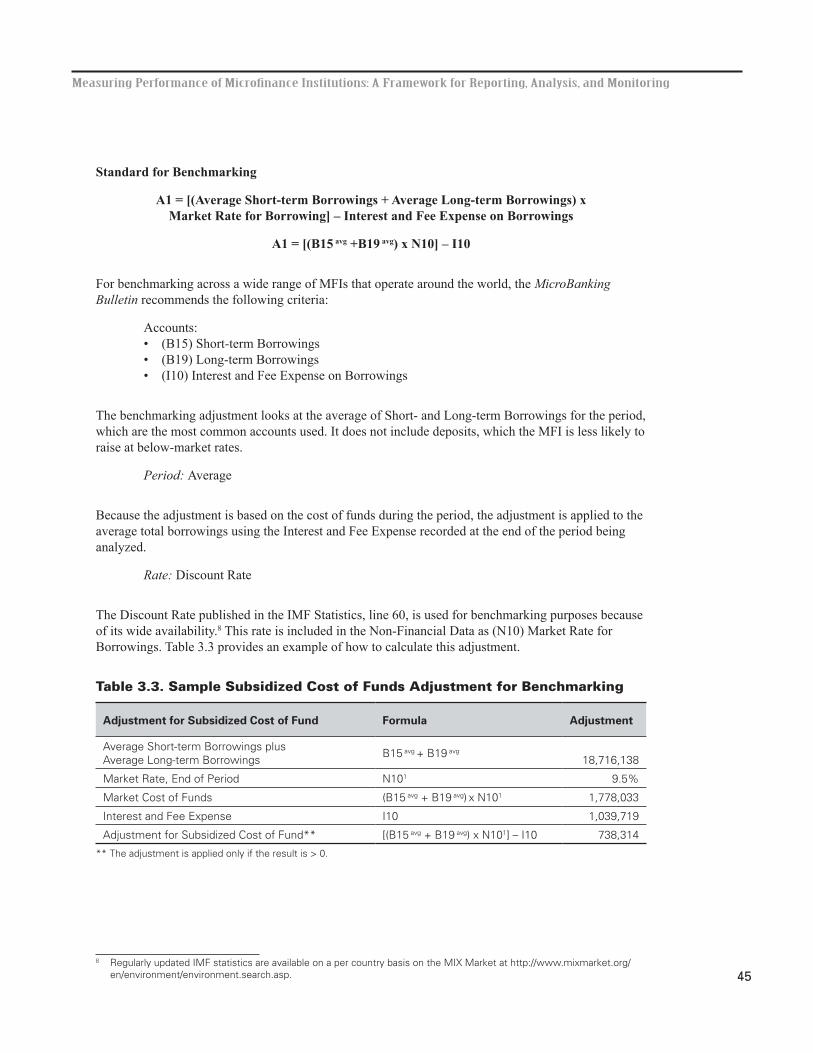
Measuring Performance of Microfinance Institutions: A Framework for Reporting, Analysis, and Monitoring
45
Standard for Benchmarking
A1 = [(Average Short-term Borrowings + Average Long-term Borrowings) x Market Rate for Borrowing] – Interest and Fee Expense on Borrowings
A1 = [(B15 avg +B19 avg) x N10] – I10
For benchmarking across a wide range of MFIs that operate around the world, the MicroBanking Bulletin recommends the following criteria:
Accounts: • (B15) Short-term Borrowings• (B19) Long-term Borrowings• (I10) Interest and Fee Expense on Borrowings
The benchmarking adjustment looks at the average of Short- and Long-term Borrowings for the period, which are the most common accounts used. It does not include deposits, which the MFI is less likely to raise at below-market rates.
Period: Average
Because the adjustment is based on the cost of funds during the period, the adjustment is applied to the average total borrowings using the Interest and Fee Expense recorded at the end of the period being analyzed.
Rate: Discount Rate
The Discount Rate published in the IMF Statistics, line 60, is used for benchmarking purposes because of its wide availability.8 This rate is included in the Non-Financial Data as (N10) Market Rate for Borrowings. Table 3.3 provides an example of how to calculate this adjustment.
Table 3.3. Sample Subsidized Cost of Funds Adjustment for Benchmarking
Adjustment for Subsidized Cost of Fund Formula Adjustment
Average Short-term Borrowings plus Average Long-term Borrowings
B15 avg + B19 avg
18,716,138
Market Rate, End of Period N101 9.5%
Market Cost of Funds (B15 avg + B19 avg) x N101 1,778,033
Interest and Fee Expense I10 1,039,719
Adjustment for Subsidized Cost of Fund** [(B15 avg + B19 avg) x N101] – I10 738,314
** The adjustment is applied only if the result is > 0.
8 Regularly updated IMF statistics are available on a per country basis on the MIX Market at http://www.mixmarket.org/en/environment/environment.search.asp.
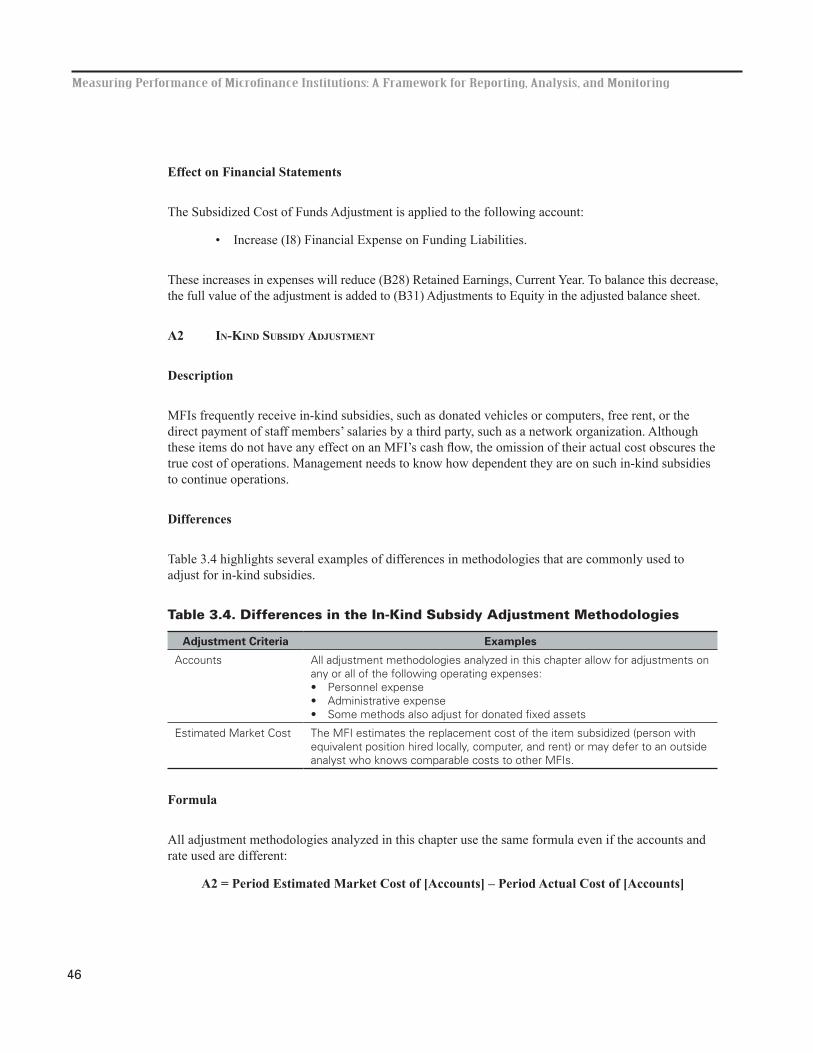
Measuring Performance of Microfinance Institutions: A Framework for Reporting, Analysis, and Monitoring
46
Effect on Financial Statements
The Subsidized Cost of Funds Adjustment is applied to the following account:
• Increase (I8) Financial Expense on Funding Liabilities.
These increases in expenses will reduce (B28) Retained Earnings, Current Year. To balance this decrease, the full value of the adjustment is added to (B31) Adjustments to Equity in the adjusted balance sheet.
A2 IN-KIND SUBSIDY ADJUSTMENT
Description
MFIs frequently receive in-kind subsidies, such as donated vehicles or computers, free rent, or the direct payment of staff members’ salaries by a third party, such as a network organization. Although these items do not have any effect on an MFI’s cash flow, the omission of their actual cost obscures the true cost of operations. Management needs to know how dependent they are on such in-kind subsidies to continue operations.
Differences
Table 3.4 highlights several examples of differences in methodologies that are commonly used to adjust for in-kind subsidies.
Table 3.4. Differences in the In-Kind Subsidy Adjustment Methodologies
Adjustment Criteria Examples
Accounts All adjustment methodologies analyzed in this chapter allow for adjustments on any or all of the following operating expenses: • Personnel expense• Administrative expense• Some methods also adjust for donated fixed assets
Estimated Market Cost The MFI estimates the replacement cost of the item subsidized (person with equivalent position hired locally, computer, and rent) or may defer to an outside analyst who knows comparable costs to other MFIs.
Formula
All adjustment methodologies analyzed in this chapter use the same formula even if the accounts and rate used are different:
A2 = Period Estimated Market Cost of [Accounts] – Period Actual Cost of [Accounts]
Measuring Performance of Microfinance Institutions: A Framework for Reporting, Analysis, and Monitoring
47
A challenge for managers is determining how to treat donations of fixed assets. This framework recommends that MFI managers account for Fixed Assets donations as part of their regular accounting rather than as an adjustment (see box 2).9 If the MFI does not do so, managers may include the value of donated Fixed Assets as a true performance adjustment. However, they are not required to do so to adjust for benchmarking purposes.
Analyzing True Performance
The adjustment for in-kind subsidies is critical for MFIs that are interested in determining their financial self-sufficiency or their ability to cover all costs related to running the MFI with its own operating revenue. To be accurate, managers should consider every in-kind subsidy received, including personnel, fixed assets, and other operational support.10 When considering which rates to use, managers should apply a fair local replacement value for the value of the subsidized staff member, service, or asset. For personnel and administrative subsidies, the difference between the estimated market cost and actual cost is added to the In-Kind Subsidy Adjustment. In the case of true performance analysis, donated Fixed Assets, such as donated computers or vehicles, that are not included in normal accounting for depreciation can be accounted for in In-kind Subsidy Adjustment. Managers should consider the asset’s purchase cost and useful life and then apply the value of the fixed assets “consumed” during the period and add this amount to the adjustment.
Box 3.2 provides and example of how to calculate an in-kind subsidy adjustment for true performance, including a sample calculation of how to account for Fixed Asset donations that have not been booked by the MFI.
Standard for Benchmarking
A2 = A2.1 + A2.2where:
A2.1 = Estimated Market Cost of Personnel – Actual Cost of Personnel A2.2 = Estimated Cost of Other Administrative Expenses – Actual Cost of Other Administrative
Expenses
A2.1 = Estimated Market Cost of I17 – Actual I17A2.2 = Estimate Market Cost of I20 – Actual I20
For benchmarking purposes, the following accounts are used in this adjustment.
Accounts: • (I17) Personnel Expense• (I20) Other Administrative Expense
9 MFIs should record fixed asset donations as deferred revenue in (B20) Other Long-term Liabilities. Each accounting period, usually monthly or quarterly, an amount equal to the period’s depreciation for the donated asset is transferred to (I28) Donations for Operating Expense, and the same amount is credited to (I17) Depreciation and Amortization. If the MFI is not recognizing a fixed asset donation in this manner, it should include the value of the fixed asset as part of this adjustment.
10 If a donor agreement requires an MFI to accept a good or service that it would not have purchased otherwise, the item is generally not treated as an in-kind subsidy when calculating this adjustment.
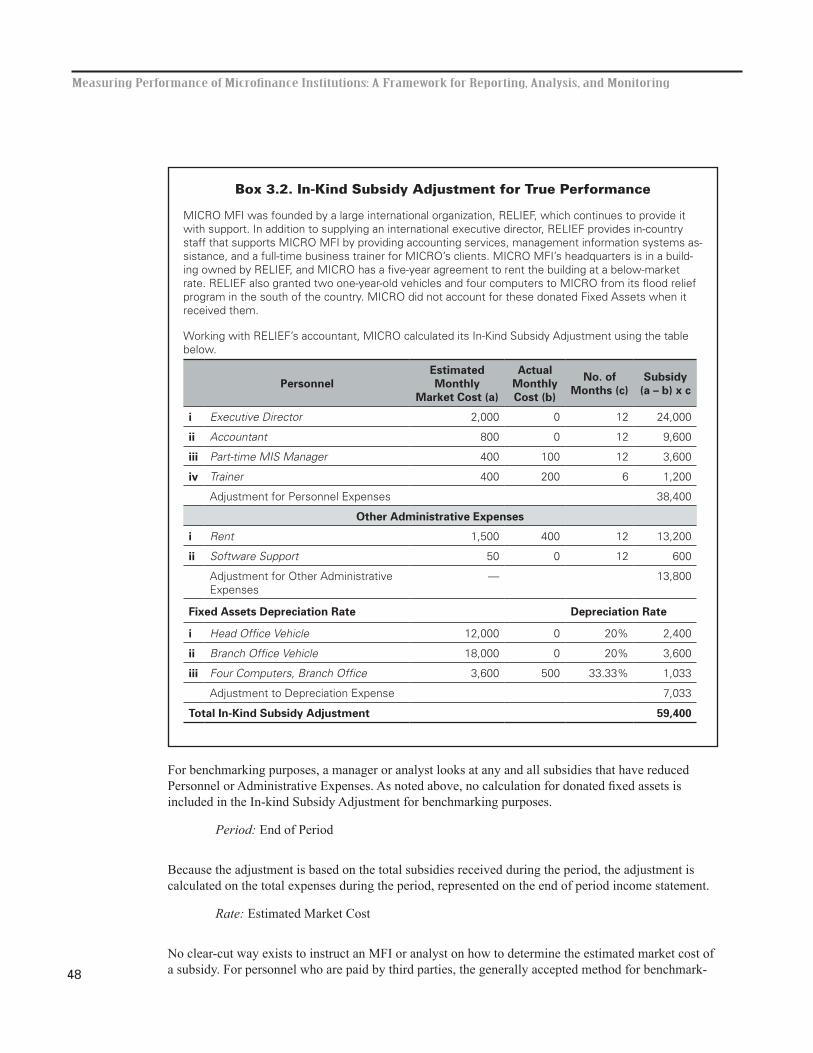
Measuring Performance of Microfinance Institutions: A Framework for Reporting, Analysis, and Monitoring
48
For benchmarking purposes, a manager or analyst looks at any and all subsidies that have reduced Personnel or Administrative Expenses. As noted above, no calculation for donated fixed assets is included in the In-kind Subsidy Adjustment for benchmarking purposes.
Period: End of Period
Because the adjustment is based on the total subsidies received during the period, the adjustment is calculated on the total expenses during the period, represented on the end of period income statement.
Rate: Estimated Market Cost
No clear-cut way exists to instruct an MFI or analyst on how to determine the estimated market cost of a subsidy. For personnel who are paid by third parties, the generally accepted method for benchmark-
Box 3.2. In-Kind Subsidy Adjustment for True Performance
MICRO MFI was founded by a large international organization, RELIEF, which continues to provide it with support. In addition to supplying an international executive director, RELIEF provides in-country staff that supports MICRO MFI by providing accounting services, management information systems as-sistance, and a full-time business trainer for MICRO’s clients. MICRO MFI’s headquarters is in a build-ing owned by RELIEF, and MICRO has a five-year agreement to rent the building at a below-market rate. RELIEF also granted two one-year-old vehicles and four computers to MICRO from its flood relief program in the south of the country. MICRO did not account for these donated Fixed Assets when it received them.
Working with RELIEF’s accountant, MICRO calculated its In-Kind Subsidy Adjustment using the table below.
PersonnelEstimated Monthly
Market Cost (a)
Actual Monthly Cost (b)
No. of Months (c)
Subsidy (a – b) x c
i Executive Director 2,000 0 12 24,000
ii Accountant 800 0 12 9,600
iii Part-time MIS Manager 400 100 12 3,600
iv Trainer 400 200 6 1,200
Adjustment for Personnel Expenses 38,400
Other Administrative Expenses
i Rent 1,500 400 12 13,200
ii Software Support 50 0 12 600
Adjustment for Other Administrative Expenses
— 13,800
Fixed Assets Depreciation Rate Depreciation Rate
i Head Office Vehicle 12,000 0 20% 2,400
ii Branch Office Vehicle 18,000 0 20% 3,600
iii Four Computers, Branch Office 3,600 500 33.33% 1,033
Adjustment to Depreciation Expense 7,033
Total In-Kind Subsidy Adjustment 59,400
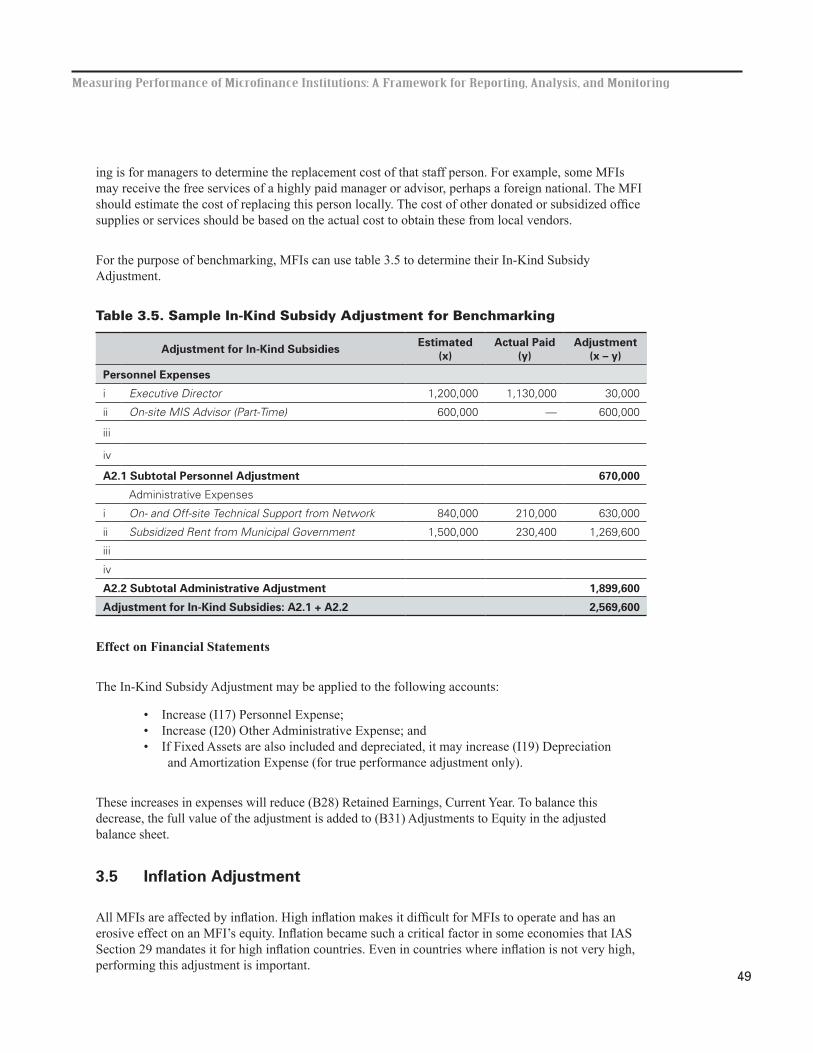
Measuring Performance of Microfinance Institutions: A Framework for Reporting, Analysis, and Monitoring
49
ing is for managers to determine the replacement cost of that staff person. For example, some MFIs may receive the free services of a highly paid manager or advisor, perhaps a foreign national. The MFI should estimate the cost of replacing this person locally. The cost of other donated or subsidized office supplies or services should be based on the actual cost to obtain these from local vendors.
For the purpose of benchmarking, MFIs can use table 3.5 to determine their In-Kind Subsidy Adjustment.
Table 3.5. Sample In-Kind Subsidy Adjustment for Benchmarking
Adjustment for In-Kind Subsidies Estimated(x)
Actual Paid (y)
Adjustment(x – y)
Personnel Expenses
i Executive Director 1,200,000 1,130,000 30,000
ii On-site MIS Advisor (Part-Time) 600,000 — 600,000
iii
iv
A2.1 Subtotal Personnel Adjustment 670,000
Administrative Expenses
i On- and Off-site Technical Support from Network 840,000 210,000 630,000
ii Subsidized Rent from Municipal Government 1,500,000 230,400 1,269,600
iii
iv
A2.2 Subtotal Administrative Adjustment 1,899,600
Adjustment for In-Kind Subsidies: A2.1 + A2.2 2,569,600
Effect on Financial Statements
The In-Kind Subsidy Adjustment may be applied to the following accounts:
• Increase (I17) Personnel Expense;• Increase (I20) Other Administrative Expense; and• If Fixed Assets are also included and depreciated, it may increase (I19) Depreciation and Amortization Expense (for true performance adjustment only).
These increases in expenses will reduce (B28) Retained Earnings, Current Year. To balance this decrease, the full value of the adjustment is added to (B31) Adjustments to Equity in the adjusted balance sheet.
3.5 Inflation Adjustment
All MFIs are affected by inflation. High inflation makes it difficult for MFIs to operate and has an erosive effect on an MFI’s equity. Inflation became such a critical factor in some economies that IAS Section 29 mandates it for high inflation countries. Even in countries where inflation is not very high, performing this adjustment is important.
Measuring Performance of Microfinance Institutions: A Framework for Reporting, Analysis, and Monitoring
50
A3 INFLATION ADJUSTMENT
The Inflation Adjustment is not the same as inflation accounting. In some countries, local regulations require that MFIs record a non-cash expense to reflect the effects of inflation. As noted in chapter 2, MFIs should add a subaccount to (I11) Other Financial Expenses called (I11-1) Inflation Expense to disclose this amount. Because the methods used for inflation-based accounting may vary from country to country, and the application of those methods is inconsistent, the Inflation Adjustment for benchmarking ensures that a minimum standard is applied to all MFIs.
Description
The purpose behind the inflation adjustment is to calculate the decrease in the real value (or purchasing power) of equity due to inflation. MFIs have two kinds of assets, monetary assets and fixed assets, whereas liabilities are generally all monetary. Inflation affects the value of the net monetary assets (monetary assets less monetary liabilities) but not the value of fixed assets. Therefore, an inflation adjustment requires two steps. The easiest way to isolate the loss in purchasing power of net monetary assets due to inflation is to perform two calculations. First, the adjustment must quantify the erosion of the purchasing power of equity. Second, it must take into account that fixed assets have not lost value.11 The most common means to adjust for the “cost” of equity is to use the inflation rate as a surrogate, because MFIs should generate a return at least sufficient to cover the erosion of their equity due to the increase in price levels.
Differences
Table 3.6 highlights several examples of differences in the methodologies that are commonly used to adjust for inflation. All methodologies analyzed in this chapter use the same formula for adjusting for inflation, which consists of calculating the erosion of equity and revaluation of fixed assets due to the effect of inflation.
Table 3.6. Differences in Inflation Adjustment Methodologies
Adjustment Criteria Examples
Accounts • Net fixed assets and total equity• Net fixed assets, total equity, and net income
Period • Period average• Beginning of period (end of previous period)• End of current period
Rate • Calculated from the Consumer Price Index (CPI)• Obtained from the Central Bank (or another reliable source)• Self-reported• Inflation rate from the IMF Statistics (line 64X)
11 If the inflation rate is negative, no adjustment is made. An MFI that holds an equal amount of fixed assets and equity is not affected by the inflation adjustment because the income from revaluation of fixed assets would be offset by the expense from the devaluation of equity (net effect of 0).
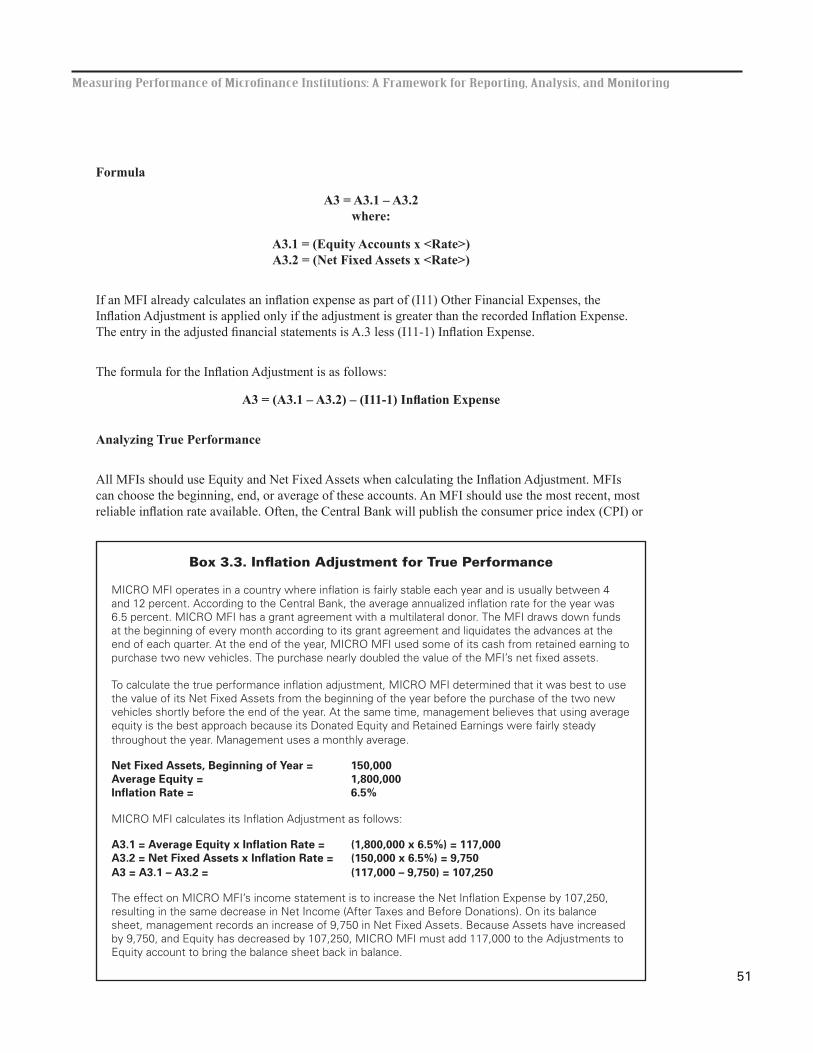
Measuring Performance of Microfinance Institutions: A Framework for Reporting, Analysis, and Monitoring
51
Formula
A3 = A3.1 – A3.2 where:
A3.1 = (Equity Accounts x <Rate>)A3.2 = (Net Fixed Assets x <Rate>)
If an MFI already calculates an inflation expense as part of (I11) Other Financial Expenses, the Inflation Adjustment is applied only if the adjustment is greater than the recorded Inflation Expense. The entry in the adjusted financial statements is A.3 less (I11-1) Inflation Expense.
The formula for the Inflation Adjustment is as follows:
A3 = (A3.1 – A3.2) – (I11-1) Inflation Expense
Analyzing True Performance
All MFIs should use Equity and Net Fixed Assets when calculating the Inflation Adjustment. MFIs can choose the beginning, end, or average of these accounts. An MFI should use the most recent, most reliable inflation rate available. Often, the Central Bank will publish the consumer price index (CPI) or
Box 3.3. Inflation Adjustment for True Performance
MICRO MFI operates in a country where inflation is fairly stable each year and is usually between 4 and 12 percent. According to the Central Bank, the average annualized inflation rate for the year was 6.5 percent. MICRO MFI has a grant agreement with a multilateral donor. The MFI draws down funds at the beginning of every month according to its grant agreement and liquidates the advances at the end of each quarter. At the end of the year, MICRO MFI used some of its cash from retained earning to purchase two new vehicles. The purchase nearly doubled the value of the MFI’s net fixed assets.
To calculate the true performance inflation adjustment, MICRO MFI determined that it was best to use the value of its Net Fixed Assets from the beginning of the year before the purchase of the two new vehicles shortly before the end of the year. At the same time, management believes that using average equity is the best approach because its Donated Equity and Retained Earnings were fairly steady throughout the year. Management uses a monthly average.
Net Fixed Assets, Beginning of Year = 150,000Average Equity = 1,800,000 Inflation Rate = 6.5%
MICRO MFI calculates its Inflation Adjustment as follows:
A3.1 = Average Equity x Inflation Rate = (1,800,000 x 6.5%) = 117,000A3.2 = Net Fixed Assets x Inflation Rate = (150,000 x 6.5%) = 9,750A3 = A3.1 – A3.2 = (117,000 – 9,750) = 107,250
The effect on MICRO MFI’s income statement is to increase the Net Inflation Expense by 107,250, resulting in the same decrease in Net Income (After Taxes and Before Donations). On its balance sheet, management records an increase of 9,750 in Net Fixed Assets. Because Assets have increased by 9,750, and Equity has decreased by 107,250, MICRO MFI must add 117,000 to the Adjustments to Equity account to bring the balance sheet back in balance.
Measuring Performance of Microfinance Institutions: A Framework for Reporting, Analysis, and Monitoring
52
the inflation rate on a regular basis on a Web site or in newspapers or other publications. Alternatively, the inflation rate is also published in the IMF statistics.12 The rate should cover the same period being analyzed. Box 3.3 provides an example of calculating an inflation adjustment to analyze true performance.
Standard for Benchmarking
A3 = A3.1 – A3.2where:
A3.1 = (Equity, Beginning of Period x Inflation Rate)A3.2 = (Net Fixed Assets, Beginning of Period x Inflation Rate)
A3.1 = (B320 x N9)A3.2 = (B90 x N9)
For benchmarking purposes, the following criteria are used.
Accounts: • (B9) Net Fixed Assets• (B32) Total Equity
All methodologies use these two accounts, which are the most common ones used for benchmarking.
Period: Beginning of Period
Because the adjustment considers the effects of inflation during the period, the formula uses the value for Net Fixed Assets and Equity at the beginning of the period (or the end of the previous period). This shows the effects of inflation on the beginning value of fixed assets and equity during the period. This assumes that any effects of inflation on fixed assets sold or acquired during the period during the period are already incorporated in the sale or purchase price. Although this calculation is not a perfect measurement, using the beginning of the period provides a fair approximation of the effects of inflation.
Rate: Inflation rate
The inflation rate is usually available from the Central Bank. The inflation rate published in the IMF Statistics, line 64X, is used by the MicroBanking Bulletin because of its wide availability.
To calculate the Inflation Adjustment, MFIs may use table 3.7.
12 Regularly updated IMF statistics are available on a per country basis on the MIX Market at http://www.mixmarket.org/en/environment/environment.search.asp.
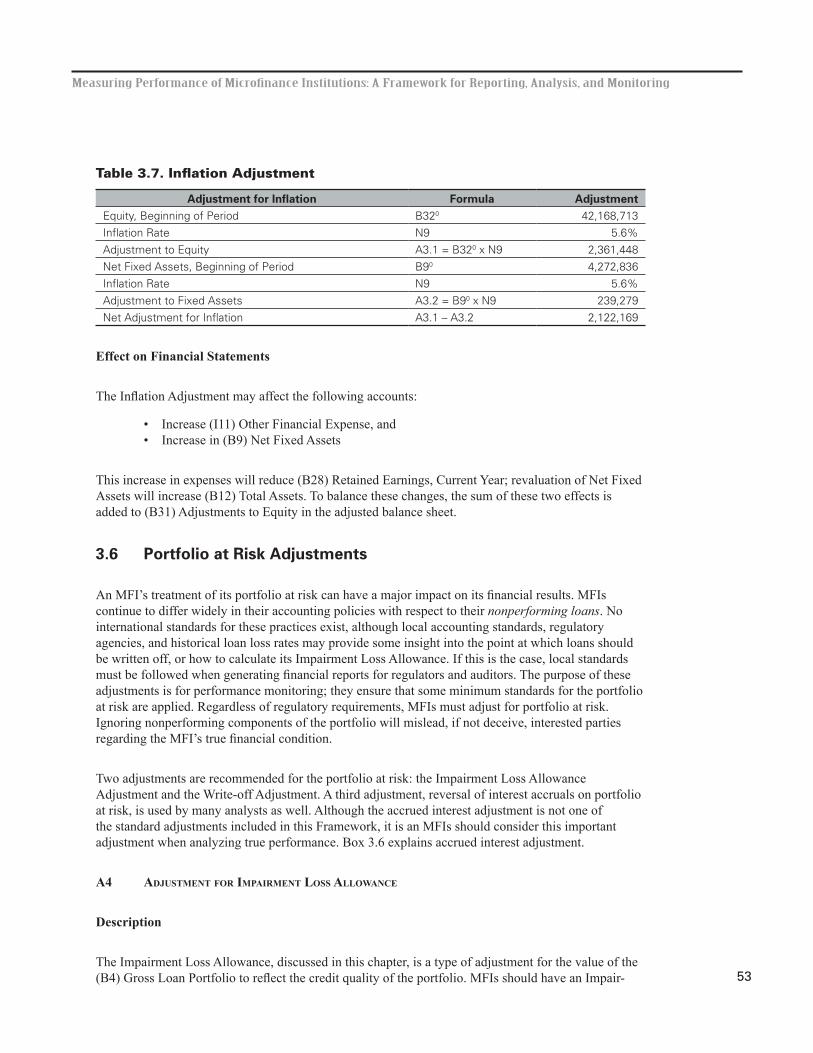
Measuring Performance of Microfinance Institutions: A Framework for Reporting, Analysis, and Monitoring
53
Table 3.7. Inflation Adjustment
Adjustment for Inflation Formula AdjustmentEquity, Beginning of Period B320 42,168,713
Inflation Rate N9 5.6%
Adjustment to Equity A3.1 = B320 x N9 2,361,448
Net Fixed Assets, Beginning of Period B90 4,272,836
Inflation Rate N9 5.6%
Adjustment to Fixed Assets A3.2 = B90 x N9 239,279
Net Adjustment for Inflation A3.1 – A3.2 2,122,169
Effect on Financial Statements
The Inflation Adjustment may affect the following accounts:
• Increase (I11) Other Financial Expense, and• Increase in (B9) Net Fixed Assets
This increase in expenses will reduce (B28) Retained Earnings, Current Year; revaluation of Net Fixed Assets will increase (B12) Total Assets. To balance these changes, the sum of these two effects is added to (B31) Adjustments to Equity in the adjusted balance sheet.
3.6 Portfolio at Risk Adjustments
An MFI’s treatment of its portfolio at risk can have a major impact on its financial results. MFIs continue to differ widely in their accounting policies with respect to their nonperforming loans. No international standards for these practices exist, although local accounting standards, regulatory agencies, and historical loan loss rates may provide some insight into the point at which loans should be written off, or how to calculate its Impairment Loss Allowance. If this is the case, local standards must be followed when generating financial reports for regulators and auditors. The purpose of these adjustments is for performance monitoring; they ensure that some minimum standards for the portfolio at risk are applied. Regardless of regulatory requirements, MFIs must adjust for portfolio at risk. Ignoring nonperforming components of the portfolio will mislead, if not deceive, interested parties regarding the MFI’s true financial condition.
Two adjustments are recommended for the portfolio at risk: the Impairment Loss Allowance Adjustment and the Write-off Adjustment. A third adjustment, reversal of interest accruals on portfolio at risk, is used by many analysts as well. Although the accrued interest adjustment is not one of the standard adjustments included in this Framework, it is an MFIs should consider this important adjustment when analyzing true performance. Box 3.6 explains accrued interest adjustment.
A4 ADJUSTMENT FOR IMPAIRMENT LOSS ALLOWANCE
Description
The Impairment Loss Allowance, discussed in this chapter, is a type of adjustment for the value of the (B4) Gross Loan Portfolio to reflect the credit quality of the portfolio. MFIs should have an Impair-
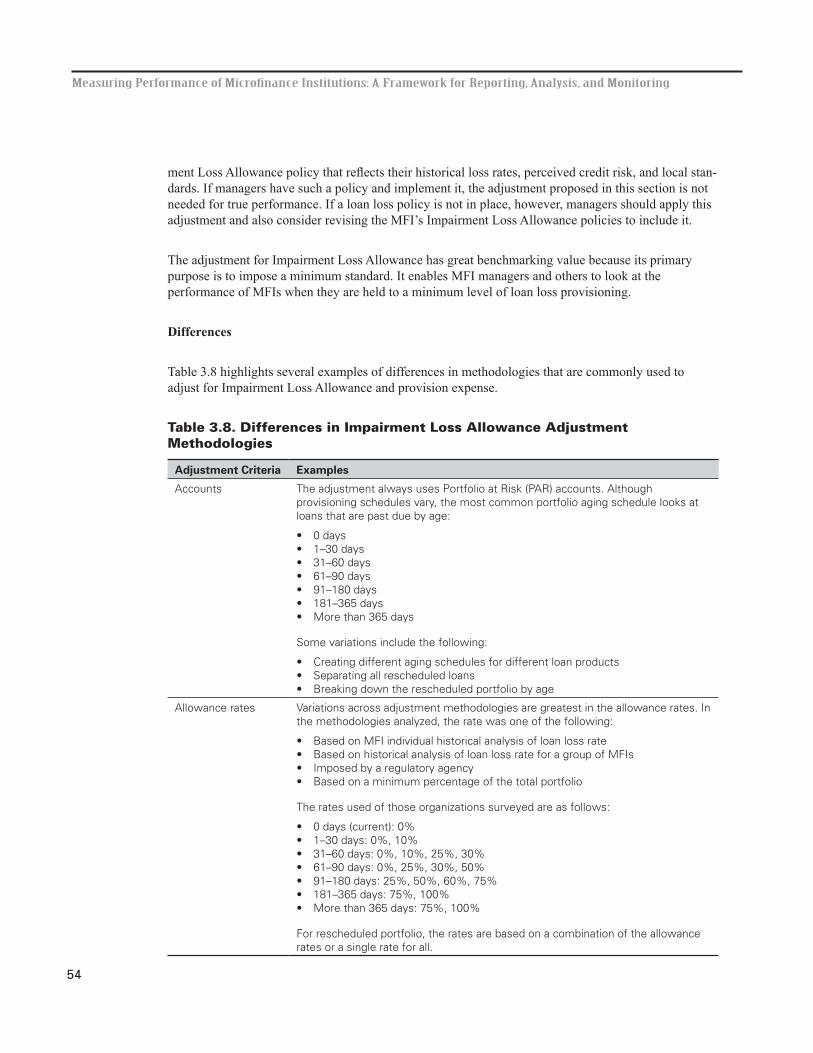
Measuring Performance of Microfinance Institutions: A Framework for Reporting, Analysis, and Monitoring
54
ment Loss Allowance policy that reflects their historical loss rates, perceived credit risk, and local stan-dards. If managers have such a policy and implement it, the adjustment proposed in this section is not needed for true performance. If a loan loss policy is not in place, however, managers should apply this adjustment and also consider revising the MFI’s Impairment Loss Allowance policies to include it.
The adjustment for Impairment Loss Allowance has great benchmarking value because its primary purpose is to impose a minimum standard. It enables MFI managers and others to look at the performance of MFIs when they are held to a minimum level of loan loss provisioning.
Differences
Table 3.8 highlights several examples of differences in methodologies that are commonly used to adjust for Impairment Loss Allowance and provision expense.
Table 3.8. Differences in Impairment Loss Allowance Adjustment Methodologies
Adjustment Criteria Examples
Accounts The adjustment always uses Portfolio at Risk (PAR) accounts. Although provisioning schedules vary, the most common portfolio aging schedule looks at loans that are past due by age:
• 0 days• 1–30 days• 31–60 days• 61–90 days • 91–180 days • 181–365 days• More than 365 days
Some variations include the following:
• Creating different aging schedules for different loan products • Separating all rescheduled loans• Breaking down the rescheduled portfolio by age
Allowance rates Variations across adjustment methodologies are greatest in the allowance rates. In the methodologies analyzed, the rate was one of the following:
• Based on MFI individual historical analysis of loan loss rate• Based on historical analysis of loan loss rate for a group of MFIs• Imposed by a regulatory agency• Based on a minimum percentage of the total portfolio
The rates used of those organizations surveyed are as follows:
• 0 days (current): 0%• 1–30 days: 0%, 10%• 31–60 days: 0%, 10%, 25%, 30% • 61–90 days: 0%, 25%, 30%, 50% • 91–180 days: 25%, 50%, 60%, 75% • 181–365 days: 75%, 100% • More than 365 days: 75%, 100%
For rescheduled portfolio, the rates are based on a combination of the allowance rates or a single rate for all.
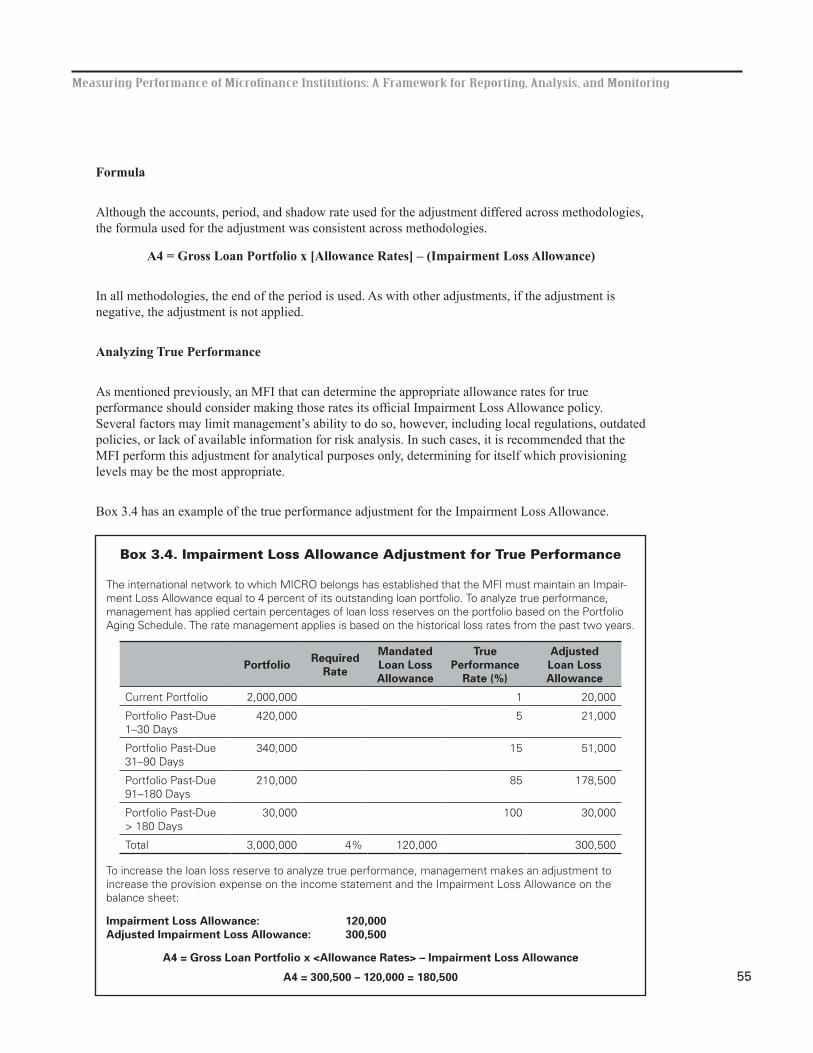
Measuring Performance of Microfinance Institutions: A Framework for Reporting, Analysis, and Monitoring
55
Formula
Although the accounts, period, and shadow rate used for the adjustment differed across methodologies, the formula used for the adjustment was consistent across methodologies.
A4 = Gross Loan Portfolio x [Allowance Rates] – (Impairment Loss Allowance)
In all methodologies, the end of the period is used. As with other adjustments, if the adjustment is negative, the adjustment is not applied.
Analyzing True Performance
As mentioned previously, an MFI that can determine the appropriate allowance rates for true performance should consider making those rates its official Impairment Loss Allowance policy. Several factors may limit management’s ability to do so, however, including local regulations, outdated policies, or lack of available information for risk analysis. In such cases, it is recommended that the MFI perform this adjustment for analytical purposes only, determining for itself which provisioning levels may be the most appropriate.
Box 3.4 has an example of the true performance adjustment for the Impairment Loss Allowance.
Box 3.4. Impairment Loss Allowance Adjustment for True Performance
The international network to which MICRO belongs has established that the MFI must maintain an Impair-ment Loss Allowance equal to 4 percent of its outstanding loan portfolio. To analyze true performance, management has applied certain percentages of loan loss reserves on the portfolio based on the Portfolio Aging Schedule. The rate management applies is based on the historical loss rates from the past two years.
Portfolio Required Rate
Mandated Loan Loss Allowance
True Performance
Rate (%)
Adjusted Loan Loss Allowance
Current Portfolio 2,000,000 1 20,000
Portfolio Past-Due 1–30 Days
420,000 5 21,000
Portfolio Past-Due 31–90 Days
340,000 15 51,000
Portfolio Past-Due 91–180 Days
210,000 85 178,500
Portfolio Past-Due > 180 Days
30,000 100 30,000
Total 3,000,000 4% 120,000 300,500
To increase the loan loss reserve to analyze true performance, management makes an adjustment to increase the provision expense on the income statement and the Impairment Loss Allowance on the balance sheet:
Impairment Loss Allowance: 120,000Adjusted Impairment Loss Allowance: 300,500
A4 = Gross Loan Portfolio x <Allowance Rates> – Impairment Loss Allowance
A4 = 300,500 – 120,000 = 180,500
Measuring Performance of Microfinance Institutions: A Framework for Reporting, Analysis, and Monitoring
56
Standard for Benchmarking
[Current Portfolio, PAR 1–180 Days, Renegotiated Portfolio) x Standard for Benchmarking Allowance Rates) – (Impairment Loss Allowance)
(P14 x Standard for Benchmarking Allowance Rates) + (P16 x Standard for Benchmarking Allowance Rates)] – B5
For benchmarking purposes, the following criteria are used.
Accounts: • (P14) Portfolio at Risk (> 1 Day)• (P16) Value of Renegotiated Loan Portfolio• (B5) Impairment Loss Allowance
Most MFIs have the capability to create a Portfolio Aging Schedule, as described in chapter 2. For ease of comparison, all non-rescheduled loans, regardless of term or type, are subject to the same allowance rates when they are adjusting for benchmark purposes (regardless of product). All rescheduled loans are considered separately (with the same provisioning regardless of aging) when making the adjustment.
Period: End of Period
The end of period accounts are used throughout the formula.
Rate: Standard for Benchmarking Allowance Rates
The rate proposed corresponds to the minimum proposed provisioning and the rates used by the MicroBanking Bulletin to create international benchmarks.
• Current Portfolio — 0%• PAR 1–30 days — 10%• PAR 31–90 days — 30%• PAR 91–180 days — 60%• PAR > 180 days — 100%• Renegotiated Portfolio — 100%
The rates above are for international benchmarking only and are not suggested allowance rates for an MFI’s internal use. Most MFIs should have more aggressive allowance rates. Table 3.9 includes an example of adjusting the Impairment Loss Allowance for benchmarking purposes.
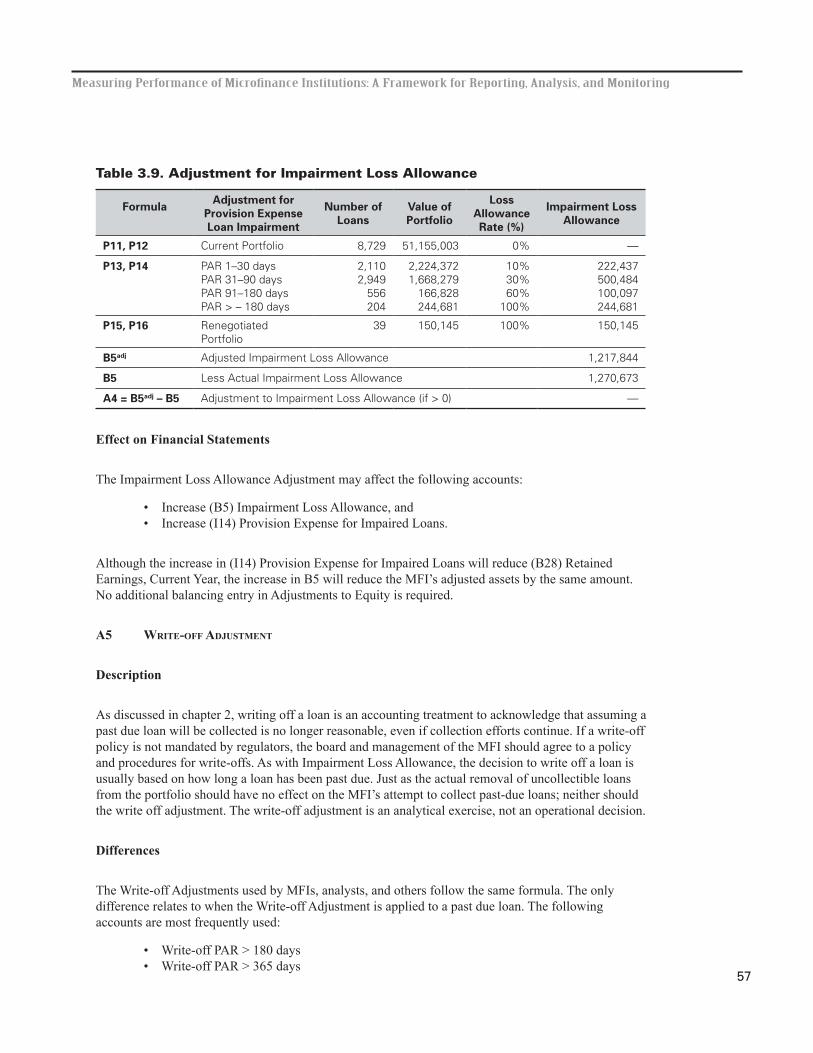
Measuring Performance of Microfinance Institutions: A Framework for Reporting, Analysis, and Monitoring
57
Table 3.9. Adjustment for Impairment Loss Allowance
Formula Adjustment for Provision Expense Loan Impairment
Number of Loans
Value of Portfolio
Loss Allowance Rate (%)
Impairment Loss Allowance
P11, P12 Current Portfolio 8,729 51,155,003 0% —
P13, P14 PAR 1–30 daysPAR 31–90 daysPAR 91–180 daysPAR > – 180 days
2,1102,949
556204
2,224,3721,668,279
166,828244,681
10%30%60%
100%
222,437500,484100,097244,681
P15, P16 Renegotiated Portfolio
39 150,145 100% 150,145
B5adj Adjusted Impairment Loss Allowance 1,217,844
B5 Less Actual Impairment Loss Allowance 1,270,673
A4 = B5adj – B5 Adjustment to Impairment Loss Allowance (if > 0) —
Effect on Financial Statements
The Impairment Loss Allowance Adjustment may affect the following accounts:
• Increase (B5) Impairment Loss Allowance, and• Increase (I14) Provision Expense for Impaired Loans.
Although the increase in (I14) Provision Expense for Impaired Loans will reduce (B28) Retained Earnings, Current Year, the increase in B5 will reduce the MFI’s adjusted assets by the same amount. No additional balancing entry in Adjustments to Equity is required.
A5 WRITE-OFF ADJUSTMENT
Description
As discussed in chapter 2, writing off a loan is an accounting treatment to acknowledge that assuming a past due loan will be collected is no longer reasonable, even if collection efforts continue. If a write-off policy is not mandated by regulators, the board and management of the MFI should agree to a policy and procedures for write-offs. As with Impairment Loss Allowance, the decision to write off a loan is usually based on how long a loan has been past due. Just as the actual removal of uncollectible loans from the portfolio should have no effect on the MFI’s attempt to collect past-due loans; neither should the write off adjustment. The write-off adjustment is an analytical exercise, not an operational decision.
Differences
The Write-off Adjustments used by MFIs, analysts, and others follow the same formula. The only difference relates to when the Write-off Adjustment is applied to a past due loan. The following accounts are most frequently used:
• Write-off PAR > 180 days• Write-off PAR > 365 days
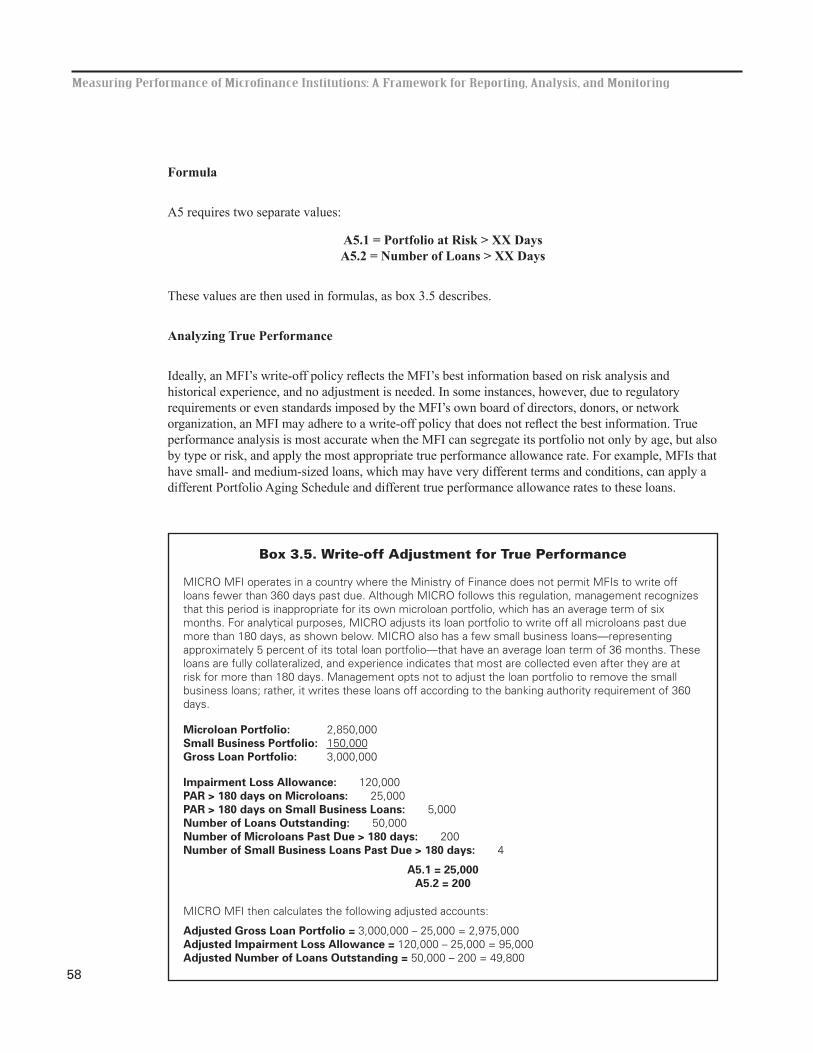
Measuring Performance of Microfinance Institutions: A Framework for Reporting, Analysis, and Monitoring
58
Formula
A5 requires two separate values:
A5.1 = Portfolio at Risk > XX DaysA5.2 = Number of Loans > XX Days
These values are then used in formulas, as box 3.5 describes.
Analyzing True Performance
Ideally, an MFI’s write-off policy reflects the MFI’s best information based on risk analysis and historical experience, and no adjustment is needed. In some instances, however, due to regulatory requirements or even standards imposed by the MFI’s own board of directors, donors, or network organization, an MFI may adhere to a write-off policy that does not reflect the best information. True performance analysis is most accurate when the MFI can segregate its portfolio not only by age, but also by type or risk, and apply the most appropriate true performance allowance rate. For example, MFIs that have small- and medium-sized loans, which may have very different terms and conditions, can apply a different Portfolio Aging Schedule and different true performance allowance rates to these loans.
Box 3.5. Write-off Adjustment for True Performance
MICRO MFI operates in a country where the Ministry of Finance does not permit MFIs to write off loans fewer than 360 days past due. Although MICRO follows this regulation, management recognizes that this period is inappropriate for its own microloan portfolio, which has an average term of six months. For analytical purposes, MICRO adjusts its loan portfolio to write off all microloans past due more than 180 days, as shown below. MICRO also has a few small business loans—representing approximately 5 percent of its total loan portfolio—that have an average loan term of 36 months. These loans are fully collateralized, and experience indicates that most are collected even after they are at risk for more than 180 days. Management opts not to adjust the loan portfolio to remove the small business loans; rather, it writes these loans off according to the banking authority requirement of 360 days.
Microloan Portfolio: 2,850,000Small Business Portfolio: 150,000Gross Loan Portfolio: 3,000,000
Impairment Loss Allowance: 120,000PAR > 180 days on Microloans: 25,000PAR > 180 days on Small Business Loans: 5,000Number of Loans Outstanding: 50,000Number of Microloans Past Due > 180 days: 200Number of Small Business Loans Past Due > 180 days: 4
A5.1 = 25,000A5.2 = 200
MICRO MFI then calculates the following adjusted accounts:
Adjusted Gross Loan Portfolio = 3,000,000 – 25,000 = 2,975,000Adjusted Impairment Loss Allowance = 120,000 – 25,000 = 95,000Adjusted Number of Loans Outstanding = 50,000 – 200 = 49,800
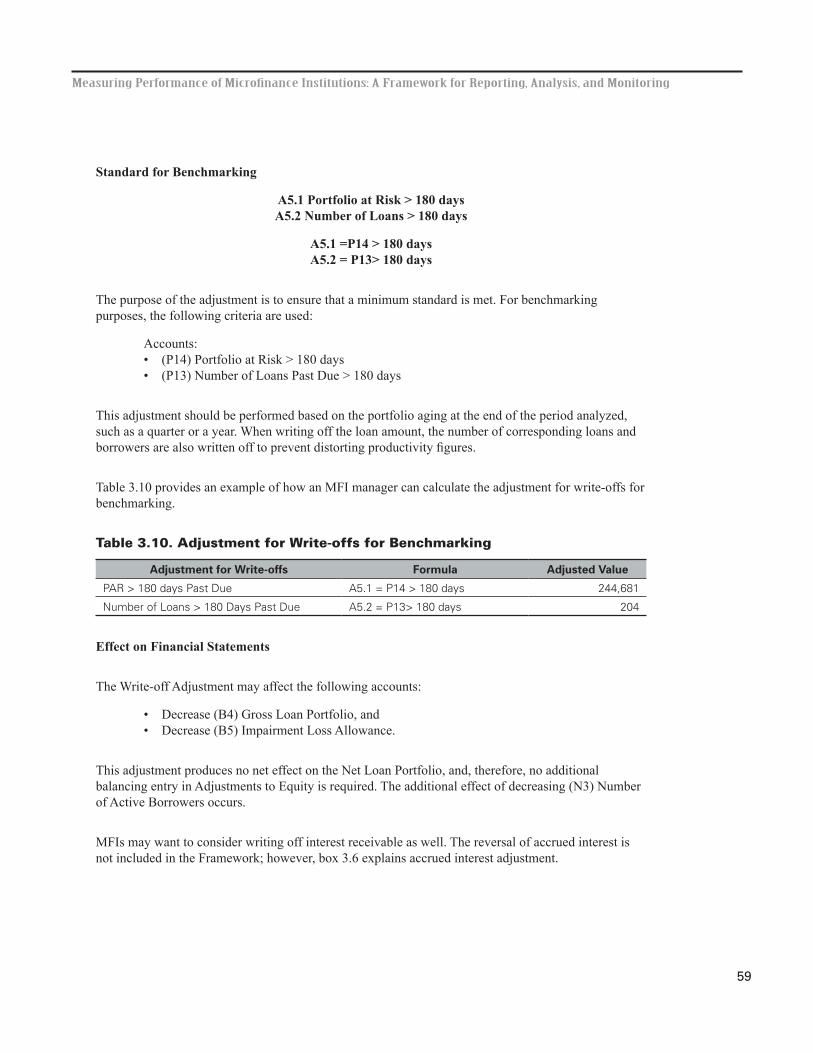
Measuring Performance of Microfinance Institutions: A Framework for Reporting, Analysis, and Monitoring
59
Standard for Benchmarking
A5.1 Portfolio at Risk > 180 days A5.2 Number of Loans > 180 days
A5.1 =P14 > 180 daysA5.2 = P13> 180 days
The purpose of the adjustment is to ensure that a minimum standard is met. For benchmarking purposes, the following criteria are used:
Accounts: • (P14) Portfolio at Risk > 180 days• (P13) Number of Loans Past Due > 180 days
This adjustment should be performed based on the portfolio aging at the end of the period analyzed, such as a quarter or a year. When writing off the loan amount, the number of corresponding loans and borrowers are also written off to prevent distorting productivity figures.
Table 3.10 provides an example of how an MFI manager can calculate the adjustment for write-offs for benchmarking.
Table 3.10. Adjustment for Write-offs for Benchmarking
Adjustment for Write-offs Formula Adjusted Value
PAR > 180 days Past Due A5.1 = P14 > 180 days 244,681
Number of Loans > 180 Days Past Due A5.2 = P13> 180 days 204
Effect on Financial Statements
The Write-off Adjustment may affect the following accounts:
• Decrease (B4) Gross Loan Portfolio, and• Decrease (B5) Impairment Loss Allowance.
This adjustment produces no net effect on the Net Loan Portfolio, and, therefore, no additional balancing entry in Adjustments to Equity is required. The additional effect of decreasing (N3) Number of Active Borrowers occurs.
MFIs may want to consider writing off interest receivable as well. The reversal of accrued interest is not included in the Framework; however, box 3.6 explains accrued interest adjustment.

Measuring Performance of Microfinance Institutions: A Framework for Reporting, Analysis, and Monitoring
60
3.7 Creating Adjusted Financial Statements
When the MFI has calculated all its adjustments, it must create an adjusted income statement and balance sheet to analyze the full impact of the adjustments. As noted in table 3.11, which summarizes the effects of adjustments, the common adjustments presented in this chapter usually result in an increase in expense and/or a reduction of assets. To offset these adjustments, the adjusted balance sheet has one additional account called Adjustments to Equity. These adjustments appear in Table 3.12, Adjusted Income Statement, and Table 3.13, Adjusted Balance Sheet. When the adjustments have been calculated and adjusted financial statements created, the financial ratios presented in chapter 4 can be calculated based on adjusted results.
Table 3.14 provides an example of what information should be disclosed when presenting adjusted financial statements. This summary is important for an analyst to see which adjustments were made, which methodology was used, and what accounts were used to calculate them.
Box 3.6. Adjustment for Accrued Interest Receivable
Many MFIs around the world account for interest on a cash basis, including only the interest that has actually been received on its income statement. Other MFIs follow accrual-based accounting, and many different practices are in place regarding the accrual of interest on past due loans. Because traditional financial institutions often accrue interest on loans past due up to 90 days or more, some MFIs follow the same practice. Studies have shown, however, that although interest on traditional commercial loans past due up to 90 days is still likely to be received, MFIs are less likely to receive interest on loans past due more than 30 days. For this reason, some rating agencies and others adjust for those interest accruals.
Although not detailed in this Framework, more MFIs are able to estimate the amount of accrued interest related to the past due portfolio and may choose to make this adjustment. Many MFIs actually calculate interest accruals on a loan-by-loan basis and can easily identify the amount of interest accrued that corresponds to loans past due more than 30 days. Others may need to estimate the value, and various methodologies are used for estimating the accrued interest adjustment.13
13 See Darcy Salinger and Sonia Salzman, 1998, “The ACCIÓN CAMEL” (Boston, MA: ACCIÓN International). http://www.microlinks.org/ev_en.php?ID=3104_201&ID2=DO_TOPIC.
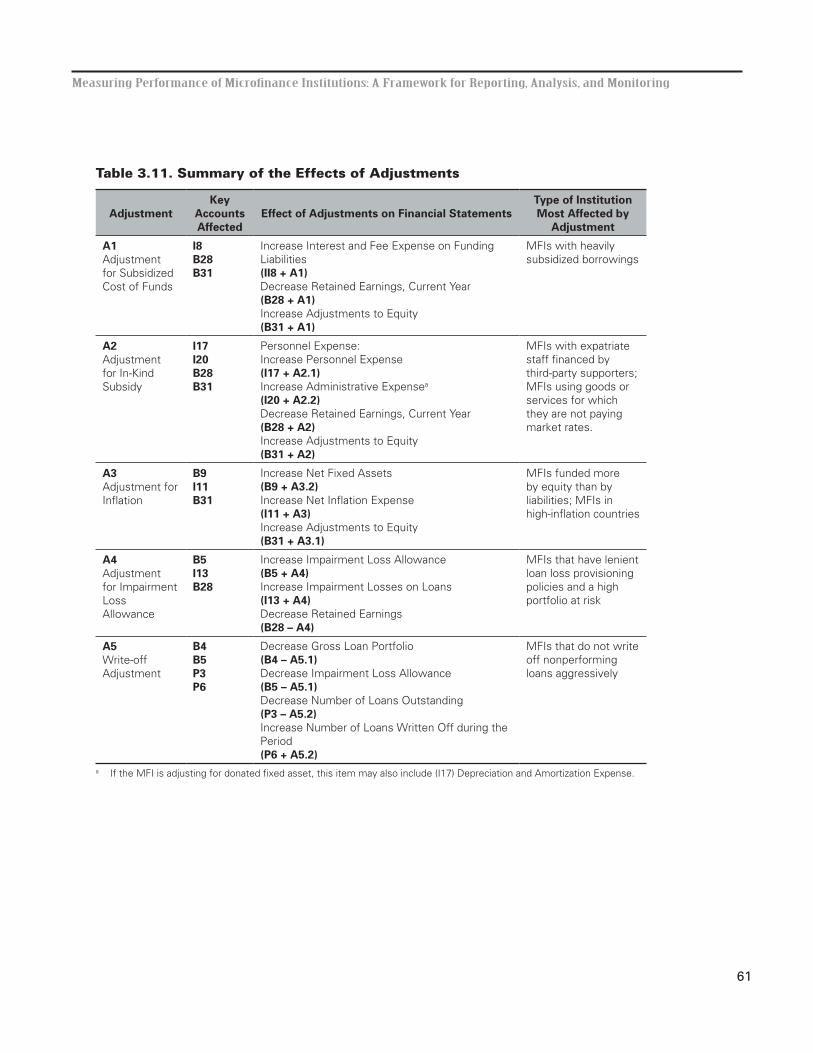
Measuring Performance of Microfinance Institutions: A Framework for Reporting, Analysis, and Monitoring
61
Table 3.11. Summary of the Effects of Adjustments
AdjustmentKey
AccountsAffected
Effect of Adjustments on Financial StatementsType of Institution Most Affected by
Adjustment
A1Adjustment for Subsidized Cost of Funds
I8B28B31
Increase Interest and Fee Expense on Funding Liabilities (II8 + A1)Decrease Retained Earnings, Current Year (B28 + A1)Increase Adjustments to Equity(B31 + A1)
MFIs with heavily subsidized borrowings
A2Adjustment for In-Kind Subsidy
I17I20B28B31
Personnel Expense: Increase Personnel Expense(I17 + A2.1)Increase Administrative Expensea
(I20 + A2.2) Decrease Retained Earnings, Current Year(B28 + A2)Increase Adjustments to Equity(B31 + A2)
MFIs with expatriate staff financed by third-party supporters; MFIs using goods or services for which they are not paying market rates.
A3Adjustment for Inflation
B9I11B31
Increase Net Fixed Assets(B9 + A3.2) Increase Net Inflation Expense(I11 + A3)Increase Adjustments to Equity(B31 + A3.1)
MFIs funded more by equity than by liabilities; MFIs in high-inflation countries
A4Adjustment for Impairment Loss Allowance
B5I13B28
Increase Impairment Loss Allowance(B5 + A4) Increase Impairment Losses on Loans(I13 + A4) Decrease Retained Earnings(B28 – A4)
MFIs that have lenient loan loss provisioning policies and a high portfolio at risk
A5Write-off Adjustment
B4B5P3P6
Decrease Gross Loan Portfolio(B4 – A5.1)Decrease Impairment Loss Allowance(B5 – A5.1)Decrease Number of Loans Outstanding(P3 – A5.2)Increase Number of Loans Written Off during the Period(P6 + A5.2)
MFIs that do not write off nonperforming loans aggressively
a If the MFI is adjusting for donated fixed asset, this item may also include (I17) Depreciation and Amortization Expense.
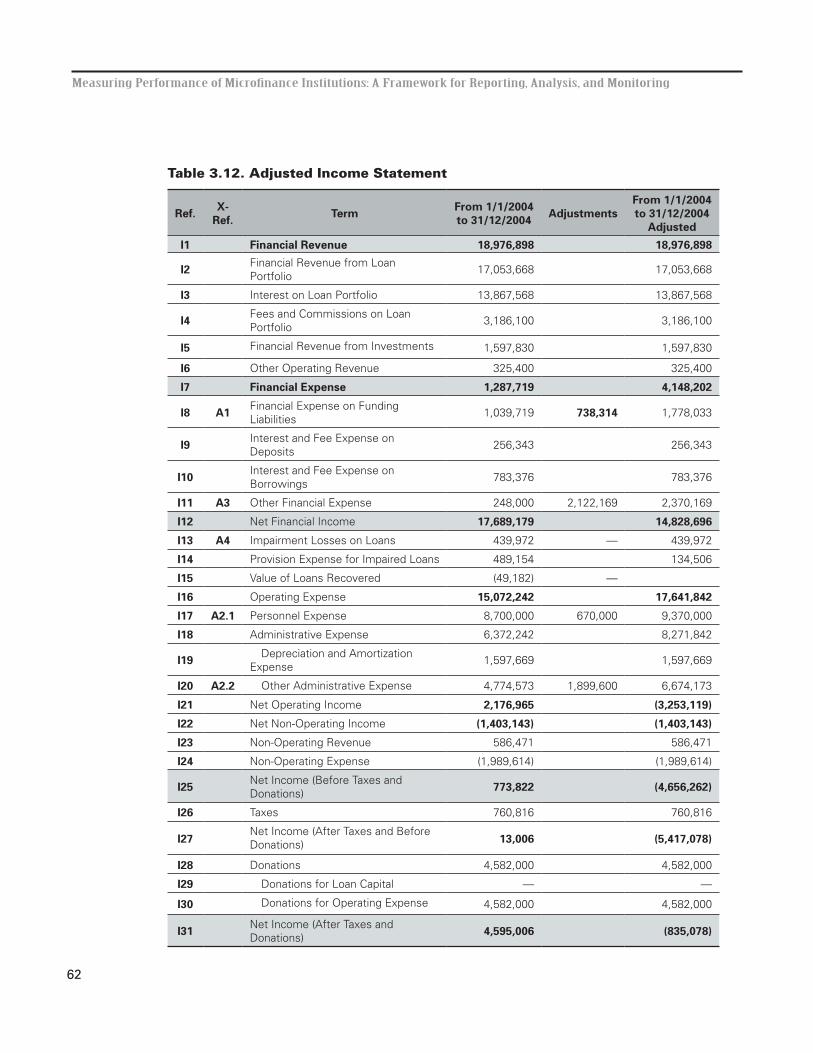
Measuring Performance of Microfinance Institutions: A Framework for Reporting, Analysis, and Monitoring
62
Table 3.12. Adjusted Income Statement
Ref. X-Ref. Term From 1/1/2004
to 31/12/2004 AdjustmentsFrom 1/1/2004 to 31/12/2004
Adjusted
I1 Financial Revenue 18,976,898 18,976,898
I2 Financial Revenue from Loan Portfolio
17,053,668 17,053,668
I3 Interest on Loan Portfolio 13,867,568 13,867,568
I4 Fees and Commissions on Loan Portfolio
3,186,100 3,186,100
I5 Financial Revenue from Investments 1,597,830 1,597,830
I6 Other Operating Revenue 325,400 325,400
I7 Financial Expense 1,287,719 4,148,202
I8 A1 Financial Expense on Funding Liabilities
1,039,719 738,314 1,778,033
I9 Interest and Fee Expense on Deposits
256,343 256,343
I10 Interest and Fee Expense on Borrowings
783,376 783,376
I11 A3 Other Financial Expense 248,000 2,122,169 2,370,169
I12 Net Financial Income 17,689,179 14,828,696
I13 A4 Impairment Losses on Loans 439,972 — 439,972
I14 Provision Expense for Impaired Loans 489,154 134,506
I15 Value of Loans Recovered (49,182) —
I16 Operating Expense 15,072,242 17,641,842
I17 A2.1 Personnel Expense 8,700,000 670,000 9,370,000
I18 Administrative Expense 6,372,242 8,271,842
I19 Depreciation and Amortization Expense
1,597,669 1,597,669
I20 A2.2 Other Administrative Expense 4,774,573 1,899,600 6,674,173
I21 Net Operating Income 2,176,965 (3,253,119)
I22 Net Non-Operating Income (1,403,143) (1,403,143)
I23 Non-Operating Revenue 586,471 586,471
I24 Non-Operating Expense (1,989,614) (1,989,614)
I25 Net Income (Before Taxes and Donations)
773,822 (4,656,262)
I26 Taxes 760,816 760,816
I27Net Income (After Taxes and Before Donations) 13,006 (5,417,078)
I28 Donations 4,582,000 4,582,000
I29 Donations for Loan Capital — —
I30 Donations for Operating Expense 4,582,000 4,582,000
I31 Net Income (After Taxes and Donations)
4,595,006 (835,078)
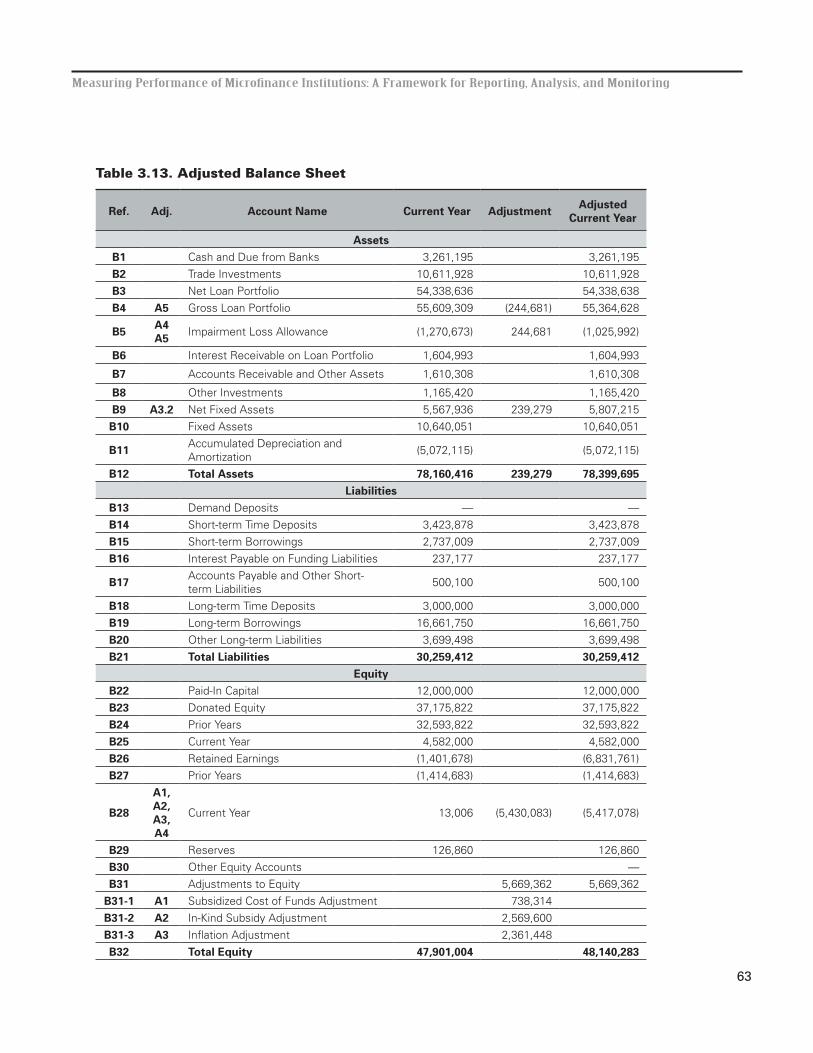
Measuring Performance of Microfinance Institutions: A Framework for Reporting, Analysis, and Monitoring
63
Table 3.13. Adjusted Balance Sheet
Ref. Adj. Account Name Current Year Adjustment Adjusted Current Year
AssetsB1 Cash and Due from Banks 3,261,195 3,261,195
B2 Trade Investments 10,611,928 10,611,928
B3 Net Loan Portfolio 54,338,636 54,338,638
B4 A5 Gross Loan Portfolio 55,609,309 (244,681) 55,364,628
B5 A4A5 Impairment Loss Allowance (1,270,673) 244,681 (1,025,992)
B6 Interest Receivable on Loan Portfolio 1,604,993 1,604,993
B7 Accounts Receivable and Other Assets 1,610,308 1,610,308
B8 Other Investments 1,165,420 1,165,420
B9 A3.2 Net Fixed Assets 5,567,936 239,279 5,807,215
B10 Fixed Assets 10,640,051 10,640,051
B11 Accumulated Depreciation and Amortization
(5,072,115) (5,072,115)
B12 Total Assets 78,160,416 239,279 78,399,695Liabilities
B13 Demand Deposits — —
B14 Short-term Time Deposits 3,423,878 3,423,878
B15 Short-term Borrowings 2,737,009 2,737,009
B16 Interest Payable on Funding Liabilities 237,177 237,177
B17 Accounts Payable and Other Short-term Liabilities
500,100 500,100
B18 Long-term Time Deposits 3,000,000 3,000,000
B19 Long-term Borrowings 16,661,750 16,661,750
B20 Other Long-term Liabilities 3,699,498 3,699,498
B21 Total Liabilities 30,259,412 30,259,412Equity
B22 Paid-In Capital 12,000,000 12,000,000
B23 Donated Equity 37,175,822 37,175,822
B24 Prior Years 32,593,822 32,593,822
B25 Current Year 4,582,000 4,582,000
B26 Retained Earnings (1,401,678) (6,831,761)
B27 Prior Years (1,414,683) (1,414,683)
B28
A1,A2,A3,A4
Current Year 13,006 (5,430,083) (5,417,078)
B29 Reserves 126,860 126,860
B30 Other Equity Accounts —
B31 Adjustments to Equity 5,669,362 5,669,362
B31-1 A1 Subsidized Cost of Funds Adjustment 738,314
B31-2 A2 In-Kind Subsidy Adjustment 2,569,600
B31-3 A3 Inflation Adjustment 2,361,448
B32 Total Equity 47,901,004 48,140,283
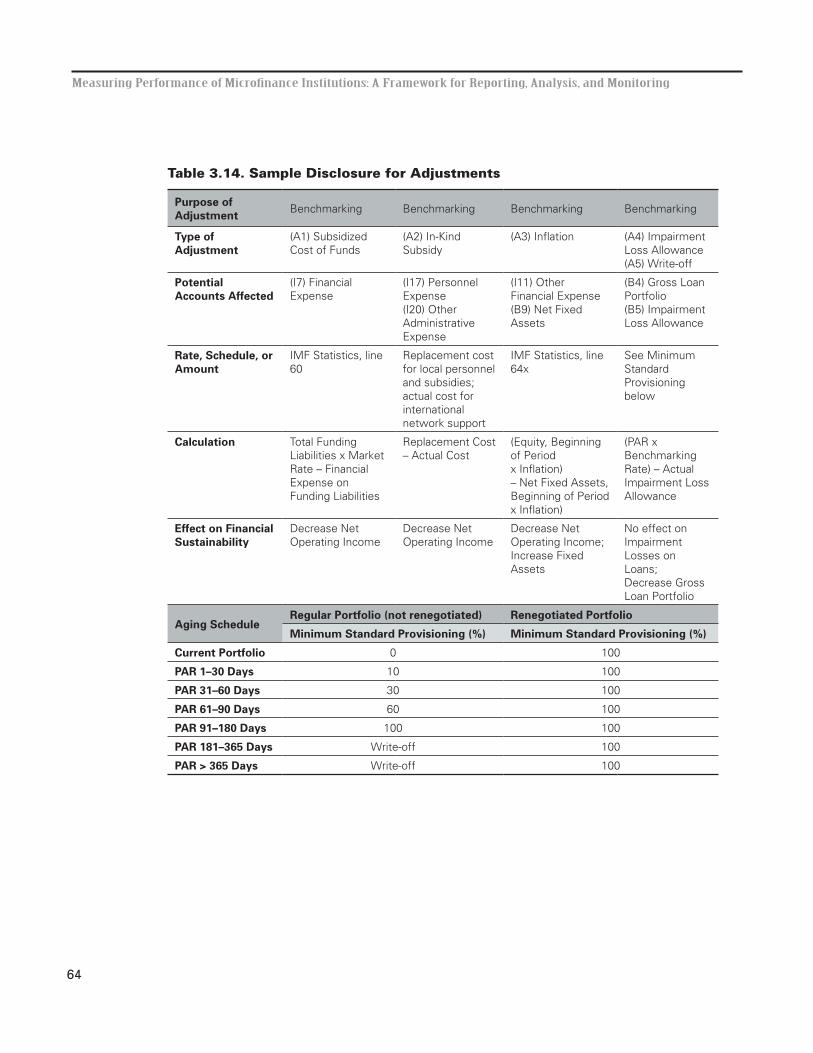
Measuring Performance of Microfinance Institutions: A Framework for Reporting, Analysis, and Monitoring
64
Table 3.14. Sample Disclosure for Adjustments
Purpose of Adjustment Benchmarking Benchmarking Benchmarking Benchmarking
Type of Adjustment
(A1) Subsidized Cost of Funds
(A2) In-Kind Subsidy
(A3) Inflation (A4) Impairment Loss Allowance(A5) Write-off
Potential Accounts Affected
(I7) Financial Expense
(I17) Personnel Expense (I20) Other Administrative Expense
(I11) Other Financial Expense(B9) Net Fixed Assets
(B4) Gross Loan Portfolio(B5) Impairment Loss Allowance
Rate, Schedule, or Amount
IMF Statistics, line 60
Replacement cost for local personnel and subsidies; actual cost for international network support
IMF Statistics, line 64x
See Minimum Standard Provisioning below
Calculation Total Funding Liabilities x Market Rate – Financial Expense on Funding Liabilities
Replacement Cost – Actual Cost
(Equity, Beginning of Period x Inflation) – Net Fixed Assets, Beginning of Period x Inflation)
(PAR x Benchmarking Rate) – Actual Impairment Loss Allowance
Effect on Financial Sustainability
Decrease Net Operating Income
Decrease Net Operating Income
Decrease Net Operating Income;Increase Fixed Assets
No effect on Impairment Losses on Loans;Decrease Gross Loan Portfolio
Aging ScheduleRegular Portfolio (not renegotiated) Renegotiated Portfolio
Minimum Standard Provisioning (%) Minimum Standard Provisioning (%)
Current Portfolio 0 100
PAR 1–30 Days 10 100
PAR 31–60 Days 30 100
PAR 61–90 Days 60 100
PAR 91–180 Days 100 100
PAR 181–365 Days Write-off 100
PAR > 365 Days Write-off 100
Measuring Performance of Microfinance Institutions: A Framework for Reporting, Analysis, and Monitoring
65
4Financial Ratios and Indicators
There are a multitude of financial ratios and indicators, each of which may provide useful information to a microfinance institution (MFI) manager. Ratios and indicators help managers evaluate the performance of their organization in several different aspects of its activity. The 18 indicators selected in this Framework reflect the areas of measurement that are priorities for most MFIs. The “SEEP 18” are divided into the following four groups:
• Profitability and sustainability,• Asset/liability management,• Portfolio quality, and• Efficiency and productivity.
This chapter begins by listing the term for each ratio, its formula, and an explanation of its purpose. Each ratio is then discussed in the context of its group, including a brief introduction to each group and a definition of each ratio. For each ratio, the Framework includes a description of the following:
• The formula, • Why the ratio is important, and• How to use adjusted data in the calculations and the effects of using adjustments.14
Each ratio can be derived directly from the financial statements and reports presented in chapter 2. Most ratios can be calculated using the adjusted financial statements presented in chapter 3. If the MFI can to complete the adjustments, it should calculate these ratios on both an adjusted and an unadjusted basis. Taken as a whole, the ratios in this Framework provide a multidimensional perspective on the financial health of the lending and savings operations of the institution. The ratios must be analyzed together; selective ratio use can create an incomplete picture.
Table 4.1 summarizes the SEEP 18 and includes their calculations, which use the financial statements in chapters 2 and 3.
Ratios are customarily expressed as an annualized number or percentage. They can be calculated for any period, however, from monthly to annually, and managers are encouraged to calculate ratios monthly or quarterly. Before calculating ratios, consider calculation issues related to averaging and annualizing, discussed in chapter 1.
14 In some cases, ratios cannot be calculated on an adjusted basis or the value of doing so is minimal. No effects of adjustments are listed for these ratios.
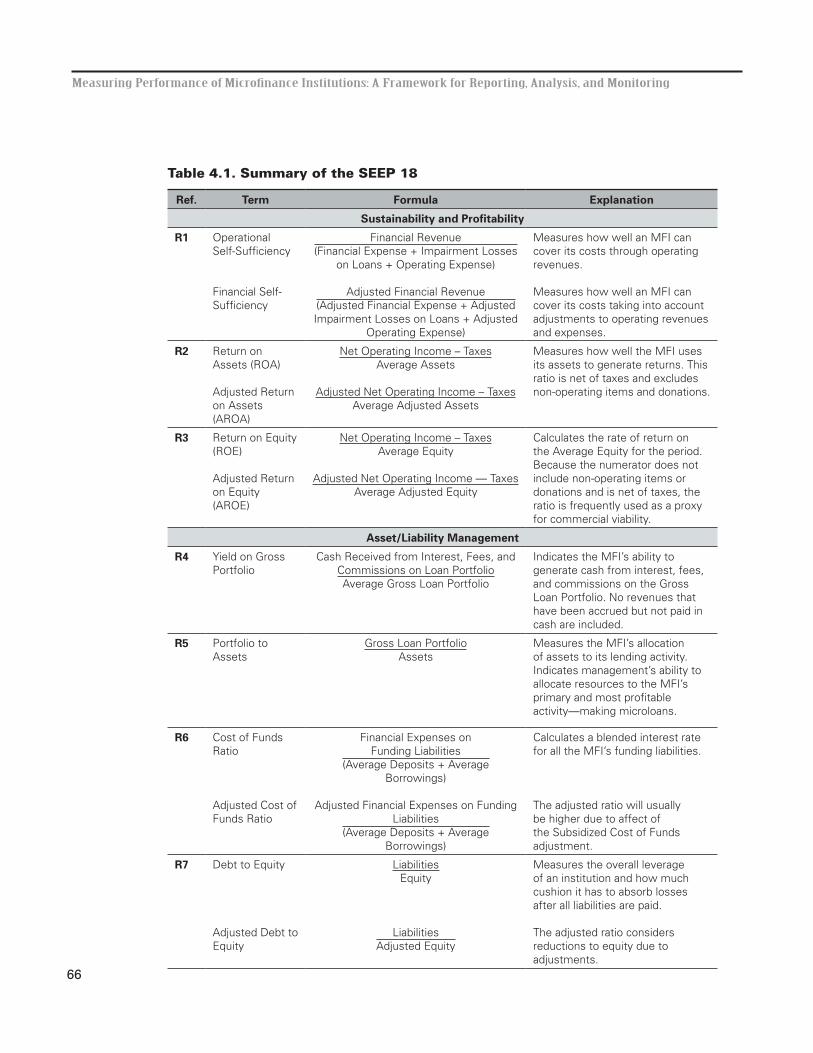
Measuring Performance of Microfinance Institutions: A Framework for Reporting, Analysis, and Monitoring
66
Table 4.1. Summary of the SEEP 18
Ref. Term Formula Explanation
Sustainability and Profitability
R1 Operational Self-Sufficiency
Financial Self-Sufficiency
Financial Revenue(Financial Expense + Impairment Losses
on Loans + Operating Expense)
Adjusted Financial Revenue (Adjusted Financial Expense + Adjusted Impairment Losses on Loans + Adjusted
Operating Expense)
Measures how well an MFI can cover its costs through operating revenues.
Measures how well an MFI can cover its costs taking into account adjustments to operating revenues and expenses.
R2 Return on Assets (ROA)
Adjusted Return on Assets(AROA)
Net Operating Income – TaxesAverage Assets
Adjusted Net Operating Income – TaxesAverage Adjusted Assets
Measures how well the MFI uses its assets to generate returns. This ratio is net of taxes and excludes non-operating items and donations.
R3 Return on Equity (ROE)
Adjusted Return on Equity(AROE)
Net Operating Income – TaxesAverage Equity
Adjusted Net Operating Income — TaxesAverage Adjusted Equity
Calculates the rate of return on the Average Equity for the period. Because the numerator does not include non-operating items or donations and is net of taxes, the ratio is frequently used as a proxy for commercial viability.
Asset/Liability Management
R4 Yield on Gross Portfolio
Cash Received from Interest, Fees, and Commissions on Loan PortfolioAverage Gross Loan Portfolio
Indicates the MFI’s ability to generate cash from interest, fees, and commissions on the Gross Loan Portfolio. No revenues that have been accrued but not paid in cash are included.
R5 Portfolio to Assets
Gross Loan PortfolioAssets
Measures the MFI’s allocation of assets to its lending activity. Indicates management’s ability to allocate resources to the MFI’s primary and most profitable activity—making microloans.
R6 Cost of Funds Ratio
Adjusted Cost of Funds Ratio
Financial Expenses on Funding Liabilities
(Average Deposits + Average Borrowings)
Adjusted Financial Expenses on Funding Liabilities
(Average Deposits + Average Borrowings)
Calculates a blended interest rate for all the MFI’s funding liabilities.
The adjusted ratio will usually be higher due to affect of the Subsidized Cost of Funds adjustment.
R7 Debt to Equity
Adjusted Debt to Equity
LiabilitiesEquity
LiabilitiesAdjusted Equity
Measures the overall leverage of an institution and how much cushion it has to absorb losses after all liabilities are paid.
The adjusted ratio considers reductions to equity due to adjustments.
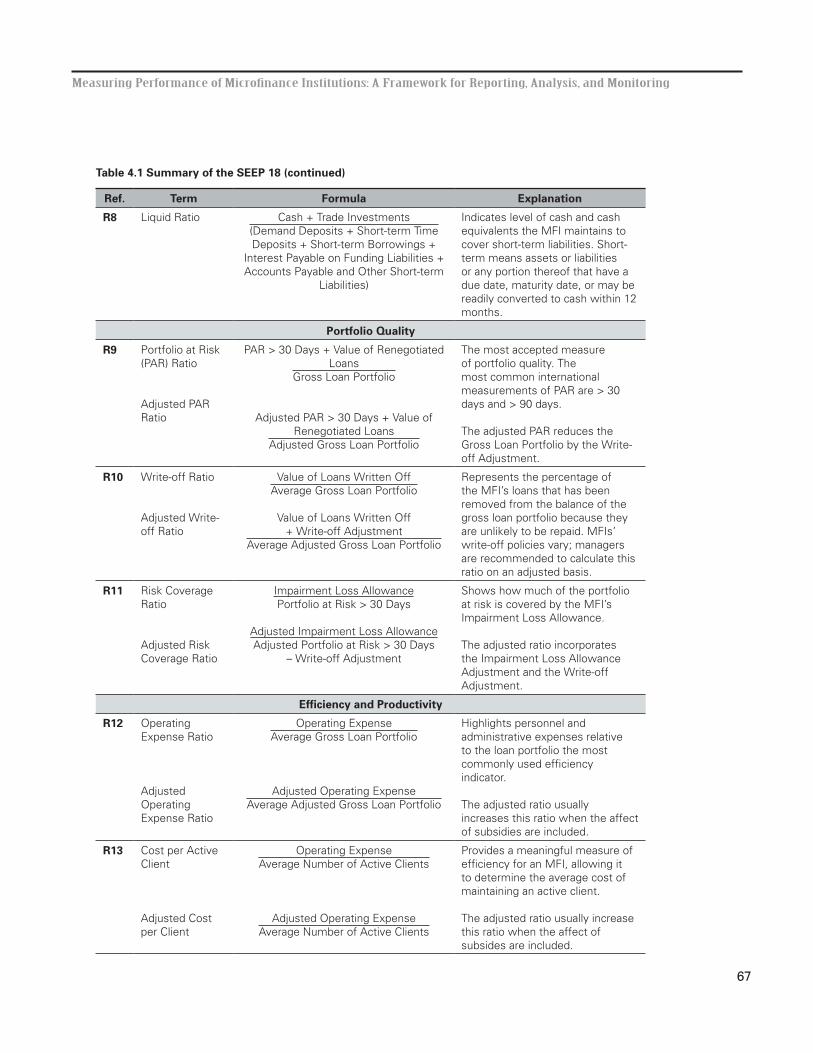
Measuring Performance of Microfinance Institutions: A Framework for Reporting, Analysis, and Monitoring
67
Ref. Term Formula Explanation
R8 Liquid Ratio Cash + Trade Investments(Demand Deposits + Short-term Time Deposits + Short-term Borrowings +
Interest Payable on Funding Liabilities + Accounts Payable and Other Short-term
Liabilities)
Indicates level of cash and cash equivalents the MFI maintains to cover short-term liabilities. Short-term means assets or liabilities or any portion thereof that have a due date, maturity date, or may be readily converted to cash within 12 months.
Portfolio Quality
R9 Portfolio at Risk (PAR) Ratio
Adjusted PAR Ratio
PAR > 30 Days + Value of Renegotiated Loans
Gross Loan Portfolio
Adjusted PAR > 30 Days + Value of Renegotiated Loans
Adjusted Gross Loan Portfolio
The most accepted measure of portfolio quality. The most common international measurements of PAR are > 30 days and > 90 days.
The adjusted PAR reduces the Gross Loan Portfolio by the Write-off Adjustment.
R10 Write-off Ratio
Adjusted Write-off Ratio
Value of Loans Written OffAverage Gross Loan Portfolio
Value of Loans Written Off + Write-off Adjustment
Average Adjusted Gross Loan Portfolio
Represents the percentage of the MFI’s loans that has been removed from the balance of the gross loan portfolio because they are unlikely to be repaid. MFIs’ write-off policies vary; managers are recommended to calculate this ratio on an adjusted basis.
R11 Risk Coverage Ratio
Adjusted Risk Coverage Ratio
Impairment Loss Allowance Portfolio at Risk > 30 Days
Adjusted Impairment Loss Allowance Adjusted Portfolio at Risk > 30 Days
– Write-off Adjustment
Shows how much of the portfolio at risk is covered by the MFI’s Impairment Loss Allowance.
The adjusted ratio incorporates the Impairment Loss Allowance Adjustment and the Write-off Adjustment.
Efficiency and Productivity
R12 Operating Expense Ratio
Adjusted Operating Expense Ratio
Operating ExpenseAverage Gross Loan Portfolio
Adjusted Operating ExpenseAverage Adjusted Gross Loan Portfolio
Highlights personnel and administrative expenses relative to the loan portfolio the most commonly used efficiency indicator.
The adjusted ratio usually increases this ratio when the affect of subsidies are included.
R13 Cost per Active Client
Adjusted Cost per Client
Operating ExpenseAverage Number of Active Clients
Adjusted Operating ExpenseAverage Number of Active Clients
Provides a meaningful measure of efficiency for an MFI, allowing it to determine the average cost of maintaining an active client.
The adjusted ratio usually increase this ratio when the affect of subsides are included.
Table 4.1 Summary of the SEEP 18 (continued)
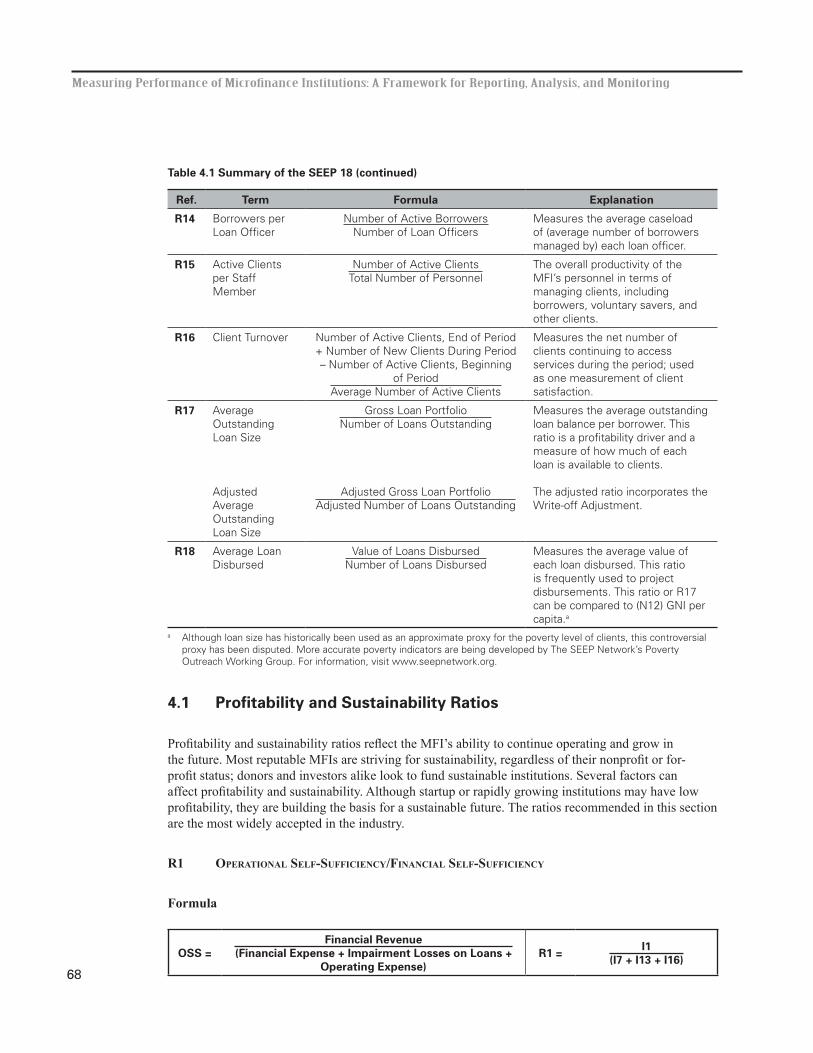
Measuring Performance of Microfinance Institutions: A Framework for Reporting, Analysis, and Monitoring
68
Ref. Term Formula Explanation
R14 Borrowers per Loan Officer
Number of Active BorrowersNumber of Loan Officers
Measures the average caseload of (average number of borrowers managed by) each loan officer.
R15 Active Clients per Staff Member
Number of Active ClientsTotal Number of Personnel
The overall productivity of the MFI’s personnel in terms of managing clients, including borrowers, voluntary savers, and other clients.
R16 Client Turnover Number of Active Clients, End of Period + Number of New Clients During Period – Number of Active Clients, Beginning
of PeriodAverage Number of Active Clients
Measures the net number of clients continuing to access services during the period; used as one measurement of client satisfaction.
R17 Average Outstanding Loan Size
Adjusted Average Outstanding Loan Size
Gross Loan PortfolioNumber of Loans Outstanding
Adjusted Gross Loan PortfolioAdjusted Number of Loans Outstanding
Measures the average outstanding loan balance per borrower. This ratio is a profitability driver and a measure of how much of each loan is available to clients.
The adjusted ratio incorporates the Write-off Adjustment.
R18 Average Loan Disbursed
Value of Loans DisbursedNumber of Loans Disbursed
Measures the average value of each loan disbursed. This ratio is frequently used to project disbursements. This ratio or R17 can be compared to (N12) GNI per capita.a
a Although loan size has historically been used as an approximate proxy for the poverty level of clients, this controversial proxy has been disputed. More accurate poverty indicators are being developed by The SEEP Network’s Poverty Outreach Working Group. For information, visit www.seepnetwork.org.
4.1 Profitability and Sustainability Ratios
Profitability and sustainability ratios reflect the MFI’s ability to continue operating and grow in the future. Most reputable MFIs are striving for sustainability, regardless of their nonprofit or for-profit status; donors and investors alike look to fund sustainable institutions. Several factors can affect profitability and sustainability. Although startup or rapidly growing institutions may have low profitability, they are building the basis for a sustainable future. The ratios recommended in this section are the most widely accepted in the industry.
R1 OPERATIONAL SELF-SUFFICIENCY/FINANCIAL SELF-SUFFICIENCY
Formula
OSS = Financial Revenue
(Financial Expense + Impairment Losses on Loans + Operating Expense)
R1 = I1(I7 + I13 + I16)
Table 4.1 Summary of the SEEP 18 (continued)
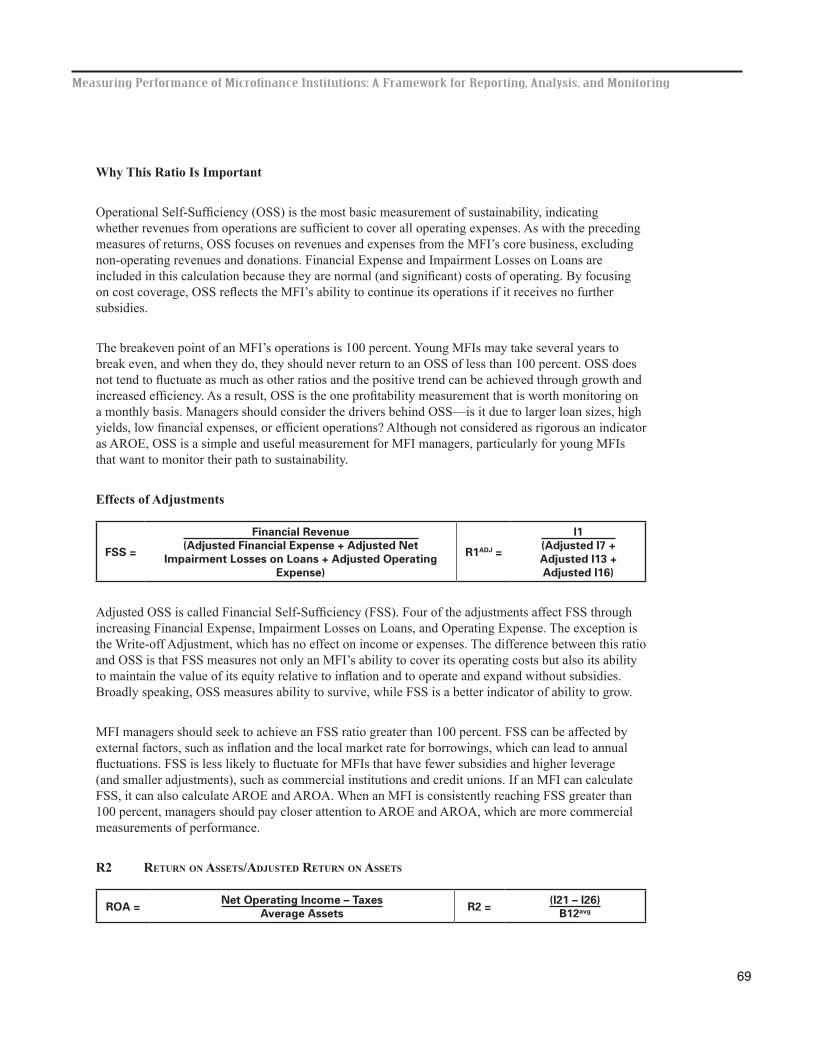
Measuring Performance of Microfinance Institutions: A Framework for Reporting, Analysis, and Monitoring
69
Why This Ratio Is Important
Operational Self-Sufficiency (OSS) is the most basic measurement of sustainability, indicating whether revenues from operations are sufficient to cover all operating expenses. As with the preceding measures of returns, OSS focuses on revenues and expenses from the MFI’s core business, excluding non-operating revenues and donations. Financial Expense and Impairment Losses on Loans are included in this calculation because they are normal (and significant) costs of operating. By focusing on cost coverage, OSS reflects the MFI’s ability to continue its operations if it receives no further subsidies.
The breakeven point of an MFI’s operations is 100 percent. Young MFIs may take several years to break even, and when they do, they should never return to an OSS of less than 100 percent. OSS does not tend to fluctuate as much as other ratios and the positive trend can be achieved through growth and increased efficiency. As a result, OSS is the one profitability measurement that is worth monitoring on a monthly basis. Managers should consider the drivers behind OSS—is it due to larger loan sizes, high yields, low financial expenses, or efficient operations? Although not considered as rigorous an indicator as AROE, OSS is a simple and useful measurement for MFI managers, particularly for young MFIs that want to monitor their path to sustainability.
Effects of Adjustments
FSS =
Financial Revenue(Adjusted Financial Expense + Adjusted Net
Impairment Losses on Loans + Adjusted Operating Expense)
R1ADJ =
I1(Adjusted I7 + Adjusted I13 + Adjusted I16)
Adjusted OSS is called Financial Self-Sufficiency (FSS). Four of the adjustments affect FSS through increasing Financial Expense, Impairment Losses on Loans, and Operating Expense. The exception is the Write-off Adjustment, which has no effect on income or expenses. The difference between this ratio and OSS is that FSS measures not only an MFI’s ability to cover its operating costs but also its ability to maintain the value of its equity relative to inflation and to operate and expand without subsidies. Broadly speaking, OSS measures ability to survive, while FSS is a better indicator of ability to grow.
MFI managers should seek to achieve an FSS ratio greater than 100 percent. FSS can be affected by external factors, such as inflation and the local market rate for borrowings, which can lead to annual fluctuations. FSS is less likely to fluctuate for MFIs that have fewer subsidies and higher leverage (and smaller adjustments), such as commercial institutions and credit unions. If an MFI can calculate FSS, it can also calculate AROE and AROA. When an MFI is consistently reaching FSS greater than 100 percent, managers should pay closer attention to AROE and AROA, which are more commercial measurements of performance.
R2 RETURN ON ASSETS/ADJUSTED RETURN ON ASSETS
ROA = Net Operating Income – TaxesAverage Assets R2 = (I21 – I26)
B12avg
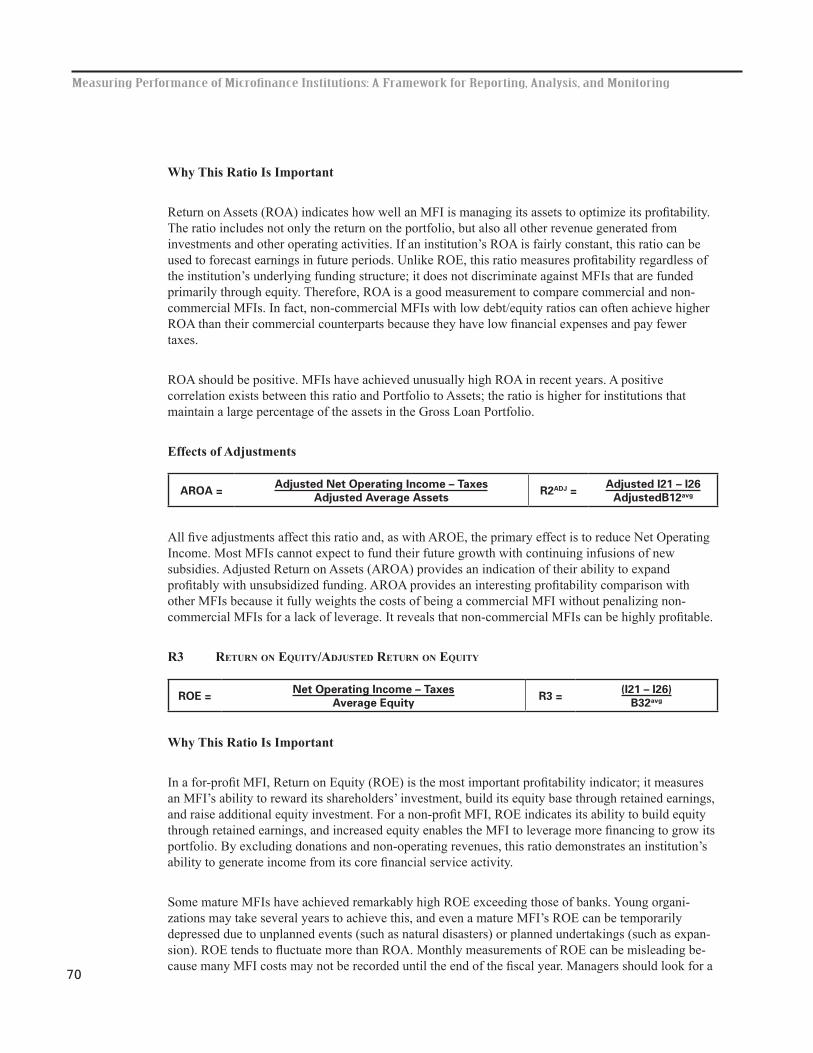
Measuring Performance of Microfinance Institutions: A Framework for Reporting, Analysis, and Monitoring
70
Why This Ratio Is Important
Return on Assets (ROA) indicates how well an MFI is managing its assets to optimize its profitability. The ratio includes not only the return on the portfolio, but also all other revenue generated from investments and other operating activities. If an institution’s ROA is fairly constant, this ratio can be used to forecast earnings in future periods. Unlike ROE, this ratio measures profitability regardless of the institution’s underlying funding structure; it does not discriminate against MFIs that are funded primarily through equity. Therefore, ROA is a good measurement to compare commercial and non-commercial MFIs. In fact, non-commercial MFIs with low debt/equity ratios can often achieve higher ROA than their commercial counterparts because they have low financial expenses and pay fewer taxes.
ROA should be positive. MFIs have achieved unusually high ROA in recent years. A positive correlation exists between this ratio and Portfolio to Assets; the ratio is higher for institutions that maintain a large percentage of the assets in the Gross Loan Portfolio.
Effects of Adjustments
AROA = Adjusted Net Operating Income – TaxesAdjusted Average Assets R2ADJ = Adjusted I21 – I26
AdjustedB12avg
All five adjustments affect this ratio and, as with AROE, the primary effect is to reduce Net Operating Income. Most MFIs cannot expect to fund their future growth with continuing infusions of new subsidies. Adjusted Return on Assets (AROA) provides an indication of their ability to expand profitably with unsubsidized funding. AROA provides an interesting profitability comparison with other MFIs because it fully weights the costs of being a commercial MFI without penalizing non-commercial MFIs for a lack of leverage. It reveals that non-commercial MFIs can be highly profitable.
R3 RETURN ON EQUITY/ADJUSTED RETURN ON EQUITY
ROE = Net Operating Income – TaxesAverage Equity R3 = (I21 – I26)
B32avg
Why This Ratio Is Important
In a for-profit MFI, Return on Equity (ROE) is the most important profitability indicator; it measures an MFI’s ability to reward its shareholders’ investment, build its equity base through retained earnings, and raise additional equity investment. For a non-profit MFI, ROE indicates its ability to build equity through retained earnings, and increased equity enables the MFI to leverage more financing to grow its portfolio. By excluding donations and non-operating revenues, this ratio demonstrates an institution’s ability to generate income from its core financial service activity.
Some mature MFIs have achieved remarkably high ROE exceeding those of banks. Young organi-zations may take several years to achieve this, and even a mature MFI’s ROE can be temporarily depressed due to unplanned events (such as natural disasters) or planned undertakings (such as expan-sion). ROE tends to fluctuate more than ROA. Monthly measurements of ROE can be misleading be-cause many MFI costs may not be recorded until the end of the fiscal year. Managers should look for a
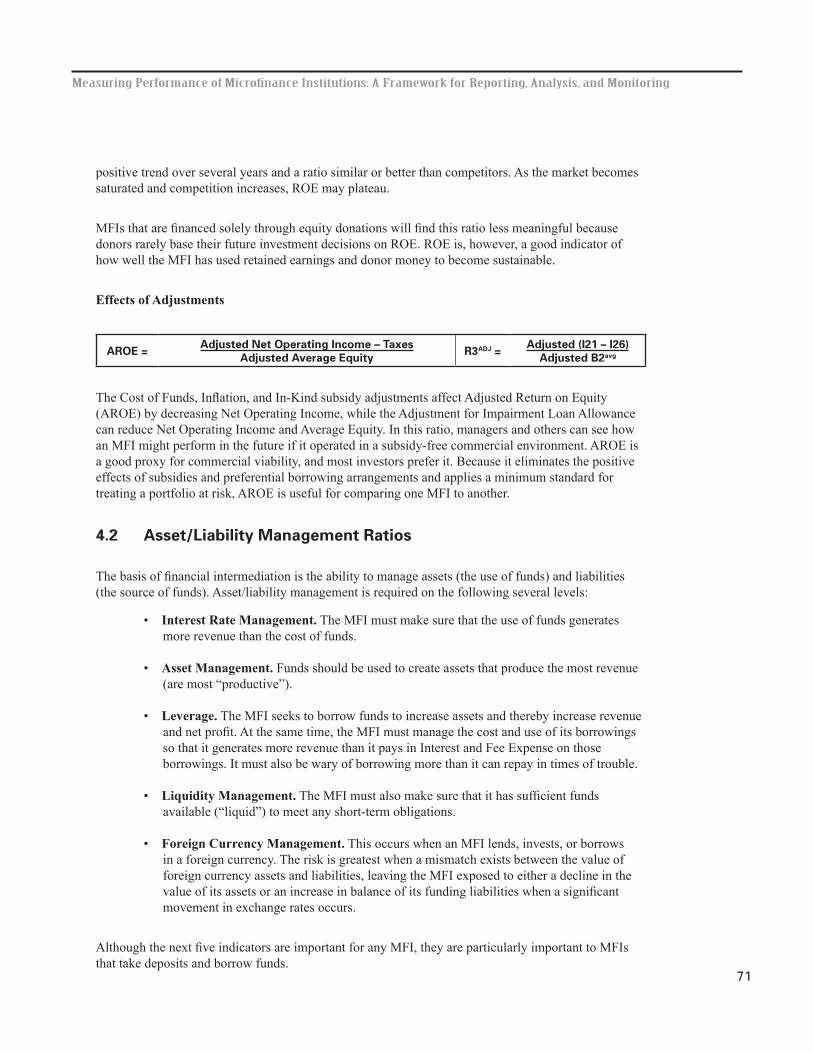
Measuring Performance of Microfinance Institutions: A Framework for Reporting, Analysis, and Monitoring
71
positive trend over several years and a ratio similar or better than competitors. As the market becomes saturated and competition increases, ROE may plateau.
MFIs that are financed solely through equity donations will find this ratio less meaningful because donors rarely base their future investment decisions on ROE. ROE is, however, a good indicator of how well the MFI has used retained earnings and donor money to become sustainable.
Effects of Adjustments
AROE = Adjusted Net Operating Income – TaxesAdjusted Average Equity R3ADJ = Adjusted (I21 – I26)
Adjusted B2avg
The Cost of Funds, Inflation, and In-Kind subsidy adjustments affect Adjusted Return on Equity (AROE) by decreasing Net Operating Income, while the Adjustment for Impairment Loan Allowance can reduce Net Operating Income and Average Equity. In this ratio, managers and others can see how an MFI might perform in the future if it operated in a subsidy-free commercial environment. AROE is a good proxy for commercial viability, and most investors prefer it. Because it eliminates the positive effects of subsidies and preferential borrowing arrangements and applies a minimum standard for treating a portfolio at risk, AROE is useful for comparing one MFI to another.
4.2 Asset/Liability Management Ratios
The basis of financial intermediation is the ability to manage assets (the use of funds) and liabilities (the source of funds). Asset/liability management is required on the following several levels:
• Interest Rate Management. The MFI must make sure that the use of funds generates more revenue than the cost of funds.
• Asset Management. Funds should be used to create assets that produce the most revenue (are most “productive”).
• Leverage. The MFI seeks to borrow funds to increase assets and thereby increase revenue and net profit. At the same time, the MFI must manage the cost and use of its borrowings so that it generates more revenue than it pays in Interest and Fee Expense on those borrowings. It must also be wary of borrowing more than it can repay in times of trouble.
• Liquidity Management. The MFI must also make sure that it has sufficient funds available (“liquid”) to meet any short-term obligations.
• Foreign Currency Management. This occurs when an MFI lends, invests, or borrows in a foreign currency. The risk is greatest when a mismatch exists between the value of foreign currency assets and liabilities, leaving the MFI exposed to either a decline in the value of its assets or an increase in balance of its funding liabilities when a significant movement in exchange rates occurs.
Although the next five indicators are important for any MFI, they are particularly important to MFIs that take deposits and borrow funds.
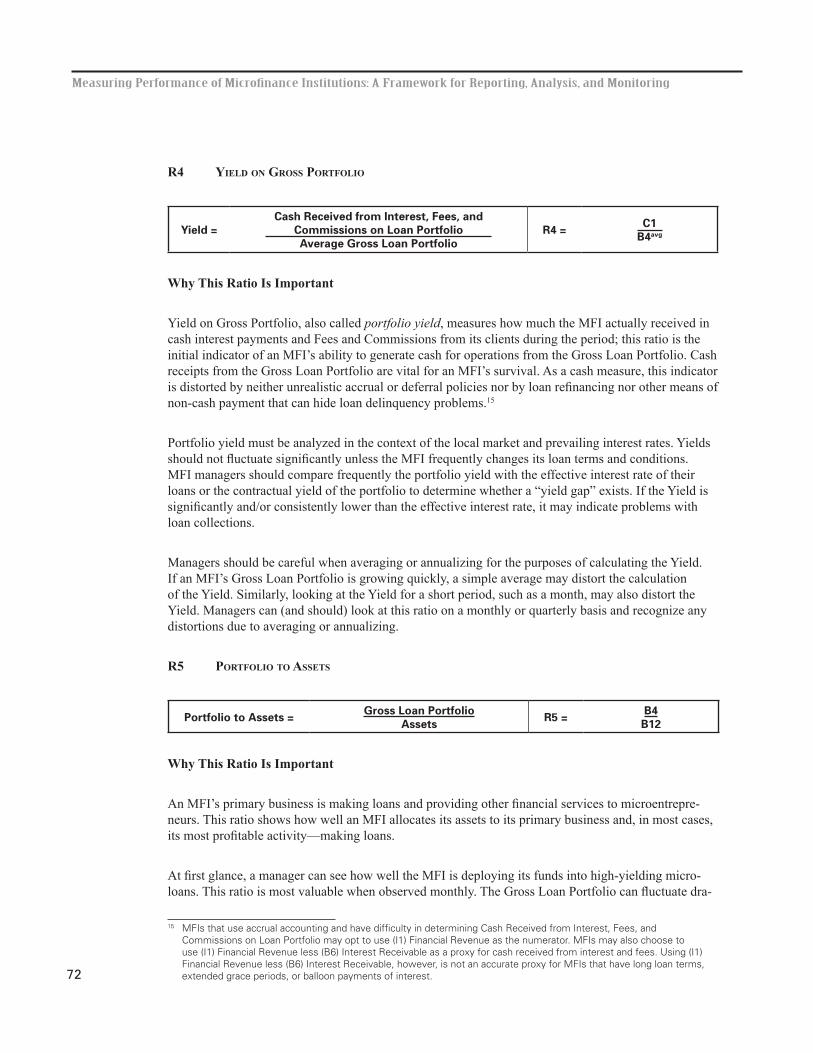
Measuring Performance of Microfinance Institutions: A Framework for Reporting, Analysis, and Monitoring
72
R4 YIELD ON GROSS PORTFOLIO
Yield = Cash Received from Interest, Fees, and
Commissions on Loan PortfolioAverage Gross Loan Portfolio
R4 = C1B4avg
Why This Ratio Is Important
Yield on Gross Portfolio, also called portfolio yield, measures how much the MFI actually received in cash interest payments and Fees and Commissions from its clients during the period; this ratio is the initial indicator of an MFI’s ability to generate cash for operations from the Gross Loan Portfolio. Cash receipts from the Gross Loan Portfolio are vital for an MFI’s survival. As a cash measure, this indicator is distorted by neither unrealistic accrual or deferral policies nor by loan refinancing nor other means of non-cash payment that can hide loan delinquency problems.15
Portfolio yield must be analyzed in the context of the local market and prevailing interest rates. Yields should not fluctuate significantly unless the MFI frequently changes its loan terms and conditions. MFI managers should compare frequently the portfolio yield with the effective interest rate of their loans or the contractual yield of the portfolio to determine whether a “yield gap” exists. If the Yield is significantly and/or consistently lower than the effective interest rate, it may indicate problems with loan collections.
Managers should be careful when averaging or annualizing for the purposes of calculating the Yield. If an MFI’s Gross Loan Portfolio is growing quickly, a simple average may distort the calculation of the Yield. Similarly, looking at the Yield for a short period, such as a month, may also distort the Yield. Managers can (and should) look at this ratio on a monthly or quarterly basis and recognize any distortions due to averaging or annualizing.
R5 PORTFOLIO TO ASSETS
Portfolio to Assets = Gross Loan PortfolioAssets R5 = B4
B12
Why This Ratio Is Important
An MFI’s primary business is making loans and providing other financial services to microentrepre-neurs. This ratio shows how well an MFI allocates its assets to its primary business and, in most cases, its most profitable activity—making loans.
At first glance, a manager can see how well the MFI is deploying its funds into high-yielding micro-loans. This ratio is most valuable when observed monthly. The Gross Loan Portfolio can fluctuate dra-
15 MFIs that use accrual accounting and have difficulty in determining Cash Received from Interest, Fees, and Commissions on Loan Portfolio may opt to use (I1) Financial Revenue as the numerator. MFIs may also choose to use (I1) Financial Revenue less (B6) Interest Receivable as a proxy for cash received from interest and fees. Using (I1) Financial Revenue less (B6) Interest Receivable, however, is not an accurate proxy for MFIs that have long loan terms, extended grace periods, or balloon payments of interest.
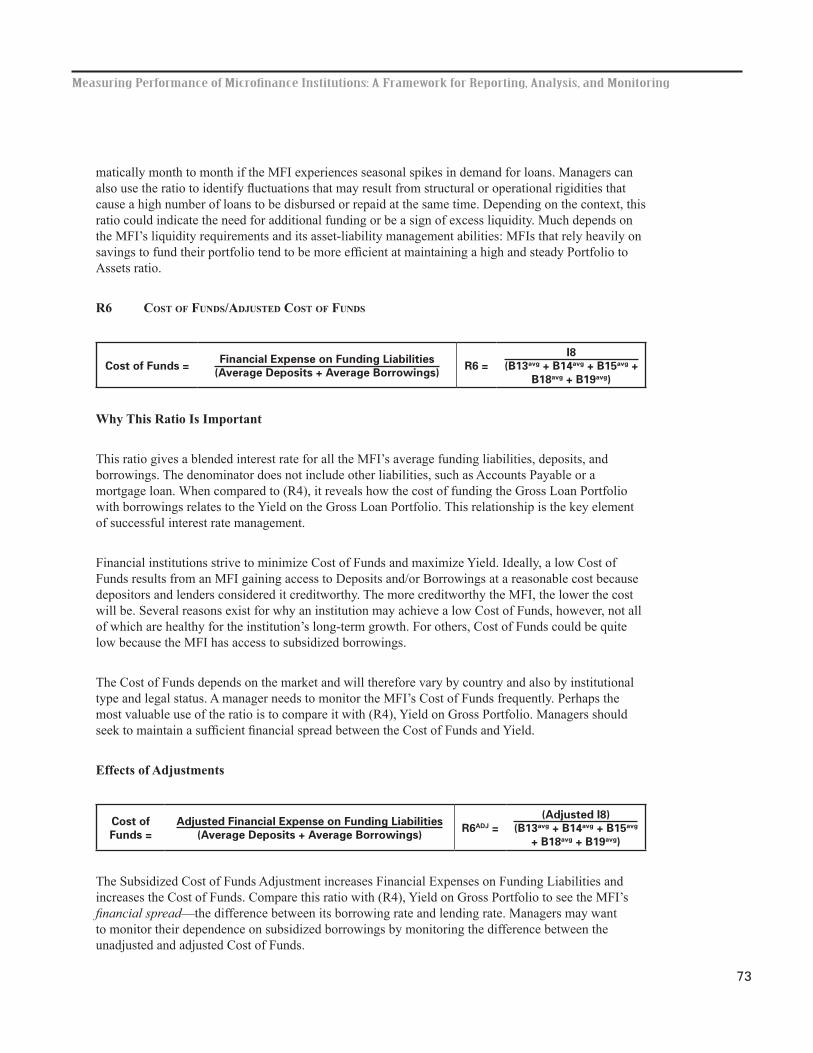
Measuring Performance of Microfinance Institutions: A Framework for Reporting, Analysis, and Monitoring
73
matically month to month if the MFI experiences seasonal spikes in demand for loans. Managers can also use the ratio to identify fluctuations that may result from structural or operational rigidities that cause a high number of loans to be disbursed or repaid at the same time. Depending on the context, this ratio could indicate the need for additional funding or be a sign of excess liquidity. Much depends on the MFI’s liquidity requirements and its asset-liability management abilities: MFIs that rely heavily on savings to fund their portfolio tend to be more efficient at maintaining a high and steady Portfolio to Assets ratio.
R6 COST OF FUNDS/ADJUSTED COST OF FUNDS
Cost of Funds = Financial Expense on Funding Liabilities(Average Deposits + Average Borrowings) R6 =
I8(B13avg + B14avg + B15avg +
B18avg + B19avg)
Why This Ratio Is Important
This ratio gives a blended interest rate for all the MFI’s average funding liabilities, deposits, and borrowings. The denominator does not include other liabilities, such as Accounts Payable or a mortgage loan. When compared to (R4), it reveals how the cost of funding the Gross Loan Portfolio with borrowings relates to the Yield on the Gross Loan Portfolio. This relationship is the key element of successful interest rate management.
Financial institutions strive to minimize Cost of Funds and maximize Yield. Ideally, a low Cost of Funds results from an MFI gaining access to Deposits and/or Borrowings at a reasonable cost because depositors and lenders considered it creditworthy. The more creditworthy the MFI, the lower the cost will be. Several reasons exist for why an institution may achieve a low Cost of Funds, however, not all of which are healthy for the institution’s long-term growth. For others, Cost of Funds could be quite low because the MFI has access to subsidized borrowings.
The Cost of Funds depends on the market and will therefore vary by country and also by institutional type and legal status. A manager needs to monitor the MFI’s Cost of Funds frequently. Perhaps the most valuable use of the ratio is to compare it with (R4), Yield on Gross Portfolio. Managers should seek to maintain a sufficient financial spread between the Cost of Funds and Yield.
Effects of Adjustments
Cost of Funds =
Adjusted Financial Expense on Funding Liabilities(Average Deposits + Average Borrowings) R6ADJ =
(Adjusted I8)(B13avg + B14avg + B15avg
+ B18avg + B19avg)
The Subsidized Cost of Funds Adjustment increases Financial Expenses on Funding Liabilities and increases the Cost of Funds. Compare this ratio with (R4), Yield on Gross Portfolio to see the MFI’s financial spread—the difference between its borrowing rate and lending rate. Managers may want to monitor their dependence on subsidized borrowings by monitoring the difference between the unadjusted and adjusted Cost of Funds.
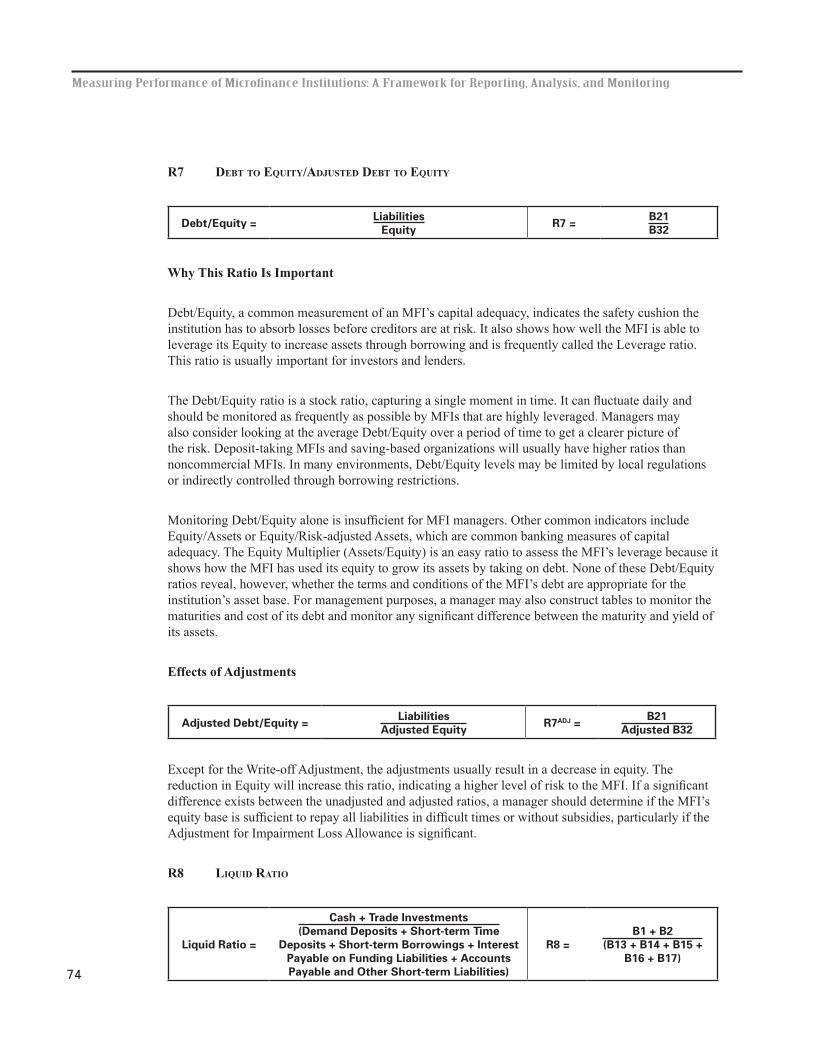
Measuring Performance of Microfinance Institutions: A Framework for Reporting, Analysis, and Monitoring
74
R7 DEBT TO EQUITY/ADJUSTED DEBT TO EQUITY
Debt/Equity = LiabilitiesEquity R7 = B21
B32
Why This Ratio Is Important
Debt/Equity, a common measurement of an MFI’s capital adequacy, indicates the safety cushion the institution has to absorb losses before creditors are at risk. It also shows how well the MFI is able to leverage its Equity to increase assets through borrowing and is frequently called the Leverage ratio. This ratio is usually important for investors and lenders.
The Debt/Equity ratio is a stock ratio, capturing a single moment in time. It can fluctuate daily and should be monitored as frequently as possible by MFIs that are highly leveraged. Managers may also consider looking at the average Debt/Equity over a period of time to get a clearer picture of the risk. Deposit-taking MFIs and saving-based organizations will usually have higher ratios than noncommercial MFIs. In many environments, Debt/Equity levels may be limited by local regulations or indirectly controlled through borrowing restrictions.
Monitoring Debt/Equity alone is insufficient for MFI managers. Other common indicators include Equity/Assets or Equity/Risk-adjusted Assets, which are common banking measures of capital adequacy. The Equity Multiplier (Assets/Equity) is an easy ratio to assess the MFI’s leverage because it shows how the MFI has used its equity to grow its assets by taking on debt. None of these Debt/Equity ratios reveal, however, whether the terms and conditions of the MFI’s debt are appropriate for the institution’s asset base. For management purposes, a manager may also construct tables to monitor the maturities and cost of its debt and monitor any significant difference between the maturity and yield of its assets.
Effects of Adjustments
Adjusted Debt/Equity = LiabilitiesAdjusted Equity R7ADJ = B21
Adjusted B32
Except for the Write-off Adjustment, the adjustments usually result in a decrease in equity. The reduction in Equity will increase this ratio, indicating a higher level of risk to the MFI. If a significant difference exists between the unadjusted and adjusted ratios, a manager should determine if the MFI’s equity base is sufficient to repay all liabilities in difficult times or without subsidies, particularly if the Adjustment for Impairment Loss Allowance is significant.
R8 LIQUID RATIO
Liquid Ratio =
Cash + Trade Investments(Demand Deposits + Short-term Time
Deposits + Short-term Borrowings + Interest Payable on Funding Liabilities + Accounts Payable and Other Short-term Liabilities)
R8 =B1 + B2
(B13 + B14 + B15 + B16 + B17)
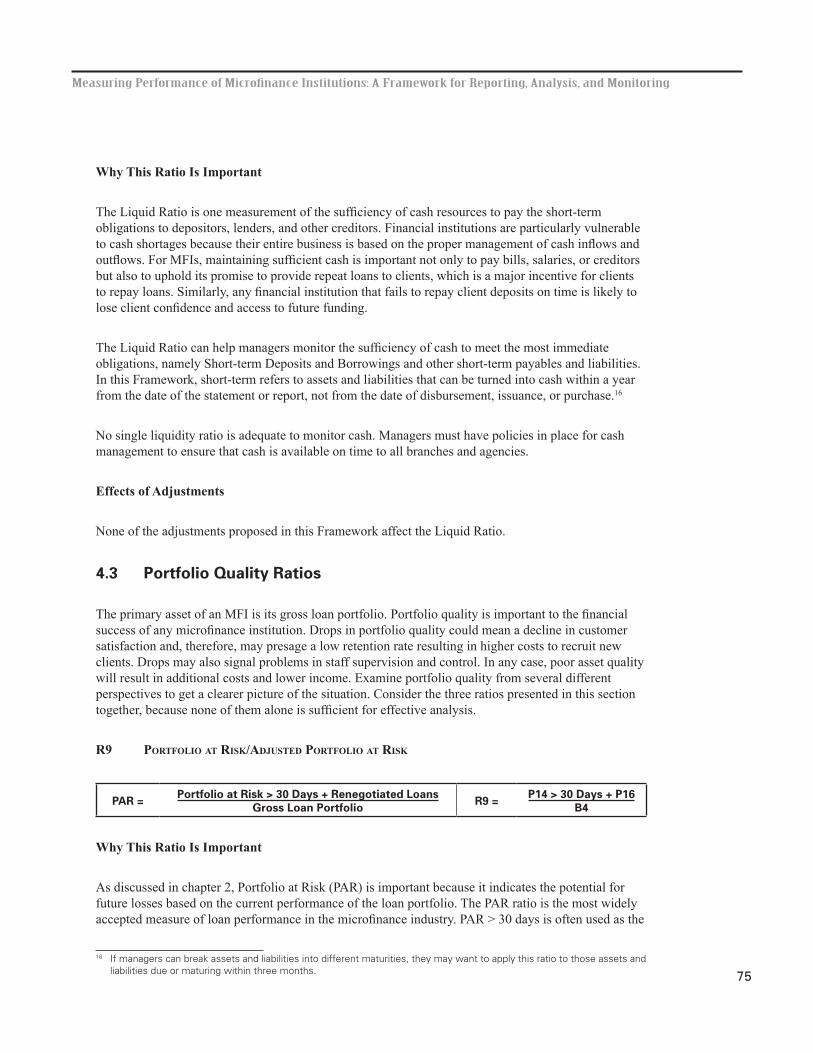
Measuring Performance of Microfinance Institutions: A Framework for Reporting, Analysis, and Monitoring
75
Why This Ratio Is Important
The Liquid Ratio is one measurement of the sufficiency of cash resources to pay the short-term obligations to depositors, lenders, and other creditors. Financial institutions are particularly vulnerable to cash shortages because their entire business is based on the proper management of cash inflows and outflows. For MFIs, maintaining sufficient cash is important not only to pay bills, salaries, or creditors but also to uphold its promise to provide repeat loans to clients, which is a major incentive for clients to repay loans. Similarly, any financial institution that fails to repay client deposits on time is likely to lose client confidence and access to future funding.
The Liquid Ratio can help managers monitor the sufficiency of cash to meet the most immediate obligations, namely Short-term Deposits and Borrowings and other short-term payables and liabilities. In this Framework, short-term refers to assets and liabilities that can be turned into cash within a year from the date of the statement or report, not from the date of disbursement, issuance, or purchase.16
No single liquidity ratio is adequate to monitor cash. Managers must have policies in place for cash management to ensure that cash is available on time to all branches and agencies.
Effects of Adjustments
None of the adjustments proposed in this Framework affect the Liquid Ratio.
4.3 Portfolio Quality Ratios
The primary asset of an MFI is its gross loan portfolio. Portfolio quality is important to the financial success of any microfinance institution. Drops in portfolio quality could mean a decline in customer satisfaction and, therefore, may presage a low retention rate resulting in higher costs to recruit new clients. Drops may also signal problems in staff supervision and control. In any case, poor asset quality will result in additional costs and lower income. Examine portfolio quality from several different perspectives to get a clearer picture of the situation. Consider the three ratios presented in this section together, because none of them alone is sufficient for effective analysis.
R9 PORTFOLIO AT RISK/ADJUSTED PORTFOLIO AT RISK
PAR = Portfolio at Risk > 30 Days + Renegotiated LoansGross Loan Portfolio R9 = P14 > 30 Days + P16
B4
Why This Ratio Is Important
As discussed in chapter 2, Portfolio at Risk (PAR) is important because it indicates the potential for future losses based on the current performance of the loan portfolio. The PAR ratio is the most widely accepted measure of loan performance in the microfinance industry. PAR > 30 days is often used as the
16 If managers can break assets and liabilities into different maturities, they may want to apply this ratio to those assets and liabilities due or maturing within three months.
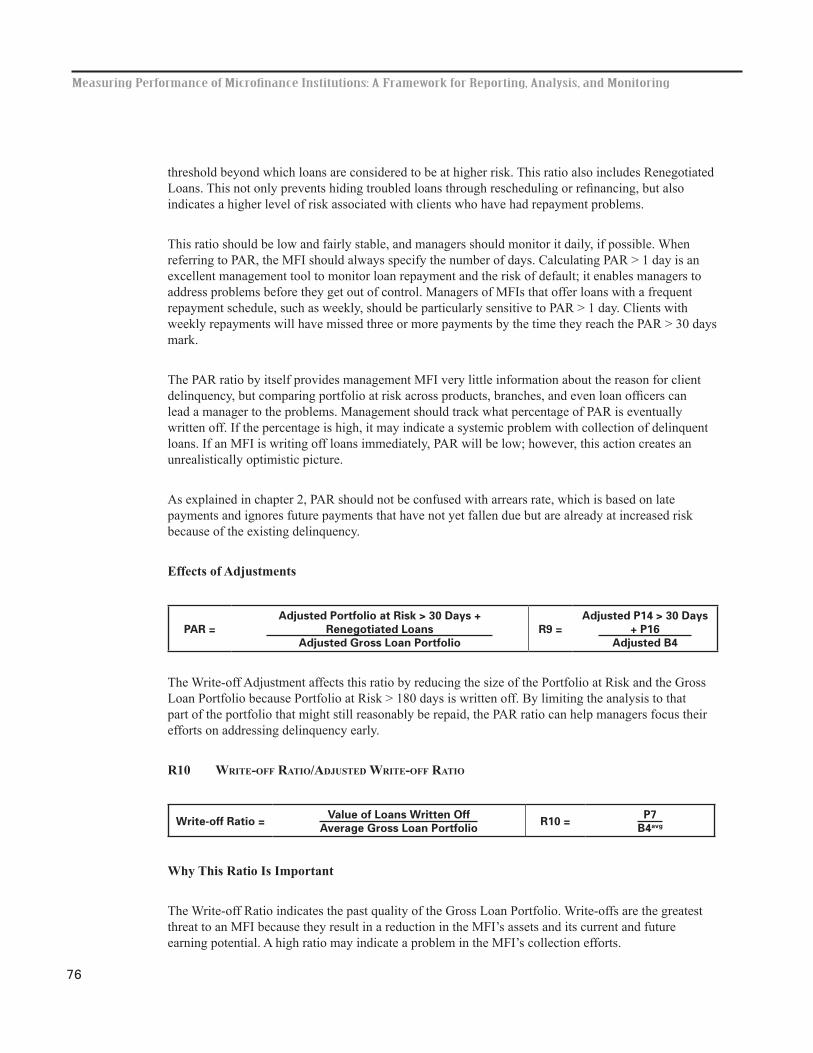
Measuring Performance of Microfinance Institutions: A Framework for Reporting, Analysis, and Monitoring
76
threshold beyond which loans are considered to be at higher risk. This ratio also includes Renegotiated Loans. This not only prevents hiding troubled loans through rescheduling or refinancing, but also indicates a higher level of risk associated with clients who have had repayment problems.
This ratio should be low and fairly stable, and managers should monitor it daily, if possible. When referring to PAR, the MFI should always specify the number of days. Calculating PAR > 1 day is an excellent management tool to monitor loan repayment and the risk of default; it enables managers to address problems before they get out of control. Managers of MFIs that offer loans with a frequent repayment schedule, such as weekly, should be particularly sensitive to PAR > 1 day. Clients with weekly repayments will have missed three or more payments by the time they reach the PAR > 30 days mark.
The PAR ratio by itself provides management MFI very little information about the reason for client delinquency, but comparing portfolio at risk across products, branches, and even loan officers can lead a manager to the problems. Management should track what percentage of PAR is eventually written off. If the percentage is high, it may indicate a systemic problem with collection of delinquent loans. If an MFI is writing off loans immediately, PAR will be low; however, this action creates an unrealistically optimistic picture.
As explained in chapter 2, PAR should not be confused with arrears rate, which is based on late payments and ignores future payments that have not yet fallen due but are already at increased risk because of the existing delinquency.
Effects of Adjustments
PAR = Adjusted Portfolio at Risk > 30 Days +
Renegotiated LoansAdjusted Gross Loan Portfolio
R9 =Adjusted P14 > 30 Days
+ P16Adjusted B4
The Write-off Adjustment affects this ratio by reducing the size of the Portfolio at Risk and the Gross Loan Portfolio because Portfolio at Risk > 180 days is written off. By limiting the analysis to that part of the portfolio that might still reasonably be repaid, the PAR ratio can help managers focus their efforts on addressing delinquency early.
R10 WRITE-OFF RATIO/ADJUSTED WRITE-OFF RATIO
Write-off Ratio = Value of Loans Written OffAverage Gross Loan Portfolio R10 = P7
B4avg
Why This Ratio Is Important
The Write-off Ratio indicates the past quality of the Gross Loan Portfolio. Write-offs are the greatest threat to an MFI because they result in a reduction in the MFI’s assets and its current and future earning potential. A high ratio may indicate a problem in the MFI’s collection efforts.
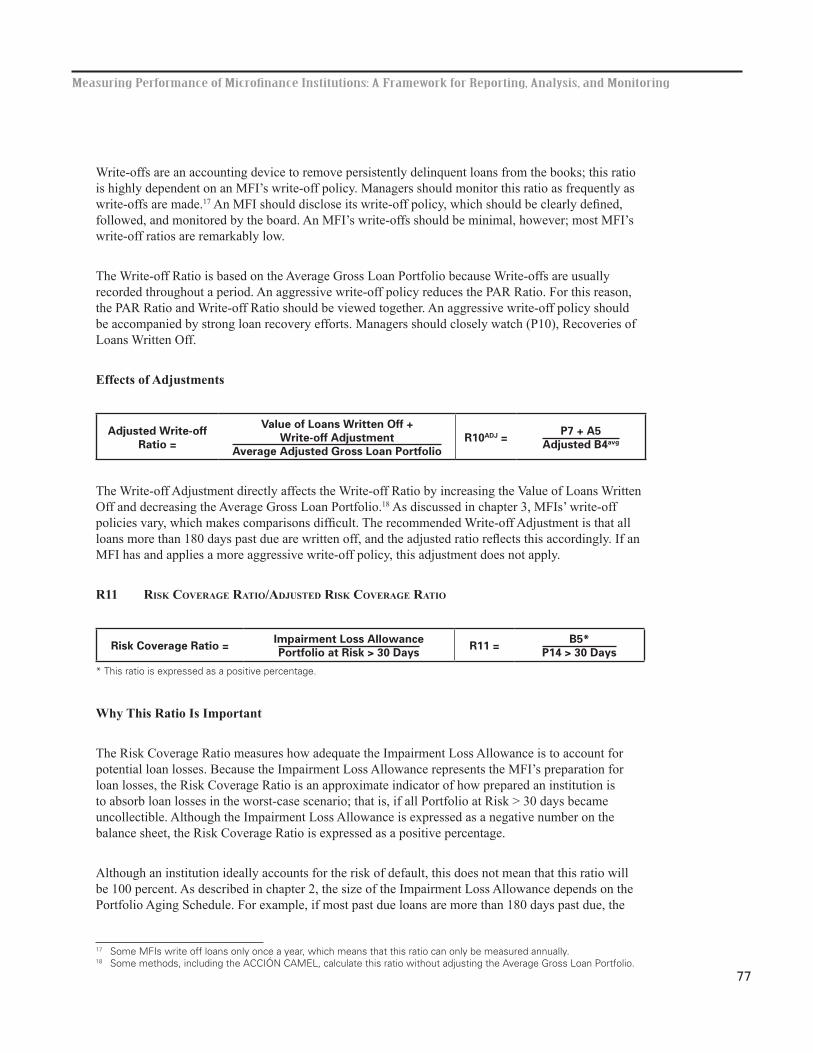
Measuring Performance of Microfinance Institutions: A Framework for Reporting, Analysis, and Monitoring
77
Write-offs are an accounting device to remove persistently delinquent loans from the books; this ratio is highly dependent on an MFI’s write-off policy. Managers should monitor this ratio as frequently as write-offs are made.17 An MFI should disclose its write-off policy, which should be clearly defined, followed, and monitored by the board. An MFI’s write-offs should be minimal, however; most MFI’s write-off ratios are remarkably low.
The Write-off Ratio is based on the Average Gross Loan Portfolio because Write-offs are usually recorded throughout a period. An aggressive write-off policy reduces the PAR Ratio. For this reason, the PAR Ratio and Write-off Ratio should be viewed together. An aggressive write-off policy should be accompanied by strong loan recovery efforts. Managers should closely watch (P10), Recoveries of Loans Written Off.
Effects of Adjustments
Adjusted Write-off Ratio =
Value of Loans Written Off + Write-off Adjustment
Average Adjusted Gross Loan PortfolioR10ADJ = P7 + A5
Adjusted B4avg
The Write-off Adjustment directly affects the Write-off Ratio by increasing the Value of Loans Written Off and decreasing the Average Gross Loan Portfolio.18 As discussed in chapter 3, MFIs’ write-off policies vary, which makes comparisons difficult. The recommended Write-off Adjustment is that all loans more than 180 days past due are written off, and the adjusted ratio reflects this accordingly. If an MFI has and applies a more aggressive write-off policy, this adjustment does not apply.
R11 RISK COVERAGE RATIO/ADJUSTED RISK COVERAGE RATIO
Risk Coverage Ratio = Impairment Loss AllowancePortfolio at Risk > 30 Days R11 = B5*
P14 > 30 Days
* This ratio is expressed as a positive percentage.
Why This Ratio Is Important
The Risk Coverage Ratio measures how adequate the Impairment Loss Allowance is to account for potential loan losses. Because the Impairment Loss Allowance represents the MFI’s preparation for loan losses, the Risk Coverage Ratio is an approximate indicator of how prepared an institution is to absorb loan losses in the worst-case scenario; that is, if all Portfolio at Risk > 30 days became uncollectible. Although the Impairment Loss Allowance is expressed as a negative number on the balance sheet, the Risk Coverage Ratio is expressed as a positive percentage.
Although an institution ideally accounts for the risk of default, this does not mean that this ratio will be 100 percent. As described in chapter 2, the size of the Impairment Loss Allowance depends on the Portfolio Aging Schedule. For example, if most past due loans are more than 180 days past due, the
17 Some MFIs write off loans only once a year, which means that this ratio can only be measured annually. 18 Some methods, including the ACCIÓN CAMEL, calculate this ratio without adjusting the Average Gross Loan Portfolio.
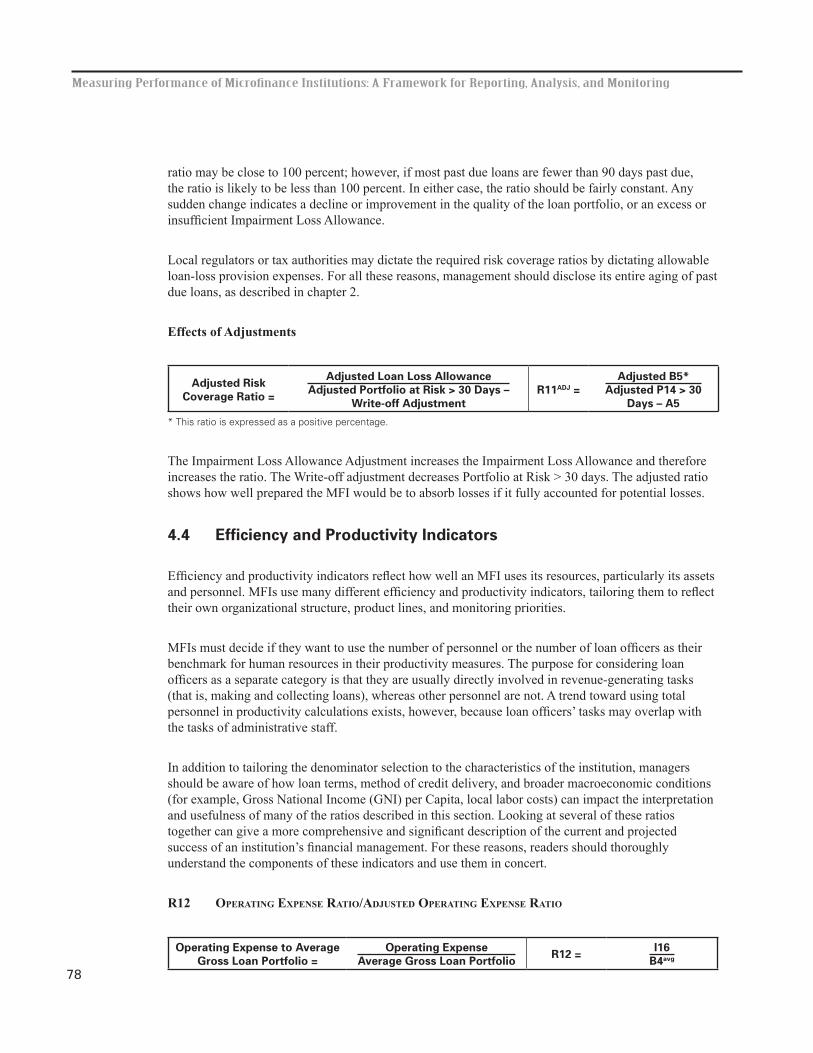
Measuring Performance of Microfinance Institutions: A Framework for Reporting, Analysis, and Monitoring
78
ratio may be close to 100 percent; however, if most past due loans are fewer than 90 days past due, the ratio is likely to be less than 100 percent. In either case, the ratio should be fairly constant. Any sudden change indicates a decline or improvement in the quality of the loan portfolio, or an excess or insufficient Impairment Loss Allowance.
Local regulators or tax authorities may dictate the required risk coverage ratios by dictating allowable loan-loss provision expenses. For all these reasons, management should disclose its entire aging of past due loans, as described in chapter 2.
Effects of Adjustments
Adjusted Risk Coverage Ratio =
Adjusted Loan Loss AllowanceAdjusted Portfolio at Risk > 30 Days –
Write-off AdjustmentR11ADJ =
Adjusted B5*Adjusted P14 > 30
Days – A5
* This ratio is expressed as a positive percentage.
The Impairment Loss Allowance Adjustment increases the Impairment Loss Allowance and therefore increases the ratio. The Write-off adjustment decreases Portfolio at Risk > 30 days. The adjusted ratio shows how well prepared the MFI would be to absorb losses if it fully accounted for potential losses.
4.4 Efficiency and Productivity Indicators
Efficiency and productivity indicators reflect how well an MFI uses its resources, particularly its assets and personnel. MFIs use many different efficiency and productivity indicators, tailoring them to reflect their own organizational structure, product lines, and monitoring priorities.
MFIs must decide if they want to use the number of personnel or the number of loan officers as their benchmark for human resources in their productivity measures. The purpose for considering loan officers as a separate category is that they are usually directly involved in revenue-generating tasks (that is, making and collecting loans), whereas other personnel are not. A trend toward using total personnel in productivity calculations exists, however, because loan officers’ tasks may overlap with the tasks of administrative staff.
In addition to tailoring the denominator selection to the characteristics of the institution, managers should be aware of how loan terms, method of credit delivery, and broader macroeconomic conditions (for example, Gross National Income (GNI) per Capita, local labor costs) can impact the interpretation and usefulness of many of the ratios described in this section. Looking at several of these ratios together can give a more comprehensive and significant description of the current and projected success of an institution’s financial management. For these reasons, readers should thoroughly understand the components of these indicators and use them in concert.
R12 OPERATING EXPENSE RATIO/ADJUSTED OPERATING EXPENSE RATIO
Operating Expense to Average Gross Loan Portfolio =
Operating ExpenseAverage Gross Loan Portfolio R12 = I16
B4avg
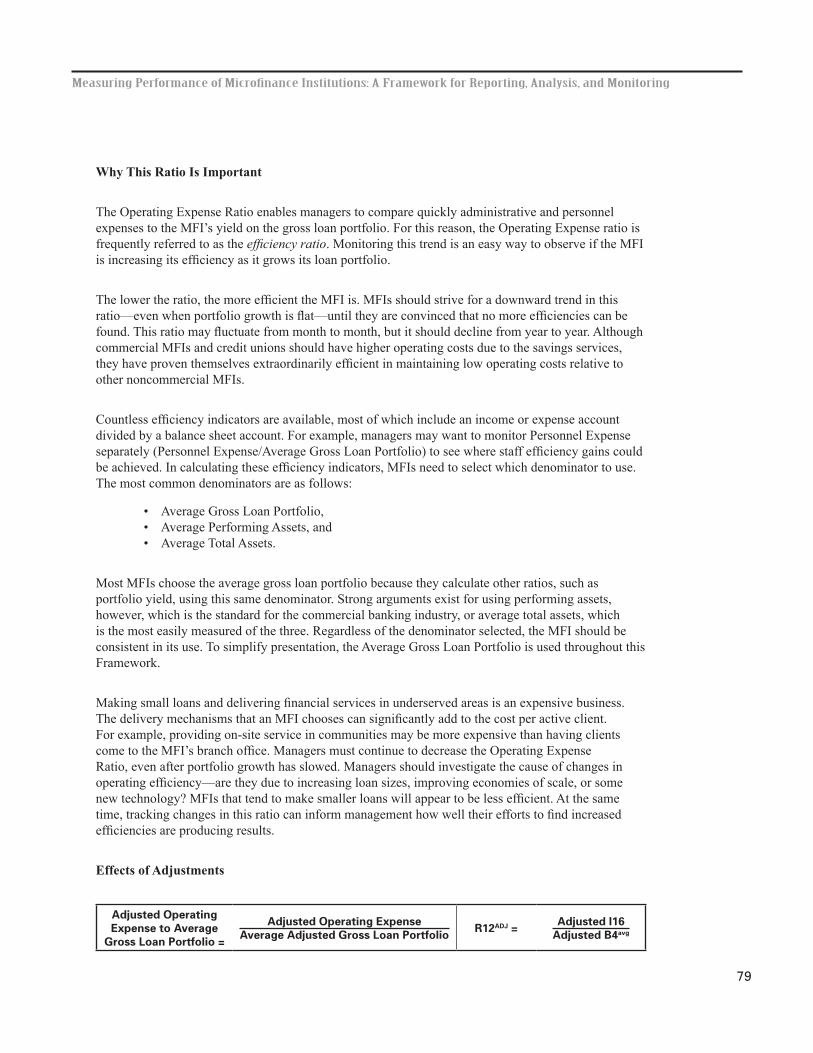
Measuring Performance of Microfinance Institutions: A Framework for Reporting, Analysis, and Monitoring
79
Why This Ratio Is Important
The Operating Expense Ratio enables managers to compare quickly administrative and personnel expenses to the MFI’s yield on the gross loan portfolio. For this reason, the Operating Expense ratio is frequently referred to as the efficiency ratio. Monitoring this trend is an easy way to observe if the MFI is increasing its efficiency as it grows its loan portfolio.
The lower the ratio, the more efficient the MFI is. MFIs should strive for a downward trend in this ratio—even when portfolio growth is flat—until they are convinced that no more efficiencies can be found. This ratio may fluctuate from month to month, but it should decline from year to year. Although commercial MFIs and credit unions should have higher operating costs due to the savings services, they have proven themselves extraordinarily efficient in maintaining low operating costs relative to other noncommercial MFIs.
Countless efficiency indicators are available, most of which include an income or expense account divided by a balance sheet account. For example, managers may want to monitor Personnel Expense separately (Personnel Expense/Average Gross Loan Portfolio) to see where staff efficiency gains could be achieved. In calculating these efficiency indicators, MFIs need to select which denominator to use. The most common denominators are as follows:
• Average Gross Loan Portfolio,• Average Performing Assets, and • Average Total Assets.
Most MFIs choose the average gross loan portfolio because they calculate other ratios, such as portfolio yield, using this same denominator. Strong arguments exist for using performing assets, however, which is the standard for the commercial banking industry, or average total assets, which is the most easily measured of the three. Regardless of the denominator selected, the MFI should be consistent in its use. To simplify presentation, the Average Gross Loan Portfolio is used throughout this Framework.
Making small loans and delivering financial services in underserved areas is an expensive business. The delivery mechanisms that an MFI chooses can significantly add to the cost per active client. For example, providing on-site service in communities may be more expensive than having clients come to the MFI’s branch office. Managers must continue to decrease the Operating Expense Ratio, even after portfolio growth has slowed. Managers should investigate the cause of changes in operating efficiency—are they due to increasing loan sizes, improving economies of scale, or some new technology? MFIs that tend to make smaller loans will appear to be less efficient. At the same time, tracking changes in this ratio can inform management how well their efforts to find increased efficiencies are producing results.
Effects of Adjustments
Adjusted Operating Expense to Average
Gross Loan Portfolio =
Adjusted Operating ExpenseAverage Adjusted Gross Loan Portfolio R12ADJ = Adjusted I16
Adjusted B4avg
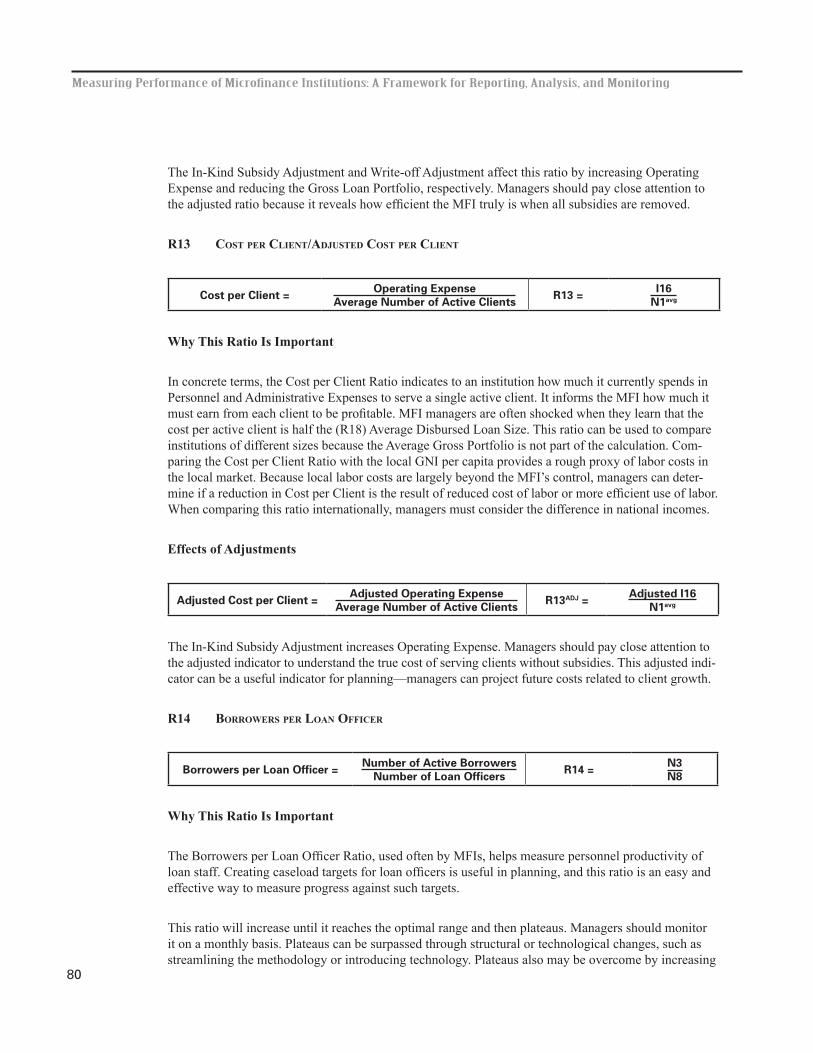
Measuring Performance of Microfinance Institutions: A Framework for Reporting, Analysis, and Monitoring
80
The In-Kind Subsidy Adjustment and Write-off Adjustment affect this ratio by increasing Operating Expense and reducing the Gross Loan Portfolio, respectively. Managers should pay close attention to the adjusted ratio because it reveals how efficient the MFI truly is when all subsidies are removed.
R13 COST PER CLIENT/ADJUSTED COST PER CLIENT
Cost per Client = Operating ExpenseAverage Number of Active Clients R13 = I16
N1avg
Why This Ratio Is Important
In concrete terms, the Cost per Client Ratio indicates to an institution how much it currently spends in Personnel and Administrative Expenses to serve a single active client. It informs the MFI how much it must earn from each client to be profitable. MFI managers are often shocked when they learn that the cost per active client is half the (R18) Average Disbursed Loan Size. This ratio can be used to compare institutions of different sizes because the Average Gross Portfolio is not part of the calculation. Com-paring the Cost per Client Ratio with the local GNI per capita provides a rough proxy of labor costs in the local market. Because local labor costs are largely beyond the MFI’s control, managers can deter-mine if a reduction in Cost per Client is the result of reduced cost of labor or more efficient use of labor. When comparing this ratio internationally, managers must consider the difference in national incomes.
Effects of Adjustments
Adjusted Cost per Client = Adjusted Operating ExpenseAverage Number of Active Clients R13ADJ = Adjusted I16
N1avg
The In-Kind Subsidy Adjustment increases Operating Expense. Managers should pay close attention to the adjusted indicator to understand the true cost of serving clients without subsidies. This adjusted indi-cator can be a useful indicator for planning—managers can project future costs related to client growth.
R14 BORROWERS PER LOAN OFFICER
Borrowers per Loan Officer = Number of Active BorrowersNumber of Loan Officers R14 = N3
N8
Why This Ratio Is Important
The Borrowers per Loan Officer Ratio, used often by MFIs, helps measure personnel productivity of loan staff. Creating caseload targets for loan officers is useful in planning, and this ratio is an easy and effective way to measure progress against such targets.
This ratio will increase until it reaches the optimal range and then plateaus. Managers should monitor it on a monthly basis. Plateaus can be surpassed through structural or technological changes, such as streamlining the methodology or introducing technology. Plateaus also may be overcome by increasing
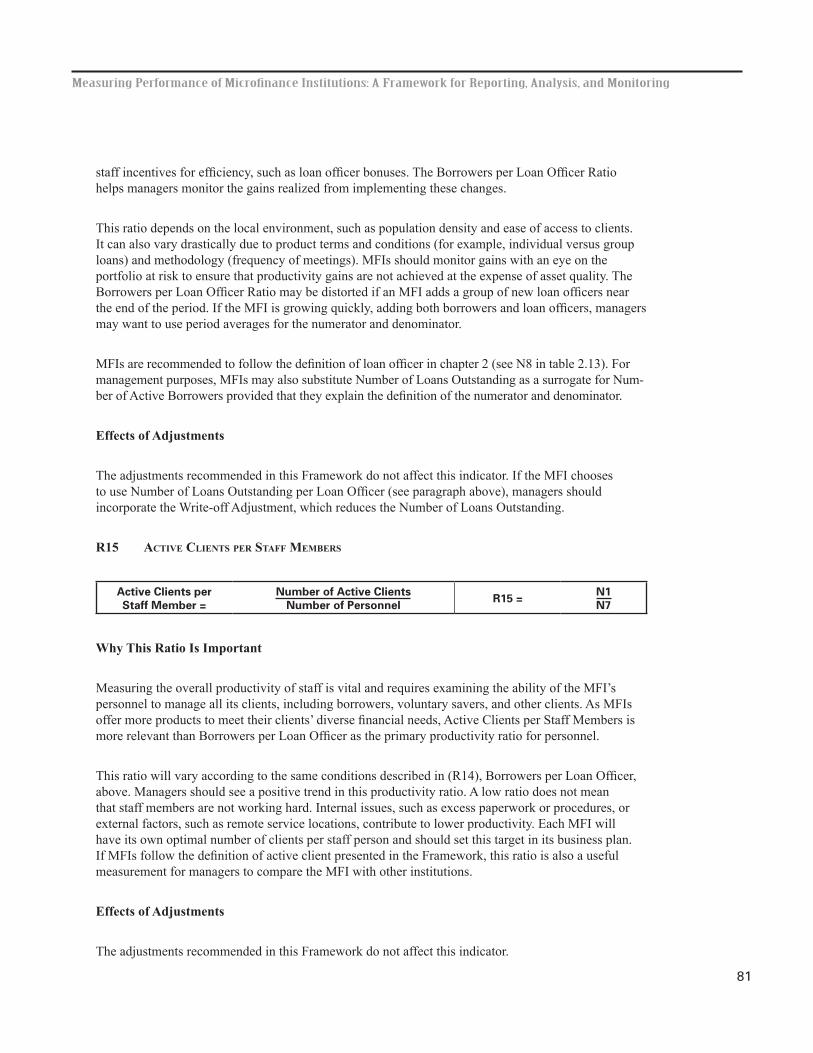
Measuring Performance of Microfinance Institutions: A Framework for Reporting, Analysis, and Monitoring
81
staff incentives for efficiency, such as loan officer bonuses. The Borrowers per Loan Officer Ratio helps managers monitor the gains realized from implementing these changes.
This ratio depends on the local environment, such as population density and ease of access to clients. It can also vary drastically due to product terms and conditions (for example, individual versus group loans) and methodology (frequency of meetings). MFIs should monitor gains with an eye on the portfolio at risk to ensure that productivity gains are not achieved at the expense of asset quality. The Borrowers per Loan Officer Ratio may be distorted if an MFI adds a group of new loan officers near the end of the period. If the MFI is growing quickly, adding both borrowers and loan officers, managers may want to use period averages for the numerator and denominator.
MFIs are recommended to follow the definition of loan officer in chapter 2 (see N8 in table 2.13). For management purposes, MFIs may also substitute Number of Loans Outstanding as a surrogate for Num-ber of Active Borrowers provided that they explain the definition of the numerator and denominator.
Effects of Adjustments
The adjustments recommended in this Framework do not affect this indicator. If the MFI chooses to use Number of Loans Outstanding per Loan Officer (see paragraph above), managers should incorporate the Write-off Adjustment, which reduces the Number of Loans Outstanding.
R15 ACTIVE CLIENTS PER STAFF MEMBERS
Active Clients per Staff Member =
Number of Active ClientsNumber of Personnel R15 = N1
N7
Why This Ratio Is Important
Measuring the overall productivity of staff is vital and requires examining the ability of the MFI’s personnel to manage all its clients, including borrowers, voluntary savers, and other clients. As MFIs offer more products to meet their clients’ diverse financial needs, Active Clients per Staff Members is more relevant than Borrowers per Loan Officer as the primary productivity ratio for personnel.
This ratio will vary according to the same conditions described in (R14), Borrowers per Loan Officer, above. Managers should see a positive trend in this productivity ratio. A low ratio does not mean that staff members are not working hard. Internal issues, such as excess paperwork or procedures, or external factors, such as remote service locations, contribute to lower productivity. Each MFI will have its own optimal number of clients per staff person and should set this target in its business plan. If MFIs follow the definition of active client presented in the Framework, this ratio is also a useful measurement for managers to compare the MFI with other institutions.
Effects of Adjustments
The adjustments recommended in this Framework do not affect this indicator.
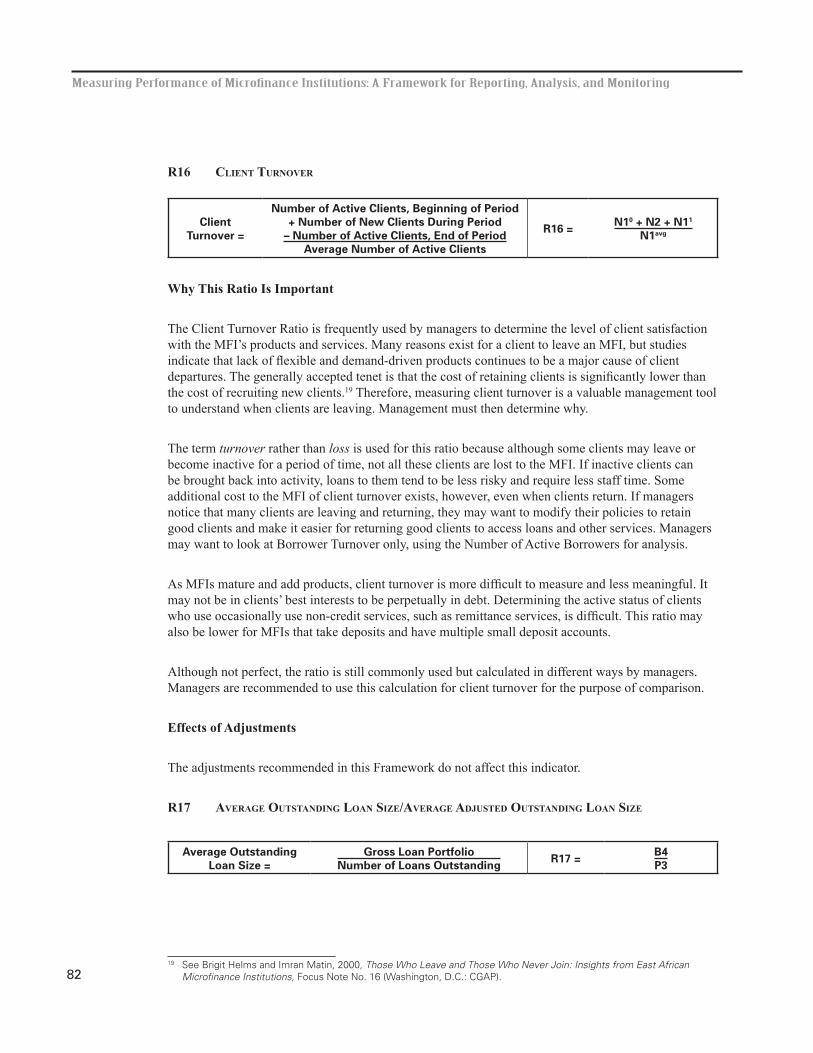
Measuring Performance of Microfinance Institutions: A Framework for Reporting, Analysis, and Monitoring
82
R16 CLIENT TURNOVER
Client Turnover =
Number of Active Clients, Beginning of Period + Number of New Clients During Period
– Number of Active Clients, End of PeriodAverage Number of Active Clients
R16 = N10 + N2 + N11
N1avg
Why This Ratio Is Important
The Client Turnover Ratio is frequently used by managers to determine the level of client satisfaction with the MFI’s products and services. Many reasons exist for a client to leave an MFI, but studies indicate that lack of flexible and demand-driven products continues to be a major cause of client departures. The generally accepted tenet is that the cost of retaining clients is significantly lower than the cost of recruiting new clients.19 Therefore, measuring client turnover is a valuable management tool to understand when clients are leaving. Management must then determine why.
The term turnover rather than loss is used for this ratio because although some clients may leave or become inactive for a period of time, not all these clients are lost to the MFI. If inactive clients can be brought back into activity, loans to them tend to be less risky and require less staff time. Some additional cost to the MFI of client turnover exists, however, even when clients return. If managers notice that many clients are leaving and returning, they may want to modify their policies to retain good clients and make it easier for returning good clients to access loans and other services. Managers may want to look at Borrower Turnover only, using the Number of Active Borrowers for analysis.
As MFIs mature and add products, client turnover is more difficult to measure and less meaningful. It may not be in clients’ best interests to be perpetually in debt. Determining the active status of clients who use occasionally use non-credit services, such as remittance services, is difficult. This ratio may also be lower for MFIs that take deposits and have multiple small deposit accounts.
Although not perfect, the ratio is still commonly used but calculated in different ways by managers. Managers are recommended to use this calculation for client turnover for the purpose of comparison.
Effects of Adjustments
The adjustments recommended in this Framework do not affect this indicator.
R17 AVERAGE OUTSTANDING LOAN SIZE/AVERAGE ADJUSTED OUTSTANDING LOAN SIZE
Average Outstanding Loan Size =
Gross Loan PortfolioNumber of Loans Outstanding R17 = B4
P3
19 See Brigit Helms and Imran Matin, 2000, Those Who Leave and Those Who Never Join: Insights from East African Microfinance Institutions, Focus Note No. 16 (Washington, D.C.: CGAP).
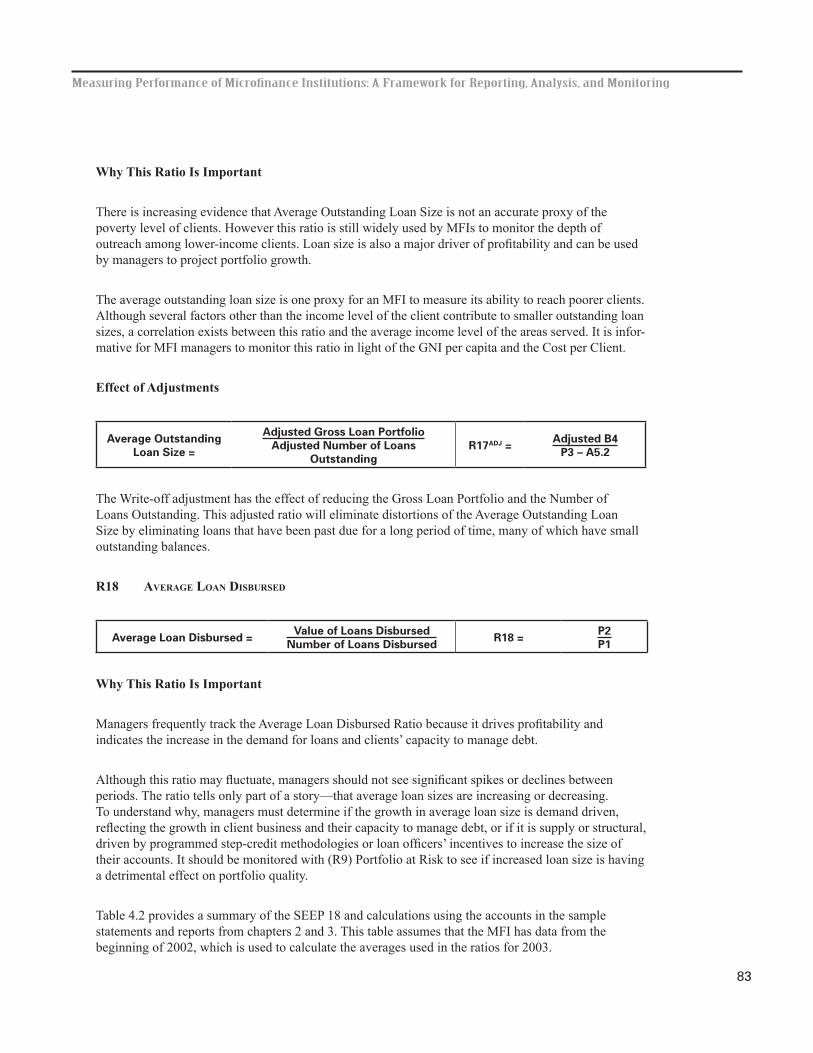
Measuring Performance of Microfinance Institutions: A Framework for Reporting, Analysis, and Monitoring
83
Why This Ratio Is Important
There is increasing evidence that Average Outstanding Loan Size is not an accurate proxy of the poverty level of clients. However this ratio is still widely used by MFIs to monitor the depth of outreach among lower-income clients. Loan size is also a major driver of profitability and can be used by managers to project portfolio growth.
The average outstanding loan size is one proxy for an MFI to measure its ability to reach poorer clients. Although several factors other than the income level of the client contribute to smaller outstanding loan sizes, a correlation exists between this ratio and the average income level of the areas served. It is infor-mative for MFI managers to monitor this ratio in light of the GNI per capita and the Cost per Client.
Effect of Adjustments
Average Outstanding Loan Size =
Adjusted Gross Loan PortfolioAdjusted Number of Loans
OutstandingR17ADJ = Adjusted B4
P3 – A5.2
The Write-off adjustment has the effect of reducing the Gross Loan Portfolio and the Number of Loans Outstanding. This adjusted ratio will eliminate distortions of the Average Outstanding Loan Size by eliminating loans that have been past due for a long period of time, many of which have small outstanding balances.
R18 AVERAGE LOAN DISBURSED
Average Loan Disbursed = Value of Loans DisbursedNumber of Loans Disbursed R18 = P2
P1
Why This Ratio Is Important
Managers frequently track the Average Loan Disbursed Ratio because it drives profitability and indicates the increase in the demand for loans and clients’ capacity to manage debt.
Although this ratio may fluctuate, managers should not see significant spikes or declines between periods. The ratio tells only part of a story—that average loan sizes are increasing or decreasing. To understand why, managers must determine if the growth in average loan size is demand driven, reflecting the growth in client business and their capacity to manage debt, or if it is supply or structural, driven by programmed step-credit methodologies or loan officers’ incentives to increase the size of their accounts. It should be monitored with (R9) Portfolio at Risk to see if increased loan size is having a detrimental effect on portfolio quality.
Table 4.2 provides a summary of the SEEP 18 and calculations using the accounts in the sample statements and reports from chapters 2 and 3. This table assumes that the MFI has data from the beginning of 2002, which is used to calculate the averages used in the ratios for 2003.
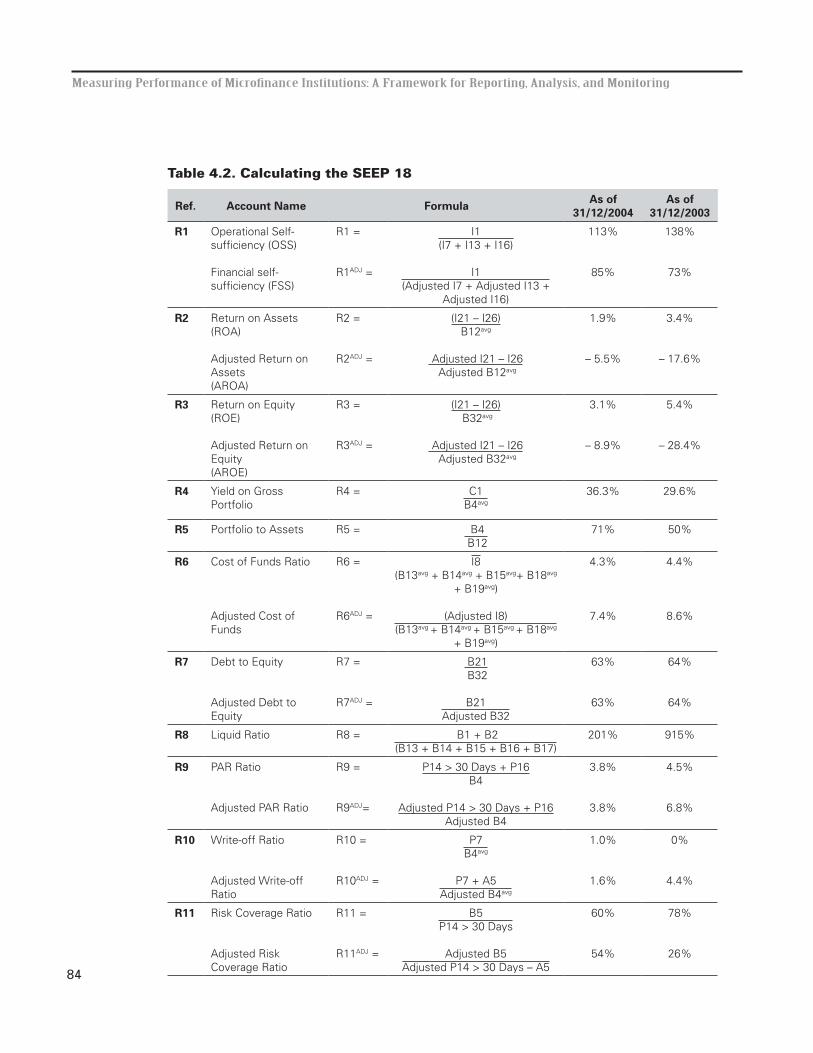
Measuring Performance of Microfinance Institutions: A Framework for Reporting, Analysis, and Monitoring
84
Table 4.2. Calculating the SEEP 18
Ref. Account Name Formula As of 31/12/2004
As of 31/12/2003
R1 Operational Self- sufficiency (OSS)
Financial self- sufficiency (FSS)
R1 =
R1ADJ =
I1(I7 + I13 + I16)
I1(Adjusted I7 + Adjusted I13 +
Adjusted I16)
113%
85%
138%
73%
R2 Return on Assets (ROA)
Adjusted Return on Assets(AROA)
R2 =
R2ADJ =
(I21 – I26)B12avg
Adjusted I21 – I26 Adjusted B12avg
1.9%
– 5.5%
3.4%
– 17.6%
R3 Return on Equity (ROE)
Adjusted Return on Equity(AROE)
R3 =
R3ADJ =
(I21 – I26) B32avg
Adjusted I21 – I26 Adjusted B32avg
3.1%
– 8.9%
5.4%
– 28.4%
R4 Yield on Gross Portfolio
R4 = C1B4avg
36.3% 29.6%
R5 Portfolio to Assets R5 = B4 B12
71% 50%
R6 Cost of Funds Ratio
Adjusted Cost of Funds
R6 =
R6ADJ =
I8 (B13avg + B14avg + B15avg+ B18avg
+ B19avg)
(Adjusted I8)(B13avg + B14avg + B15avg + B18avg
+ B19avg)
4.3%
7.4%
4.4%
8.6%
R7 Debt to Equity
Adjusted Debt to Equity
R7 =
R7ADJ =
B21 B32
B21Adjusted B32
63%
63%
64%
64%
R8 Liquid Ratio R8 = B1 + B2(B13 + B14 + B15 + B16 + B17)
201% 915%
R9 PAR Ratio
Adjusted PAR Ratio
R9 =
R9ADJ=
P14 > 30 Days + P16B4
Adjusted P14 > 30 Days + P16Adjusted B4
3.8%
3.8%
4.5%
6.8%
R10 Write-off Ratio
Adjusted Write-off Ratio
R10 =
R10ADJ =
P7B4avg
P7 + A5Adjusted B4avg
1.0%
1.6%
0%
4.4%
R11 Risk Coverage Ratio
Adjusted Risk Coverage Ratio
R11 =
R11ADJ =
B5P14 > 30 Days
Adjusted B5Adjusted P14 > 30 Days – A5
60%
54%
78%
26%
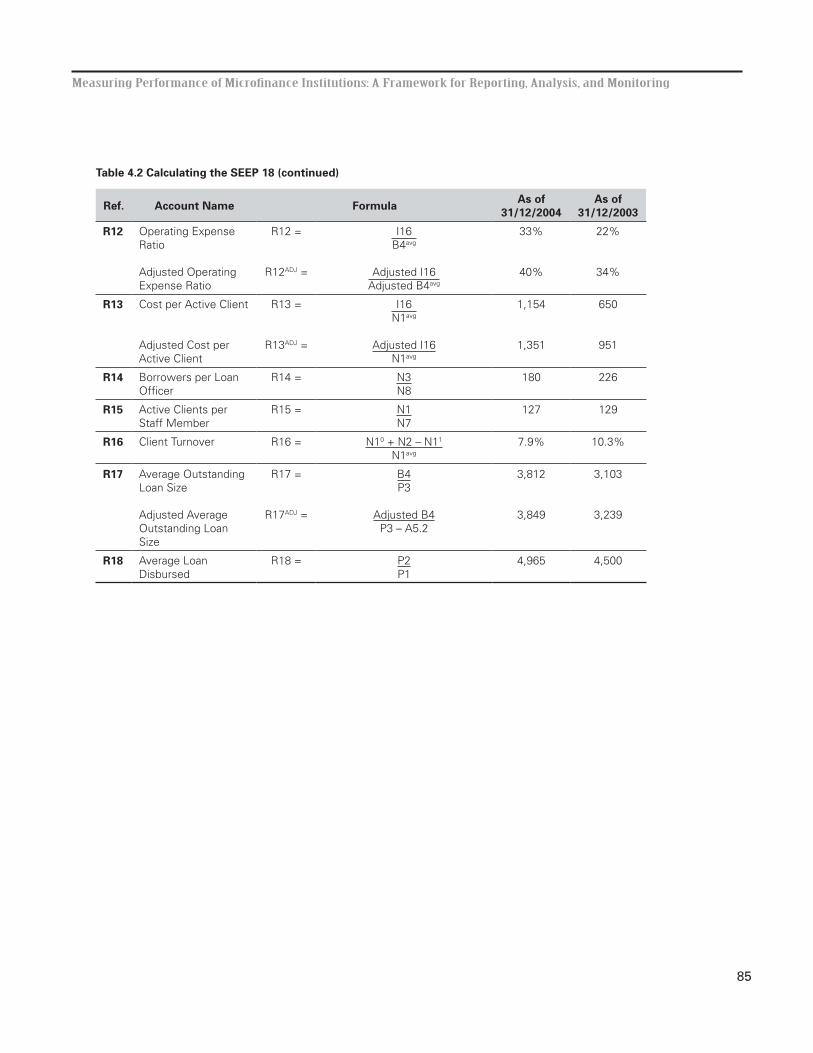
Measuring Performance of Microfinance Institutions: A Framework for Reporting, Analysis, and Monitoring
85
Ref. Account Name Formula As of 31/12/2004
As of 31/12/2003
R12 Operating Expense Ratio
Adjusted Operating Expense Ratio
R12 =
R12ADJ =
I16B4avg
Adjusted I16Adjusted B4avg
33%
40%
22%
34%
R13 Cost per Active Client
Adjusted Cost per Active Client
R13 =
R13ADJ =
I16N1avg
Adjusted I16N1avg
1,154
1,351
650
951
R14 Borrowers per Loan Officer
R14 = N3N8
180 226
R15 Active Clients per Staff Member
R15 = N1N7
127 129
R16 Client Turnover R16 = N10 + N2 – N11
N1avg 7.9% 10.3%
R17 Average Outstanding Loan Size
Adjusted Average Outstanding Loan Size
R17 =
R17ADJ =
B4P3
Adjusted B4P3 – A5.2
3,812
3,849
3,103
3,239
R18 Average Loan Disbursed
R18 = P2P1
4,965 4,500
Table 4.2 Calculating the SEEP 18 (continued)

Measuring Performance of Microfinance Institutions: A Framework for Reporting, Analysis, and Monitoring
87
5Creating and Analyzing Performance Monitoring Reports
Creating financial performance monitoring reports is only part of an overall performance monitoring system. This system begins with drafting a business plan, managing for results, monitoring progress, and holding management and staff accountable for results. All institutions create reports to manage for results and monitor progress. The content of performance monitoring reports varies according to the purpose of the specific report and the needs and demands of the user. The reports must include not only data and details, but they must also provide some meaningful analysis of an MFI’s performance and condition.
Chapter 4 includes a detailed explanation of the SEEP 18 ratios and indicators important for analysis. This chapter briefly presents the following three types of analysis:
• Trend analysis,• Variance analysis, and• Benchmarking.
These types of analysis are used in one or more of the following sample templates for financial performance reports for MFIs:
• Monthly management report,• Quarterly management report,• Quarterly board report,• Semiannual donor report, and • Semiannual investor report.
The templates for reporting are presented only as simple examples and are intended to encourage managers, board members, donors, and others to develop and use their own reports. Managers should determine the content of these reports by analyzing the following four issues:
• The timeliness of data depends on the frequency with which an MFI can produce data needed and on the time it takes to produce it;
• The accuracy and integrity of data depend not only on the information system, but also on the competence of the user and the checks and controls in place;
• The relevance of the data depends on the user—communicating less information is often better than providing detailed information that is not instructive; and
• The requirements of board members, donors, investors, and others must be respected. Management should carefully review the requirements of statutes, agreements, and contracts when designing their reports.
5.1 Analysis of Financial Statements and Indicators
Financial analysis is the art of interpreting financial statements and indicators—it requires managers to look at past performance, analyze it, and use the lessons learned to make today’s decisions. Without
Measuring Performance of Microfinance Institutions: A Framework for Reporting, Analysis, and Monitoring
88
analysis, creating financial statements is an accounting exercise. In addition to ratio analysis, several ways are available to use financial statements and ratios to learn more about an MFI’s performance.
5.1.1 Trend Analysis
Trend analysis is the examination of a company’s financial statements and indicators over time to deter-mine how actions affect results. Financial statements for a single period do not reveal much about the institution. The best method for performing trend analysis is to either compare the current period to a previous period of the same length, such as the previous quarter and the current quarter, or to annualize the indicators for the current period and compare the annualized indicators to the previous year.
The basic formula for determining the change in an account is as follows:
Ptrend = P1 – P0
P0
This ratio enables managers to calculate the relative change between periods. For example:
Gross Loan Portfoliotrend = 1,500,000 – 1,250,000 = 20%1,250,000
This formula can also be used for ratios; for example:
FSStrend = 85% – 73% = 16%73%
The above formula indicates that Financial Self-Sufficiency (FSS) has increased relative to the previous period by 16 percent. For ratios, examining the absolute change between periods rather than the relative change is customary. The calculation for the absolute change is more commonly used when comparing ratios from two different periods. The following formula is used:
Rtrend = R1 – R0
In this case, the following result occurs:
FSStrend = 85% – 73% = 12%
This formula indicates that in absolute terms, FSS is 12 percent higher than the previous year. This convention is more customary for analyzing ratios.
When analyzing the changes in accounts or ratios, determining why the accounts or ratios are increasing or decreasing is important. For example, management should be familiar with seasonal trends, such as strong portfolio growth during a holiday season, to distinguish seasonal fluctuations from general business trends. An example is in box 5.1 below.
5.1.2 Variance Analysis
Variance analysis is accomplished by comparing actual performance to the MFI’s projected performance. This type of analysis is a powerful tool to measure management’s success or failure in
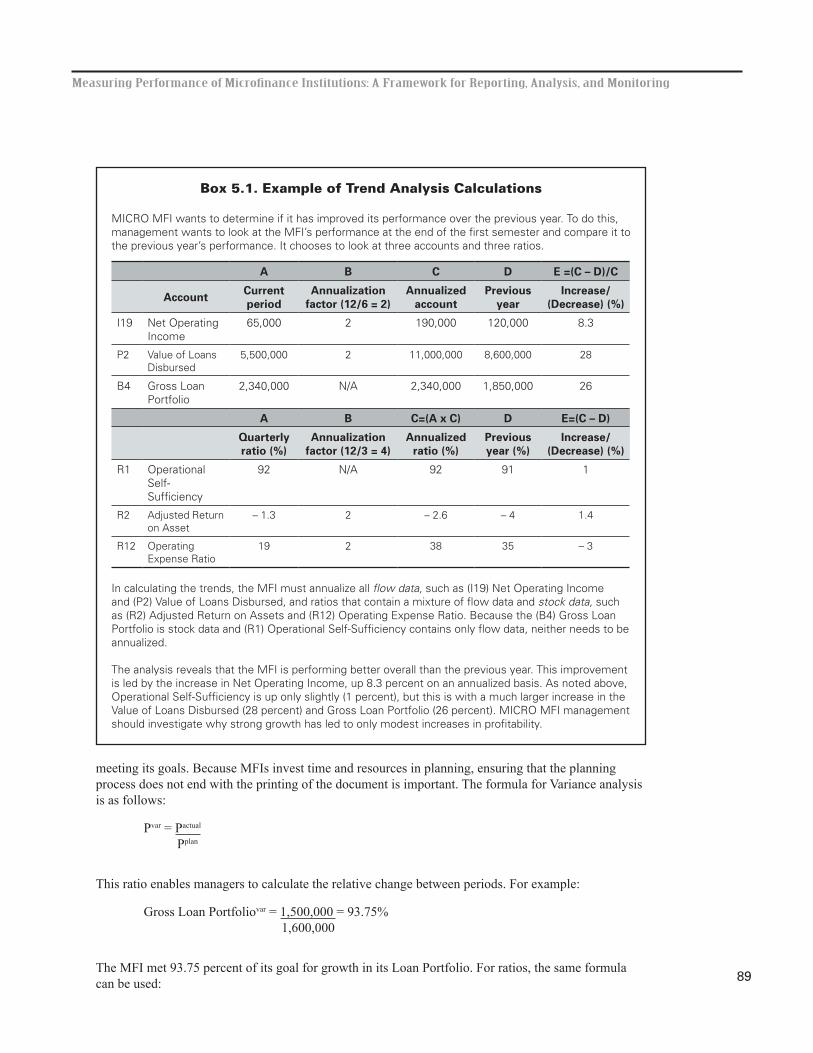
Measuring Performance of Microfinance Institutions: A Framework for Reporting, Analysis, and Monitoring
89
meeting its goals. Because MFIs invest time and resources in planning, ensuring that the planning process does not end with the printing of the document is important. The formula for Variance analysis is as follows:
Pvar = Pactual
Pplan
This ratio enables managers to calculate the relative change between periods. For example:
Gross Loan Portfoliovar = 1,500,000 = 93.75%1,600,000
The MFI met 93.75 percent of its goal for growth in its Loan Portfolio. For ratios, the same formula can be used:
Box 5.1. Example of Trend Analysis Calculations
MICRO MFI wants to determine if it has improved its performance over the previous year. To do this, management wants to look at the MFI’s performance at the end of the first semester and compare it to the previous year’s performance. It chooses to look at three accounts and three ratios.
A B C D E =(C – D)/C
Account Current period
Annualization factor (12/6 = 2)
Annualized account
Previous year
Increase/(Decrease) (%)
I19 Net Operating Income
65,000 2 190,000 120,000 8.3
P2 Value of Loans Disbursed
5,500,000 2 11,000,000 8,600,000 28
B4 Gross Loan Portfolio
2,340,000 N/A 2,340,000 1,850,000 26
A B C=(A x C) D E=(C – D)
Quarterly ratio (%)
Annualization factor (12/3 = 4)
Annualized ratio (%)
Previous year (%)
Increase/(Decrease) (%)
R1 Operational Self-Sufficiency
92 N/A 92 91 1
R2 Adjusted Return on Asset
– 1.3 2 – 2.6 – 4 1.4
R12 Operating Expense Ratio
19 2 38 35 – 3
In calculating the trends, the MFI must annualize all flow data, such as (I19) Net Operating Income and (P2) Value of Loans Disbursed, and ratios that contain a mixture of flow data and stock data, such as (R2) Adjusted Return on Assets and (R12) Operating Expense Ratio. Because the (B4) Gross Loan Portfolio is stock data and (R1) Operational Self-Sufficiency contains only flow data, neither needs to be annualized.
The analysis reveals that the MFI is performing better overall than the previous year. This improvement is led by the increase in Net Operating Income, up 8.3 percent on an annualized basis. As noted above, Operational Self-Sufficiency is up only slightly (1 percent), but this is with a much larger increase in the Value of Loans Disbursed (28 percent) and Gross Loan Portfolio (26 percent). MICRO MFI management should investigate why strong growth has led to only modest increases in profitability.
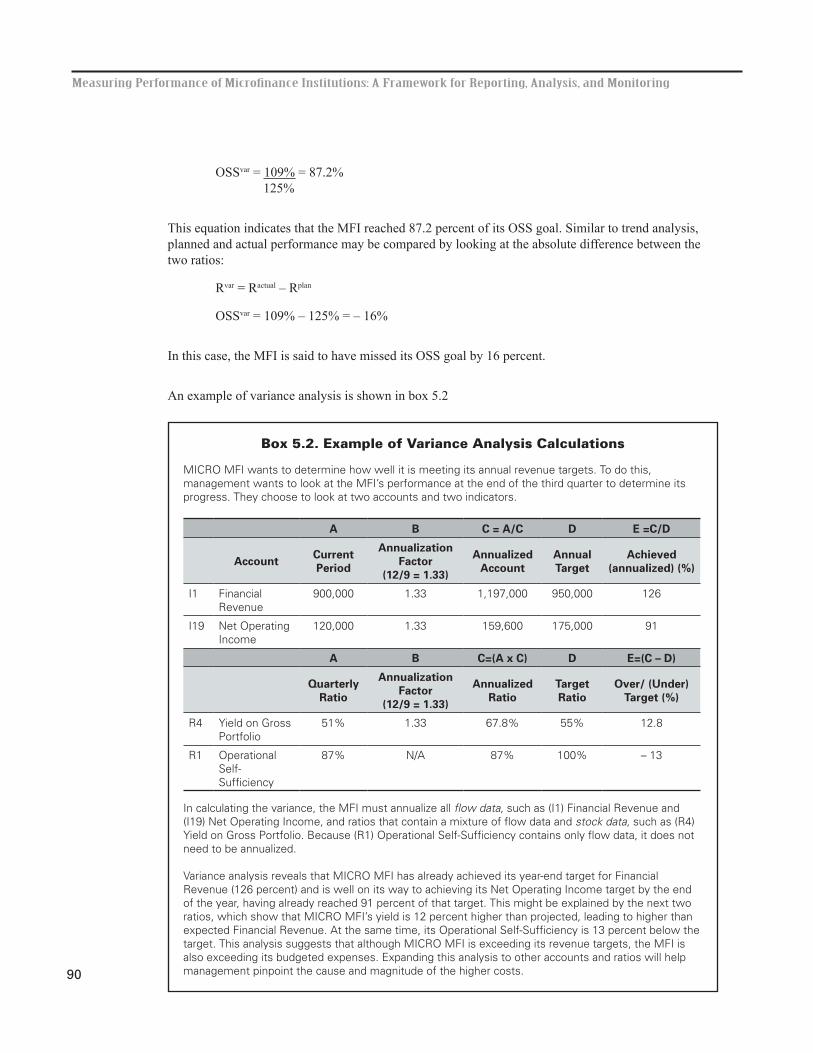
Measuring Performance of Microfinance Institutions: A Framework for Reporting, Analysis, and Monitoring
90
OSSvar = 109% = 87.2%125%
This equation indicates that the MFI reached 87.2 percent of its OSS goal. Similar to trend analysis, planned and actual performance may be compared by looking at the absolute difference between the two ratios:
Rvar = Ractual – Rplan
OSSvar = 109% – 125% = – 16%
In this case, the MFI is said to have missed its OSS goal by 16 percent.
An example of variance analysis is shown in box 5.2
Box 5.2. Example of Variance Analysis Calculations
MICRO MFI wants to determine how well it is meeting its annual revenue targets. To do this, management wants to look at the MFI’s performance at the end of the third quarter to determine its progress. They choose to look at two accounts and two indicators.
A B C = A/C D E =C/D
Account Current Period
Annualization Factor
(12/9 = 1.33)
Annualized Account
Annual Target
Achieved (annualized) (%)
I1 Financial Revenue
900,000 1.33 1,197,000 950,000 126
I19 Net Operating Income
120,000 1.33 159,600 175,000 91
A B C=(A x C) D E=(C – D)
Quarterly Ratio
Annualization Factor
(12/9 = 1.33)
Annualized Ratio
Target Ratio
Over/ (Under) Target (%)
R4 Yield on Gross Portfolio
51% 1.33 67.8% 55% 12.8
R1 Operational Self-Sufficiency
87% N/A 87% 100% – 13
In calculating the variance, the MFI must annualize all flow data, such as (I1) Financial Revenue and (I19) Net Operating Income, and ratios that contain a mixture of flow data and stock data, such as (R4) Yield on Gross Portfolio. Because (R1) Operational Self-Sufficiency contains only flow data, it does not need to be annualized.
Variance analysis reveals that MICRO MFI has already achieved its year-end target for Financial Revenue (126 percent) and is well on its way to achieving its Net Operating Income target by the end of the year, having already reached 91 percent of that target. This might be explained by the next two ratios, which show that MICRO MFI’s yield is 12 percent higher than projected, leading to higher than expected Financial Revenue. At the same time, its Operational Self-Sufficiency is 13 percent below the target. This analysis suggests that although MICRO MFI is exceeding its revenue targets, the MFI is also exceeding its budgeted expenses. Expanding this analysis to other accounts and ratios will help management pinpoint the cause and magnitude of the higher costs.
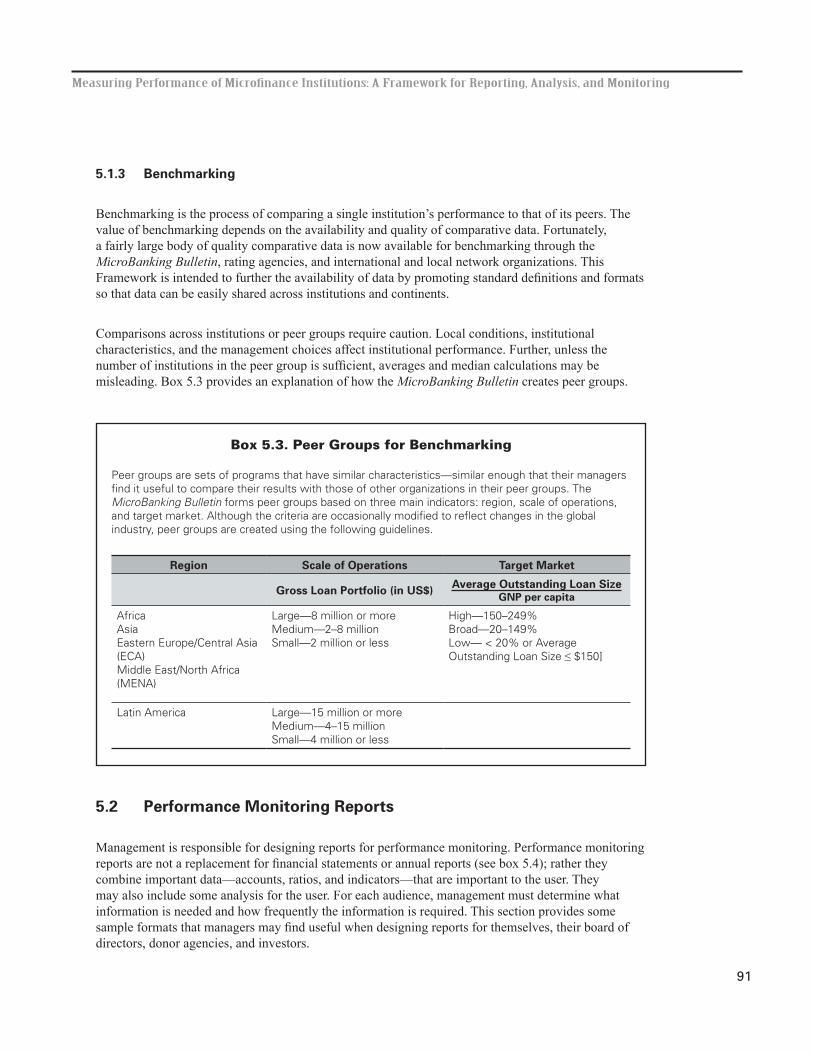
Measuring Performance of Microfinance Institutions: A Framework for Reporting, Analysis, and Monitoring
91
5.1.3 Benchmarking
Benchmarking is the process of comparing a single institution’s performance to that of its peers. The value of benchmarking depends on the availability and quality of comparative data. Fortunately, a fairly large body of quality comparative data is now available for benchmarking through the MicroBanking Bulletin, rating agencies, and international and local network organizations. This Framework is intended to further the availability of data by promoting standard definitions and formats so that data can be easily shared across institutions and continents.
Comparisons across institutions or peer groups require caution. Local conditions, institutional characteristics, and the management choices affect institutional performance. Further, unless the number of institutions in the peer group is sufficient, averages and median calculations may be misleading. Box 5.3 provides an explanation of how the MicroBanking Bulletin creates peer groups.
5.2 Performance Monitoring Reports
Management is responsible for designing reports for performance monitoring. Performance monitoring reports are not a replacement for financial statements or annual reports (see box 5.4); rather they combine important data—accounts, ratios, and indicators—that are important to the user. They may also include some analysis for the user. For each audience, management must determine what information is needed and how frequently the information is required. This section provides some sample formats that managers may find useful when designing reports for themselves, their board of directors, donor agencies, and investors.
Box 5.3. Peer Groups for Benchmarking
Peer groups are sets of programs that have similar characteristics—similar enough that their managers find it useful to compare their results with those of other organizations in their peer groups. The MicroBanking Bulletin forms peer groups based on three main indicators: region, scale of operations, and target market. Although the criteria are occasionally modified to reflect changes in the global industry, peer groups are created using the following guidelines.
Region Scale of Operations Target Market
Gross Loan Portfolio (in US$) Average Outstanding Loan SizeGNP per capita
AfricaAsiaEastern Europe/Central Asia (ECA)Middle East/North Africa (MENA)
Large—8 million or moreMedium—2–8 millionSmall—2 million or less
High—150–249%Broad—20–149%Low— < 20% or Average Outstanding Loan Size ≤ $150]
Latin America Large—15 million or moreMedium—4–15 millionSmall—4 million or less
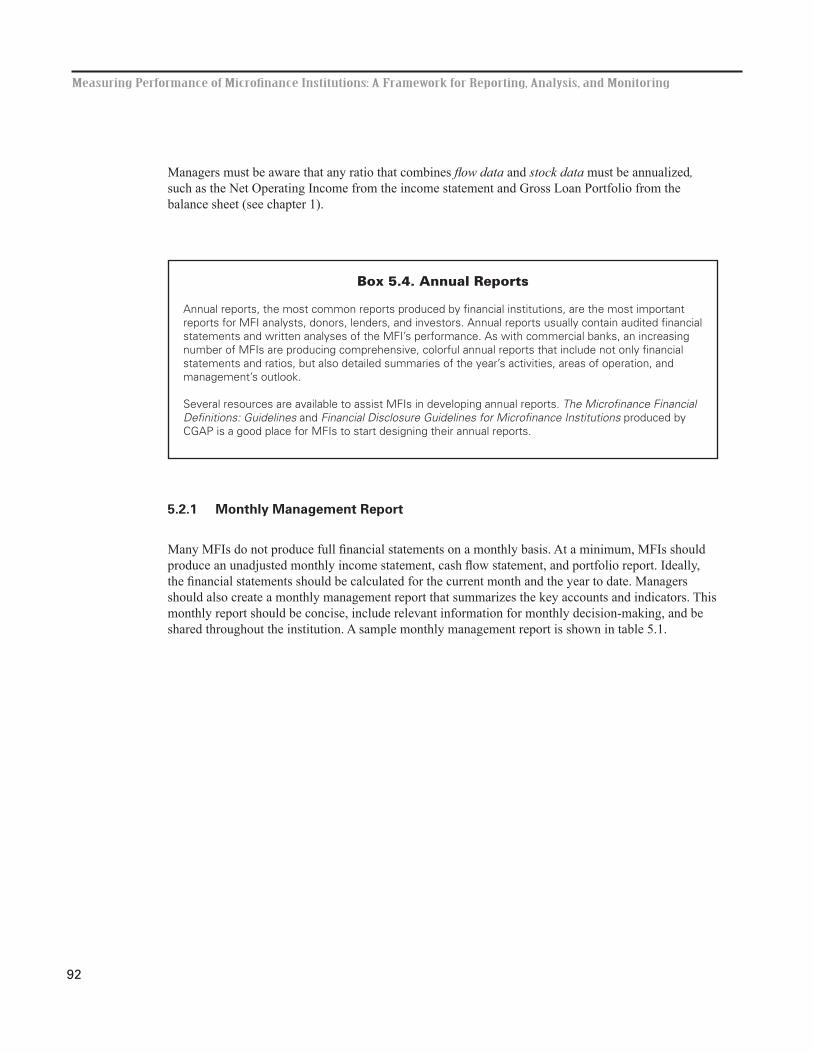
Measuring Performance of Microfinance Institutions: A Framework for Reporting, Analysis, and Monitoring
92
Managers must be aware that any ratio that combines flow data and stock data must be annualized, such as the Net Operating Income from the income statement and Gross Loan Portfolio from the balance sheet (see chapter 1).
5.2.1 Monthly Management Report
Many MFIs do not produce full financial statements on a monthly basis. At a minimum, MFIs should produce an unadjusted monthly income statement, cash flow statement, and portfolio report. Ideally, the financial statements should be calculated for the current month and the year to date. Managers should also create a monthly management report that summarizes the key accounts and indicators. This monthly report should be concise, include relevant information for monthly decision-making, and be shared throughout the institution. A sample monthly management report is shown in table 5.1.
Box 5.4. Annual Reports
Annual reports, the most common reports produced by financial institutions, are the most important reports for MFI analysts, donors, lenders, and investors. Annual reports usually contain audited financial statements and written analyses of the MFI’s performance. As with commercial banks, an increasing number of MFIs are producing comprehensive, colorful annual reports that include not only financial statements and ratios, but also detailed summaries of the year’s activities, areas of operation, and management’s outlook.
Several resources are available to assist MFIs in developing annual reports. The Microfinance Financial Definitions: Guidelines and Financial Disclosure Guidelines for Microfinance Institutions produced by CGAP is a good place for MFIs to start designing their annual reports.
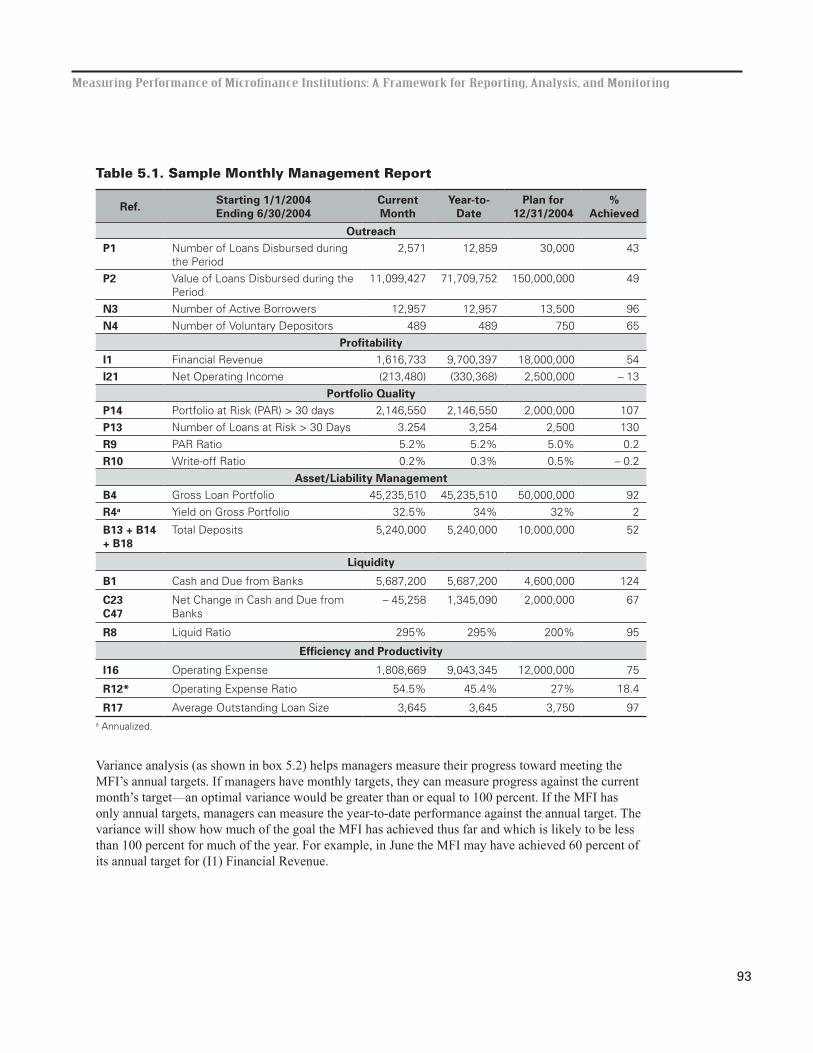
Measuring Performance of Microfinance Institutions: A Framework for Reporting, Analysis, and Monitoring
93
Table 5.1. Sample Monthly Management Report
Ref. Starting 1/1/2004Ending 6/30/2004
Current Month
Year-to-Date
Plan for 12/31/2004
% Achieved
OutreachP1 Number of Loans Disbursed during
the Period2,571 12,859 30,000 43
P2 Value of Loans Disbursed during the Period
11,099,427 71,709,752 150,000,000 49
N3 Number of Active Borrowers 12,957 12,957 13,500 96
N4 Number of Voluntary Depositors 489 489 750 65
ProfitabilityI1 Financial Revenue 1,616,733 9,700,397 18,000,000 54
I21 Net Operating Income (213,480) (330,368) 2,500,000 – 13
Portfolio QualityP14 Portfolio at Risk (PAR) > 30 days 2,146,550 2,146,550 2,000,000 107
P13 Number of Loans at Risk > 30 Days 3.254 3,254 2,500 130
R9 PAR Ratio 5.2% 5.2% 5.0% 0.2
R10 Write-off Ratio 0.2% 0.3% 0.5% – 0.2
Asset/Liability ManagementB4 Gross Loan Portfolio 45,235,510 45,235,510 50,000,000 92
R4a Yield on Gross Portfolio 32.5% 34% 32% 2
B13 + B14 + B18
Total Deposits 5,240,000 5,240,000 10,000,000 52
Liquidity
B1 Cash and Due from Banks 5,687,200 5,687,200 4,600,000 124
C23C47
Net Change in Cash and Due from Banks
– 45,258 1,345,090 2,000,000 67
R8 Liquid Ratio 295% 295% 200% 95
Efficiency and Productivity
I16 Operating Expense 1,808,669 9,043,345 12,000,000 75
R12* Operating Expense Ratio 54.5% 45.4% 27% 18.4
R17 Average Outstanding Loan Size 3,645 3,645 3,750 97a Annualized.
Variance analysis (as shown in box 5.2) helps managers measure their progress toward meeting the MFI’s annual targets. If managers have monthly targets, they can measure progress against the current month’s target—an optimal variance would be greater than or equal to 100 percent. If the MFI has only annual targets, managers can measure the year-to-date performance against the annual target. The variance will show how much of the goal the MFI has achieved thus far and which is likely to be less than 100 percent for much of the year. For example, in June the MFI may have achieved 60 percent of its annual target for (I1) Financial Revenue.
Measuring Performance of Microfinance Institutions: A Framework for Reporting, Analysis, and Monitoring
94
Due to fluctuations in monthly operations, trend analysis may not be the most useful management tool. Managers wanting to perform monthly trend analysis might learn more by comparing the current year-to-date data with the previous year-to-date data rather than the current and previous month. Conducting benchmarking analysis based on monthly results is difficult also because most comparable data sets are based on annual adjusted data.
5.2.2 Quarterly or Semiannual Management Reports
Managers should be able to create adjusted financial statements for every quarter and semester, including a portfolio report and a complete set of the SEEP 18 ratios. As with the monthly financial statements, the quarterly or semiannual income statement and cash flow statement should include the results for the quarter and the year-to-date. A useful analysis for quarterly or semiannual income statements is to divide each income statement account by (I1) Financial Revenue. This revenue analysis (presented in table 5.2) shows how much each revenue account contributes to Financial Revenue and how much of the Financial Revenue each expense account consumes.
MFI managers can also use the quarterly or semiannual balance sheet for asset allocation analysis. A good measure of MFI efficiency is how well it allocates its assets to earning assets—those which generate Financial Revenue, including the (B4) Gross Loan Portfolio, (B2) Trade Investments, and (B8) Other Investments. Managers can divide each balance sheet account by (B12) Total Assets to determine the allocation of assets. This calculation (shown in table 5.3) also reveals how these assets are funded, showing what percentage of assets are funded by each liability and equity account.
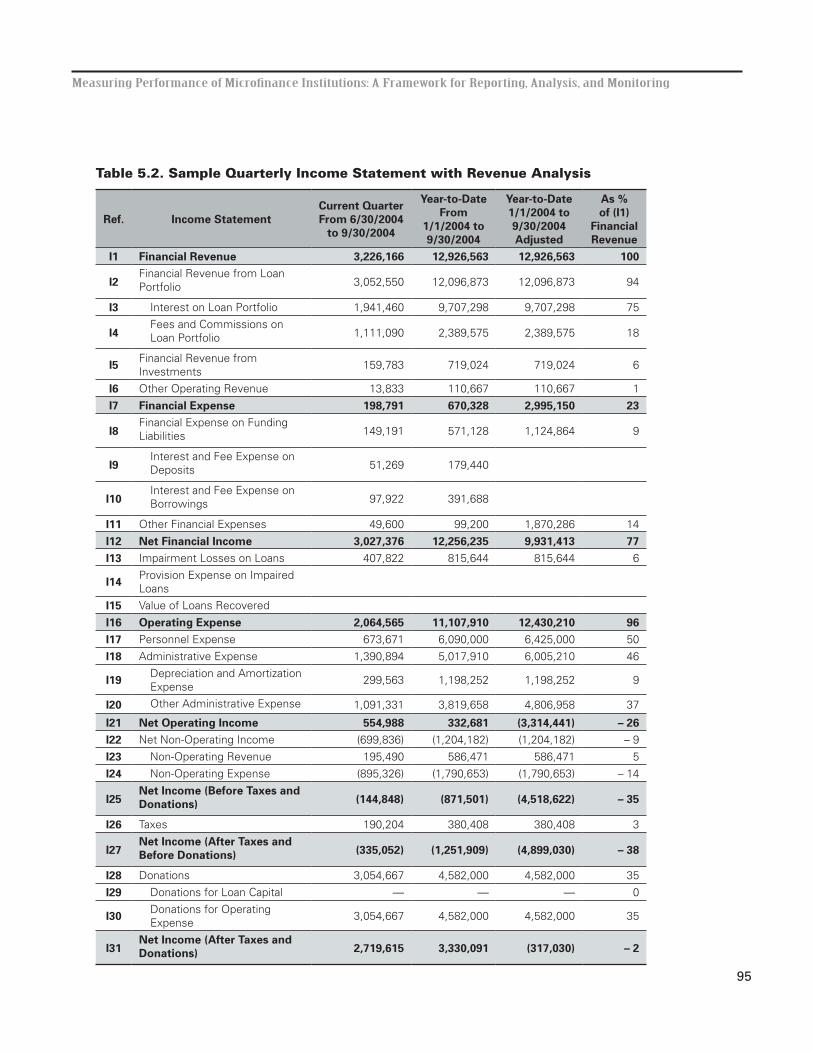
Measuring Performance of Microfinance Institutions: A Framework for Reporting, Analysis, and Monitoring
95
Table 5.2. Sample Quarterly Income Statement with Revenue Analysis
Ref. Income StatementCurrent QuarterFrom 6/30/2004
to 9/30/2004
Year-to-DateFrom
1/1/2004 to 9/30/2004
Year-to-Date1/1/2004 to 9/30/2004Adjusted
As % of (I1)
Financial Revenue
I1 Financial Revenue 3,226,166 12,926,563 12,926,563 100
I2Financial Revenue from Loan Portfolio 3,052,550 12,096,873 12,096,873 94
I3 Interest on Loan Portfolio 1,941,460 9,707,298 9,707,298 75
I4 Fees and Commissions on Loan Portfolio 1,111,090 2,389,575 2,389,575 18
I5 Financial Revenue from Investments
159,783 719,024 719,024 6
I6 Other Operating Revenue 13,833 110,667 110,667 1
I7 Financial Expense 198,791 670,328 2,995,150 23
I8Financial Expense on Funding Liabilities 149,191 571,128 1,124,864 9
I9 Interest and Fee Expense on Deposits 51,269 179,440
I10 Interest and Fee Expense on Borrowings 97,922 391,688
I11 Other Financial Expenses 49,600 99,200 1,870,286 14
I12 Net Financial Income 3,027,376 12,256,235 9,931,413 77I13 Impairment Losses on Loans 407,822 815,644 815,644 6
I14 Provision Expense on Impaired Loans
I15 Value of Loans Recovered
I16 Operating Expense 2,064,565 11,107,910 12,430,210 96I17 Personnel Expense 673,671 6,090,000 6,425,000 50
I18 Administrative Expense 1,390,894 5,017,910 6,005,210 46
I19 Depreciation and Amortization Expense
299,563 1,198,252 1,198,252 9
I20 Other Administrative Expense 1,091,331 3,819,658 4,806,958 37
I21 Net Operating Income 554,988 332,681 (3,314,441) – 26I22 Net Non-Operating Income (699,836) (1,204,182) (1,204,182) – 9
I23 Non-Operating Revenue 195,490 586,471 586,471 5
I24 Non-Operating Expense (895,326) (1,790,653) (1,790,653) – 14
I25Net Income (Before Taxes and Donations) (144,848) (871,501) (4,518,622) – 35
I26 Taxes 190,204 380,408 380,408 3
I27Net Income (After Taxes and Before Donations) (335,052) (1,251,909) (4,899,030) – 38
I28 Donations 3,054,667 4,582,000 4,582,000 35
I29 Donations for Loan Capital — — — 0
I30 Donations for Operating Expense
3,054,667 4,582,000 4,582,000 35
I31Net Income (After Taxes and Donations) 2,719,615 3,330,091 (317,030) – 2
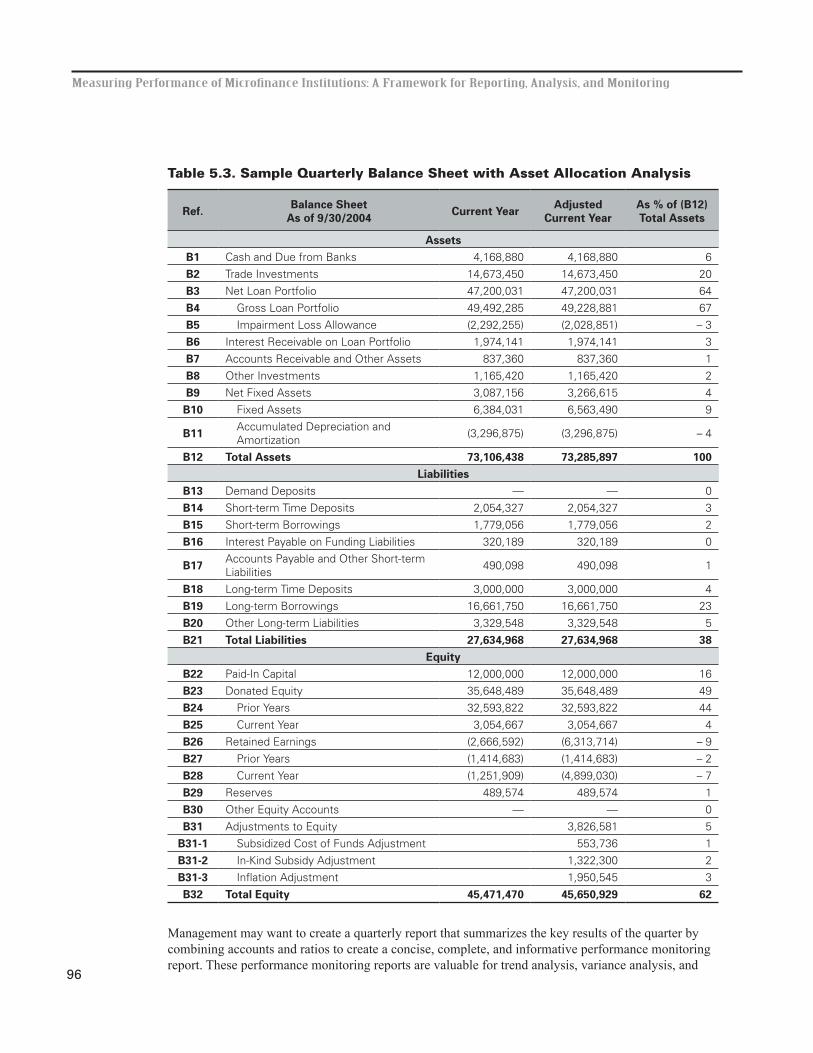
Measuring Performance of Microfinance Institutions: A Framework for Reporting, Analysis, and Monitoring
96
Table 5.3. Sample Quarterly Balance Sheet with Asset Allocation Analysis
Ref. Balance SheetAs of 9/30/2004 Current Year Adjusted
Current YearAs % of (B12) Total Assets
AssetsB1 Cash and Due from Banks 4,168,880 4,168,880 6
B2 Trade Investments 14,673,450 14,673,450 20
B3 Net Loan Portfolio 47,200,031 47,200,031 64
B4 Gross Loan Portfolio 49,492,285 49,228,881 67
B5 Impairment Loss Allowance (2,292,255) (2,028,851) – 3
B6 Interest Receivable on Loan Portfolio 1,974,141 1,974,141 3
B7 Accounts Receivable and Other Assets 837,360 837,360 1
B8 Other Investments 1,165,420 1,165,420 2
B9 Net Fixed Assets 3,087,156 3,266,615 4
B10 Fixed Assets 6,384,031 6,563,490 9
B11 Accumulated Depreciation and Amortization
(3,296,875) (3,296,875) – 4
B12 Total Assets 73,106,438 73,285,897 100Liabilities
B13 Demand Deposits — — 0
B14 Short-term Time Deposits 2,054,327 2,054,327 3
B15 Short-term Borrowings 1,779,056 1,779,056 2
B16 Interest Payable on Funding Liabilities 320,189 320,189 0
B17 Accounts Payable and Other Short-term Liabilities
490,098 490,098 1
B18 Long-term Time Deposits 3,000,000 3,000,000 4
B19 Long-term Borrowings 16,661,750 16,661,750 23
B20 Other Long-term Liabilities 3,329,548 3,329,548 5
B21 Total Liabilities 27,634,968 27,634,968 38Equity
B22 Paid-In Capital 12,000,000 12,000,000 16
B23 Donated Equity 35,648,489 35,648,489 49
B24 Prior Years 32,593,822 32,593,822 44
B25 Current Year 3,054,667 3,054,667 4
B26 Retained Earnings (2,666,592) (6,313,714) – 9
B27 Prior Years (1,414,683) (1,414,683) – 2
B28 Current Year (1,251,909) (4,899,030) – 7
B29 Reserves 489,574 489,574 1
B30 Other Equity Accounts — — 0
B31 Adjustments to Equity 3,826,581 5
B31-1 Subsidized Cost of Funds Adjustment 553,736 1
B31-2 In-Kind Subsidy Adjustment 1,322,300 2
B31-3 Inflation Adjustment 1,950,545 3
B32 Total Equity 45,471,470 45,650,929 62
Management may want to create a quarterly report that summarizes the key results of the quarter by combining accounts and ratios to create a concise, complete, and informative performance monitoring report. These performance monitoring reports are valuable for trend analysis, variance analysis, and
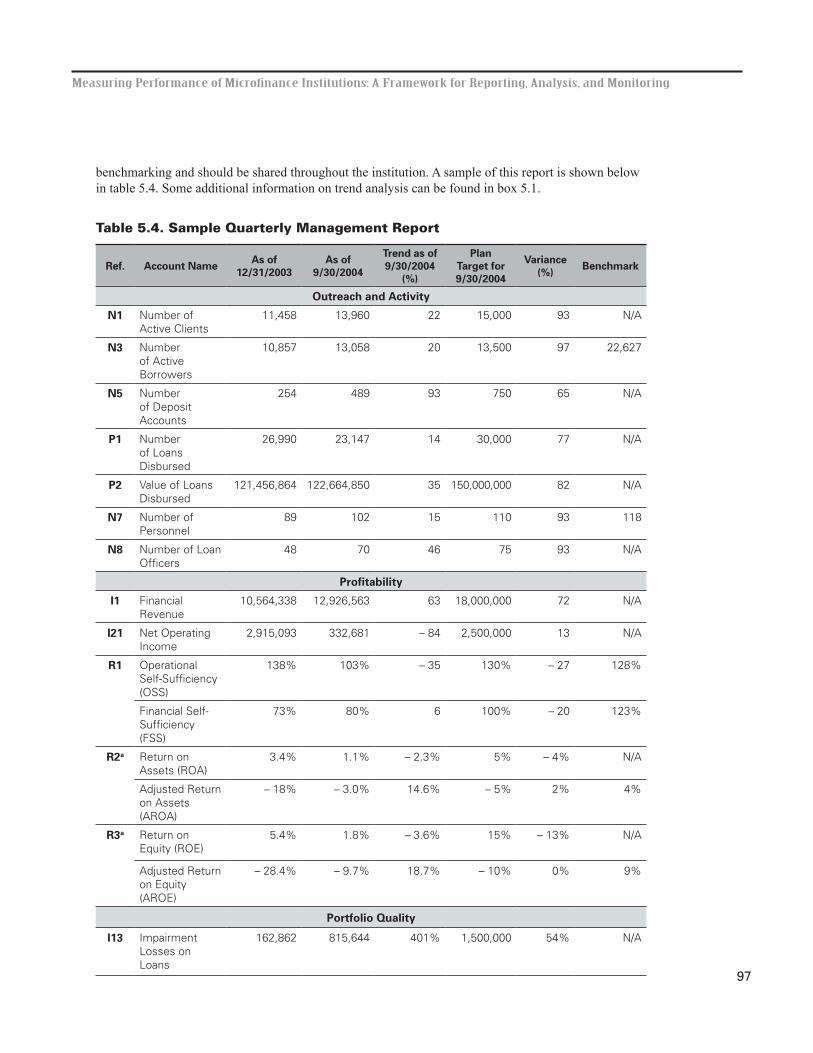
Measuring Performance of Microfinance Institutions: A Framework for Reporting, Analysis, and Monitoring
97
benchmarking and should be shared throughout the institution. A sample of this report is shown below in table 5.4. Some additional information on trend analysis can be found in box 5.1.
Table 5.4. Sample Quarterly Management Report
Ref. Account Name As of 12/31/2003
As of 9/30/2004
Trend as of 9/30/2004
(%)
Plan Target for 9/30/2004
Variance (%) Benchmark
Outreach and Activity
N1 Number of Active Clients
11,458 13,960 22 15,000 93 N/A
N3 Number of Active Borrowers
10,857 13,058 20 13,500 97 22,627
N5 Number of Deposit Accounts
254 489 93 750 65 N/A
P1 Number of Loans Disbursed
26,990 23,147 14 30,000 77 N/A
P2 Value of Loans Disbursed
121,456,864 122,664,850 35 150,000,000 82 N/A
N7 Number of Personnel
89 102 15 110 93 118
N8 Number of Loan Officers
48 70 46 75 93 N/A
Profitability
I1 Financial Revenue
10,564,338 12,926,563 63 18,000,000 72 N/A
I21 Net Operating Income
2,915,093 332,681 – 84 2,500,000 13 N/A
R1 Operational Self-Sufficiency (OSS)
138% 103% – 35 130% – 27 128%
Financial Self-Sufficiency (FSS)
73% 80% 6 100% – 20 123%
R2a Return on Assets (ROA)
3.4% 1.1% – 2.3% 5% – 4% N/A
Adjusted Return on Assets (AROA)
– 18% – 3.0% 14.6% – 5% 2% 4%
R3a Return on Equity (ROE)
5.4% 1.8% – 3.6% 15% – 13% N/A
Adjusted Return on Equity (AROE)
– 28.4% – 9.7% 18.7% – 10% 0% 9%
Portfolio Quality
I13 Impairment Losses on Loans
162,862 815,644 401% 1,500,000 54% N/A
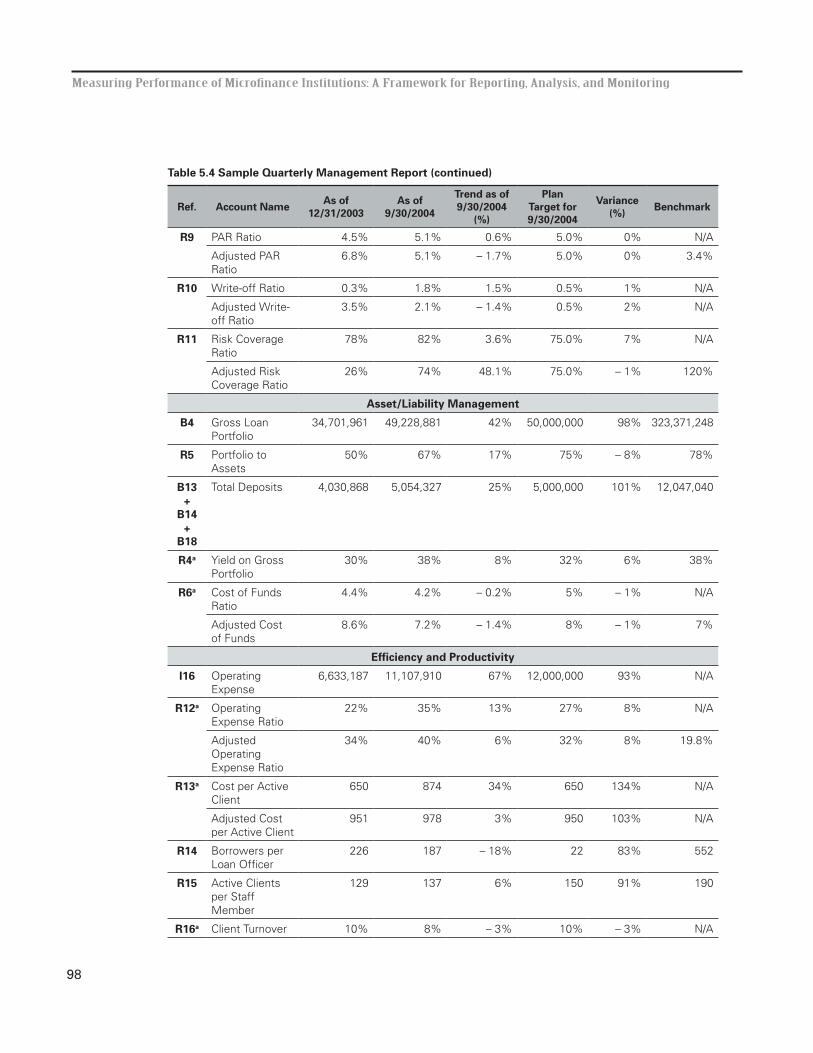
Measuring Performance of Microfinance Institutions: A Framework for Reporting, Analysis, and Monitoring
98
Ref. Account Name As of 12/31/2003
As of 9/30/2004
Trend as of 9/30/2004
(%)
Plan Target for 9/30/2004
Variance (%) Benchmark
R9 PAR Ratio 4.5% 5.1% 0.6% 5.0% 0% N/A
Adjusted PAR Ratio
6.8% 5.1% – 1.7% 5.0% 0% 3.4%
R10 Write-off Ratio 0.3% 1.8% 1.5% 0.5% 1% N/A
Adjusted Write-off Ratio
3.5% 2.1% – 1.4% 0.5% 2% N/A
R11 Risk Coverage Ratio
78% 82% 3.6% 75.0% 7% N/A
Adjusted Risk Coverage Ratio
26% 74% 48.1% 75.0% – 1% 120%
Asset/Liability Management
B4 Gross Loan Portfolio
34,701,961 49,228,881 42% 50,000,000 98% 323,371,248
R5 Portfolio to Assets
50% 67% 17% 75% – 8% 78%
B13 +
B14 +
B18
Total Deposits 4,030,868 5,054,327 25% 5,000,000 101% 12,047,040
R4a Yield on Gross Portfolio
30% 38% 8% 32% 6% 38%
R6a Cost of Funds Ratio
4.4% 4.2% – 0.2% 5% – 1% N/A
Adjusted Cost of Funds
8.6% 7.2% – 1.4% 8% – 1% 7%
Efficiency and Productivity
I16 Operating Expense
6,633,187 11,107,910 67% 12,000,000 93% N/A
R12a Operating Expense Ratio
22% 35% 13% 27% 8% N/A
Adjusted Operating Expense Ratio
34% 40% 6% 32% 8% 19.8%
R13a Cost per Active Client
650 874 34% 650 134% N/A
Adjusted Cost per Active Client
951 978 3% 950 103% N/A
R14 Borrowers per Loan Officer
226 187 – 18% 22 83% 552
R15 Active Clients per Staff Member
129 137 6% 150 91% 190
R16a Client Turnover 10% 8% – 3% 10% – 3% N/A
Table 5.4 Sample Quarterly Management Report (continued)
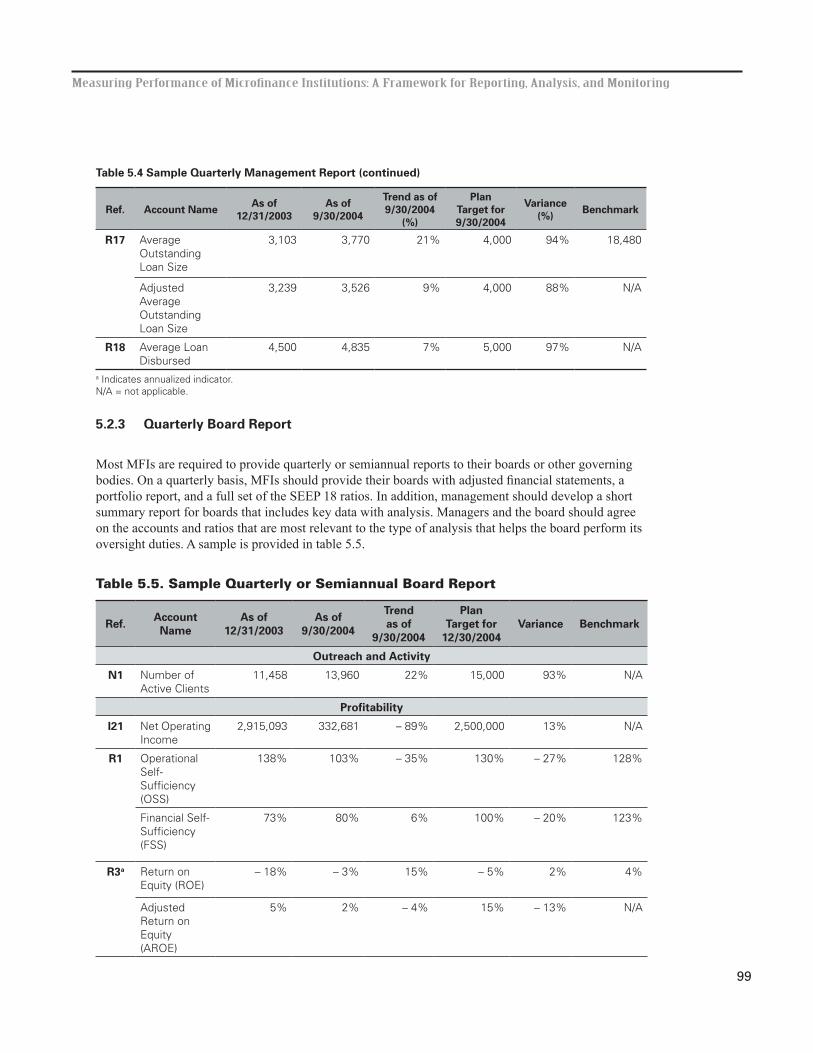
Measuring Performance of Microfinance Institutions: A Framework for Reporting, Analysis, and Monitoring
99
Ref. Account Name As of 12/31/2003
As of 9/30/2004
Trend as of 9/30/2004
(%)
Plan Target for 9/30/2004
Variance (%) Benchmark
R17 Average Outstanding Loan Size
3,103 3,770 21% 4,000 94% 18,480
Adjusted Average Outstanding Loan Size
3,239 3,526 9% 4,000 88% N/A
R18 Average Loan Disbursed
4,500 4,835 7% 5,000 97% N/A
a Indicates annualized indicator.N/A = not applicable.
5.2.3 Quarterly Board Report
Most MFIs are required to provide quarterly or semiannual reports to their boards or other governing bodies. On a quarterly basis, MFIs should provide their boards with adjusted financial statements, a portfolio report, and a full set of the SEEP 18 ratios. In addition, management should develop a short summary report for boards that includes key data with analysis. Managers and the board should agree on the accounts and ratios that are most relevant to the type of analysis that helps the board perform its oversight duties. A sample is provided in table 5.5.
Table 5.5. Sample Quarterly or Semiannual Board Report
Ref. Account Name
As of 12/31/2003
As of 9/30/2004
Trendas of
9/30/2004
Plan Target for
12/30/2004Variance Benchmark
Outreach and Activity
N1 Number of Active Clients
11,458 13,960 22% 15,000 93% N/A
Profitability
I21 Net Operating Income
2,915,093 332,681 – 89% 2,500,000 13% N/A
R1 Operational Self-Sufficiency (OSS)
138% 103% – 35% 130% – 27% 128%
Financial Self-Sufficiency (FSS)
73% 80% 6% 100% – 20% 123%
R3a Return on Equity (ROE)
– 18% – 3% 15% – 5% 2% 4%
Adjusted Return on Equity (AROE)
5% 2% – 4% 15% – 13% N/A
Table 5.4 Sample Quarterly Management Report (continued)
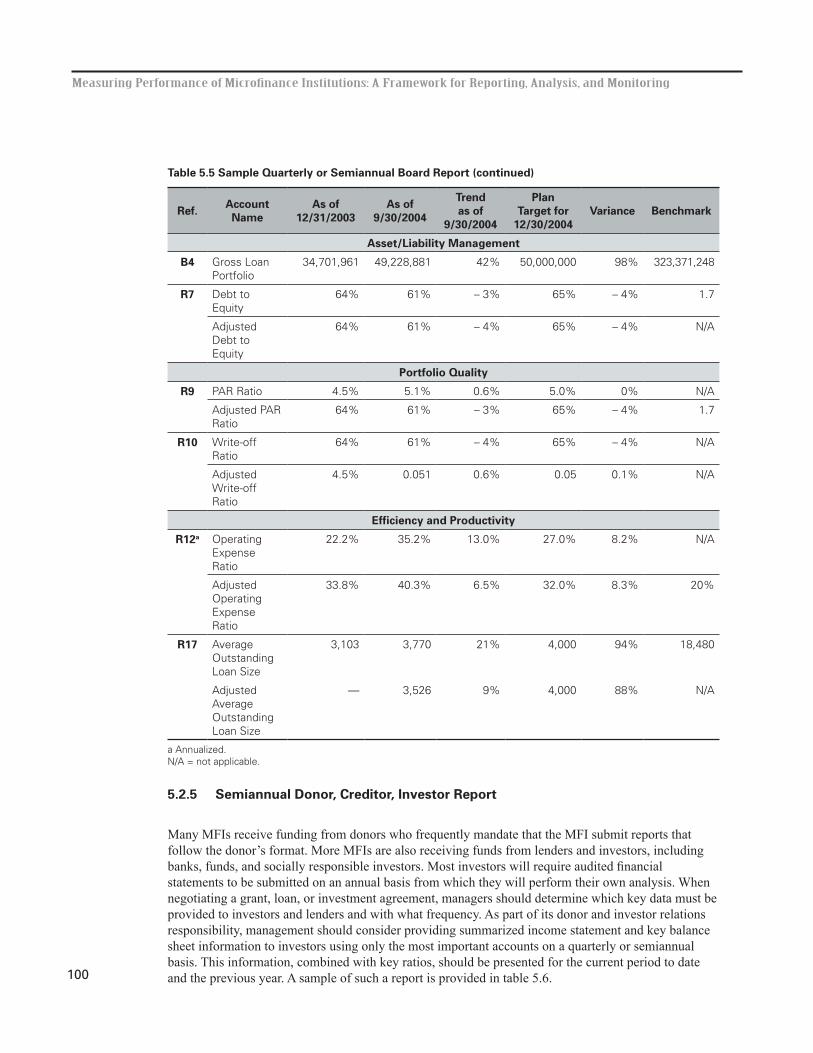
Measuring Performance of Microfinance Institutions: A Framework for Reporting, Analysis, and Monitoring
100
Ref. Account Name
As of 12/31/2003
As of 9/30/2004
Trendas of
9/30/2004
Plan Target for
12/30/2004Variance Benchmark
Asset/Liability Management
B4 Gross Loan Portfolio
34,701,961 49,228,881 42% 50,000,000 98% 323,371,248
R7 Debt to Equity
64% 61% – 3% 65% – 4% 1.7
Adjusted Debt to Equity
64% 61% – 4% 65% – 4% N/A
Portfolio Quality
R9 PAR Ratio 4.5% 5.1% 0.6% 5.0% 0% N/A
Adjusted PAR Ratio
64% 61% – 3% 65% – 4% 1.7
R10 Write-off Ratio
64% 61% – 4% 65% – 4% N/A
Adjusted Write-off Ratio
4.5% 0.051 0.6% 0.05 0.1% N/A
Efficiency and Productivity
R12a Operating Expense Ratio
22.2% 35.2% 13.0% 27.0% 8.2% N/A
Adjusted Operating Expense Ratio
33.8% 40.3% 6.5% 32.0% 8.3% 20%
R17 Average Outstanding Loan Size
3,103 3,770 21% 4,000 94% 18,480
Adjusted Average Outstanding Loan Size
— 3,526 9% 4,000 88% N/A
a Annualized. N/A = not applicable.
5.2.5 Semiannual Donor, Creditor, Investor Report
Many MFIs receive funding from donors who frequently mandate that the MFI submit reports that follow the donor’s format. More MFIs are also receiving funds from lenders and investors, including banks, funds, and socially responsible investors. Most investors will require audited financial statements to be submitted on an annual basis from which they will perform their own analysis. When negotiating a grant, loan, or investment agreement, managers should determine which key data must be provided to investors and lenders and with what frequency. As part of its donor and investor relations responsibility, management should consider providing summarized income statement and key balance sheet information to investors using only the most important accounts on a quarterly or semiannual basis. This information, combined with key ratios, should be presented for the current period to date and the previous year. A sample of such a report is provided in table 5.6.
Table 5.5 Sample Quarterly or Semiannual Board Report (continued)
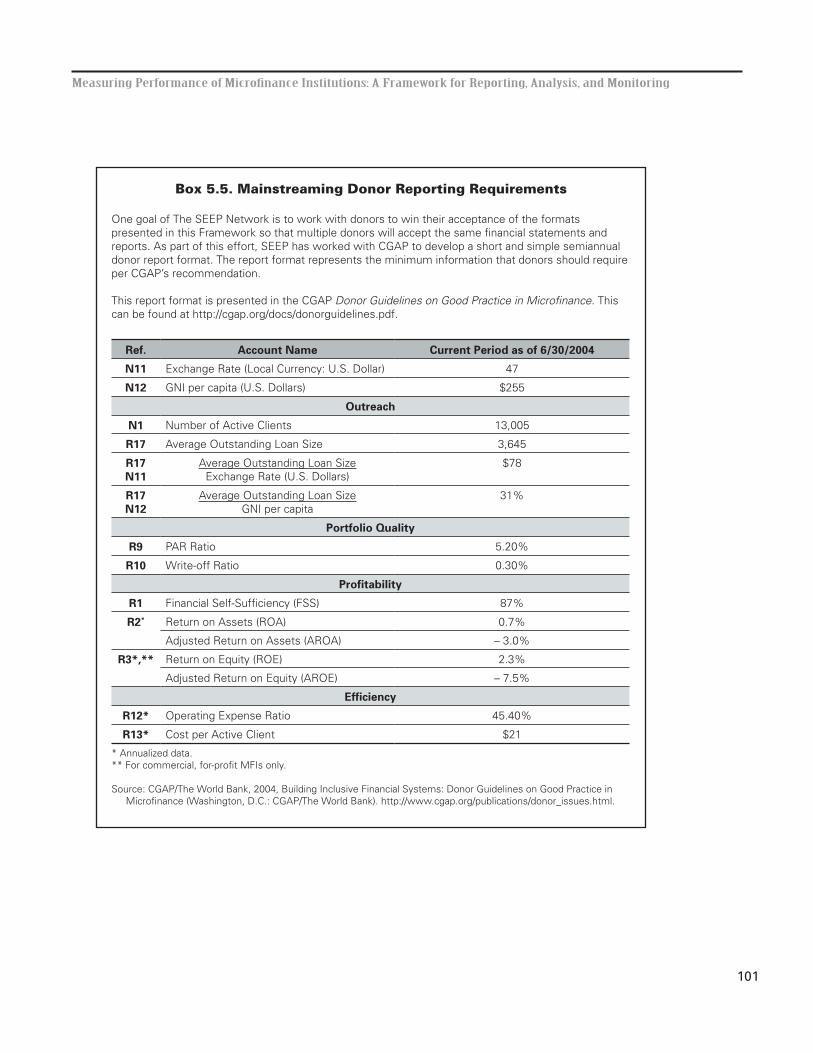
Measuring Performance of Microfinance Institutions: A Framework for Reporting, Analysis, and Monitoring
101
Box 5.5. Mainstreaming Donor Reporting Requirements
One goal of The SEEP Network is to work with donors to win their acceptance of the formats presented in this Framework so that multiple donors will accept the same financial statements and reports. As part of this effort, SEEP has worked with CGAP to develop a short and simple semiannual donor report format. The report format represents the minimum information that donors should require per CGAP’s recommendation.
This report format is presented in the CGAP Donor Guidelines on Good Practice in Microfinance. This can be found at http://cgap.org/docs/donorguidelines.pdf.
Ref. Account Name Current Period as of 6/30/2004
N11 Exchange Rate (Local Currency: U.S. Dollar) 47
N12 GNI per capita (U.S. Dollars) $255
Outreach
N1 Number of Active Clients 13,005
R17 Average Outstanding Loan Size 3,645
R17N11
Average Outstanding Loan SizeExchange Rate (U.S. Dollars)
$78
R17N12
Average Outstanding Loan SizeGNI per capita
31%
Portfolio Quality
R9 PAR Ratio 5.20%
R10 Write-off Ratio 0.30%
Profitability
R1 Financial Self-Sufficiency (FSS) 87%
R2* Return on Assets (ROA) 0.7%
Adjusted Return on Assets (AROA) – 3.0%
R3*,** Return on Equity (ROE) 2.3%
Adjusted Return on Equity (AROE) – 7.5%
Efficiency
R12* Operating Expense Ratio 45.40%
R13* Cost per Active Client $21
* Annualized data.** For commercial, for-profit MFIs only.
Source: CGAP/The World Bank, 2004, Building Inclusive Financial Systems: Donor Guidelines on Good Practice in Microfinance (Washington, D.C.: CGAP/The World Bank). http://www.cgap.org/publications/donor_issues.html.
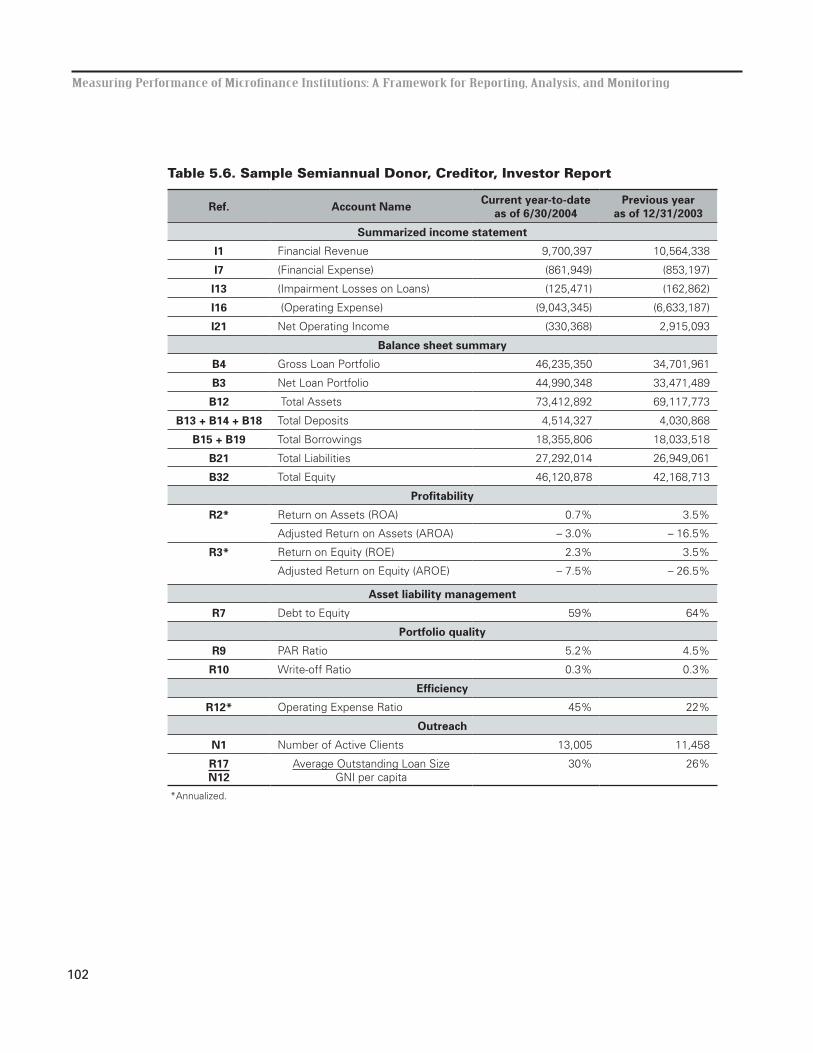
Measuring Performance of Microfinance Institutions: A Framework for Reporting, Analysis, and Monitoring
102
Table 5.6. Sample Semiannual Donor, Creditor, Investor Report
Ref. Account Name Current year-to-dateas of 6/30/2004
Previous yearas of 12/31/2003
Summarized income statement
I1 Financial Revenue 9,700,397 10,564,338
I7 (Financial Expense) (861,949) (853,197)
I13 (Impairment Losses on Loans) (125,471) (162,862)
I16 (Operating Expense) (9,043,345) (6,633,187)
I21 Net Operating Income (330,368) 2,915,093
Balance sheet summary
B4 Gross Loan Portfolio 46,235,350 34,701,961
B3 Net Loan Portfolio 44,990,348 33,471,489
B12 Total Assets 73,412,892 69,117,773
B13 + B14 + B18 Total Deposits 4,514,327 4,030,868
B15 + B19 Total Borrowings 18,355,806 18,033,518
B21 Total Liabilities 27,292,014 26,949,061
B32 Total Equity 46,120,878 42,168,713
Profitability
R2* Return on Assets (ROA) 0.7% 3.5%
Adjusted Return on Assets (AROA) – 3.0% – 16.5%
R3* Return on Equity (ROE) 2.3% 3.5%
Adjusted Return on Equity (AROE) – 7.5% – 26.5%
Asset liability management
R7 Debt to Equity 59% 64%
Portfolio quality
R9 PAR Ratio 5.2% 4.5%
R10 Write-off Ratio 0.3% 0.3%
Efficiency
R12* Operating Expense Ratio 45% 22%
Outreach
N1 Number of Active Clients 13,005 11,458
R17N12
Average Outstanding Loan SizeGNI per capita
30% 26%
*Annualized.
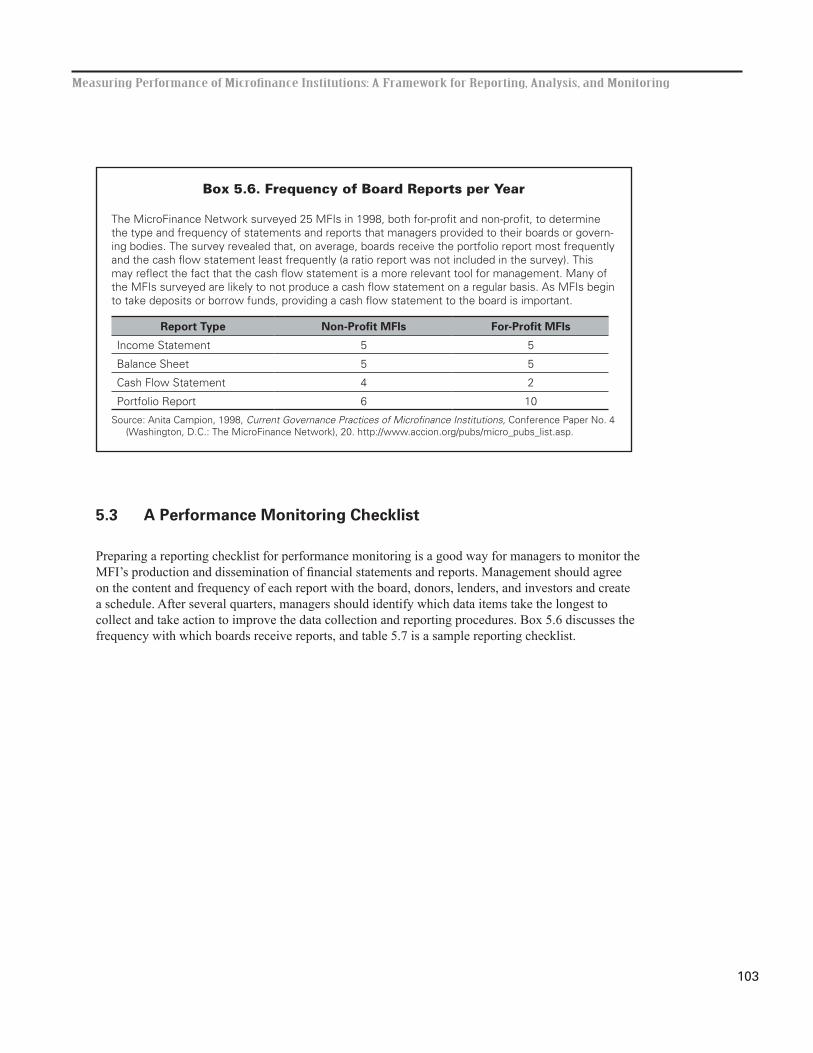
Measuring Performance of Microfinance Institutions: A Framework for Reporting, Analysis, and Monitoring
103
5.3 A Performance Monitoring Checklist
Preparing a reporting checklist for performance monitoring is a good way for managers to monitor the MFI’s production and dissemination of financial statements and reports. Management should agree on the content and frequency of each report with the board, donors, lenders, and investors and create a schedule. After several quarters, managers should identify which data items take the longest to collect and take action to improve the data collection and reporting procedures. Box 5.6 discusses the frequency with which boards receive reports, and table 5.7 is a sample reporting checklist.
Box 5.6. Frequency of Board Reports per Year
The MicroFinance Network surveyed 25 MFIs in 1998, both for-profit and non-profit, to determine the type and frequency of statements and reports that managers provided to their boards or govern-ing bodies. The survey revealed that, on average, boards receive the portfolio report most frequently and the cash flow statement least frequently (a ratio report was not included in the survey). This may reflect the fact that the cash flow statement is a more relevant tool for management. Many of the MFIs surveyed are likely to not produce a cash flow statement on a regular basis. As MFIs begin to take deposits or borrow funds, providing a cash flow statement to the board is important.
Report Type Non-Profit MFIs For-Profit MFIs
Income Statement 5 5
Balance Sheet 5 5
Cash Flow Statement 4 2
Portfolio Report 6 10
Source: Anita Campion, 1998, Current Governance Practices of Microfinance Institutions, Conference Paper No. 4 (Washington, D.C.: The MicroFinance Network), 20. http://www.accion.org/pubs/micro_pubs_list.asp.
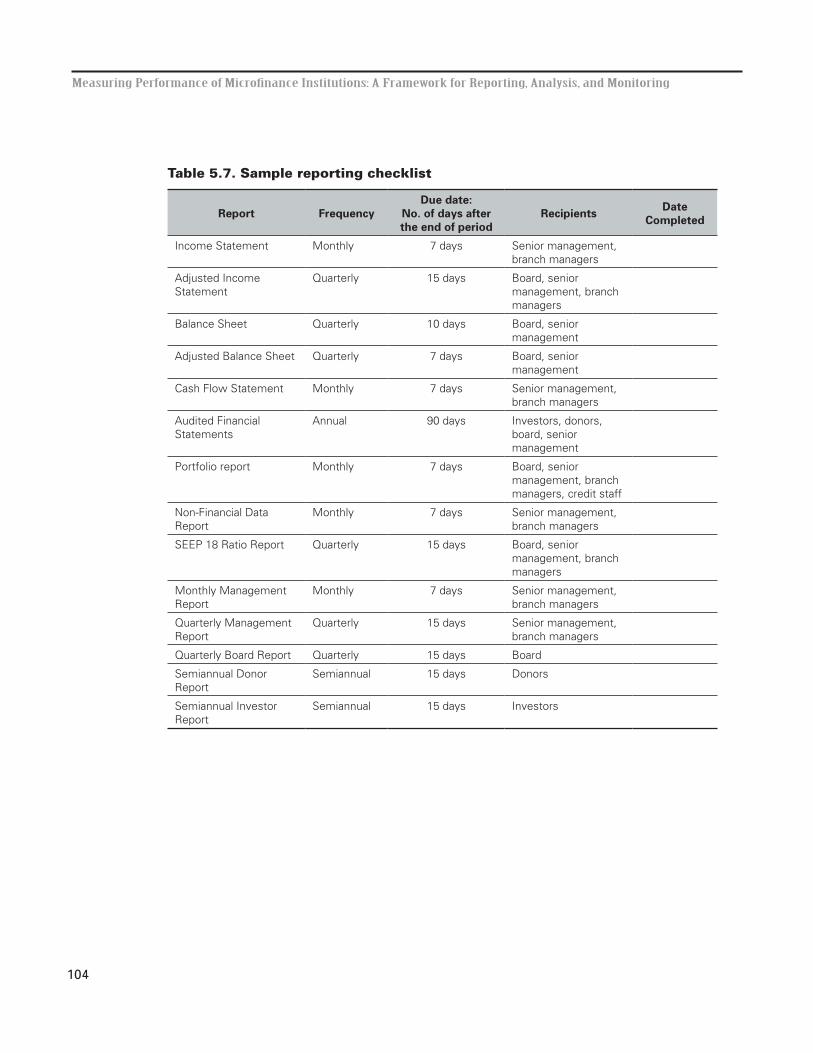
Measuring Performance of Microfinance Institutions: A Framework for Reporting, Analysis, and Monitoring
104
Table 5.7. Sample reporting checklist
Report FrequencyDue date:
No. of days after the end of period
Recipients Date Completed
Income Statement Monthly 7 days Senior management,branch managers
Adjusted Income Statement
Quarterly 15 days Board, senior management, branch managers
Balance Sheet Quarterly 10 days Board, senior management
Adjusted Balance Sheet Quarterly 7 days Board, senior management
Cash Flow Statement Monthly 7 days Senior management,branch managers
Audited Financial Statements
Annual 90 days Investors, donors, board, senior management
Portfolio report Monthly 7 days Board, senior management, branch managers, credit staff
Non-Financial Data Report
Monthly 7 days Senior management,branch managers
SEEP 18 Ratio Report Quarterly 15 days Board, senior management, branch managers
Monthly Management Report
Monthly 7 days Senior management,branch managers
Quarterly Management Report
Quarterly 15 days Senior management,branch managers
Quarterly Board Report Quarterly 15 days Board
Semiannual Donor Report
Semiannual 15 days Donors
Semiannual Investor Report
Semiannual 15 days Investors
Measuring Performance of Microfinance Institutions: A Framework for Reporting, Analysis, and Monitoring
105
6Glossary
Account Name Definition
allowance A balance sheet contra account used to show the estimated amount of receivables that an institution does not expect to collect. When presented against the gross receivable account, the allowance enables the institution to estimate the amount of receivables that it expects to collect.
arrears The principal due but unpaid for all loans that have one or more installments of principal past due by one or more days.
asset quality An indication of the level of risk inherent in the organization’s assets based on the likelihood that these assets will be lost and no longer produce future economic benefits.
assets As defined by the International Accounting Standards (IAS), a resource controlled by an institution as a result of past events and from which future economic benefits are expected to flow to the institution.
balance sheet A stock statement that shows the financial position of the institution at a point in time, including its economic resources, claims on those resources, and the residual interest in them.
cash flow statement A flow statement that summarizes the inflows and outflows of cash for an institution over a given period.
contra asset account A negative asset account that accumulates subtractions from another asset account. See also allowance.
deposit rate As defined by the International Monetary Fund (IMF), the deposit rate “usually refers to rates offered to resident customers for demand, time, and savings deposits.”
direct method cash flow statement
The presentation of cash receipts and payments made over a given period. This presentation of sources and uses of cash is often divided by operating, investing, and financing activities to determine the use of cash in each of these areas.
equity As defined by IAS, the residual interest in the assets of an institution after deducting all its liabilities.
expenses As defined by IAS, decreases in economic benefits during the accounting period in the form of outflows, depletions of assets, or incurred liabilities that result in decreases in equity other than those relating to distributions to equity participants.
financial position As defined by IAS, the relationship of the assets, liabilities, and equities of an institution as reported in the balance sheet.
flow The change in the amount of an item over time. Contrast with stock.
foreign exchange gain (loss)
As defined by IAS, gain (loss) from holding net foreign monetary items. Monetary items are money held and assets and liabilities to be received or paid in fixed or determinable amounts of money. This type of gain (loss) arises from reporting the same number of units of a foreign currency in the reporting currency at different exchange rates from the opening to the closing of a period.
Measuring Performance of Microfinance Institutions: A Framework for Reporting, Analysis, and Monitoring
106
Account Name Definition
full-time equivalent Means of calculating a staff member’s time so that, e.g., advisors who spend two-thirds of their time at an institution would be considered two-thirds of a full-time employee. Similarly, when calculating full-time equivalence for a given position, the institution should count the time a staff member spends doing certain tasks of that position as a percentage of the time that a full-time employee in that position spends doing them. For example, an institution that has five loan officers and one supervisor who manages some loans may report 5.5 as the number of loan officers.
funding liability All liabilities used to finance an institution’s financial assets.
gains As defined by IAS, increases in economic benefits—as such, they are no different in nature from revenue.
goodwill As defined by IAS, any excess of the cost of the acquisition over the acquirer’s interest in the fair value of the identifiable assets and liabilities acquired at the date of the exchange transaction.
Gross National Income (GNI) per capita
As defined by the World Bank’s World Development Index, “measures the total domestic and foreign value added claimed by residents. The sum of value added by all resident producers plus any product taxes (less subsidies) not included in the valuation of output plus net receipts of primary income (compensation of employees and property income) from abroad. GNI per capita is the GNI divided by the midyear population of the country.”
income statement A flow statement that summarizes all revenues, expenses, gains, and losses over a given period.
indirect method cash flow statement
With respect to the cash flow statement, demonstrates changes in cash position by starting with the net income and showing adjustments for revenues not currently producing cash and expenses not currently using cash. This presentation is often divided by operating, investing, and financing activities to determine the use of cash in each of these areas.
International Accounting Standards
IAS were issued by the International Accounting Standards Committee from 1973 to 2000. The International Accounting Standards Boards (IASB) replaced the IASC in 2001. Since then, the IASB has amended some IAS, proposed to amend other IAS, proposed to replace some IAS with new International Financial Reporting Standards, and adopted or proposed new IFRS on topics for which no previous IAS existed.
International Financial Reporting Standards (IFRS)
Refers to the new numbered series of pronouncements that the International Accounting Standards Board (IASB) is issuing, as distinct from the International Accounting Standards (IAS) series issued by its predecessor. More broadly, IFRS refers to the entire body of IASB pronouncements, including standards and interpretations approved by the IASB and IAS and Standards Interpretation Committee (SIC). Financial statements may not be described as complying with IFRS unless they comply with all the requirements of each applicable standard and each applicable interpretation.
inflation As defined by IMF, inflation is the “change in the cost of acquiring a fixed basket of goods and services by the average consumer.”
liabilities A present obligation of the institution arising from past events, the settlement of which is expected to result in an outflow from the institution of resources with economic benefits.
Measuring Performance of Microfinance Institutions: A Framework for Reporting, Analysis, and Monitoring
107
Account Name Definition
liquidity As defined by IAS, the availability of sufficient funds to meet deposit withdrawals and other financial commitments as they fall due.
losses Decreases in economic benefits that are no different in nature from expenses.
materiality As defined by IAS, information is material if its nondisclosure could influence the economic decisions of users.
net income The excess of all revenues and gains for a given period over all expenses and losses.
net worth See equity.
non-operating accounts
Revenue and expense accounts not related to the institution’s core business—the provision of financial services.
non-performing loans
See portfolio at risk.
operating accounts Revenue and expense accounts related to the institution’s core business—the provision of financial services.
past due payments The principal and interest due but unpaid for all loans that have one or more installments of principal past due by one or more days. Contrast with arrears.
period The time covered between two consecutive balance sheets.
portfolio at risk The principal balance of all loans outstanding that have one or more installments of principal past due by one or more days.
profit and loss statement
See income statement.
revenue As defined by IAS, the gross inflow of economic benefits during a period arising in the course of ordinary activities of an institution when those inflows result in increases in equity other than increases relating to contributions from equity participants.
solvency As defined by IAS, the availability of cash over the longer term to meet financial commitments as they fall due.
sources and uses of funds statement
See cash flow statement.
spread The percentage difference between the interest rate charged on a bank loan and the lender’s cost of funds
statement of changes in equity
A flow statement that summarizes the economic transactions that affect an institution’s equity over a given period.
statement of changes in net worth
See statement of changes in equity.
statement of financial position
See balance sheet.
stock Represents a measure of something on hand at a given point in time. Contrast with flow.

Measuring Performance of Microfinance Institutions: A Framework for Reporting, Analysis, and Monitoring
108
Account Name Definition
trial balance A presentation of all debit and credit balances for all accounts at a given point in time. Debit balances are presented in a left column and credit balances in a right column. The two should be equal.

Measuring Performance of Microfinance Institutions: A Framework for Reporting, Analysis, and Monitoring
109
7Bibliography
Brown, Warren, Tony Sheldon, and Charles Waterfield. 2000. SEEP’s Financial Services Working Group Performance Monitoring Project. Washington, D.C.: The SEEP Network.
Bruett, Tillman, Sharon D’Onofrio, and Reuben Summerlin. 2002. Técnicas de gestão microfinanceira. Programa de Desenvolvlimento Institucional. Rio de Jainero: BNDES. http://www.bndes.gov.br/conhecimento/microfin/07livro_tecnica.pdf.
Bruett, Tillman, and Nancy Natilson. 2003. Financial Performance Monitoring: A Manual for Board Members of Microfinance Institutions. Washington, D.C.: The SEEP Network. https://pos.brightdoc.com/store/entrance.asp?CompanyID=3859.
Campion, Anita. 1998. Current Governance Practices of Microfinance Institutions. Conference Paper No. 4. Washington, D.C.: The MicroFinance Network. http://www.accion.org/pubs/micro_pubs_list.asp.
Campion, Anita. 2000. Improving Internal Control: A Practical Guide for Microfinance Institutions. Technical Guide No. 1. Washington, D.C.: MicroFinance Network (with GTZ). http://www.accion.org/pubs/micro_pubs_list.asp.
CGAP/The World Bank. 2004. Building Inclusive Financial Systems: Donor Guidelines on Good Practice in Microfinance. Washington, D.C.: CGAP/The World Bank. http://www.cgap.org/publications/donor_issues.html.
CGAP/ World Bank. 1999. Format for Appraisal of Microfinance Institutions. Technical Tool Series No. 4. Washington D.C.: CGAP/ World Bank. http://www.cgap.org/docs/TechnicalTool_04.pdf.
CGAP/The World Bank Group. 2003. Microfinance Consensus Guidelines: Definitions of Standard Financial Terms, Ratios, and Adjustments for Microfinance. 3rd ed. Washington, D.C.: CGAP/The World Bank Group. http://www.cgap.org/docs/Guideline_definitions.pdf.
Helms, Brigit. 1998. Cost Allocation for Multi-Service Microfinance Institutions. Occasional Paper No. 2. Washington, D.C.: CGAP. http://www.cgap.org/docs/OccasionalPaper_02.pdf.
Helms, Brigit, and Imran Matin. 2000. Those Who Leave and Those Who Never Join: Insights from East African Microfinance Institutions. Focus Note No. 16. Washington, D.C.: CGAP. http://www.cgap.org/docs/FocusNote_16.pdf.
Jansson, Tor, Frank Abate, Julia Abrams, and Damien von Stauffenberg. 2002. Performance Indicators for Microfinance Institutions Technical Guide. 2nd ed. Washington: D.C.: MicroRate and the Inter-American Development Bank.
Measuring Performance of Microfinance Institutions: A Framework for Reporting, Analysis, and Monitoring
110
Ledgerwood, Joanna, Samuel Mutebi, and Anne Mpendo. 2003. MFI Performance Monitoring Tool Users Guide. Kampala, Uganda: SPEED/U.S. Agency for International Development.
Price Waterhouse Coopers International. 2004. International Financial Reporting Standards: Illustrative Corporate Consolidated Financial Statements 2004—Banks. London: Price Waterhouse Coopers International. http://www.pwcglobal.com/gx/eng/about/svcs/corporatereporting/ICFS2004.pdf.
Rosenberg, Richard, Patricia Mwangi, Robert Peck Christian, and Mohammed Nasr. 2003. Microfinance Consensus Guidelines: Financial Disclosure Guidelines for Microfinance Institutions. Washington, D.C.: CGAP/The World Bank Group. http://www.cgap.org/docs/Guideline_disclosure.pdf.
Saltzman, Sonia B., and Darcy Salinger. 1998. The ACCIÓN CAMELTM. Technical Note. Washington, D.C.: ACCIÓN International. http://www.microlinks.org/ev_en.php?ID=3104_201&ID2=DO_TOPIC.
The SEEP Network Financial Services Working Group. 1995. Financial Ratio Analysis of Micro-Finance Institutions. Washington, D.C.: The SEEP Network and Calmeadow.
Sheldon, Tony, and Charles Waterfield. 1998. Business Planning and Financial Modeling for Microfinance Institutions: A Handbook. CGAP Technical Tool Series No. 2. Washington, D.C.: CGAP. http://www.cgap.org/docs/TechnicalTool_02_PDF.zip.
Tracy, John A. 2001. Accounting for Dummies. 2nd ed. New York: Hungry Minds, Inc.

The SEEP Network
1825 Connecticut Avenue NW Washington, DC 20009
PHONE 202.884.8392 FAX 202.884.8479
E-MAIL [email protected]
WEB SITE & BOOKSTORE www.seepnetwork.org
Th
e SE
EP
Netw
ork M
easurin
g P
erform
ance o
f Micro
fin
ance In
stitutio
ns