Embed Size (px)
Citation preview

The Sea Level Rise The Sea Level Rise StoryStory
Bruno TremblayBruno Tremblay
McGill UniversityMcGill University
Slide from Steven Nerem – University of Colorado
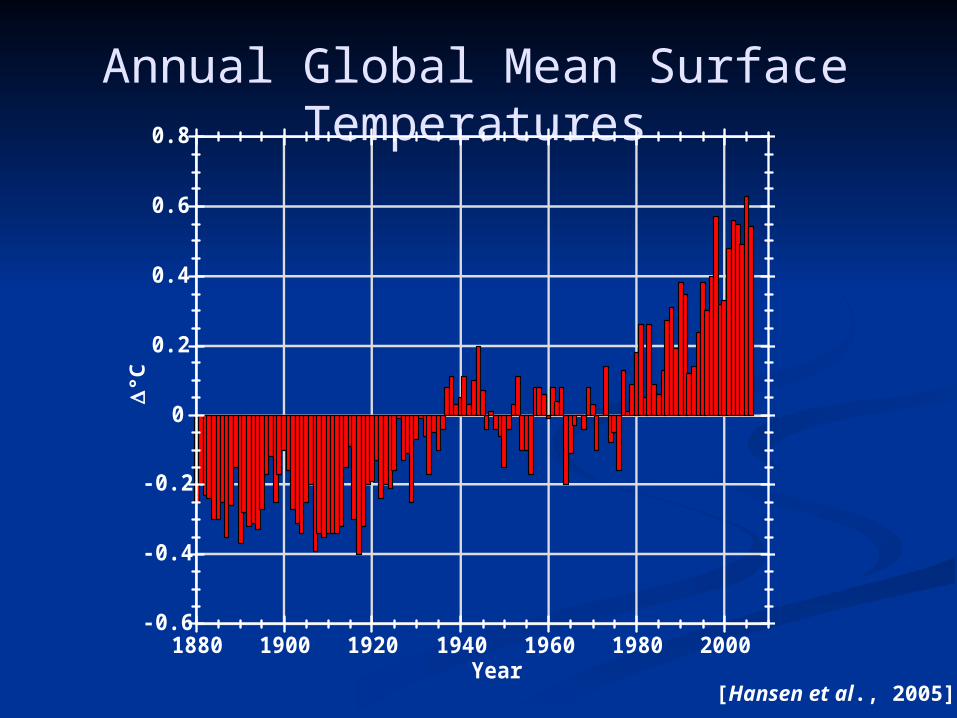
Annual Global Mean Surface Temperatures
-0.6
-0.4
-0.2
0
0.2
0.4
0.6
0.8
1880 1900 1920 1940 1960 1980 2000
°C
Year [Hansen et al., 2005]
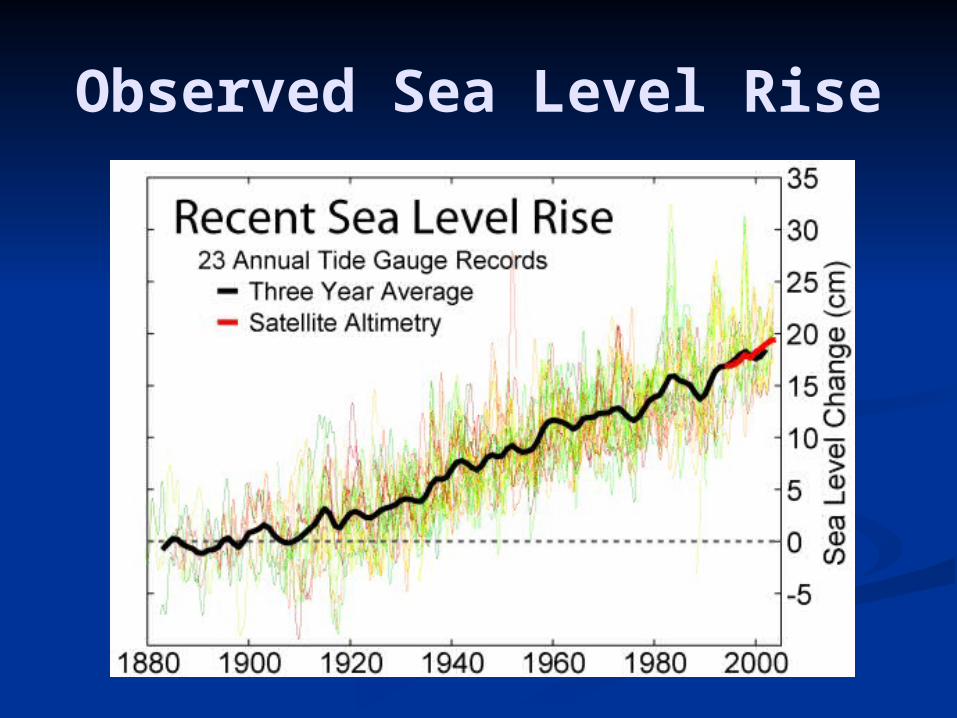
Observed Sea Level Rise
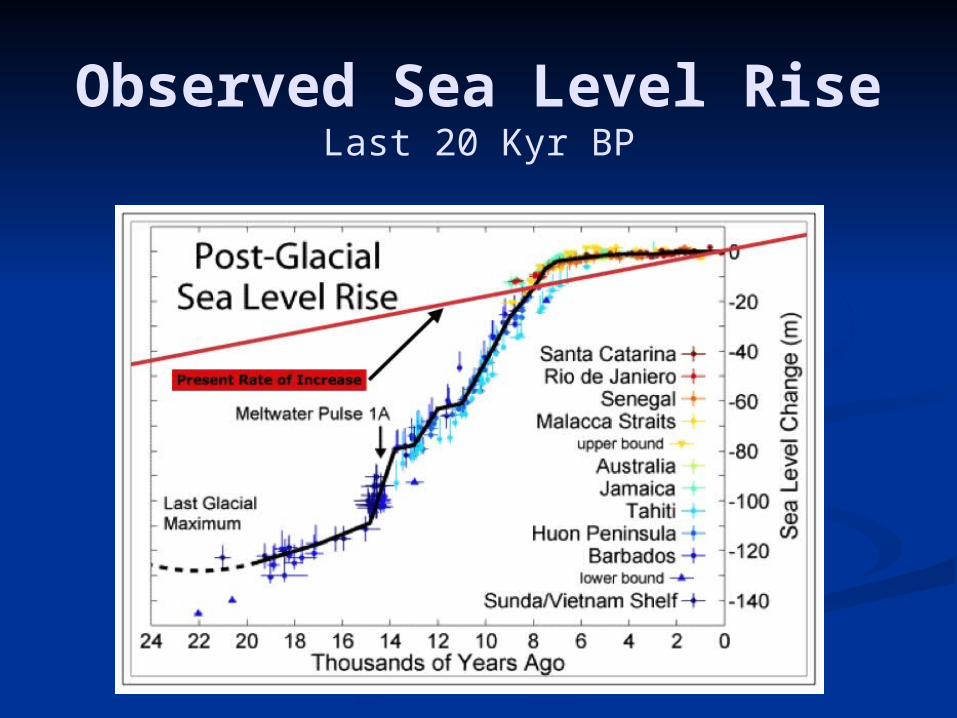
Observed Sea Level RiseLast 20 Kyr BP
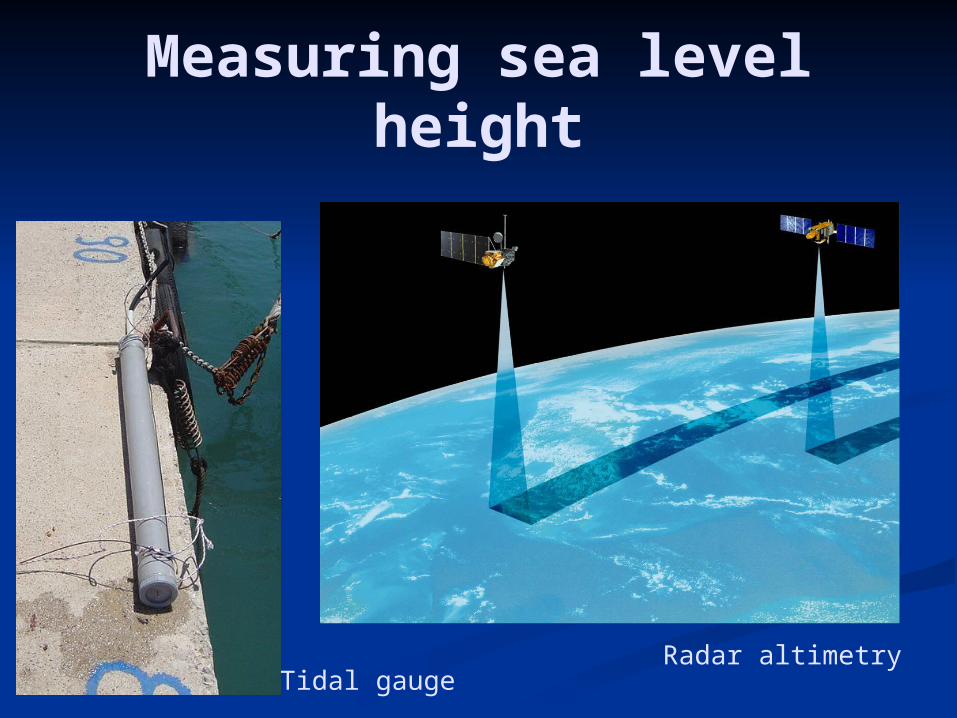
Measuring sea level height
Tidal gaugeRadar altimetry
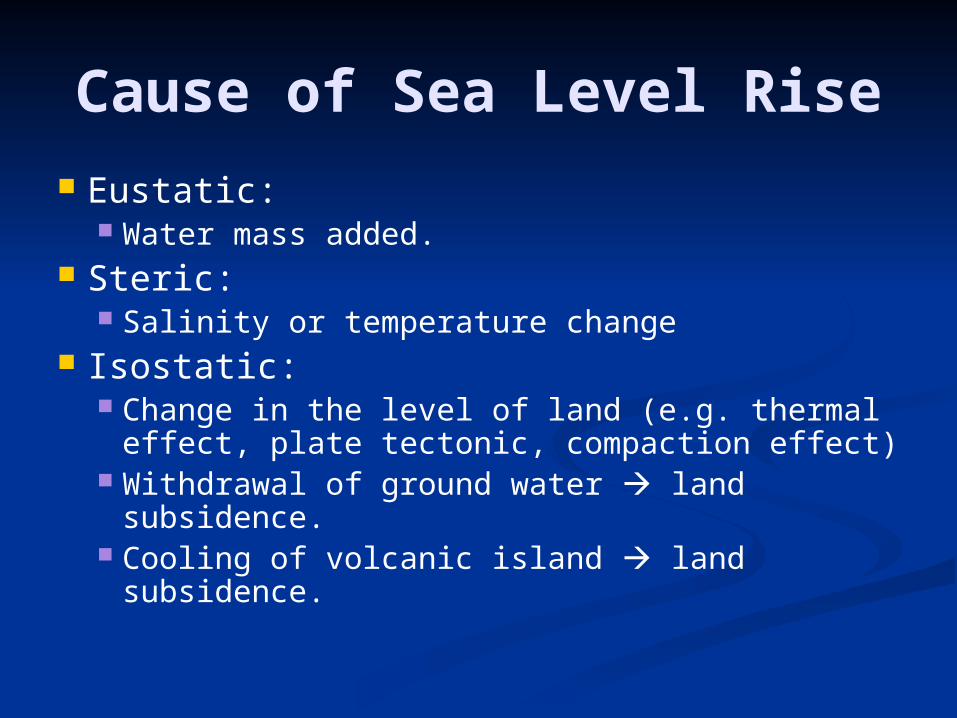
Cause of Sea Level Rise Eustatic:
Water mass added. Steric:
Salinity or temperature change Isostatic:
Change in the level of land (e.g. thermal effect, plate tectonic, compaction effect)
Withdrawal of ground water land subsidence.
Cooling of volcanic island land subsidence.

Short Term Changes in Sea Level
Diurnal-semidiurnal tides Atmospheric pressure – Winds - Evaporation-
precipitations Water density and currents El Niño/southern oscillation Water mass exchange between Arctic, Atlantic,
Pacific, Indian Oceans River runoff/floods Seiches Tsunamis Abrupt change in land level
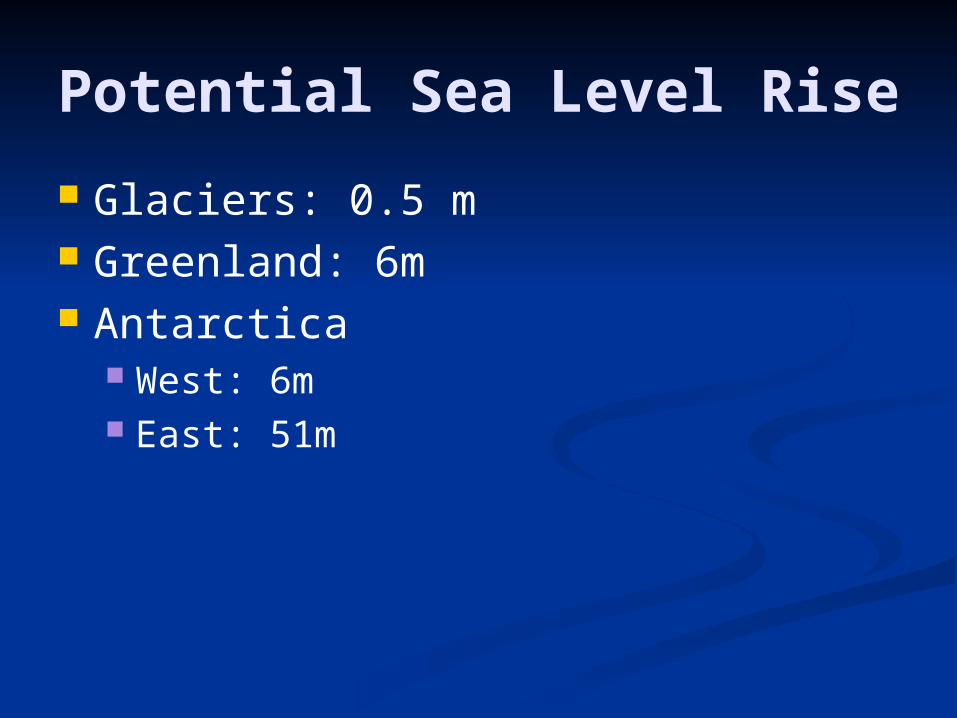
Potential Sea Level Rise
Glaciers: 0.5 m Greenland: 6m Antarctica
West: 6m East: 51m
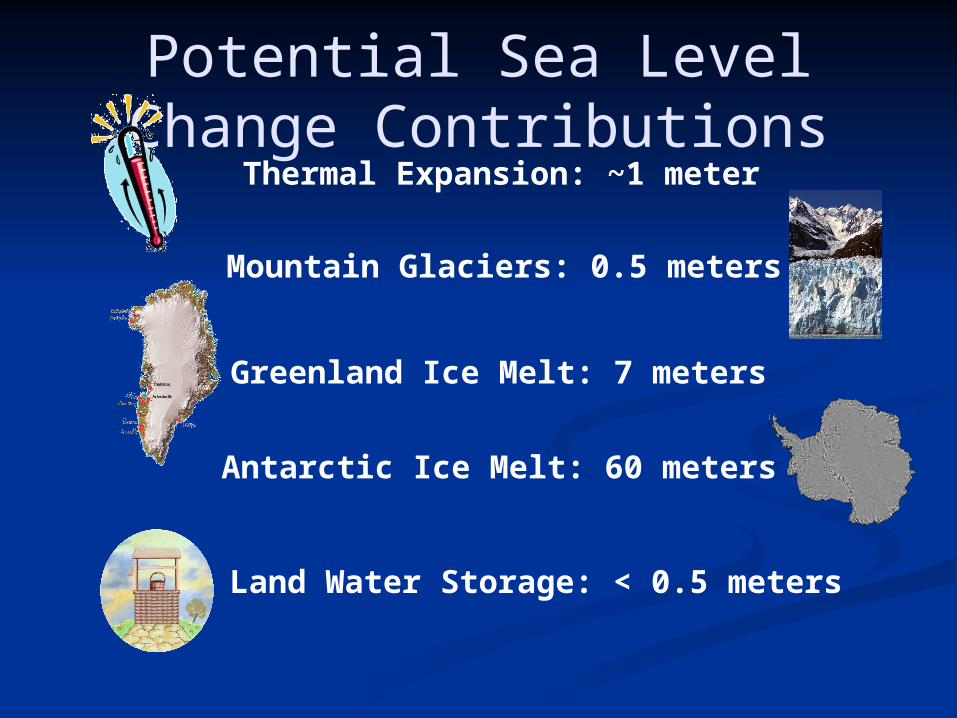
Potential Sea Level Change Contributions
Thermal Expansion: ~1 meter
Mountain Glaciers: 0.5 meters
Greenland Ice Melt: 7 meters
Antarctic Ice Melt: 60 meters
Land Water Storage: < 0.5 meters
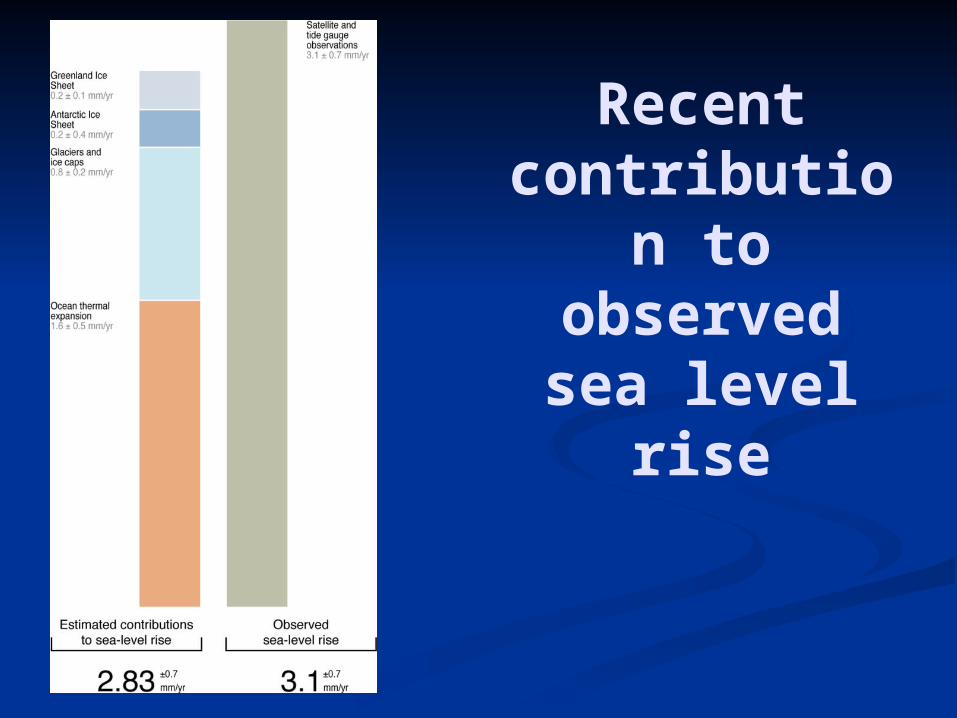
Recent contributio
n to observed sea level
rise
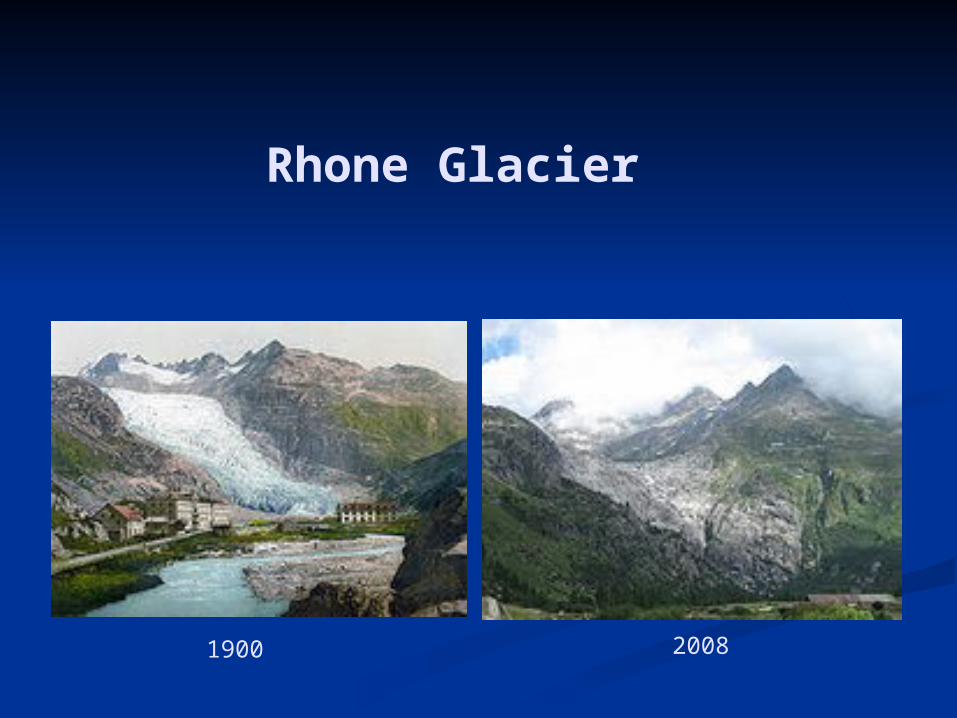
Rhone Glacier
1900 2008
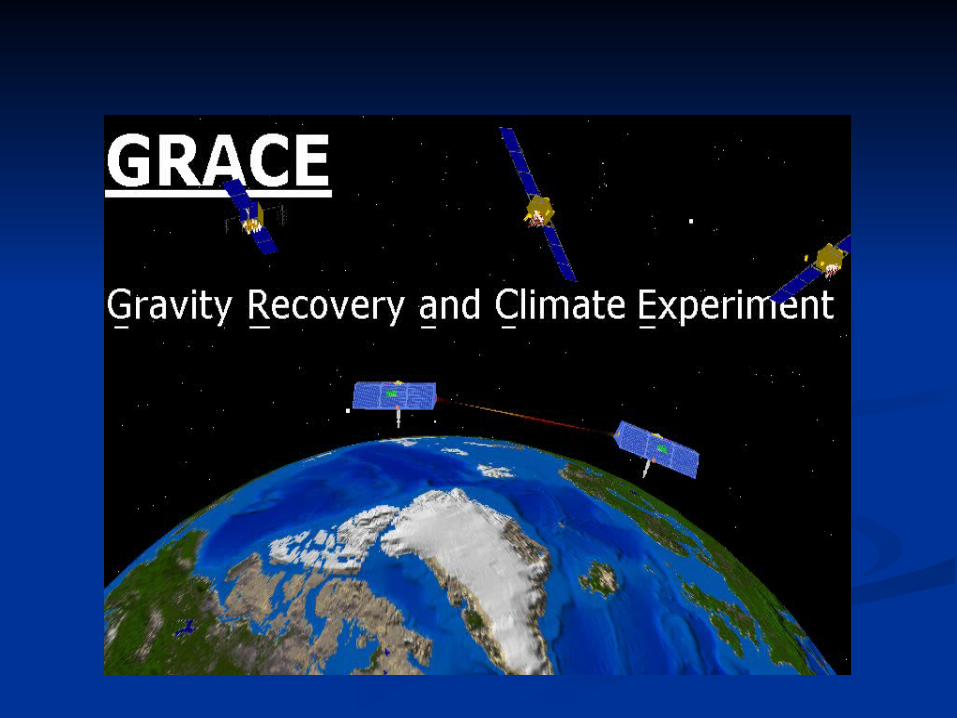
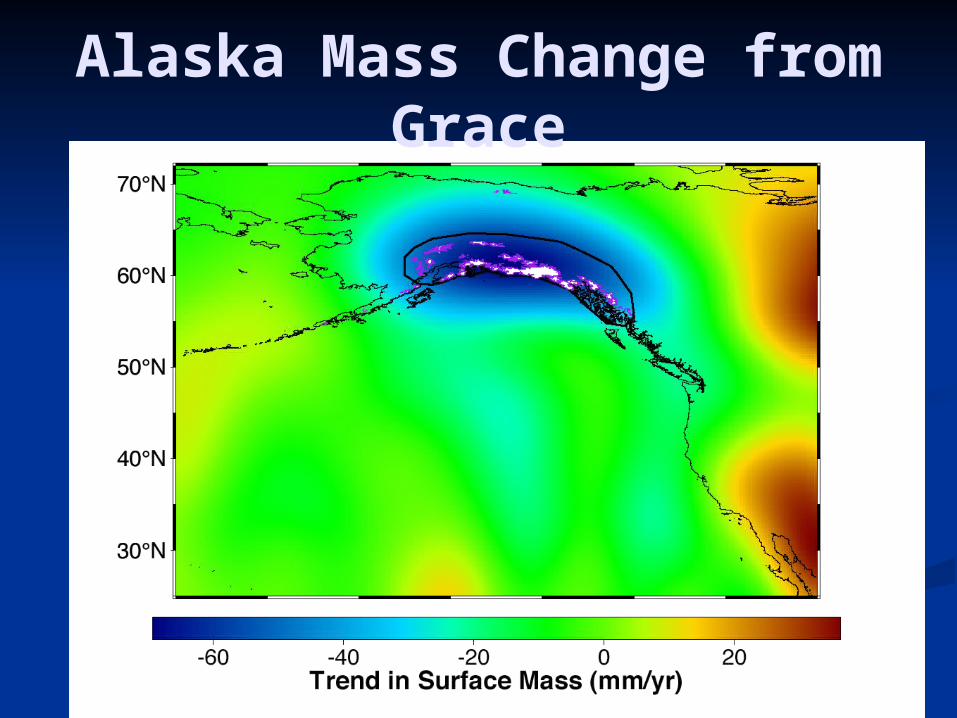
Alaska Mass Change from Grace
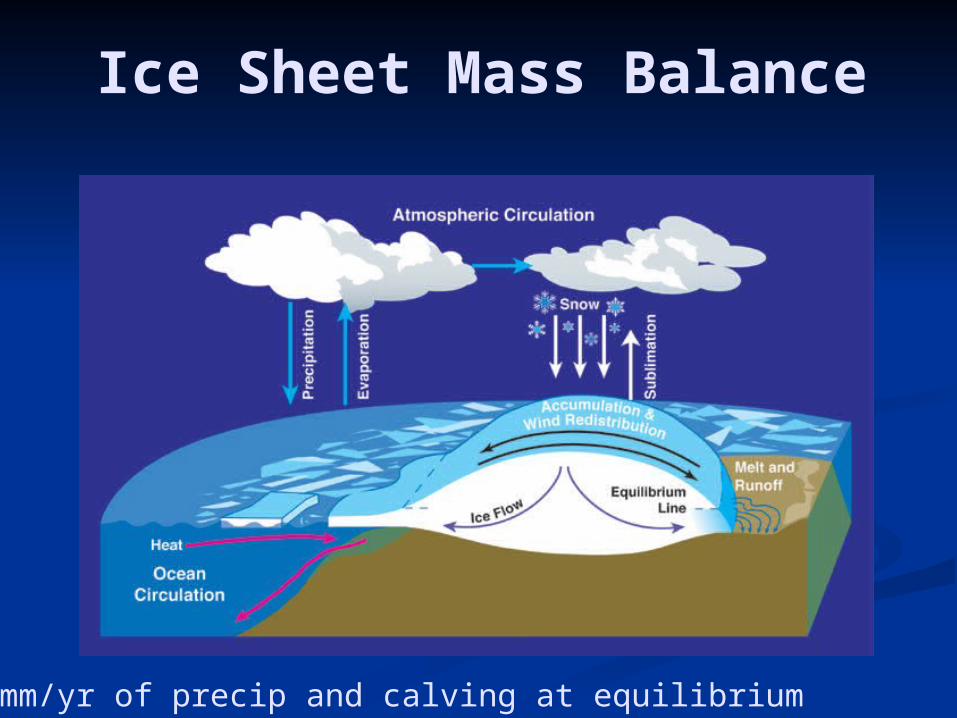
Ice Sheet Mass Balance
8 mm/yr of precip and calving at equilibrium
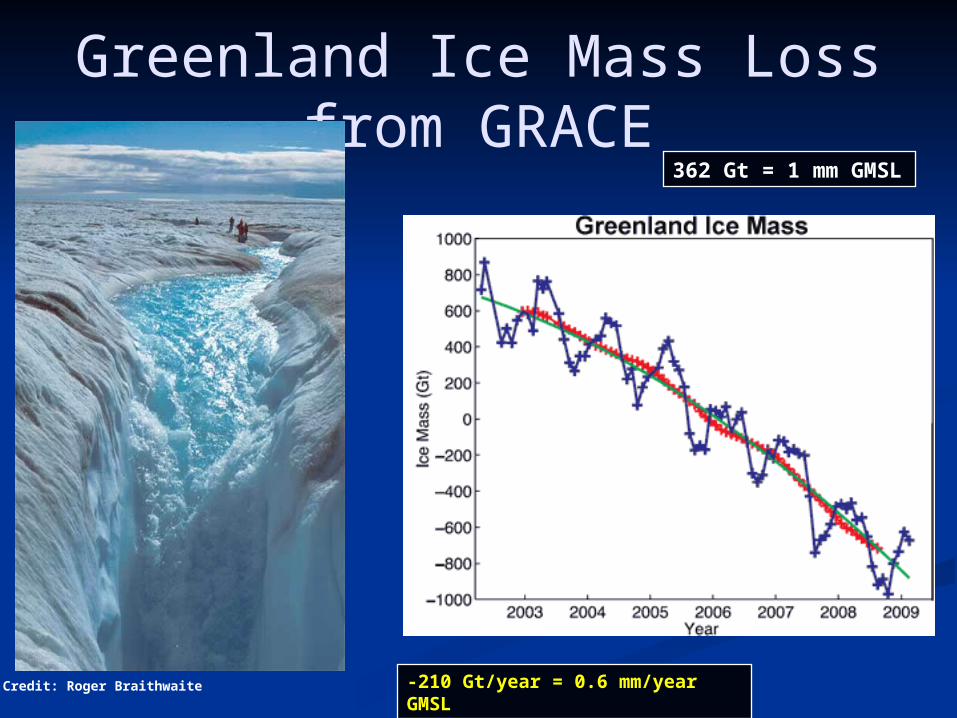
Greenland Ice Mass Loss from GRACE
Credit: Roger Braithwaite
362 Gt = 1 mm GMSL
-210 Gt/year = 0.6 mm/year GMSL
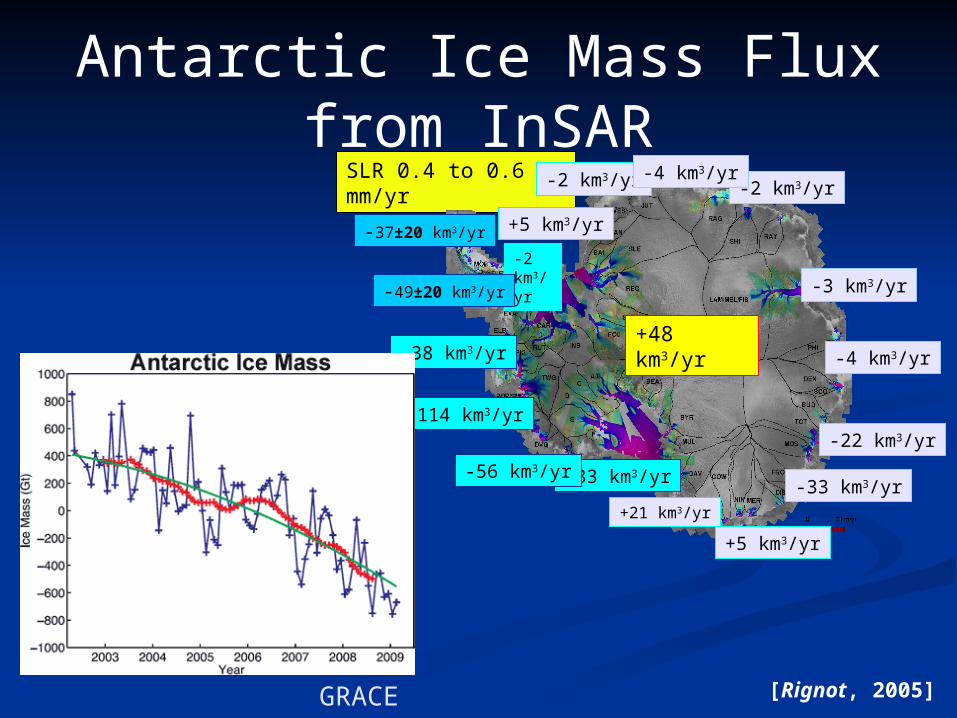
Antarctic Ice Mass Flux from InSAR
SLR 0.4 to 0.6 mm/yr
-114 km3/yr
-37±20 km3/yr
+33 km3/yr
-38 km3/yr+48 km3/yr
-2 km3/yr
+5 km3/yr
-22 km3/yr
-3 km3/yr
+5 km3/yr
-2 km3/yr
-56 km3/yr
-2 km3/yr
+21 km3/yr
-4 km3/yr
-33 km3/yr
-4 km3/yr
-49±20 km3/yr
[Rignot, 2005]GRACE
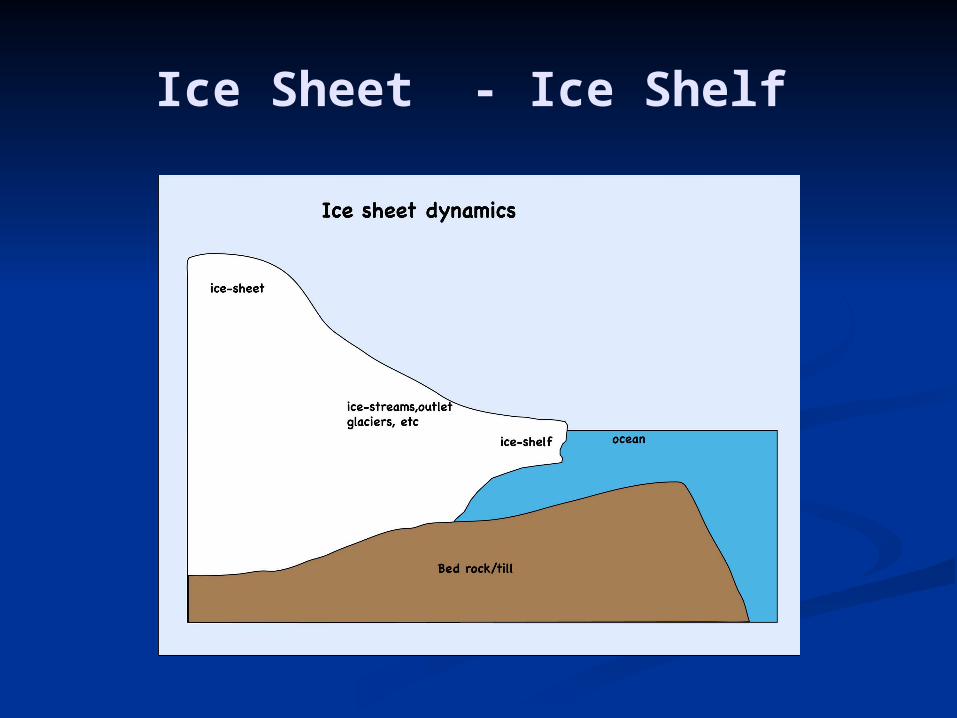
Ice Sheet - Ice Shelf
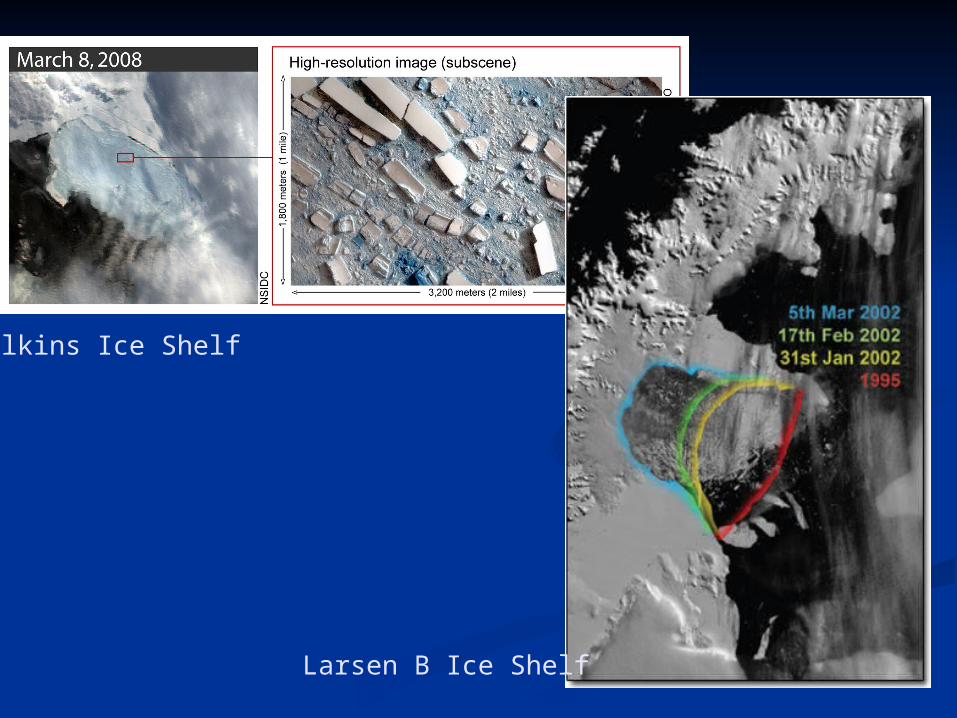
Wilkins Ice Shelf
Larsen B Ice Shelf
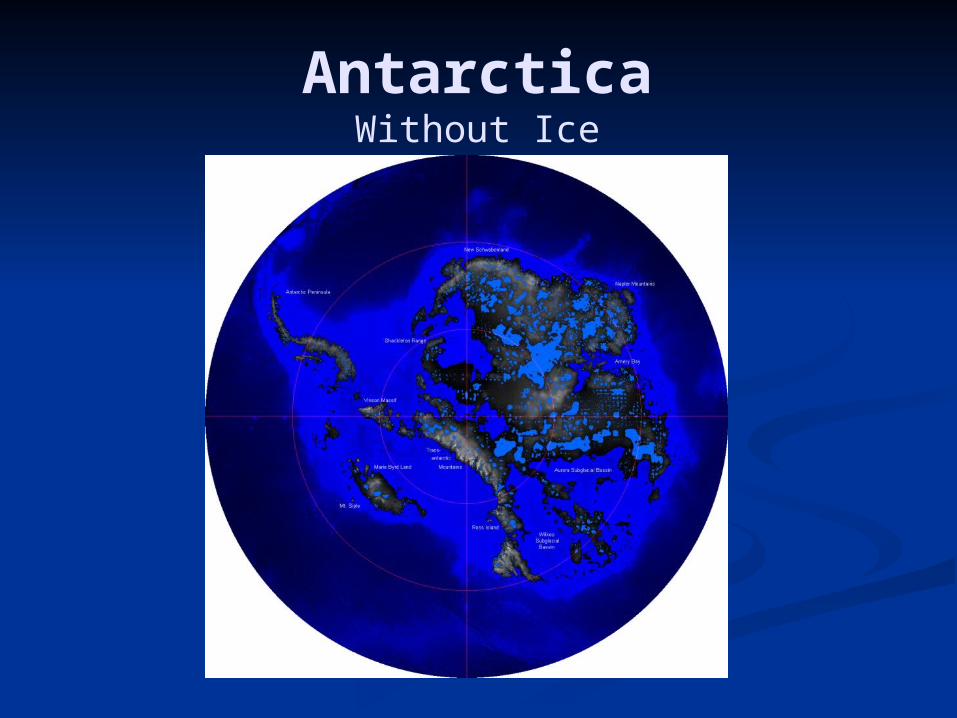
AntarcticaWithout Ice

Recent contributio
n to observed sea level
rise
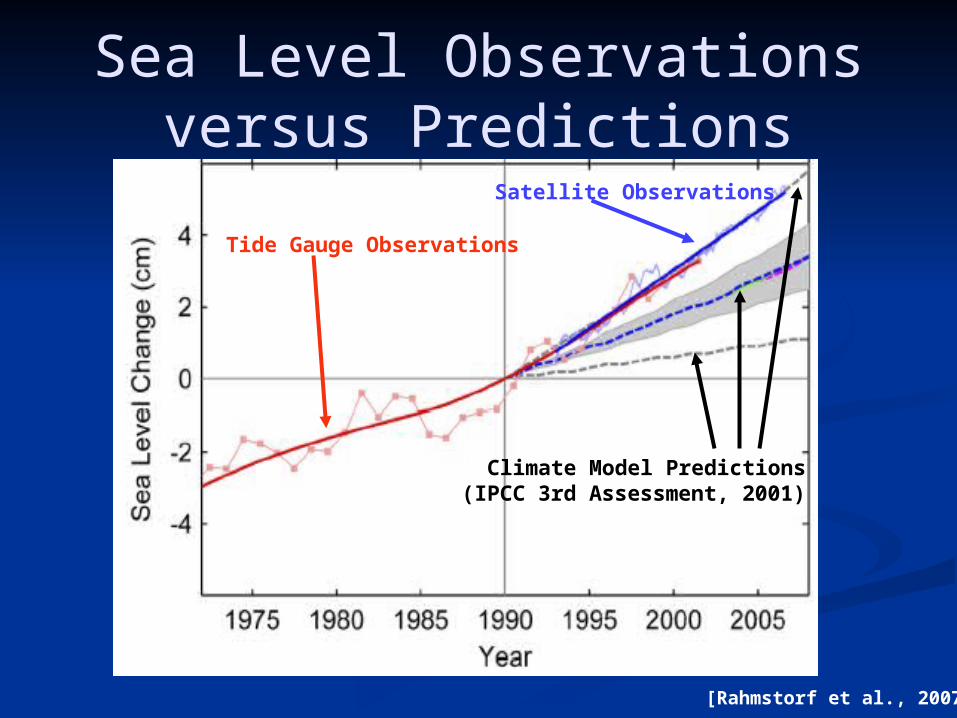
Sea Level Observations versus Predictions
[Rahmstorf et al., 2007]
Tide Gauge Observations
Satellite Observations
Climate Model Predictions(IPCC 3rd Assessment, 2001)
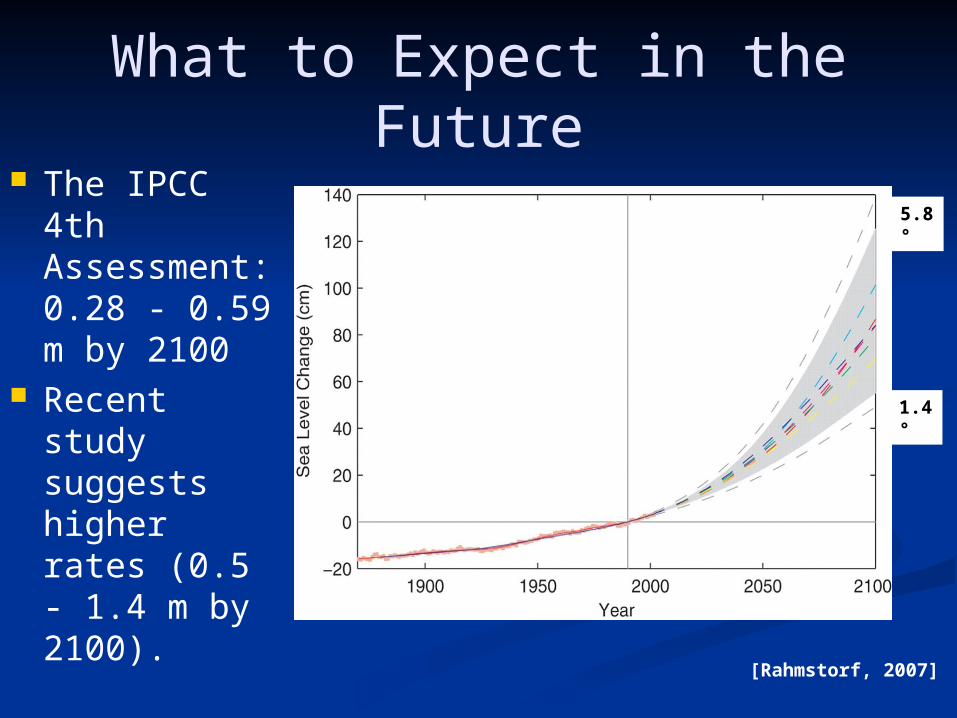
What to Expect in the Future
The IPCC 4th Assessment: 0.28 - 0.59 m by 2100
Recent study suggests higher rates (0.5 - 1.4 m by 2100).
[Rahmstorf, 2007]
1.4°
5.8°
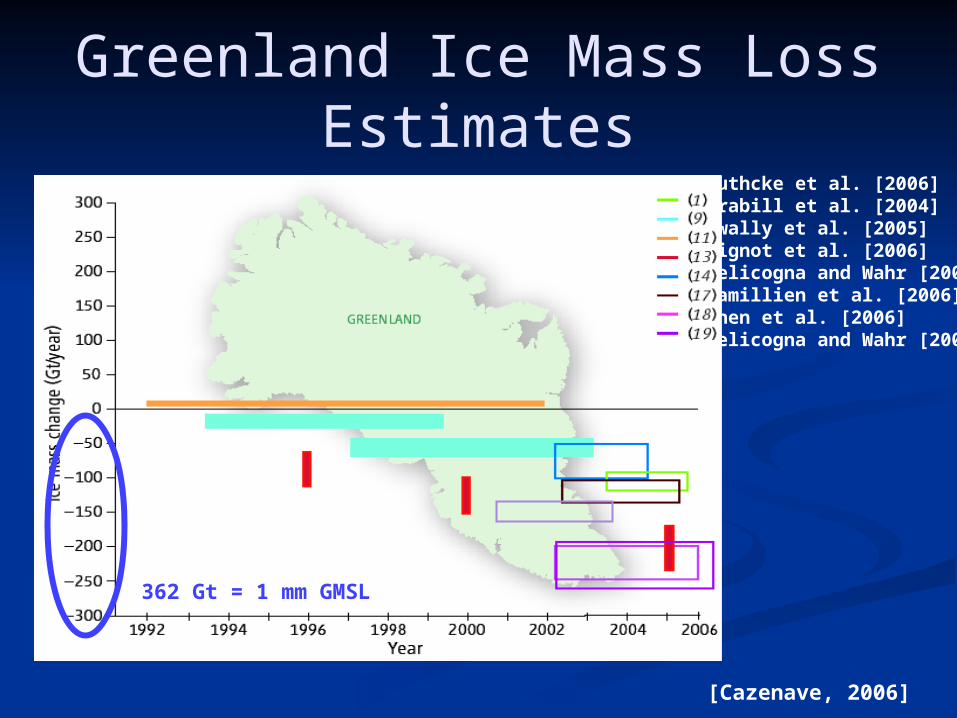
Greenland Ice Mass Loss Estimates
Luthcke et al. [2006]Krabill et al. [2004]Zwally et al. [2005]Rignot et al. [2006]Velicogna and Wahr [2005]Ramillien et al. [2006]Chen et al. [2006]Velicogna and Wahr [2006]
[Cazenave, 2006]
362 Gt = 1 mm GMSL
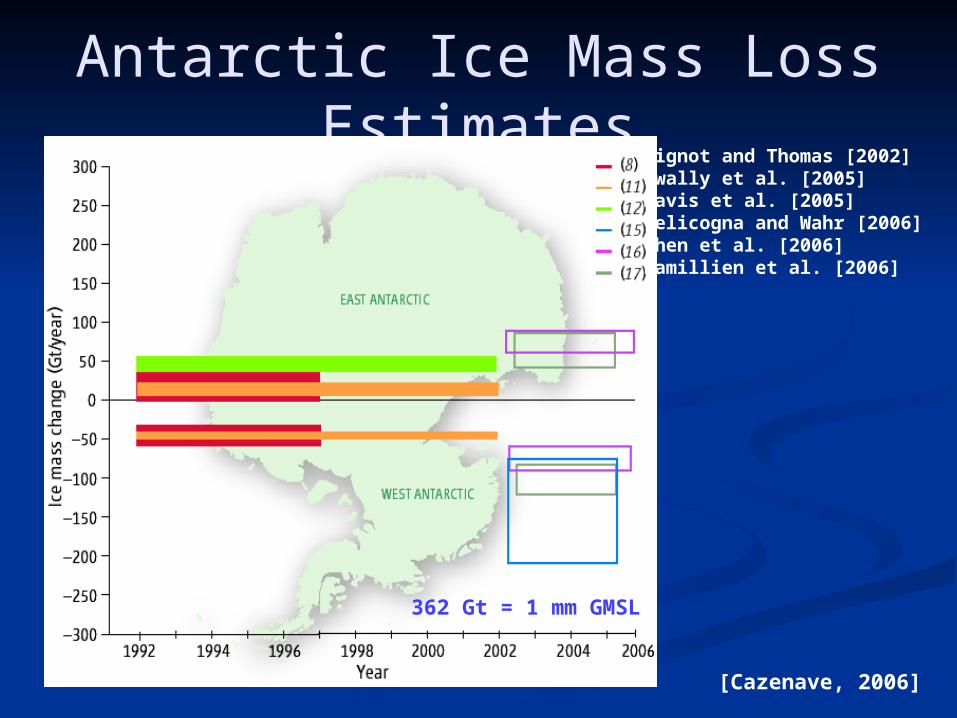
Antarctic Ice Mass Loss Estimates
Rignot and Thomas [2002]Zwally et al. [2005]Davis et al. [2005]Velicogna and Wahr [2006]Chen et al. [2006]Ramillien et al. [2006]
[Cazenave, 2006]
362 Gt = 1 mm GMSL
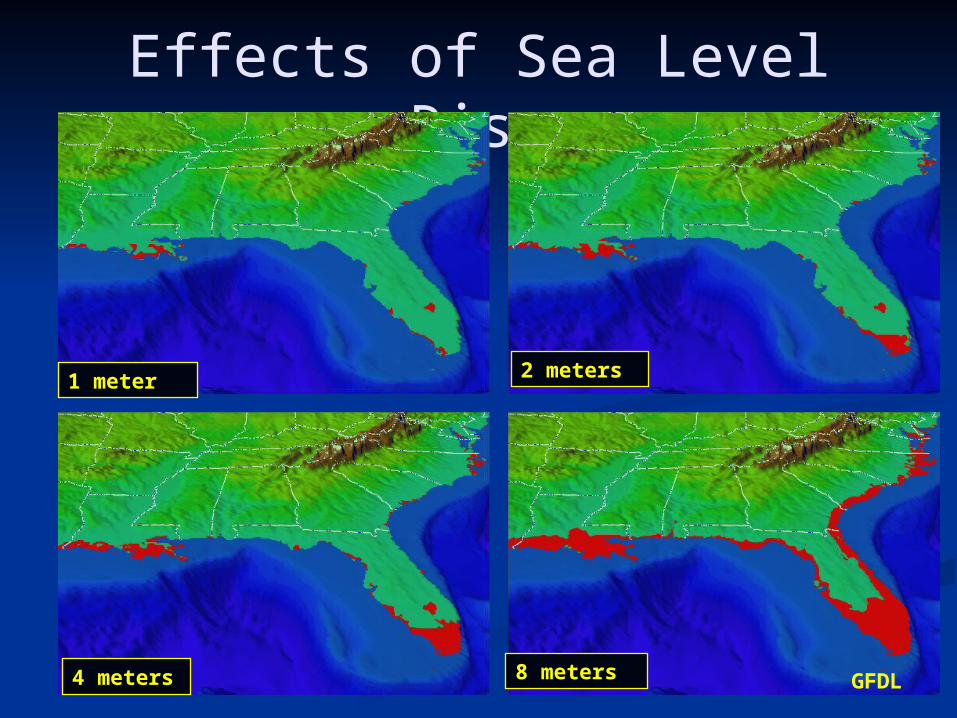
Effects of Sea Level Rise
1 meter 2 meters
4 meters 8 meters GFDL