Embed Size (px)
Citation preview
The Schumpeterian GrowthParadigmPhilippe Aghion,1 Ufuk Akcigit,2 and Peter Howitt3
1Department of Economics, Harvard University, Cambridge, Massachusetts 02138;email: [email protected] of Economics, University of Pennsylvania, Philadelphia, Pennsylvania19104; email: [email protected] of Economics, Brown University, Providence, Rhode Island 02912;email: [email protected]
Annu. Rev. Econ. 2015. 7:557–75
First published online as a Review in Advance onMay 8, 2015
The Annual Review of Economics is online ateconomics.annualreviews.org
This article’s doi:10.1146/annurev-economics-080614-115412
Copyright © 2015 by Annual Reviews.All rights reserved
JEL codes: O10, O11, O12, O30, O31, O33, O40,O43, O47
Keywords
creative destruction, entry, exit, competition, firm dynamics,reallocation
Abstract
In this review, we argue that the Schumpeterian growth paradigm,whichmodels growth as resulting from innovations involving creativedestruction, sheds light on several aspects of the growth process thatcannot be properly addressed by alternative theories. We focus onthree important aspects for which Schumpeterian growth theorydelivers predictions that distinguish it from other growth models,namely, (a) the role of competition and market structure, (b) firmdynamics, and (c) the relationship between growth and development.
557
Ann
u. R
ev. E
con.
201
5.7:
557-
575.
Dow
nloa
ded
from
ww
w.a
nnua
lrev
iew
s.or
g A
cces
s pr
ovid
ed b
y B
row
n U
nive
rsity
on
09/1
4/15
. For
per
sona
l use
onl
y.

1. INTRODUCTION
Formal models allow us to make verbal notions operational and confront them with data.Schumpeterian growth theory has operationalized Schumpeter’s notion of creative destruction—the process bywhich new innovations replace older technologies—in twoways.1 First, it has led tomodels based on creative destruction that shed new light on several microeconomic aspects of thegrowth process: in particular, the role of competition, firm dynamics, and cross-firm and cross-sector reallocation. Second, it makes use of rich micro data, in particular on entry, exit, and firmsize distribution, to confront predictions, which distinguishes it from other growth theories.In both respects, Schumpeterian growth theory has helped bridge the gap between micro- andmacroeconomics.
In this article, we consider three aspects on which Schumpeterian growth theory delivers dis-tinctive predictions. First, the Schumpeterian paradigm allows us to analyze the relationshipbetween growth and industrial organization (IO). Faster innovation-led growth is generally as-sociated with higher turnover rates (i.e., higher rates of creation and destruction and of firmsand jobs). Moreover, competition appears to be positively correlated with growth, and compe-tition policy tends to complement patent policy. Second, the paradigm sheds light on the re-lationship between growth and firm dynamics. Small firms exit more frequently than large firms.Conditional on survival, small firms grow faster, and there is a very strong correlation betweenfirm size and age. Additionally, the firm size distribution is highly skewed. Third, we argue thatSchumpeterian growth theory helps us reconcile growth with development: first, by looking athow growth is related to the size distribution of firms, which itself depends on local institutionalconstraints and, second, by bringing out the notion of appropriate growth institutions and poli-cies, that is, the idea that what drives growth in a sector (or country) far below the world tech-nology frontier is not necessarily what drives growth in a sector or country at the technologicalfrontier, at which creative destruction plays a more important role. In particular, we point todemocracy being more growth enhancing in more frontier economies.
The article is organized as follows. Section 2 lays out the basic Schumpeterian model.Section 3 introduces competition and IO into the framework. Section 4 analyzes firm dynamics.Section 5 investigates the relationship between growth and development. Section 6 concludes.
We provide a word of caution before proceeding: This article focuses on the Schumpeteriangrowth paradigm and some of its applications. It is not a survey of the existing (endogenous)growth literature. Formore information on that literature, we refer the reader to growth textbooks(e.g., Aghion & Howitt 1998, 2009; Barro & Sala-i-Martin 2003; Acemoglu 2009; Galor 2011;Weil 2012; Jones & Vollrath 2013).
2. SCHUMPETERIAN GROWTH: BASIC MODEL
The Schumpeterian growth model is based on three main ideas: (a) Long-run growth results frominnovations; (b) innovations result from entrepreneurial investments that are themselves moti-vated by the prospects of monopoly rents; and (c) new innovations replace old technologies.In other words, growth involves creative destruction.
1The theory was initiated in the fall of 1987 at the Massachusetts Institute of Technology. During that year, Aghion andHowitt wrote their model of growth through creative destruction (see Section 2), which was published in 1992 (Aghion &Howitt 1992). Parallel attempts at developing Schumpeterian growth models include Segerstrom et al. (1990) and Corriveau(1991).
558 Aghion � Akcigit � Howitt
Ann
u. R
ev. E
con.
201
5.7:
557-
575.
Dow
nloa
ded
from
ww
w.a
nnua
lrev
iew
s.or
g A
cces
s pr
ovid
ed b
y B
row
n U
nive
rsity
on
09/1
4/15
. For
per
sona
l use
onl
y.

More formally, in the basic Aghion-Howitt model (see Aghion & Howitt 1992), time is con-tinuous, and the economy is populated by a continuum of mass L of individuals. Individualsare risk neutral, and each individual is endowedwith one unit flow of labor per unit of time, whichhe or she can devote either to manufacturing or to research and development (R&D).
A final output is produced at any time using an intermediate input, according to
Y ¼ Aya,
whereA denotes the current quality of the input, which is multiplied by a factor g > 1 each timea new innovation occurs. Innovations arrive at Poisson rate lz, where z is the amount of labordevoted toR&D.The intermediate is itself using labor one for one; thus, y also denotes the amountof labor working in manufacturing the intermediate input.
The model revolves around two basic equations. The first is a labor market clearing equation:
yþ z ¼ L, ð1Þ
where L denotes the total labor supply. The second is a research arbitrage equation that statesthat in equilibrium, an individual is indifferent between working in R&D and working inmanufacturing, namely,
wk ¼ lVkþ1, ð2Þ
wherewk is the wage rate paid by the intermediate input sector after the k-th innovation, andVkþ1
is the value of the next [i.e., the (k þ 1)-th] innovation.2
These two equations allow us to determine the equilibriumR&D using Equations 1 and 2. Theresulting equilibrium aggregate R&D, z, depends on the parameters of the economy. In particular,higher productivity of the R&D technology as measured by l, a larger size of innovations g, ora larger size of the population L has a positive effect on aggregate R&D. Conversely, a higher a(which corresponds to the intermediate producer facing a more elastic inverse demand curve andtherefore getting lower monopoly rents) or a higher discount rate r tends to discourage R&D.
Finally, the expected growth rate,
EðgtÞ ¼ lz lng,
inherits the comparative static properties of z with respect to the parameters l, g, a, r, and L.A distinct prediction of the model is the following.
Prediction 1: The turnover rate lz is positively correlated with the growth rate g.
Another distinctive implication of the model is that innovation-led growth may be excessiveunder laissez-faire. Growth is excessive (insufficient) under laissez-faire when the business-stealingeffect associated with creative destruction dominates (is dominated by) the intertemporalknowledge spillovers from current to future innovators.3
2If innovatinggave the innovator access toapermanent profit flowpkþ1, then the value of the corresponding perpetuity wouldbepkþ1=r. However, there is creative destruction at the aggregate rate lz. As a result, we haveVkþ1 ¼ pkþ1=ðr þ lzÞ. That is,the value of innovation is equal to the profit flow divided by the risk-adjusted interest rate r þ lz, where the risk is that of beingdisplaced by a new innovator.3Which of these effects dominates will depend, in particular, on the size of innovations. Assessing the relative importance ofthese two effects in practice requires estimating the structural parameters of the growth model using micro data (see footnote 6).
559www.annualreviews.org � The Schumpeterian Growth Paradigm
Ann
u. R
ev. E
con.
201
5.7:
557-
575.
Dow
nloa
ded
from
ww
w.a
nnua
lrev
iew
s.or
g A
cces
s pr
ovid
ed b
y B
row
n U
nive
rsity
on
09/1
4/15
. For
per
sona
l use
onl
y.
3. GROWTH MEETS INDUSTRIAL ORGANIZATION
Bothempirical studies (e.g., seeBlundell et al. 1995, 1999;Nickell 1996) and casual evidence pointto a positive correlationbetween growth andproductmarket competition.However, this is at oddswith the predictions of non-Schumpeterian growth models. AK models assume perfect compe-tition and therefore do not address the relationship between competition and growth. Addi-tionally, in Romer’s product variety model, higher competition amounts to a higher degree ofsubstitutability between the horizontally differentiated inputs, which in turn implies lower rentsfor innovators and therefore lower R&D incentives and thus lower growth.
In contrast, the Schumpeterian growth paradigm can account for the positive correlation be-tween competition and growth found in linear regressions. In addition, it accounts for severalinteresting facts about competition and growth that no other growth theory can explain. [Aghion &Griffith (2006) provide a first attempt at synthesizing the theoretical and empirical debateson competition and growth.] Our focus is on the following three findings. First, innovationand productivity growth by incumbent firms appear to be stimulated by competition and entry,particularly in firms near the technology frontier or in firms that compete neck and neckwith theirrivals, less so in firms below the frontier. Second, competition and productivity growth display aninverted-U relationship. Starting from an initially low level of competition, higher competitionstimulates innovation and growth; starting from a high initial level of competition, highercompetition has a less positive or even a negative effect on innovation and productivity growth.Third, patent protection complements product market competition in encouraging R&D invest-ments and innovation.
Understanding the relationship between competition and growth also helps improve our un-derstanding of the relationship between trade and growth. Indeed, there are several dimensions tothat relationship. To begin, there is the scale effect, in which liberalizing trade increases themarketfor successful innovations and therefore the incentives to innovate. This is naturally captured byany innovation-based model of growth, including the Schumpeterian growth model. But there isalso a competition effect of trade openness, which only the Schumpeterianmodel can capture. Thislatter effect appears to have been at work in emerging countries that implemented trade liber-alization reforms (e.g., India in the early 1990s), and it also explains why trade restrictions aremore detrimental to growth in more frontier countries (see Section 5).
3.1. From Leapfrogging to Step-by-Step Innovation4
In this section, we uncover the main counteracting effects of competition on innovation and an-alyze conditions under which each effect dominates.
3.1.1. The argument. Let us replace the leapfrogging assumption of the model in Section 2 (inwhich incumbents are systematically overtaken by outside researchers) with a less radical step-by-step assumption: Namely, a firm that is currently m steps behind the technological leader in thesame sector or industry must catch up with the leader before becoming a leader itself. The un-derlying idea is that an innovator acquires tacit knowledge that cannot be duplicated by a rivalwithout engaging in its own R&D to catch up. This step-by-step assumption implies that firms insome sectors will be neck and neck. Now in such sectors, by making life more difficult for neck-and-neck firms, increased product market competition will encourage these firms to innovate in
4The following model and analysis are based on Aghion et al. (1997, 2001, 2005) and Acemoglu & Akcigit (2012) (see alsoPeretto 1998 for related work).
560 Aghion � Akcigit � Howitt
Ann
u. R
ev. E
con.
201
5.7:
557-
575.
Dow
nloa
ded
from
ww
w.a
nnua
lrev
iew
s.or
g A
cces
s pr
ovid
ed b
y B
row
n U
nive
rsity
on
09/1
4/15
. For
per
sona
l use
onl
y.

order to acquire a lead over their rival in the sector. We refer to this as the escape-competitioneffect. Conversely, in sectors that are not neck and neck, increased product market competitionwill have a more ambiguous effect on innovation. In particular, it will discourage innovation bylaggard firmswhen these firms do not putmuchweight on the (more remote) prospect of becominga leader and insteadmainly look at the short-run extra profit from catching upwith the leader.Wecall this the Schumpeterian effect. Finally, the steady-state fraction of neck-and-neck sectors willitself depend on the innovation intensities in neck-and-neck versus unleveled sectors. We refer tothis as the composition effect.
Thus, the effect of competition on innovation depends on the technological state of the sector.In unleveled sectors, the Schumpeterian effect is at work even if it does not always dominate. But inleveled (neck-and-neck) sectors, the escape-competition effect is the only effect at work. That is,more competition induces neck-and-neck firms to innovate in order to escape from a situation inwhich competition constrains profits.
On average, an increase in product market competition will have an ambiguous effect ongrowth. It induces faster productivity growth in currently neck-and-neck sectors and slowergrowth in currently unleveled sectors. The overall effect on growthwill thus dependon the (steady-state) fraction of leveled versus unleveled sectors. But this steady-state fraction is itself endoge-nous, as it depends on equilibriumR&D intensities in both types of sectors. One can show that theoverall effect is an inverted U, and at the same time, thismodel generates additional predictions forfurther empirical testing.
3.1.2. Composition effect and the inverted U. The inverted-U shape results from the compositioneffect inwhich an increase in competition changes the steady-state fraction of sectors that are in theleveled state, inwhich the escape-competition effect dominates, versus the unleveled state, inwhichthe Schumpeterian effect dominates. At one extreme, when there is not much product marketcompetition, there is not much incentive for neck-and-neck firms to innovate, and therefore, theoverall innovation ratewill be highestwhen the sector is unleveled. Thus, the industrywill be quickto leave the unleveled state (which it does as soon as the laggard innovates) and slow to leave theleveled state (which will not happen until one of the neck-and-neck firms innovates). As a result,the industry will spend most of the time in the leveled state, in which the escape-competition effectdominates. In other words, if the degree of competition is very low to begin with, an increase incompetition should result in a faster average innovation rate. At the other extreme, when com-petition is initially very high, there is little incentive for the laggard to innovate in an unleveledstate. Thus, the industrywill be slow to leave the unleveled state.Meanwhile, the large incrementalprofit from innovation gives firms in the leveled state a relatively large incentive to innovate, sothat the industry will be relatively quick to leave the leveled state. As a result, the industry willspend most of the time in the unleveled state in which the Schumpeterian effect is the dominanteffect. In other words, if the degree of competition is very high to begin with, an increase incompetition should result in a slower average innovation rate.
3.2. Predictions
The main testable predictions from the above discussion are listed below.
Prediction 2: The relationship between competition and innovation follows aninverted-U pattern, and the average technological gap within a sector increases withcompetition.
561www.annualreviews.org � The Schumpeterian Growth Paradigm
Ann
u. R
ev. E
con.
201
5.7:
557-
575.
Dow
nloa
ded
from
ww
w.a
nnua
lrev
iew
s.or
g A
cces
s pr
ovid
ed b
y B
row
n U
nive
rsity
on
09/1
4/15
. For
per
sona
l use
onl
y.
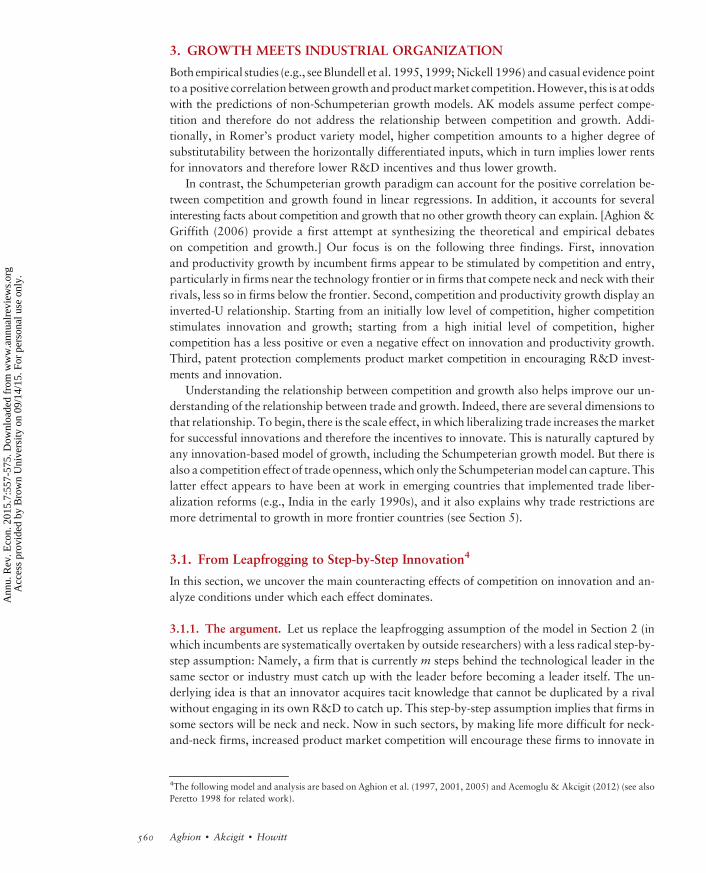
This prediction is analyzed by Aghion et al. (2005) using panel data on UK firms spanning 17two-digit Standard Industrial Classification (SIC) industries between 1973 and 1994. The chosenmeasure of product market competition is equal to 1minus the Lerner index. The Lerner index, orprice-cost margin, is itself defined by operating profits net of depreciation, provisions, and fi-nancial cost of capital, divided by sales, averaged across firms within an industry-year. Figure 1shows the inverted-U pattern, and it also demonstrates that if we restrict attention to industriesabove the median degree of neck-and-neckness, the upward-sloping part of the inverted U issteeper than if we consider the whole sample of industries. Aghion et al. also show that the averagetechnological gapacross firmswithin an industry increaseswith the degree of competition towhichthe industry is subject.
The following prediction characterizes the sectors where the escape-competition effect domi-nates the Schumpeterian effect.
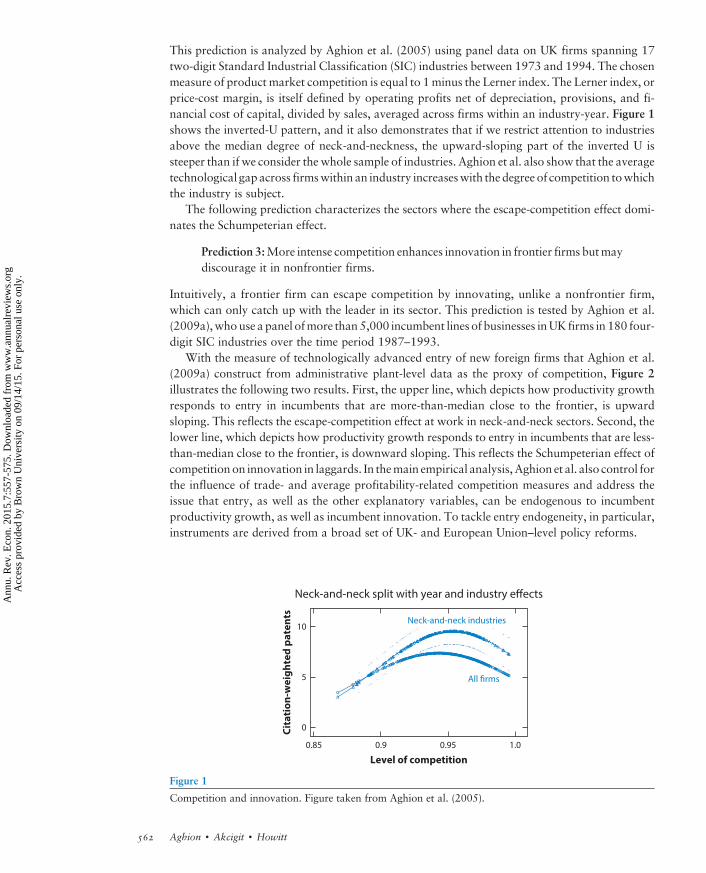
Prediction 3:More intense competition enhances innovation in frontier firms butmaydiscourage it in nonfrontier firms.
Intuitively, a frontier firm can escape competition by innovating, unlike a nonfrontier firm,which can only catch up with the leader in its sector. This prediction is tested by Aghion et al.(2009a),whouse a panel ofmore than5,000 incumbent lines of businesses inUK firms in 180 four-digit SIC industries over the time period 1987–1993.
With the measure of technologically advanced entry of new foreign firms that Aghion et al.(2009a) construct from administrative plant-level data as the proxy of competition, Figure 2illustrates the following two results. First, the upper line, which depicts how productivity growthresponds to entry in incumbents that are more-than-median close to the frontier, is upwardsloping. This reflects the escape-competition effect at work in neck-and-neck sectors. Second, thelower line, which depicts how productivity growth responds to entry in incumbents that are less-than-median close to the frontier, is downward sloping. This reflects the Schumpeterian effect ofcompetitionon innovation in laggards. In themain empirical analysis, Aghion et al. also control forthe influence of trade- and average profitability-related competition measures and address theissue that entry, as well as the other explanatory variables, can be endogenous to incumbentproductivity growth, as well as incumbent innovation. To tackle entry endogeneity, in particular,instruments are derived from a broad set of UK- and European Union–level policy reforms.
Neck-and-neck industries
Level of competition
Neck-and-neck split with year and industry effects
Cit
ati
on
-we
igh
ted
pa
ten
ts
All firms
1.00.85
0
5
10
0.9 0.95
Figure 1
Competition and innovation. Figure taken from Aghion et al. (2005).
562 Aghion � Akcigit � Howitt
Ann
u. R
ev. E
con.
201
5.7:
557-
575.
Dow
nloa
ded
from
ww
w.a
nnua
lrev
iew
s.or
g A
cces
s pr
ovid
ed b
y B
row
n U
nive
rsity
on
09/1
4/15
. For
per
sona
l use
onl
y.
The following prediction ties the product market competition to patent policy.
Prediction 4: There is complementarity between patent protection and productmarket competition in fostering innovation.
Intuitively, competition reduces the profit flow of noninnovating neck-and-neck firms,whereas patent protection is likely to enhance the profit flow of innovating neck-and-neck firms.Both contribute to raising the net profit gain of innovating neck-and-neck firms; in other words,both types of policies tend to enhance the escape-competition effect.5 This prediction is confirmedbyAghion et al. (2013) usingOrganization for EconomicCo-operation andDevelopment (OECD)country-industry panel data for many industries in OECD countries since the 1980s. Aghion et al.find that the implementation of a competition-increasing product market reform, the large-scaleEuropean Single Market Programme, has increased innovation in industries of countries withstrong intellectual property rights (IPRs) since the presample period, but not so in those withweaker IPRs. Moreover, the positive response of innovation to the product market reform instrong IPR countries is more pronounced among firms in industries that rely more on patentingthan in other industries. Overall, these empirical results are consistent with a complementaritybetween IPRs and competition.
4. SCHUMPETERIAN GROWTH AND FIRM DYNAMICS
The empirical literature has documented various stylized facts on firm size distribution and firmdynamics usingmicro firm-level data. In particular, (a) the firm size distribution is highly skewed;(b) firm size and firm age are highly correlated; (c) small firms exit more frequently, but the onesthat survive tend to grow faster than the average growth rate; (d) a large fraction of R&D in the
Level of competition
Entry rate of foreign firms in market
To
tal
fact
or
pro
du
ctiv
ity
gro
wth
0
0.08
–0.02
0
0.02
0.02
Near frontier
Far from frontier
0.060.04
0.04
0.06
Figure 2
Entry and growth. Figure taken from Aghion et al. (2009a).
5That competition and patent protection should be complementary in enhancing growth rather than mutually exclusive is atodds with Romer’s (1990) product variety model, in which competition is always detrimental to innovation and growth (asdiscussed above) for exactly the same reason that IPRs in the form of patent protection are good for innovation: Namely,competition reduces postinnovation rents, whereas patent protection increases these rents. Acemoglu & Akcigit (2012)provide a general analysis of optimal patent protection in Schumpeterian models with step-by-step innovation.
563www.annualreviews.org � The Schumpeterian Growth Paradigm
Ann
u. R
ev. E
con.
201
5.7:
557-
575.
Dow
nloa
ded
from
ww
w.a
nnua
lrev
iew
s.or
g A
cces
s pr
ovid
ed b
y B
row
n U
nive
rsity
on
09/1
4/15
. For
per
sona
l use
onl
y.
United States is done by incumbents; and (e) the reallocation of inputs between entrants andincumbents is an important source of productivity growth.
These are all facts that non-Schumpeterian growth models cannot account for. In particular,the first four facts listed require a new firm to enter, expand, then shrink over time, and eventuallybe replaced by new entrants. These and the last fact on the importance of reallocation are allembodied in the Schumpeterian idea of creative destruction.
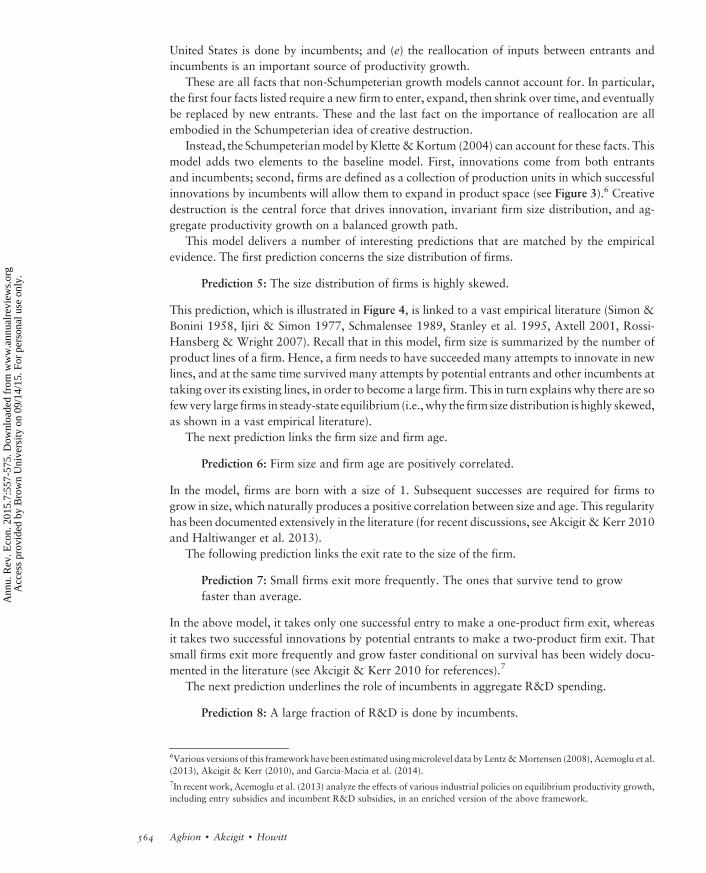
Instead, the Schumpeterianmodel byKlette &Kortum (2004) can account for these facts. Thismodel adds two elements to the baseline model. First, innovations come from both entrantsand incumbents; second, firms are defined as a collection of production units in which successfulinnovations by incumbents will allow them to expand in product space (see Figure 3).6 Creativedestruction is the central force that drives innovation, invariant firm size distribution, and ag-gregate productivity growth on a balanced growth path.
This model delivers a number of interesting predictions that are matched by the empiricalevidence. The first prediction concerns the size distribution of firms.
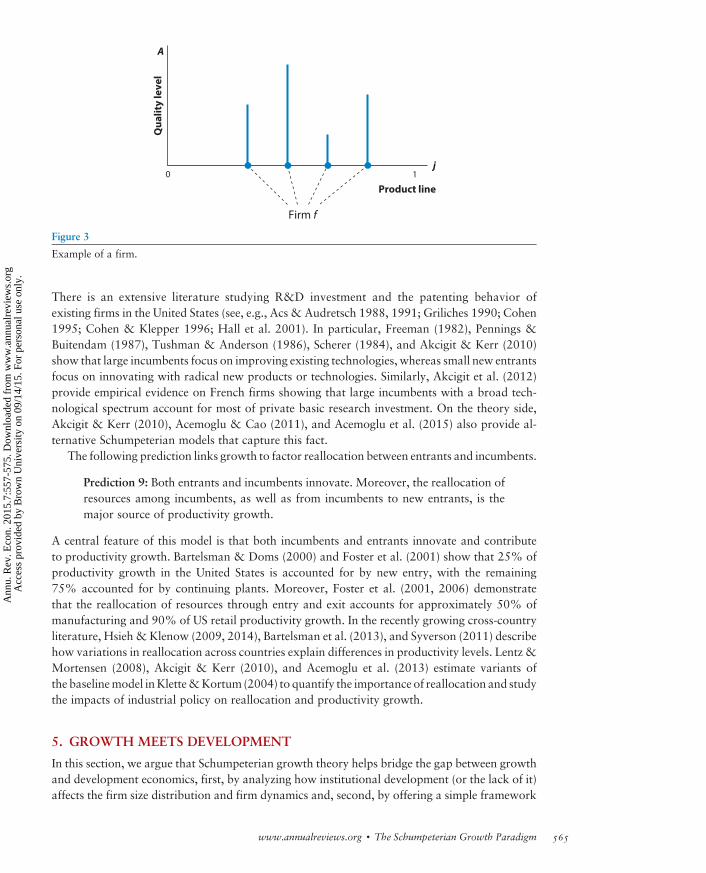
Prediction 5: The size distribution of firms is highly skewed.
This prediction, which is illustrated in Figure 4, is linked to a vast empirical literature (Simon &Bonini 1958, Ijiri & Simon 1977, Schmalensee 1989, Stanley et al. 1995, Axtell 2001, Rossi-Hansberg & Wright 2007). Recall that in this model, firm size is summarized by the number ofproduct lines of a firm. Hence, a firm needs to have succeeded many attempts to innovate in newlines, and at the same time survived many attempts by potential entrants and other incumbents attaking over its existing lines, in order to become a large firm. This in turn explains why there are sofewvery large firms in steady-state equilibrium (i.e.,why the firm size distribution is highly skewed,as shown in a vast empirical literature).
The next prediction links the firm size and firm age.
Prediction 6: Firm size and firm age are positively correlated.
In the model, firms are born with a size of 1. Subsequent successes are required for firms togrow in size, which naturally produces a positive correlation between size and age. This regularityhas been documented extensively in the literature (for recent discussions, see Akcigit & Kerr 2010and Haltiwanger et al. 2013).
The following prediction links the exit rate to the size of the firm.
Prediction 7: Small firms exit more frequently. The ones that survive tend to growfaster than average.
In the above model, it takes only one successful entry to make a one-product firm exit, whereasit takes two successful innovations by potential entrants to make a two-product firm exit. Thatsmall firms exit more frequently and grow faster conditional on survival has been widely docu-mented in the literature (see Akcigit & Kerr 2010 for references).7
The next prediction underlines the role of incumbents in aggregate R&D spending.
Prediction 8: A large fraction of R&D is done by incumbents.
6Various versions of this frameworkhave been estimated usingmicrolevel data by Lentz&Mortensen (2008), Acemoglu et al.(2013), Akcigit & Kerr (2010), and Garcia-Macia et al. (2014).7In recent work, Acemoglu et al. (2013) analyze the effects of various industrial policies on equilibrium productivity growth,including entry subsidies and incumbent R&D subsidies, in an enriched version of the above framework.
564 Aghion � Akcigit � Howitt
Ann
u. R
ev. E
con.
201
5.7:
557-
575.
Dow
nloa
ded
from
ww
w.a
nnua
lrev
iew
s.or
g A
cces
s pr
ovid
ed b
y B
row
n U
nive
rsity
on
09/1
4/15
. For
per
sona
l use
onl
y.
There is an extensive literature studying R&D investment and the patenting behavior ofexisting firms in the United States (see, e.g., Acs & Audretsch 1988, 1991; Griliches 1990; Cohen1995; Cohen & Klepper 1996; Hall et al. 2001). In particular, Freeman (1982), Pennings &Buitendam (1987), Tushman & Anderson (1986), Scherer (1984), and Akcigit & Kerr (2010)show that large incumbents focus on improving existing technologies, whereas small new entrantsfocus on innovating with radical new products or technologies. Similarly, Akcigit et al. (2012)provide empirical evidence on French firms showing that large incumbents with a broad tech-nological spectrum account for most of private basic research investment. On the theory side,Akcigit & Kerr (2010), Acemoglu & Cao (2011), and Acemoglu et al. (2015) also provide al-ternative Schumpeterian models that capture this fact.
The following prediction links growth to factor reallocation between entrants and incumbents.
Prediction 9: Both entrants and incumbents innovate. Moreover, the reallocation ofresources among incumbents, as well as from incumbents to new entrants, is themajor source of productivity growth.
A central feature of this model is that both incumbents and entrants innovate and contributeto productivity growth. Bartelsman & Doms (2000) and Foster et al. (2001) show that 25% ofproductivity growth in the United States is accounted for by new entry, with the remaining75% accounted for by continuing plants. Moreover, Foster et al. (2001, 2006) demonstratethat the reallocation of resources through entry and exit accounts for approximately 50% ofmanufacturing and 90% of US retail productivity growth. In the recently growing cross-countryliterature, Hsieh &Klenow (2009, 2014), Bartelsman et al. (2013), and Syverson (2011) describehow variations in reallocation across countries explain differences in productivity levels. Lentz &Mortensen (2008), Akcigit & Kerr (2010), and Acemoglu et al. (2013) estimate variants ofthe baselinemodel inKlette&Kortum (2004) to quantify the importance of reallocation and studythe impacts of industrial policy on reallocation and productivity growth.
5. GROWTH MEETS DEVELOPMENT
In this section, we argue that Schumpeterian growth theory helps bridge the gap between growthand development economics, first, by analyzing how institutional development (or the lack of it)affects the firm size distribution and firm dynamics and, second, by offering a simple framework
0 1
Firm f
Qu
ali
ty l
ev
el
A
Product line
j
Figure 3
Example of a firm.
565www.annualreviews.org � The Schumpeterian Growth Paradigm
Ann
u. R
ev. E
con.
201
5.7:
557-
575.
Dow
nloa
ded
from
ww
w.a
nnua
lrev
iew
s.or
g A
cces
s pr
ovid
ed b
y B
row
n U
nive
rsity
on
09/1
4/15
. For
per
sona
l use
onl
y.
to capture the idea that growth-enhancingpolicies or institutionsmayvarywith a country’s level oftechnological development.
5.1. Innovation, Institutions, and Firm Dynamics in Developing Countries
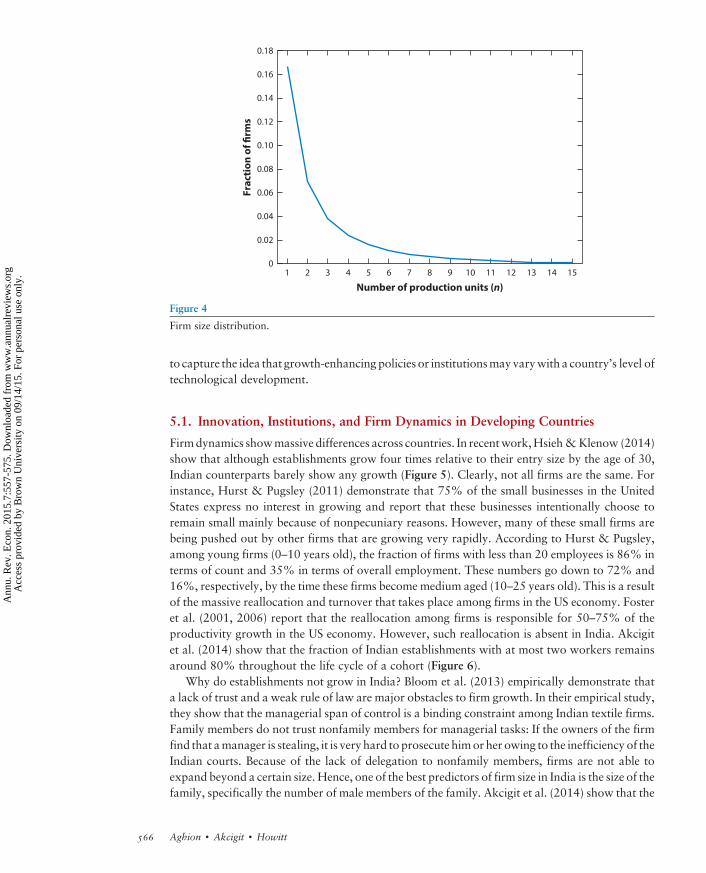
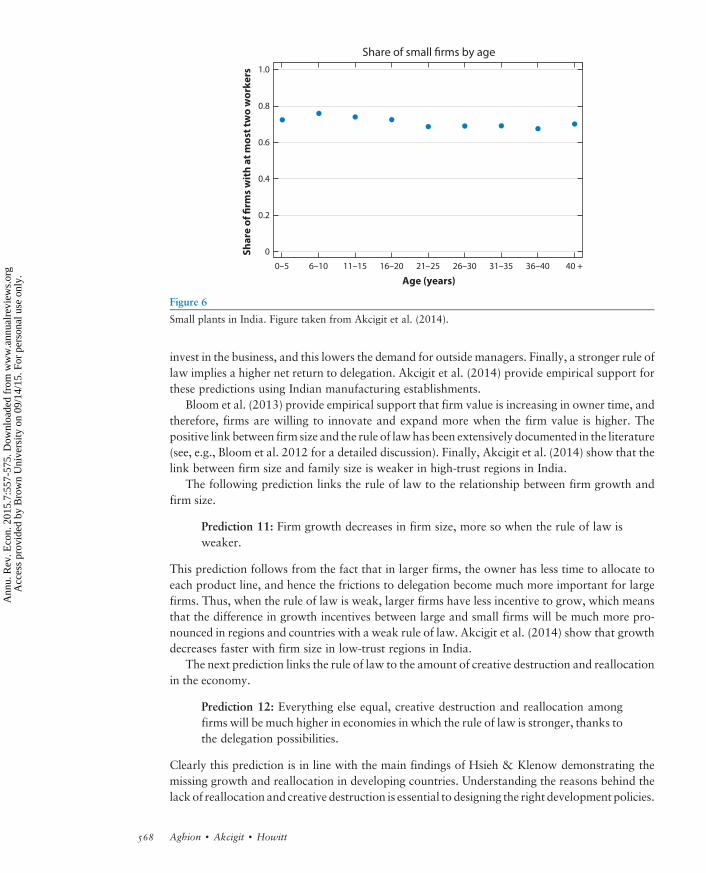
Firmdynamics showmassive differences across countries. In recentwork,Hsieh&Klenow (2014)show that although establishments grow four times relative to their entry size by the age of 30,Indian counterparts barely show any growth (Figure 5). Clearly, not all firms are the same. Forinstance, Hurst & Pugsley (2011) demonstrate that 75% of the small businesses in the UnitedStates express no interest in growing and report that these businesses intentionally choose toremain small mainly because of nonpecuniary reasons. However, many of these small firms arebeing pushed out by other firms that are growing very rapidly. According to Hurst & Pugsley,among young firms (0–10 years old), the fraction of firms with less than 20 employees is 86% interms of count and 35% in terms of overall employment. These numbers go down to 72% and16%, respectively, by the time these firms become medium aged (10–25 years old). This is a resultof the massive reallocation and turnover that takes place among firms in the US economy. Fosteret al. (2001, 2006) report that the reallocation among firms is responsible for 50–75% of theproductivity growth in the US economy. However, such reallocation is absent in India. Akcigitet al. (2014) show that the fraction of Indian establishments with at most two workers remainsaround 80% throughout the life cycle of a cohort (Figure 6).
Why do establishments not grow in India? Bloom et al. (2013) empirically demonstrate thata lack of trust and a weak rule of law are major obstacles to firm growth. In their empirical study,they show that the managerial span of control is a binding constraint among Indian textile firms.Family members do not trust nonfamily members for managerial tasks: If the owners of the firmfind that amanager is stealing, it is very hard to prosecute himor her owing to the inefficiency of theIndian courts. Because of the lack of delegation to nonfamily members, firms are not able toexpand beyond a certain size. Hence, one of the best predictors of firm size in India is the size of thefamily, specifically the number of male members of the family. Akcigit et al. (2014) show that the
1 2 3 4 5 6 7 8
Number of production units (n)
Fra
ctio
n o
f fi
rms
1514131211109
0.18
0.16
0.14
0.12
0.10
0.08
0.06
0
0.02
0.04
Figure 4
Firm size distribution.
566 Aghion � Akcigit � Howitt
Ann
u. R
ev. E
con.
201
5.7:
557-
575.
Dow
nloa
ded
from
ww
w.a
nnua
lrev
iew
s.or
g A
cces
s pr
ovid
ed b
y B
row
n U
nive
rsity
on
09/1
4/15
. For
per
sona
l use
onl
y.
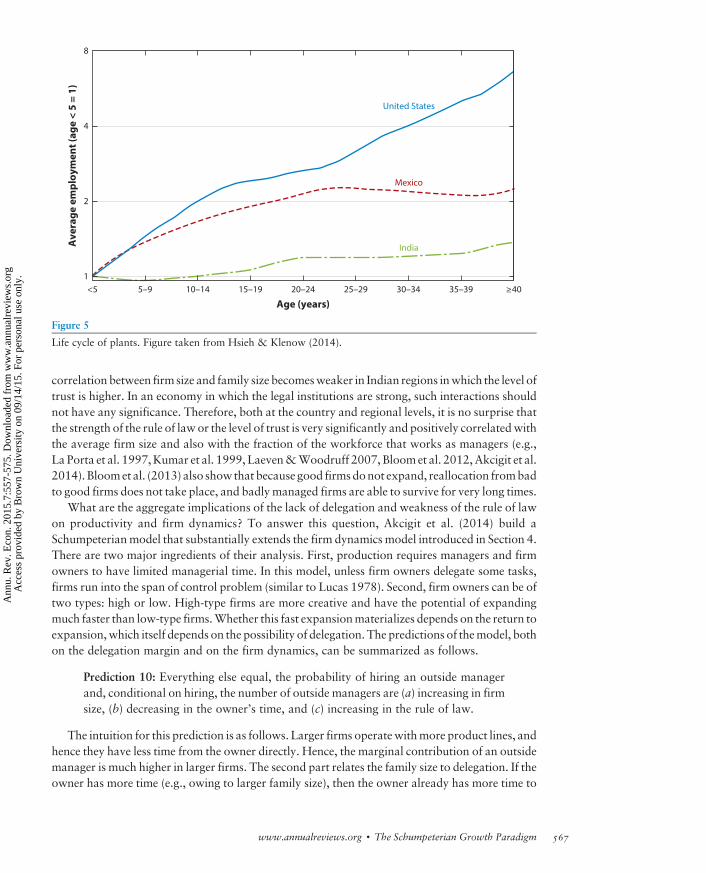
correlation between firm size and family size becomesweaker in Indian regions inwhich the level oftrust is higher. In an economy in which the legal institutions are strong, such interactions shouldnot have any significance. Therefore, both at the country and regional levels, it is no surprise thatthe strength of the rule of law or the level of trust is very significantly and positively correlatedwiththe average firm size and also with the fraction of the workforce that works as managers (e.g.,La Porta et al. 1997,Kumar et al. 1999, Laeven&Woodruff 2007, Bloomet al. 2012,Akcigit et al.2014). Bloomet al. (2013) also show that because good firmsdonot expand, reallocation frombadto good firms does not take place, and badlymanaged firms are able to survive for very long times.
What are the aggregate implications of the lack of delegation and weakness of the rule of lawon productivity and firm dynamics? To answer this question, Akcigit et al. (2014) build aSchumpeterianmodel that substantially extends the firm dynamics model introduced in Section 4.There are two major ingredients of their analysis. First, production requires managers and firmowners to have limited managerial time. In this model, unless firm owners delegate some tasks,firms run into the span of control problem (similar to Lucas 1978). Second, firm owners can be oftwo types: high or low. High-type firms are more creative and have the potential of expandingmuch faster than low-type firms.Whether this fast expansionmaterializes depends on the return toexpansion,which itself depends on the possibility of delegation. The predictions of themodel, bothon the delegation margin and on the firm dynamics, can be summarized as follows.
Prediction 10: Everything else equal, the probability of hiring an outside managerand, conditional on hiring, the number of outside managers are (a) increasing in firmsize, (b) decreasing in the owner’s time, and (c) increasing in the rule of law.
The intuition for this prediction is as follows. Larger firms operatewithmore product lines, andhence they have less time from the owner directly. Hence, the marginal contribution of an outsidemanager is much higher in larger firms. The second part relates the family size to delegation. If theowner has more time (e.g., owing to larger family size), then the owner already has more time to
Av
era
ge
em
plo
ym
en
t (a
ge
< 5
= 1
)
Age (years)
United States
India
Mexico
<5
1
8
4
2
35–3930–3425–2920–2415–1910–145–9 ≥40
Figure 5
Life cycle of plants. Figure taken from Hsieh & Klenow (2014).
567www.annualreviews.org � The Schumpeterian Growth Paradigm
Ann
u. R
ev. E
con.
201
5.7:
557-
575.
Dow
nloa
ded
from
ww
w.a
nnua
lrev
iew
s.or
g A
cces
s pr
ovid
ed b
y B
row
n U
nive
rsity
on
09/1
4/15
. For
per
sona
l use
onl
y.
invest in the business, and this lowers the demand for outside managers. Finally, a stronger rule oflaw implies a higher net return to delegation. Akcigit et al. (2014) provide empirical support forthese predictions using Indian manufacturing establishments.
Bloom et al. (2013) provide empirical support that firm value is increasing in owner time, andtherefore, firms are willing to innovate and expand more when the firm value is higher. Thepositive link between firm size and the rule of lawhas been extensively documented in the literature(see, e.g., Bloom et al. 2012 for a detailed discussion). Finally, Akcigit et al. (2014) show that thelink between firm size and family size is weaker in high-trust regions in India.
The following prediction links the rule of law to the relationship between firm growth andfirm size.
Prediction 11: Firm growth decreases in firm size, more so when the rule of law isweaker.
This prediction follows from the fact that in larger firms, the owner has less time to allocate toeach product line, and hence the frictions to delegation become much more important for largefirms. Thus, when the rule of law is weak, larger firms have less incentive to grow, which meansthat the difference in growth incentives between large and small firms will be much more pro-nounced in regions and countries with a weak rule of law. Akcigit et al. (2014) show that growthdecreases faster with firm size in low-trust regions in India.
The next prediction links the rule of law to the amount of creative destruction and reallocationin the economy.
Prediction 12: Everything else equal, creative destruction and reallocation amongfirms will be much higher in economies in which the rule of law is stronger, thanks tothe delegation possibilities.
Clearly this prediction is in line with the main findings of Hsieh & Klenow demonstrating themissing growth and reallocation in developing countries. Understanding the reasons behind thelackof reallocation and creative destruction is essential to designing the right development policies.
Sh
are
of
firm
s w
ith
at
mo
st t
wo
wo
rke
rs
Age (years)
Share of small firms by age
0.8
0.6
0.4
0.2
0
1.0
21–2516–2011–156–10 26–30 31–35 36–400–5 40 +
Figure 6
Small plants in India. Figure taken from Akcigit et al. (2014).
568 Aghion � Akcigit � Howitt
Ann
u. R
ev. E
con.
201
5.7:
557-
575.
Dow
nloa
ded
from
ww
w.a
nnua
lrev
iew
s.or
g A
cces
s pr
ovid
ed b
y B
row
n U
nive
rsity
on
09/1
4/15
. For
per
sona
l use
onl
y.

The Schumpeterian growth framework provides a useful framework to conduct counterfactualpolicy exercises that can shed light on this important debate.
5.2. Innovation Versus Imitation and the Notion of Appropriate Institutions
Policies and institutions that are appropriate for countries close to the global technology frontierare often different from those that are appropriate for nonfrontier countries. This is because thosepolicies and institutions that help a country copy, adapt, and implement leading-edge technologiesare not necessarily the same as those that help it make leading-edge innovations. Acemoglu et al.(2006) develop the idea of appropriate institutions more systematically, and it underlies morerecentwork, in particular, Acemoglu&Robinson’s (2012) best-selling book,WhyNations Fail, inwhich the authors rely on a rich set of country studies to argue that sustained growth requirescreative destruction and therefore is not sustainable in countries with “extractive institutions.”
A particularly direct and simpler way to formalize the idea of appropriate growth policy is tomove for amoment from continuous to discrete time. Following Acemoglu et al. (2006) and moreremotely Nelson & Phelps (1966), let At denote the current average productivity in the domesticcountry and At denote the current (world) frontier productivity. Then, think of innovation asmultiplying productivity by factor g and of imitation as catching up with the frontier technology.
Then, if the fraction mn of sectors innovates and the fraction mm imitates, we have
Atþ1 � At ¼ mnðg � 1ÞAt þ mm
�At � At
�.
This in turn implies that productivity growth hinges upon the country’s degree of frontierness, thatis, its proximity at ¼ At=At to the world frontier, namely,
gt ¼ Atþ1 � At
At¼ mnðg � 1Þ þ mm
�a�1t � 1
�.
In particular, we have the following prediction.
Prediction 13: The closer to the frontier an economy is (i.e., the closer to 1 theproximity variable at is), the more growth is driven by innovation-enhancing ratherthan imitation-enhancing policies or institutions.
Section 3 discusses some recent evidence for the prediction that competition and free entryshould be more growth enhancing. Using a cross-country panel of more than 100 countries overthe 1960–2000 period, Acemoglu et al. (2006) regress the average growth rate on a country’sdistance to the US frontier (measured by the ratio of GDP per capita in that country to GDP percapita in the United States) at the beginning of the period. Then, they split the sample of countriesinto two groups: countries that are more open than the median and countries that are less openthan the median. The prediction is as follows.
Prediction 14:Average growth should decreasemore rapidly as a country approachesthe world frontier when openness is low.
To measure openness, one can use imports plus exports divided by aggregate GDP. But thismeasure suffers from obvious endogeneity problems; in particular, exports and imports are likelyto be influenced by domestic growth. To deal with the endogeneity problem, Frankel & Romer(1999) construct a more exogenous measure of openness that relies on exogenous characteristics
569www.annualreviews.org � The Schumpeterian Growth Paradigm
Ann
u. R
ev. E
con.
201
5.7:
557-
575.
Dow
nloa
ded
from
ww
w.a
nnua
lrev
iew
s.or
g A
cces
s pr
ovid
ed b
y B
row
n U
nive
rsity
on
09/1
4/15
. For
per
sona
l use
onl
y.
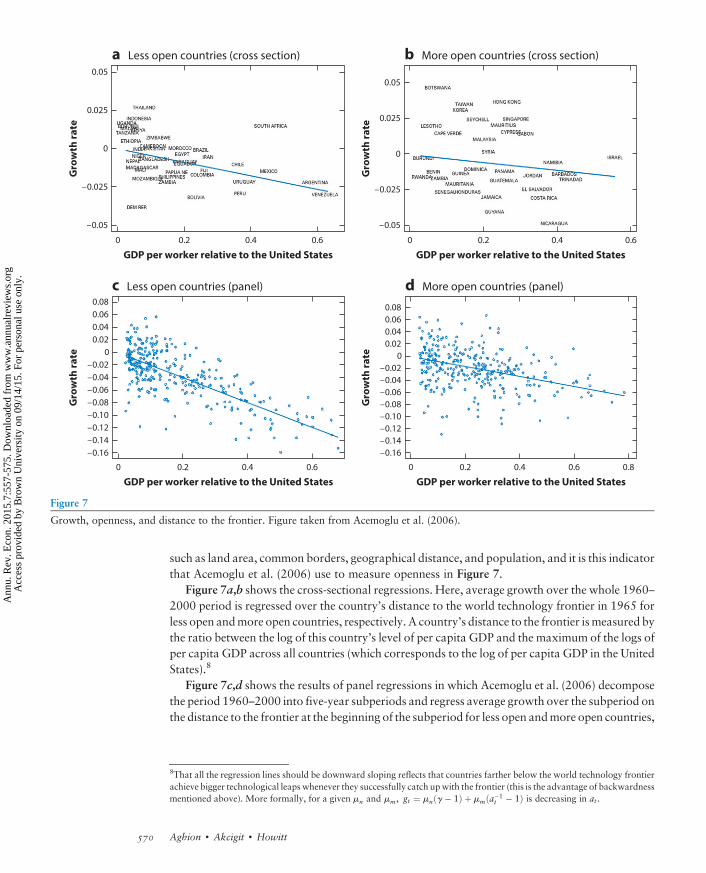
such as land area, common borders, geographical distance, and population, and it is this indicatorthat Acemoglu et al. (2006) use to measure openness in Figure 7.
Figure 7a,b shows the cross-sectional regressions. Here, average growth over the whole 1960–2000 period is regressed over the country’s distance to the world technology frontier in 1965 forless open andmore open countries, respectively. A country’s distance to the frontier ismeasured bythe ratio between the log of this country’s level of per capita GDP and the maximum of the logs ofper capita GDP across all countries (which corresponds to the log of per capita GDP in the UnitedStates).8
Figure 7c,d shows the results of panel regressions in which Acemoglu et al. (2006) decomposethe period 1960–2000 into five-year subperiods and regress average growth over the subperiod onthe distance to the frontier at the beginning of the subperiod for less open andmore open countries,
GDP per worker relative to the United States
Gro
wth
ra
te
–0.05
0 0.60.40.2
–0.025
0
0.025
0.05
a Less open countries (cross section)
Gro
wth
ra
te
–0.16
GDP per worker relative to the United States
0 0.60.40.2
–0.12
–0.10
–0.14
–0.02
–0.04
–0.06
–0.08
0
0.02
0.06
0.08
0.04
c Less open countries (panel)
GDP per worker relative to the United States
Gro
wth
ra
te
–0.05
0 0.60.40.2
–0.025
0
0.025
0.05
Gro
wth
ra
te
–0.16
GDP per worker relative to the United States
0 0.60.40.2
–0.12
–0.10
–0.14
–0.02
–0.04
–0.06
–0.08
0
0.02
0.06
0.08
0.04
0.8
d More open countries (panel)
b More open countries (cross section)
Figure 7
Growth, openness, and distance to the frontier. Figure taken from Acemoglu et al. (2006).
8That all the regression lines should be downward sloping reflects that countries farther below the world technology frontierachieve bigger technological leapswhenever they successfully catch upwith the frontier (this is the advantage of backwardnessmentioned above). More formally, for a given mn and mm, gt ¼ mnðg � 1Þ þ mmða�1
t � 1Þ is decreasing in at .
570 Aghion � Akcigit � Howitt
Ann
u. R
ev. E
con.
201
5.7:
557-
575.
Dow
nloa
ded
from
ww
w.a
nnua
lrev
iew
s.or
g A
cces
s pr
ovid
ed b
y B
row
n U
nive
rsity
on
09/1
4/15
. For
per
sona
l use
onl
y.
respectively. These latter regressions control for country fixed effects. In both cross-sectional andpanel regressions,we see that, although a lowdegree of openness does not appear to be detrimentalto growth in countries far below the world frontier, it becomes increasingly detrimental to growthas countries approach the frontier.
Acemoglu et al. (2006) repeat the same exercise using entry costs faced by new firms instead ofopenness. The prediction is the following.
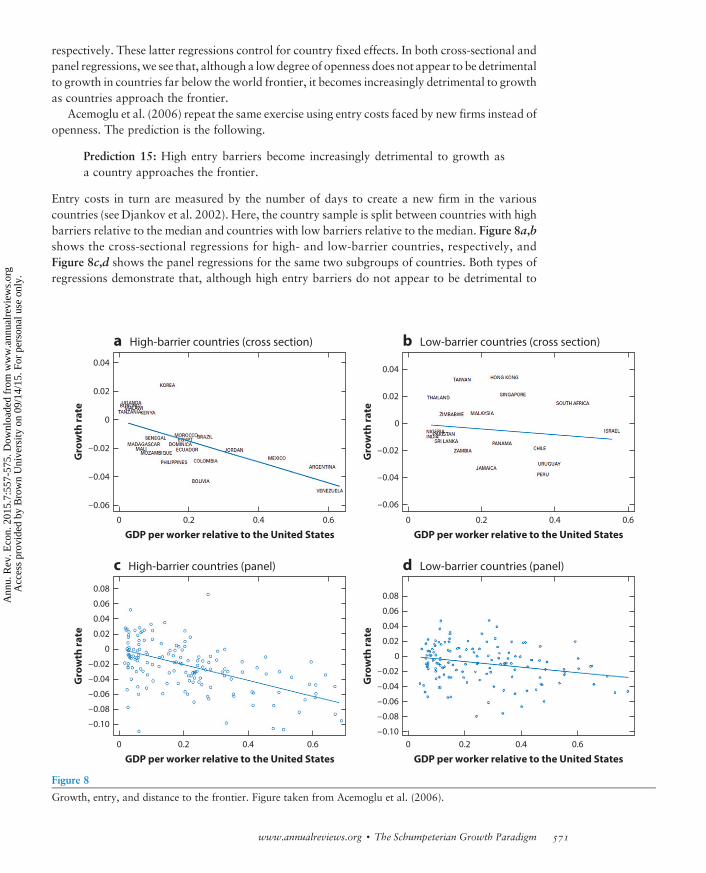
Prediction 15: High entry barriers become increasingly detrimental to growth asa country approaches the frontier.
Entry costs in turn are measured by the number of days to create a new firm in the variouscountries (see Djankov et al. 2002). Here, the country sample is split between countries with highbarriers relative to the median and countries with low barriers relative to the median. Figure 8a,bshows the cross-sectional regressions for high- and low-barrier countries, respectively, andFigure 8c,d shows the panel regressions for the same two subgroups of countries. Both types ofregressions demonstrate that, although high entry barriers do not appear to be detrimental to
GDP per worker relative to the United States
a High-barrier countries (cross section) b Low-barrier countries (cross section)
Gro
wth
ra
te
–0.06
0 0.60.40.2
–0.04
–0.02
0
0.02
0.04G
row
th r
ate
–0.06
GDP per worker relative to the United States
0 0.60.40.2
–0.04
–0.02
0
0.02
0.04
c High-barrier countries (panel) d Low-barrier countries (panel)
GDP per worker relative to the United States
Gro
wth
ra
te
–0.10
0 0.60.40.2
–0.08
–0.02
–0.04
–0.06
0
0.04
0.02
0.06
0.08
Gro
wth
ra
te
–0.10
GDP per worker relative to the United States
0 0.60.40.2
–0.06
–0.08
–0.02
–0.04
0
0.02
0.06
0.08
0.04
Figure 8
Growth, entry, and distance to the frontier. Figure taken from Acemoglu et al. (2006).
571www.annualreviews.org � The Schumpeterian Growth Paradigm
Ann
u. R
ev. E
con.
201
5.7:
557-
575.
Dow
nloa
ded
from
ww
w.a
nnua
lrev
iew
s.or
g A
cces
s pr
ovid
ed b
y B
row
n U
nive
rsity
on
09/1
4/15
. For
per
sona
l use
onl
y.
growth in countries far below the world frontier, they indeed become increasingly detrimental togrowth as countries approach the frontier.
These two empirical exercises point to the importance of interacting institutions or policieswith technological variables in growth regressions: Openness is particularly growth enhancing incountries closer to the technological frontier, and entry is more growth enhancing in countries orsectors closer to the technological frontier. Below we see that higher (in particular, graduate)education tends to be more growth enhancing in countries or in US states that are closer to thetechnological frontier, whereas primary-secondary (possibly undergraduate) education tends tobe more growth enhancing in countries or in US states that are farther below the frontier.
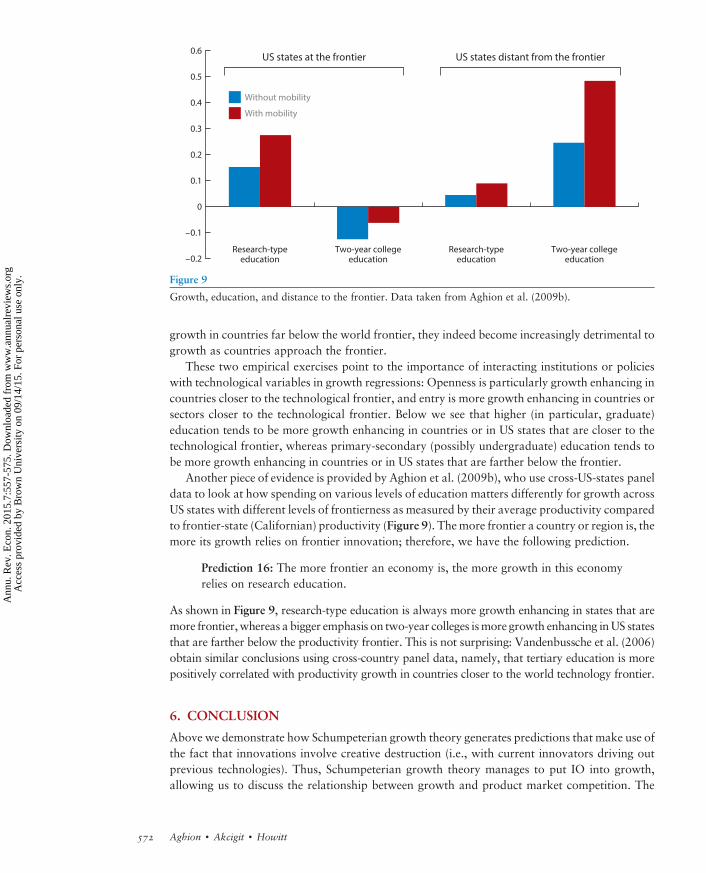
Another piece of evidence is provided by Aghion et al. (2009b), who use cross-US-states paneldata to look at how spending on various levels of education matters differently for growth acrossUS states with different levels of frontierness as measured by their average productivity comparedto frontier-state (Californian) productivity (Figure 9). Themore frontier a country or region is, themore its growth relies on frontier innovation; therefore, we have the following prediction.
Prediction 16: The more frontier an economy is, the more growth in this economyrelies on research education.
As shown in Figure 9, research-type education is always more growth enhancing in states that aremore frontier,whereas a bigger emphasis on two-year colleges ismore growth enhancing inUS statesthat are farther below the productivity frontier. This is not surprising: Vandenbussche et al. (2006)obtain similar conclusions using cross-country panel data, namely, that tertiary education is morepositively correlated with productivity growth in countries closer to the world technology frontier.
6. CONCLUSION
Above we demonstrate how Schumpeterian growth theory generates predictions that make use ofthe fact that innovations involve creative destruction (i.e., with current innovators driving outprevious technologies). Thus, Schumpeterian growth theory manages to put IO into growth,allowing us to discuss the relationship between growth and product market competition. The
US states at the frontier
Research-typeeducation
Research-typeeducation
Two-year collegeeducation–0.2
–0.1
0
0.6
0.5
0.4
0.3
0.2
0.1
Two-year collegeeducation
US states distant from the frontier
Without mobility
With mobility
Figure 9
Growth, education, and distance to the frontier. Data taken from Aghion et al. (2009b).
572 Aghion � Akcigit � Howitt
Ann
u. R
ev. E
con.
201
5.7:
557-
575.
Dow
nloa
ded
from
ww
w.a
nnua
lrev
iew
s.or
g A
cces
s pr
ovid
ed b
y B
row
n U
nive
rsity
on
09/1
4/15
. For
per
sona
l use
onl
y.
framework can be used to link growth with firm dynamics, thereby generating predictions on thedynamic patterns of markets and firms (e.g., entry, exit, reallocation) and on the ways in whichthese patterns shape the overall growth process. We argue that Schumpeterian growth theoryhelps us reconcile growth with development. First, it helps us look at how institutional de-velopment shapes the relationship among firm size distribution, reallocation, and growth. Second,it brings out the notion of appropriate growth institutions and policies, that is, the idea that whatdrives growth in a sector (or country) far below the world technology frontier is not necessarilywhat drives growth in a sector or country at the technological frontier, at which creative de-struction plays a more important role.
The Schumpeterian growth framework can be further developed in several interesting direc-tions.We are currently exploring three newavenues.One is the relationship among innovation-ledgrowth, top income shares, and social mobility. The Schumpeterian paradigm predicts that moreinnovation should increase both top income shares (these include the rewards to successfulinnovators) and social mobility (by virtue of creative destruction, which implies that new inno-vators should continuously challenge the vested interests of previous innovators). A second avenueis the analysis of the relationship between innovation-led growth andwell-being.On the one hand,more creative destruction implies more job destruction, which should reduce the well-being ofcurrently employed workers. On the other hand, more creative destruction implies more new jobcreation and a higher growth rate, both of which should bewelfare enhancing. A third avenue is toanalyze how firm size relates to the type of innovation the firm pursues. In particular, are moreradical innovations pursued by smaller or by larger firms, and is the answer to this question thesame in developed and less developed countries? These and many other potential applications ofthe Schumpeterian paradigm are left for future research.
DISCLOSURE STATEMENT
The authors are not aware of any affiliations, memberships, funding, or financial holdings thatmight be perceived as affecting the objectivity of this review.
ACKNOWLEDGMENTS
We thank Timothy Bresnahan for excellent comments and suggestions.
LITERATURE CITED
Acemoglu D. 2009. Introduction to Modern Economic Growth. Princeton, NJ: Princeton Univ. PressAcemoglu D, Aghion P, Zilibotti F. 2006. Distance to frontier, selection, and economic growth. J. Eur. Econ.
Assoc. 4:37–74Acemoglu D, Akcigit U. 2012. Intellectual property rights policy, competition and innovation. J. Eur. Econ.
Assoc. 10:1–42Acemoglu D, Akcigit U, Bloom N, Kerr W. 2013. Innovation, reallocation and growth. NBER Work. Pap.
18993Acemoglu D, Akcigit U, Hanley D, Kerr W. 2015. Transition to clean technology. J. Polit. Econ. In pressAcemoglu D, Cao D. 2011. Innovation by entrants and incumbents. Unpublished manuscript, Mass. Inst.
Technol., Cambridge, MAAcemoglu D, Robinson J. 2012. Why Nations Fail. New York: Crown Bus.Acs Z, Audretsch D. 1988. Innovation in large and small firms: an empirical analysis. Am. Econ. Rev.
78:678–90Acs Z, Audretsch D. 1991. Innovation and size at the firm level. South. Econ. J. 57:739–44
573www.annualreviews.org � The Schumpeterian Growth Paradigm
Ann
u. R
ev. E
con.
201
5.7:
557-
575.
Dow
nloa
ded
from
ww
w.a
nnua
lrev
iew
s.or
g A
cces
s pr
ovid
ed b
y B
row
n U
nive
rsity
on
09/1
4/15
. For
per
sona
l use
onl
y.

Aghion P, Bloom N, Blundell R, Griffith R, Howitt P. 2005. Competition and innovation: an inverted-Urelationship. Q. J. Econ. 120:701–28
Aghion P, Blundell R, Griffith R, Howitt P, Prantl S. 2009a. The effects of entry on incumbent innovation andproductivity. Rev. Econ. Stat. 91:20–32
Aghion P, Boustan L, Hoxby C, Vandenbussche J. 2009b. Exploiting states’ mistakes to identify the causaleffects of higher education on growth. Unpublished manuscript, Harvard Univ., Cambridge, MA
Aghion P, Griffith R. 2006. Competition and Growth: Reconciling Theory and Evidence. Cambridge, MA:MIT Press
Aghion P, Harris C, Howitt P, Vickers J. 2001. Competition, imitation and growth with step-by-step in-novation. Rev. Econ. Stud. 68:467–92
Aghion P, Harris C, Vickers J. 1997. Competition and growth with step-by-step innovation: an example.Eur Econ. Rev. 41:771–82
Aghion P, Howitt P. 1992. A model of growth through creative destruction. Econometrica 60:323–51Aghion P, Howitt P. 1998. Endogenous Growth Theory. Cambridge, MA: MIT PressAghion P, Howitt P. 2009. The Economics of Growth. Cambridge, MA: MIT PressAghion P, Howitt P, Prantl S. 2013. Patent rights, product market reforms and innovation. NBERWork. Pap.
18854Akcigit U, Alp H, Peters M. 2014. Lack of selection and limits to delegation: firm dynamics in developing
countries. Work. Pap., Univ. Pa., PhiladelphiaAkcigit U, Hanley D, Serrano-Velarde N. 2012. Back to basics: basic research spillovers, innovation policy
and growth. Unpublished manuscript, Univ. Pa., PhiladelphiaAkcigit U, Kerr W. 2010. Growth through heterogeneous innovations. NBER Work. Pap. 16443Axtell R. 2001. Zipf distribution of US firm sizes. Science 293:1818–20Barro RJ, Sala-i-Martin X. 2003. Economic Growth. New York: McGraw-HillBartelsman E, DomsM. 2000. Understanding productivity: lessons from longitudinal microdata. J. Econ. Lit.
38:569–94Bartelsman E, Haltiwanger J, Scarpetta S. 2013. Cross-country differences in productivity: the role of allo-
cation and selection. Am. Econ. Rev. 103:305–34Bloom N, Eifert B, McKenzie D, Mahajan A, Roberts J. 2013. Does management matter? Evidence from
India. Q. J. Econ. 128:1–51BloomN, SadunR,VanReenen J. 2012. Theorganizationof firms across countries.Q. J. Econ.127:1663–705Blundell R, Griffith R, Van Reenen J. 1995. Dynamic count data models of technological innovation. Econ. J.
105:333–44Blundell R, Griffith R, Van Reenen J. 1999. Market share, market value and innovation in a panel of British
manufacturing firms. Rev. Econ. Stud. 66:529–54CohenW. 1995. Empirical studies of innovative activity. InHandbook of the Economics of Innovations and
Technological Change, ed. P Stoneman, pp. 182–264. Oxford, UK: BlackwellCohen W, Klepper S. 1996. Firm size and the nature of innovation within industries: the case of process and
product R&D. Rev. Econ. Stat. 78:232–43Corriveau L. 1991. Entrepreneurs, growth, and cycles. PhD Diss., Univ. West. OntarioDjankov S, La Porta R, Lopez-de-Silanes F, Shleifer A. 2002. The regulation of entry. Q. J. Econ. 117:1–37Foster L, Haltiwanger J, Krizan C. 2001. Aggregate productivity growth: lessons from microeconomic evi-
dence. InNewDirections inProductivityAnalysis, ed. EDean,MHarper,CHulten, pp. 303–72.Chicago:Univ. Chicago Press
Foster L, Haltiwanger J, Krizan C. 2006. Market selection, reallocation, and restructuring in the U.S. retailtrade sector in the 1990s. Rev. Econ. Stat. 88:748–58
Frankel J, Romer D. 1999. Does trade cause growth? Am. Econ. Rev. 89:379–99Freeman C. 1982. The Economics of Industrial Innovation. Cambridge, MA: MIT PressGalor O. 2011. Unified Growth Theory. Princeton, NJ: Princeton Univ. PressGarcia-Macia, D, Hsieh C, Klenow P. 2014. How destructive is innovation? Unpublished manuscript,
Stanford Univ., Stanford, CAGriliches Z. 1990. Patent statistics as economic indicators: a survey. J. Econ. Lit. 28:1661–707
574 Aghion � Akcigit � Howitt
Ann
u. R
ev. E
con.
201
5.7:
557-
575.
Dow
nloa
ded
from
ww
w.a
nnua
lrev
iew
s.or
g A
cces
s pr
ovid
ed b
y B
row
n U
nive
rsity
on
09/1
4/15
. For
per
sona
l use
onl
y.
Hall B, Jaffe A, TrajtenbergM. 2001.TheNBERpatent citation data file: lessons, insights andmethodologicaltools. NBER Work. Pap. 8498
Haltiwanger J, JarminR,Miranda J. 2013.Who creates jobs? Small versus large versus young.Rev. Econ. Stat.95:347–61
HsiehC,KlenowP. 2009.Misallocation andmanufacturingTFP inChina and India.Q. J. Econ. 124:1403–48Hsieh C, Klenow P. 2014. The life cycle of plants in India and Mexico. Q. J. Econ. 129:1035–84Hurst E, Pugsley B. 2011. What do small businesses do? Brookings Pap. Econ. Act. 43(2):73–142Ijiri Y, Simon H. 1977. Skew Distributions and the Sizes of Business Firms. Amsterdam: North-HollandJones C, Vollrath D. 2013. Introduction to Economic Growth. New York: NortonKlette T, Kortum S. 2004. Innovating firms and aggregate innovation. J. Polit. Econ. 112:986–1018Kumar KB, Rajan RG, Zingales L. 1999. What determines firm size? NBER Work. Pap. 7208La Porta R, Lopez-de-Silanes F, Shleifer A, Vishny RW. 1997. Trust in large organizations. Am. Econ. Rev.
87:333–38Laeven L, Woodruff C. 2007. The quality of the legal system, firm ownership, and firm size. Rev. Econ. Stat.
89:601–14Lentz R, Mortensen D. 2008. An empirical model of growth through product innovation. Econometrica
76:1317–73Lucas RE. 1978. On the size distribution of business firms. Bell J. Econ. 9:508–23Nelson R, Phelps E. 1966. Investment in humans, technological diffusion, and economic growth. Am. Econ.
Rev. 61:69–75Nickell S. 1996. Competition and corporate performance. J. Polit. Econ. 104:724–46Pennings JM, Buitendam A. 1987. New Technology as Organizational Innovation: The Development and
Diffusion of Microelectronics. Cambridge, MA: BallingerPeretto P. 1998. Technological change, market rivalry, and the evolution of the capitalist engine of growth.
J. Econ. Growth 3:53–80Romer P. 1990. Endogenous technical change. J. Polit. Econ. 98:71–102Rossi-Hansberg E, Wright M. 2007. Establishment size dynamics in the aggregate economy. Am. Econ. Rev.
97:1639–66Scherer FM. 1984. Innovation and Growth: Schumpeterian Perspectives. Cambridge, MA: MIT PressSchmalensee R. 1989. Inter-industry studies of structure and performance. In Handbook of Industrial
Organization, Vol. 2, ed. R Schmalensee, RD Willig, pp. 951–1009. Amsterdam: North-HollandSegerstrom P, Anant T, Dinopoulos E. 1990. A Schumpeterian model of the product cycle. Am. Econ. Rev.
88:1077–92Simon H, Bonini C. 1958. The size distribution of business firms. Am. Econ. Rev. 48:607–17StanleyM, Buldyrev S, Havlin S,Mantegna R, SalingerM, Stanley E. 1995. Zipf plots and the size distribution
of firms. Econ. Lett. 49:453–57Syverson C. 2011. What determines productivity? J. Econ. Lit. 49:326–65Tushman ML, Anderson P. 1986. Technological discontinuities and organizational environments. Adm. Sci.
Q. 31:439–65Vandenbussche J, Aghion P,Meghir C. 2006.Growth, distance to frontier, and composition of human capital.
J. Econ. Growth 11:97–127Weil D. 2012. Economic Growth. Englewood Cliffs, NJ: Prentice Hall
575www.annualreviews.org � The Schumpeterian Growth Paradigm
Ann
u. R
ev. E
con.
201
5.7:
557-
575.
Dow
nloa
ded
from
ww
w.a
nnua
lrev
iew
s.or
g A
cces
s pr
ovid
ed b
y B
row
n U
nive
rsity
on
09/1
4/15
. For
per
sona
l use
onl
y.

Annual Review of
Economics
Volume 7, 2015Contents
Knowledge-Based Hierarchies: Using Organizations to Understand theEconomyLuis Garicano and Esteban Rossi-Hansberg . . . . . . . . . . . . . . . . . . . . . . . . 1
Beyond Ricardo: Assignment Models in International TradeArnaud Costinot and Jonathan Vogel . . . . . . . . . . . . . . . . . . . . . . . . . . . . 31
The Roots of Gender Inequality in Developing CountriesSeema Jayachandran . . . . . . . . . . . . . . . . . . . . . . . . . . . . . . . . . . . . . . . . 63
Reconciling Micro and Macro Labor Supply Elasticities: A StructuralPerspectiveMichael Keane and Richard Rogerson . . . . . . . . . . . . . . . . . . . . . . . . . . . . 89
International Trade, Multinational Activity, and Corporate FinanceC. Fritz Foley and Kalina Manova . . . . . . . . . . . . . . . . . . . . . . . . . . . . . . 119
Policy Implications of Dynamic Public FinanceMikhail Golosov and Aleh Tsyvinski . . . . . . . . . . . . . . . . . . . . . . . . . . . . 147
Media and PoliticsDavid Strömberg . . . . . . . . . . . . . . . . . . . . . . . . . . . . . . . . . . . . . . . . . . 173
Forecasting in Nonstationary Environments: WhatWorks andWhat Doesn’tin Reduced-Form and Structural ModelsRaffaella Giacomini and Barbara Rossi . . . . . . . . . . . . . . . . . . . . . . . . . . 207
Political DecentralizationDilip Mookherjee . . . . . . . . . . . . . . . . . . . . . . . . . . . . . . . . . . . . . . . . . . 231
Household Debt: Facts, Puzzles, Theories, and PoliciesJonathan Zinman . . . . . . . . . . . . . . . . . . . . . . . . . . . . . . . . . . . . . . . . . . 251
Making Progress on Foreign AidNancy Qian . . . . . . . . . . . . . . . . . . . . . . . . . . . . . . . . . . . . . . . . . . . . . . 277
v
Ann
u. R
ev. E
con.
201
5.7:
557-
575.
Dow
nloa
ded
from
ww
w.a
nnua
lrev
iew
s.or
g A
cces
s pr
ovid
ed b
y B
row
n U
nive
rsity
on
09/1
4/15
. For
per
sona
l use
onl
y.

Credit, Financial Stability, and the MacroeconomyAlan M. Taylor . . . . . . . . . . . . . . . . . . . . . . . . . . . . . . . . . . . . . . . . . . . 309
Job Creation, Job Destruction, and Productivity Growth: The Role ofYoung BusinessesJohn Haltiwanger . . . . . . . . . . . . . . . . . . . . . . . . . . . . . . . . . . . . . . . . . . 341
The Evolution of Social NormsH. Peyton Young . . . . . . . . . . . . . . . . . . . . . . . . . . . . . . . . . . . . . . . . . . 359
Crime and Economic IncentivesMirko Draca and Stephen Machin . . . . . . . . . . . . . . . . . . . . . . . . . . . . . 389
Entrepreneurship and Financial Frictions: A Macrodevelopment PerspectiveFrancisco J. Buera, Joseph P. Kaboski, and Yongseok Shin . . . . . . . . . . . 409
The US Electricity Industry After 20 Years of RestructuringSeverin Borenstein and James Bushnell . . . . . . . . . . . . . . . . . . . . . . . . . . 437
Methods of Identification in Social NetworksBryan S. Graham . . . . . . . . . . . . . . . . . . . . . . . . . . . . . . . . . . . . . . . . . . 465
Affirmative Action in Undergraduate EducationPeter Arcidiacono, Michael Lovenheim, and Maria Zhu . . . . . . . . . . . . . 487
Is College a Worthwhile Investment?Lisa Barrow and Ofer Malamud . . . . . . . . . . . . . . . . . . . . . . . . . . . . . . . 519
The Schumpeterian Growth ParadigmPhilippe Aghion, Ufuk Akcigit, and Peter Howitt . . . . . . . . . . . . . . . . . . 557
Climate and ConflictMarshall Burke, Solomon M. Hsiang, and Edward Miguel . . . . . . . . . . . . 577
The Gains from Market IntegrationDave Donaldson . . . . . . . . . . . . . . . . . . . . . . . . . . . . . . . . . . . . . . . . . . 619
Valid Post-Selection and Post-Regularization Inference: An Elementary,General ApproachVictor Chernozhukov, Christian Hansen, and Martin Spindler . . . . . . . . . 649
Indexes
Cumulative Index of Contributing Authors, Volumes 3–7 689Cumulative Index of Article Titles, Volumes 3–7 692
Errata
An online log of corrections toAnnual Review of Economics articles may be found at http://www.annualreviews.org/errata/economics
vi Contents
Ann
u. R
ev. E
con.
201
5.7:
557-
575.
Dow
nloa
ded
from
ww
w.a
nnua
lrev
iew
s.or
g A
cces
s pr
ovid
ed b
y B
row
n U
nive
rsity
on
09/1
4/15
. For
per
sona
l use
onl
y.