Embed Size (px)
Citation preview
Innovation and Growth:
The Schumpeterian Perspective
Philippe Aghion�and Ufuk Akcigity
Draft Survey for discussion - COEURE Coordination Action
June 11, 2015
1 Introduction
There is a broad consensus among most European leaders and in Brussels on the importance of structural
reforms to foster innovation-based growth in Europe. However, this consensus has not reached the European
public at large. One recent example is France, where the timid reforms proposed by the Economy Minister
have met opposition from all political parties. So often do we hear that structural reforms amount to austerity,
and therefore are detrimental to growth and employment. Similarly, a commonly held view is that going for
supply side policies (structural reforms or �scal devaluations aimed at fostering such reforms) necessarily means
that we have decided to ignore the demand side. We also hear that a �scal system conducive to innovation
and entrepreneurship would necessarily aggravate inequality and reduce social mobility. The purpose of this
survey is twofold: �rst, to bring the reader up to speed with recent research in the Economics of Innovation
and Growth; second, to provide the reader with theoretical and empirical background to think about growth
policy design in EU countries.
We should emphasize right away that this survey is opinionated in the sense that it re�ects our own biases
and uses the lenses of our own work. However, the reader should feel free (and is welcome) to disagree and
take issue with the models, analyses and statements outlaid in the next sections. Our main purpose is indeed
to encourage debates and criticisms and to inspire future work on the subject, in particular contributions that
involve creative destruction of our own work.
In particular, we will propose some answers to questions such as:
1. What distinguishes innovation-led growth from other types of growth? What are the main drivers of
innovation-led growth? (Why) is innovation necessary for sustained long-run growth? What are the
main levers that governments should activate to promote innovation-led growth?
2. Why do we need competition policy for innovation-led growth? Should that lead us to dispense with
patent protection: in other words, should we oppose patent protection and competition as potential
drivers of innovation-led growth? Similarly, should the need for competition policy lead us to reject any
form of sectoral (or industrial) policy?�Harvard University, College de France, NBER and CIFARyUniversity of Chicago and NBER
1
3. How should we reform the welfare state in order to facilitate the transition from imitation-based (or catch-
up) growth and innovation-led growth? Should the state simply concentrate on "regalian" functions, i.e.
law and order, education and health?
4. Should EU governments rely more on aggregate demand or on competitiveness to foster growth? Should
we oppose structural reforms and the need for (more �exible) macroeconomic policy in enhancing growth
in Europe? And how can macroeconomic policy and macro prudential regulations a¤ect innovation-led
growth?
5. Should governments subsidize R&D to foster innovation-led growth: is such government intervention
necessary or su¢ cient? How should we design the tax system to make growth more "inclusive" and
reconcile innovation-led growth with the need to foster social mobility and to avoid excessive inequality?
Can public subsidies always make up for a more expropriatory taxation?
6. What are the limits to patenting and intellectual property and why do we need academic freedom and
openness?
The remaining part of this survey will be organized as follows. Section 2 will argue that Schumpeterian
growth theory provides a relevant framework in which to analyze key aspects of innovation-led growth and to
also think about growth policy design. We will contrast the predictions and policy recommendations that come
out of that theory from those delivered by other growth theories (in particular the so-called AK model, and
the product variety model). Section 3 discusses growth policy design. In particular, building on the previous
two sections, it will draw lessons on how to foster innovation-led growth in the EU. Section 4 touches upon
the recent debate on secular stagnation. Section 5 uses the lenses of Schumpeterian growth theory to provide
new insights into the design of R&D policy. Section 6 looks at the organization of innovation and the role of
academic freedom and openness. Section 7 concludes by suggesting avenues for future research.
2 Looking for growth paradigms to think about growth policy
Today�s research on growth economics, with its double objective of improving our understanding of the growth
process and of helping us think more systematically about growth policy design, uses essentially four leading
growth paradigms.
2.1 The neoclassical growth model
The primary reference in growth economics is the neoclassical paradigm. The success of this model owes
�rst to its parsimony; the growth process is described by only two equations: (i) a production equation that
expresses the current �ow of output good as a function of the current stocks of capital and labor:
Y = AK�L1��;
where A is a productivity parameter and where � < 1 so that production involves decreasing returns to
capital, and (ii) a law of motion that shows how capital accumulation depends on investment (equal to
aggregate savings) and depreciation:_K = sY � �K;
2
where sY denotes aggregate savings and �K denotes aggregate depreciation.
What also makes this model the benchmark for growth analysis is, paradoxically, its implication that,
in the long run, economic growth does not depend on economic conditions. In particular, economic policy
cannot a¤ect a country�s long-run growth rate. Speci�cally, per capita GDP Y=L cannot grow in the long
run unless we assume that productivity A also grows over time, which Solow (1956) refers to as �technical
progress�. The problem is that in this neoclassical model, technical progress cannot be explained or even
rationalized. To analyze policies for growth, one needs a theoretical framework in which productivity growth
is endogenous; that is, dependent upon characteristics of the economic environment. That framework must
account for long-term technological progress and productivity growth, without which diminishing marginal
productivity would eventually choke o¤ all growth.
2.2 The AK model
The �rst version of endogenous growth theory is the so-called AK theory, which does not make an explicit
distinction between capital accumulation and technological progress. In e¤ect it just lumps together the
physical and human capital whose accumulation is studied by neoclassical theory with the intellectual capital
that is accumulated when technological progress is made. When this aggregate of di¤erent kinds of capital is
accumulated there is no reason to think that diminishing returns will drag its marginal product down to zero,
because part of that accumulation is the very technological progress needed to counteract diminishing returns.
According to the AK paradigm, the way to sustain high growth rates is to save a large fraction of GDP, some
of which will �nd its way into �nancing a higher rate of technological progress and will thus result in faster
growth.
Formally, the AK model is the neoclassical model without diminishing returns. The theory starts with an
aggregate production function that is linear homogeneous in the stock of capital:
Y = AK
with A a constant. If capital accumulates according to the same equation:
_K = sY � �K
as before, then the economy�s long-run (and short-run) growth rate is
g = sA� �:
which is increasing in the saving rate s.
AK theory presents a �one size �ts all�view of the growth process. It applies equally to countries that are
on the leading edge of the world technology frontier and to countries that are far behind. Like the neoclassical
model, it postulates a growth process that is independent of developments in the rest of the world, except
insofar as international trade changes the conditions for capital accumulation. Yet, it is a useful tool for many
purposes when the distinction between innovation and accumulation is of secondary importance.
2.3 The product-variety model
The second wave of endogenous growth theory consists of so-called �innovation-based�growth models, which
themselves belong to two parallel branches. One branch is the product variety model of Romer (1990), in which
3
innovation causes productivity growth by creating new, but not necessarily improved, varieties of products.
This paradigm grew out of the new theory of international trade, and emphasizes the role technology spillovers.
It starts from a Dixit-Stiglitz (1977) production function of the form:
Yt =
NtX0
K�itdi
in which there are Nt di¤erent varieties of intermediate product, each produced using Kit units of capital. By
symmetry, the aggregate capital stock Kt will be divided up evenly among the Nt existing varieties equally,
which means we can re-express the production function as:
Yt = N1��t K�
t :
According to this function, the degree of product varietyNt is the economy�s aggregate productivity parameter,
and its growth rate is the economy�s long-run growth rate of per-capita output. Product variety raises the
economy�s production potential because it allows a given capital stock to be spread over a larger number of
uses, each of which exhibits diminishing returns.
The fact that there is just one kind of innovation, which always results in the same kind of new product,
means that the product-variety model is limited in its ability to generate context-dependent growth. In
particular, the theory makes it di¢ cult to talk about the notion of technology frontier and of a country�s
distance to the frontier, since all intermediate products are on a technological par. �
Moreover, nothing in this model implies an important role for exit and turnover; indeed increased exit
can do nothing but reduce the economy�s GDP, by reducing the variety variable Nt that uniquely determines
aggregate productivity. Thus there is no role for �creative destruction,�the driving force in the Schumpeterian
model to be discussed below.
2.4 The Schumpeterian model
The Schumpeterian paradigm (see Aghion and Howitt (1992, 1998)) grew out of modern industrial organization
theory and put �rms and entrepreneurs at the heart of the growth process. The paradigm relies on three main
ideas.
First idea: long-run growth relies on innovations. These can be process innovations, namely to increase the
productivity of production factors (e.g. labor or capital); or product innovations (introducing new products);
or organizational innovations (to make the combination of production factors more e¢ cient).
Second idea: Innovations result from investments like research and development (R&D), �rms�investments
in skills, search for new markets,...that are motivated by the prospect of monopoly rents for successful inno-
vators. An important consideration for thinking about the role for public intervention in the growth process,
is that innovations generate positive knowledge spillovers (on future research and innovation activity) which
private �rms do not fully internalize. Thus private �rms under laissez-faire tend to underinvest in R&D,
training,...This propensity to underinvest is reinforced by the existence of credit market imperfections which
become particularly tight in recessions. Hence an important role for the state as a co-investor in the knowledge
economy.
Third idea: creative destruction. Namely, new innovations tend to make old innovations, old technologies,
old skills, become obsolete. Thus growth involves a con�ict between the old and the new: the innovators of
4
yesterday resist new innovations that render their activities obsolete. This also explains why innovation-led
growth in OECD countries is associated with a higher rate of �rm and labor turnover. And it suggests a second
role for the state, namely as an insurer against the turnover risk and to help workers move from one job to
another. More fundamentally, governments need to strike the right balance between preserving innovation
rents and at the same time not deterring future entry and innovation. This is the paradigm that we �nd most
useful, and it plays an especially important role throughout the book. We present it in Chapter 4 and then
use it and extend it in the subsequent chapters of the book.
More formally, Schumpeterian theory begins with a production function speci�ed at the industry level:
Yit = A1��it K�
it; 0 < � < 1
where Ait is a productivity parameter attached to the most recent technology used in industry i at time t: In
this equation, Kit represents the �ow of a unique intermediate product used in this sector, each unit of which
is produced one-for-one by �nal output or, in the most complete version of the model, by capital. Aggregate
output is just the sum of the industry-speci�c outputs Yit.
Each intermediate product is produced and sold exclusively by the most recent innovator. A successful
innovator in sector i improves the technology parameter Ait and is thus able to displace the previous product
in that sector, until it is displaced in turn by the next innovator. Thus a �rst implication of the Schumpeterian
paradigm, is that faster growth generally implies a higher rate of �rm turnover, because this process of creative
destruction generates entry of new innovators and exit of former innovators.
A �rst distinct prediction of Schumpeterian Growth Theory is therefore:
Prediction 1: The turnover rate is positively correlated with the productivity growth rate.
Another distinctive implication of the model is that innovation-led growth may be excessive under laissez-
faire. Growth is excessive (resp. insu¢ cient) under laissez-faire when the business-stealing e¤ect associated
with creative destruction dominates (resp. is dominated by) the intertemporal knowledge spillovers from
current to future innovators.1
3 Some main applications of Schumpeterian growth theory
3.0.1 Growth meets IO
Both, empirical studies2 and casual evidence point to a positive correlation between growth and product
market competition which is at odds with what most growth models predict. The Solow and AK models
assumes perfect competition, thus by construction they cannot look at how growth is a¤ected by changes in
the degree of product market competition. In the product variety model, more product market competition
corresponds to a higher degree of substitutability � between intermediate inputs, and therefore to lower rents
for potential innovators. This in turn has a detrimental e¤ect on R&D and therefore on growth.
While in Aghion and Howitt (1992)�model also, more competition discourages innovation and growth, yet
one can reconcile theory with evidence by allowing for step-by-step innovation in the Schumpeterian growth
paradigm.3 Namely, a �rm that is currently behind the technological leader in the same sector or industry must
1Which of these e¤ects dominates will depend in particular upon the size of innovations. Assessing the relative importance of
these two e¤ects in practice, requires estimating the structural parameters of the growth model using micro data (see footnote 9).2E.g. see Blundell, Gri¢ th and Van Reenen (1995).3See Aghion, Harris and Vickers (1997) and Aghion, Harris, Howitt and Vickers (2001).
5
catch up with the leader before becoming a leader itself. This step-by-step assumption implies that �rms in
some sectors will be neck-and-neck. In turn in such sectors, increased product market competition, by making
life more di¢ cult for neck-and-neck �rms, will encourage them to innovate in order to acquire a lead over their
rival in the sector. This we refer to as the escape competition e¤ect. On the other hand, in unleveled sectors
where �rms are not neck-and-neck, increased product market competition will tend to discourage innovation
by laggard �rms as it decreases the short-run extra pro�t from catching up with the leader. This we call the
Schumpeterian e¤ect. Finally, the steady-state fraction of neck-and-neck sectors will itself depend upon the
innovation intensities in neck-and-neck versus unleveled sectors. This we refer to as the composition e¤ect.
The Schumpeterian growth framework with step-by-step innovation, generates three interesting predictions:
Prediction 1: The relationship between competition and innovation follows an inverted-U pattern.
Intuitively, when competition is low, innovation intensity is low in neck and neck sectors, therefore most
sectors in the economy are neck and neck (the composition e¤ect); but precisely it is in those sectors that
the escape competition e¤ect dominates. Thus overall aggregate innovation increases with competition at low
levels of competition. When competition is high, innovation intensity is high in neck and neck sectors, therefore
most sectors in the economy are unleveled sectors, so that the Schumpeterian e¤ect dominates overall. This
inverted-U prediction is con�rmed by Aghion, Bloom, Blundell, Gri¢ th and Howitt (2005), using panel data
on UK �rms.
Prediction 2: More intense competition enhances innovation in "frontier" �rms but may discourage it in
"non-frontier" �rms.
Intuitively, a frontier �rm can escape competition by innovating, unlike a non-frontier �rm who can only
catch up with the leader in its sector. This prediction is tested by Aghion, Blundell, Gri¢ th, Howitt and
Prantl (2009) using again panel data of UK �rms.
Prediction 3: There is complementarity between patent protection and product market competition in
fostering innovation.
Intuitively, competition reduces the pro�t �ow of non-innovating neck-and-neck �rms, whereas patent
protection is likely to enhance the pro�t �ow of an innovating neck-and-neck �rm. Both contribute to raising
the net pro�t gain of an innovating neck-and-neck �rm; in other words, both types of policies tend to enhance
the escape competition e¤ect.4 This prediction is con�rmed by Aghion, Howitt and Prantl (2013) using
OECD country-industry panel data. This prediction cannot be generated by the product variety model where
competition can only counteract the e¤ects of better patent protection (the former reduces innovation rents
whereas the latter enhances those rents).
3.0.2 Schumpeterian growth and �rm dynamics
The empirical literature has documented various stylized facts on �rm size distribution and �rm dynamics
using micro �rm-level data. In particular: (i) the �rm size distribution is highly skewed; (ii) �rm size and
�rm age are highly correlated; (iii) small �rms exit more frequently, but the ones that survive tend to grow
faster than the average growth rate.
4That competition and patent protection should be complementary in enhancing growth rather than mutually exclusive is
at odds with Romer�s (1990) product variety model, where competition is always detrimental to innovation and growth (as we
discussed above) for exactly the same reason that intellectual property rights (IPRs) in the form of patent protection are good for
innovation: namely, competition reduces post-innovation rents, whereas patent protection increases these rents. See Acemoglu
and Akcigit (2012) for a general analysis of optimal patent protection in Schumpeterian models with step-by-step innovation.
6
These are all facts that non-Schumpeterian growth models cannot account for. In particular, the �rst four
facts listed require a new �rm to enter, expand, then shrink over time, and eventually be replaced by new
entrants: these and the last fact on the importance of reallocation are all embodied in the Schumpeterian idea
of creative destruction.5
Instead the Schumpeterian model by Klette and Kortum (2004) can account for these facts. This model
adds two elements to the baseline model: �rst, innovations come from both entrants and incumbents; second,
�rms are de�ned as a collection of production units where successful innovations by incumbents will allow
them to expand in product space.6
This model allows us to explain the above stylized facts:
Prediction 1: The size distribution of �rms is highly skewed.
Recall that in this model, �rm size is summarized by the number of product lines of a �rm. Hence, a �rm
needs to have succeeded many attempts to innovate in new lines and at the same survived many attempts
by potential entrants and other incumbents at taking over its existing lines, in order to become a large �rm.
This is turn explains why there are so few very large �rms in steady-state equilibrium, i.e. why �rm size
distribution is highly skewed as shown in a vast empirical literature.
Prediction 2: Firm size and �rm age are positively correlated.
In the model, �rms are born with a size of 1. Subsequent successes are required for �rms to grow in size,
which naturally produces a positive correlation between size and age. This regularity has been documented
extensively in the literature.7
Prediction 3: Small �rms exit more frequently. The ones that survive tend to grow faster than average.
In the above model, it takes only one successful entry to make a one-product �rm to exit, whereas it takes
two successful innovations by potential entrants to make a two-product �rm exit. The facts that small �rms
exit more frequently and grow faster conditional on survival have been widely documented in the literature.8
3.0.3 Growth meets development
The previous two sections have implications for how Schumpeterian growth theory can help bridge the gap
between growth and development economics: �rst, by capturing the idea that growth-enhancing policies or
institutions vary with a country�s level of technological development; second, by analyzing how institutional
development (or the lack of it) a¤ects �rm size distribution and �rm dynamics.
Appropriate institutions In Section 3.1 above we mentioned some recent evidence for the prediction that
competition and free-entry should be more growth-enhancing in more frontier �rms, which implies that they
should be more growth-enhancing in more advanced countries since those have a larger proportion of frontier
�rms. This idea can be extended to other aspects of growth policy design. Indeed, the Schumpeterian paradigm
is �exible in modeling the contribution of past innovations. It encompasses the case of an innovation that
leapfrogs the best technology available before the innovation, resulting in a new technology parameter Ait in
5 In the product variety model, exit is always detrimental to growth as it reduces product variety.6Various versions of this framework have been estimated using micro-level data by Lentz and Mortensen (2008), Acemoglu,
Akcigit, Bloom and Kerr (2013), Akcigit and Kerr (2014) and Garcia-Macia, Hsieh and Klenow (2014).7For recent discussions, see Haltiwanger, Jarmin and Miranda (2010) and Akcigit and Kerr (2010).8See Aghion, Akcigit and Howitt (2014 a,b) and Akcigit and Kerr (2010) for references. In a recent work, Acemoglu, Akcigit,
Bloom and Kerr (2013) analyze the e¤ects of various industrial policies on equilibrium productivity growth, including entry
subsidy and incumbent R&D subsidy, in an enriched version of the above framework.
7
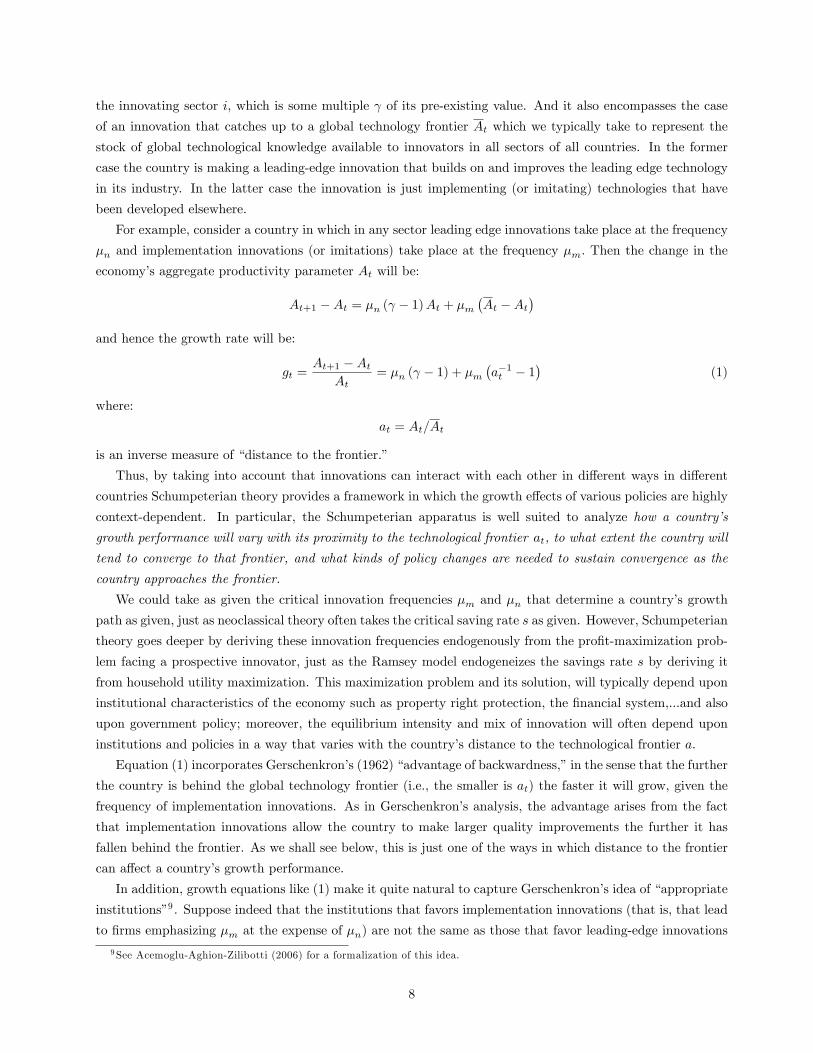
the innovating sector i, which is some multiple of its pre-existing value. And it also encompasses the case
of an innovation that catches up to a global technology frontier At which we typically take to represent the
stock of global technological knowledge available to innovators in all sectors of all countries. In the former
case the country is making a leading-edge innovation that builds on and improves the leading edge technology
in its industry. In the latter case the innovation is just implementing (or imitating) technologies that have
been developed elsewhere.
For example, consider a country in which in any sector leading edge innovations take place at the frequency
�n and implementation innovations (or imitations) take place at the frequency �m: Then the change in the
economy�s aggregate productivity parameter At will be:
At+1 �At = �n ( � 1)At + �m�At �At
�and hence the growth rate will be:
gt =At+1 �At
At= �n ( � 1) + �m
�a�1t � 1
�(1)
where:
at = At=At
is an inverse measure of �distance to the frontier.�
Thus, by taking into account that innovations can interact with each other in di¤erent ways in di¤erent
countries Schumpeterian theory provides a framework in which the growth e¤ects of various policies are highly
context-dependent. In particular, the Schumpeterian apparatus is well suited to analyze how a country�s
growth performance will vary with its proximity to the technological frontier at, to what extent the country will
tend to converge to that frontier, and what kinds of policy changes are needed to sustain convergence as the
country approaches the frontier.
We could take as given the critical innovation frequencies �m and �n that determine a country�s growth
path as given, just as neoclassical theory often takes the critical saving rate s as given. However, Schumpeterian
theory goes deeper by deriving these innovation frequencies endogenously from the pro�t-maximization prob-
lem facing a prospective innovator, just as the Ramsey model endogeneizes the savings rate s by deriving it
from household utility maximization. This maximization problem and its solution, will typically depend upon
institutional characteristics of the economy such as property right protection, the �nancial system,...and also
upon government policy; moreover, the equilibrium intensity and mix of innovation will often depend upon
institutions and policies in a way that varies with the country�s distance to the technological frontier a:
Equation (1) incorporates Gerschenkron�s (1962) �advantage of backwardness,�in the sense that the further
the country is behind the global technology frontier (i.e., the smaller is at) the faster it will grow, given the
frequency of implementation innovations. As in Gerschenkron�s analysis, the advantage arises from the fact
that implementation innovations allow the country to make larger quality improvements the further it has
fallen behind the frontier. As we shall see below, this is just one of the ways in which distance to the frontier
can a¤ect a country�s growth performance.
In addition, growth equations like (1) make it quite natural to capture Gerschenkron�s idea of �appropriate
institutions�9 . Suppose indeed that the institutions that favors implementation innovations (that is, that lead
to �rms emphasizing �m at the expense of �n) are not the same as those that favor leading-edge innovations
9See Acemoglu-Aghion-Zilibotti (2006) for a formalization of this idea.
8
(that is, that encourage �rms to focus on �n): then, far from the frontier a country will maximize growth by
favoring institutions that facilitate implementation, however as it catches up with the technological frontier,
to sustain a high growth rate the country will have to shift from implementation-enhancing institutions to
innovation-enhancing institutions as the relative importance of �n for growth is also increasing.
Thus Acemoglu, Aghion and Zilibotti (2006), henceforth AAZ, provide support to the following predictions
using a cross-country panel of more than 100 countries over the 1960-2000 period:
Prediction 1: Average growth should decrease more rapidly as a country approaches the world frontier
when openness is low.
AAZ repeat the same exercise using entry costs faced by new �rms instead of openness. They show:
Prediction 2: High entry barriers become increasingly detrimental to growth as the country approaches
the frontier.
These two empirical exercises point to the importance of interacting institutions or policies with techno-
logical variables in growth regressions: openness is particularly growth-enhancing in countries that are closer
to the technological frontier; entry is more growth-enhancing in countries or sectors that are closer to the
technological frontier.
Next, to the extent that frontier innovation makes greater use of research education than imitation, the
prediction is:
Prediction 3: The more frontier an economy is, the more growth in this economy relies on research
education.10
Finally, one can look at the relationship between technological development, democracy and growth. An
important channel is Schumpeterian: namely, democracy reduces the scope for expropriating successful inno-
vators or for incumbents to prevent new entry by using political pressure or bribes: in other words, democracy
facilitates creative destruction and thereby encourages innovation.11 To the extent that innovation matters
more for growth in more frontier economies, the prediction is:
Prediction 4: The correlation between democracy and innovation/growth is more positive and signi�cant
in more frontier economies.
This prediction is con�rmed by Aghion, Alesina and Trebbi (2007) using employment and productivity
data at industry level across countries and over time.
This dichotomy between catch-up growth and innovation-led growth explains why countries like China
grow faster than all OECD countries: growth in China is driven by technological imitation, and when one
starts far below the frontier, catching up with the frontier means a big leap forward. Second, it explains
why growth policy design should not be exactly the same in developed and in less developed economies. In
particular, an imitative economy does not require labor and product market �exibility as much as a country
where growth relies more on frontier innovation. Also, bank �nance is well adapted to the needs of imitative
�rms, whereas equity �nancing (venture capital,...) are better suited to the needs of an innovative �rm at
10Aghion, Boustan, Hoxby and Vandenbussche (2009) show that research-type education is always more growth-enhancing in
US states that are more frontier, whereas a bigger emphasis on two-year colleges is more growth-enhancing in US states that
are farther below the productivity frontier. Similarly, using cross-country panel data, Vandenbussche, Aghion and Meghir (2006)
show that tertiary education is more positively correlated with productivity growth in countries that are closer to the world
technology frontier.11Acemoglu and Robinson (2006) formalize another reason, also Schumpeterian, as to why democracy matters for innovation:
namely, new innovations do not only destroy the economic rents of incumbent producers, they also threaten the power of incumbent
political leaders.
9
the frontier. Similarly, good primary, secondary, and undergraduate education is well suited to the needs of
a catching-up economy whereas graduate schools focusing on research education are more indispensable in a
country where growth relies more on frontier innovations. This in turn suggests that beyond universal growth-
enhancing policies such as good property right protection (and more generally the avoidance of expropriating
institutions) and stabilizing macroeconomic policy (to reduce interest rates and in�ation), the design of growth
policy should be tailored to the stage of development of each individual country or region.
Innovation, institutions, and �rm dynamics in developing countries Firm dynamics show massive
di¤erences across countries. In a recent work, Hsieh and Klenow (2014) show that while establishments grow
5 times relative to their entry size by the age of 30, Indian counterparts barely show any growth. Why do
establishments do not grow in India? Bloom et al. (2013) have empirically shown that lack of trust and the
weak rule of law is a major obstacle to �rm growth.
What are the aggregate implications of the lack of delegation and weakness of rule of law on productivity
and �rm dynamics? To answer this question, Akcigit, Alp, and Peters (2014) extend the �rm dynamics model
introduced in the previous section, by adding two major ingredients: (i) production requires managers and
unless �rm owners delegate some of the tasks, �rms run into span of control problem as owners�time endowment
is limited; (ii) �rm owners can be of two types, high or low. High-type �rms are more creative and have the
potential of expanding much faster than low type �rms. Whether this fast expansion is materialized or not
depends on the return to expansion which itself depends on the possibility of delegation.
The predictions, both on the delegation margin and on the �rm dynamics can be summarized as follows:
Prediction 1: Everything else equal, the probability of hiring an outside manager and, conditional on
hiring, the number of outside managers is (i) increasing in �rm size, (ii) decreasing in the owner�s time, and
(iii) increasing in the rule of law.
Larger �rms operate with more product lines and hence they have less time from the owner directly.
Hence, the marginal contribution of an outside manager is much higher in larger �rms. The second part
relates the family size to delegation. If the owner has more time (due to larger family size, for instance), then
the owner has already more time to invest in his business and this lowers the demand for outside managers.
Finally stronger rule of law implies higher net return to delegation. AAP provide empirical support for these
predictions using Indian manufacturing establishments.
Prediction 2: Average �rm size: (i) increases in the owner�s time, (ii) increases in the rule of law,
and (iii) the positive relationship between �rm size and the owner�s time becomes weaker as the rule of law
improves.
Firm value is increasing in owner time and therefore the �rms are willing to innovate and expand more
when �rm value is higher. The empirical support for the �rst part is provided by Bloom et al (2013). The
positive link between �rm size and the rule of law has been extensively documented in the literature (See for
instance Bloom, Sadun, and Van Reenen (2012) for a detailed discussion). Finally, AAP show that the link
between �rm size and family size is weaker in high trust regions in India.
Prediction 3: Firm growth decreases in �rm size, more so when the rule of law is weaker.
This prediction follows from the fact that in larger �rms, the owner has less time to allocate in each product
line and hence the frictions to delegation become much more important for large �rms. Hence, when the rule of
law is weak, larger �rms have less of an incentive to grow which means that the di¤erence in growth incentives
between large and small �rms will be much more pronounced in weak rule of law countries or regions. AAP
10
show that growth decreases faster in �rm size in low trust regions in India.
Prediction 4: Everything else equal, creative destruction and reallocation among �rms will be much higher
in economies where the rule of law is stronger, thanks to the delegation possibilities.
Clearly this latter prediction is in line with the main �ndings of Hsieh and Klenow�s work which showed
the missing growth and reallocation in developing countries. Understanding the reasons behind the lack of re-
allocation and creative destruction is essential in designing the right development policies. The Schumpeterian
growth framework provides a useful framework to conduct counterfactual policy exercises which can shed light
on this important debate.
3.1 Search frictions, innovation and growth
Peter A. Diamond, Dale T. Mortensen and Christopher A. Pissarides received their Nobel Prize in Economics
for their research on �markets with search frictions.�Their research was centered on the idea that in markets,
buyers and sellers or workers and �rms do not �nd each other immediately and it takes time for them to
match. This delay was broadly attributed to so-called search and matching (S&M) frictions that exist in
those markets that prevent the matches from happening immediately. But search market frictions in turn
imply that creative destruction and therefore the growth process should a¤ect the unemployment rate.12
And indeed Schumpeterian growth paradigm allows us to analyze the implications of frictional matching
on the labor market for the relationship between innovation-led growth and unemployment. In particular it
points to three counteracting e¤ects of growth through creative destruction on the equilibrium unemployment
level. While it is leading to incumbents getting replaced by new entrants and therefore release the workers
of the incumbent �rm to the unemployment pool: hence a positive creative destruction e¤ect of innovation-
led growth on unemployment (i.e a negative e¤ect of innovation-led growth on the equilibrium employment
rate). However, new �rms entering the economy also create new jobs, hence a negative job creation e¤ect
of growth on unemployment (i.e a positive e¤ect of innovation-led growth on the equilibrium employment
rate). In addition to these two e¤ects, more creative destruction implies higher growth and therefore a higher
discounted value for new �rms entering the market: hence a negative capitalization e¤ect of growth on entry.
Whether this capitalization e¤ect increases or reduces equilibrium unemployment, depends upon which of the
creative destruction and job creation e¤ects dominates. If the creative destruction e¤ect dominates, then the
capitalization e¤ect will reinforce the creative destruction e¤ect. If the job creation e¤ect dominates, then the
capitalization e¤ect will reinforce the job creation e¤ect.
Now, when jobs can be destroyed for "exogenous" reasons, i.e. for reasons that do not have to do with
innovation, then innovation becomes more a source of new job creation than mainly a source of job destruction.
More precisely, the Schumpeterian theory of growth and unemployment with search frictions, predicts that:
Prediction 1: When the rate of exogenous destruction is small the job destruction e¤ect dominates the
job creation e¤ect and therefore growth and unemployment should be positively correlated.
Prediction 2: When the rate of exogenous job destruction is high, then the relationship is negative growth
and unemployment: in that case the job creation e¤ect of innovation-led growth on unemployment dominates
the job destruction e¤ect.
This framework is used by Aghion, Akcigit, Deaton and Roulet (2015) to analyze the relationship between
innovation-led growth and well-being. On the one hand more creative destruction implies more job destruction,
12See Aghion and Howitt (1994) and Mortensen and Pissarides (1998).
11
which should reduce well-being of currently employed workers. On the other hand more creative destruction
implies both, more new job creation and a higher growth rate, both of which should be welfare-enhancing.
The authors generate and then test the following predictions using US data on subjective wellbeing and on
job/�rm turnover:
Prediction 3: A higher turnover rate increases wellbeing more when controlling for aggregate unemploy-
ment, than when not controlling for aggregate unemployment.
Prediction 4: Higher turnover increases wellbeing more, the more turnover is associated with growth-
enhancing activities.
Prediction 5: Higher turnover increases wellbeing more, the more generous unemployment bene�ts are.
4 Enhancing productivity growth in advanced countries
4.1 Pillars of innovation-led growth
To enhance productivity growth in advanced countries, where growth relies more on frontier innovations, it
helps to invest more in (autonomous) universities, to maximize �exibility of product and labour markets and
to develop �nancial systems that rely importantly on equity �nancing.
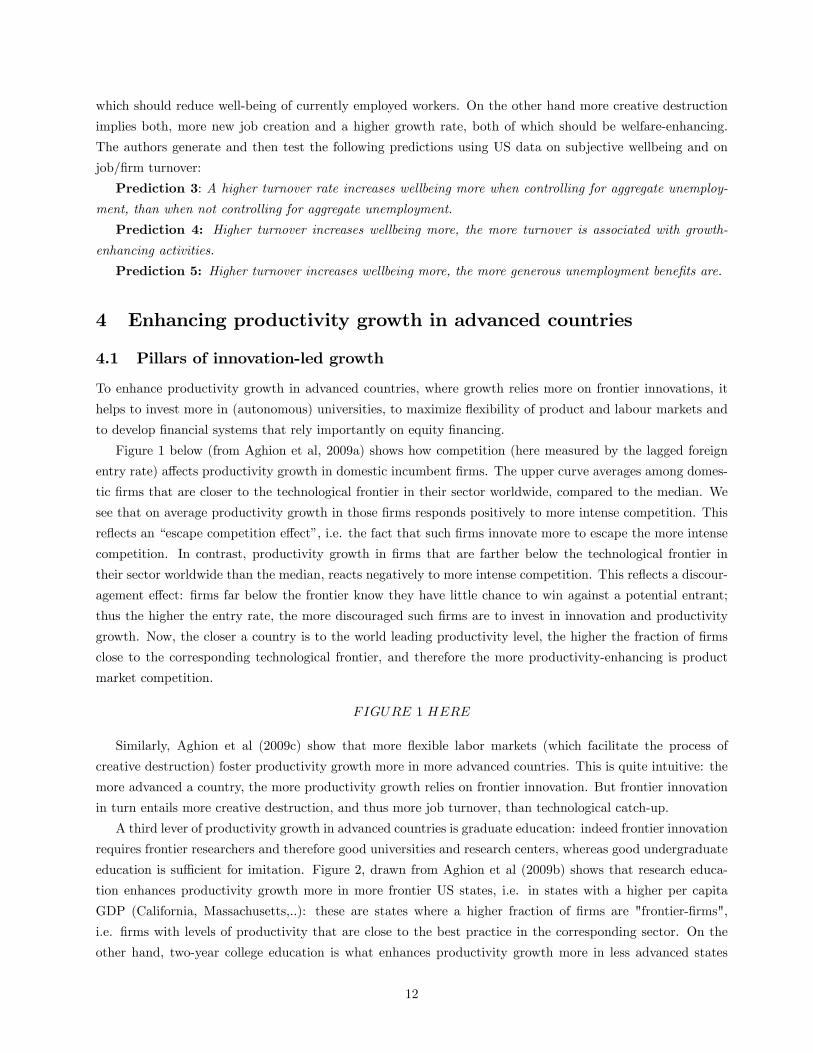
Figure 1 below (from Aghion et al, 2009a) shows how competition (here measured by the lagged foreign
entry rate) a¤ects productivity growth in domestic incumbent �rms. The upper curve averages among domes-
tic �rms that are closer to the technological frontier in their sector worldwide, compared to the median. We
see that on average productivity growth in those �rms responds positively to more intense competition. This
re�ects an �escape competition e¤ect�, i.e. the fact that such �rms innovate more to escape the more intense
competition. In contrast, productivity growth in �rms that are farther below the technological frontier in
their sector worldwide than the median, reacts negatively to more intense competition. This re�ects a discour-
agement e¤ect: �rms far below the frontier know they have little chance to win against a potential entrant;
thus the higher the entry rate, the more discouraged such �rms are to invest in innovation and productivity
growth. Now, the closer a country is to the world leading productivity level, the higher the fraction of �rms
close to the corresponding technological frontier, and therefore the more productivity-enhancing is product
market competition.
FIGURE 1 HERE
Similarly, Aghion et al (2009c) show that more �exible labor markets (which facilitate the process of
creative destruction) foster productivity growth more in more advanced countries. This is quite intuitive: the
more advanced a country, the more productivity growth relies on frontier innovation. But frontier innovation
in turn entails more creative destruction, and thus more job turnover, than technological catch-up.
A third lever of productivity growth in advanced countries is graduate education: indeed frontier innovation
requires frontier researchers and therefore good universities and research centers, whereas good undergraduate
education is su¢ cient for imitation. Figure 2, drawn from Aghion et al (2009b) shows that research educa-
tion enhances productivity growth more in more frontier US states, i.e. in states with a higher per capita
GDP (California, Massachusetts,..): these are states where a higher fraction of �rms are "frontier-�rms",
i.e. �rms with levels of productivity that are close to the best practice in the corresponding sector. On the
other hand, two-year college education is what enhances productivity growth more in less advanced states
12
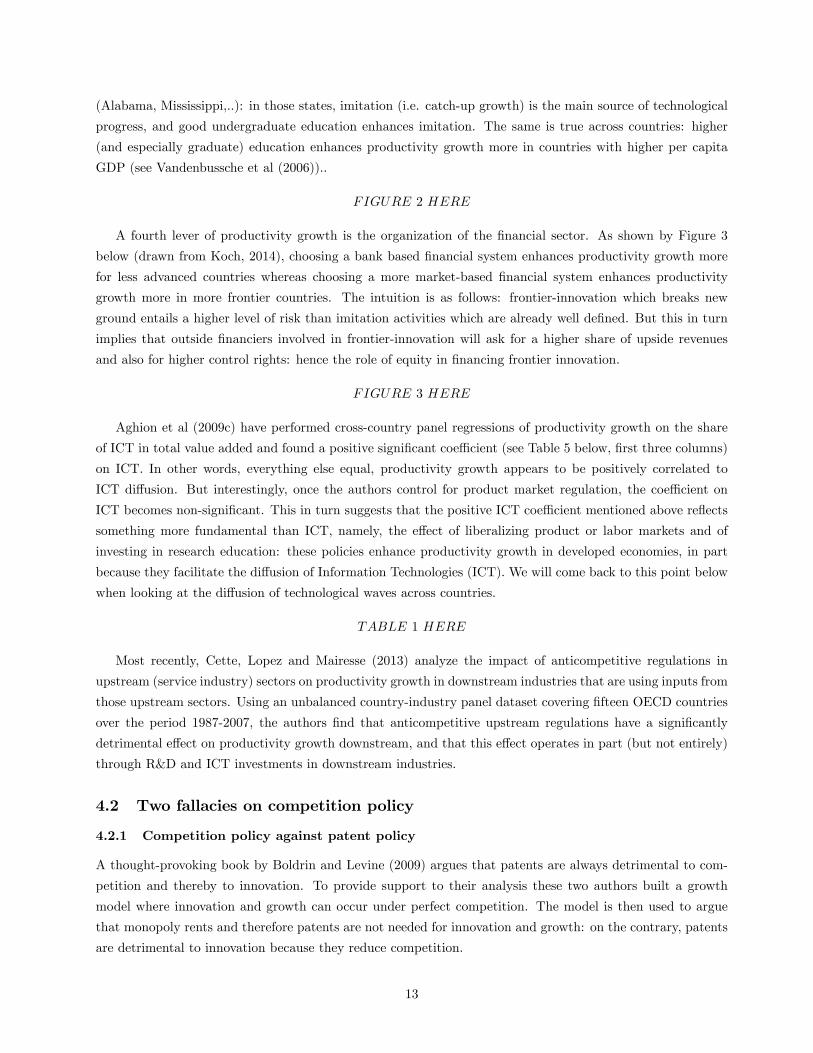
(Alabama, Mississippi,..): in those states, imitation (i.e. catch-up growth) is the main source of technological
progress, and good undergraduate education enhances imitation. The same is true across countries: higher
(and especially graduate) education enhances productivity growth more in countries with higher per capita
GDP (see Vandenbussche et al (2006))..
FIGURE 2 HERE
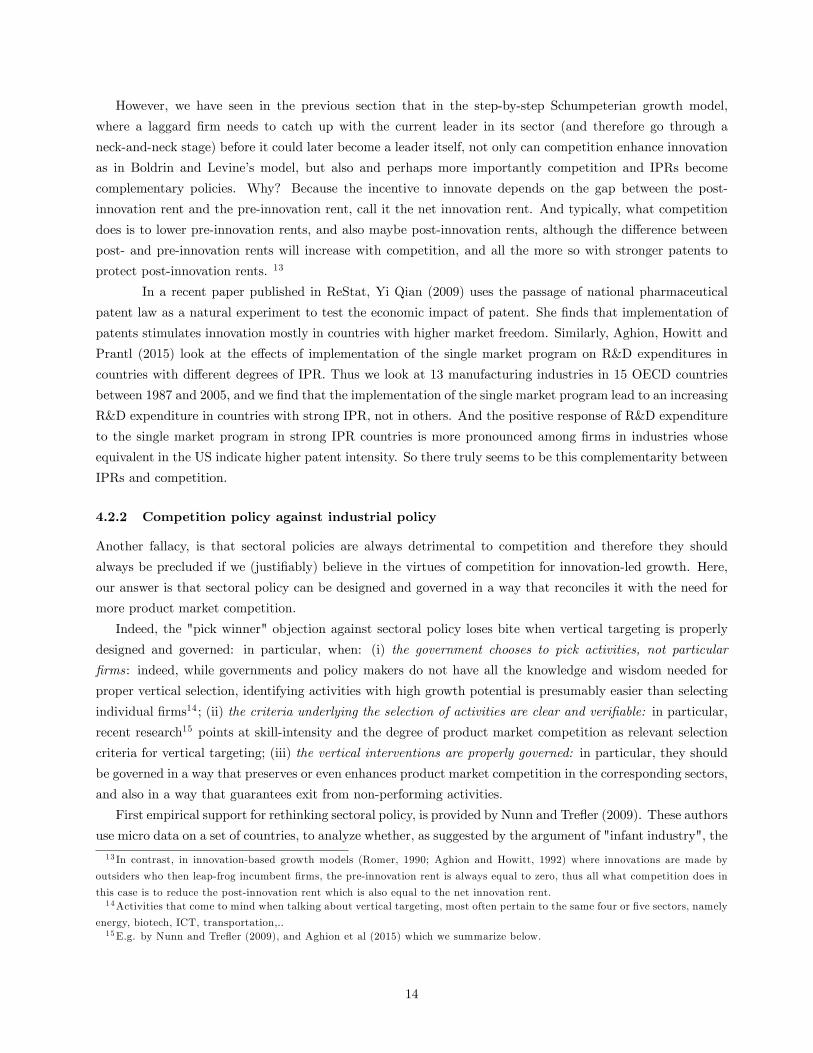
A fourth lever of productivity growth is the organization of the �nancial sector. As shown by Figure 3
below (drawn from Koch, 2014), choosing a bank based �nancial system enhances productivity growth more
for less advanced countries whereas choosing a more market-based �nancial system enhances productivity
growth more in more frontier countries. The intuition is as follows: frontier-innovation which breaks new
ground entails a higher level of risk than imitation activities which are already well de�ned. But this in turn
implies that outside �nanciers involved in frontier-innovation will ask for a higher share of upside revenues
and also for higher control rights: hence the role of equity in �nancing frontier innovation.
FIGURE 3 HERE
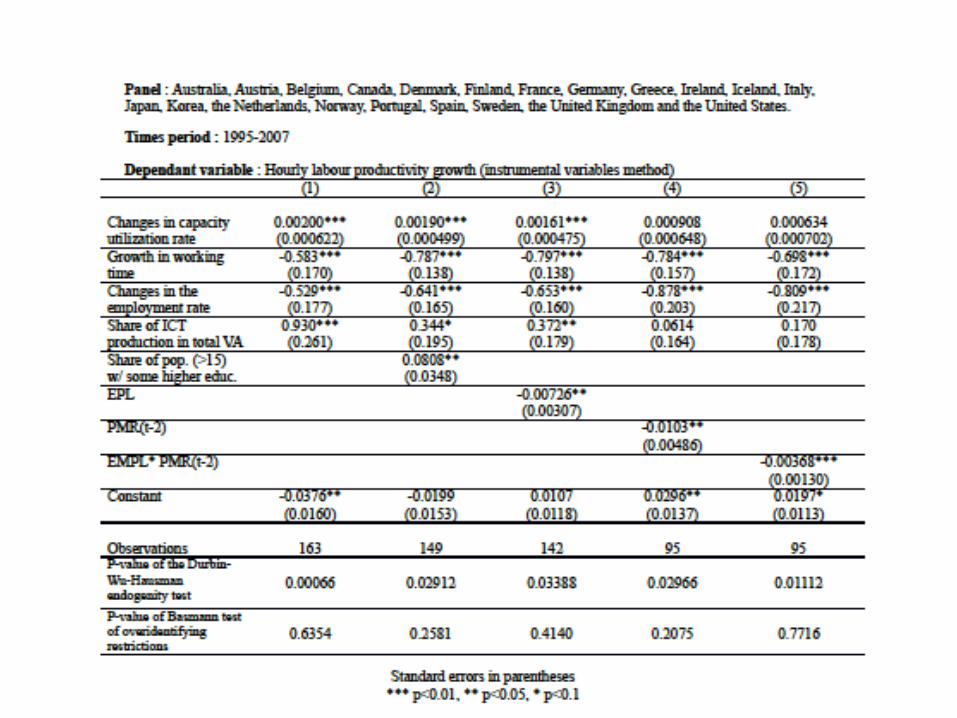
Aghion et al (2009c) have performed cross-country panel regressions of productivity growth on the share
of ICT in total value added and found a positive signi�cant coe¢ cient (see Table 5 below, �rst three columns)
on ICT. In other words, everything else equal, productivity growth appears to be positively correlated to
ICT di¤usion. But interestingly, once the authors control for product market regulation, the coe¢ cient on
ICT becomes non-signi�cant. This in turn suggests that the positive ICT coe¢ cient mentioned above re�ects
something more fundamental than ICT, namely, the e¤ect of liberalizing product or labor markets and of
investing in research education: these policies enhance productivity growth in developed economies, in part
because they facilitate the di¤usion of Information Technologies (ICT). We will come back to this point below
when looking at the di¤usion of technological waves across countries.
TABLE 1 HERE
Most recently, Cette, Lopez and Mairesse (2013) analyze the impact of anticompetitive regulations in
upstream (service industry) sectors on productivity growth in downstream industries that are using inputs from
those upstream sectors. Using an unbalanced country-industry panel dataset covering �fteen OECD countries
over the period 1987-2007, the authors �nd that anticompetitive upstream regulations have a signi�cantly
detrimental e¤ect on productivity growth downstream, and that this e¤ect operates in part (but not entirely)
through R&D and ICT investments in downstream industries.
4.2 Two fallacies on competition policy
4.2.1 Competition policy against patent policy
A thought-provoking book by Boldrin and Levine (2009) argues that patents are always detrimental to com-
petition and thereby to innovation. To provide support to their analysis these two authors built a growth
model where innovation and growth can occur under perfect competition. The model is then used to argue
that monopoly rents and therefore patents are not needed for innovation and growth: on the contrary, patents
are detrimental to innovation because they reduce competition.
13
However, we have seen in the previous section that in the step-by-step Schumpeterian growth model,
where a laggard �rm needs to catch up with the current leader in its sector (and therefore go through a
neck-and-neck stage) before it could later become a leader itself, not only can competition enhance innovation
as in Boldrin and Levine�s model, but also and perhaps more importantly competition and IPRs become
complementary policies. Why? Because the incentive to innovate depends on the gap between the post-
innovation rent and the pre-innovation rent, call it the net innovation rent. And typically, what competition
does is to lower pre-innovation rents, and also maybe post-innovation rents, although the di¤erence between
post- and pre-innovation rents will increase with competition, and all the more so with stronger patents to
protect post-innovation rents. 13
In a recent paper published in ReStat, Yi Qian (2009) uses the passage of national pharmaceutical
patent law as a natural experiment to test the economic impact of patent. She �nds that implementation of
patents stimulates innovation mostly in countries with higher market freedom. Similarly, Aghion, Howitt and
Prantl (2015) look at the e¤ects of implementation of the single market program on R&D expenditures in
countries with di¤erent degrees of IPR. Thus we look at 13 manufacturing industries in 15 OECD countries
between 1987 and 2005, and we �nd that the implementation of the single market program lead to an increasing
R&D expenditure in countries with strong IPR, not in others. And the positive response of R&D expenditure
to the single market program in strong IPR countries is more pronounced among �rms in industries whose
equivalent in the US indicate higher patent intensity. So there truly seems to be this complementarity between
IPRs and competition.
4.2.2 Competition policy against industrial policy
Another fallacy, is that sectoral policies are always detrimental to competition and therefore they should
always be precluded if we (justi�ably) believe in the virtues of competition for innovation-led growth. Here,
our answer is that sectoral policy can be designed and governed in a way that reconciles it with the need for
more product market competition.
Indeed, the "pick winner" objection against sectoral policy loses bite when vertical targeting is properly
designed and governed: in particular, when: (i) the government chooses to pick activities, not particular
�rms: indeed, while governments and policy makers do not have all the knowledge and wisdom needed for
proper vertical selection, identifying activities with high growth potential is presumably easier than selecting
individual �rms14 ; (ii) the criteria underlying the selection of activities are clear and veri�able: in particular,
recent research15 points at skill-intensity and the degree of product market competition as relevant selection
criteria for vertical targeting; (iii) the vertical interventions are properly governed: in particular, they should
be governed in a way that preserves or even enhances product market competition in the corresponding sectors,
and also in a way that guarantees exit from non-performing activities.
First empirical support for rethinking sectoral policy, is provided by Nunn and Tre�er (2009). These authors
use micro data on a set of countries, to analyze whether, as suggested by the argument of "infant industry", the
13 In contrast, in innovation-based growth models (Romer, 1990; Aghion and Howitt, 1992) where innovations are made by
outsiders who then leap-frog incumbent �rms, the pre-innovation rent is always equal to zero, thus all what competition does in
this case is to reduce the post-innovation rent which is also equal to the net innovation rent.14Activities that come to mind when talking about vertical targeting, most often pertain to the same four or �ve sectors, namely
energy, biotech, ICT, transportation,..15E.g. by Nunn and Tre�er (2009), and Aghion et al (2015) which we summarize below.
14
growth of productivity in a country is positively a¤ected by the measure in which tari¤ protection is biased in
favor of activities and sectors that are "skill-intensive", that is to say, use more intensely skilled workers. They
�nd a signi�cant positive correlation between productivity growth and the "skill bias" due to tari¤ protection.
Of course, such a correlation does not necessarily mean there is causality between skill-bias due to protection
and productivity growth: the two variables may themselves be the result of a third factor, such as the quality
of institutions in countries considered. However, Nunn and Tre�er show that at least 25% of the correlation
corresponds to a causal e¤ect. Overall, their analysis suggests that adequately designed (here, skill-intensive)
targeting may actually enhance growth, not only in the sector which is being subsidized, but also the country
as a whole.
More recently, Aghion, Dewatripont, Du, Harrison and Legros (2015), henceforth Aghion et al (2015b),
argue that sectoral policy should not be systematically opposed to competition policy. They use Chinese �rm-
level panel data. More precisely, they use �rm-level panel data from the Chinese National Business Survey
and regress productivity growth, patenting, or other measures of innovativeness and entrepreneurship, over
various measures of sectoral intervention (subsidies, tari¤s,...) interacted with the degree of competition in
the sector, and also with the extent to which intervention in each sector is not concentrated on one single
�rm, but rather distributed over a larger number of �rms. They show that TFP, TFP growth and product
innovation (de�ned as the ratio between output value generated by new products to total output value) are
all positively correlated with the interaction between state aid to the sector and market competition in the
sector. Thus the more competitive the recipient sector, the more positive the e¤ects of targeted state subsidies
to that sector on TFP, TFP growth, and product innovation in that sector. Moreover, Aghion et al (2015b),
show that the interaction between state aid and product market competition in the sector, is more positive
when state aid is less concentrated.
And �nally Acemoglu et al (2013) extend the Klette-Kortum model of growth and �rm dynamics to allow
for high versus low R&D productivity �rms. Their model implies that subsidizing incumbents�R&D inhibits
the entry of high-e¢ ciency �rms, which in turn can be detrimental to growth and welfare. We get back to
this paper in more details in Section 5 below.
Yet this does not address the issue of why vertical targeting would be at all needed. A main theoretical
argument in support of vertical targeting, is the existence of knowledge spillovers. Thus, Aghion et al (2015c)
explore a cross-country panel data set of patents in the automotive industry. They distinguish between
"dirty innovations" which a¤ect combustion engines, and clean innovations such as those on electric cars.
Then they show that the larger the stock of past "dirty" innovations by a given entrepreneur, the "dirtier"
current innovations by the same entrepreneur. This "path dependence" phenomenon, together with the fact
that innovations have been mostly dirty so far, implies that in the absence of government intervention our
economies would generate too many dirty innovations. Hence a role for government intervention to "redirect
technical change" towards clean innovations. Indeed Aghion et al (2015) show that an increase in carbon price
(e.g. through carbon taxes) induces �rms to redirect innovation towards clean technologies (e.g. to develop
electric cars).
A reinforcing factor is the existence of credit constraints which may further limit or slow down the re-
allocation of �rms towards new (more growth-enhancing) activities. Now, one can argue that the existence
of market failures on its own is not su¢ cient to justify vertical intervention. On the other hand, there are
activities �typically high-tech activities- which generate knowledge spillovers on the rest of the economy, and
where assets are highly intangible which in turn makes it more di¢ cult for �rms to borrow from private capital
15
markets to �nance their growth.
4.3 Reforming the state
Aghion and Roulet (2011) use Schumpeterian growth theory to discuss why and how the welfare state should
be reformed in the process of making the transition to an innovation-led economy. One extreme view is that
the state should remain organized as it was when European countries were in a catching-up phase (from 1945
to the early 1970s). Another extreme view is that the transition from catch-up growth to innovation-led
growth, should lead to a radical reform of the state, with the state withdrawing from the economy almost
completely, except when it comes to law and order, national security and defense, and basic public services.
However we depart from these two extreme views on the following grounds. First, the transition to
innovation-led growth, where frontier innovation is associated with creative destruction, i.e. with the constant
replacement of old activities by new activities, implies that the state must give up the old industrial policies
based on the support of few national champions. Instead, the state must favor and accompany the process of
creative destruction, and in particular implement sectoral policies that are competition-friendly. On the other
hand, the existence of knowledge externalities (reinforced by the existence of credit constraints) implies that
the state cannot completely withdraw from the economy. Thus one has to look for a third way between these
two extremes. This is what we refer to as the "strategic state" or the "smart state".
In particular a main issue facing countries in the euro area, particularly in its Southern part, is how to
reconcile the need to invest in the main levers of innovation-led growth with that of reducing public debt and
de�cits. To address the challenge of reconciling growth with greater budgetary discipline, governments and
states must become strategic. This �rst means to adopt a new approach to public spending: in particular, they
must depart from the Keynesian policies aimed at fostering growth though indiscriminate public spending, and
instead become selective as to where public funds should be invested. They must look for all possible areas
where public spending can be reduced without damaging e¤ects on growth and social cohesion: a good example
are the potential savings on administrative costs: technical progress in information and communication makes
it possible to decentralize and thereby reduce the number of government layers, for similar reasons as those
that allowed large �rms to reduce the number of hierarchical layers over the past decades. Decentralization
makes it also easier to operate a high quality health system at lower cost, as shown by the Swedish example.
Second, governments must focus public investments on a limited number of growth-enhancing areas and
sectors: education, universities, innovative SMEs, labor market policies and support to labor and product
market �exibility; industrial sectors with high growth potential and externalities as we argued above.
Third, governments must link public �nancing to changes in the governance of sectors they invest in:
how can one make sure that government funds will be appropriately used? For example, public investments
in education must be conditional upon schools taking concrete steps to improve pedagogical methods and to
provide individual support to students. Similarly, the necessary increases in higher education investments must
be conditional upon universities going for excellence and adopting the required governance rules. For example
Aghion et. al. (2010) show that investments in higher education are more e¤ective the more autonomous
universities are and the more competitive the overall university system is (in particular, the more funding
relies on competitive grants).
16
4.4 Macroeconomic policy
Recent studies (see Aghion, Hemous, and Kharroubi, 2009; Aghion, Farhi and Kharroubi, 2012) performed at
cross-country/cross-industry level, show that more countercyclical �scal and monetary policies enhance growth.
Fiscal policy countercyclicality refers to countries increasing their public de�cits and debt in recessions but
reducing them in upturns. Monetary policy countercyclicality refers to central banks letting real short term
interest rates go down in recessions while having them increase again during upturns. Such policies can help
credit-constrained or liquidity-constrained �rms to pursue innovative investments (R&D, skills and training,...)
over the cycle in spite of credit tightening during recessions, and it also helps maintain aggregate consumption
and therefore �rms�market size over the cycle (see Aghion and Howitt, 2009, ch. 13). Both contribute to
encouraging �rms to invest more in R&D and innovation. This view of the role and design of macroeconomic
policy departs both, from the Keynesian approach of advocating untargeted public spending to foster demand
in recessions, and from the neo-liberal policy of just minimizing tax and public spending in recessions.
Note that such policies are complementary to the above mentioned structural policies aimed at favoring
innovation-led growth, namely product market liberalization, labor market �exibility and training, and higher
education reform. As well argued by Mario Draghi in his Bretton Woods speech a year ago, quantity easing
and other devices to increase the �exibility of macroeconomic policy in the Euro area, will have little e¤ect
on productivity growth if they are not accompanied by systematic structural reforms that make it easier for
new �rms to enter the product market and hire on the labor market.
4.5 Innovation, inequality, and social mobility: making growth inclusive
Figures 4 and 5 below show innovation (measured by the �ow of patents per 1000 inhabitants) and top income
inequality (measured by the share of income accruing to the top 1% income earners) over the past �fty years,
respectively for the US and for Sweden. In both cases, we see that innovation and top income inequality
follow parallel evolutions, �rst essentially �at until the late seventies and then sharply increasing since the
early 1980s.
FIGURES 4 AND 5 HERE
Does that mean that innovation necessarily leads to increased inequality? And what can governments do
to reconcile innovation-led growth with the need to avoid excessive inequality and instead maintain social
cohesion?
In recent work, Aghion et al (2015d) use cross-US-state panel data on patenting and inequality over the
period 1975-2010 to show that: (i) the top 1% income share in the US state is positively and signi�cantly
correlated with the state�s degree of innovativeness, i.e. with the quality-adjusted amount of innovation
in this country or state, which they measure by citation count; (ii) the e¤ect of innovation on top income
inequality is (at least partly) causal, from innovation to top income inequality16(iii) in cross-state panel
regressions, innovativeness is less positively or even negatively correlated with measures of inequality which
do not emphasize the very top incomes, in particular the top 2 to 10% income shares (i.e. excluding the top
1%), or broader measures of inequality like the Gini coe¢ cient. From cross-section regressions performed at
the CZ level, Aghion et al (2015d) also �nd that: (i) innovativeness is positively correlated with upward social
16They establish this result by instrumenting for innovativeness following two di¤erent strategies, �rst by using data on the
appropriation committees of the Senate, and second by relying on knowledge spillovers from the other states.
17
mobility; (ii) the positive correlation between innovativeness and social mobility, is driven mainly by entrant
innovators and less so by incumbent innovators, and it is dampened in states with higher lobbying intensity.
In short, innovation tends to increase top income inequality, but not inequality at large17 And moreover
innovation appears to be positively correlated with social mobility. However, both, entrant innovation and
social mobility are dampened by lobbying activities.
What are the implications of these �ndings for policy design aimed at making growth more inclusive?
Investing more and better in schools and universities, clearly has the e¤ect of increasing growth while also
fostering social mobility. But what is more interesting in the sense that it goes against the popular view, is
that structural reforms such as product and labor market liberalization, which enhance productivity growth
as we have argued above, also increase social mobility to the extent that they favor innovation and creative
destruction.18 Thus the three pillars of an innovation-led growth strategy, namely (higher) education, product
market �exibility, and labor market �exibility, lie at the heart of an inclusive growth strategy.
Now, what about taxation policy? There is a whole theoretical literature on how capital and labor income
should be optimally taxed. However, somewhat surprisingly, very little has been done on taxation and growth,
and almost nothing in the context of an economy where growth is driven by innovation. Absent growth
considerations, the traditional argument against taxing capital is that this discourages savings and capital
accumulation, and amounts to taxing individuals twice: once when they receive their labor income, and a
second time when they collect revenues from saving their net labor income. Introducing endogenous growth
may either reinforce this result (when the �ow of innovation is mainly driven by the capital stock) or dampen
it (when innovation is mainly driven by market size which itself revolves around employees�net labor income).
A An analysis of optimal taxation policy in the context of an innovation-led economy, is beyond the scope of
this paper and represents a huge new research agenda. Yet, one can learn from the tax reforms implemented
in some developed countries during the past decades. In particular, it is widely acknowledge that by deciding
to: (i) lower its maximal tax rate on labor income from around 90% before 1991 to 57% after 1991; (ii) move
from a progressive tax schedule on capital income with a maximum marginal tax rate at 72% before 1991
to a �at rate of 30% after 1991, Sweden has spurred innovation-led growth (as shown by the acceleration in
patenting and in productivity growth after 1991), while still maintaining public services (health, schools and
universities) of high quality and available to all for free. Moreover, Sweden remains the second least unequal
country worldwide.
5 Technological waves and the debate on secular stagnation
5.1 The debate
Based on the (apparent) slowing down of productivity growth in advanced countries since 2001, Gordon (2012,
2013) holds that the IT revolution is over and moreover that the slowdown is there to last for a long period to
come. His view is that: (i) the IT wave exhausted its growth-enhancing power; (ii) several factors make the
arrival of a new wave unlikely in the near future: in particular, the demographic transition, the limits in the
growth of educational attainment, the rising income and wealth inequality resulting in mounting household
17 In Sweden for example, the Gini has not increased over the past twenty �ve years, whereas both, patenting and top income
inequality have.18See Aghion and Roulet (2014).
18
debts that add to government debts. We disagree with that pessimist view for at least three reasons. First, as
pointed out by Dale Jorgenson and others, the IT revolution has durably changed the technology for producing
ideas: in particular, it has made it easier for researchers to communicate and interact at long distance, which
has certainly contributed to increasing the �ow of new ideas. And we already see new ideas about to be
implemented, which could revive the IT wave, such as the 3D chips and 3D printing. Second, there is an
obvious demand for new fundamental innovations, for example in renewable energies and in bio techs, both
by individuals and by governments. Third, as stressed by Byrne et al (2013), the apparent slow down in
the contribution of IT to productivity growth, can be due to measurement problems: in particular Byrne
et al. make the argument that the BLS price index has not properly factored in the continuous progress in
semi-conductor technology: the rate of decline in the price of semi-conductor embodying products has been
underestimated according to these authors.
But there another consideration, made by Bergeaud, Cette and Lecat (2014), which directly links to the
focus of this survey: the IT wave is di¤using with delays to countries other than the US, and the delay is
most important in countries which have not yet fully implemented the structural reforms (university reform,
product and labor market liberalization) required for a successful transition to innovation-based growth.
5.2 Historical wave patterns
In the remaining part of this section we take a brief look at technological waves and their di¤usion from US
to other developed countries. In particular we will point at the relationship between structural reforms and
a country�s ability to take advantage of the new IT wave. We de�ne a technological wave as the di¤usion
of new General Purpose Technologies (GPT)19 . General Purpose Technologies (GPTs) are de�ned as generic
technologies which a¤ect most sectors of the economy. Obvious examples include steam energy in the early and
mid 19th century, electricity and chemistry in the early 20th century, and the Information and Communication
Technology revolution in the 1980s. While innovation-led productivity growth goes beyond the di¤usion of
these generic technologies, the speed at which a country adopts and di¤uses a new General Purpose Technology,
re�ects the country�s ability to innovate more generally. It is therefore of interest to compare the di¤usion
patterns of General Purpose Technologies across countries, especially when showing that lags in such di¤usion
re�ect market or institutional rigidities which hamper innovation-led growth more generally.
5.2.1 Two productivity growth waves
Using annual and quarterly data over the period 1890-2012 on labor productivity and TFP for 13 advanced
countries (the G7 plus Spain, The Netherlands, Finland, Australia, Sweden and Norway) plus the reconstituted
Euro area, Bergeaud, Cette and Lecat (2014) (BCL thereafter) show the existence of two big productivity
growth waves during this period.
The �rst wave culminates in 1941, the second culminates in 2001. The �rst wave corresponds to the second
industrial revolution: that of electricity, internal combustion and chemistry (Gordon, 2000). The second wave
is the ICT wave. That wave of smaller magnitude than the �rst, and a big question is as to whether that
second wave has ended in the US.19See Bresnahan and Trajtenberg (xxxx).
19
5.2.2 Di¤usion patterns
Figure 6 from Cette and Lopez (2012) shows that the Euro Area20 and Japan su¤er from a lag in the di¤usion
of technological waves compare to the US. Thus the �rst wave fully di¤used to the current euro area, Japan
and the UK only post World War II. As for the second productivity wave, so far it does not show up in the
Euro Area or in Japan. Market rigidities contribute to explaining such delays.
FIGURE 6 HERE
And through an econometric analysis, Cette and Lopez show that this lag of ICT di¤usion in Europe
and Japan, compare to the US, is explained by institutional aspects: a lower education level, on average, of
the working-age population and more regulations on labour and product markets. This result means that by
implementing structural reforms, these countries could bene�t from a productivity acceleration linked to a
catch-up of the US ICT di¤usion level. The lower quality of research and higher education in the Euro area
and Japan compared to the US also appears to matter for explaining the di¤usion lag. These �ndings mirror
those in Table 1.
5.2.3 Country-speci�c shocks and the role of reforms
Figure 7 from BCL (2014) shows a positive break in labour productivity and in TFP growth in Sweden after
1990. This stands in contrast with the case of Japan shown on Figure 8: there, we see no such break but instead
decelerating labour productivity and TFP growth since 1980. Our explanation is that Sweden implemented
sweeping structural reforms in the early 1990s: in particular a reform of the public spending system to reduce
public de�cits, and a tax reform to encourage labour supply and entrepreneurship. No signi�cant reform took
place in Japan over the past thirty years.
Consider from BCL (2014) study the four countries which are commonly presented as lead reformers over
the past three decades. The reforms initiated in Sweden in the early 1990s made the rate of TFP growth
increase from an average of 0.4% over the period 1976-1992 to an average of 1.9% over the period 1992-2008.
Similarly, the 1982 reform (Wassenaard agreement) in the Netherlands is associated with a break from an
average TFP growth rate of 0.5% over the period 1977-1983 to an average TFP growth rate of 1.5% over
the period 1983-2002. The reforms initiated in the early 1990s in Canada are associated with a break from
an average TFP growth rate of 0.3% over the period 1974-1990 to an average rate of 1.1% over the period
1990-2000. Finally, the reforms initiated in the early 1990s in Australia are associated with a break from an
average TFP growth rate over the period 1971-1990 of 0.4% to an average growth rate of 1.4% over the period
1990-2002.
These �ndings are in line with cross-country panel regressions suggesting that structural reforms play a
key role in speeding up the di¤usion of technological waves.
FIGURES 7 AND 8 HERE
20The Euro Area is here the aggregation of Germany, France, Italy, Spain, The Netherlands, Austria and Finland. These seven
countries represent together, in 2012, 88 12% or the total GDP of the Euro Area.
20
6 Schumpeterian insights into R&D policy
How should the optimal R&D policy be designed? This question is at the heart of any policy debate which tar-
gets technological progress through R&D and innovation. Many governments are providing massive subsidies
to foster innovation. As an example, the United States spends more than $130 billion per year at the federal
level to support innovation (NSF + NIH + Army Research O¢ ce + R&D tax credit).21 The proponents of
R&D subsidy have argued that R&D has spillovers that are not internalized by the innovating �rms. The
opponents claim that product market competition already provides su¢ cient incentives to �rms and that any
additional subsidy would be wasteful.
In this section, summarizing the �ndings from recent research on R&D policy from the Schumpeterian
growth viewpoint, we argue that there are at least two new and important aspects that the design of optimal
R&D policy should consider: namely, �rm selection and the distinction between basic and applied research.
The former implies that R&D policy could a¤ect �rm survival and consequently resource reallocation between
more productive and less productive �rms, or between incumbent and entrant �rms. The latter relates to the
fact that di¤erent types of research, in this case basic and applied, could have di¤erent spillovers and R&D
policy should take into account its impact on the distinct types of research.
6.1 R&D policies and �rm selection
The goal of R&D policies is to incentivize �rms to undertake greater R&D investment, produce more in-
novations, increase productivity, and create more jobs. However, these policies do not a¤ect every �rm in
the economy in the same way. For instance, Criscuolo et al. (2012) have shown that large incumbents are
better at obtaining government subsidies. Therefore one can argue that R&D subsidies to incumbents might
be ine¢ ciently preventing the entry of new �rms and therefore slowing down the replacement of ine¢ cient
incumbents by more productive new entrants. The turnover and factor reallocation between incumbents and
entrants is an important source of productivity growth. Foster, Haltiwanger and Krizan (2000 and 2006) have
shown empirically that the reallocation of factors across �rms accounts for more than 50% of productivity
growth in the US. Given the empirical importance of this reallocation margin, it is necessary that R&D policy
takes into account the interaction between innovation and factor reallocation. This is our focus in Acemoglu
et al. (2013).
Recent literature has emphasized the importance of �rm size and age for �rm level heterogeneity that are
observed in the data (Akcigit and Kerr, 2015; Haltiwanger et al 2013). In particular Acemoglu et al (2013) uses
data from the Census Bureau�s Longitudinal Business Database and Census of Manufacturers, the National
Science Foundation�s Survey of Industrial Research and Development, and the NBER Patent Database. Their
analysis focuses on innovative �rms that are in operation during the 1987-1997 period. If we de�ne small and
large �rms by their size relative to the median employment in the sample by year; and we de�ne young and
old �rms by whether or not the �rm is older than ten years, then the evidence points to small and young
�rms are both more R&D intensive and grow faster.22 It then follows that industrial policies that discourage
the reallocation of resources towards younger �rms might indeed be costly in that they slow the movement of
R&D resources from less e¢ cient innovators (struggling incumbents) towards more e¢ cient innovators (new
21http://www.whitehouse.gov/sites/default/�les/microsites/ostp/Fy%202015%20R&D.pdf22Likewise Akcigit and Kerr (2015) regress �rm growth on log �rm size and �nd an estimate -0.04 and innovation intensity
(number of innovations relative to the �rm size) on log �rm size and �nd an estimate of -0.18.
21
�rms).
Acemoglu et al (2013) extend the Klette-Kortum model of growth and �rm dynamics considered above
by allowing for high versus low ability �rms, i.e. �rms with more versus less e¢ cient R&D technologies.
Then they calibrate their model by matching empirical moments capturing key features of �rm-level R&D
behavior, shipments growth, employment growth and exit, and the variation of these moments with size and
age. Finally, they use the estimated model as a lab to run counterfactual experiments and test the impacts of
various R&D policy designs on economic growth and welfare. The policies that we consider include a subsidy
to new entrants, a subsidy to R&D by incumbents, and a subsidy for the continued operation of incumbents.
Their main �ndings can be summarized as follows. First, subsidizing incumbents reduces the equilibrium
growth rate and welfare decrease. The reason is that this may prevent low-ability incumbents from exiting,
thereby inhibiting the entry of high-ability �rms. Solving for the optimal policy, the authors �nd that it
involves a substantial tax on the operation of incumbents, combined with an R&D subsidy to incumbents.
The reason for this result is that taxing operations makes it harder for low-type �rms to survive and forces
them to exit. This way the freed-up factors of production are reallocated to high-type �rms, which make use
of them much more e¤ectively.
Overall, this general equilibrium analysis, which incorporates both reallocation and selection e¤ects, high-
lights the fact that the economy in equilibrium might contain too many low-type �rms and policies that ignore
the selection e¤ect might help low-type �rms survive. Another point that is highlighted is the fact that in-
tertemporal spillovers are sizable and the overall R&D investment is too little. Therefore a combination of
R&D subsidies and taxes on �rm operations could be an e¤ective way of providing innovation incentives to
�rms, while also leveraging the selection margin in the economy.
6.2 Basic versus applied R&D
In many countries national funds allocated to basic research have been among the top items in governments�
policy agendas. For instance, in a recent report by the US Congress Joint Economic Committee, it is argued
that despite its value to society as a whole, basic research is underfunded by private �rms precisely because it
is performed with no speci�c commercial applications in mind. The level of federal funding for basic research
is deemed "worrisome" and it is claimed that it must be increased in order to overcome the underinvestment
in basic research (JEC, 2010) . However the report also complains about the lack of research studies that
actually quantify the extent of this underinvestment and about the lack of data.23
For similar reasons governments introduce programs to promote collaboration between basic academic re-
searchers and private �rms, with the hope that synergies generated from these interactions could lead to break-
through technological advances. For instance, the United States government has aggressively promoted collab-
oration between universities and industrial researchers through speci�c funding programs. Among many others,
the National Science Foundation (NSF) sponsors the Fundamental Research Program for Industry-University
Cooperative Research (FRP), the Industry-University Cooperative Research Centers Program (I/UCRC) and
Grant Opportunities for Academic Liaison with Industry (GOALI).
Although the di¤erent characteristics of basic and applied research on the one hand and academic and
corporate research on the other hand have been widely recognized to be of �rst-order importance by policy
makers, these issues have received insu¢ cient attention in the economic literature on productivity and economic
23http://jec.senate.gov/public/?a=Files.Serve&File_id=29aac456-fce3-4d69-956f-4add06f111c1
22
growth. In particular, the endogenous growth literature has mainly considered a uniform type of (applied)
research and overlooked basic research investment by private �rms.
What are the key roles of basic and applied research for productivity growth? How should R&D policy
be geared towards basic versus applied research? What are the incentives of private �rms to conduct basic
research? How does academic research contribute to innovation and productivity growth? Akcigit, Hanley
and Serrano-Velarde (2014) provide a �rst attempt at answering these questions. In order to understand the
potential ine¢ ciencies involved in di¤erent types of research investments and to design appropriate industrial
policies to address them, it is necessary to adopt a structural framework that explicitly models the incentives
for di¤erent types of research investments by private �rms. Akcigit et al (2014) take an important step toward
developing this theoretical framework, identifying the potential spillovers, and studying their macroeconomic
implications for innovation policy.
Their analysis starts from the observation that countries allocate a signi�cant share of their GDP to R&D
(around 2-3%). The question then is: which fraction of it goes to basic versus applied research? The interesting
fact is that almost half of overall spending goes into basic research.24
Akcigit et al (2014) �rst test Nelson (1959)�s view that ��rms which support research toward the basic-
science end of the spectrum are �rms that have �ngers in many pies�. According to this argument, as the
range of its products and industries gets more diversi�ed, a �rm�s incentive for investing into basic research
relative to applied research should increase due to better appropriability of potential knowledge spillovers. To
measure multi-industry presence, the authors count how many distinct SIC codes a �rm is present in. Using
micro-level data on French �rms, they plot average basic research intensity against the total number of distinct
1 digit SIC codes in which the �rm is present. And they �nd a positive and statistically and economically
signi�cant relationship between multi-industry presence and basic research spending. A broader technological
base is associated with higher investment in basic research relative to applied research. Thus the authors
support Nelsons�hypothesis about the link between multi-industry presence and relative research incentives.
These correlations are robust to a large variety of potential confounding factors. This result suggests that
cross-industry spillovers are sizable and using the variation in �rms� technology base, we can estimate the
cross-industry spillovers associated with basic research.
In order to study the policy implications of these spillovers, Akcigit et al (2014) build a general equilibrium,
multi-industry framework with private �rms and a public research sector. Firms conduct both basic and
applied research, whereas the public sector focuses exclusively on basic research. In their model, basic research
generates fundamental technological innovations and generates spillovers, both within and across industries,
that a¤ect subsequent applied innovations.25 In line with the �Ivory Tower� theory of academic research,
basic research by private �rms in this model will turn into consumer products faster than that undertaken by
public research labs. Applied research, on the other hand, will be done only by private �rms and will generate
follow-on innovations building on the existing basic knowledge stock.
The authors then undertake a quantitative investigation of the impacts of various innovation policies on
the aggregate economy. They �rst estimate the model by targeting some of the key moments in the data,
especially public and private spending on basic and applied research in France. Then they use the estimated
24See Akcigit et al (2014) for references.25By fundamental innovation, we mean major technological improvements that generate larger than average contributions to
the aggregate knowledge stock of society. In addition, these will have long-lasting spillover e¤ects on the size of subsequent
innovations within the same �eld.
23

model to assess the extent of ine¢ ciencies in basic and applied research and to study the implications of several
important innovation policies.
Their main results can be summarized as follows. First, a large fraction of spillovers from basic research
across industries are not internalized. As a result, there is a dynamic misallocation of research e¤orts, which
reduces welfare signi�cantly. One striking result is that the decentralized economy and the social planner�s
economy are using overall the same level of resources for research. However, the composition of the total
research e¤ort is very distinct. While the social planner is allocating more resources to basic research, it
allocates less resources to applied research. This implies that the dominant misallocation here is not that
between production and research, but among the various types of research activities, in this case, applied and
basic research. There is actually overinvestment in applied research in the decentralized economy because
of product market competition, whereas there is underinvestment in basic research due to uninternalized
within-industry and cross-industry spillovers.
This raises an important question: to what extent can public policies address this ine¢ ciency? The �rst
policy we analyze is a uniform research subsidy to private �rms. In this environment, subsidizing overall
private research is ine¤ective since this will oversubsidize applied research, which is already excessive due to
product market competition. Therefore, the welfare improvement from such a subsidy is limited, unless the
policymaker is able to discriminate between types of research projects at the �rm level, a di¢ cult task in the
real world.
The authors then analyze another policy tool: the level of funding for public research labs. We show that
due to the Ivory Tower nature of public basic research, allocating more money to the academic sector without
giving property rights to the researchers (ownership over their inventions) is not necessarily a good idea. To
demonstrate this, they simulate a policy similar to the Bayh-Dole Act enacted in the US in 1980. They consider
alternative scenarios in which public researchers have no property rights, then 50% and 100% property rights.
And they �nd a complementarity between the level of property rights and the optimal allocation of resources to
academic research. The optimal combination turns out to grant full property rights to the academic researcher
and allocating a larger fraction of GDP to public research. This reduces the welfare gap signi�cantly.
7 The role of freedom and openness in the innovation process
How do incentives and organizations a¤ect the probability and nature of innovation? As well explained by
Pierre Azoulay in his lecture notes, providing incentives for producing ideas is problematic for at least three
reasons. First, ex ante it is di¢ cult to describe the innovation in advance. Second, ex post property rights on
innovations may be di¢ cult to enforce (for example, how do we enforce patent breadth). Third, innovation
e¤orts are hard to observe and verify.
In short, a contract for future innovation is bound to be an incomplete contract, one whereby the contracting
parties allocate property rights on the realized innovation and/or decision rights on the innovation process,
leaving much of the revenue sharing to expost bargaining26 .
In this section we explore one particular implication of contractual incompleteness, namely the issue of
how to allocate control rights on the choice of research agenda in the context of multi-stage research lines.
26Of course, the monetary incentives for innovation are not only determined by ex post bargaining: ex post monetary rewards
through prizes, as well as ex ante �nancing of R&D as part of research grants or procurement contracts, also play an important
role in inducing innovation.
24
This leads us to revisit the role of intellectual property (IP) versus academic freedom and openness in the
innovation process.
7.1 The ADS framework and the role of academic freedom
The incentives of academics are known to be di¤erent from those of private researchers (see Dasgupta and
David, 1990). Building on an emerging body of research in the new economics of science (Dasgupta and David,
1994; Stern, 2004), Aghion, Dewatripont and Stein (2008, henceforth ADS) emphasize the role of intellectual
freedom: granting control rights to allow researchers to select their own research agenda.
More formally, ADS consider a multi-stage research line. The line starts with an initial idea I0. Then the
idea is elaborated upon in stages. If stage 1 is successful, there is a re�ned idea I1; this re�ned idea can be
pursued further to potentially generate an even-more-re�ned idea I2, etc. There are a total of k stages after
the initial idea. If and only if all k stages are successful, there is a �nal idea Ik which generates a terminal
value V , e.g. in the form of a marketable product.
Each stage on the research line requires one researcher, and that researcher succeeds with probability p
if she follows a (success-maximizing) practical strategy at that stage. Instead of the practical strategy, the
researcher may choose to follow an �alternative� strategy which yields a zero probability of success. One
interpretation is that the alternative strategy may be the one that the researcher enjoys more, even though it
does not pay o¤ in monetary terms. Another interpretation is that the alternative strategy may help initiate
new lines but does not generate progress on the initial line.
There is an in�nite supply of researchers at each stage, each of whom has an outside option R that she
can obtain by working in another profession. After being exposed to idea Ij�1, each researcher at stage j
decides whether she would better enjoy following the practical strategy or the alternative strategy. If she is
able to undertake her favored strategy, she su¤ers no disutility from working. However, if the researcher has
to undertake the strategy that she likes less, she su¤ers a disutility of z. The ex ante probability that a given
researcher prefers to follow the practical strategy is given by �. ADS assume that the choice of the practical
vs. the alternative strategy is ex ante non-contractible. In other words, one cannot write a contract that
promises a bonus for following the practical strategy, because the nature of work that strategy entails cannot
be adequately described ahead of time.
If the researcher is employed by a university which leaves her with full control rights over the choice
of research strategy (the �researcher-freedom� regime), in equilibrium, she is paid the reservation wage
wfreedom = R, and always works on her preferred strategy. This implies that with probability �, the
scientist works on the practical strategy, and with probability (1� �), she works on the alternative strategy.Therefore, the ex-ante probability of advancing to the next stage is given by �p.
Suppose instead that the researcher is employed by a centralized �rm who has full control rights on the
choice of research agenda. Then, ex-post, the manager has the authority to force the researcher to work on
the practical strategy. Anticipating this, the researcher will demand a wage of wfirm = R + (1 � �)z inorder to work under this �manager-control�regime. The (1��)z markup over the researcher-freedom regimerepresents compensation for loss of creative freedom�the fact that the researcher now must always adopt the
practical strategy, whether this turns out to coincide with her preferences or not.
ADS show that it is optimal to allocate control rights on the research agenda (i.e. to grant academic
freedom) in early stages of the research line, as this reduces the cost of research (the researcher asks for
25

wfreedom = R instead of wfirm = R + (1 � �)z), whereas for later stages in the research line focus on thepractical strategy becomes paramount, so that it is optimal to have research performed within a �rm.
More generally, whether the researcher will or will not enjoy control rights -i.e. real authority- over her
research agenda, will depend upon how strongly she is monitored by the �rm that employs her.
For example, consider a two-stage research process. In each stage i = 1; 2 the �rm owner hires a scientist,
and agrees to pay her a wage of wpi. Next, the �rm owner invests e¤ort in trying to become informed about
the project. For an e¤ort cost of ��2=2, the �rm owner has a probability � of becoming informed. If she is
informed, she is then able to force the scientist to follow the practical strategy. However, if she is uninformed,
the entrepreneur is unable to direct the scientist, and the scientist is thus free to do what she wants.
It is easy to show that: (i) the more the researcher is being monitored by the �rm, the higher the wage
the researcher will ask to compensate for her loss of control rights; (ii) it is optimal to grant more freedom to
the researcher in the earlier stage (here, in stage i = 1) of the research process.
To prove these two claims, note that the payo¤ to the �rm owner if she is informed at stage i is:
E(�pi j informed) = p�i+1 � wpi;
whereas the payo¤ to the �rm owner if she is uninformed at stage i is:
E(�pi j uninformed) = �p�i+1 � wpi;
so that the marginal value of being informed at stage i is (1 � �)p�i+1, and the �rm owner�s equilibrium
probability of becoming informed at this stage is:
�i = (1� �)p�i+1=�: (2)
It follows that the unconditional expected payo¤ at stage i is given by:
�i = E(�pi ) = (�i + �(1� �i))p�i+1 � wpi � ��
2i =2;
where the wage wpi is itself determined as:
wpi = R+ �i(1� �)z: (3)
Proving (i) and (ii) is now straightforward: �rst, from (2), as the project is getting closer to completion,
the likelihood that the �rm owner becomes informed and therefore imposes her choice of research strategy to
the scientist increases, since �i+1 goes up with i; second, from (3) we immediately get that the scientist�s wage
also increases, to compensate for the fact that he has less de facto creative control. In other words, research
�rms endogenously become more hands on in later stages of research projects.
7.2 Freedom and openness
Another implication of the ADS framework, is that openness should play an important role in early stage
research, whereas later stages in the research process are bound to be more "proprietary". Indeed, when
granted academic freedom, researchers are free to explore alternative strategies which may lead to the creation
of new research lines that those researchers may not pursue. Then there is value in having other researchers
freely access the knowledge that will enable them to pursue these new research lines. Openness is less justi�ed
in later stages of the research process when research is more focused and also closer to commercialization.
26

More formally, consider two parallel research lines, 1 and 2, each of which operates as described above.
Namely, with ex ante probability � the researcher initially allocated to the current stage of either of these
two lines, prefers to pursue the practical strategy for that line whereas with probability (1��) he prefers notto pursue this practical strategy. Now openness implies that the scientist on line 1 can learn about project 2
and vice-versa, and that consequently with positive probability ', she may choose to work on the practical
strategy for project 2 if nobody else does. A greater degree of openness implies a higher value of ':
What openness does, is to increase the net present value of a research line operated under freedom from
E(�pi j uninformed) = �p�i+1 � wpi
to
E(�pi j uninformed) = [�+ (1� �)']p�i+1 � wpi:
However, openness has no value when the �rm owner controls the researcher�s agenda, since the researcher
is always forced to work on the practical strategy in that case. Thus we still have:
E(�pi j informed) = p�i+1 � wpi:
Hence:
�i = E(�pi ) = (�i + (1� �i)[�+ (1� �)'])p�i+1 � wpi � ��
2i =2;
which in turn will lead to a lower equilibrium value of �i (particularly for lower i�s) and therefore to more
freedom (particularly at earlier stages on the research line) and thus to more new lines being created. As a
result, a higher fraction of researchers will be working on early stages of research lines, hence there will be
more basic research.
7.3 Evidence on the limits of IP and the role of openness and freedom
The above model generates the following predictions:
Prediction 1: Earlier stages of research should be managed in a more decentralized way, leaving more
freedom to researchers.
There is some empirical research speaking to this prediction, although indirectly. For example, using French
and British �rm-level data, Acemoglu et al. (2007, AALVR) show that �rms that encounter newer problems to
solve tend to be more decentralized. This includes �rms in more heterogeneous industries (where it is harder
to learn from others), �rms closer to the technological frontier (so that there are fewer other �rms to learn
from) and younger �rms (thus with less experience to learn from their own mistakes). That more frontier �rms
should delegate more may also explain why subsidizing higher education, in particular graduate education, is
more likely to be innovation-enhancing if universities are more decentralized (as shown for example by Aghion
et al., 2010, using cross-US-state panel data). Incidentally, universities are a sector in which formal delegation
can be more easily enforced.
Prediction 2: More openness: (i) enhances research freedom; (ii) enhances the creation of new lines; (iii)
enhances basic research .
Murray et al (2008) test the prediction that in a research setting characterized by a high level of intellectual
freedom, greater openness does not just increase the �ow of research, but also increases the diversity of
27
new research discoveries. More precisely, they consider the following natural experiment in openness: NIH
agreements in the late 1990s that reduced the costs of accessing information on genetically engineered mice.27Using a sample of engineered mice linked to speci�c scienti�c papers, some of which were a¤ected by the NIH
agreements and some were not, Murray et al (2008) evaluate how the level and nature of follow-on research
changes after the NIH-induced increase in openness. They �nd that increased openness encourages entry by
new researchers and the exploration of more diverse research lines.
Particularly in�uential has been Heidi Williams�contribution to the �eld. In particular Williams (2013)
uses a fascinating dataset on the sequencing of the human genome to analyze the impact of the IP restric-
tions imposed by the private �rm Celera until 2003, on subsequent innovation. The author �nds that these
restrictions have indeed negatively a¤ected subsequent scienti�c research and product innovation.
Both, Murray et al (2008) and Williams (2013) have in common that they both analyze the impact of
non-patent IP restrictions on subsequent innovation. More recently, Sampat and Williams (2015) have looked
at the potential impact of gene patents on subsequent innovation on human genes. Somewhat surprisingly,
using USPTO data on human genes the authors �nd that gene patents have no systematic e¤ect on subsequent
innovation.
8 Towards a new Growth Pact in Europe
The above discussion suggests some directions for a new growth package for EU and in particular countries in
the Euro area: (i) structural reforms starting with the liberalization of product and labor markets: here we
will argue that an important role can be played by structural funds provided the targeting and governance of
these funds is suitably modi�ed; (ii) industrial investments along the lines suggested by our above discussion
on vertical targeting; (iii) more �exible macroeconomic policies (budgetary and monetary) at EU level.
8.1 Structural reforms and the role of structural funds
There is a broad consensus among European leaders regarding the importance of structural reforms, in partic-
ular product and labor market liberalization and higher education reform, to foster long run growth Europe.
In this section we �rst assess the potential increase in growth potential from having all Eurozone countries
converge fully or partly to the best standards with regard to product or labor market liberalization, and also
with regard to higher education. In the second part of the section we discuss the role that structural funds
might play in encouraging such reforms.
8.1.1 Assessing the growth e¤ects of structural reforms
As in Aghion et al (2009c) one can look at the e¤ect of structural policies using cross-country panel regressions
across 21 European countries. Our structural indicators are the following: For higher education system : the
share of the 25-64 years old population having completed tertiary education (SUP); for product market : an
OECD index assessing product market regulation (PMR); for labor market : an OECD index assessing the
strictness of employment protection (LPE). In fact we focus on the interaction between these two rigidities,
27Speci�cally, in 1998 and 1999, the National Institutes of Health negotiated two Memoranda of Understanding with the �rm
DuPont, which granted academic researchers low-cost, royalty-free and independent access to both the use of DuPont�s methods
and to the transgenic mice associated with them through the Jackson Laboratory, a non-pro�t research mice repository.
28
namely the variable PMR*LPE, in the analysis of labor and product market reforms. Indeed, there are good
reasons to believe the e¤ects of liberalizing product markets are complementary to those of liberalizing labor
markets: for example, making entry in a new activity easier is of lesser value to an entrepreneur if she cannot
hire new employees to work on that activity.
We can look at the short- and long-run growth e¤ects of converging towards the performance levels of
�target countries�. The target groups include those countries which are found to be the �best performers�
in terms of education, product and labor market regulations. In order to determine these groups, we rank
countries according to the variables SUP and PMR*LPE and we come up with two target groups: Non-
European target group: USA and Canada; European target group: UK, Ireland and Denmark. The advantage
of these two target groups is that they allow comparisons between countries within the European Union as
well as with non European counterparts. Interestingly, we found the same target groups both for the higher
education and the labor and product market regulation. Then we can assess the average e¤ect of converging
towards best practice for the eurozone (EMU) as a whole. Our results are that converging towards the best
practice in terms of product and labor market liberalization generates a growth gain of between 0.3 and
0.4 already in the short run. Converging towards the best practice in terms of higher education enrollment
generates a growth gain which is initially smaller (if we take the UK, Ireland and Denmark as the reference
countries), but grows up to 0.6 by 2050. Altogether, a full percentage point in growth can be gained through
structural convergence towards those three countries.
8.1.2 Rethinking the role and design of Structural Funds
Here we argue that structural funds can be partly reoriented towards facilitating the implementation of struc-
tural reforms. So far, these funds have been used mainly to �nance medium-term investment projects and
to fostering socio-economic cohesion within the EU. Moreover, these funds are allocated ex ante based on
recipient countries�GDP relative to the EU average, population and surface.
We argue in favour of an alternative approach both to the goals, targeting and governance of Structural
Funds. On the goals of Structural Funds: These funds should become transformative, in other words they
should help achieve structural reforms in the sectors they are targeted to. In our above discussion, we identi�ed
some main areas (areas or sectors?) where structural reforms are needed: labor markets, product markets
and education. Structural funds should aim at facilitating changes in the functioning of these sectors in the
various countries. The allocation of funds should generally be made on an individual basis: in other words,
they should mainly target schools, employment agencies, individual workers, not so much countries. The funds
would help �nance transition costs. The allocation of funds should be to well-speci�ed deliverables (provision
of better tutorship in education, improvements in the organization of employment agencies, transition to
portable pensions rights across two or more countries, setting up of diploma equivalence for service jobs,. . . )
and should be also conditional upon the country or region not having put in place a general policy that
contradicts the purpose of the fund allocation.
Now regarding the governance of Structural Funds, the allocation of funds should be made by European
agencies on the model of the European Research Council: bottom up approach with peer evaluation ex ante
and ex post.
29
8.2 Rethinking industrial policy in the EU
Growth in the EU also requires adequate vertical targeting, both by member states and at EU level. In the
previous sections we have emphasized the view that horizontal targeting should be given priority: basic and
applied research, higher education, labor mobility. But, in light of our discussion in the previous sections, we
also believe that well governed vertical targeting by member states and at EU level can help foster growth
further within the EU.
At EU level, infrastructure investments in transportation, energy, and broadband network should greatly
contribute to increasing product market competition in local markets. In other words, proper vertical targeting
at EU level can help enhance horizontal policies in member states. Another justi�cation for privileging vertical
targeting at EU level, is that targeting at EU level is more likely to preserve product market competition when
the targeted activities involve important �xed costs. What we mean here, is that subsidizing activities with
high �xed costs at local level (i.e. at the level of one particular country) often boils down to subsidizing one
particular �rm, which in turn defeats the purpose of reconciling industrial policy with the need to enhance
product market competition. This consideration becomes less binding when vertical targeting is done at EU
level, since at EU level it is easier to �nd more than one potential recipient of vertical subsidies, including for
activities involving high �xed costs.
But EU policy with regard to vertical targeting goes beyond EU level investments: it also concerns the
attitude of the European Commission with regard to sectoral policies by member states. These are currently
perceived by European authorities as a threat to European integration which in turn explains the fussy checks
by European competition authorities of all devices supporting industrial activities. Here, let us mention a
remarkable work on state aid in Europe, Japan and the United States by Pierre-André Buigues and Khalid
Sekkat which identi�es false debates and arguments against industrial policy. These authors �nd a general
tendency in Europe towards lowering state aid (Germany being an exception, although mainly since the past
ten years with the integration of the Eastern landers). This in turn suggests that the Commission has been
remarkably e¤ective in limiting the scope of state aid. What we recommend is to have the Commission become
less a priori biased against the use of state aid while at the same time setting new and clear guidelines for
the allocation and governance of that aid. In other words, the Commission should move from an "ex ante",
legalistic, approach to sectoral state aid to an "ex post", pragmatic, approach where state aid is sanctionned
only when it can be proved that it resulted in lowering product market competition in the corresponding
activity.
Whether at EU level or by member states, vertical targeting should be adequately designed and governed.
In the previous section we mentioned the recent paper by Nunn and Tre�er (2009) suggesting that sectoral
aid is more likely to be growth-enhancing if it target sectors with higher growth potential, one measure of it
being the extent to which various industries are skill-biased. We also mentioned the work by Aghion et al
(2013) suggesting that vertical targeting is more growth-enhancing if it targets activities with higher degree
of product market competition and enhance product market competition within the sector.28
28While it is part of the EU mission to promote product market competition, at the same time, natural monopolies are prevalent
in network sectors, and having too many networks, may result in Europe becoming underequipped in the �eld of broadband optics
and more generally disadvantaged in digital industry activities. This consideration should of course be also taken into account
when designing vertical targeting at EU level.
30
8.3 More �exible macroeconomic policies at EU level
In previous sections we have argued that more countercyclical macroeconomic policies can help (credit-
constrained) �rms maintain R&D and other types of innovation-enhancing investments over the business
cycle. One implication of this for European growth policy design, is that all the debt and de�cit targets (both
in the short and in the long term) should be corrected for cyclical variations, in other words they should
always be stated in structural terms. Thus, for example if a country�s current growth rate is signi�cantly
below trend, then the short run budgetary targets should be relaxed so as to allow this country to maintain
its growth enhancing investments. However, while the �scal compact speci�es long-term objectives that are
stated in structural terms, the short and medium term targets agreed between the European Commission and
member states last year, are in nominal terms. This inconsistency is damageable to growth.
9 Conclusion
In this paper we have tried to show how theoretical models of growth and innovation can deliver testable
predictions and also policy recommendations. Our emphasis has been on the Schumpeterian approach where
each innovation induces positive knowledge spillovers on subsequent research but also destroys rents from
previous innovations.
Where do we see the research on R&D, innovation and growth being pushed over the next years? A �rst
direction is to look more closely at how growth and innovation are a¤ected by the organization of �rms and
research. Thus over the past �ve years Nick Bloom and John Van Reenen have popularized fascinating new
data sets that allow us to look at how various types of organizations (e.g. more or less decentralized �rms)
are more or less conducive to innovation. But �rms�size and organization are in turn endogenous, and in
particular they depend upon factors such as the relative supply of skilled labor or the nature of domestic
institutions.
A second and related avenue for future research is to look in more details at innovation-led growth, �rm
dynamics and reallocation in developing economies. Recent empirical evidence (see Hsieh and Klenow 2009,
2012) has shown that misallocation of resources is a major source of productivity gap across countries. What
are the causes of misallocation, why do these countries lack creative destruction which would eliminate the
ine¢ cient �rms? Schumpeterian theory with �rm dynamics could be an invaluable source to shed light on
these important issues that lie at the core of the development puzzle.
A third avenue is to look at the role of �nance in innovation-led growth. Recent studies point at equity
�nance being more growth-enhancing in more frontier economies. More generally, we still need to better
understand how di¤erent types of �nancial instruments map with di¤erent sources of growth and di¤erent
types of innovation activities. Also, we need to better understand why we observe a surge of �nance during
the acceleration phase in the di¤usion of new technological waves, and also how �nancial sectors evolve when
the waves taper o¤.
A fourth avenue is to analyze in greater depth the relationship between innovation, income inequality and
social mobility, and to gather new data on individual patenting and revenues to look at how taxation policy
a¤ects the �ow and nature of innovation and the mobility of innovators. These and many other microeconomic
aspects of innovation and growth await further research.
31
References
[1] Acemoglu, D. (2009). Introduction to Modern Economic Growth, Princeton University Press.
[2] Acemoglu, D., Aghion, P., and Zilibotti, F (2006), �Distance to Frontier, Selection, and Economic
Growth.�Journal of the European Economic Association, 37-74.
[3] Acemoglu, D., and Akcigit, U (2012), �Intellectual Property Rights Policy, Competition and Innovation.�
Journal of the European Economic Association, 10, 1-42.
[4] Acemoglu, D., Akcigit, U., Bloom, N., and Kerr, W (2013), �Innovation, Reallocation and Growth.�
NBER Working Paper 18993.
[5] Acemoglu, D., Akcigit, U., Hanley, D., and Kerr, W (2012), �Transition to Clean Technology.�University
of Pennsylvania mimeo.
[6] Acemoglu, D., and Cao, D (2011), �Innovation by Entrants and Incumbents.�MIT mimeo.
[7] Acemoglu, D., and Robinson, J (2006), �Economic Backwardness in Political Perspective.� American
Political Science Review, 100, 115-131.
[8] Acemoglu, D., and Robinson, J (2012), Why Nations Fail, Crown Business.
[9] Acs, Z., and Audretsch, D (1988). �Innovation in Large and Small Firms: An Empirical Analysis.�
American Economic Review 78, 678-690.
[10] Acs, Z., and Audretsch, D (1991), �Innovation and Size at the Firm Level.�Southern Economic Journal
57, 739-744.
[11] Aghion, P., Akcigit, U., Deaton, A., and Roulet, A (2015), "Creative Destruction and Subjective Wellbe-
ing", NBER Working Paper No. 21069
[12] Aghion, P., Askenazy, P., Bourles, R., Cette, G., and Dromel, N (2009), �Education, market rigidities
and growth�, Economics Letters, N� 102, Iss. 1, January, pp. 62-65.
[13] Aghion, P., Bloom, N., Blundell, R., Gri¢ th, R., and Howitt, P (2005), �Competition and Innovation:
An Inverted-U Relationship.�Quarterly Journal of Economics, 120, 701-728.
[14] Aghion, P., Blundell, R., Gri¢ th, R., Howitt, P., and Prantl, S (2009), �The E¤ects of Entry on Incumbent
Innovation and Productivity.�Review of Economics and Statistics, 91, 20-32.
[15] Aghion, P., Boustan, L., Hoxby, C. and Vandenbussche, J (2009), � Exploiting States�Mistakes to Identify
the Causal E¤ects of Higher Education on Growth.�Harvard mimeo.
[16] Aghion, P., Caroli, E., and Garcia-Penalosa, C (1999), �Inequality and Economic Growth: The Perspec-
tive of the New Growth Theories.�Journal of Economic Literature, 37, 1615-1660.
[17] Aghion, P., Dewatripont, M. , Du, L. , Harrison, A. , and Legros, P (2015), �Industrial Policy and
Competition�, mimeo Harvard
32

[18] Aghion, P., Dewatripont, M., Hoxby, C., Mas-Colell, A., and Sapir, A (2010), �The Governance and
performance of Universities: Evidence from Europe and the US�, Economic Policy, 25, 7-59.
[19] Aghion, P., Farhi, E., and Kharroubi, E (2012), �Monetary Policy, Liquidity and Growth�, mimeo Harvard
[20] Aghion, P., and Gri¢ th, R (2006). Competition and Growth: Reconciling Theory and Evidence, MIT
Press.
[21] Aghion, P., Harris, C., Howitt, P., and Vickers, J (2001). �Competition, Imitation and Growth with
Step-by-Step Innovation.�Review of Economic Studies, 68, 467-492.
[22] Aghion, P., Harris, C., and Vickers, J (1997), �Competition and Growth with Step-by-Step Innovation:
An Example.�European Economic Review, Papers and Proceedings, 771-782.
[23] Aghion, P., Hemous, D., and Kharroubi, E (2009), �Countercyclical Fiscal Policy, Credit Constraints,
and Productivity Growth�, forthcoming in the Journal of Monetary Economics
[24] Aghion, P., and Howitt, P (1992), �A Model of Growth Through Creative Destruction.�Econometrica,
60, 323-351.
[25] Aghion, P., and Howitt, P (1998), Endogenous Growth Theory, MIT Press.
[26] Aghion, P., and Howitt, P (2006), �Appropriate Growth Policy�, Journal of the European Economic
Association, 4, 269-314.
[27] Aghion, P., and Howitt, P (2009), The Economics of Growth, MIT Press.
[28] Aghion, P., Howitt, P., and Prantl, S (2013), �Patent Rights, Product Market Reforms and Innovation.�
NBER Working Paper 18854.
[29] Aghion, P, and A. Roulet (2011), Repenser l�Etat, Editions du Seuil, Paris.
[30] Akcigit, U., Hanley, D., and Serrano-Velarde, N (2014), �Back to Basics: Basic Research Spillovers,
Innovation Policy and Growth�, NBER Working Paper 19473
[31] Akcigit, U., and Kerr, W (2010), �Growth Through Heterogeneous Innovations.�NBER Working Paper
16443.
[32] Arrow, K (1962), �The Economic Implications of Learning by Doing.�Review of Economic Studies, 29,
155-173.
[33] Axtell, R (2001), �Zipf Distribution of US Firm Sizes.�Science, 293, 1818�1820.
[34] Barro, R., and Sala-i-Martin, X (2003), Economic Growth, McGraw-Hill.
[35] Bartelsman, E., and Doms, M (2000), �Understanding Productivity: Lessons from Longitudinal Micro-
data.�Journal of Economic Literature, 38, 569�594.
[36] Bartelsman, E., Haltiwanger, J., and Scarpetta, S (2009), �Cross-country Di¤erences in Productivity:
The Role of Allocation and Selection� NBER Working Paper 15490.
33

[37] Bergeaud, A., Cette, G., and Lecat, R (2014), �Productivity trends from 1890 to 2012 in advanced
countries�, Banque de France, Working Paper, N� 475, February.
[38] Birch, D (1981), �Who Creates Jobs?�The Public Interest, 65, 3-14.
[39] Birch, D. (1987). Job Creation in America: How Our Smallest Companies Put the Most People to Work,
Free Press.
[40] Blundell, R., Gri¢ th, R., and Van Reenen, J (1995), �Dynamic Count Data Models of Technological
Innovation.�Economic Journal, 105, 333-344.
[41] Blundell, R., Gri¢ th, R., and Van Reenen, J (1999), �Market Share, Market Value and Innovation in a
Panel of British Manufacturing Firms.�Review of Economic Studies, 66, 529-554.
[42] Boldrin, M., and Levine, D (2008), Against Intellectual Monopoly, Cambridge University Press.
[43] Bresnahan, T., and Trajtenberg, M (1995), �General Purpose Technologies: Engines of Growth?�Journal
of Econometrics, 65, 83-108.
[44] Cette, G., and Lopez, J (2012), �ICT demand behavior: an international comparison�, Economics of
innovation and New Technology, Taylor and Francis Journals, vol. 21(4), June, pp. 397-410.
[45] Cohen, W (1995), �Empirical Studies of Innovative Activity.� in Paul Stoneman (ed.) Handbook of the
Economics of Innovations and Technological Change, Blackwell.
[46] Cohen, W., and S. Klepper. (1996). �Firm Size and the Nature of Innovation within Industries: The Case
of Process and Product R&D.�Review of Economics and Statistics, 232-243.
[47] Criscuolo, C., Martin, R., Overman, H., and Van Reenen, J (2012), �The Causal E¤ects of Industrial
Policy�, CEP Working Paper 1113.
[48] David, P. (1990), �The Dynamo and the Computer: An Historical Perspective on the Modern Productivity
Paradox.�American Economic Review, 80, 355-361.
[49] Davis, S., Haltiwanger, J., and Schuh, S (1996), Job Creation and Destruction, MIT Press.
[50] Djankov, S., La Porta, R., Lopez-de-Silanes, F., and Shleifer, A (2002), �The Regulation of Entry.�
Quarterly Journal of Economics, 117, 1-37.
[51] Foster, L., Haltiwanger, J., and Krizan, C (2001), �Aggregate Productivity Growth: Lessons from Micro-
economic Evidence.�New Directions in Productivity Analysis (eds. E. Dean, M. Harper and C. Hulten),
University of Chicago Press.
[52] Foster, L., Haltiwanger, J., and Krizan, C (2006), �Market Selection, Reallocation, and Restructuring in
the U.S. Retail Trade Sector in the 1990s.�Review of Economics and Statistics, 88, 748-758.
[53] Foster, L., Haltiwanger, J., and Krizan, C (2000), �Aggregate Productivity Growth: Lessons from Micro-
economic Evidence�, in New Developments in Productivity Analysis, University of Chicago Press.
[54] Frankel, J., and Romer, D (1999), �Does Trade Cause Growth?�American Economic Review, 89, 379-399.
34

[55] Freeman, C (1982), The Economics of Industrial Innovation, MIT Press.
[56] Galor, O (2011), Uni�ed Growth Theory, Princeton University Press.
[57] Gerschenkron, A (1962), Economic Backwardness in Historical Perspective: A Book of Essays, Belknap
Press of Harvard University Press.
[58] Gordon, R. (2012). �Is U.S. Economic Growth Over? Faltering Innovation Confronts the Six Headwinds.�
NBER Working Paper 18315.
[59] Gottschalk, P., and Mo¢ tt, R (1994), �The Growth of Earnings Instability in the US Labor Market.�
Brookings Papers on Economic Activity, 2, 217-272.
[60] Greenwood, J., and Yorukoglu, M (1997), �1974.�Carnegie-Rochester Series on Public Policy, 46, 49�95.
[61] Griliches, Z. (1990). �Patent Statistics as Economic Indicators: A Survey.�Journal of Economic Literature
28, 1661-1707.
[62] Grossman, G., and Helpman, E (1991), �Quality Ladders in the Theory of Growth.�Review of Economic
Studies, 58, 43-61.
[63] Hall, B., Ja¤e, A., and Trajtenberg, M (2001), �The NBER Patent Citation Data File: Lessons, Insights
and Methodological Tools.�NBER Working Paper 8498.
[64] Haltiwanger, J., Jarmin, R., and Miranda, J (2010), �Who Creates Jobs? Small vs. Large vs. Young.�
NBER Working Paper 16300.
[65] Helpman, E., and Trajtenberg, M (1998), �A Time to Sow and A Time to Reap: Growth Based on General
Purpose Technologies.�in E. Helpman (eds.) General Purpose Technologies and Economic Growth, MIT
Press.
[66] Hornstein, A., and Krusell, P (1996), �Can Technology Improvements Cause Productivity Slowdowns?�
NBER Macroeconomics Annual, 11, 209�259.
[67] Howitt, P (2000), �Endogenous Growth and Cross-Country Income Di¤erences.�American Economic
Review, 90, 829-46.
[68] Hsieh, C., and Klenow, P (2009), �Misallocation and Manufacturing TFP in China and India.�Quarterly
Journal of Economics, 124, 1403-1448.
[69] Hsieh, C., and Klenow, P (2012), �The Life Cycle of Plants in India and Mexico.�NBER Working Paper
18133.
[70] Ijiri, Y., and Simon, H (1977), Skew Distributions and the Sizes of Business Firms. North-Holland.
[71] Joint Economic Committee (JEC) (2010): �The 2010 Joint Economic Report,�Washington, DC: Gov-
ernment Printing O¢ ce.
[72] Jones, C., and Vollrath, D (2013), Introduction to Economic Growth, W. W. Norton & Company.
35

[73] Klette, T., and Kortum, S (2004), �Innovating Firms and Aggregate Innovation.� Journal of Political
Economy 112, 986-1018.
[74] Lentz, R., and Mortensen, D (2008), �An Empirical Model of Growth Through Product Innovation.�
Econometrica 76, 1317-1373.
[75] Lipsey, R., and Bekar, C (1995). �A Structuralist View of Technical Change and Economic Growth.�Bell
Canada Papers on Economic and Public Policy, 3, 9-75.
[76] Mortensen, D., and Pissarides, C (1998), "Technological Progress, Job Creation, and Job Destruction",
Review of Economic Dynamics, 1, 733-753.
[77] Nelson, R (1959), �The Simple Economics of Basic Research,�Journal of Political Economy, 67, 297�306.
[78] Nelson, R., and Phelps, E (1966), �Investment in Humans, Technological Di¤usion, and Economic
Growth.�American Economic Review, 61, 69-75.
[79] Neumark, D., Wall, B., and Zhang, J (2008), �Do Small Businesses Create More Jobs? New Evidence for
the United States from the National Establishment Time Series.�NBER Working Paper 13818.
[80] Nickell, S. (1996), �Competition and Corporate Performance.� Journal of Political Economy, 104, 724-
746.
[81] Pissarides, C (1990), Equilibrium Unemployment Theory, Blackwell, Oxford.
[82] Qian, Y (2007), �Do National Patent Laws Stimulate Domestic Innovation in a Global Patenting Envi-
ronment?�Review of Economics and Statistics, 89, 436-453.
[83] Romer, P (1990), �Endogenous Technical Change.�Journal of Political Economy, 98, 71-102.
[84] Rossi-Hansberg, E. and M. Wright. (2007). �Establishment Size Dynamics in the Aggregate Economy.�
American Economic Review, 97, 1639�1666.
[85] Scherer, F (1984), Innovation and Growth: Schumpeterian Perspectives. MIT Press.
[86] Schmalensee, R (1989), �Inter-industry Studies of Structure and Performance.�In Handbook of Industrial
Organization, vol. 2, R. Schmalensee and R. D. (eds.) Willig, North-Holland.
[87] Schmutzler, A (2010), �Is Competition Good for Innovation? A Simple Approach to An Unresolved
Question.�Foundations and Trends in Microeconomic Analysis, 5, 355-428.
[88] Simon, H., and Bonini, C (1958), �The Size Distribution of Business Firms.�American Economic Review,
48, 607�17.
[89] Stanley, M., Buldyrev, S., Havlin, S., Mantegna, R., Salinger, M., and Stanley, E (1995), �Zipf Plots and
the Size Distribution of Firms.�Economic Letters 49, 453�57.
[90] Syverson, C (2011), �What Determines Productivity.�Journal of Economic Literature 49, 326-365.
[91] Tirole, J (1988), The Theory of Industrial Organization, MIT Press.
36

[92] Tushman, M., and Anderson, P (1986), "Technological Discontinuities and Organizational Environments.�
Administrative Science Quarterly, 31, 439�465.
[93] Vandenbussche, J., Aghion, P., and Meghir, C (2006), �Growth, Distance to Frontier, and Composition
of Human Capital.�Journal of Economic Growth, 11, 97-127.
[94] Vives, X (2008), �Innovation and Competitive Pressure.�Journal of Industrial Economics, 56, 419-469.
[95] Weil, D (2012), Economic Growth, Prentice Hall.
37
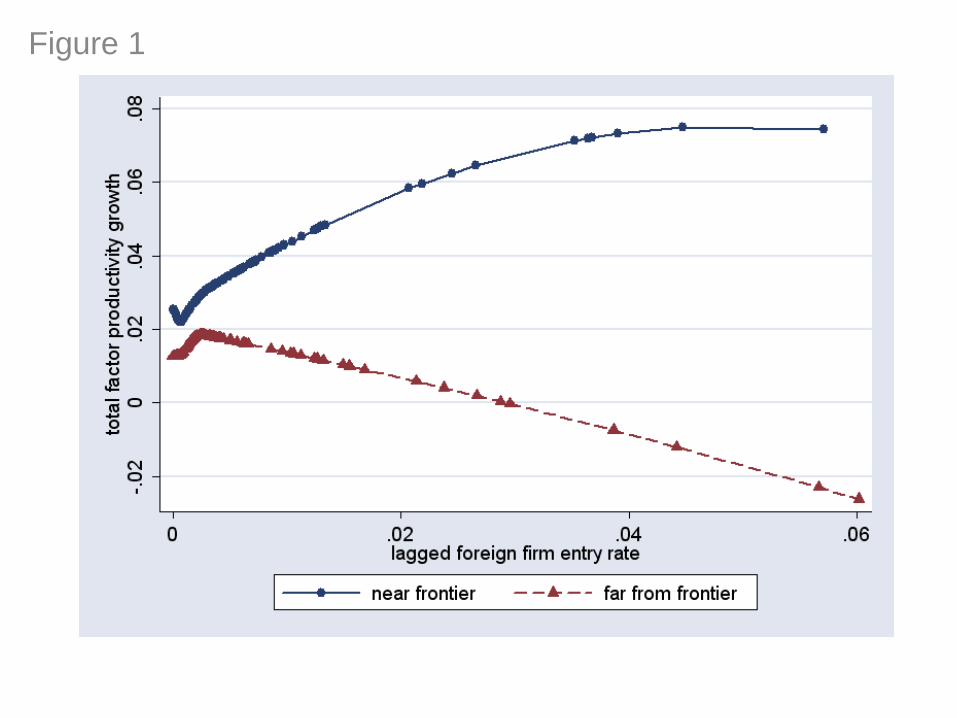
Figure 1
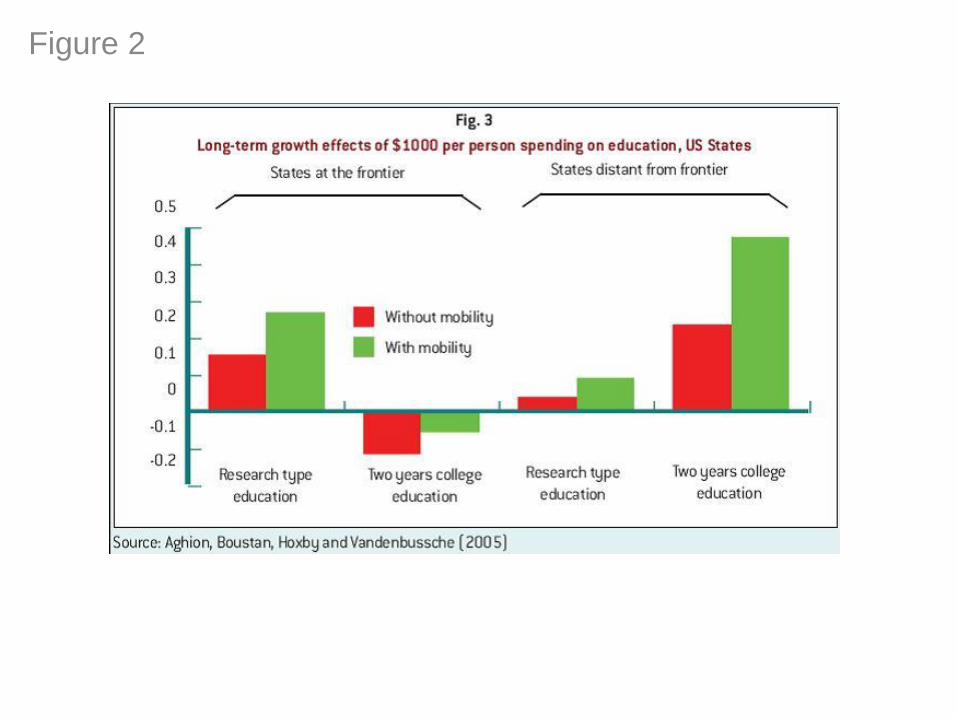
Figure 2
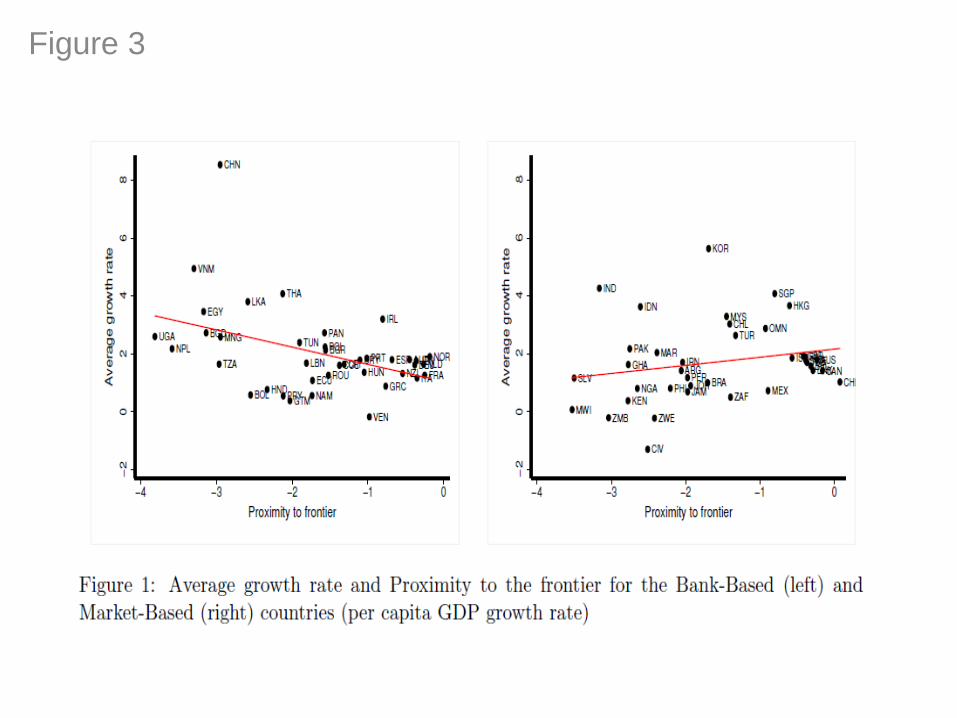
Figure 3
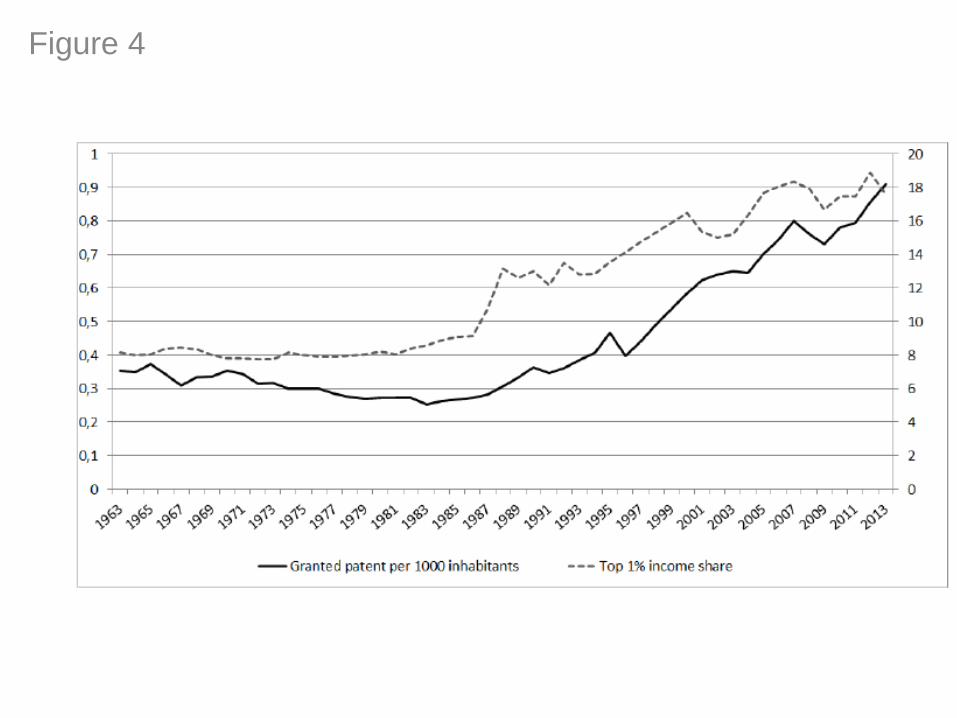
Figure 4
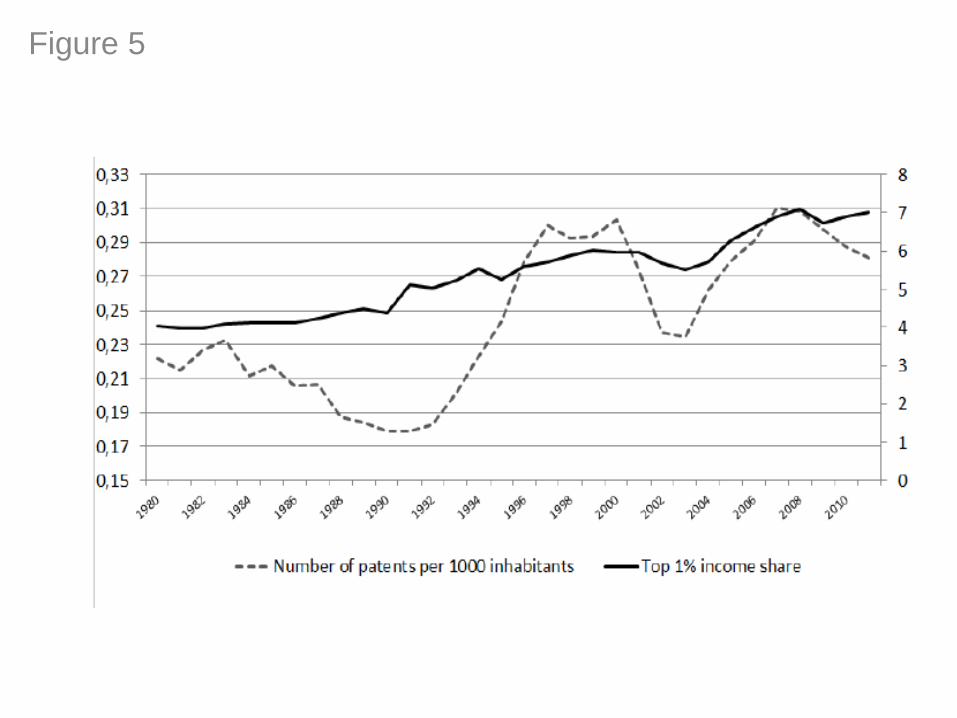
Figure 5
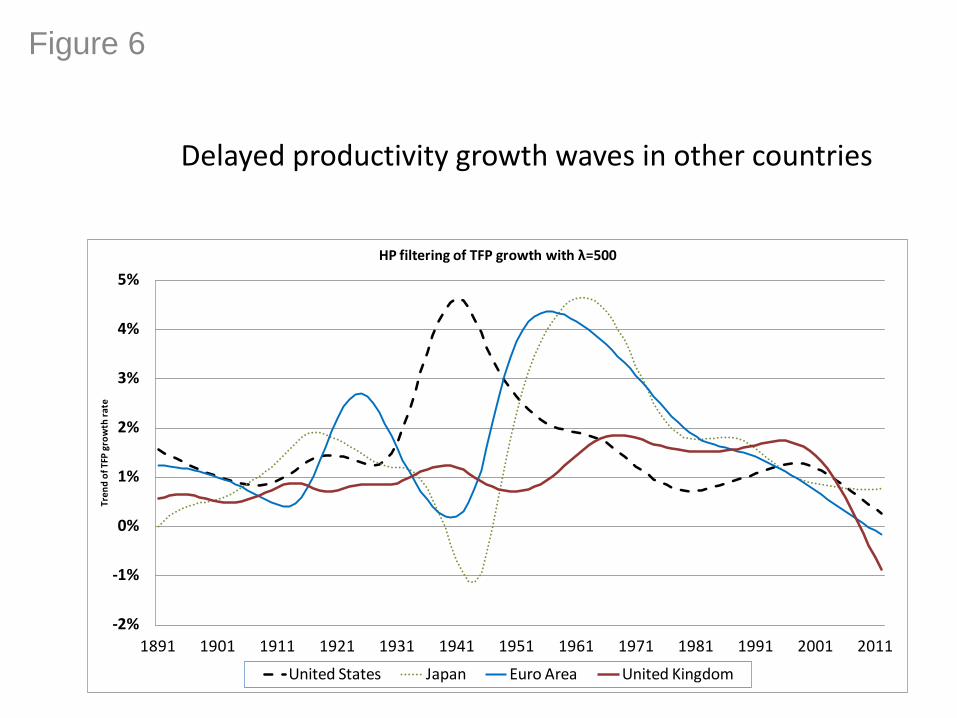
Figure 6
Delayed productivity growth waves in other countries
-2%
-1%
0%
1%
2%
3%
4%
5%
1891 1901 1911 1921 1931 1941 1951 1961 1971 1981 1991 2001 2011
Tren
d o
f TFP
gro
wth
rat
e
HP filtering of TFP growth with λ=500
United States Japan Euro Area United Kingdom
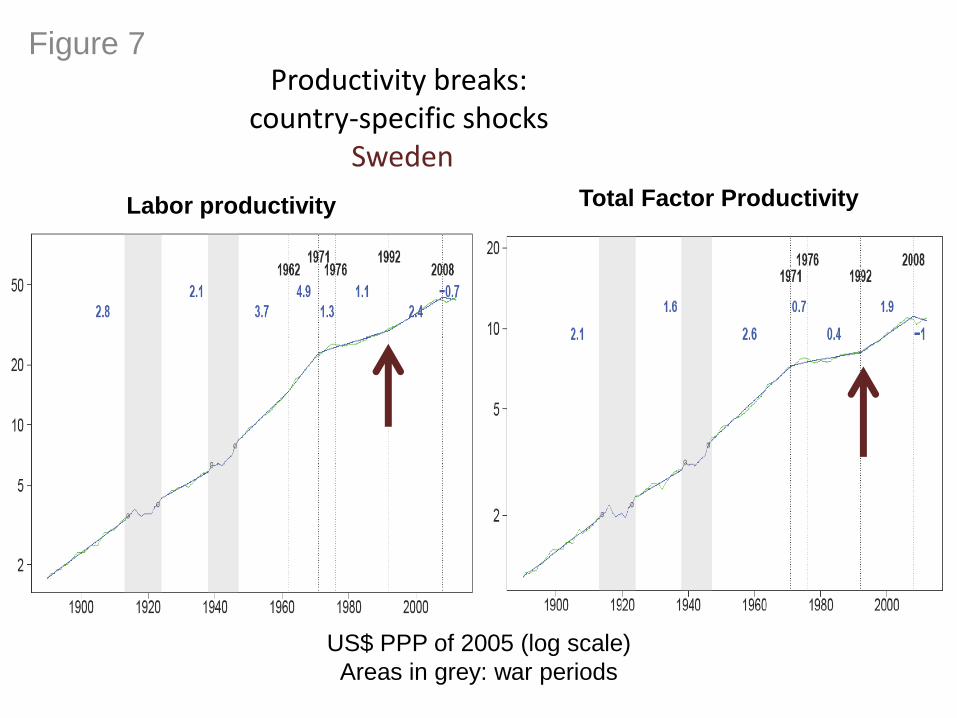
Figure 7 Productivity breaks:
country-specific shocks Sweden
Labor productivity
US$ PPP of 2005 (log scale)
Areas in grey: war periods
Total Factor Productivity

Figure 8 Productivity breaks:
country-specific shock Japan
Labor productivity
US$ PPP of 2005 (log scale)
Areas in grey: war periods
Total Factor Productivity