Embed Size (px)
Citation preview
The school snapshot survey: winter 2017 Research report
July 2018
IFF Research
2
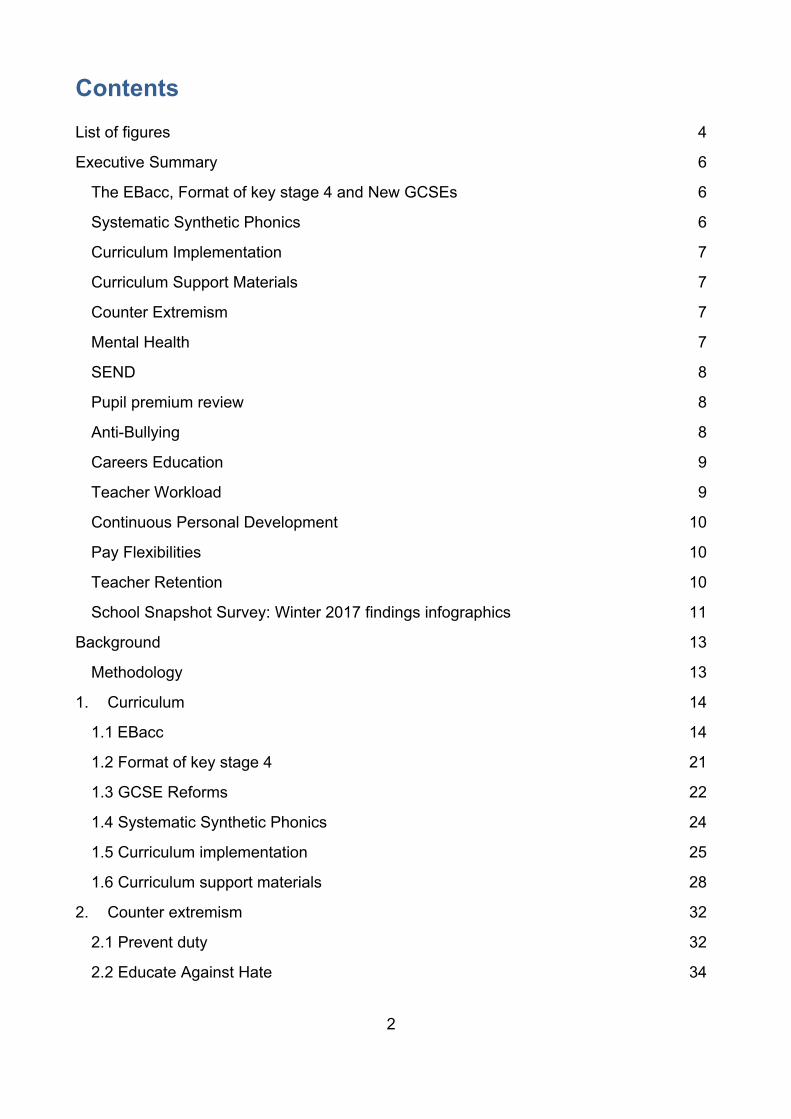
Contents List of figures 4
Executive Summary 6
The EBacc, Format of key stage 4 and New GCSEs 6
Systematic Synthetic Phonics 6
Curriculum Implementation 7
Curriculum Support Materials 7
Counter Extremism 7
Mental Health 7
SEND 8
Pupil premium review 8
Anti-Bullying 8
Careers Education 9
Teacher Workload 9
Continuous Personal Development 10
Pay Flexibilities 10
Teacher Retention 10
School Snapshot Survey: Winter 2017 findings infographics 11
Background 13
Methodology 13
1. Curriculum 14
1.1 EBacc 14
1.2 Format of key stage 4 21
1.3 GCSE Reforms 22
1.4 Systematic Synthetic Phonics 24
1.5 Curriculum implementation 25
1.6 Curriculum support materials 28
2. Counter extremism 32
2.1 Prevent duty 32
2.2 Educate Against Hate 34
3
3. Mental Health, SEND and Pupil Premium 37
3.1 Mental Health 37
3.2 SEND 38
3.3 Pupil Premium reviews 40
3.4 Anti-Bullying 44
4. Careers Education 48
5. Teachers and Teaching 51
5.1 Workload 51
5.2 Continuous professional development (CPD) 53
5.3 Pay Flexibilities 55
5.4 Teacher retention 57
Appendix 60
Scope 60
Mode of interview 60
Response rate 60
Weighting 62
4
List of figures Figure 1: Proportion of KS4 pupils that schools plan to enter into full range of EBacc subjects 15
Figure 2: Estimated % entered into EBacc in 2018 by academy status 16
Figure 3: Estimated % entered into EBacc in 2018 by FSM quintile 17
Figure 4: Estimated % of KS4 pupils likely to be entered into EBacc in 2019 by academy status 19
Figure 5: Estimated % of KS4 pupils likely to be entered into EBacc in 2019 by FSM quintile 20
Figure 6: Proportion of schools that plan to enter pupils for the EBacc in 2020 21
Figure 7: Whether year 9 pupils will begin studying for KS4 in current academic year 22
Figure 8: Preparation for start of teachingnew GCSE Program 273
Figure 9: Confidence using systematic synthetic phonics to teach early reading (all primary teachers 31
Figure 10: Participation in national support programmes in last 12 months (all leaders and teacher except where specified) 27
Figure 11: Level at which teachers who felt they have insufficient access to guidance and resources would most like additional resources and guidance (all primary and secondary teachers / those who feel unable to access sufficient guidance) 29
Figure 12: Subjects in which primary teachers feel they have insufficient access to guidance and resources (primary teachers who feel do not have sufficient access) 30
Figure 13: Forms of guidance or resources felt to be most useful ( primary and secondary teachers who felt did not have sufficient access) 31
Figure 14: Confidence in implementing Prevent duty and confidence that school teachingrespect and tolerance (all leaders and teachers) 33
Figure 15: Awareness and usage of ‘Educate Against Hate’ website (all leaders and teachers) 34
Figure 16: Ways in which ‘Educate Against Hate’ website had helped (all leaders and teachers who had visited website) 35
5
Figure 17: Activities performed by mental health lead 38
Figure 18: Method of conducting SEND provision review 39
Figure 19: Commissioning of pupil premium reviews 41
Figure 20: Helpfulness of the pupil premium review 42
Figure 21: Reasons for not comissioning a pupil premium review 43
Figure 22: Frequency seen or received reports of different forms of bullying in last 12 months (leaders and teachers) 45
Figure 23: Proportion of leaders and teachers ‘fairly’or ‘very confident’ in dealing with different forms of bullying (leaders and teachers) 47
Figure 24: Organisation or person responsible for careers education in secondary schools 49
Figure 25: Format of careers education provided in schools 50
Figure 26: Actions taken by schools to evacuate and reduce unnecessary workload52
Figure 27: Extent to which workload has changed following action 53
Figure 28: Extent of knowledge of Standard 54
Figure 29: Ways that CPD has helped in the job or career of teachers 55
Figure 30: Pay flexibilities of which schools currently make use 56
Figure 31: School interest in offering additional pay flexibilities 57
Figure 32: Plans to leave the profession 58
6
Executive Summary This report covers the Winter 2017 findings of the first wave of the School Snapshot Survey. A total of 800 interviews were conducted with senior leaders and 909 interviews with classroom teachers. The survey covers a range of educational topics.
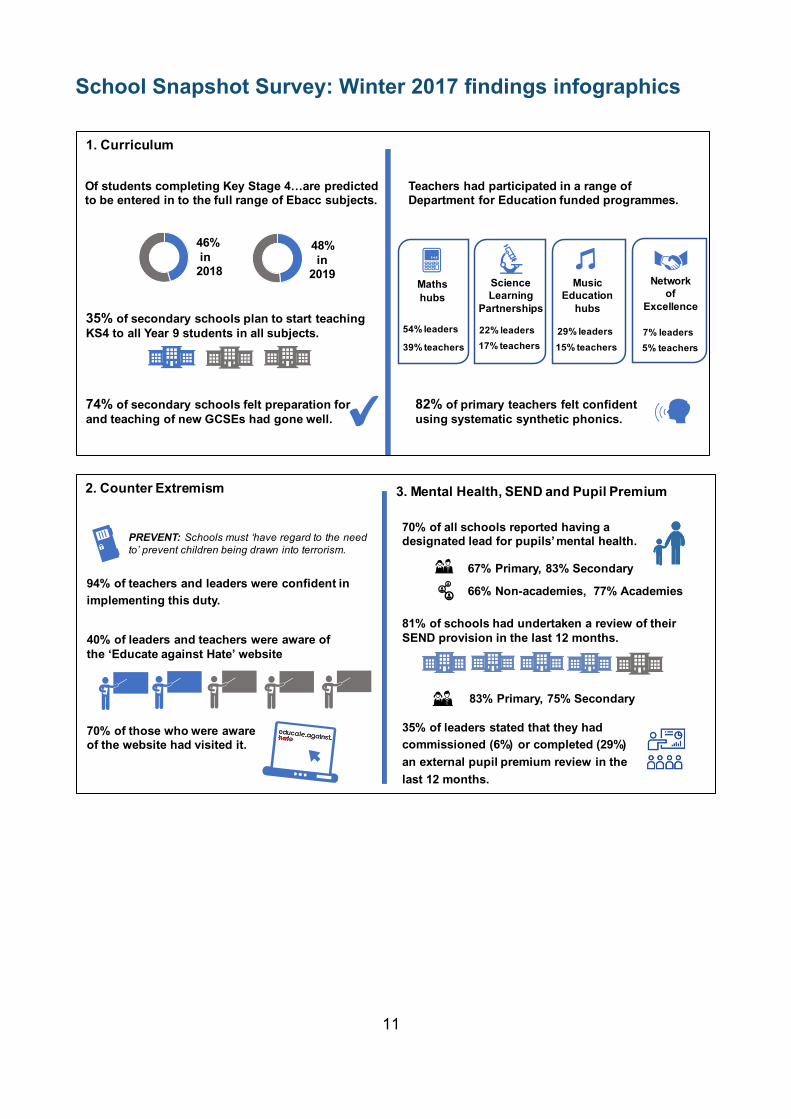
The EBacc, Format of key stage 4 and New GCSEs The EBacc is a school performance measure. It shows how many pupils both enter (entry measure) and get a grade C or 5 or above in science, a language, geography or history, English and maths at key stage 4 (attainment measure) in any government-funded school. Estimates from the survey indicate that, across the 3,428 secondary schools in England, around 239,400 pupils will be entered into the EBacc combination of exams in 2018, equating to around 46% of those completing key stage 4. This is an estimated rise from the proportion actually entered in 2017, where 38.2% of pupils from state-funded schools were entered into the EBacc combination of exams1. The indications from the survey are that this proportion will be slightly higher in 2019 (48%) and that this will continue to increase in 2020.
Traditionally GCSEs are two year courses of study that pupils start in year 10. However some schools have started to teach GCSE courses earlier. When secondary leaders were asked whether any of their year 9 pupils would begin (or had already begun) studying for key stage 4 in the current academic year, there was a mixed response across schools. Approximately a third of secondary schools who teach year 9 pupils stated that all their year 9 pupils would start studying for KS4 in all subjects (35%), just over a quarter thought all year 9 pupils would but for some subjects only (28%) and a similar percentage said that none would (27%). (The remainder stated that some of their students would).
Almost 3 in 4 secondary schools (74%) felt that the preparation and start of teaching for the third wave of new GCSEs introduced for first teaching in September 2017 had gone well, with nearly a fifth (19%) stating it had gone ‘very well’.
Systematic Synthetic Phonics Systematic Synthetic Phonics is the method of teaching the sounds of the alphabet and how to blend these sounds into words. Over four fifths of primary school teachers (82%) felt confident using systematic synthetic phonics to teach early reading, with just under half feeling ‘very confident’ (47%)
1 https://www.gov.uk/government/statistics/revised-gcse-and-equivalent-results-in-england-2016-to-2017
7
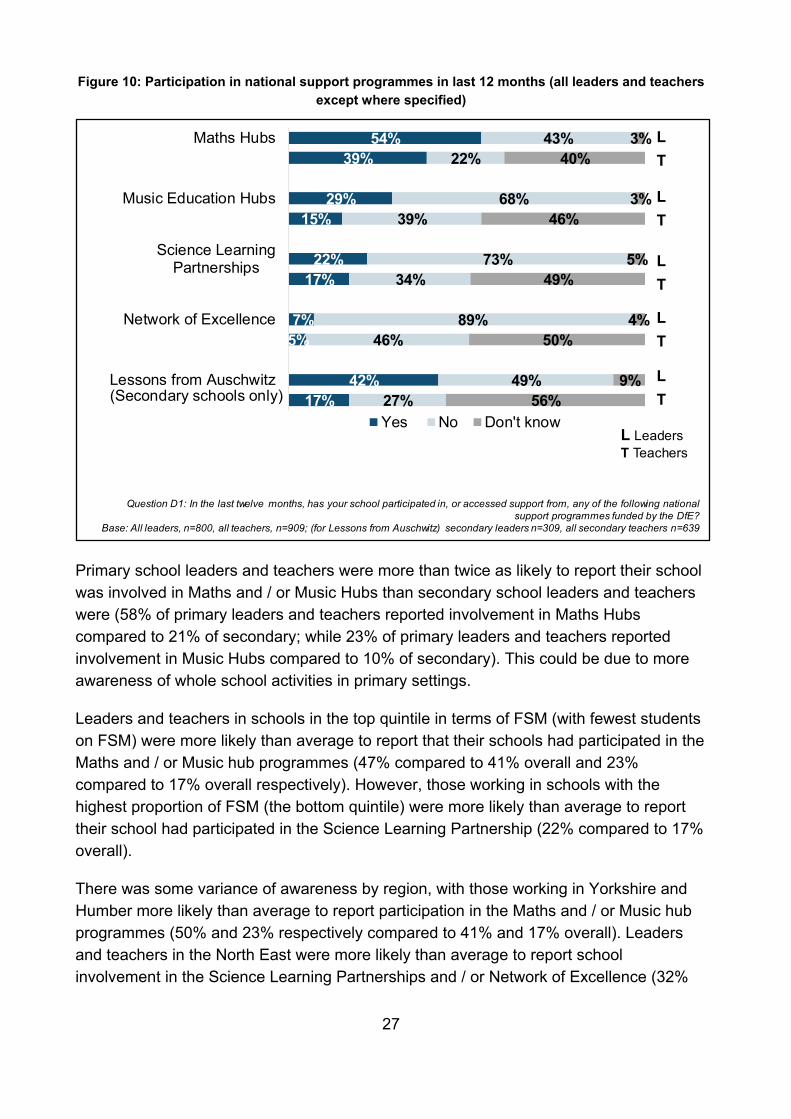
Curriculum Implementation Leaders and teachers were most likely to say they had participated in Maths hubs (54% of leaders and 39% of teachers). This was followed by the Music Education hub programme (29% of leaders and 15% of teachers) and Science Learning Partnerships (22% of leaders and 17% of teachers). Few reported that their school had engaged with the computer science-focused Network of Excellence during the past year (7% of leaders and 5% of teachers).
Curriculum Support Materials Overall 85% of teachers agreed they can access the guidance and resources needed to effectively plan and deliver lessons that meet the requirements of the national curriculum, while 12% disagreed. Secondary school teachers were twice as likely as primary school teachers to feel they did not have sufficient access to guidance and resources (16% compared to 8%).
Counter Extremism Since 1 July 2015 all schools have been subject to a duty under section 26 of the Counter-Terrorism and Security Act 2015, in the exercise of their functions, to have “due regard to the need to prevent people from being drawn into terrorism”. This duty is known as the Prevent duty. The vast majority (94%) of teachers (both classroom and in leadership positions) were confident in implementing this duty.
In 2016, the Department launched the ‘Educate Against Hate’ website, which aims to provide practical advice, support and resources to protect children from extremism and radicalisation. Two fifths (40%) of leaders and teachers were aware of the ‘Educate Against Hate’ website. Of the leaders and teachers who had heard of the website, 70% had visited it. The majority of those who had visited it had found it helpful (8 in 10 teachers found it helpful in several aspects, while three quarters (76%) of leaders found it helpful in several aspects.
Mental Health The Government has committed to incentivise every school to identify a Designated Senior Lead for Mental Health to oversee the approach to mental health and wellbeing2. Seven in 10 (70%) of all schools reported having a designated lead for pupils’ mental
2 Department of Health and the Department of Education (2017) Transforming Children and Young People’s Mental Health Provision: a Green Paper
8
health. This figure varied significantly between primary schools (67%) and secondary schools (83%). Non-academies were also less likely to have a mental health lead (only 66% had one in comparison with 77% of academy schools).
SEND A SEND review considers how a school is providing for its pupils with special educational needs and/or disabilities. Its purpose is to improve SEND provision and strategy to effectively support pupils with SEND to achieve good outcomes. Over 4 in 5 schools (81%) reported that they had undertaken a review of their SEND provision in the last 12 months. Primary schools were more likely to have undertaken a review (83%) than secondary schools (75%).
Pupil premium review A pupil premium review looks at how a school is spending its pupil premium funding. The purpose of the review is to improve a school’s pupil premium strategy, so that funding is spent on approaches shown to be effective in improving the achievement of disadvantaged pupils. Just over a third of schools (35%) stated that they had either commissioned (6%) or completed (29%) a pupil premium review from someone external to the school in the last 12 months.
Anti-Bullying By law, all state schools must have a behaviour policy in place that includes measures to prevent all forms of bullying among pupils. This policy is decided by the school. All teachers, pupils and parents must be told what it is.
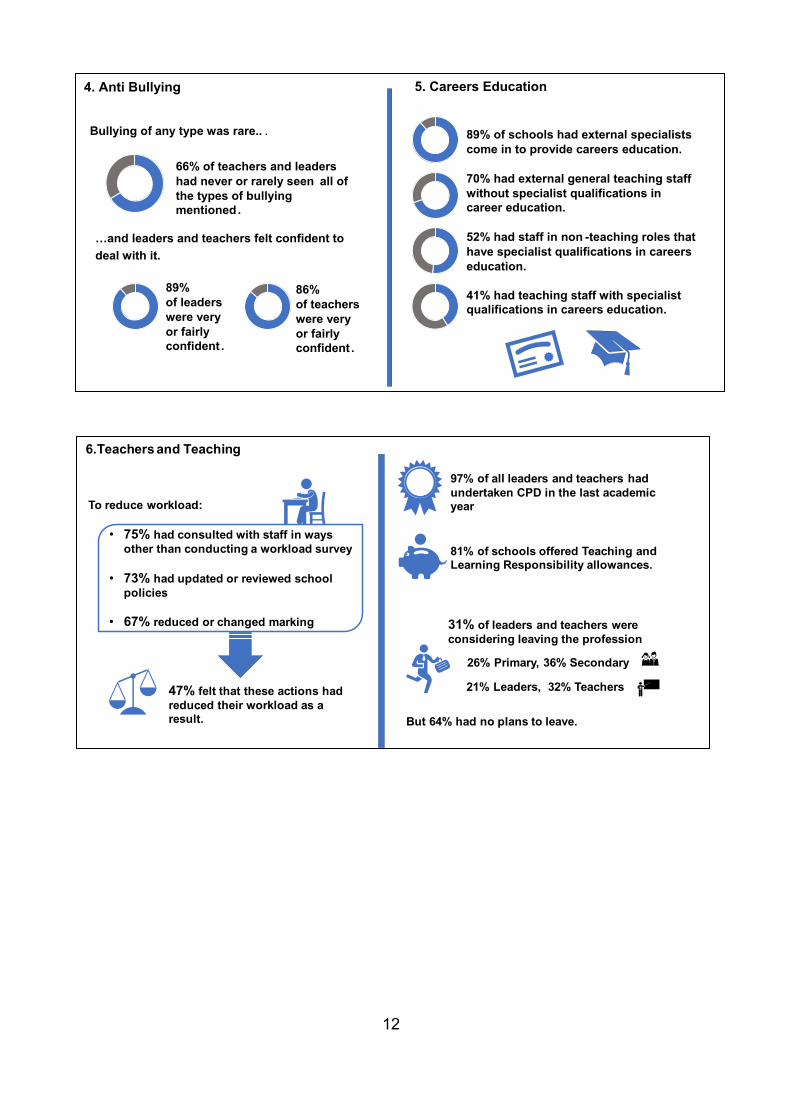
Over the previous 12 months all forms of bullying were seen very rarely, if at all: 66% of leaders and teachers had never or rarely seen all of the types of bullying mentioned. Anti-Semitic bullying was the least common form of bullying seen in the last 12 months (88% had never seen it, while 8% had seen it but only rarely). Other very rarely seen forms of bullying included: transphobic bullying (81% had never seen, 12% only rarely), boys being touched inappropriately (79% and 15% respectively), anti-Muslim bullying (77% and 18%), other bullying based on religion (77% and 18%), girls being touched inappropriately (71% and 21%) and bullying based on disability (70% and 23%). Slightly more commonly seen, though still relatively rare, was homophobic bullying (52% had never seen this, 31% had seen it rarely), bullying based on race or nationality (43% had never seen this, 44% had seen it rarely), and sexist or sexual language being used (41% had never seen this, 34% had seen it rarely).
9
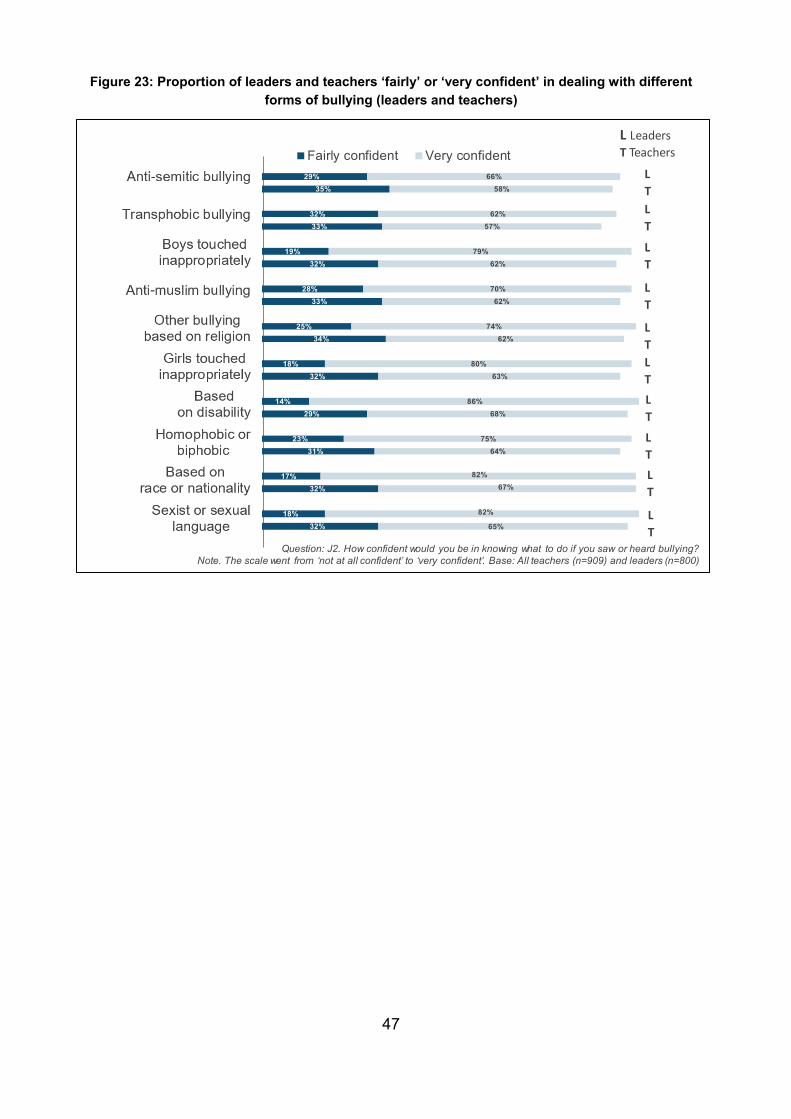
Overall, close to nine in ten leaders (89%) and teachers (86%) said they felt ‘very’ or ‘fairly’ confident in knowing what to do if they witnessed any form of bullying. Leaders were consistently more likely than teachers to feel ‘very confident’ in dealing with each form of bullying.
Careers Education Every school must ensure that pupils are provided with independent careers guidance from year 8 to year 133. The ways in which secondary schools were delivering careers education varied. Schools most commonly had external specialists come in to provide careers education (89%), followed by general teaching staff without specialist qualifications in career education (70%), staff with non-teaching roles that have specialist qualifications in careers education (52%) and teaching staff with specialist qualifications in careers education (41%).
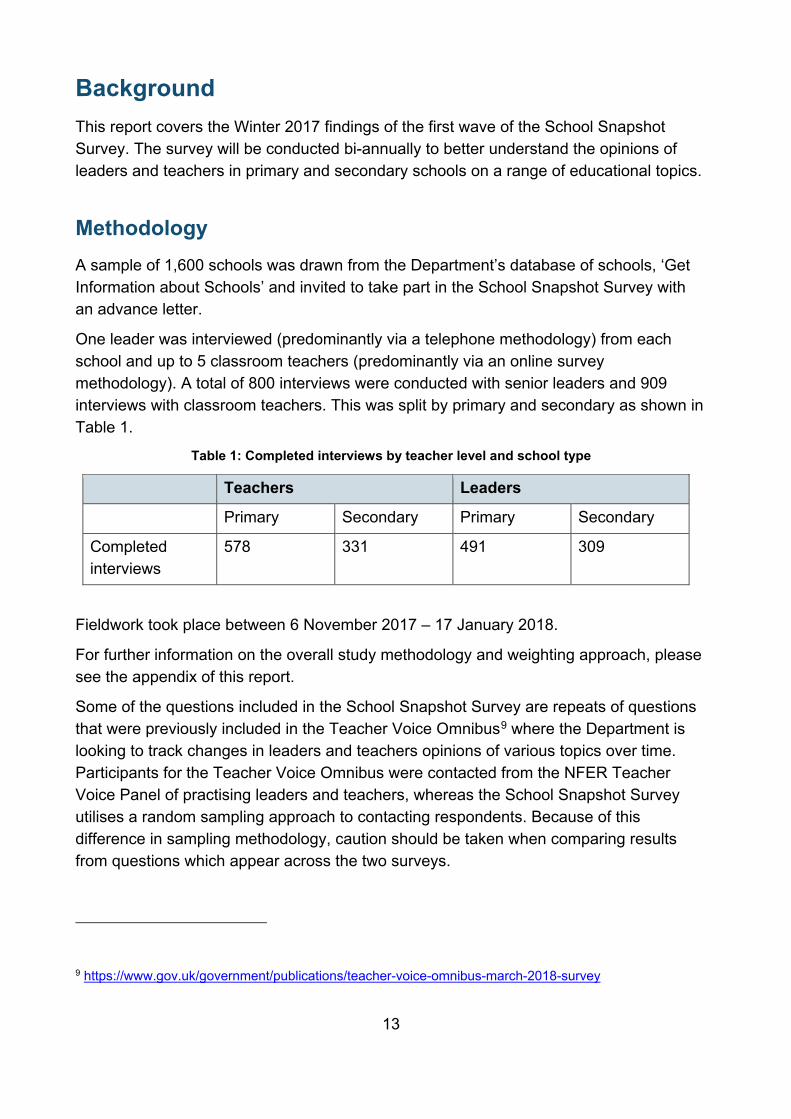
Teacher Workload Removing unnecessary workload is high on the education agenda. The DfE published the 2016 Teacher Workload Survey report4, a commitment from the 2014 Workload Challenge5, alongside an action plan6 setting out the steps to be taken. Leaders and teachers were asked about what actions, if any, their schools had taken to evaluate and reduce unnecessary workload. The most cited action taken was to consult with staff in ways other than conducting a workload survey (75% of leaders and teachers worked in schools which had done this). Other actions taken include reviewing or updating school policies (73%), reducing or changing marking (67%), reducing or changing planning (49%), using the independent reports on marking, planning and resources and/or data management as a basis to review current policies (39%) or actively addressing the recommendations for schools in the reports on marking, planning and resources, and/or data management (38%). Of those working in schools that had taken action on workloads, almost half (47%) said that the actions taken had effectively reduced unnecessary workload.
3 http://researchbriefings.files.parliament.uk/documents/CBP-7236/CBP-7236.pdf 4 https://www.gov.uk/government/publications/teacher-workload-survey-2016 5 https://www.gov.uk/government/publications/workload-challenge-for-schools-government-response 6 https://www.gov.uk/government/publications/reducing-teachers-workload
10
Continuous Professional Development The Department published a Standard for teachers’ professional development in July 20167. Over three quarters of leaders and teachers (76%) were aware of the Standard, 21% were not aware and 4% did not know.
When asked whether they had undertaken any Continuous Professional Development (CPD) in the last academic year, 97% of all leaders and teachers stated they had done so. Only 3% had not.
Pay Flexibilities Maintained schools must follow Government guidance on teachers’ pay and conditions8. Non-maintained schools, including academines and free schools are not obliged to follow the statutory arrangements, although they may still choose to do so if they wish. Leaders were asked about the pay flexibilities which their schools currently make use of. Schools most commonly offered Teaching and Learning Responsibility (TLRs) allowances (81% offered these). This was then followed by three pay flexibilities which were offered by similar numbers of schools: progressing outstanding teachers more rapidly up the pay ranges (49%), offering a salary sacrifice scheme (47%), and offering teachers new to the school a different starting salary compared to what they were on at their previous school (41%).
Teacher Retention Overall, almost two thirds of teaching professionals (either leaders or classroom teachers) stated that they had no plans to leave the profession (64% did not plan to leave). Just over three in ten (31%) were considering leaving; of these, 2% were actively looking to leave the teaching profession, 4% were considering leaving in the next 12 months, 24% were considering leaving in the next few years and 5% were unsure about their likelihood to remain. Leaders were less likely than teachers to be considering leaving and those working in secondary schools were more likely than those in primary schools to be considering leaving.
7 https://www.gov.uk/government/uploads/system/uploads/attachment_data/file/537030/160712_-_PD_standard.pdf 8 https://www.gov.uk/government/uploads/system/uploads/attachment_data/file/636389/School_teachers__ pay_and_conditions_document_2017.pdf
11
School Snapshot Survey: Winter 2017 findings infographics
1. Curriculum
46% in
2018
35% of secondary schools plan to start teaching KS4 to all Year 9 students in all subjects.
74% of secondary schools felt preparation for and teaching of new GCSEs had gone well.
82% of primary teachers felt confident using systematic synthetic phonics.
48% in
2019
Of students completing Key Stage 4…are predicted to be entered in to the full range of Ebacc subjects.
Teachers had participated in a range of Department for Education funded programmes.
Mathshubs
Science Learning
Partnerships
Music Education
hubs
Network of
Excellence
39% teachers
54% leaders 29% leaders 15% teachers 17% teachers
22% leaders 7% leaders 5% teachers
2. Counter Extremism
40% of leaders and teachers were aware of the ‘Educate against Hate’ website
70% of those who were aware of the website had visited it.
94% of teachers and leaders were confident in implementing this duty.
PREVENT: Schools must ‘have regard to the need to’ prevent children being drawn into terrorism.
3. Mental Health, SEND and Pupil Premium
70% of all schools reported having a designated lead for pupils’ mental health.
67% Primary, 83% Secondary
81% of schools had undertaken a review of their SEND provision in the last 12 months.
83% Primary, 75% Secondary
35% of leaders stated that they had commissioned (6%) or completed (29%) an external pupil premium review in the last 12 months.
66% Non-academies, 77% Academies
12
5. Careers Education
89% of schools had external specialists come in to provide careers education.
70% had external general teaching staff without specialist qualifications in career education.
52% had staff in non - teaching roles that have specialist qualifications in careers education.
41% had teaching staff with specialist qualifications in careers education.
4. Anti Bullying
Bullying of any type was rare.. .
66% of teachers and leaders had never or rarely seen all of the types of bullying mentioned .
…and leaders and teachers felt confident to deal with it.
89% of leaders were very or fairly confident .
86% of teachers were very or fairly confident .
97% of all leaders and teachers had undertaken CPD in the last academic yearTo reduce workload:
But 64% had no plans to leave.
6.Teachers and Teaching
• 75% had consulted with staff in ways other than conducting a workload survey
• 73% had updated or reviewed school policies
• 67% reduced or changed marking
47% felt that these actions had reduced their workload as a result.
26% Primary, 36% Secondary
21% Leaders, 32% Teachers
31% of leaders and teachers were considering leaving the profession
81% of schools offered Teaching and Learning Responsibility allowances.
13
Background This report covers the Winter 2017 findings of the first wave of the School Snapshot Survey. The survey will be conducted bi-annually to better understand the opinions of leaders and teachers in primary and secondary schools on a range of educational topics.
Methodology A sample of 1,600 schools was drawn from the Department’s database of schools, ‘Get Information about Schools’ and invited to take part in the School Snapshot Survey with an advance letter.
One leader was interviewed (predominantly via a telephone methodology) from each school and up to 5 classroom teachers (predominantly via an online survey methodology). A total of 800 interviews were conducted with senior leaders and 909 interviews with classroom teachers. This was split by primary and secondary as shown in Table 1.
Table 1: Completed interviews by teacher level and school type
Teachers Leaders
Primary Secondary Primary Secondary
Completed interviews
578 331 491 309
Fieldwork took place between 6 November 2017 – 17 January 2018.
For further information on the overall study methodology and weighting approach, please see the appendix of this report.
Some of the questions included in the School Snapshot Survey are repeats of questions that were previously included in the Teacher Voice Omnibus9 where the Department is looking to track changes in leaders and teachers opinions of various topics over time. Participants for the Teacher Voice Omnibus were contacted from the NFER Teacher Voice Panel of practising leaders and teachers, whereas the School Snapshot Survey utilises a random sampling approach to contacting respondents. Because of this difference in sampling methodology, caution should be taken when comparing results from questions which appear across the two surveys.
9 https://www.gov.uk/government/publications/teacher-voice-omnibus-march-2018-survey
14
1. Curriculum This chapter will explore schools’ and teaching professionals’ perspectives on a range of policy areas relating to curriculum reform, including the English Baccalaureate (EBacc), the new GCSEs, and areas in which teachers feel they need more support.
1.1 EBacc There are two EBacc school performance measures. The EBacc entry measure shows how many pupils enter GCSEs in English, mathematics, history or geography, the sciences (including computer science) and a language at key stage 4 (KS4) in state-funded schools. The attainment measures shows how many pupils get a grade C or 5 or above in those subjects.
In July 2017, the government announced its ambition that by 2022, 75% of pupils in year 10 should be starting to study GCSEs in the EBacc combination of subjects, rising to 90% of year 10 pupils starting to study this combination by 2025.
Senior leaders of secondary schools were asked how many of their pupils will be completing their KS4 in 2018 and the proportion of these pupils that they plan to enter into the full range of subjects required for the EBacc. They were then asked corresponding questions for those completing KS4 in 2019.
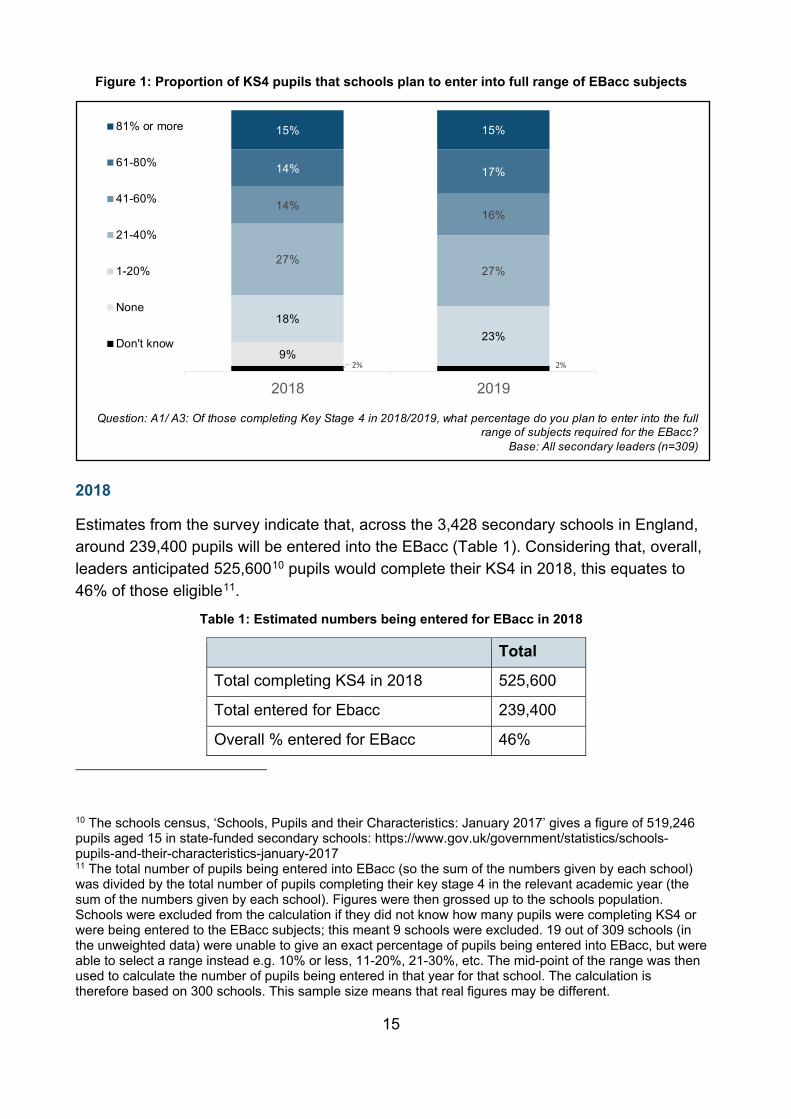
As Figure 1 shows, there was a considerable spread in terms of the proportion of pupils that schools anticipated will be entered into the full range of EBacc subjects with 9% of schools anticipating that none of their KS4 pupils will be entered into the full range of EBacc subjects in 2018 while 15% anticipated that at least 80% of their pupils will be entered. When forecasting figures for 2019, there were no schools who stated that none of their pupils will be entered but there remained a wide spread in the proportion of pupils that schools felt would be entered.
15
Figure 1: Proportion of KS4 pupils that schools plan to enter into full range of EBacc subjects
2018
Estimates from the survey indicate that, across the 3,428 secondary schools in England, around 239,400 pupils will be entered into the EBacc (Table 1). Considering that, overall, leaders anticipated 525,60010 pupils would complete their KS4 in 2018, this equates to 46% of those eligible11.
Table 1: Estimated numbers being entered for EBacc in 2018
Total
Total completing KS4 in 2018 525,600
Total entered for Ebacc 239,400
Overall % entered for EBacc 46%
10 The schools census, ‘Schools, Pupils and their Characteristics: January 2017’ gives a figure of 519,246 pupils aged 15 in state-funded secondary schools: https://www.gov.uk/government/statistics/schools-pupils-and-their-characteristics-january-2017 11 The total number of pupils being entered into EBacc (so the sum of the numbers given by each school) was divided by the total number of pupils completing their key stage 4 in the relevant academic year (the sum of the numbers given by each school). Figures were then grossed up to the schools population. Schools were excluded from the calculation if they did not know how many pupils were completing KS4 or were being entered to the EBacc subjects; this meant 9 schools were excluded. 19 out of 309 schools (in the unweighted data) were unable to give an exact percentage of pupils being entered into EBacc, but were able to select a range instead e.g. 10% or less, 11-20%, 21-30%, etc. The mid-point of the range was then used to calculate the number of pupils being entered in that year for that school. The calculation is therefore based on 300 schools. This sample size means that real figures may be different.
2% 2%9%
18%23%
27%27%
14%16%
14% 17%
15% 15%
2018 2019
81% or more
61-80%
41-60%
21-40%
1-20%
None
Don't know
Question: A1/ A3: Of those completing Key Stage 4 in 2018/2019, what percentage do you plan to enter into the full range of subjects required for the EBacc?
Base: All secondary leaders (n=309)
16
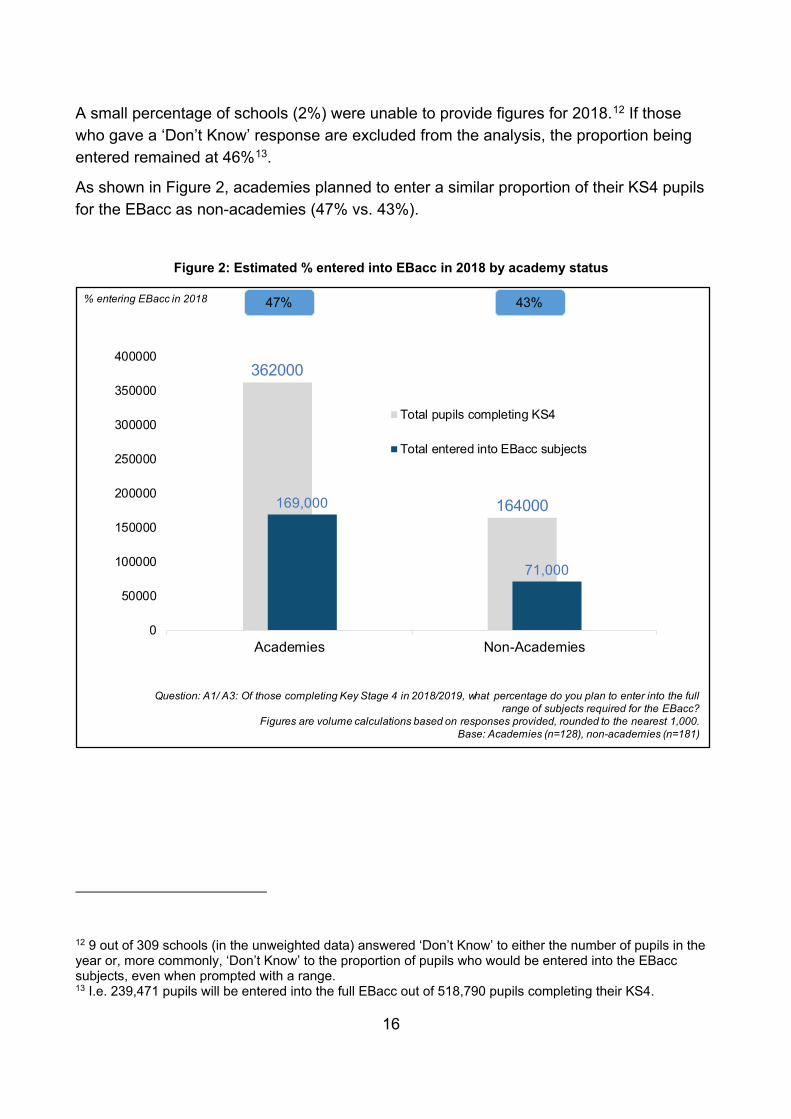
A small percentage of schools (2%) were unable to provide figures for 2018.12 If those who gave a ‘Don’t Know’ response are excluded from the analysis, the proportion being entered remained at 46%13.
As shown in Figure 2, academies planned to enter a similar proportion of their KS4 pupils for the EBacc as non-academies (47% vs. 43%).
Figure 2: Estimated % entered into EBacc in 2018 by academy status
12 9 out of 309 schools (in the unweighted data) answered ‘Don’t Know’ to either the number of pupils in the year or, more commonly, ‘Don’t Know’ to the proportion of pupils who would be entered into the EBacc subjects, even when prompted with a range. 13 I.e. 239,471 pupils will be entered into the full EBacc out of 518,790 pupils completing their KS4.
362000
164000169,000
71,000
0
50000
100000
150000
200000
250000
300000
350000
400000
Academies Non-Academies
Total pupils completing KS4
Total entered into EBacc subjects
47%% entering EBacc in 2018 43%
Question: A1/ A3: Of those completing Key Stage 4 in 2018/2019, what percentage do you plan to enter into the full range of subjects required for the EBacc?
Figures are volume calculations based on responses provided, rounded to the nearest 1,000. Base: Academies (n=128), non-academies (n=181)
17
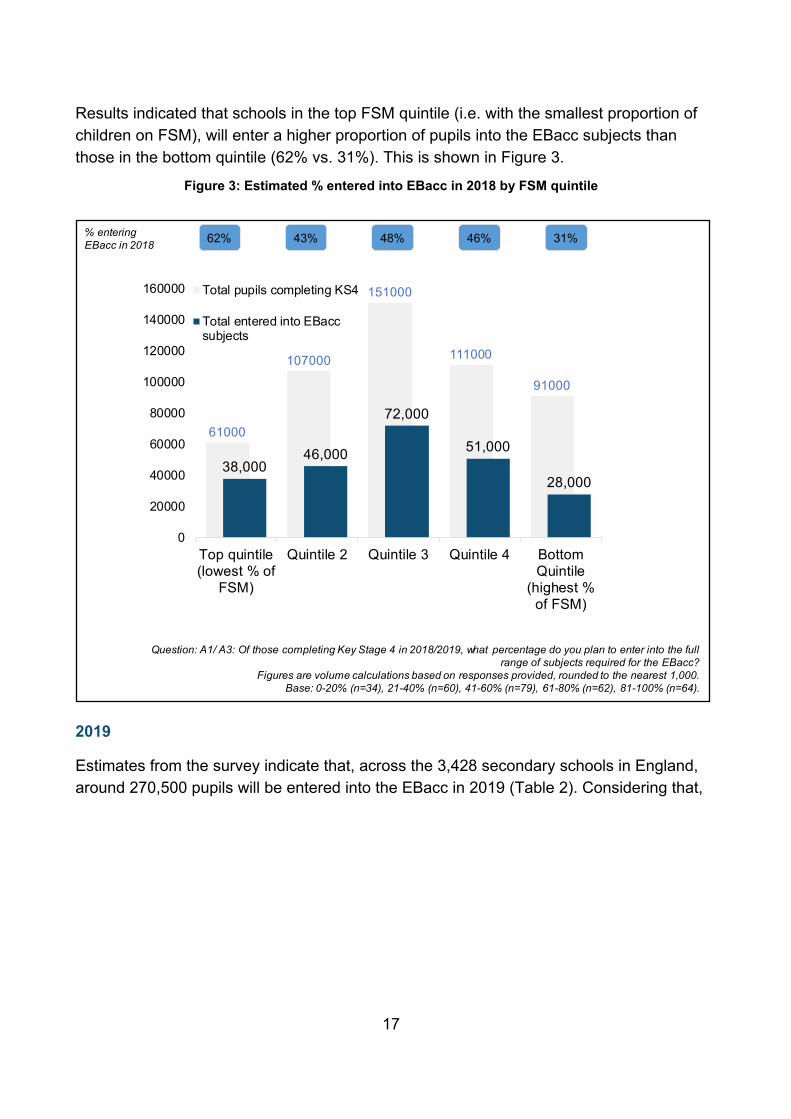
Results indicated that schools in the top FSM quintile (i.e. with the smallest proportion of children on FSM), will enter a higher proportion of pupils into the EBacc subjects than those in the bottom quintile (62% vs. 31%). This is shown in Figure 3.
Figure 3: Estimated % entered into EBacc in 2018 by FSM quintile
2019
Estimates from the survey indicate that, across the 3,428 secondary schools in England, around 270,500 pupils will be entered into the EBacc in 2019 (Table 2). Considering that,
61000
107000
151000
111000
91000
38,00046,000
72,000
51,000
28,000
0
20000
40000
60000
80000
100000
120000
140000
160000
Top quintile(lowest % of
FSM)
Quintile 2 Quintile 3 Quintile 4 BottomQuintile
(highest %of FSM)
Total pupils completing KS4
Total entered into EBaccsubjects
62%% entering EBacc in 2018 43% 48% 46% 31%
Question: A1/ A3: Of those completing Key Stage 4 in 2018/2019, what percentage do you plan to enter into the full range of subjects required for the EBacc?
Figures are volume calculations based on responses provided, rounded to the nearest 1,000. Base: 0-20% (n=34), 21-40% (n=60), 41-60% (n=79), 61-80% (n=62), 81-100% (n=64).
18
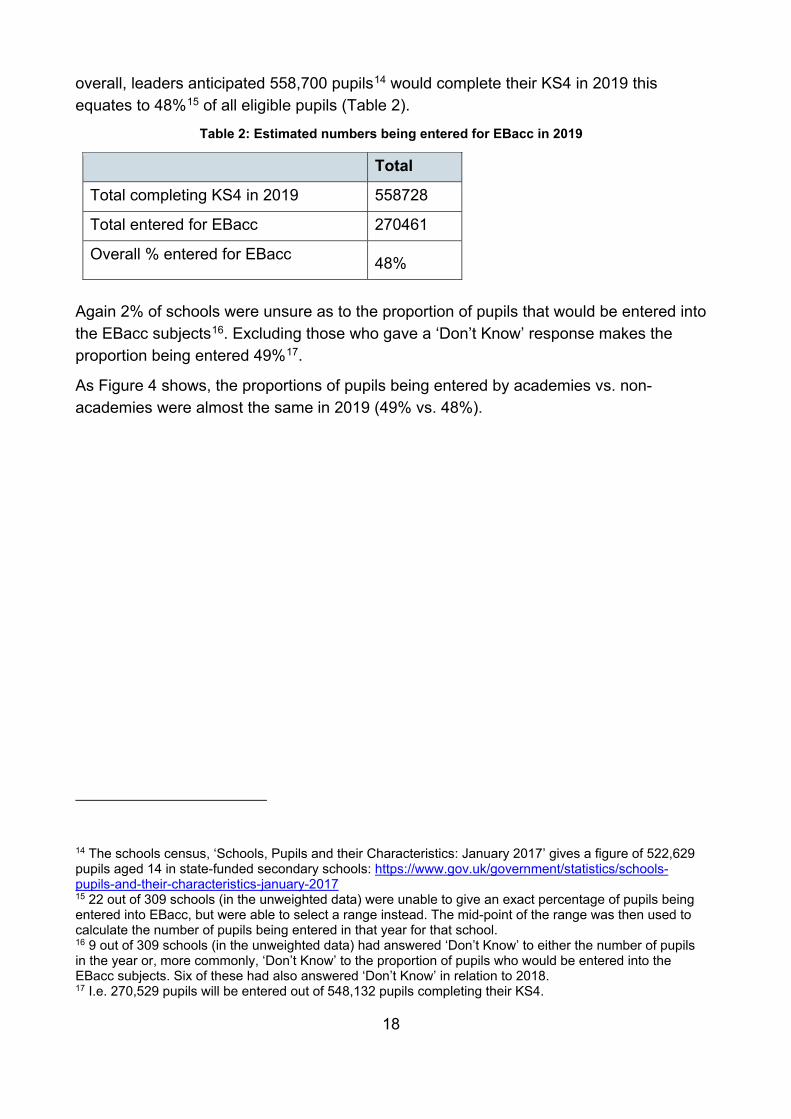
overall, leaders anticipated 558,700 pupils14 would complete their KS4 in 2019 this equates to 48%15 of all eligible pupils (Table 2).
Table 2: Estimated numbers being entered for EBacc in 2019
Total
Total completing KS4 in 2019 558728
Total entered for EBacc 270461
Overall % entered for EBacc 48% Again 2% of schools were unsure as to the proportion of pupils that would be entered into the EBacc subjects16. Excluding those who gave a ‘Don’t Know’ response makes the proportion being entered 49%17.
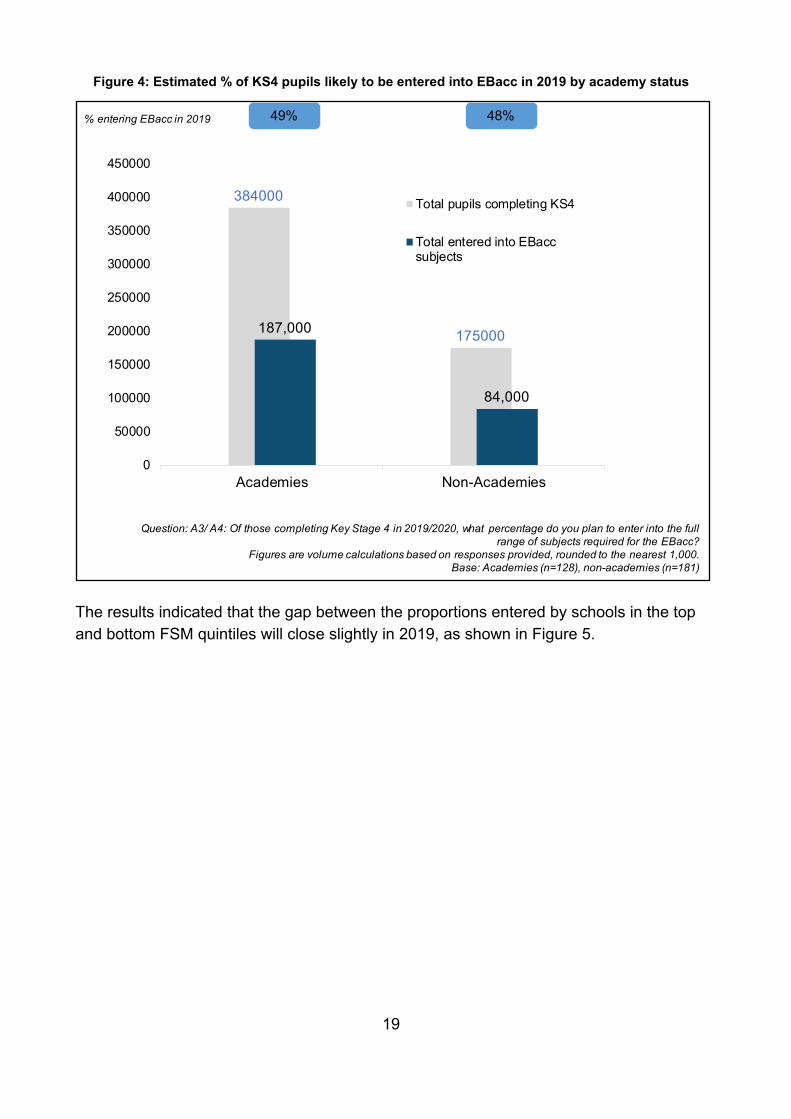
As Figure 4 shows, the proportions of pupils being entered by academies vs. non-academies were almost the same in 2019 (49% vs. 48%).
14 The schools census, ‘Schools, Pupils and their Characteristics: January 2017’ gives a figure of 522,629 pupils aged 14 in state-funded secondary schools: https://www.gov.uk/government/statistics/schools-pupils-and-their-characteristics-january-2017 15 22 out of 309 schools (in the unweighted data) were unable to give an exact percentage of pupils being entered into EBacc, but were able to select a range instead. The mid-point of the range was then used to calculate the number of pupils being entered in that year for that school. 16 9 out of 309 schools (in the unweighted data) had answered ‘Don’t Know’ to either the number of pupils in the year or, more commonly, ‘Don’t Know’ to the proportion of pupils who would be entered into the EBacc subjects. Six of these had also answered ‘Don’t Know’ in relation to 2018. 17 I.e. 270,529 pupils will be entered out of 548,132 pupils completing their KS4.
19
Figure 4: Estimated % of KS4 pupils likely to be entered into EBacc in 2019 by academy status
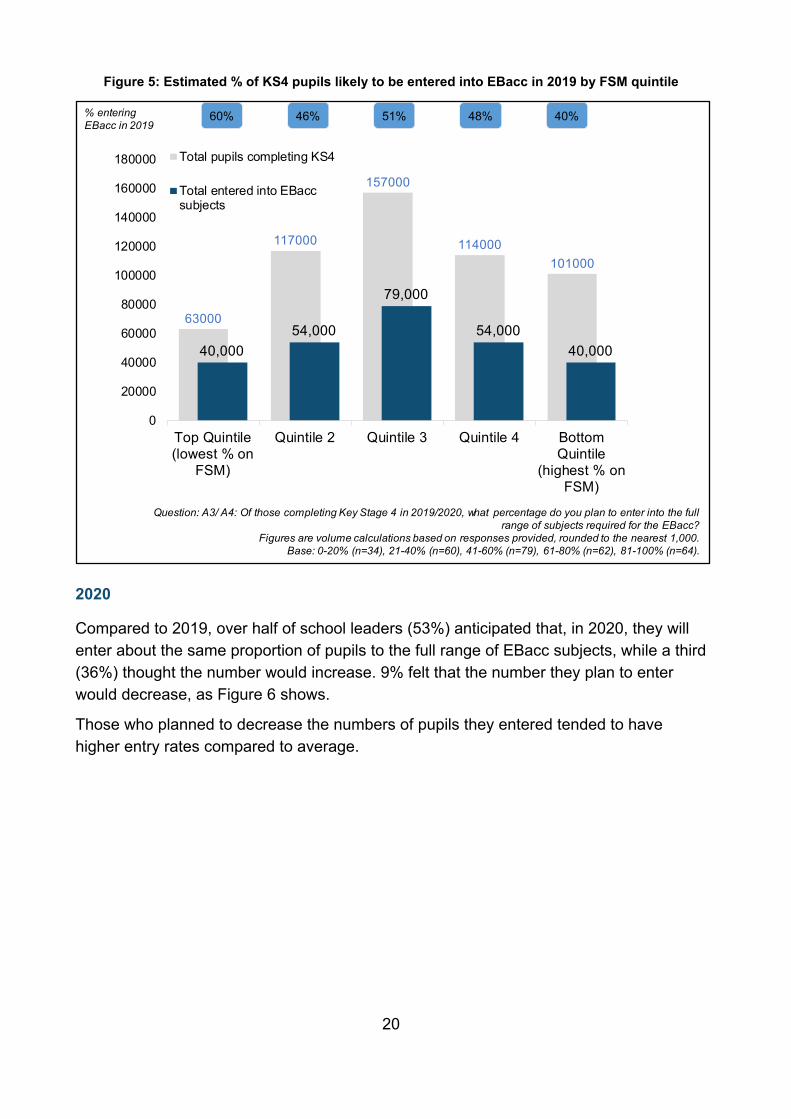
The results indicated that the gap between the proportions entered by schools in the top and bottom FSM quintiles will close slightly in 2019, as shown in Figure 5.
384000
175000187,000
84,000
0
50000
100000
150000
200000
250000
300000
350000
400000
450000
Academies Non-Academies
Total pupils completing KS4
Total entered into EBaccsubjects
49%% entering EBacc in 2019 48%
Question: A3/ A4: Of those completing Key Stage 4 in 2019/2020, what percentage do you plan to enter into the full range of subjects required for the EBacc?
Figures are volume calculations based on responses provided, rounded to the nearest 1,000. Base: Academies (n=128), non-academies (n=181)
20
Figure 5: Estimated % of KS4 pupils likely to be entered into EBacc in 2019 by FSM quintile
2020
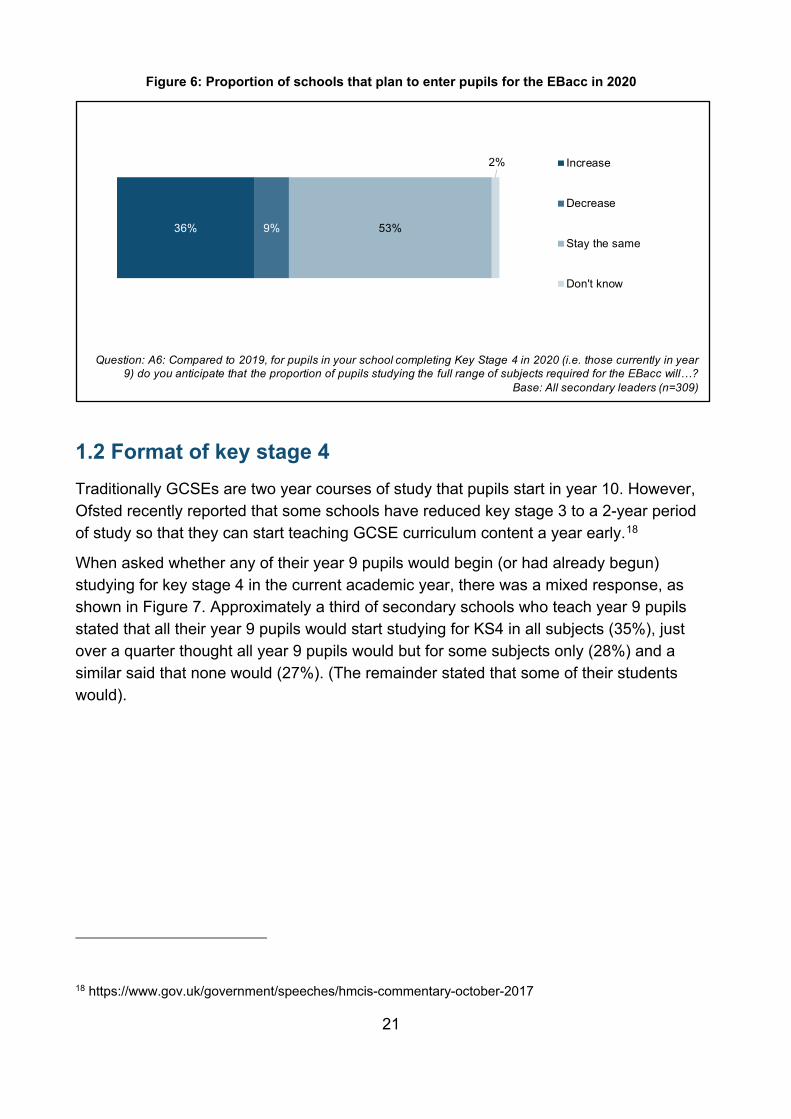
Compared to 2019, over half of school leaders (53%) anticipated that, in 2020, they will enter about the same proportion of pupils to the full range of EBacc subjects, while a third (36%) thought the number would increase. 9% felt that the number they plan to enter would decrease, as Figure 6 shows.
Those who planned to decrease the numbers of pupils they entered tended to have higher entry rates compared to average.
63000
117000
157000
114000101000
40,00054,000
79,000
54,00040,000
0
20000
40000
60000
80000
100000
120000
140000
160000
180000
Top Quintile(lowest % on
FSM)
Quintile 2 Quintile 3 Quintile 4 BottomQuintile
(highest % onFSM)
Total pupils completing KS4
Total entered into EBaccsubjects
60%% entering EBacc in 2019
46% 51% 48% 40%
Question: A3/ A4: Of those completing Key Stage 4 in 2019/2020, what percentage do you plan to enter into the full range of subjects required for the EBacc?
Figures are volume calculations based on responses provided, rounded to the nearest 1,000. Base: 0-20% (n=34), 21-40% (n=60), 41-60% (n=79), 61-80% (n=62), 81-100% (n=64).
21
Figure 6: Proportion of schools that plan to enter pupils for the EBacc in 2020
1.2 Format of key stage 4 Traditionally GCSEs are two year courses of study that pupils start in year 10. However, Ofsted recently reported that some schools have reduced key stage 3 to a 2-year period of study so that they can start teaching GCSE curriculum content a year early.18
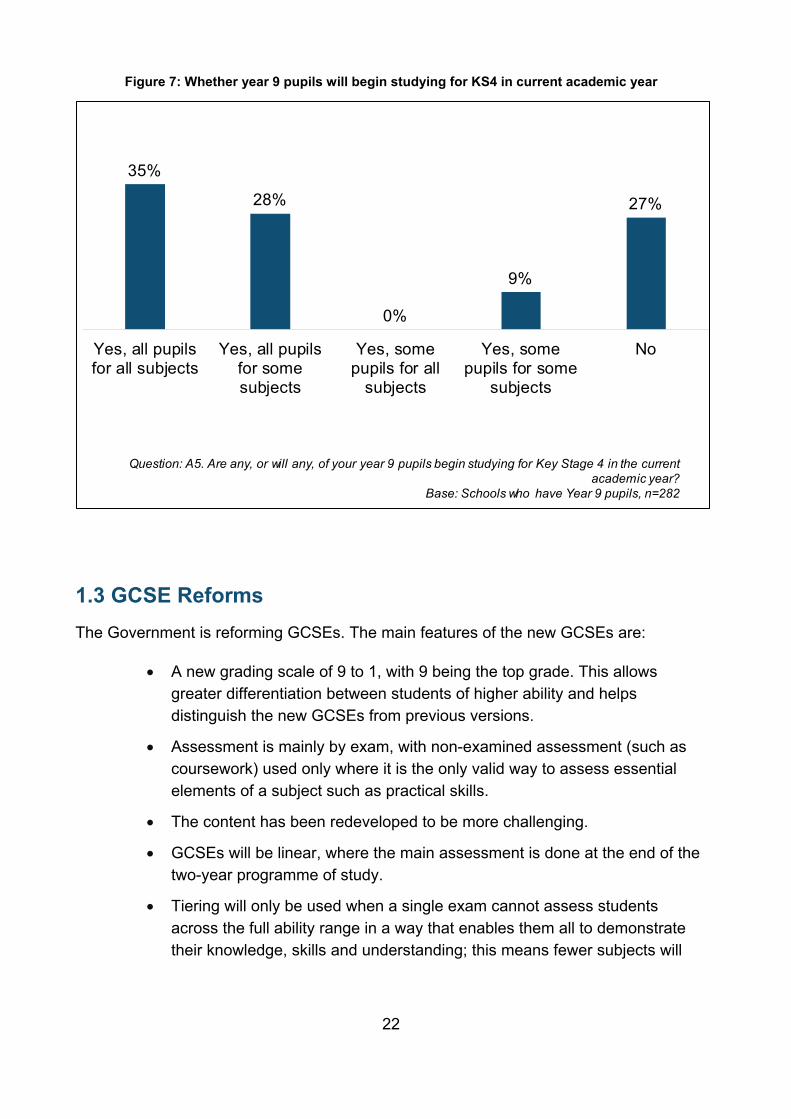
When asked whether any of their year 9 pupils would begin (or had already begun) studying for key stage 4 in the current academic year, there was a mixed response, as shown in Figure 7. Approximately a third of secondary schools who teach year 9 pupils stated that all their year 9 pupils would start studying for KS4 in all subjects (35%), just over a quarter thought all year 9 pupils would but for some subjects only (28%) and a similar said that none would (27%). (The remainder stated that some of their students would).
18 https://www.gov.uk/government/speeches/hmcis-commentary-october-2017
36% 9% 53%
2% Increase
Decrease
Stay the same
Don't know
Question: A6: Compared to 2019, for pupils in your school completing Key Stage 4 in 2020 (i.e. those currently in year 9) do you anticipate that the proportion of pupils studying the full range of subjects required for the EBacc will…?
Base: All secondary leaders (n=309)
22
Figure 7: Whether year 9 pupils will begin studying for KS4 in current academic year
1.3 GCSE Reforms The Government is reforming GCSEs. The main features of the new GCSEs are:
• A new grading scale of 9 to 1, with 9 being the top grade. This allows greater differentiation between students of higher ability and helps distinguish the new GCSEs from previous versions.
• Assessment is mainly by exam, with non-examined assessment (such as coursework) used only where it is the only valid way to assess essential elements of a subject such as practical skills.
• The content has been redeveloped to be more challenging.
• GCSEs will be linear, where the main assessment is done at the end of the two-year programme of study.
• Tiering will only be used when a single exam cannot assess students across the full ability range in a way that enables them all to demonstrate their knowledge, skills and understanding; this means fewer subjects will
35%
28%
0%
9%
27%
Yes, all pupilsfor all subjects
Yes, all pupilsfor somesubjects
Yes, somepupils for all
subjects
Yes, somepupils for some
subjects
No
Question: A5. Are any, or will any, of your year 9 pupils begin studying for Key Stage 4 in the current academic year?
Base: Schools who have Year 9 pupils, n=282
23
now use tiering. Foundation and higher tiers are permitted only in maths, statistics, science and modern foreign languages.
The new GCSEs are being introduced in four waves. The third wave of GCSE qualifications were introduced for first teaching in September 2017. These are as follows: Ancient History, Arabic, Astronomy, Bengali, Business, Chinese, Classical Civilisation, Design and Technology, Economics, Electronics, Engineering, Film Studies, Geology, Italian, Japanese, Media Studies, modern Greek, modern Hebrew, Panjabi, Polish, Psychology, Russian, Sociology, Statistics and Urdu.
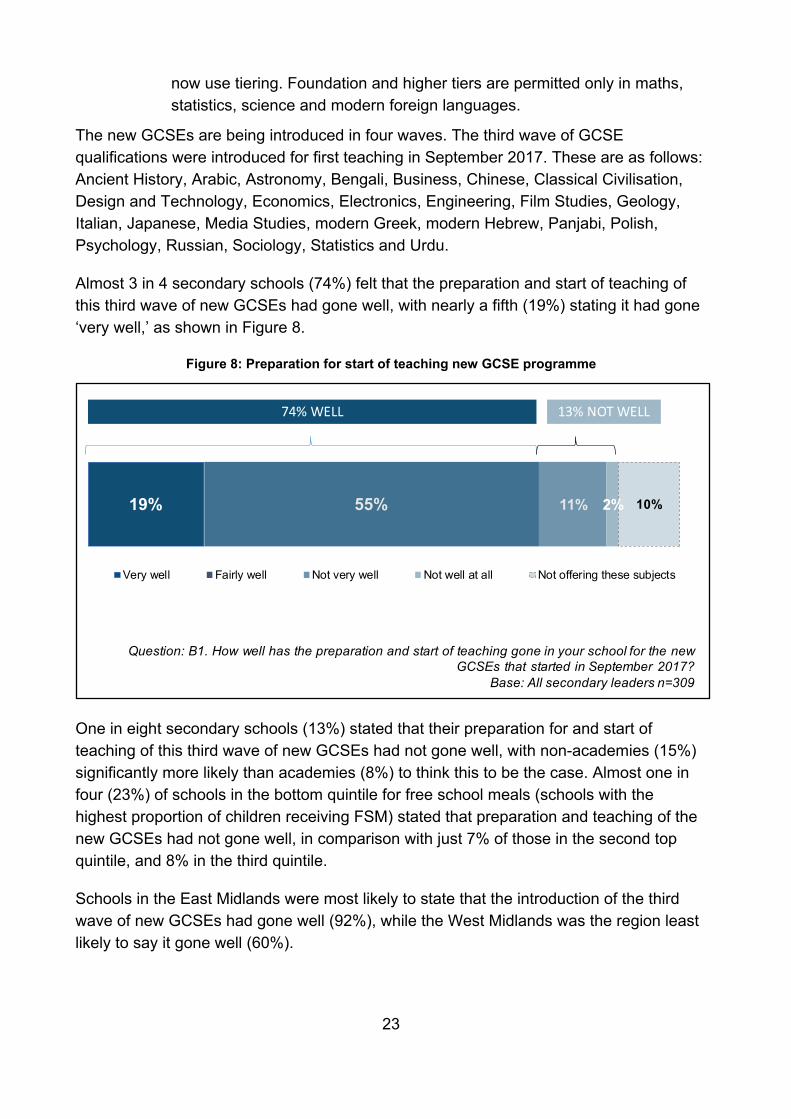
Almost 3 in 4 secondary schools (74%) felt that the preparation and start of teaching of this third wave of new GCSEs had gone well, with nearly a fifth (19%) stating it had gone ‘very well,’ as shown in Figure 8.
Figure 8: Preparation for start of teaching new GCSE programme
One in eight secondary schools (13%) stated that their preparation for and start of teaching of this third wave of new GCSEs had not gone well, with non-academies (15%) significantly more likely than academies (8%) to think this to be the case. Almost one in four (23%) of schools in the bottom quintile for free school meals (schools with the highest proportion of children receiving FSM) stated that preparation and teaching of the new GCSEs had not gone well, in comparison with just 7% of those in the second top quintile, and 8% in the third quintile.
Schools in the East Midlands were most likely to state that the introduction of the third wave of new GCSEs had gone well (92%), while the West Midlands was the region least likely to say it gone well (60%).
19% 55% 11% 2% 10%
Very well Fairly well Not very well Not well at all Not offering these subjects
74% WELL
Question: B1. How well has the preparation and start of teaching gone in your school for the new GCSEs that started in September 2017?
Base: All secondary leaders n=309
13% NOT WELL
24
In the Summer 2017 Teacher Voice survey 72% of teachers felt that their school was very (11%) or fairly (61%) confident to teach the third wave of new GCSEs from September 2017. Almost a fifth (18%) were not confident. Broadly the same proportion as those who were confident six months prior felt that the early stages of delivery has gone well.
In the November 2016 Teacher Voice survey, 89% of leaders felt that preparation for and the start of teaching the second wave of new GCSEs had gone well19; significantly higher than the 74% who felt it had gone well for the third wave of GCSEs. The subjects being introduced in the third wave are less commonly taught than those introduced in the second wave so the option, ‘not offering these subjects,’ was included for the first time in the Winter 2017 School Snapshot survey. If those not offering any of these subjects are excluded from the analysis then the proportion stating that the introduction of the third wave of GCSEs had gone well was 82% - more in line with the figures from 2016.
1.4 Systematic Synthetic Phonics Systematic synthetic phonics is the method of teaching the sounds of the alphabet and how to blend these sounds into words. Systematic synthetic phonics enables teachers to map incremental progression in pupils’ phonic knowledge and skills, track children's progress and identify difficulties, so that appropriate support can be provided.
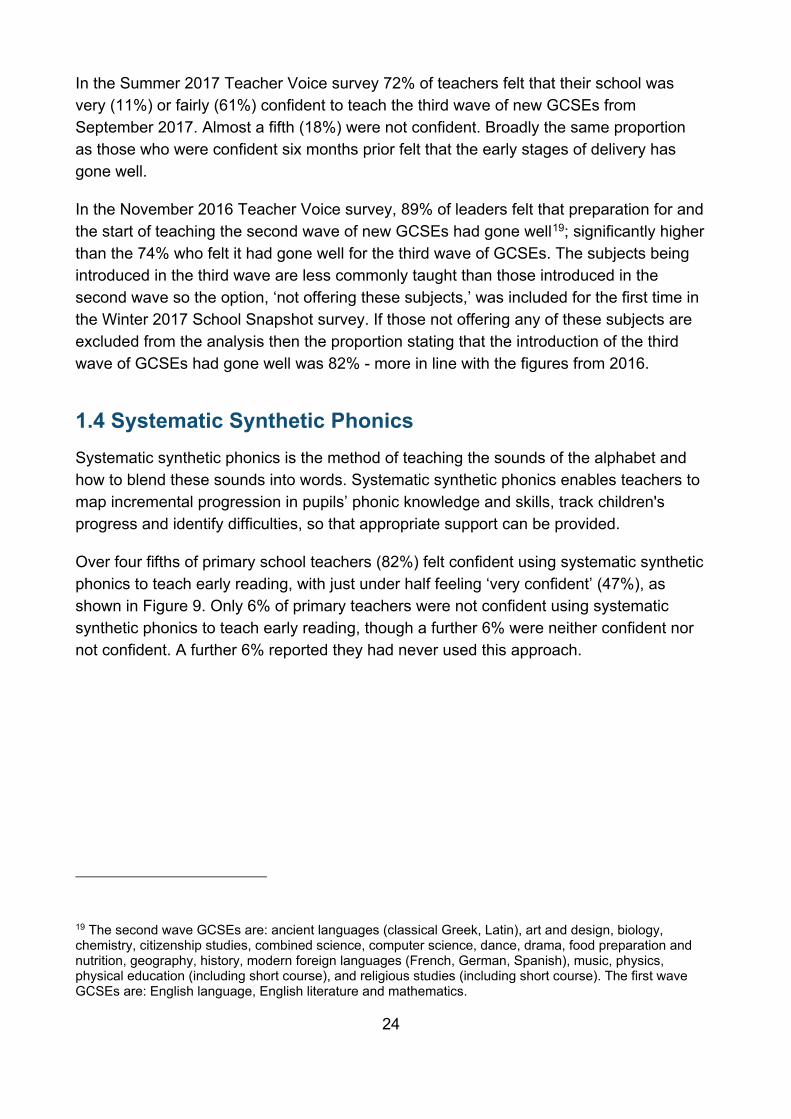
Over four fifths of primary school teachers (82%) felt confident using systematic synthetic phonics to teach early reading, with just under half feeling ‘very confident’ (47%), as shown in Figure 9. Only 6% of primary teachers were not confident using systematic synthetic phonics to teach early reading, though a further 6% were neither confident nor not confident. A further 6% reported they had never used this approach.
19 The second wave GCSEs are: ancient languages (classical Greek, Latin), art and design, biology, chemistry, citizenship studies, combined science, computer science, dance, drama, food preparation and nutrition, geography, history, modern foreign languages (French, German, Spanish), music, physics, physical education (including short course), and religious studies (including short course). The first wave GCSEs are: English language, English literature and mathematics.
25
Figure 9: Confidence using systematic synthetic phonics to teach early reading (all primary teachers)
More experienced teachers were significantly more likely to be ‘very confident’ using systematic synthetic phonics system. Over half of those had taught for over ten years were ‘very confident’ (54%) compared to around a third (32%) of those who had taught for less than four years. Similarly, those in the QTS upper pay range were more likely to be ‘very confident’ than those in the QTS lower pay range (51% compared to 41%).
Female primary teachers were also more likely to be confident using systematic synthetic phonics than male primary teachers (85% vs 66% respectively).
1.5 Curriculum implementation The Department for Education funds a range of national support programmes, including the following.
• The Maths Hubs programme, which brings together mathematics education professionals in a collaborative national network of 35 hubs, each locally led by a lead school or college, to develop and spread excellent practice, for the benefit of all pupils and students.20
• Music Education Hubs, which are groups of organisations such as local authorities, schools, art organisations, community or voluntary
20 http://www.mathshubs.org.uk/
6%1%
5% 6% 35% 47%
Never used Not at all confident Not very confident Neither nor Fairly confident Very confident
22Question C1: How confident do you feel to use systematic synthetic phonics to teach early reading?
Base: All primary teachers n=579
82% CONFIDENT
6% NOT CONFIDENT
26
organisations. They work together to create joined-up music education provision, respond to local need and fulfil the objectives of the hub.21
• Science Learning Partnerships (SLPs), which combine local expertise in teaching and learning in science, facilitating CPD, and providing school-to-school support. They are led by local teaching school alliances, schools and colleges with excellence in science, higher education institutions, and other local partners with cutting-edge expertise in science.22
• The Network of Excellence (NoE), which was managed by the British Computer Society (BCS). It was first established in 2012 to enable teachers in England to become confident, effective and enthusiastic teachers of computing, and to develop and articulate a vision for the subject of computing at the national level. The NoE programme closed in March 2018.23
• The Lessons From Auschwitz Project which is run by the Holocaust Educational Trust and aims to increase knowledge and understanding of the Holocaust for A Level students and to clearly highlight what can happen if prejudice and racism become acceptable. It is run with secondary schools only. 24
Awareness of school participation in DfE funded national programmes was generally higher among leaders than teachers. Many teachers were unsure if their school had participated in the programmes; at least 40% did not know if they had done so when each programme was mentioned. Leaders were more likely to be certain - a maximum of 9% indicating they were unsure about participation in any particular programme.
Leaders and teachers were most likely to say they had participated in Maths Hubs (54% of leaders and 39% of teachers). This was followed by the Music Education Hub programme (29% of leaders and 15% of teachers) and Science Learning Partnerships (22% of leaders and 17% of teachers). Few reported that their school had engaged with the computer science-focused Network of Excellence during the past year (7% of leaders and 5% of teachers).
42% of leaders and 17% of teachers in secondary schools indicated their school had participated in the Lessons from Auschwitz programme.
21 http://www.artscouncil.org.uk/music-education/music-education-hubs 22 https://www.stem.org.uk/science-learning-partnerships 23 http://www.computingatschool.org.uk/custom_pages/35-noe 24 https://www.het.org.uk/lessons-from-auschwitz-programme
27
Figure 10: Participation in national support programmes in last 12 months (all leaders and teachers except where specified)
Primary school leaders and teachers were more than twice as likely to report their school was involved in Maths and / or Music Hubs than secondary school leaders and teachers were (58% of primary leaders and teachers reported involvement in Maths Hubs compared to 21% of secondary; while 23% of primary leaders and teachers reported involvement in Music Hubs compared to 10% of secondary). This could be due to more awareness of whole school activities in primary settings.
Leaders and teachers in schools in the top quintile in terms of FSM (with fewest students on FSM) were more likely than average to report that their schools had participated in the Maths and / or Music hub programmes (47% compared to 41% overall and 23% compared to 17% overall respectively). However, those working in schools with the highest proportion of FSM (the bottom quintile) were more likely than average to report their school had participated in the Science Learning Partnership (22% compared to 17% overall).
There was some variance of awareness by region, with those working in Yorkshire and Humber more likely than average to report participation in the Maths and / or Music hub programmes (50% and 23% respectively compared to 41% and 17% overall). Leaders and teachers in the North East were more likely than average to report school involvement in the Science Learning Partnerships and / or Network of Excellence (32%
54%39%
29%15%
22%17%
7%5%
42%17%
43%22%
68%39%
73%34%
89%46%
49%27%
3%40%
3%46%
5%49%
4%50%
9%56%
Maths Hubs
Music Education Hubs
Science LearningPartnerships
Network of Excellence
Lessons from Auschwitz
Yes No Don't know
(Secondary schools only)
Question D1: In the last twelve months, has your school participated in, or accessed support from, any of the following nationalsupport programmes funded by the DfE?
Base: All leaders, n=800, all teachers, n=909; (for Lessons from Auschwitz) secondary leaders n=309, all secondary teachers n=639
LT
LT
LT
LT
L LeadersT Teachers
LT
28
and 11% respectively compared to 17% and 5% overall). Those based in the East Midlands were also more likely than average to note their school had participated in the Science Learning Partnerships programme during the last year (25% compared to 17% overall).
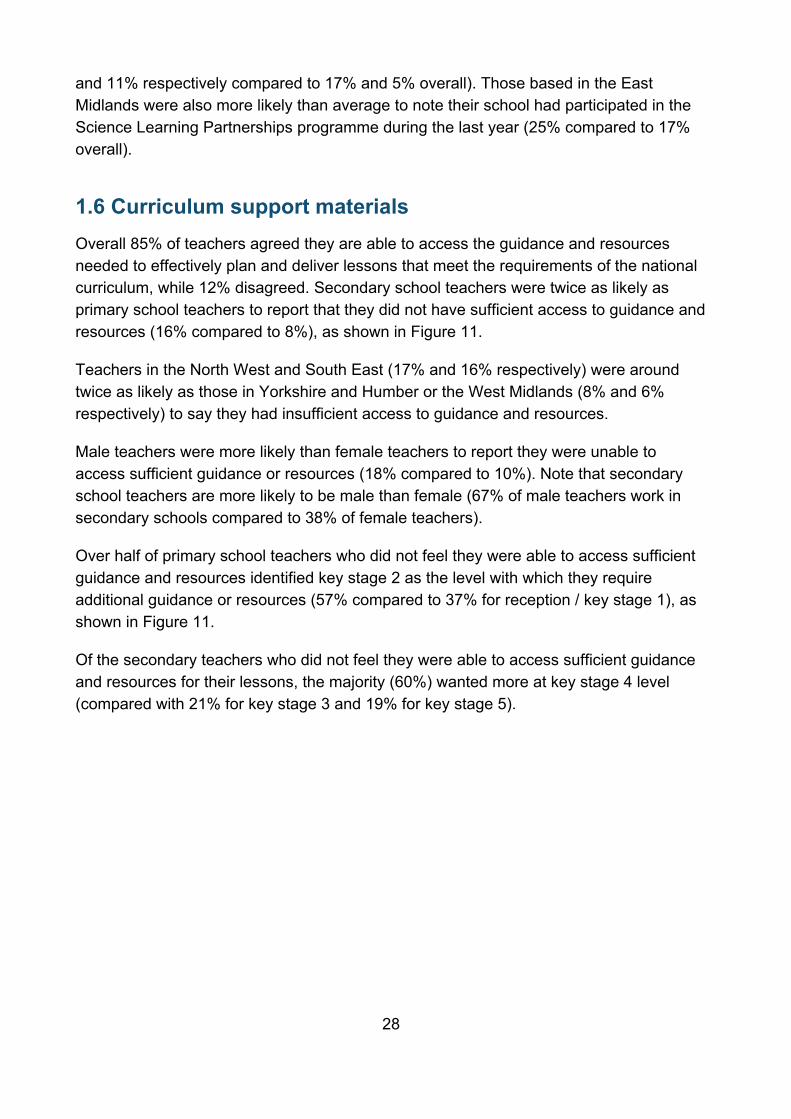
1.6 Curriculum support materials Overall 85% of teachers agreed they are able to access the guidance and resources needed to effectively plan and deliver lessons that meet the requirements of the national curriculum, while 12% disagreed. Secondary school teachers were twice as likely as primary school teachers to report that they did not have sufficient access to guidance and resources (16% compared to 8%), as shown in Figure 11.
Teachers in the North West and South East (17% and 16% respectively) were around twice as likely as those in Yorkshire and Humber or the West Midlands (8% and 6% respectively) to say they had insufficient access to guidance and resources.
Male teachers were more likely than female teachers to report they were unable to access sufficient guidance or resources (18% compared to 10%). Note that secondary school teachers are more likely to be male than female (67% of male teachers work in secondary schools compared to 38% of female teachers).
Over half of primary school teachers who did not feel they were able to access sufficient guidance and resources identified key stage 2 as the level with which they require additional guidance or resources (57% compared to 37% for reception / key stage 1), as shown in Figure 11.
Of the secondary teachers who did not feel they were able to access sufficient guidance and resources for their lessons, the majority (60%) wanted more at key stage 4 level (compared with 21% for key stage 3 and 19% for key stage 5).
29
Figure 11: Level at which teachers who felt they have insufficient access to guidance and resources would most like additional resources and guidance (all primary and secondary teachers / those who
feel unable to access sufficient guidance)
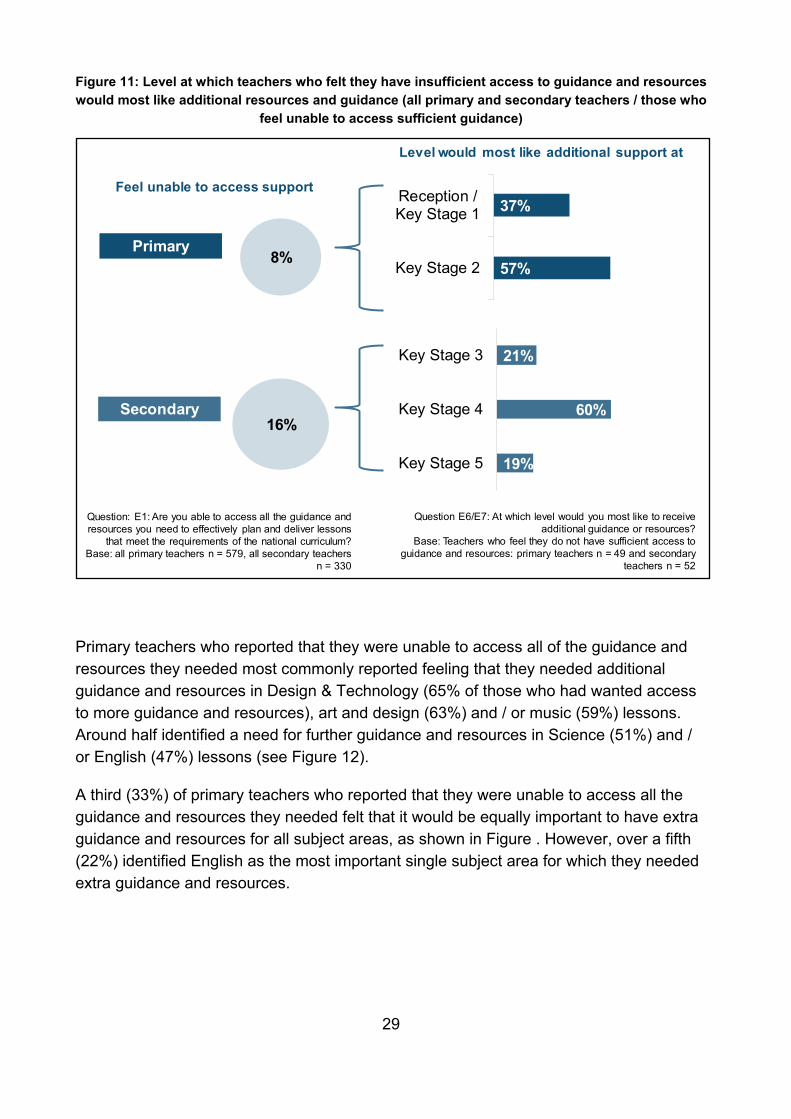
Primary teachers who reported that they were unable to access all of the guidance and resources they needed most commonly reported feeling that they needed additional guidance and resources in Design & Technology (65% of those who had wanted access to more guidance and resources), art and design (63%) and / or music (59%) lessons. Around half identified a need for further guidance and resources in Science (51%) and / or English (47%) lessons (see Figure 12).
A third (33%) of primary teachers who reported that they were unable to access all the guidance and resources they needed felt that it would be equally important to have extra guidance and resources for all subject areas, as shown in Figure . However, over a fifth (22%) identified English as the most important single subject area for which they needed extra guidance and resources.
24
Question E6/E7: At which level would you most like to receive additional guidance or resources?
Base: Teachers who feel they do not have sufficient access to guidance and resources: primary teachers n = 49 and secondary
teachers n = 52
81%
16%
21%
60%
19%
Key Stage 3
Key Stage 4
Key Stage 5
37%
57%
Reception /Key Stage 1
Key Stage 2
Question: E1: Are you able to access all the guidance and resources you need to effectively plan and deliver lessons
that meet the requirements of the national curriculum?Base: all primary teachers n = 579, all secondary teachers
n = 330
8%
Feel unable to access support
Primary
16%Secondary
Level would most like additional support at
30
Figure 12: Subjects in which primary teachers feel they have insufficient access to guidance and resources (primary teachers who feel do not have sufficient access)
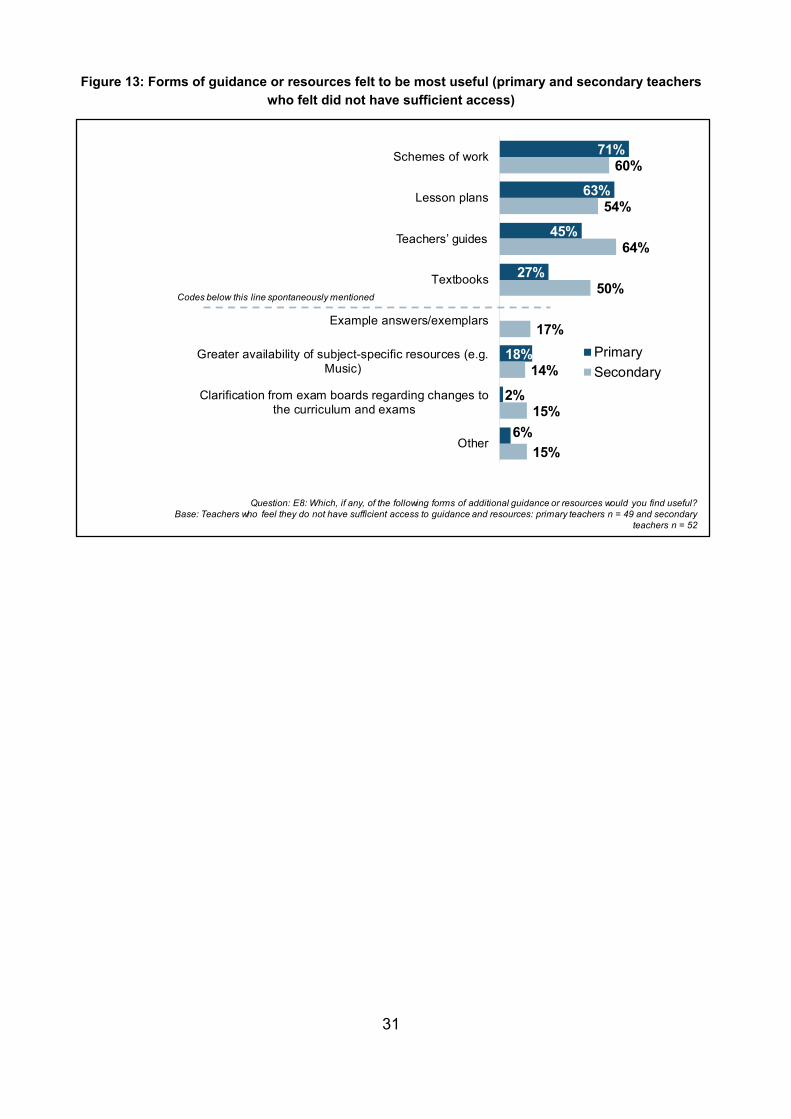
Both primary and secondary teachers who said that they needed additional guidance and resources were asked whether they would find a range of types of resources and guidance useful. Primary teachers were most likely to say that schemes of work would be useful (71%); they were also frequently mentioned by secondary teachers (60%), as shown in Figure 13. Teachers guides were more likely to be considered useful by secondary teachers who wanted additional guidance or resources (63%). Lesson plans were also identified as useful by over half of those who reported they would like additional resources and guidance (63% of primary teachers and 54% of secondary teachers).
65%
63%
59%
51%
47%
37%
37%
37%
18%
Design & Technology
Art and design
Music
Science
English
Maths
History
Geography
Computer Science
Question E2: In which of the following subject areas do you feel you need more additional guidance and resources? Codes <15% notdisplayed / E3: Which one do you feel would be the most important for you to get this extra guidance and resources?
Base: Primary teachers who feel do not have sufficient access to guidance and resources n = 49
Most important
2%
22%
12%
10%
14%
33% All equally important
4% Other subject
Codes below this line spontaneously mentioned
31
Figure 13: Forms of guidance or resources felt to be most useful (primary and secondary teachers who felt did not have sufficient access)
26
Question: E8: Which, if any, of the following forms of additional guidance or resources would you find useful? Base: Teachers who feel they do not have sufficient access to guidance and resources: primary teachers n = 49 and secondary
teachers n = 52
71%
63%
45%
27%
18%
2%
6%
60%
54%
64%
50%
17%
14%
15%
15%
Schemes of work
Lesson plans
Teachers’ guides
Textbooks
Example answers/exemplars
Greater availability of subject-specific resources (e.g.Music)
Clarification from exam boards regarding changes tothe curriculum and exams
Other
PrimarySecondary
Codes below this line spontaneously mentioned
32
2. Counter extremism This chapter will explore schools’ and teachers’ perspectives on a range of areas relating to counter extremism, including the Prevent duty and the ‘Educate Against Hate’ website.
2.1 Prevent duty Since 1 July 2015 all schools have been subject to a duty under section 26 of the Counter-Terrorism and Security Act 2015, in the exercise of their functions, to have “due regard to the need to prevent people from being drawn into terrorism”. This duty is known as the Prevent duty.25
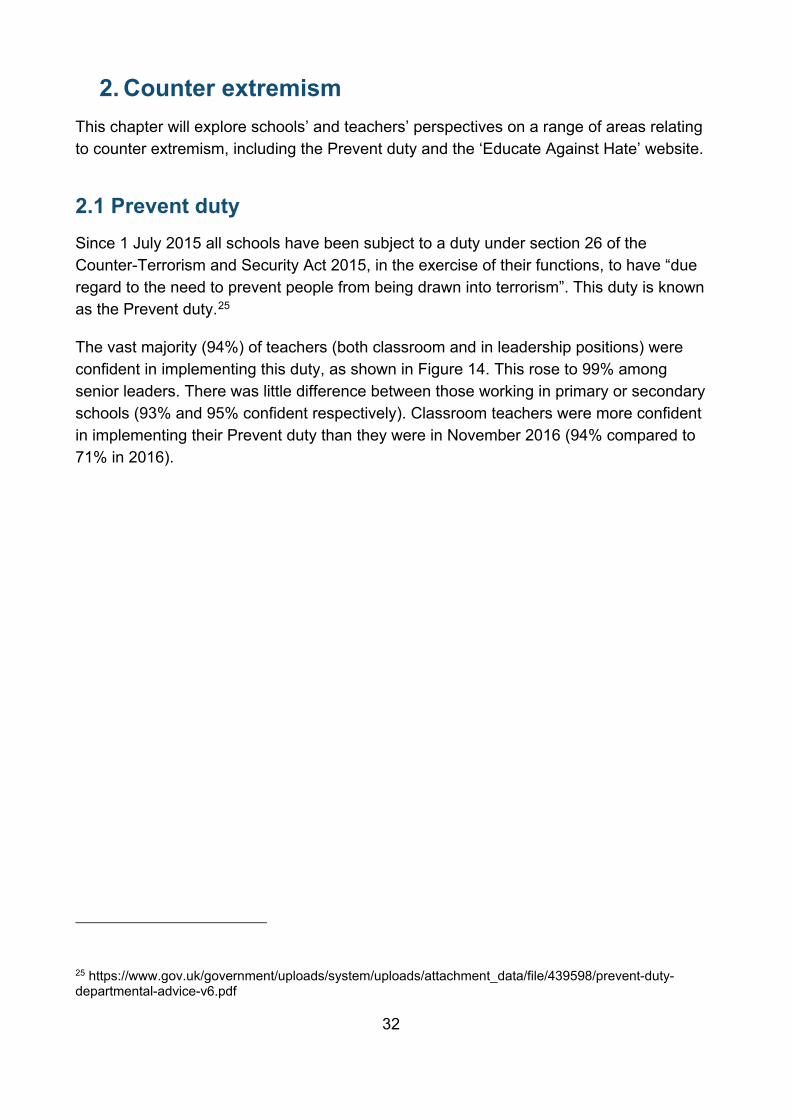
The vast majority (94%) of teachers (both classroom and in leadership positions) were confident in implementing this duty, as shown in Figure 14. This rose to 99% among senior leaders. There was little difference between those working in primary or secondary schools (93% and 95% confident respectively). Classroom teachers were more confident in implementing their Prevent duty than they were in November 2016 (94% compared to 71% in 2016).
25 https://www.gov.uk/government/uploads/system/uploads/attachment_data/file/439598/prevent-duty-departmental-advice-v6.pdf
33
Figure 14: Confidence in implementing Prevent duty and confidence that school teaching respect and tolerance (all leaders and teachers)
The difference in confidence levels between leaders and teachers is more marked when the proportion who were ‘very confident’ in implementing Prevent duty are compared: three fifths (62%) of senior leaders were ‘very confident’ compared to two fifths (42%) of teachers.
Being ‘very confident’ in implementing the Prevent duty also increased with both the length of time in teaching (47% of those who had taught for four years or longer compared to 32% of those who had taught for a shorter time) and the age of leaders and teachers (55% of those aged 45 or above compared to 42% of younger teachers).
Overall nearly all leaders and teachers (98%) were confident that their school effectively teaches the values of respect and tolerance of those from different backgrounds, as shown in Figure . There was little difference in confidence between primary leaders and
1%
1%
1%
1%
4%
1%
5%
1%
2%
49%
36%
51%
23%
17%
24%
45%
62%
42%
75%
83%
74%
ImplementingPrevent duty
Teaching respectand tolerance
Not at all confident Not very confident Neither nor Fairly confident Very confident
27Question: G1: how confident are you in implementing the duty on schools to, ‘have regard to the need to’ prevent children and young
people from being drawn into terrorism. / G2: How confident are you that your school effectively teaches the values of respect and tolerance of those from different backgrounds. Base: All teachers and leaders (1709)
94% CONFIDENT
98% CONFIDENT
L Senior leadersT Teachers
L
T
L
T
Total
Total
34
teachers, and secondary senior leaders and teachers in overall confidence (98% and 97% respectively).
This is a significant increase in confidence from November 2016, where 93% felt confident overall.
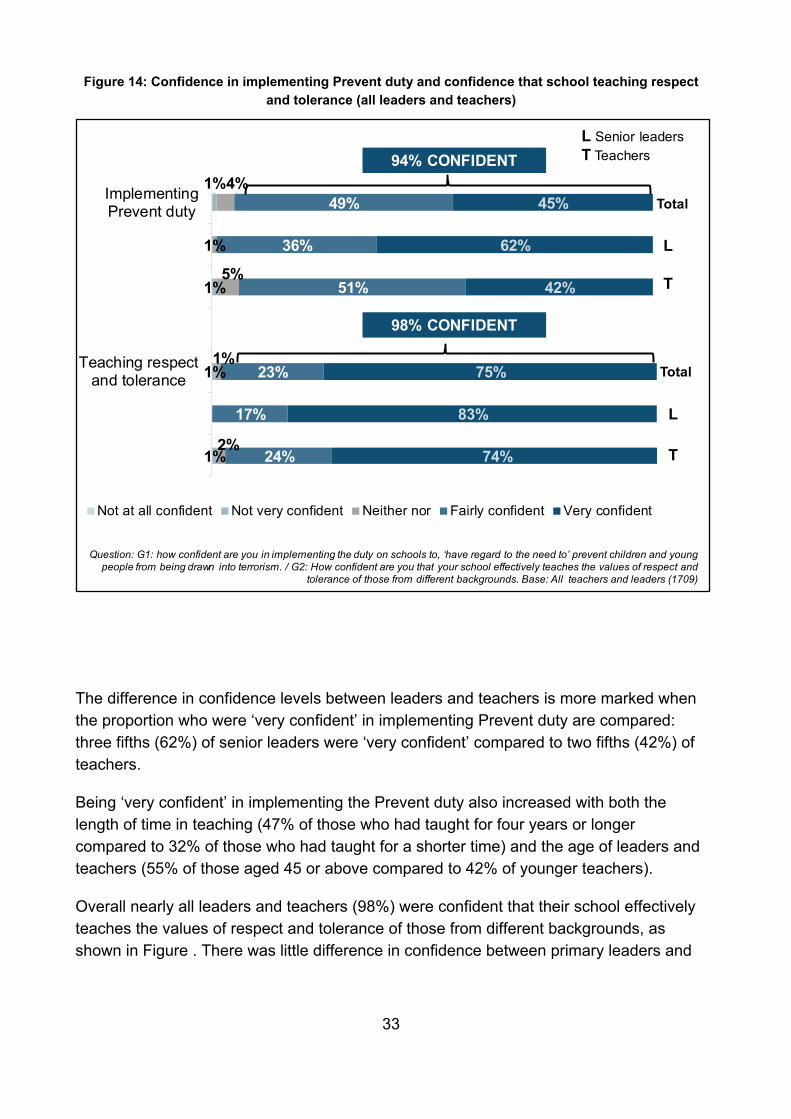
2.2 Educate Against Hate In 2016, the Department launched the ‘Educate Against Hate’ website, which aims to provide practical advice, support and resources to protect children from extremism and radicalisation.
Two fifths (40%) of leaders and teachers were aware of the ‘Educate Against Hate’ website, as shown in Figure 15. Awareness was higher among leaders (58%) compared to classroom teachers (37%). Awareness levels were very similar for those working in primary and secondary schools (41% and 37% respectively).
Figure 15: Awareness and usage of ‘Educate Against Hate’ website (all leaders and teachers)
Question: G3. Have you heard of the Government website ‘Educate Against Hate’? / G4. How many times have you visited the website?
Base: All teachers and leaders (1709)
Not aware, 54%
Unsure if aware, 6%
Visited once, 14%
Visited more than once,
12%
Never visited, 12%
Unsure, 1%
Aware of website,
40%
26% VISITED
WEBSITE
35
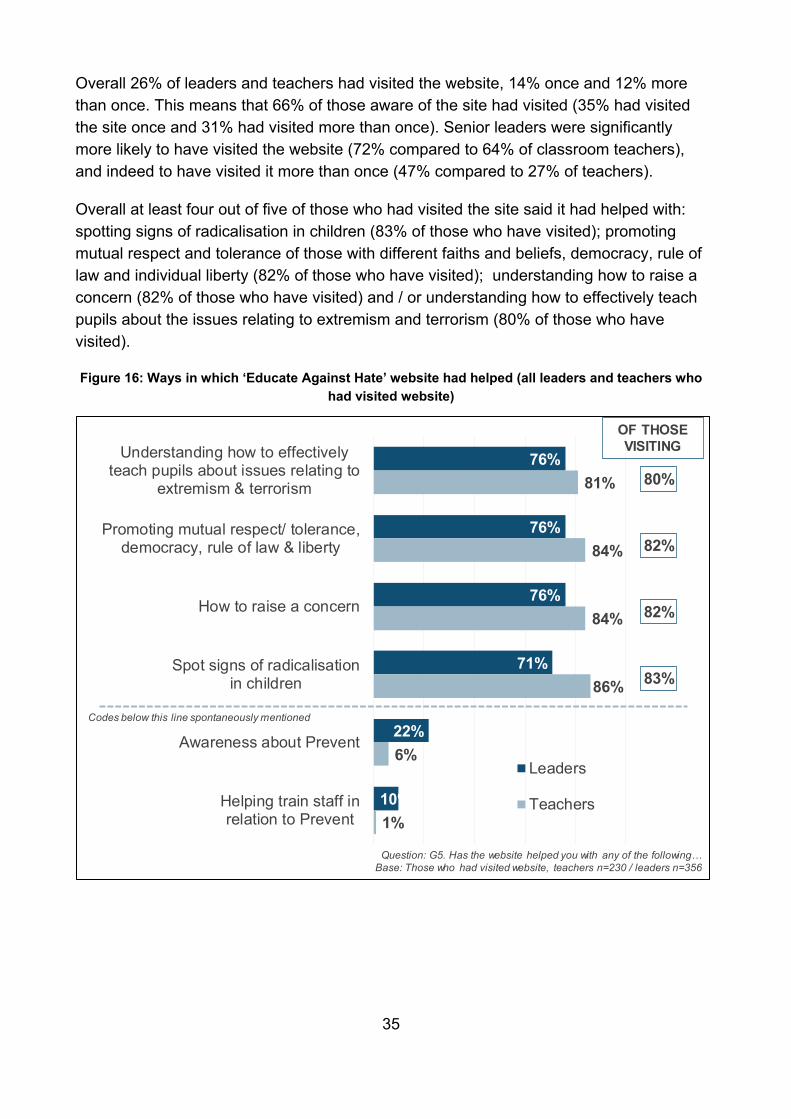
Overall 26% of leaders and teachers had visited the website, 14% once and 12% more than once. This means that 66% of those aware of the site had visited (35% had visited the site once and 31% had visited more than once). Senior leaders were significantly more likely to have visited the website (72% compared to 64% of classroom teachers), and indeed to have visited it more than once (47% compared to 27% of teachers).
Overall at least four out of five of those who had visited the site said it had helped with: spotting signs of radicalisation in children (83% of those who have visited); promoting mutual respect and tolerance of those with different faiths and beliefs, democracy, rule of law and individual liberty (82% of those who have visited); understanding how to raise a concern (82% of those who have visited) and / or understanding how to effectively teach pupils about the issues relating to extremism and terrorism (80% of those who have visited).
Figure 16: Ways in which ‘Educate Against Hate’ website had helped (all leaders and teachers who had visited website)
Question: G5. Has the website helped you with any of the following…Base: Those who had visited website, teachers n=230 / leaders n=356
76%
76%
76%
71%
22%
10%
81%
84%
84%
86%
6%
1%
Understanding how to effectivelyteach pupils about issues relating to
extremism & terrorism
Promoting mutual respect/ tolerance,democracy, rule of law & liberty
How to raise a concern
Spot signs of radicalisationin children
Awareness about Prevent
Helping train staff inrelation to Prevent
Leaders
Teachers
Codes below this line spontaneously mentioned
80%
82%
83%
82%
OF THOSE VISITING
36
Senior leaders who had visited the site were most likely to find it helpful in understanding how to effectively teach pupils about the issues relating to extremism and terrorism, promoting mutual respect and tolerance, and in understanding how to raise a concern (76% of leaders who visited the website), while classroom teachers who had visited the site were most likely to find it helpful with understanding how to spot signs of radicalisation in children (86% of teachers who visited the website), promoting mutual respect and tolerance (84%), and understanding how to raise a concern (84%).
Primary teachers who visited the website were more likely than secondary teachers to find it helpful in understanding how to raise a concern (89% compared to 78% of secondary teachers) and in helping to spot the signs of radicalisation in children (90% compared to 81% of secondary teachers who had visited).
37
3. Mental Health, SEND and Pupil Premium
3.1 Mental Health In recent years the Government has made significant steps to improve mental health support in schools. The Government’s December 2017 green paper (Transforming Children and Young People’s Mental Health Provision26) outlined proposals to improve mental health support, including a commitment to incentivising every school and college to identify a Designated Senior Lead for Mental Health to oversee the approach to mental health and wellbeing and introduce mental health support teams and reduce waiting list times.
Seven in 10 of all state funded schools eligible for the survey27 reported having a designated lead for pupils’ mental health. This figure varied significantly between primary (67%) and secondary schools (83%), as well as between academy schools (77%) and non-academy schools (66%).
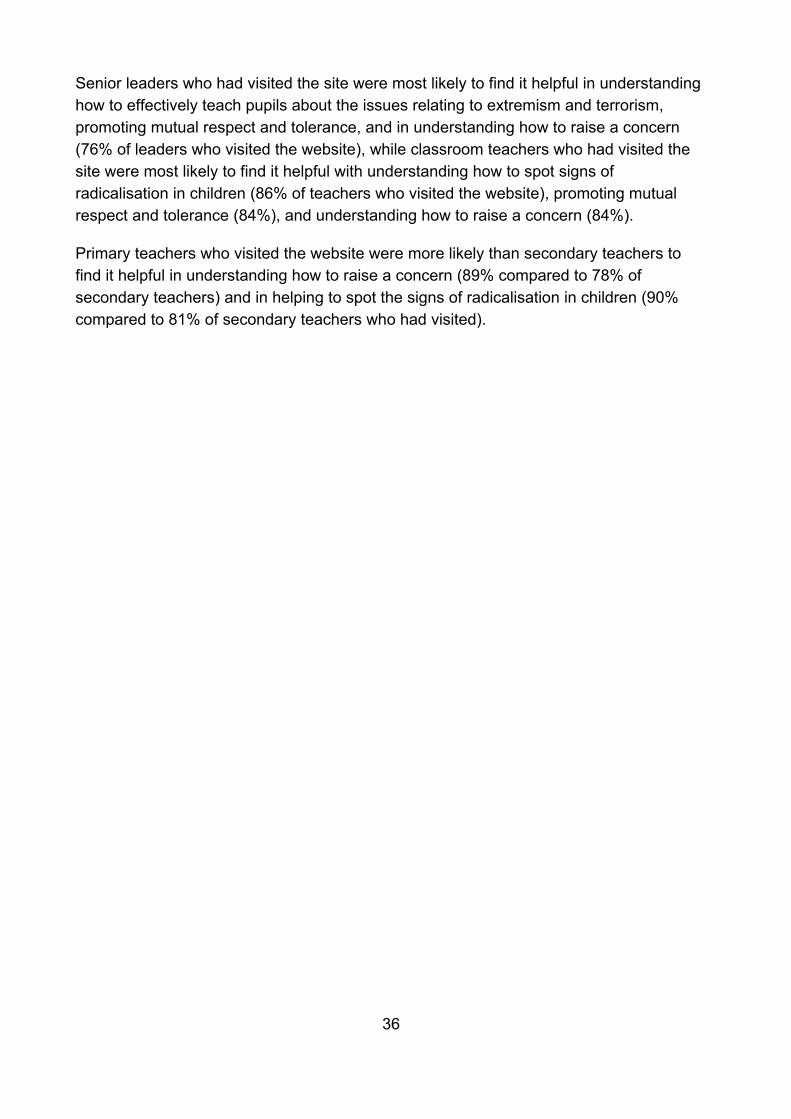
As Figure 7 shows, among the schools that did have a mental health lead, the most common activity performed by this role was liaising with external mental health services (97%), followed by identifying and/or assessing pupils’ needs (94%), and coordinating mental health provision within the school (92%). Monitoring and supporting staff wellbeing was least likely to be undertaken, although three in four schools (75%) stated that this was carried out by the mental health lead.
26 https://www.gov.uk/government/consultations/transforming-children-and-young-peoples-mental-health-provision-a-green-paper 27 Pupil referral units and special schools were not included in the eligible sample. For more information, see the methodology in the appendix.
38
Figure 17: Activities performed by mental health lead
Schools in the top quintile for FSM (with fewest pupils on FSM) were least likely to suggest their mental health leads provided pastoral or therapeutic support to individual pupils (81% compared with 88% among the total sample).
Mental health leads in academies were significantly more likely (87%) to teach pupils about mental health and wellbeing in comparison with their non-academy counter-parts (79%)
Finally, mental health leads working in primary schools were more likely to identify and assess student needs (95%) and monitor and support staff wellbeing (78%), compared to those in secondary schools (88% and 63% respectively).
3.2 SEND A SEND review considers how a school is providing for its pupils with special educational needs and/or disabilities. Its purpose is to improve SEND provision and strategy to effectively support pupils with SEND to achieve good outcomes28.
28 This is the definition provided in the survey if respondents needed it.
97%
94%
92%
91%
88%
88%
85%
82%
75%
Liaising with external mental health services
Identifying and/or assessing pupils’ needs
Coordinating mental health provision in the school
Monitoring mental health and wellbeing across theschool
Providing pastoral or therapeutic support to individualpupils
Being a contact point for parents with concerns abouttheir child's mental health
Training staff about young people's mental health andwellbeing
Teaching pupils about mental health and wellbeing
Monitoring and supporting staff wellbeing
I2. Which of the following activities do they do? Base: All who have designated lead (578)
39
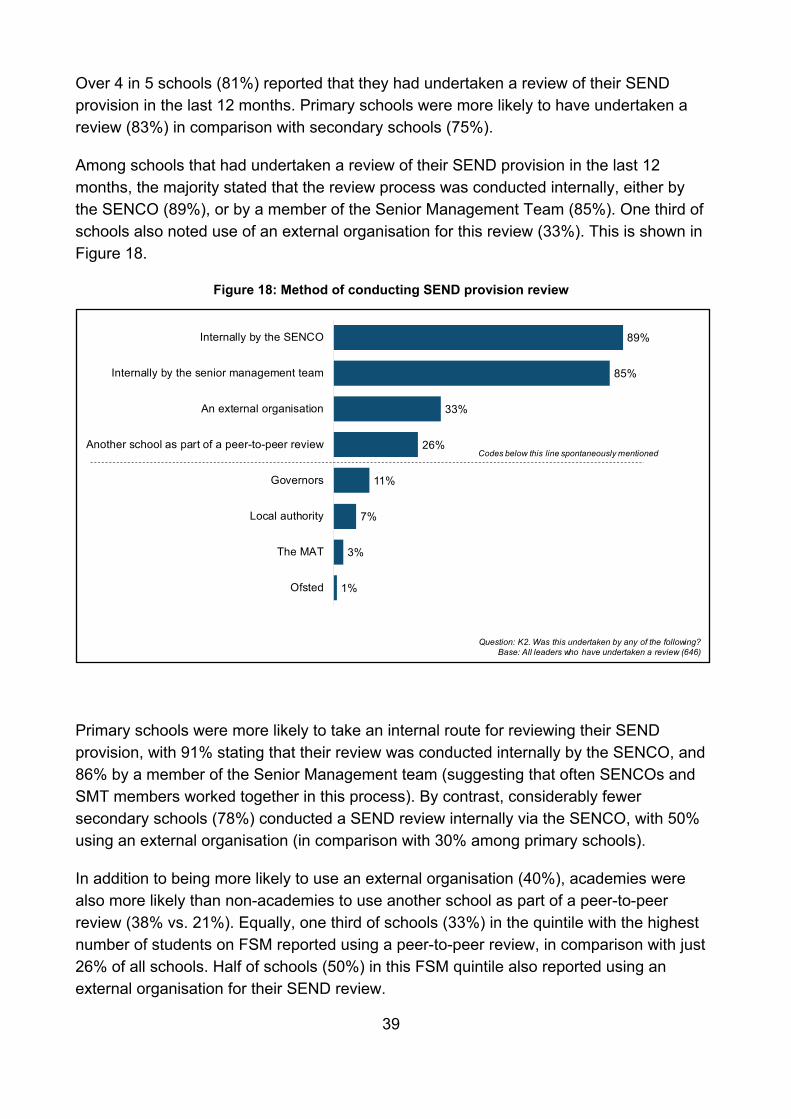
Over 4 in 5 schools (81%) reported that they had undertaken a review of their SEND provision in the last 12 months. Primary schools were more likely to have undertaken a review (83%) in comparison with secondary schools (75%).
Among schools that had undertaken a review of their SEND provision in the last 12 months, the majority stated that the review process was conducted internally, either by the SENCO (89%), or by a member of the Senior Management Team (85%). One third of schools also noted use of an external organisation for this review (33%). This is shown in Figure 18.
Figure 18: Method of conducting SEND provision review
Primary schools were more likely to take an internal route for reviewing their SEND provision, with 91% stating that their review was conducted internally by the SENCO, and 86% by a member of the Senior Management team (suggesting that often SENCOs and SMT members worked together in this process). By contrast, considerably fewer secondary schools (78%) conducted a SEND review internally via the SENCO, with 50% using an external organisation (in comparison with 30% among primary schools).
In addition to being more likely to use an external organisation (40%), academies were also more likely than non-academies to use another school as part of a peer-to-peer review (38% vs. 21%). Equally, one third of schools (33%) in the quintile with the highest number of students on FSM reported using a peer-to-peer review, in comparison with just 26% of all schools. Half of schools (50%) in this FSM quintile also reported using an external organisation for their SEND review.
89%
85%
33%
26%
11%
7%
3%
1%
Internally by the SENCO
Internally by the senior management team
An external organisation
Another school as part of a peer-to-peer review
Governors
Local authority
The MAT
Ofsted
Question: K2. Was this undertaken by any of the following? Base: All leaders who have undertaken a review (646)
Codes below this line spontaneously mentioned
40
Regionally, Yorkshire and Humber and the South West, were most likely to use peer review (37% and 31% respectively), with only 15% of schools from the London area using this method. Although schools in all regions most commonly used internal methods for their SEND provision reviews, those from the West Midlands were most likely to use an external organisation (45%) as part of their review, in comparison with only 1 in 5 respondents (21%) from the South West.
3.3 Pupil premium reviews A pupil premium review looks at how a school is spending its pupil premium funding. The purpose of the review is to improve a school’s pupil premium strategy, so that funding is spent on approaches shown to be effective in improving the achievement of disadvantaged pupils. In the case of an external review, the reviewer will be an independent, experienced leader with a track record of making these improvements for disadvantaged pupils29.
A school may be recommended to commission a pupil premium review by Ofsted if they identify concerns with the school’s provision for disadvantaged pupils; however recommendations may also come from a local authority, academy trust, regional schools commissioner or the Department for Education.
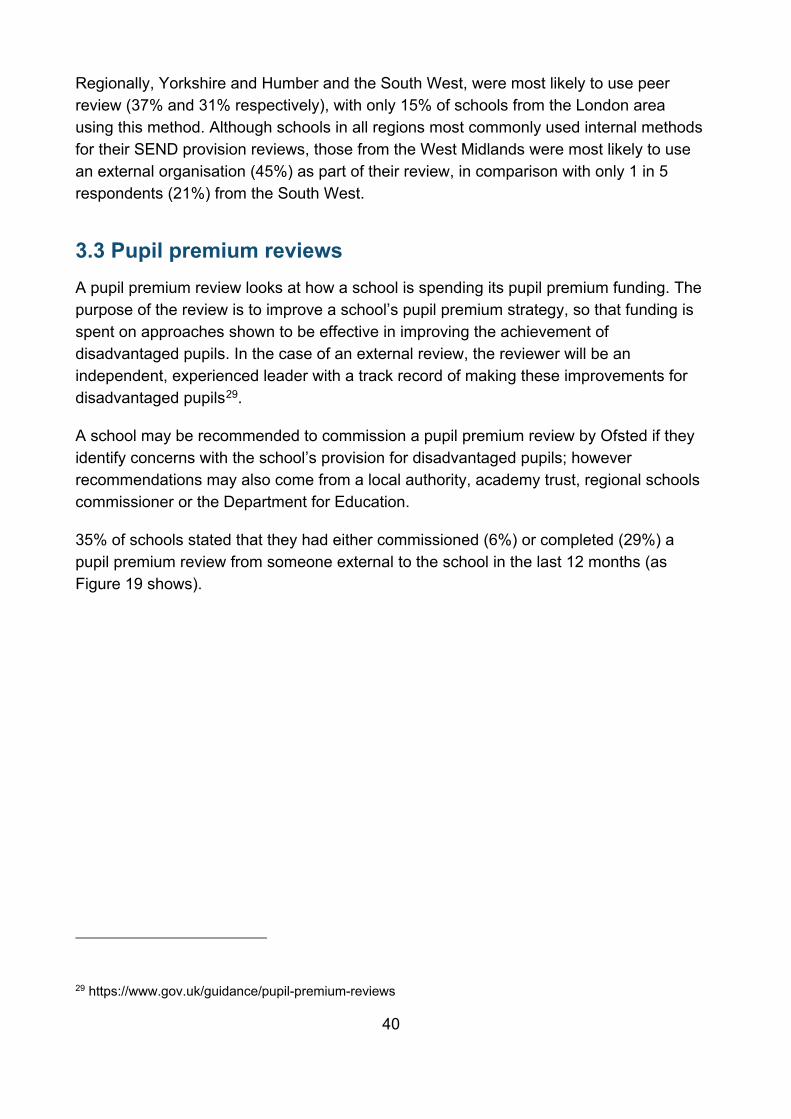
35% of schools stated that they had either commissioned (6%) or completed (29%) a pupil premium review from someone external to the school in the last 12 months (as Figure 19 shows).
29 https://www.gov.uk/guidance/pupil-premium-reviews
41
Figure 19: Commissioning of pupil premium reviews
Secondary schools were more likely to have completed or commissioned a review, with 48% stating that their school had either completed or commissioned a review in comparison with just 32% of primary schools. 40% of academies stated that they had completed pupil premium reviews in comparison with just 24% of non-academies.
Schools with the highest proportion of students on FSM were also most likely to have completed a review (36%), with only 16% of those with fewest FSM students having completed a review.
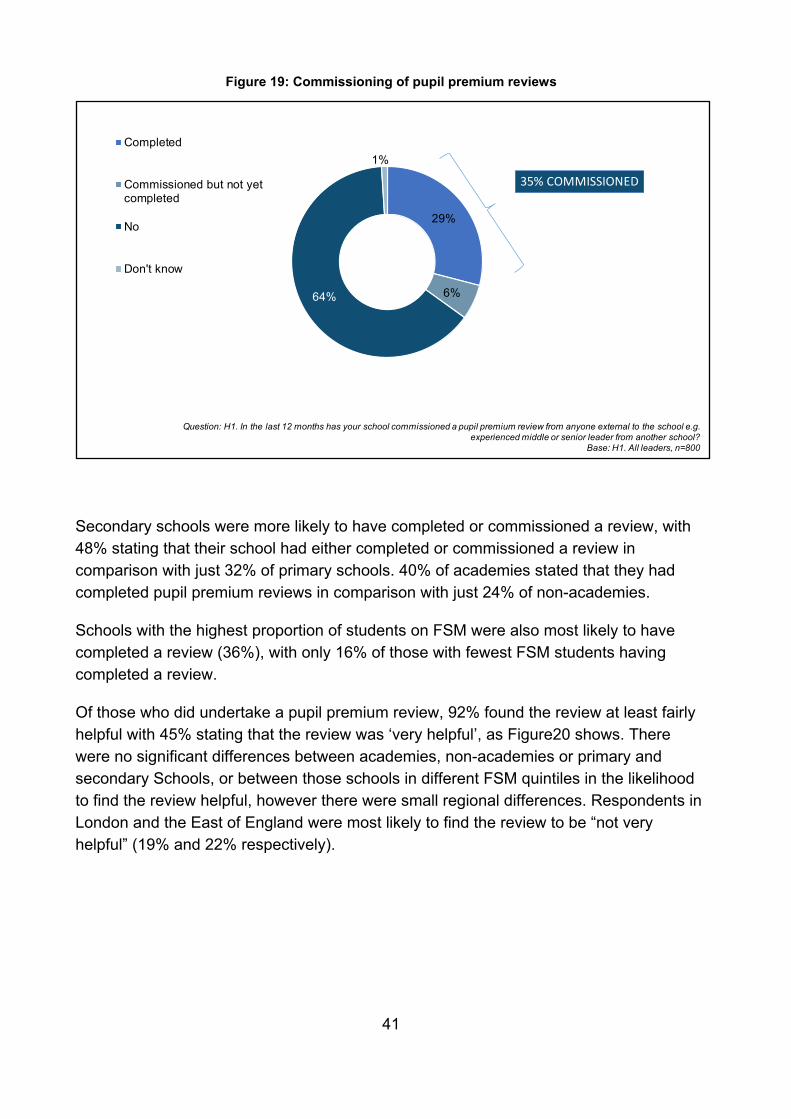
Of those who did undertake a pupil premium review, 92% found the review at least fairly helpful with 45% stating that the review was ‘very helpful’, as Figure20 shows. There were no significant differences between academies, non-academies or primary and secondary Schools, or between those schools in different FSM quintiles in the likelihood to find the review helpful, however there were small regional differences. Respondents in London and the East of England were most likely to find the review to be “not very helpful” (19% and 22% respectively).
29%
6%64%
1%Completed
Commissioned but not yetcompleted
No
Don't know
35% COMMISSIONED
Question: H1. In the last 12 months has your school commissioned a pupil premium review from anyone external to the school e.g. experienced middle or senior leader from another school?
Base: H1. All leaders, n=800
42
Figure 20: Helpfulness of the pupil premium review
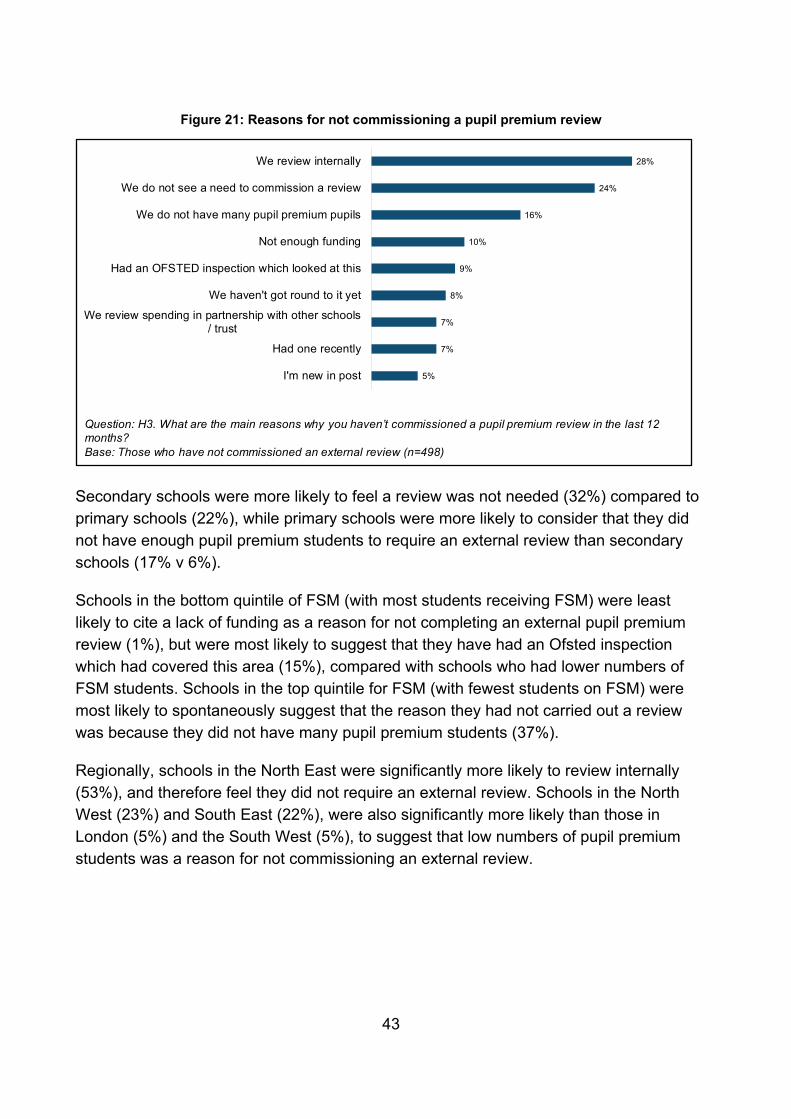
Schools were asked to provide their own unprompted reasons as to why they had not commissioned a pupil premium review. As shown in Figure 21, there were a variety of reasons why schools have not commissioned a pupil premium review with an external organisation in the last 12 months. The most common response was that the school reviewed internally (28%), followed by not seeing a need to commission a review (24%). 16% of schools that did not commission a pupil premium review also reported that they did not have many pupil premium students and thus a review was not warranted.
45% 47% 7%
Very Fairly Not very Not at all
H2. How helpful did your school find the pupil premium review…? Base: All who had commissioned Pupil Premium reviews (243)
43
Figure 21: Reasons for not commissioning a pupil premium review
Secondary schools were more likely to feel a review was not needed (32%) compared to primary schools (22%), while primary schools were more likely to consider that they did not have enough pupil premium students to require an external review than secondary schools (17% v 6%).
Schools in the bottom quintile of FSM (with most students receiving FSM) were least likely to cite a lack of funding as a reason for not completing an external pupil premium review (1%), but were most likely to suggest that they have had an Ofsted inspection which had covered this area (15%), compared with schools who had lower numbers of FSM students. Schools in the top quintile for FSM (with fewest students on FSM) were most likely to spontaneously suggest that the reason they had not carried out a review was because they did not have many pupil premium students (37%).
Regionally, schools in the North East were significantly more likely to review internally (53%), and therefore feel they did not require an external review. Schools in the North West (23%) and South East (22%), were also significantly more likely than those in London (5%) and the South West (5%), to suggest that low numbers of pupil premium students was a reason for not commissioning an external review.
28%
24%
16%
10%
9%
8%
7%
7%
5%
We review internally
We do not see a need to commission a review
We do not have many pupil premium pupils
Not enough funding
Had an OFSTED inspection which looked at this
We haven't got round to it yet
We review spending in partnership with other schools/ trust
Had one recently
I'm new in post
Question: H3. What are the main reasons why you haven’t commissioned a pupil premium review in the last 12 months?Base: Those who have not commissioned an external review (n=498)
44
3.4 Anti-Bullying By law, all state schools must have a behaviour policy in place that includes measures to prevent all forms of bullying among pupils. This policy is decided by the school. All teachers, pupils and parents must be told what it is.
Leaders and teachers were asked about whether they had seen various types of bullying in the last 12 months, and the frequency in which they had seen them occur.
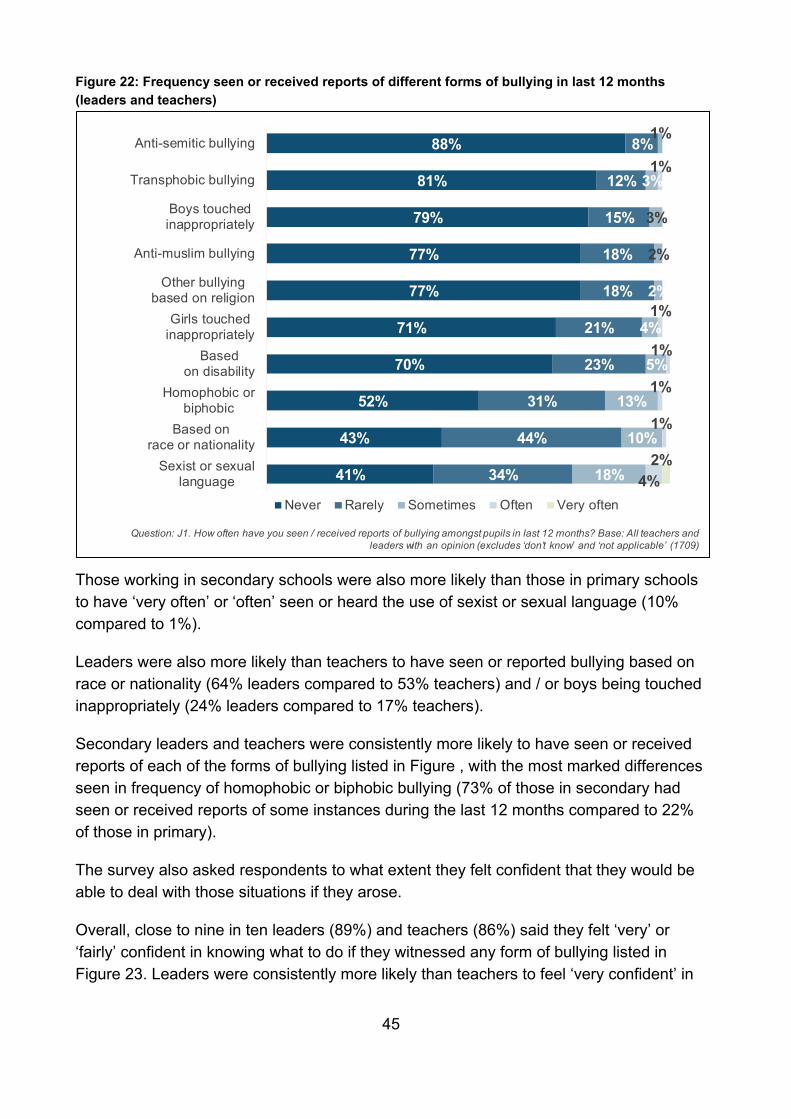
Over the previous 12 months all forms of bullying were seen very rarely, if at all: 66% of leaders and teachers had never or rarely seen all of the types of bullying mentioned. As shown in Figure 22, anti-Semitic bullying was the least common form of bullying seen in the last 12 months (88% had never seen it, while 8% had seen it but only rarely). Other very rarely seen forms of bullying included: transphobic bullying (81% had never seen, 12% only rarely), boys being touched inappropriately (79% and 15% respectively), anti-Muslim bullying (77% and 18%), other bullying based on religion (77% and 18%), girls being touched inappropriately (71% and 21%) and bullying based on disability (70% and 23%).
Slightly more commonly seen, though still relatively rare, was homophobic bullying (52% had never seen this, 31% had seen it rarely, 13% had seen it sometimes and 1% had seen it often) and bullying based on race or nationality (43% had never seen this, 44% had seen it rarely, 10% had seen it sometimes and 1% had seen it often). Most common was sexist or sexual language being used (while 41% had never seen this, 34% had seen it rarely, 18% had seen it sometimes, 4% had seen it often and 2% very often).
45
Figure 22: Frequency seen or received reports of different forms of bullying in last 12 months (leaders and teachers)
Those working in secondary schools were also more likely than those in primary schools to have ‘very often’ or ‘often’ seen or heard the use of sexist or sexual language (10% compared to 1%).
Leaders were also more likely than teachers to have seen or reported bullying based on race or nationality (64% leaders compared to 53% teachers) and / or boys being touched inappropriately (24% leaders compared to 17% teachers).
Secondary leaders and teachers were consistently more likely to have seen or received reports of each of the forms of bullying listed in Figure , with the most marked differences seen in frequency of homophobic or biphobic bullying (73% of those in secondary had seen or received reports of some instances during the last 12 months compared to 22% of those in primary).
The survey also asked respondents to what extent they felt confident that they would be able to deal with those situations if they arose.
Overall, close to nine in ten leaders (89%) and teachers (86%) said they felt ‘very’ or ‘fairly’ confident in knowing what to do if they witnessed any form of bullying listed in Figure 23. Leaders were consistently more likely than teachers to feel ‘very confident’ in
Question: J1. How often have you seen / received reports of bullying amongst pupils in last 12 months? Base: All teachers and leaders with an opinion (excludes ‘don’t know’ and ‘not applicable’ (1709)
41%
43%
52%
70%
71%
77%
77%
79%
81%
88%
34%
44%
31%
23%
21%
18%
18%
15%
12%
8%
18%
10%
13%
5%
4%
2%
2%
3%
3%
1%
4%
1%
1%
1%
1%
1%
2%Sexist or sexuallanguage
Based onrace or nationality
Homophobic orbiphobic
Basedon disability
Girls touchedinappropriately
Other bullyingbased on religion
Anti-muslim bullying
Boys touchedinappropriately
Transphobic bullying
Anti-semitic bullying
Never Rarely Sometimes Often Very often
46
dealing with each form of bullying. Both leaders and teachers were most likely to feel ‘very confident’ if they had to deal with bullying based on disability (86% of leaders and 68% of teachers), though leaders were markedly more confident than teachers.
Both leaders and teachers were generally more confident in dealing with the forms of bullying which are more frequently seen or reported (82% of leaders and 65% of teachers ‘very confident’ in dealing with use of sexist or sexual language, and 82% of teachers and 65% of teachers ‘very confident’ in dealing with bullying based on race or nationality). However, compared to their confidence in dealing with other forms of bullying leaders were less likely to be ‘very confident’ dealing with homophobic or biphobic bullying (75% of leaders).
Both leaders and teachers were less confident dealing with less frequently seen forms of bullying – transphobic (62% of leaders and 57% of teachers ‘very confident’) and anti-Semitic (66% of leaders and 58% of teachers ‘very confident’).
Secondary leaders and teachers were consistently more likely than primary leaders and teachers to be ‘very confident’ in dealing with all forms of bullying listed, reflecting their higher likelihood to have experienced each form. The most marked differences were in dealing with homophobic or biphobic bullying (79% of secondary compared to 54% of primary ‘very confident’), anti-Semitic bullying (71% compared to 48%) and anti-muslim bullying (74% compared to 53%).
47
Figure 23: Proportion of leaders and teachers ‘fairly’ or ‘very confident’ in dealing with different forms of bullying (leaders and teachers)
32%18%
32%17%
31%23%
29%14%
32%18%
34%25%
33%28%
32%19%
33%32%
35%29%
65%
82%
67%82%
64%75%
68%86%
63%80%
62%74%
62%70%
62%79%
57%62%
58%66%
Fairly confident Very confident
Question: J2. How confident would you be in knowing what to do if you saw or heard bullying?Note. The scale went from ‘not at all confident’ to ‘very confident’. Base: All teachers (n=909) and leaders (n=800)
LT
L LeadersT Teachers
LT
LT
LT
LT
LT
LT
LT
LT
LT
48
4. Careers Education This chapter will explore schools’ provision of careers education to their pupils.
Every school must ensure that pupils are provided with independent careers guidance from year 8 to year 13. Every school must:
• Ensure that there is an opportunity for a range of education and training providers to access all pupils in year 8 to year 13 for the purpose of informing them about approved technical education qualifications or apprenticeships.
• Publish a policy statement setting out their arrangements for provider access and ensure that it is followed30.
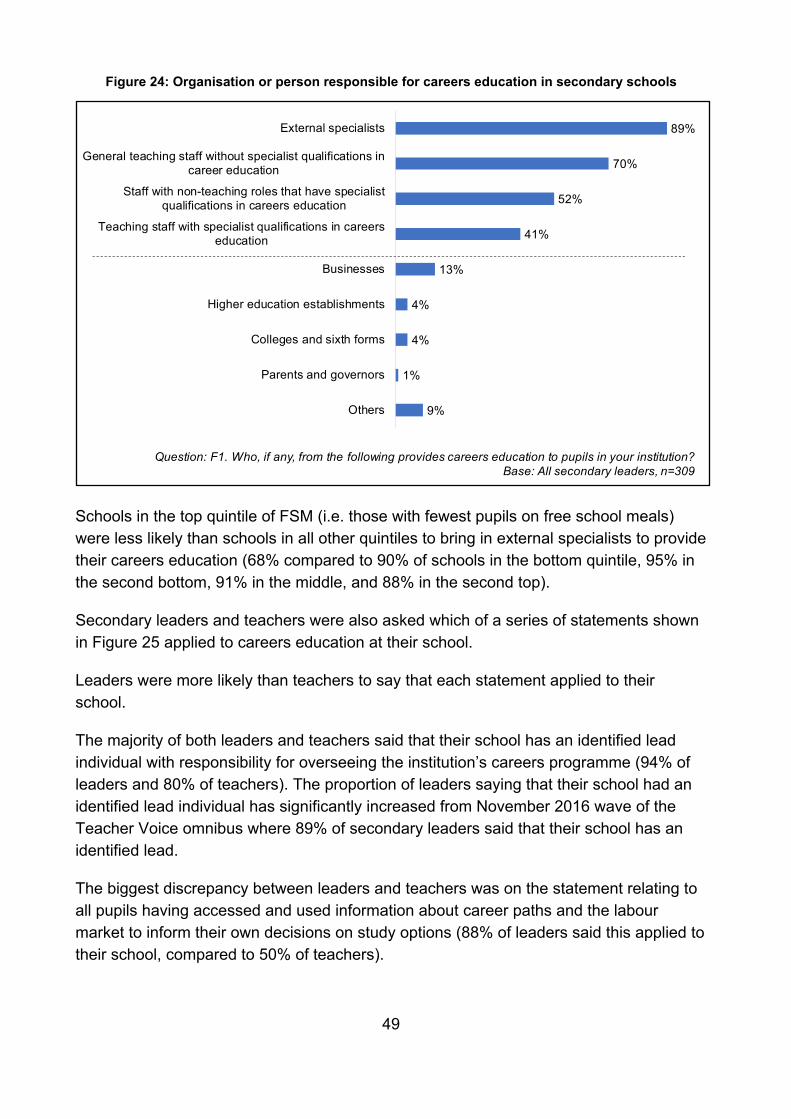
The ways in which secondary schools were delivering careers education are shown in Figure 24. Schools most commonly had external specialists come in to provide careers education (89%), followed by general teaching staff without specialist qualifications in career education (70%), staff with non-teaching roles that have specialist qualifications in careers education (52%) and teaching staff with specialist qualifications in careers education (41%).
In total, 66% of secondary schools were using internal staff with specialist qualifications in careers education (either teaching staff or non-teaching staff). 96% were using staff (either internal teaching or non-teaching, or external) with a specialist qualification in careers education. Only 3% were using general staff without specialist qualifications in careers education as their only method of providing careers education; the remainder used this in combination with other methods.
Around one in eight schools spontaneously mentioned that they had businesses come to visit and provide careers education (13%), 4% had higher education establishments involved, 4% had colleges and sixth forms involved, and 1% had parents and governors come to the school to provide careers education. 9% had another type of person or organisation providing careers education.
30 http://researchbriefings.files.parliament.uk/documents/CBP-7236/CBP-7236.pdf
49
Figure 24: Organisation or person responsible for careers education in secondary schools
Schools in the top quintile of FSM (i.e. those with fewest pupils on free school meals) were less likely than schools in all other quintiles to bring in external specialists to provide their careers education (68% compared to 90% of schools in the bottom quintile, 95% in the second bottom, 91% in the middle, and 88% in the second top).
Secondary leaders and teachers were also asked which of a series of statements shown in Figure 25 applied to careers education at their school.
Leaders were more likely than teachers to say that each statement applied to their school.
The majority of both leaders and teachers said that their school has an identified lead individual with responsibility for overseeing the institution’s careers programme (94% of leaders and 80% of teachers). The proportion of leaders saying that their school had an identified lead individual has significantly increased from November 2016 wave of the Teacher Voice omnibus where 89% of secondary leaders said that their school has an identified lead.
The biggest discrepancy between leaders and teachers was on the statement relating to all pupils having accessed and used information about career paths and the labour market to inform their own decisions on study options (88% of leaders said this applied to their school, compared to 50% of teachers).
89%
70%
52%
41%
13%
4%
4%
1%
9%
External specialists
General teaching staff without specialist qualifications incareer education
Staff with non-teaching roles that have specialistqualifications in careers education
Teaching staff with specialist qualifications in careerseducation
Businesses
Higher education establishments
Colleges and sixth forms
Parents and governors
Others
Question: F1. Who, if any, from the following provides careers education to pupils in your institution?Base: All secondary leaders, n=309
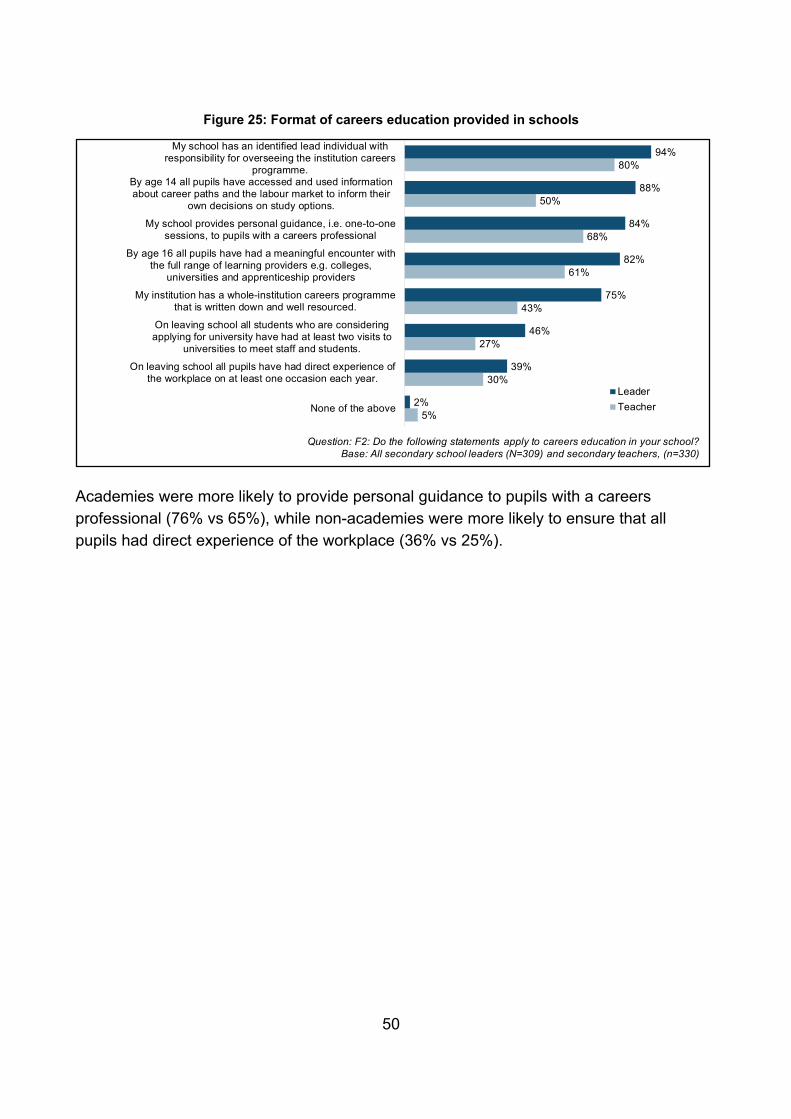
50
Figure 25: Format of careers education provided in schools
Academies were more likely to provide personal guidance to pupils with a careers professional (76% vs 65%), while non-academies were more likely to ensure that all pupils had direct experience of the workplace (36% vs 25%).
5%
30%
27%
43%
61%
68%
50%
80%
2%
39%
46%
75%
82%
84%
88%
94%
None of the above
On leaving school all pupils have had direct experience ofthe workplace on at least one occasion each year.
On leaving school all students who are consideringapplying for university have had at least two visits to
universities to meet staff and students.
My institution has a whole-institution careers programmethat is written down and well resourced.
By age 16 all pupils have had a meaningful encounter withthe full range of learning providers e.g. colleges,
universities and apprenticeship providers
My school provides personal guidance, i.e. one-to-onesessions, to pupils with a careers professional
By age 14 all pupils have accessed and used informationabout career paths and the labour market to inform their
own decisions on study options.
My school has an identified lead individual withresponsibility for overseeing the institution careers
programme.
LeaderTeacher
Question: F2: Do the following statements apply to careers education in your school? Base: All secondary school leaders (N=309) and secondary teachers, (n=330)
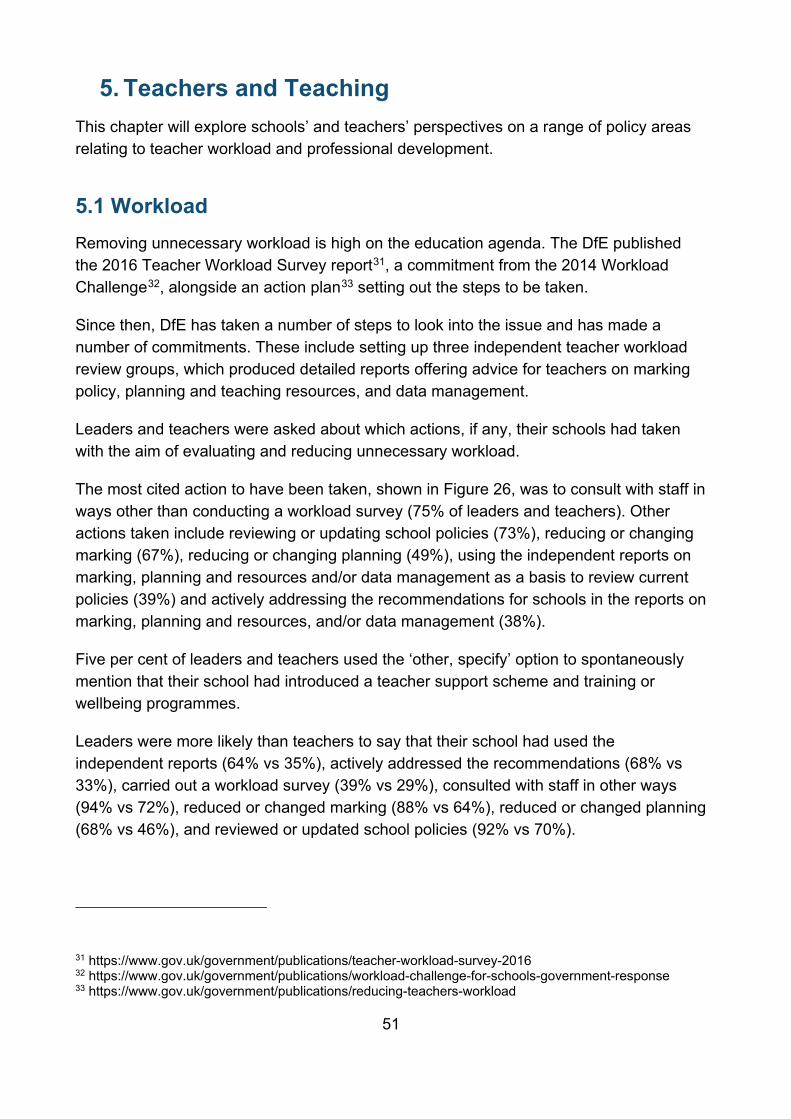
51
5. Teachers and Teaching This chapter will explore schools’ and teachers’ perspectives on a range of policy areas relating to teacher workload and professional development.
5.1 Workload Removing unnecessary workload is high on the education agenda. The DfE published the 2016 Teacher Workload Survey report31, a commitment from the 2014 Workload Challenge32, alongside an action plan33 setting out the steps to be taken.
Since then, DfE has taken a number of steps to look into the issue and has made a number of commitments. These include setting up three independent teacher workload review groups, which produced detailed reports offering advice for teachers on marking policy, planning and teaching resources, and data management.
Leaders and teachers were asked about which actions, if any, their schools had taken with the aim of evaluating and reducing unnecessary workload.
The most cited action to have been taken, shown in Figure 26, was to consult with staff in ways other than conducting a workload survey (75% of leaders and teachers). Other actions taken include reviewing or updating school policies (73%), reducing or changing marking (67%), reducing or changing planning (49%), using the independent reports on marking, planning and resources and/or data management as a basis to review current policies (39%) and actively addressing the recommendations for schools in the reports on marking, planning and resources, and/or data management (38%).
Five per cent of leaders and teachers used the ‘other, specify’ option to spontaneously mention that their school had introduced a teacher support scheme and training or wellbeing programmes.
Leaders were more likely than teachers to say that their school had used the independent reports (64% vs 35%), actively addressed the recommendations (68% vs 33%), carried out a workload survey (39% vs 29%), consulted with staff in other ways (94% vs 72%), reduced or changed marking (88% vs 64%), reduced or changed planning (68% vs 46%), and reviewed or updated school policies (92% vs 70%).
31 https://www.gov.uk/government/publications/teacher-workload-survey-2016 32 https://www.gov.uk/government/publications/workload-challenge-for-schools-government-response 33 https://www.gov.uk/government/publications/reducing-teachers-workload
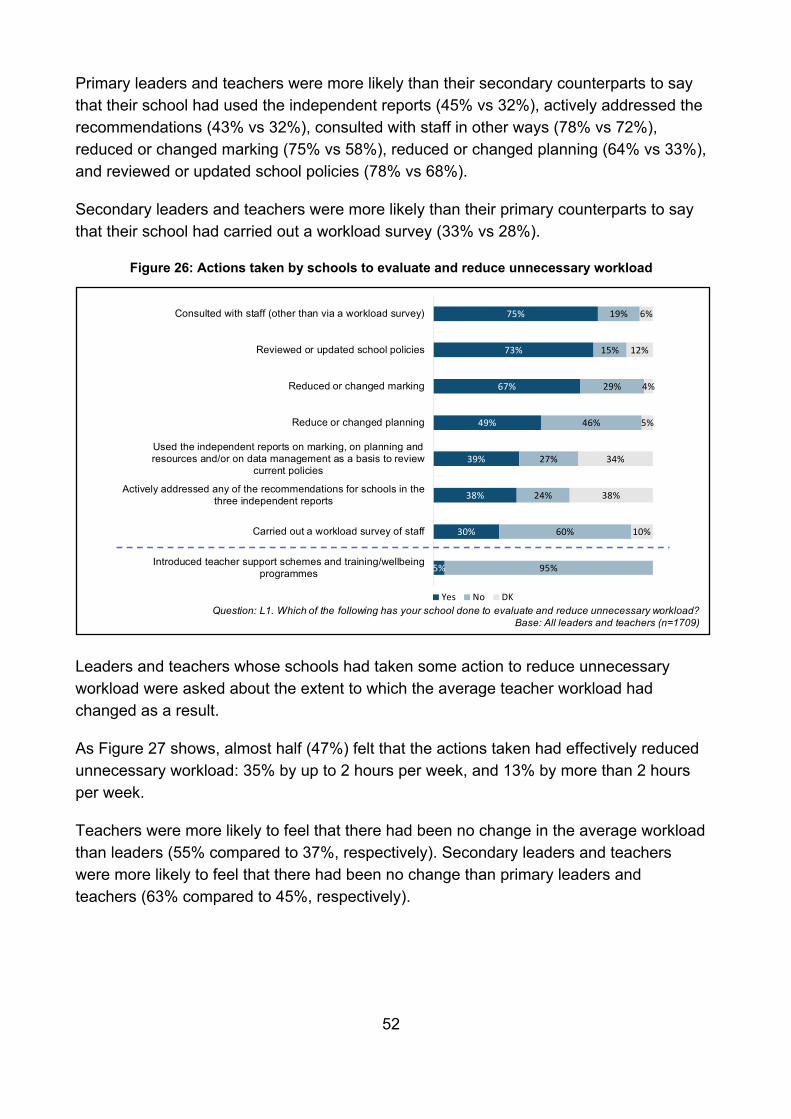
52
Primary leaders and teachers were more likely than their secondary counterparts to say that their school had used the independent reports (45% vs 32%), actively addressed the recommendations (43% vs 32%), consulted with staff in other ways (78% vs 72%), reduced or changed marking (75% vs 58%), reduced or changed planning (64% vs 33%), and reviewed or updated school policies (78% vs 68%).
Secondary leaders and teachers were more likely than their primary counterparts to say that their school had carried out a workload survey (33% vs 28%).
Figure 26: Actions taken by schools to evaluate and reduce unnecessary workload
Leaders and teachers whose schools had taken some action to reduce unnecessary workload were asked about the extent to which the average teacher workload had changed as a result.
As Figure 27 shows, almost half (47%) felt that the actions taken had effectively reduced unnecessary workload: 35% by up to 2 hours per week, and 13% by more than 2 hours per week.
Teachers were more likely to feel that there had been no change in the average workload than leaders (55% compared to 37%, respectively). Secondary leaders and teachers were more likely to feel that there had been no change than primary leaders and teachers (63% compared to 45%, respectively).
5%
30%
38%
39%
49%
67%
73%
75%
95%
60%
24%
27%
46%
29%
15%
19%
10%
38%
34%
5%
4%
12%
6%
Introduced teacher support schemes and training/wellbeingprogrammes
Carried out a workload survey of staff
Actively addressed any of the recommendations for schools in thethree independent reports
Used the independent reports on marking, on planning andresources and/or on data management as a basis to review
current policies
Reduce or changed planning
Reduced or changed marking
Reviewed or updated school policies
Consulted with staff (other than via a workload survey)
Yes No DKQuestion: L1. Which of the following has your school done to evaluate and reduce unnecessary workload?
Base: All leaders and teachers (n=1709)
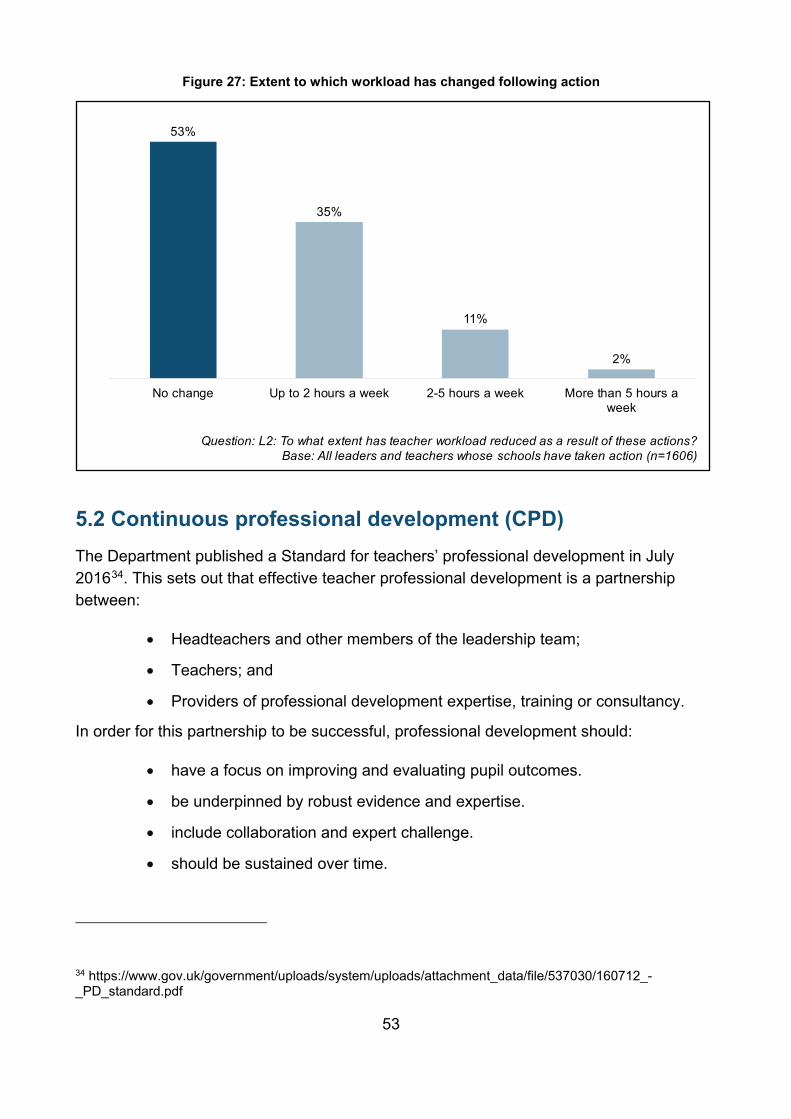
53
Figure 27: Extent to which workload has changed following action
5.2 Continuous professional development (CPD) The Department published a Standard for teachers’ professional development in July 201634. This sets out that effective teacher professional development is a partnership between:
• Headteachers and other members of the leadership team;
• Teachers; and
• Providers of professional development expertise, training or consultancy.
In order for this partnership to be successful, professional development should:
• have a focus on improving and evaluating pupil outcomes.
• be underpinned by robust evidence and expertise.
• include collaboration and expert challenge.
• should be sustained over time.
34 https://www.gov.uk/government/uploads/system/uploads/attachment_data/file/537030/160712_-_PD_standard.pdf
53%
35%
11%
2%
No change Up to 2 hours a week 2-5 hours a week More than 5 hours aweek
Question: L2: To what extent has teacher workload reduced as a result of these actions? Base: All leaders and teachers whose schools have taken action (n=1606)
54
And all this is underpinned by, and requires that:
• Professional development must be prioritised by school leadership.
Leaders and teachers were asked whether they were aware of the Standard. Over three quarters (76%) were aware of the Standard, 21% were not aware and 4% did not know.
Leaders were more likely than teachers to be aware of the Standard (86% of leaders compared to 74% of teachers). Those working in primary schools were also more likely than those working in secondary schools to be aware (80% compared to 71%).
When asked how well they felt they knew what aspects of teachers’ professional development the Standard covers, overall 80% of leaders and teachers felt they knew it well (20% very well and 60% fairly well), whilst 18% stated that they did not know it at all.
As Figure 28 shows, leaders were more likely than teachers to feel they knew what it covered well (87% of leaders compared to 79% of teachers). Those working in primary schools were also more likely than those working in secondary schools to feel they knew well what it covered (83% compared to 77%).
Figure 28: Extent of knowledge of Standard
When asked whether they had undertaken any CPD in the last academic year, 97% of all leaders and teachers stated they had done so. Only 3% had not. This proportion was consistently high among leaders (98%) and teachers (96%), and among those working in both primary (98%) and secondary (95%) schools.
20% 60% 18% 1%
Very Fairly Not very Not at all
80% WELL
Question: M2. How well do you know what aspects of teachers' professional development the Standard covers?Base: All aware(1371); Secondary (n=495), Primary (n=876), Leaders (n=687), Teachers (n=684)
87%
79%
LEADERS
TEACHERS
83%
77%
PRIMARY
SECONDARY
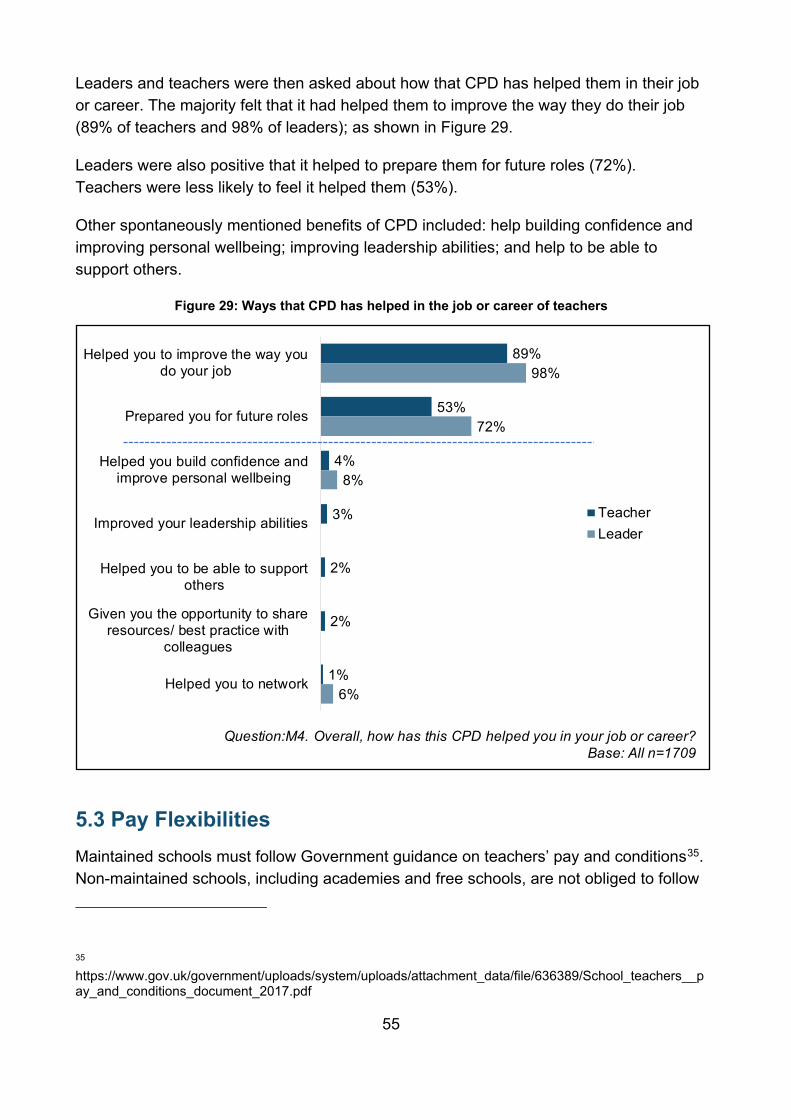
55
Leaders and teachers were then asked about how that CPD has helped them in their job or career. The majority felt that it had helped them to improve the way they do their job (89% of teachers and 98% of leaders); as shown in Figure 29.
Leaders were also positive that it helped to prepare them for future roles (72%). Teachers were less likely to feel it helped them (53%).
Other spontaneously mentioned benefits of CPD included: help building confidence and improving personal wellbeing; improving leadership abilities; and help to be able to support others.
Figure 29: Ways that CPD has helped in the job or career of teachers
5.3 Pay Flexibilities Maintained schools must follow Government guidance on teachers’ pay and conditions35. Non-maintained schools, including academies and free schools, are not obliged to follow
35 https://www.gov.uk/government/uploads/system/uploads/attachment_data/file/636389/School_teachers__pay_and_conditions_document_2017.pdf
Question:M4. Overall, how has this CPD helped you in your job or career? Base: All n=1709
89%
53%
4%
3%
2%
2%
1%
98%
72%
8%
6%
Helped you to improve the way youdo your job
Prepared you for future roles
Helped you build confidence andimprove personal wellbeing
Improved your leadership abilities
Helped you to be able to supportothers
Given you the opportunity to shareresources/ best practice with
colleagues
Helped you to network
TeacherLeader
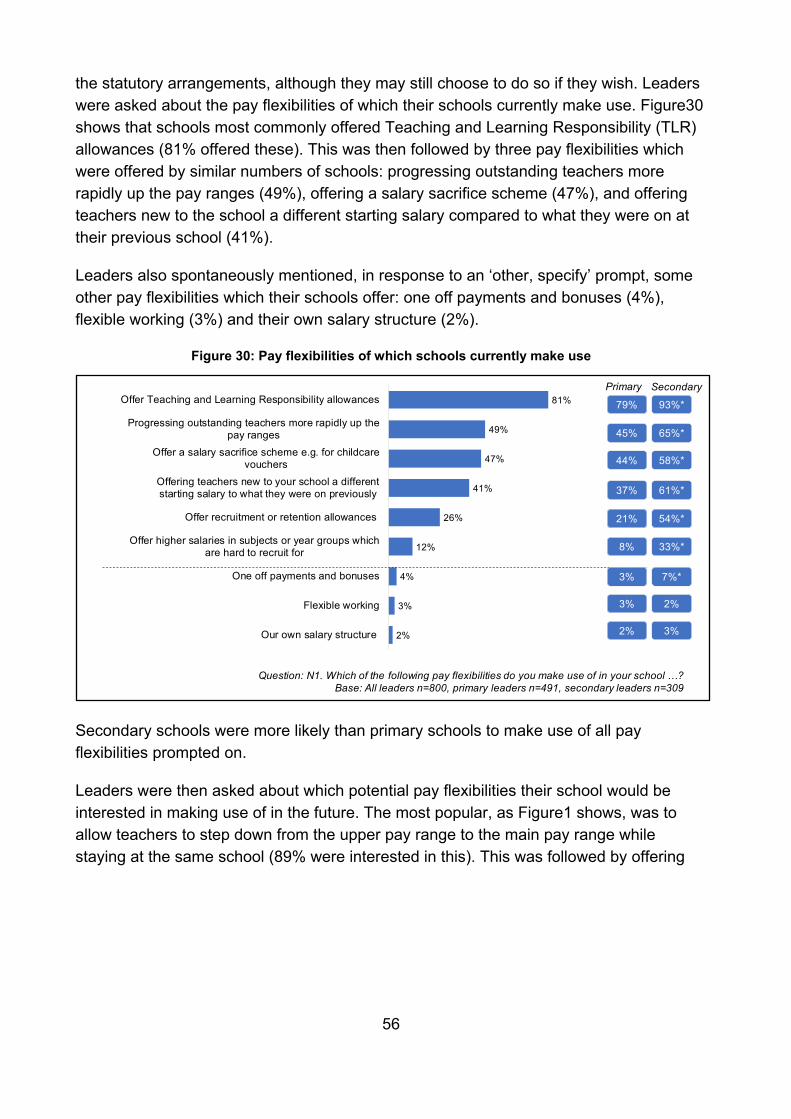
56
the statutory arrangements, although they may still choose to do so if they wish. Leaders were asked about the pay flexibilities of which their schools currently make use. Figure30 shows that schools most commonly offered Teaching and Learning Responsibility (TLR) allowances (81% offered these). This was then followed by three pay flexibilities which were offered by similar numbers of schools: progressing outstanding teachers more rapidly up the pay ranges (49%), offering a salary sacrifice scheme (47%), and offering teachers new to the school a different starting salary compared to what they were on at their previous school (41%).
Leaders also spontaneously mentioned, in response to an ‘other, specify’ prompt, some other pay flexibilities which their schools offer: one off payments and bonuses (4%), flexible working (3%) and their own salary structure (2%).
Figure 30: Pay flexibilities of which schools currently make use
Secondary schools were more likely than primary schools to make use of all pay flexibilities prompted on.
Leaders were then asked about which potential pay flexibilities their school would be interested in making use of in the future. The most popular, as Figure1 shows, was to allow teachers to step down from the upper pay range to the main pay range while staying at the same school (89% were interested in this). This was followed by offering
81%
49%
47%
41%
26%
12%
4%
3%
2%
Offer Teaching and Learning Responsibility allowances
Progressing outstanding teachers more rapidly up thepay ranges
Offer a salary sacrifice scheme e.g. for childcarevouchers
Offering teachers new to your school a differentstarting salary to what they were on previously
Offer recruitment or retention allowances
Offer higher salaries in subjects or year groups whichare hard to recruit for
One off payments and bonuses
Flexible working
Our own salary structure
Question: N1. Which of the following pay flexibilities do you make use of in your school …?Base: All leaders n=800, primary leaders n=491, secondary leaders n=309
Primary Secondary
79% 93%*
45% 65%*
44% 58%*
37% 61%*
21% 54%*
8% 33%*
3% 7%*
3% 2%
2% 3%
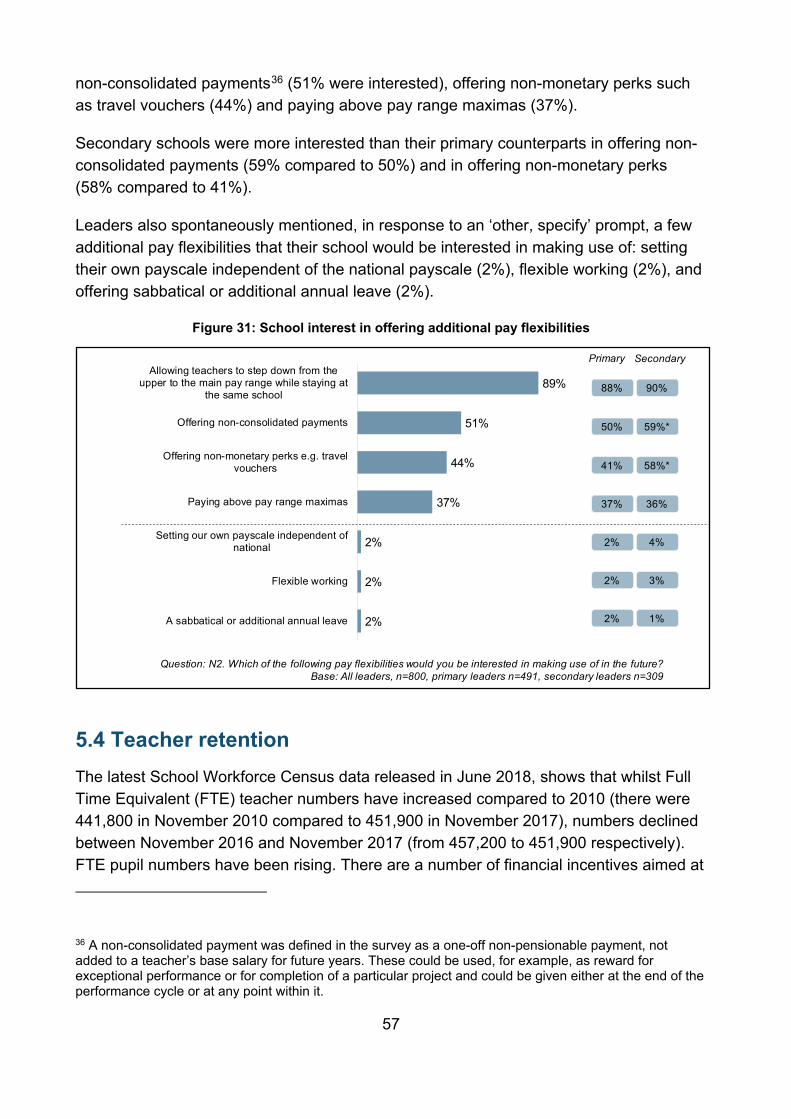
57
non-consolidated payments36 (51% were interested), offering non-monetary perks such as travel vouchers (44%) and paying above pay range maximas (37%).
Secondary schools were more interested than their primary counterparts in offering non-consolidated payments (59% compared to 50%) and in offering non-monetary perks (58% compared to 41%).
Leaders also spontaneously mentioned, in response to an ‘other, specify’ prompt, a few additional pay flexibilities that their school would be interested in making use of: setting their own payscale independent of the national payscale (2%), flexible working (2%), and offering sabbatical or additional annual leave (2%).
Figure 31: School interest in offering additional pay flexibilities
5.4 Teacher retention The latest School Workforce Census data released in June 2018, shows that whilst Full Time Equivalent (FTE) teacher numbers have increased compared to 2010 (there were 441,800 in November 2010 compared to 451,900 in November 2017), numbers declined between November 2016 and November 2017 (from 457,200 to 451,900 respectively). FTE pupil numbers have been rising. There are a number of financial incentives aimed at
36 A non-consolidated payment was defined in the survey as a one-off non-pensionable payment, not added to a teacher’s base salary for future years. These could be used, for example, as reward for exceptional performance or for completion of a particular project and could be given either at the end of the performance cycle or at any point within it.
89%
51%
44%
37%
2%
2%
2%
Allowing teachers to step down from theupper to the main pay range while staying at
the same school
Offering non-consolidated payments
Offering non-monetary perks e.g. travelvouchers
Paying above pay range maximas
Setting our own payscale independent ofnational
Flexible working
A sabbatical or additional annual leave
Question: N2. Which of the following pay flexibilities would you be interested in making use of in the future? Base: All leaders, n=800, primary leaders n=491, secondary leaders n=309
88% 90%
50% 59%*
41% 58%*
37% 36%
2% 4%
2% 3%
2% 1%
Primary Secondary
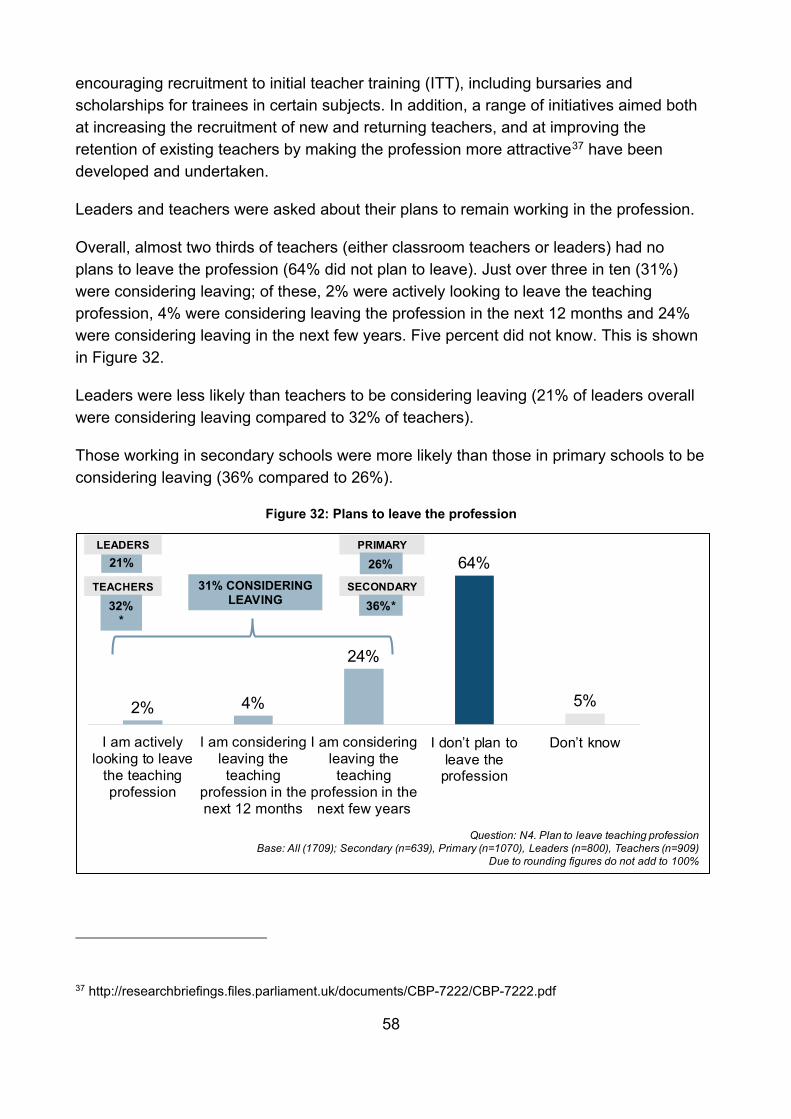
58
encouraging recruitment to initial teacher training (ITT), including bursaries and scholarships for trainees in certain subjects. In addition, a range of initiatives aimed both at increasing the recruitment of new and returning teachers, and at improving the retention of existing teachers by making the profession more attractive37 have been developed and undertaken.
Leaders and teachers were asked about their plans to remain working in the profession.
Overall, almost two thirds of teachers (either classroom teachers or leaders) had no plans to leave the profession (64% did not plan to leave). Just over three in ten (31%) were considering leaving; of these, 2% were actively looking to leave the teaching profession, 4% were considering leaving the profession in the next 12 months and 24% were considering leaving in the next few years. Five percent did not know. This is shown in Figure 32.
Leaders were less likely than teachers to be considering leaving (21% of leaders overall were considering leaving compared to 32% of teachers).
Those working in secondary schools were more likely than those in primary schools to be considering leaving (36% compared to 26%).
Figure 32: Plans to leave the profession
37 http://researchbriefings.files.parliament.uk/documents/CBP-7222/CBP-7222.pdf
2% 4%
24%
64%
5%
I am activelylooking to leave
the teachingprofession
I am consideringleaving theteaching
profession in thenext 12 months
I am consideringleaving theteaching
profession in thenext few years
I don’t plan to leave the
profession
Don’t know
Question: N4. Plan to leave teaching professionBase: All (1709); Secondary (n=639), Primary (n=1070), Leaders (n=800), Teachers (n=909)
Due to rounding figures do not add to 100%
31% CONSIDERING LEAVING
21%LEADERS
TEACHERS
PRIMARY
SECONDARY
32%*
26%
36%*

59
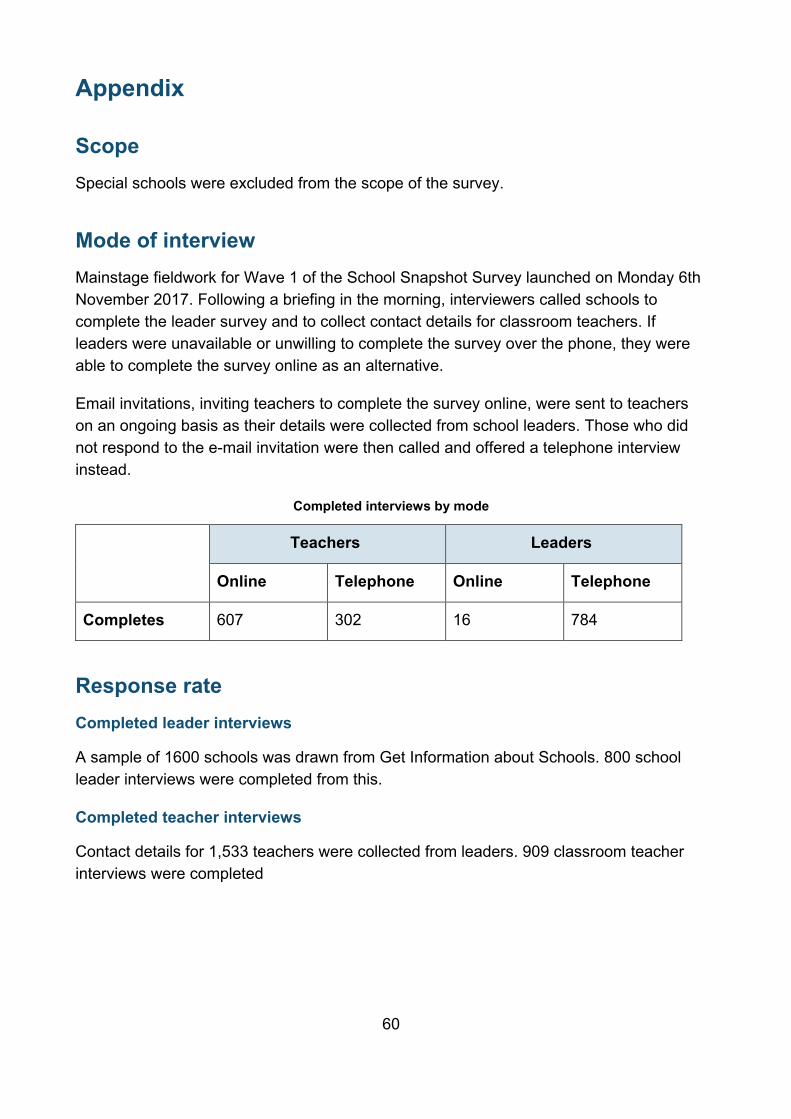
60
Appendix
Scope Special schools were excluded from the scope of the survey.
Mode of interview Mainstage fieldwork for Wave 1 of the School Snapshot Survey launched on Monday 6th November 2017. Following a briefing in the morning, interviewers called schools to complete the leader survey and to collect contact details for classroom teachers. If leaders were unavailable or unwilling to complete the survey over the phone, they were able to complete the survey online as an alternative.
Email invitations, inviting teachers to complete the survey online, were sent to teachers on an ongoing basis as their details were collected from school leaders. Those who did not respond to the e-mail invitation were then called and offered a telephone interview instead.
Completed interviews by mode
Teachers Leaders
Online Telephone Online Telephone
Completes 607 302 16 784
Response rate Completed leader interviews
A sample of 1600 schools was drawn from Get Information about Schools. 800 school leader interviews were completed from this.
Completed teacher interviews
Contact details for 1,533 teachers were collected from leaders. 909 classroom teacher interviews were completed
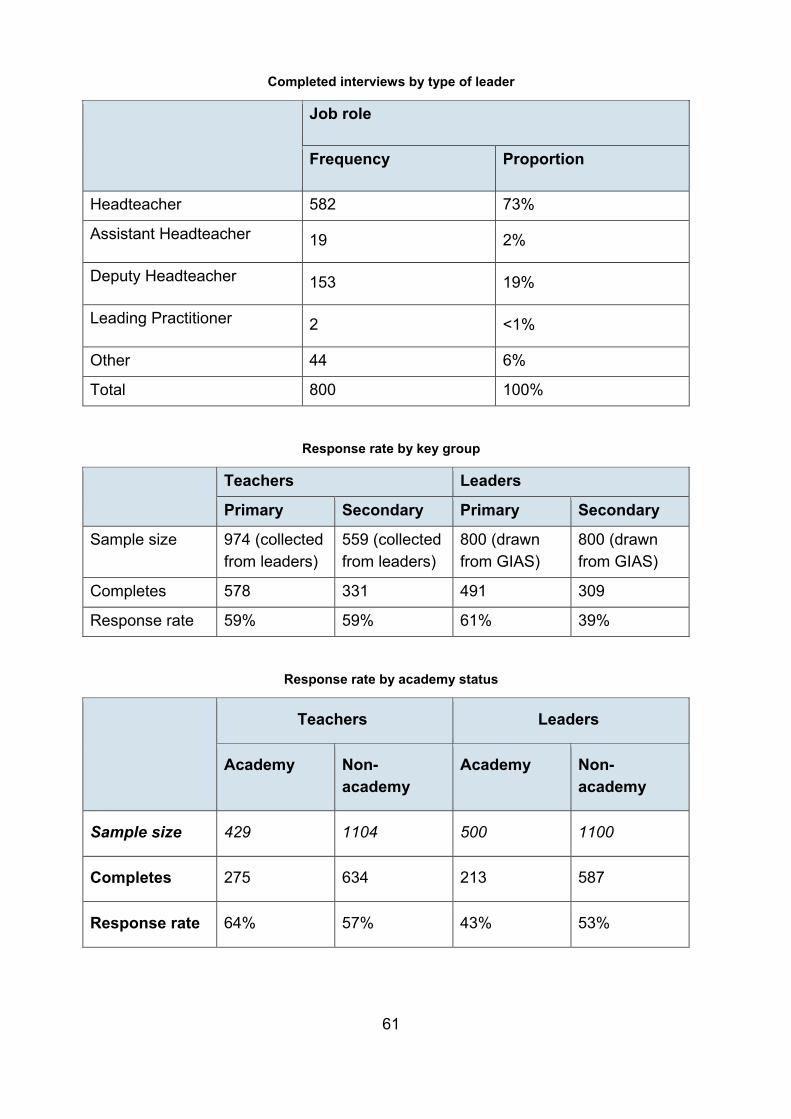
61
Completed interviews by type of leader
Job role
Frequency Proportion
Headteacher 582 73%
Assistant Headteacher 19 2%
Deputy Headteacher 153 19%
Leading Practitioner 2 <1%
Other 44 6%
Total 800 100%
Response rate by key group
Teachers Leaders
Primary Secondary Primary Secondary
Sample size 974 (collected from leaders)
559 (collected from leaders)
800 (drawn from GIAS)
800 (drawn from GIAS)
Completes 578 331 491 309
Response rate 59% 59% 61% 39%
Response rate by academy status
Teachers Leaders
Academy Non-academy
Academy Non-academy
Sample size 429 1104 500 1100
Completes 275 634 213 587
Response rate 64% 57% 43% 53%
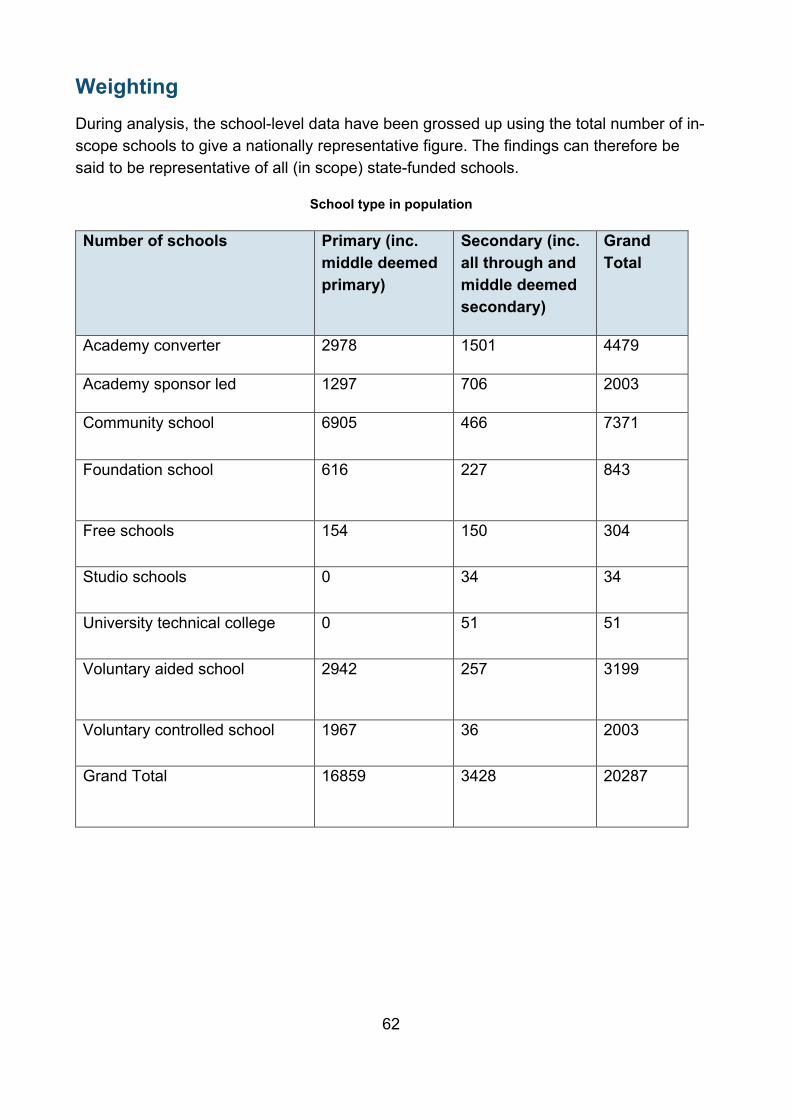
62
Weighting During analysis, the school-level data have been grossed up using the total number of in-scope schools to give a nationally representative figure. The findings can therefore be said to be representative of all (in scope) state-funded schools.
School type in population
Number of schools Primary (inc. middle deemed primary)
Secondary (inc. all through and middle deemed secondary)
Grand Total
Academy converter 2978 1501 4479
Academy sponsor led 1297 706 2003
Community school 6905 466 7371
Foundation school 616 227 843
Free schools 154 150 304
Studio schools 0 34 34
University technical college 0 51 51
Voluntary aided school 2942 257 3199
Voluntary controlled school 1967 36 2003
Grand Total 16859 3428 20287
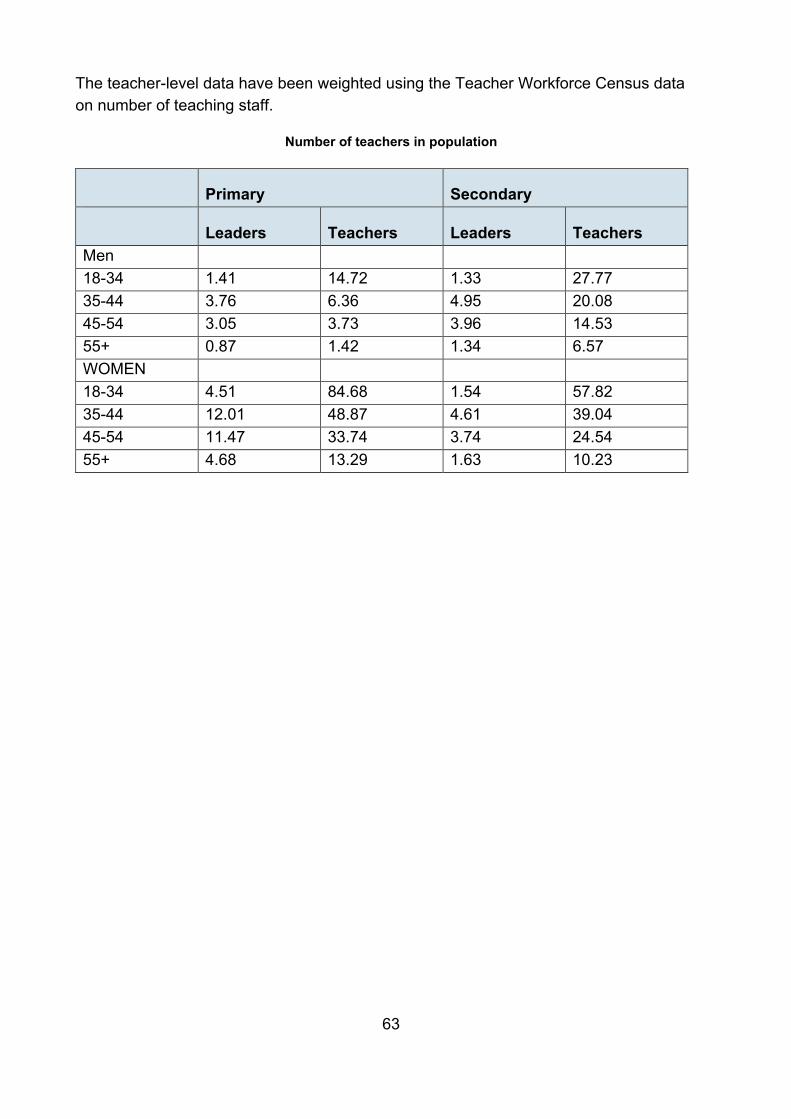
63
The teacher-level data have been weighted using the Teacher Workforce Census data on number of teaching staff.
Number of teachers in population
Primary Secondary
Leaders Teachers Leaders Teachers
Men 18-34 1.41 14.72 1.33 27.77 35-44 3.76 6.36 4.95 20.08 45-54 3.05 3.73 3.96 14.53 55+ 0.87 1.42 1.34 6.57 WOMEN 18-34 4.51 84.68 1.54 57.82 35-44 12.01 48.87 4.61 39.04 45-54 11.47 33.74 3.74 24.54 55+ 4.68 13.29 1.63 10.23
64
© IFF Research 2018
Reference: DFE-RR822
ISBN: 978-1-78105-918-0
The views expressed in this report are the authors’ and do not necessarily reflect those of the Department for Education.
Any enquiries regarding this publication should be sent to us at: [email protected] or www.education.gov.uk/contactus
This document is available for download at www.gov.uk/government/publications